Embed Size (px)
Citation preview
CONTENT & INFORMATION DESIGNCustomised Infographics – Presentation Design – Animated Videos – Microsites – Corporate Publishing – Distribution, Lead Generation & Advertising

781
199
154
121
230
129
91
95
80
42
29
44 3939
60
United States
Brazil
Canada U.K
Netherlands
Belgium
France
Italy
Poland
Spain
Russia
Japan
Australia
Germany
Portugal
Collaborative Workspace in Numbers
08
Countries with the highest number of coworking
spaces (2013)
Physical office space per employee(and change from 2014)
Number of people working in coworking spaces worldwide
2010 2017
1,180,000
21,000
Survey question: How much has your work style altered since you entered a coworking space?
Better interaction
with others
More motivated
and productive
Relax more at home
Working space
is more organized
Work more
frequently in teams
Increased income
Work is less complicated
87.8% 86.0% 60.4% 59.3% 56.9% 42.3% 42.1%
Helsinki
Frankfurt
Munich Copenhagen
Stockholm Paris
London
Luxembourg
Madrid
Berlin
Average
29.2 m2
(-12.3%)
27.1 m2
(+1.5%)
25.6 m2
(-1.5%)25.1 m2
(-5.6%)
19.8 m2
(-7.5%)
19.6 m2
(-6.2%)
19.0 m2
(-1.6%)
16.6 m2
(-8.8%)
12.8 m2
(-1.5%)
9.3 m2 (+22.4%)
19.6 m2
(-2.9%)
02
THE THREE PILLARS OF STATISTA
Platform (statista.com)
Leading statistics portal worldwide
Over 1,500,000 statistics on 80,000 topics from more than 18,000 sources
Industry reports, dossiers, studies
Provides forecasts for 500 industry sectors and 50 countries
Research & Analysis
Tailored market research and analysis
Approx. 70 business analysts
Quantitative and qualitative market research
e.g. surveys, market & competitor analysis, M&A targeting, expert interviews / panels, data modelling and forecasting
Content Marketing & Information Design
More than 22 designers, editorial researchers & creative consultants
Content & Design (e.g. infographics, presentations)
Marketing & Advertising
Desk Research & Editorial

03
STATISTA CONTENT & DESIGN
The Statista Content Marketing & Information Design department assists you from concept development, research and editorial work to the graphic design and distribution of the work. Thanks to our access to statista.com and the 18,000 market data sources behind it, a team of experienced researchers and creative editors, we can visualise any topic for you.
Content & Design
Customised Infographics, Editorial Storytelling
Animations (GIFs..)
High-end Presentations
Customised Videos
Corporate Publishing (e-books, whitepapers, blog posts, etc.)
Microsites
Marketing & Advertising
Lead Generation
Advertising & Sponsored Infographics Posts
Desk Research & Editorial
Desk Research
Editorial Work
Consulting
Content Marketing
Information Design
Workshops
04
THE POWER OF INFORMATION DESIGN
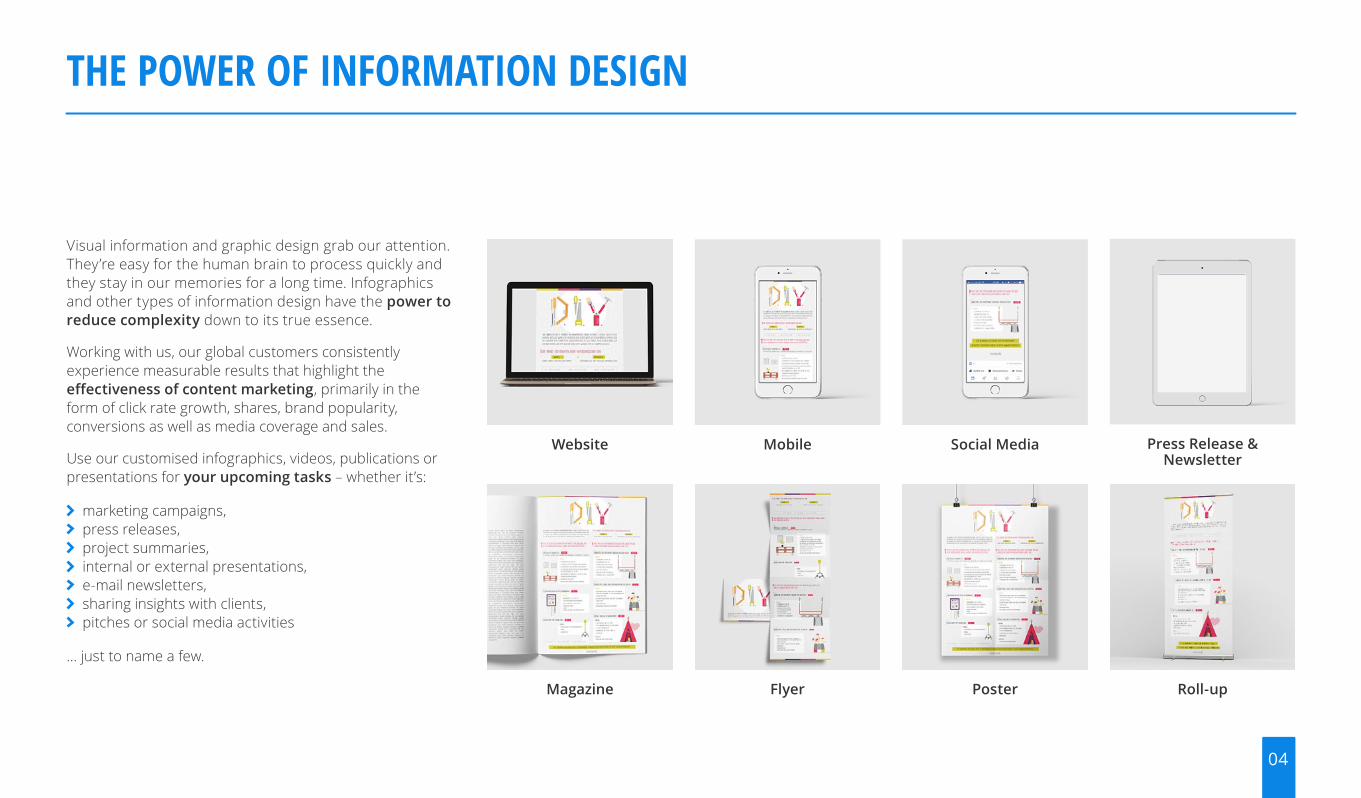
Visual information and graphic design grab our attention. They’re easy for the human brain to process quickly and they stay in our memories for a long time. Infographics and other types of information design have the power to reduce complexity down to its true essence.
Working with us, our global customers consistently experience measurable results that highlight the effectiveness of content marketing, primarily in the form of click rate growth, shares, brand popularity, conversions as well as media coverage and sales.
Use our customised infographics, videos, publications or presentations for your upcoming tasks – whether it’s:
marketing campaigns, press releases, project summaries, internal or external presentations, e-mail newsletters, sharing insights with clients, pitches or social media activities
… just to name a few.
Press Release & Newsletter
Mobile Social MediaWebsite
Magazine Flyer Poster Roll-up
05
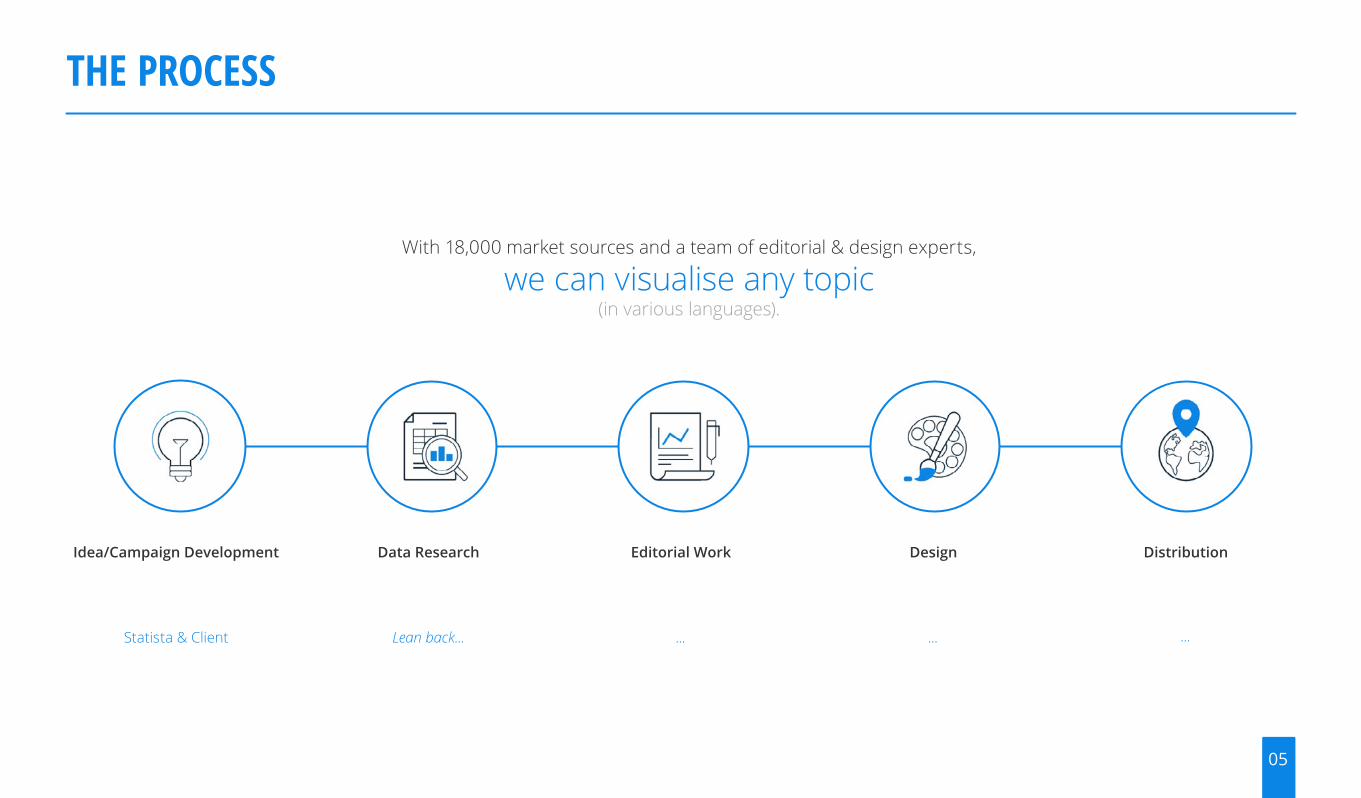
Idea/Campaign Development
Statista & Client
Data Research
Lean back...
Editorial Work
...
Design
...
Distribution
...
THE PROCESS
With 18,000 market sources and a team of editorial & design experts,
we can visualise any topic (in various languages).

PORTFOLIO

07
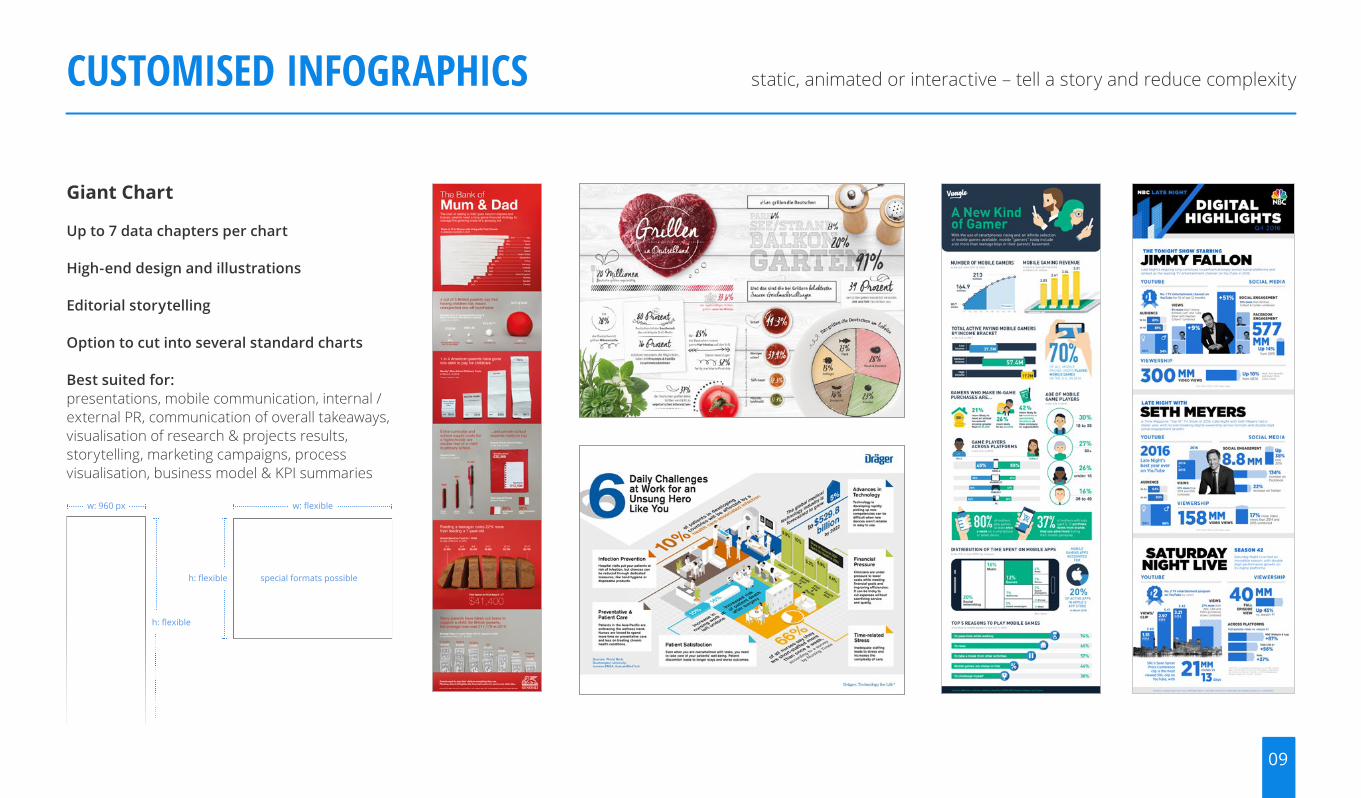
CUSTOMISED INFOGRAPHICS static, animated or interactive – tell a story and reduce complexity
Standard Chart
1 data chapter per chart
Simple design and illustrations
Best suited for:presentations, internal / external PR, online media, publications, marketing campaigns, social media, communication of one key takeaway
Landscape
h: 684 px
w: 960 px
Portrait
h: 960 px
w: 684 px

08
CUSTOMISED INFOGRAPHICS static, animated or interactive – tell a story and reduce complexity
Standard Premium Chart
Up to 4 data chapters per chart
Advanced design and illustrations
Best suited for:presentations, internal / external PR, communication of overall takeaways, short storytelling, visualisation in reports & studies, marketing campaigns, project summaries
Landscape
h: 684 px
w: 960 px
Portrait
h: 960 px
w: 684 px
09
CUSTOMISED INFOGRAPHICS static, animated or interactive – tell a story and reduce complexity
Giant Chart
Up to 7 data chapters per chart
High-end design and illustrations
Editorial storytelling
Option to cut into several standard charts
Best suited for:presentations, mobile communication, internal / external PR, communication of overall takeaways, visualisation of research & projects results, storytelling, marketing campaigns, process visualisation, business model & KPI summaries
h: flexible
w: flexible
special formats possible
h: flexible
w: 960 px

10
ANIMATIONS Self-running animations, showing stats, insights and great wording and design

11
PRESENTATION DESIGN fresh and handcrafted presentations by our presentation design artists

12
SNIPPET VIDEOS Precise and spot-on. Brief clips to visualise infographics or key takeaways.

13
ANIMATED VIDEOS data-driven and to the point – get your message across

14
MICROSITES content on user-friendly websites to engage with your communities

AdviceIntegrating the millennial employees doesn’t have to involve rewriting the book on workplace management. Sensitivity to generational values will go a long way in adapting your organization for this new breed of employees. Read on for a few tips on how to have a smooth transition:
1Use generational differences training to help employees set aside their misconceptions and see the added value each generation brings to the workplace
2Communicate the reasons for structural changes, like moving to an open office plan or the introduction of social media recruiting, so all employees feel up-to-speed
3Foster a culture of network learning: encourage employees to trade ideas, insights and feedback across departments and generations
4Embrace mentorship, formal or otherwise, between younger and older employees. Let older employers feel their experience is valued and simultaneously satisfy the millennial employee’s desire for feedback and direction Catella Market Tracker November 2015
CBRE, Millennials: Myths and Realities 2016
CEB, Five Tips for Recruiting Millennials
CEB, Learning & Development Leadership Council
CEB, The Millennial Myth
Coople, OnePoll 2016
Deskmag, 2017 Coworking Forecast
EY, Executive Summary Generations Research 2013
Pew Research Center, A.T. Kearney, Where are the Global Millennials? 2016
S O U R C E S
pwc Millennials at work, Reshaping the Workplace
Social Science Research Network, Coworking: a transdisciplinary overview 2013
Telefónica Global Millennial Survey: Europe Results
The Wall Street Journal
YouGov, World of Work Employees Survey 2016
U.S. Census Bureau, Young Invincibles 2014
09
781
199
154
121
230
129
91
95
80
42
29
44 3939
60
United States
Brazil
Canada U.K
Netherlands
Belgium
France
Italy
Poland
Spain
Russia
Japan
Australia
Germany
Portugal
Collaborative Workspace in Numbers
08
Countries with the highest number of coworking
spaces (2013)
Physical office space per employee(and change from 2014)
Number of people working in coworking spaces worldwide
2010 2017
1,180,000
21,000
Survey question: How much has your work style altered since you entered a coworking space?
Better interaction
with others
More motivated
and productive
Relax more at home
Working space
is more organized
Work more
frequently in teams
Increased income
Work is less complicated
87.8% 86.0% 60.4% 59.3% 56.9% 42.3% 42.1%
Helsinki
Frankfurt
Munich Copenhagen
Stockholm Paris
London
Luxembourg
Madrid
Berlin
Average
29.2 m2
(-12.3%)
27.1 m2
(+1.5%)
25.6 m2
(-1.5%)25.1 m2
(-5.6%)
19.8 m2
(-7.5%)
19.6 m2
(-6.2%)
19.0 m2
(-1.6%)
16.6 m2
(-8.8%)
12.8 m2
(-1.5%)
9.3 m2 (+22.4%)
19.6 m2
(-2.9%)
Executive Summary
While the media likes to cast this generation as lazy and entitled, the data shows a more complex story. Millennials have high expectations of their lives, but it’d be false to say they feel entitled to success. They have a lot to give and are willing to put in the necessary work to achieve their dreams. This is a generation that treasures learning and has a strong drive to expand their knowledge and skills suite. Relative to older generations, it can feel like they expect a lot back from their employer in terms of feedback, training, advancement possibilities, and working-style accommodation.
Their older colleagues may interpret millennial behaviour as self-promoting. And with the growing emphasis on digital literacy, many of these older employees now find themselves reporting to a manager half their age. This situation can be uncomfortable for both parties and, if not handled with care, can be detrimental to company culture. It is imperative that managers find a way to integrate the working styles and values of a multigenerational workforce while still preparing their organization for the workforce of the future.
Percentage of professionals that strongly/ somewhat agree each generation displays the following characteristic (U.S., 2013)
Top sectors for millennials (2014)
25 to 34-year-olds
18 to 24-year-oldsIn this report, we take a close look at a new generation of employees, breaking down their career expectations and the effect on the modern workplace.
Millennials Generation X Babyboomers
Tech savvy
Social media opportunist
Adaptability
Entitled and concerned primarily about individual
promotion
Enthusiastic
Brand ambassador
Lacking relevant experience to make an immediate
contribution
Difficult to work with
0% 20% 40% 60% 80% 100%
Leisure & Hospitality
Retail & Wholesale
Healthcare
Professional & Business
Education
Manufacturing
22.9%
21.5%
8.7%
9.2%
14.6%
13.7%
12.7%
9.9%
9.0%
7.3%
03
Collaboration Generation
The Rise of Millennials in the Workplace
15
CORPORATE PUBLISHING whitepapers, brochures, e-books and reports – creative and number-based

16
CONTENT DISTRIBUTION
Example: sponsored post in Statista newsletter Example: sponsored post on Statista websiteIncrease your exposure and reach relevant b2b contacts, academics, jour-nalists and influencers via Statista’s portal, social media channels and daily infographic newsletter. Use our sponsored post service as a content distribu-tion option. Sponsored posts always include a short article and a link to your landing page.
Distribution via:
www.statista.com 2.4 million unique visitors and 7 million page impressions per month
Statista Infographic newsletter 140,000 recipients daily, 20% opening rate. Recipient segmentation: 50% enterprises, 20% media and agencies, 15% public sector and 15% others
Statista Facebook Page 26,000 fans
Statista Twitter feed 22,000 followers
Statista Infographics App 3,000 downloads

17
STATISTA RESEARCH & ANALYSIS
Market analysis
Competitor analysis
M&A targeting
Expert interviews / B2B Panel
Custom research projects
Primary market research (online surveys)
Employee engagement surveys and insights
Data modelling and forecasting

Statista has successfully supported multiple PR campaigns through customised infographics. Via distribution on its own channels, Statista has also helped to establish RetailMeNot as a thought
leader in the German and Spanish markets.Christian Ulrich, PR Manager New Markets @ RetailMeNot
The numbers are simply awesome. I like your approach to the numbers very much. There is nothing that needs to be changed. The infographic is amazing.Carlos Barrigüete, CEO @ RhinoB
Infographics are a vital part of our content strategy. We allocate a large part of our media budget to the creation of infographics. The all-encompassing data
research for our infographics, the great consideration for all our individual specifications and the swift communication with Statista make our editorial
planning and the distribution of infographics significantly easier.Can Struck, Brand Experience & Social Media Manager @ Yello Strom
18
REFERENCES

Canny Sutanto Art Director
John Batten Creative Consultant & Business
Development Manager
Anna Maria CzarnyProject Manager & Editorial
Researcher
Kira Luttrell-Roth Project Manager & Editorial
Researcher
Jan Jema Julia Hendrik Bernd Freddy Felix Sonja Sarah Christopher Saskia Katja Katja Isabell Johanna Jörg Sandy Raphael Chris
Robin Hüdepohl Head of Content Marketing & Information Design Projects
Overall project responsibility lies with Robin, who oversees the Global Content Marketing & International Advertising at Statista. After starting his career as Communications Consultant, Robin spent several years working in the creative industry as well as the aviation sector. Having lived and worked in 6 countries, he joined Statista in February 2015 and works with customers including Google, the European Commission, Jaguar Land Rover and Copenhagen Business School.
John is a creative consultant managing new international client projects. Originally starting out as a Graphic Designer he now has 8 years experience within marketing and technology. Before joining Statista at the start of 2018, John worked as an international client manager for a marketing consultancy based in London, helping brands navigate the agency landscape.
Canny is the Head of the Global Content Marketing graphics team. As an expert in data visualisation, presentation design, video animation and infographics, her work has been featured in many on- and offline publications. She has previously worked in Indonesia, the U.S. and Australia. Before joining Statista in 2016, she was the Art Director of the Indonesia Design Magazine and significantly contributed to winning the internationally recognised WAN-IFRA Media award in 2015.
Kira is a Project Manager, Editor and Researcher and is responsible for the smooth flow of customer projects. She has over ten years’ experience in marketing and communications, having worked in Australia, Canada and the UK. Prior to working at Statista, Kira completed her MA in International Relations and worked for The Prince’sTrust, a youth charity based in London.
Anna Maria is a Project Manager, Editor and Researcher and is responsible for handling customer projects. She is a psychologist (loves the research and the numbers!) and was raised both in the US and in Europe. Before joining Statista she worked as an Editorial Team Lead for a multimedia agency and as an Operations Team Lead in the gaming industry.
19
YOUR INTERNATIONAL TEAM
A SKILLED TEAM OF CONSULTANTS, EDITORS & DESIGNERS

20
STATISTA – THE COMPANY
Statista is one of the leading statistics companies on the internet. With a team of over 450 statisticians, database experts, analysts, and editors, Statista provides users with an innovative and intuitive tool for researching quantitative data, statistics and related information.
Our client base includes a wide range of globally active companies and premier academic institutions. Since the launch of the platform in 2008, more than 1,000,000 users and more than 9,000 companies have registered with Statista.
Statista consists of a the data platform, an in-house and global research and analysis department as well as the content marketing and information design team.
Our strategic partners include The Guardian, Forbes, Financial Times, Mashable.com, Handelsblatt, Capital and over 800 universities worldwide.

PRICING OVERVIEW

22
SERVICES & PRICES
Notes: ¡Every project includes up to two revision rounds in both the research / editorial and graphic design if required. Further revisions can be booked at a rate of 80 €/hour. ¡You receive unlimited usage and publication rights ¡Minimum booking volume 2,000 € As of July 2017
PRODUCT/SERVICE DESCRIPTION AMOUNT PRICE
Info
grap
hics
Standard Chart Portrait or landscape | in your corporate design | scope: 1 to 2 data chapters | includes up to 4 hours research and text creation | based on data from Statista, external sources and, in certain instances, from the client 1 550 €
Standard Premium Chart Portrait or landscape | in your corporate design | scope: up to 4 data chapters | includes up to 1 workday research and text creation | based on data from Statista, external sources and, in certain instances, from the client 1 900 €
Giant ChartPortrait or landscape | in your corporate design | scope: up to 7 data chapters | in certain instances can be divided into 7 Standard Charts | includes up to 1 workday research, text creation, and editorial storytelling | based on data from Statista, external sources and, in certain instances, from the client
1 2,000 €
Spec
ial P
roje
cts
Animations (GIFs) Portrait or landscape | in your corporate design | scope: 5–15 seconds | includes research, editorial, and motion design | based on data from Statista, external sources and, in certain instances, from the client 1 600 € – 1,800 €
PowerPoint Presentations Updates & Optimisation or Concept & (new) Design of presentations | including editable, data-focused and, in some cases, animated infographics | concept | layout | storytelling | editing | animations | final touches
20 slides (Updates & Optimisation)
20 slides (Concept & Design)
2,000 €
4,000 €
Corporate Publishing eBooks, whitepapers, studies, brochures etc. | incl. concept, research, editorial | graphic design & editing – from 1,600 €
Short Videos, eg. for Facebook Short, animated videos | 5–10 seconds | 1–2 facts | animation of content | animation of existing infographics | no sound (in some cases with subtitles) 3 from 2,400 €
Info Videos Animated info & explanatory videos | 45–60 seconds incl. voiceover and music | animation and illustration of infographics – from 5,500 €
Animated/Interactive Infographics & Microsites
Concept | research | design | programming – upon request

23
SERVICES & PRICES
PRODUCT/SERVICE DESCRIPTION AMOUNT PRICE
Mar
ket R
esea
rch
Short Survey Up to 3 questions | within consumers survey from Statista | with subsequent publication of results on the Statista portal | client to be listed as source | 1,000 respondents | representative average population of 18–69 years 3 questions 600 €
Working Day Research & Analysis
1 full working day (8 hours) dedicated to your market research requirements 1 day 800 €
Market Research/SurveysIndividualised market research and opinion polling: questionnaire development, questionnaire programming & execution | data preparation & detailed analysis in Excel | project management | external costs included | eg. 1,000 interviews, interview length of 5 minutes, 5–10 questions, incidence: 100% | representativeness: internet users 18+ in desired country / quotas by age, gender, state
5 working days incl. external panel
costs
from 5,500 €
Dis
trib
utio
n
Infographic Distribution/ Sponsored Posts
Int. Statista Infographic Newsletter (140,000 daily recipients) | on the Statista portal (4 million unique visitors monthly) and within the Statista Infographic App | on Facebook and Twitter (26,000 Facebook Fans, 22,000 Twitter followers) | with backlink to client landing page | “Sponsored Post” labelled
First position in newsletter
Second position in newsletter
1,950 €
950 €
Des
ign
Add
-ons Design for further languages Insertion of delivered translations into existing infographics per chart 50 € – 150 €
Translation and design of further languages
Translation of existing infographics (English, German, French, Spanish, among others) per chart 150 € – 450 €
Open Working File Buy-out for handover of open working files per chart 200 € – 400 €
Consulting/Workshops Dedicated consulting work and / or workshops for Content Marketing or Information Design in you organisation - on request
As of July 2017

24
SERVICES & PRICES
PRODUCT/SERVICE DISCOUNT ON NET PRICES TOTAL
Pack
ages
Content & Design Package – STARTER 3 % 4,000 €
Content & Design Package – SMALL 5 % 8,000 €
Content & Design Package – MEDIUM 9 % 12,000 €
Content & Design Package – LARGE 14 % 16,000 €
Many companies make use of the discounted package options:
Opportunity to use all the services of the Statista Content Marketing & Information Design department “on the go” and upon request Your own account balance (retainer): we deduct all the costs for every piece of work from the account balance as we go The larger the package, the larger the discounts on the net prices of the respective services
We‘re happy to provide you with a customised package.All prices excl. VAT
As of July 2017
GET IN TOUCH
ROBIN HÜDEPOHLHead of Content Marketing & Information Design projects
PHONE (UK) +44 20 3695 6092PHONE (GER) +49 40 688 931 211
JOHN BATTENCreative Consultant &
Business Development Manager
PHONE (GER) +49 40 284 841 [email protected]