Embed Size (px)
Citation preview

I
www.infoharvardresearchuk.com
Contemporary Business Economics
II
www.infoharvardresearchuk.com
III
www.infoharvardresearchuk.com
IV
www.infoharvardresearchuk.com
Executive Summary
This assignment is divided into two parts called Task 1 & 2. In the Task 1, fundamental notion of
demand and supply will be discussed. Converse relation between price and demand indicates law
of demand and positive relation between price and supply indicates law of supply. Mutation along
the law and supply curve happens when price forces demand and supply to be changed while
determinants of demand and supply remain static. Determinants of demand and supply forces
supply and demand curve to be switched. And the effects of demand and supply determinants will
also be discussed in the Task 1. In the Task 2, one of the 21st centuries best economics theories is
innovation theory which main theme is that knowledge, innovation, information are the basis of
economic growth and Keynesian theory introduced in 20th century which main theme is that high
spending in consumption, investment, government expenditure are the basis of economic growth
will be discussed. Comparison between the innovation theory and the Keynesian theory and the
relation among these theories and contemporary business practises will be discussed at the end of
this assignment.

V
www.infoharvardresearchuk.com
Introduction
This study deals with the basic notions of macroeconomics like theory of law and supply, switch
and change of supply and demand curve and related factors in the task-01. And in the task-02,
contemporary business models like- innovative economics theory and Keynesian theory will be
discussed and their relation to the modern business practises will also be discussed. Besides the
illustration of demand and supply schedule and curve, how income, price of substitute and
complement products forces demand curve to be changed will also be presented. After that, how
production factors, technological condition, number of producer force supply curve to be shifted
will also be discussed. At the end, how PPP and innovation change the contemporary business
practises as suggested by innovative and Keynesian theory will be presented.
VI
www.infoharvardresearchuk.com
Task 01: Fundamental Notion of Demand and Supply
VII
www.infoharvardresearchuk.com
1.1 Fundamental discussion of demand law and various aspects of the changing
demand curve and some affecting components
1.1.1 Theory of law of demand
When price goes up, the demand of a certain product or service decrease and when the price goes
down, the demand of a certain product or service decrease; and this converse connection between
price and demand indicates the demand law (Whelan and Msefer, 1996). The main reason behind
this converse connection is the law of diminishing marginal utility which indicates if a person
continuously consumes same product or enjoy the same service, s/he starts to mitigate consuming
the same product which ultimately results in the decrease of the utility. For example- if a person
continuously buys the same brand of mobile, soon s/he will lose interest and decrease its
consumption (Ormazabal and Kepa, 1995). According to (Whelan and Msefer, 1996), demand law
can occur when some factors like- product preference and earning of the consumer; prices of
alternative and complementary products remain static.
Mutation of demand curve: mutation of demand curve happens in two ways. They are as follows;
▪ Mutation along the same demand curve
▪ Mutation of the demand curve
1.1.2 Mutation along the same demand curve
According to (Brækkan and Eivind, 2015), when the price of a certain product forces the demand
to be changed and at that time and components related to demand remain static, mutation along
the same demand curve happens. There are two types of mutation towards the same demand curve
and they are as follows:
01. Upward Mutation: when a converse connection is present between price and demand of
a certain product, upward Mutation happens towards the same curve.
02. Downward Mutation: when a positive connection is present between the price and
demand of a certain product, downward Mutation happens towards the same curve.
VIII
www.infoharvardresearchuk.com
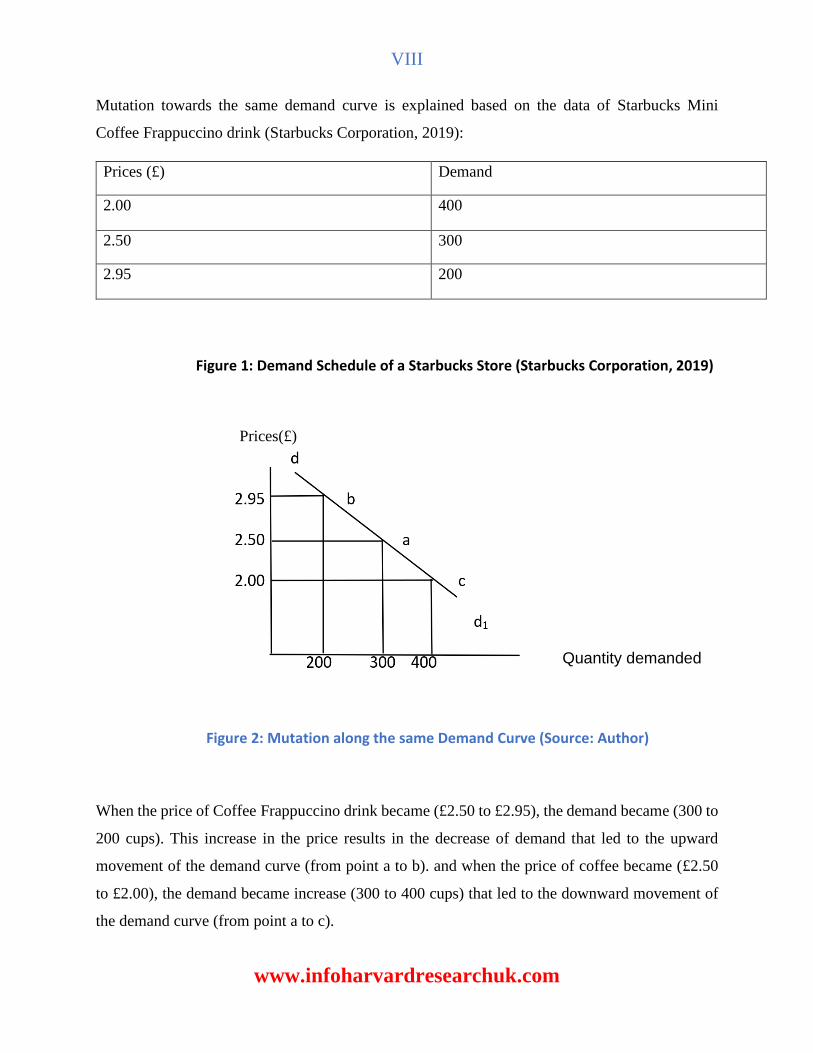
Mutation towards the same demand curve is explained based on the data of Starbucks Mini
Coffee Frappuccino drink (Starbucks Corporation, 2019):
Prices (£) Demand
2.00 400
2.50 300
2.95 200
Figure 1: Demand Schedule of a Starbucks Store (Starbucks Corporation, 2019)
Prices(£)
Quantity demanded
When the price of Coffee Frappuccino drink became (£2.50 to £2.95), the demand became (300 to
200 cups). This increase in the price results in the decrease of demand that led to the upward
movement of the demand curve (from point a to b). and when the price of coffee became (£2.50
to £2.00), the demand became increase (300 to 400 cups) that led to the downward movement of
the demand curve (from point a to c).
Figure 2: Mutation along the same Demand Curve (Source: Author)
IX
www.infoharvardresearchuk.com
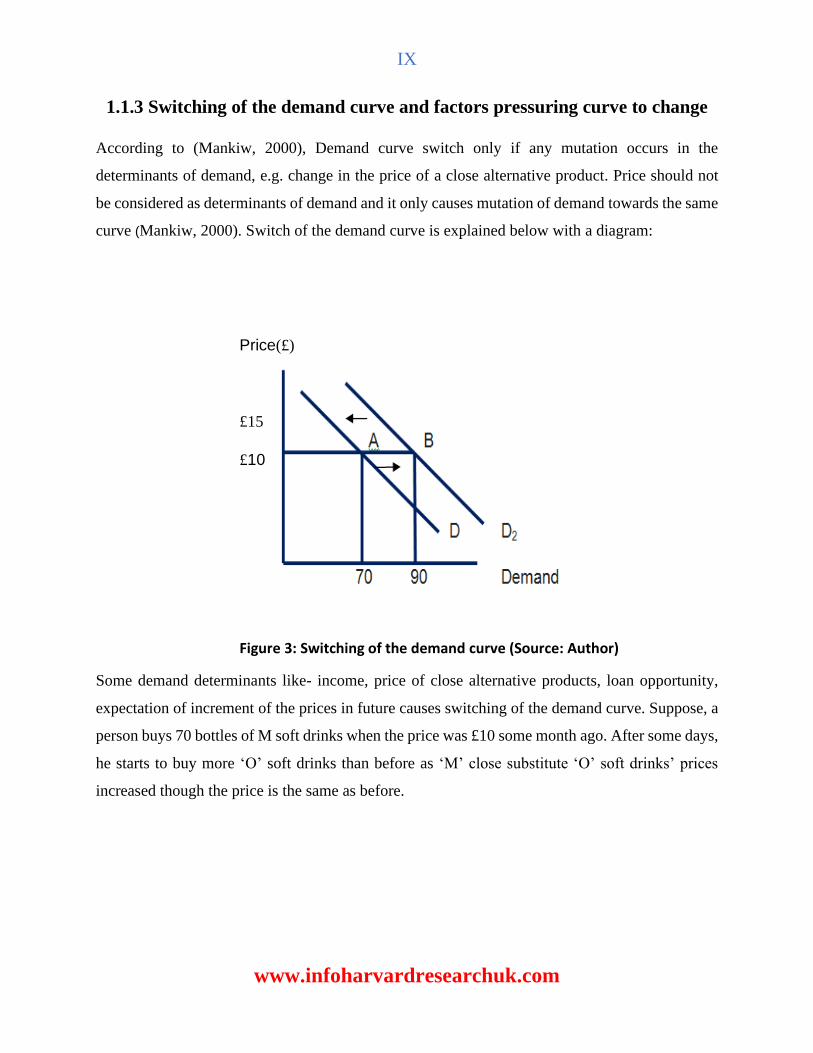
1.1.3 Switching of the demand curve and factors pressuring curve to change
According to (Mankiw, 2000), Demand curve switch only if any mutation occurs in the
determinants of demand, e.g. change in the price of a close alternative product. Price should not
be considered as determinants of demand and it only causes mutation of demand towards the same
curve (Mankiw, 2000). Switch of the demand curve is explained below with a diagram:
Price(£)
£15
£10
Figure 3: Switching of the demand curve (Source: Author)
Some demand determinants like- income, price of close alternative products, loan opportunity,
expectation of increment of the prices in future causes switching of the demand curve. Suppose, a
person buys 70 bottles of M soft drinks when the price was £10 some month ago. After some days,
he starts to buy more ‘O’ soft drinks than before as ‘M’ close substitute ‘O’ soft drinks’ prices
increased though the price is the same as before.

X
www.infoharvardresearchuk.com
Components pressuring demand curve to switch:
Figure 4: Components pressuring demand curve to switch (Source: Mankiw,2000)
▪ Income: According to (Mankiw, 2000), When a person income increases, s/he will buy
more products or enjoy services than before at each price. For example- a person whose
salary increased recently will buy more Coca-Cola bottles than before. Increase in income
will cause the demand curve to shift rightward (Mankiw, 2000).
▪ Price of substitute goods: There is a positive relationship between the prices and demands
of substitute products (Mankiw, 2000). If a product price increase, the demand of the
products’ substitute will also be increased. For example- if the prices of butter are
increased, people will increase the procurement of margarine. As a result, the demand
curve will shift to the left side. (Mankiw, 2000).
▪ Price of Complementary goods: Increase in the demand of one product because of
decreased price, demand for other complementary good also increased (Mankiw, 2000).
For example- if the demand for printers increased because of the lower price, then the
demand for ink cartridges also increased (Mankiw, 2000). It will shift the demand curve to
the rightward.
Components pressures demand
curve to be change
Income
Price of substitute
goods
Price of complements
goods
Change of preference

XI
www.infoharvardresearchuk.com
▪ Change of preference: when people preference changes, their demand also changed
(Mankiw, 2000). If consumers start to like tea more than coffee, then the demand for tea is
automatically increased which led to the shift of demand curve to the rightward.
1.2 Fundamental discussion of supply law and various aspects of the changing
supply curve and some affecting components
1.2.1 Supply law
According to (Whelan and Msefer, 1996), when the price of a product increases, Suppliers increase
the supply of the product to the market for maximizing product and when the price goes down,
suppliers decreases its supply to mitigate loss and this positive relationship between price and
supply is called supply law. For example- a burger shop will increase its supply when the selling
price of the burger is going up in the market. This law is true only if some related components
remain static such as- static income; no change in technology or production factors; no change in
the business or government policies etcetera (Whelan and Msefer, 1996).
Mutation of the supply curve: There are two types of mutation of the supply curve and they are
as follows:
▪ Mutation along the same supply curve
▪ Mutation of the supply curve
1.2.2 Mutation along the same supply curve
When quantity supplied is changed based on the changes in the product’s price while other factors
related to supply remain static, mutation along the same supply curve happens (Brækkan and
Eivind, 2015). There are two types of mutation happens along the same supply curve and they are
as follows:

XII
www.infoharvardresearchuk.com
Mutation towards same Supply curve is explained based on the data of Starbucks Iced Coffee (with
or without Milk) drink (Starbucks Corporation, 2019):
Figure 5: Supply Schedule of Starbucks Corporation (Source: Starbucks Corporation, 2019)
Price (£)
Figure 6: Supply Curve of Starbucks Corporations' Iced Coffee (Source: author)
When Starbucks’ Iced coffee’s price was £2.00, quantity supplied cups were 700, and supply
increased to 850 cups when the price increased £2.00 to £2.20 for earning more profit and this
situation led to the extension of supply. Starbucks’ quantity supplied of iced coffee decreased to
850 cups from 1000 cups when price decreased to £2.25 to £2.20 for mitigating loss and this
situation led to the contraction of supply.
XIII
www.infoharvardresearchuk.com
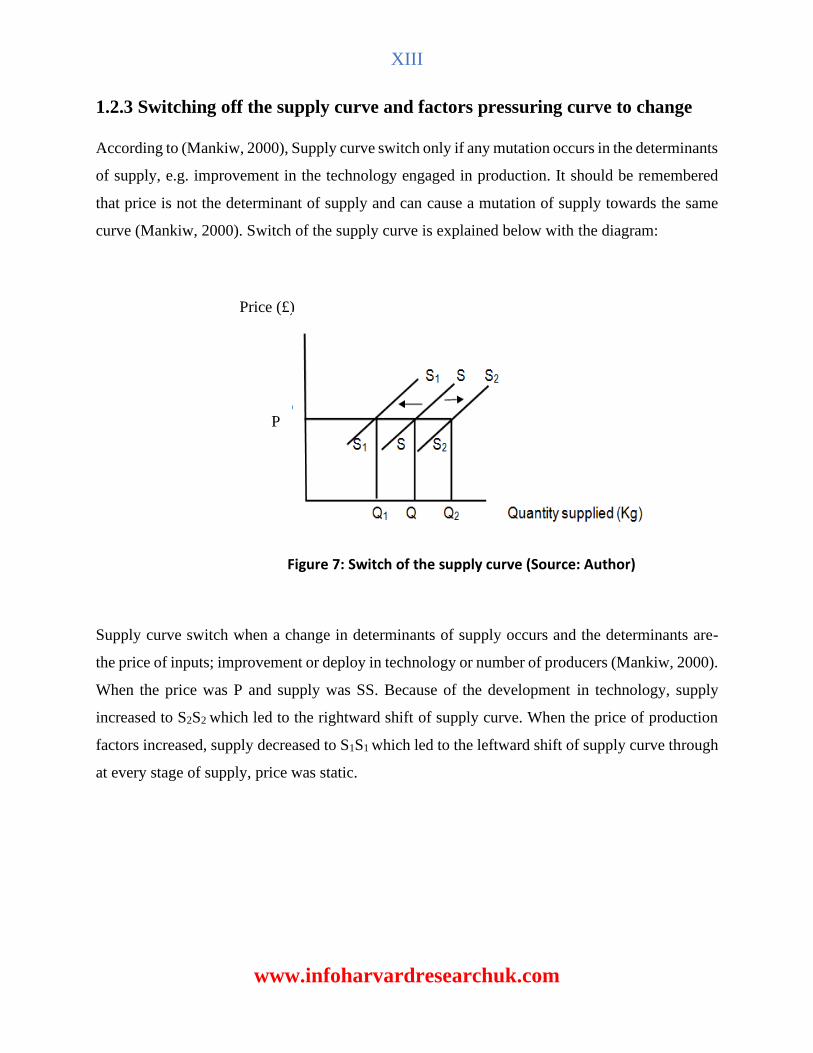
1.2.3 Switching off the supply curve and factors pressuring curve to change
According to (Mankiw, 2000), Supply curve switch only if any mutation occurs in the determinants
of supply, e.g. improvement in the technology engaged in production. It should be remembered
that price is not the determinant of supply and can cause a mutation of supply towards the same
curve (Mankiw, 2000). Switch of the supply curve is explained below with the diagram:
Price (£)
P
Figure 7: Switch of the supply curve (Source: Author)
Supply curve switch when a change in determinants of supply occurs and the determinants are-
the price of inputs; improvement or deploy in technology or number of producers (Mankiw, 2000).
When the price was P and supply was SS. Because of the development in technology, supply
increased to S2S2 which led to the rightward shift of supply curve. When the price of production
factors increased, supply decreased to S1S1 which led to the leftward shift of supply curve through
at every stage of supply, price was static.

XIV
www.infoharvardresearchuk.com
Components pressuring supply curve to switch:
Figure 8: Factors pressuring supply curve to switch (Source: Mankiw, 2000)
▪ Production factors: Due to the increase of tax imposed by China on the USA of £110
billion (Swanson and Rappeport, 2019), Starbucks China had to pay more for importing
materials from Starbucks Corporation’s main supply chain located in the USA which
ultimately forces the producers to pay more and price of Starbucks’ coffees are increased.
As a result, Starbucks China decreased its supply of products and supply curve shifts
leftward.
▪ Condition of Technology: when improved technology is used in the production line, it
enhances the efficiency of production or mitigate labor cost. And ultimately units of
production increased which led to the rightward shift of supply curve.
▪ Number of producers: When an industry has a lot of producers, the supply of products is
also of big amount and supply curve shifts rightward.
▪ Government policies: Government policies can affect business decisions directly. Due to
COVID-19 outbreak, many countries’ government stopped all the shops of their countries.
As a result, Starbucks Corporation had to stop their production and supply to the market.
Overall, the whole coffee industry is concatenated which led to the decrease of supply and
a leftward shift of supply curve.
Components pressures
supply curve to be
switched
Price of production
factors
Condition of technology
Number of producers
Govt. policies
XV
www.infoharvardresearchuk.com
2.1 Innovative economics theory: a contemporary doctrine for the
21st century
Innovative economics, introduced by Joseph Schumpeter in his book called “capitalism, socialism
and democracy” in 1942, said that technology, innovation, information, knowledge are the main
foundations of economic growth (Robles, 2009). According to (Robles, 2009), innovative
economics is based on two doctrines:
1. Economic policy should enhance the innovation and greater productivity
2. Emphasizing public-private partnership (PPP) in increasing higher productivity and
innovation
The bottom line of innovative economics is that economic growth of today’s world does not
depend on capital solely suggested by neo-classical economists rather depends on information;
technological innovation and overall innovation in every sector (Robles, 2009). For example- US
economic growth is being happened not just because of only capital but also the innovation of new
production ways; technological evolution in various industries. This theory also suggests that using
innovation in business, societies led the development of production factors of industries; extend
wealth; quality, or standard of living which ultimately results in producing high-quality products
at low cost and creating greater demand for the products (Robles, 2009). India, China, Japan, USA
are today’s world giants of innovation in every sector and they made it reality by investing in the
research and development sector, high tech parks or industry with patents, export of their
innovative products (Robles, 2009). Moreover, because of innovation in the economy, per capita
income, social tranquillity; a high standard of living also occurs.

XVI
www.infoharvardresearchuk.com
2.2 Keynesian economics theory: a prominent doctrine of the 20th century
Keynesian economics theory, introduced by John Maynard Keynes during the great depression
(the 1930s), discusses total expenditure and its effects on total output; inflation of an economy
(Arestis, Filho and Bittes, 2018). Keynes said that the economy can be out of depression if total
demand is increased by increasing government spending and setting lower taxes. And (Arestis,
Filho and Bittes, 2018) also said that prices and wages of employees decline when aggregate
demand decreased resulting in the low production and high layoff. At that time, economic growth
can be regained by the increased capital investments and giving jobs to more people by employers
(Arestis, Filho and Bittes, 2018). According to (Jahan, Mahmud and Papageorgiou, 2014),
Keynesian economics works in three ways:
1. Keynesian economics theory suggested that a country’s economy should not be run by only
private sector or public sector. There should be a mixed economy- mainly operated by
private and some specific sectors operated by the Public sector.
2. Change of supply and demand affects wages slowly. For example- if an industry enjoys
vast supply and sells products, employees of that industry will not enjoy high or handsome
wages in a short time.
3. If there is a change in any factors of spending like in consumption, government
expenditure, investment, total output, or employment is affected. For example- because of
the high demand for luxurious cars stem from high investment in the car industry will
require more employees for high production.
XVII
www.infoharvardresearchuk.com
2.3 Comparison of innovative and Keynesian economics theory
Innovative economics theory said that technological innovation, information, knowledge are the
main reasons behind economic growth and Keynesian economics theory said that high spending
in consumption, investment, government expending can extend the economic growth. Innovative
economics theory suggests that investing in innovation can increase the total output and
employment rate whereas Keynesian economics theory suggests that an increase in aggregate
demand can increase total output and employment rate. Innovative theory emphasizes on
innovation and information for advancement whereas Keynesian theory emphasizes on capital
investment. From these two theories, Innovative economics theory is more practical than
Keynesian theory in the modern age as it is the age of globalization and information.
2.4 Connection of innovative and Keynesian theory to the contemporary
business practises

XVIII
www.infoharvardresearchuk.com
Conclusion
XIX
www.infoharvardresearchuk.com
Bibliography
Whelan, J. and Msefer, K., 1996. ECONOMIC SUPPLY & DEMAND. MIT, pp.2-20.
Ormazabal and Kepa, 1995. The Law of Diminishing Marginal Utility in Alfred Marshall's
Principles of Economics. Journal of the History of Economic Thought, 2, pp.91-126.
Brækkan and Eivind, 2015. Why Do Prices Change? An Analysis Of Supply And Demand Shifts
And Price Impacts In The Farmed Salmon Market. PhD.
Starbucks Corporation, 2019. Starbucks' Fiscal 2019 Annual Report. Washington: Starbucks
Corporation, pp.1-80.
Mankiw, G., 2000. Gregory Mankiw’s Principles Of Microeconomics. 2nd ed. pp.1-7.
Swanson, A., Bradsher, K. and Rappeport, A., 2019. U.S. and China Agree to Roll Back Some
Tariffs if Deal Is Struck. The New York Times, p.1.
Robles, D., 2009. A Definition For Innovation Economics - The Ingenesist Project. The Ingenesist
Project. pp. 1
Faccarello and Gilbert, 2015. Labour Theory Of Value. pp.245-255.
Arestis, P., Filho, F. and Bittes, T., 2018. Keynesian macroeconomic policy: Theoretical analysis
and empirical evidence. Panoeconomicus, 65(1), pp.1-20.
Jahan, S., Mahmud, A. and Papageorgiou, C., 2014. What Is Keynesian Economics? 51(3), pp.2-
5.