Embed Size (px)
Citation preview
ORIGINAL ARTICLE
Contamination of fluoride in groundwater and its effect on humanhealth: a case study in hard rock aquifers of Siddipet, TelanganaState, India
A. Narsimha1 • V. Sudarshan1
Received: 22 July 2015 / Accepted: 14 June 2016 / Published online: 27 June 2016
� The Author(s) 2016. This article is published with open access at Springerlink.com
Abstract Hydrogeochemical investigation has been car-
ried out in the granitic terrain of Siddipet area, Medak
district, Telangana State, India with an aim to understand
the distribution of fluoride in the groundwater and to
understand the relationship of fluoride with other major
ions, and also to identify the high fluoride-bearing
groundwater zones. 104 groundwater samples were ana-
lyzed in the study area for fluoride and other major ions
like calcium, magnesium, chloride, carbonate, bicarbonate,
sodium, potassium, sulfate, and nitrate in addition to pH
and electrical conductivity. The studies revealed that the
concentration of fluoride in groundwater is ranging from
0.2 to 2.2 mg L-1 with a mean of 1.1 mg L-1. Nearly
22 % of groundwater has more than the permissible limit
of fluoride (1.5 mg L-1), which is responsible for the
endemic dental fluorosis in the area concerned. Geo-
chemical classification of groundwater shows that Na–
HCO3, Ca–Cl, and Ca–HCO3–Na are the dominant
hydrochemical facies. Gibbs diagram shows rock–water
interaction dominance and evaporation dominance, which
are responsible for the change in the quality of water in the
hard rock aquifer of the study area. The groundwater in
villages and its environs are affected by fluoride contami-
nation, and consequently majority of the population living
in these villages suffer from dental fluorosis. Hence, they
are advised to consume drinking water which has less than
1.5 mg L-1 fluoride to avoid further fluorosis risks.
Keywords Hydrochemistry � Groundwater � Fluoride �Siddipet � Telangana � India
Introduction
Fluorine is the lightest halogen and one of the most reac-
tives of all chemical elements (Kaminsky et al. 1990).
Fluorine commonly occurs as a negatively charged ion in
water, either in trace amounts or as a major ion with high
concentrations (Gaciri and Ad Davis 1993; Apambire et al.
1997; Fantong et al. 2009). Fluorosis is a very dangerous
and deadly disease affecting millions of people across the
world. More than 200 million people from all over the
world (among 25 nations) suffer from endemic fluorosis,
caused mainly due to excess fluoride in drinking water
(Ayoob and Gupta 2006; Hong-jian et al. 2013; Moghad-
dam and Fijani 2008; Oruc 2008; Fordyce et al. 2007;
Ghosh et al. 2013; Mesdaghinia et al. 2010).
In the two largest countries India and China of the
world, fluorosis is most severe and well known. High
concentration of fluoride, often above 1.5 mg L-1, con-
stitutes a severe problem over a large part of India. About
80 % of the diseases in the world are due to the poor
quality of drinking water, and the fluoride contamination in
drinking water is responsible for 65 % of endemic fluorosis
around the globe (Felsenfeld and Robert 1991). Further-
more, 50 % of the groundwater sources in India have been
contaminated by fluoride and more than 90 % of the vil-
lages use groundwater for drinking purposes (Subarayan
et al. 2012). In fact, more than 40 million people in India
are affected due to the prevalence of dental fluorosis
(Karthikeyan et al. 2005). In India, the excessive presence
of fluorides in groundwater is noticed in nearly 177 dis-
tricts covering 20 states, affecting more than 65 million
& A. Narsimha
1 Department of Applied Geochemistry, Osmania University,
Hyderabad 500 007, India
123
Appl Water Sci (2017) 7:2501–2512
DOI 10.1007/s13201-016-0441-0
people, including 6 million children (Gupta et al. 2006).
The problem of excessive fluoride in groundwater in India
was first reported in 1937 in the state of Andhra Pradesh
(Short et al. 1937). Telangana State is one of the fluoride
affected states in the country and is considered to be
endemic to fluorosis.
The major health problems caused by excessive fluoride
are dental fluorosis, skeletal fluorosis, and deformation of
bones in children and adults (Susheela et al. 1993). Fluo-
rosis has greatest impact on growing teeth, and children
less than 7 years old are particularly vulnerable (Murray
1996). The maximum permissible limit of fluoride in
drinking water is prescribed as 1.5 mg L-1 by World
Health Organization and Indian Council of Medical
Research (WHO 2011; ICMR 1975). Fluoride concentra-
tion in groundwater is influenced by a number of factors,
such as temperature, pH, the presence or absence of com-
plexing or precipitating ions and colloids, solubility of
fluorine bearing minerals, anion exchange capacity of
aquifer materials (i.e., OH- for F-), the size and type of
geological formations traversed by water, and the contact
time period during which water remains in contact with a
particular formation (Apambire et al. 1997). There is also
evidence that the adverse health effects of fluoride are
enhanced by lack of Ca, vitamins, and protein in the diet
(Jacks et al. 1993; Li et al. 1996). Fluorides are released
into the groundwater mostly through water–rock interac-
tion by various fluoride-bearing minerals. Fluorite (CaF2)
is the sole principal mineral of fluorine occurring in nature,
and is commonly found as an accessory in granitic gneiss
(Ozsvath 2006; Saxena and Ahmed 2003). Fluorine is also
abundant in other rock-forming minerals like apatite,
micas, amphiboles, and clay minerals (Karro and Uppin
2013; Narsimha and Sudarshan 2013; Rafique et al. 2009;
Naseem et al. 2010; Jha et al. 2010; Carrillo-Rivera et al.
2002).
The study area is situated about 105 km north of
Hyderabad on Hyderabad–Karimnagar State highway, and
is bounded by E longitude 78.76942–78.90232 and N lat-
itude 18.06768–18.24402. The area under investigation
falls under semi-arid zone, with a hot, humid climate, and
predominantly occupied by granite/gneiss of Archean age.
The area experiences a semi-arid climate with an annual
mean temperature of 30 �C. The mean annual rainfall is
recorded as 745 mm, occurring mostly during the south-
west monsoon period (June–September). Groundwater is
the major drinking water source in the villages of Siddipet
area of Medak district of Telangana State, India. Endemic
fluorosis as well as its prevalence and severity are poorly
known in the study area. The present study was undertaken
to assess the fluoride content of groundwater and to sta-
tistically correlate the concentrations of fluoride with the
other measured parameters, and also identify the wells with
high F- concentration, raise awareness in people and study
the water chemistry of groundwater in Siddipet area,
Medak district, Telangana, India.
Materials and methods
104 groundwater samples were collected from 39 villages
of Siddipet region in the month of July 2014. Samples were
collected in plastic containers previously thoroughly
cleansed with distilled water and subsequently with sam-
pled groundwater before filling. The fluoride concentration
in groundwater was determined electrochemically, using
Thermo Scientific Orion Star A214 Benchtop pH/ISE
meter, using the USEP ion selective electrode method. As
per experimental requirement, 2 ml of total ionic strength
adjusting buffer grade III (TISAB III) was added in 20 ml
of groundwater sample and determined the fluoride con-
centration. Calcium (Ca2?) and magnesium (Mg2?) were
determined titrimetrically using standard EDTA method.
Chloride (Cl-) was determined by standard AgNO3 titra-
tion. Carbonate (CO32-) and bicarbonate (HCO3
-) were
determined by titration with HCl. Sodium (Na?) and
potassium (K?) were measured by flame photometry.
Sulfate (SO42-) and nitrate (NO3
-) were determined using
UV–visible spectrophotometer. The EC and pH of water
samples were measured in the field immediately after the
collection of the samples using pH/EC/TDS meter (Hanna
HI 9811-5). Sampling, preservation, and analysis of water
samples were carried out following the method recom-
mended by APHA (2005).
Hydrogeochemistry
Results of the hydrochemical parameters and correspond-
ing groups of individual groundwater samples are pre-
sented in Table 1, and descriptive statistics for F- and
other parameters are given in Table 2. Table 3 presents the
correlation matrix in the analyzed groundwater samples of
hard rock aquifers of Siddipet, Telangana State, India.
Among the physical parameters, pH ranges from 6.3 to 8.9
with an average of 7.5, indicating the alkaline nature of
groundwater. Even though pH has no effect on human
health, it is closely related to other chemical constituents of
water. According to Keshavarzi et al. (2010), in acidic
water, fluoride is adsorbed on a clay surface, while in
alkaline water, fluoride is desorbed from solid phases;
therefore, alkaline pH is more favorable for fluoride dis-
2502 Appl Water Sci (2017) 7:2501–2512
123
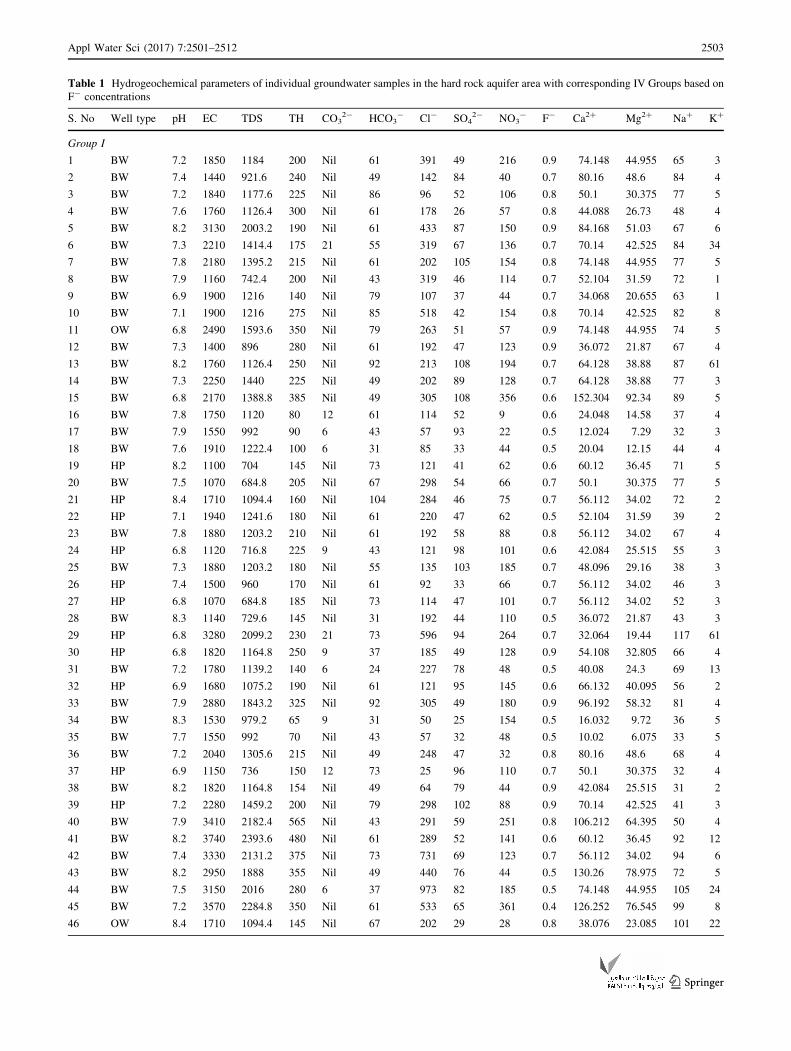
Table 1 Hydrogeochemical parameters of individual groundwater samples in the hard rock aquifer area with corresponding IV Groups based on
F- concentrations
S. No Well type pH EC TDS TH CO32- HCO3
- Cl- SO42- NO3
- F- Ca2? Mg2? Na? K?
Group I
1 BW 7.2 1850 1184 200 Nil 61 391 49 216 0.9 74.148 44.955 65 3
2 BW 7.4 1440 921.6 240 Nil 49 142 84 40 0.7 80.16 48.6 84 4
3 BW 7.2 1840 1177.6 225 Nil 86 96 52 106 0.8 50.1 30.375 77 5
4 BW 7.6 1760 1126.4 300 Nil 61 178 26 57 0.8 44.088 26.73 48 4
5 BW 8.2 3130 2003.2 190 Nil 61 433 87 150 0.9 84.168 51.03 67 6
6 BW 7.3 2210 1414.4 175 21 55 319 67 136 0.7 70.14 42.525 84 34
7 BW 7.8 2180 1395.2 215 Nil 61 202 105 154 0.8 74.148 44.955 77 5
8 BW 7.9 1160 742.4 200 Nil 43 319 46 114 0.7 52.104 31.59 72 1
9 BW 6.9 1900 1216 140 Nil 79 107 37 44 0.7 34.068 20.655 63 1
10 BW 7.1 1900 1216 275 Nil 85 518 42 154 0.8 70.14 42.525 82 8
11 OW 6.8 2490 1593.6 350 Nil 79 263 51 57 0.9 74.148 44.955 74 5
12 BW 7.3 1400 896 280 Nil 61 192 47 123 0.9 36.072 21.87 67 4
13 BW 8.2 1760 1126.4 250 Nil 92 213 108 194 0.7 64.128 38.88 87 61
14 BW 7.3 2250 1440 225 Nil 49 202 89 128 0.7 64.128 38.88 77 3
15 BW 6.8 2170 1388.8 385 Nil 49 305 108 356 0.6 152.304 92.34 89 5
16 BW 7.8 1750 1120 80 12 61 114 52 9 0.6 24.048 14.58 37 4
17 BW 7.9 1550 992 90 6 43 57 93 22 0.5 12.024 7.29 32 3
18 BW 7.6 1910 1222.4 100 6 31 85 33 44 0.5 20.04 12.15 44 4
19 HP 8.2 1100 704 145 Nil 73 121 41 62 0.6 60.12 36.45 71 5
20 BW 7.5 1070 684.8 205 Nil 67 298 54 66 0.7 50.1 30.375 77 5
21 HP 8.4 1710 1094.4 160 Nil 104 284 46 75 0.7 56.112 34.02 72 2
22 HP 7.1 1940 1241.6 180 Nil 61 220 47 62 0.5 52.104 31.59 39 2
23 BW 7.8 1880 1203.2 210 Nil 61 192 58 88 0.8 56.112 34.02 67 4
24 HP 6.8 1120 716.8 225 9 43 121 98 101 0.6 42.084 25.515 55 3
25 BW 7.3 1880 1203.2 180 Nil 55 135 103 185 0.7 48.096 29.16 38 3
26 HP 7.4 1500 960 170 Nil 61 92 33 66 0.7 56.112 34.02 46 3
27 HP 6.8 1070 684.8 185 Nil 73 114 47 101 0.7 56.112 34.02 52 3
28 BW 8.3 1140 729.6 145 Nil 31 192 44 110 0.5 36.072 21.87 43 3
29 HP 6.8 3280 2099.2 230 21 73 596 94 264 0.7 32.064 19.44 117 61
30 HP 6.8 1820 1164.8 250 9 37 185 49 128 0.9 54.108 32.805 66 4
31 BW 7.2 1780 1139.2 140 6 24 227 78 48 0.5 40.08 24.3 69 13
32 HP 6.9 1680 1075.2 190 Nil 61 121 95 145 0.6 66.132 40.095 56 2
33 BW 7.9 2880 1843.2 325 Nil 92 305 49 180 0.9 96.192 58.32 81 4
34 BW 8.3 1530 979.2 65 9 31 50 25 154 0.5 16.032 9.72 36 5
35 BW 7.7 1550 992 70 Nil 43 57 32 48 0.5 10.02 6.075 33 5
36 BW 7.2 2040 1305.6 215 Nil 49 248 47 32 0.8 80.16 48.6 68 4
37 HP 6.9 1150 736 150 12 73 25 96 110 0.7 50.1 30.375 32 4
38 BW 8.2 1820 1164.8 154 Nil 49 64 79 44 0.9 42.084 25.515 31 2
39 HP 7.2 2280 1459.2 200 Nil 79 298 102 88 0.9 70.14 42.525 41 3
40 BW 7.9 3410 2182.4 565 Nil 43 291 59 251 0.8 106.212 64.395 50 4
41 BW 8.2 3740 2393.6 480 Nil 61 289 52 141 0.6 60.12 36.45 92 12
42 BW 7.4 3330 2131.2 375 Nil 73 731 69 123 0.7 56.112 34.02 94 6
43 BW 8.2 2950 1888 355 Nil 49 440 76 44 0.5 130.26 78.975 72 5
44 BW 7.5 3150 2016 280 6 37 973 82 185 0.5 74.148 44.955 105 24
45 BW 7.2 3570 2284.8 350 Nil 61 533 65 361 0.4 126.252 76.545 99 8
46 OW 8.4 1710 1094.4 145 Nil 67 202 29 28 0.8 38.076 23.085 101 22
Appl Water Sci (2017) 7:2501–2512 2503
123
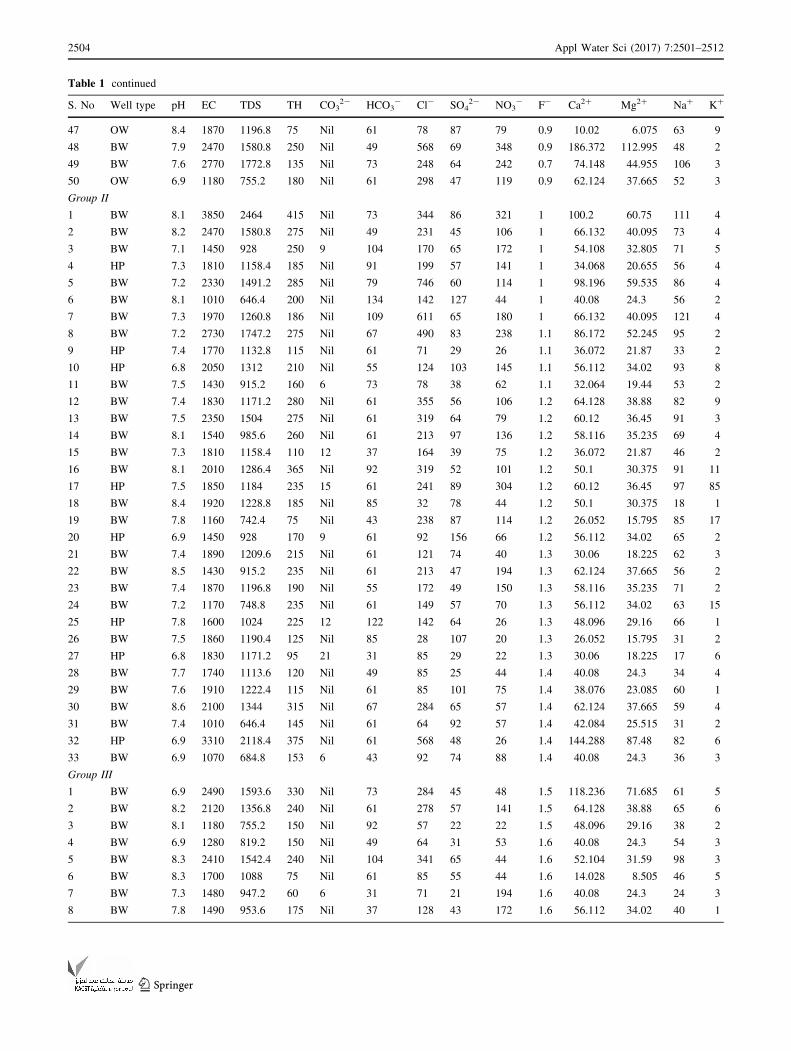
Table 1 continued
S. No Well type pH EC TDS TH CO32- HCO3
- Cl- SO42- NO3
- F- Ca2? Mg2? Na? K?
47 OW 8.4 1870 1196.8 75 Nil 61 78 87 79 0.9 10.02 6.075 63 9
48 BW 7.9 2470 1580.8 250 Nil 49 568 69 348 0.9 186.372 112.995 48 2
49 BW 7.6 2770 1772.8 135 Nil 73 248 64 242 0.7 74.148 44.955 106 3
50 OW 6.9 1180 755.2 180 Nil 61 298 47 119 0.9 62.124 37.665 52 3
Group II
1 BW 8.1 3850 2464 415 Nil 73 344 86 321 1 100.2 60.75 111 4
2 BW 8.2 2470 1580.8 275 Nil 49 231 45 106 1 66.132 40.095 73 4
3 BW 7.1 1450 928 250 9 104 170 65 172 1 54.108 32.805 71 5
4 HP 7.3 1810 1158.4 185 Nil 91 199 57 141 1 34.068 20.655 56 4
5 BW 7.2 2330 1491.2 285 Nil 79 746 60 114 1 98.196 59.535 86 4
6 BW 8.1 1010 646.4 200 Nil 134 142 127 44 1 40.08 24.3 56 2
7 BW 7.3 1970 1260.8 186 Nil 109 611 65 180 1 66.132 40.095 121 4
8 BW 7.2 2730 1747.2 275 Nil 67 490 83 238 1.1 86.172 52.245 95 2
9 HP 7.4 1770 1132.8 115 Nil 61 71 29 26 1.1 36.072 21.87 33 2
10 HP 6.8 2050 1312 210 Nil 55 124 103 145 1.1 56.112 34.02 93 8
11 BW 7.5 1430 915.2 160 6 73 78 38 62 1.1 32.064 19.44 53 2
12 BW 7.4 1830 1171.2 280 Nil 61 355 56 106 1.2 64.128 38.88 82 9
13 BW 7.5 2350 1504 275 Nil 61 319 64 79 1.2 60.12 36.45 91 3
14 BW 8.1 1540 985.6 260 Nil 61 213 97 136 1.2 58.116 35.235 69 4
15 BW 7.3 1810 1158.4 110 12 37 164 39 75 1.2 36.072 21.87 46 2
16 BW 8.1 2010 1286.4 365 Nil 92 319 52 101 1.2 50.1 30.375 91 11
17 HP 7.5 1850 1184 235 15 61 241 89 304 1.2 60.12 36.45 97 85
18 BW 8.4 1920 1228.8 185 Nil 85 32 78 44 1.2 50.1 30.375 18 1
19 BW 7.8 1160 742.4 75 Nil 43 238 87 114 1.2 26.052 15.795 85 17
20 HP 6.9 1450 928 170 9 61 92 156 66 1.2 56.112 34.02 65 2
21 BW 7.4 1890 1209.6 215 Nil 61 121 74 40 1.3 30.06 18.225 62 3
22 BW 8.5 1430 915.2 235 Nil 61 213 47 194 1.3 62.124 37.665 56 2
23 BW 7.4 1870 1196.8 190 Nil 55 172 49 150 1.3 58.116 35.235 71 2
24 BW 7.2 1170 748.8 235 Nil 61 149 57 70 1.3 56.112 34.02 63 15
25 HP 7.8 1600 1024 225 12 122 142 64 26 1.3 48.096 29.16 66 1
26 BW 7.5 1860 1190.4 125 Nil 85 28 107 20 1.3 26.052 15.795 31 2
27 HP 6.8 1830 1171.2 95 21 31 85 29 22 1.3 30.06 18.225 17 6
28 BW 7.7 1740 1113.6 120 Nil 49 85 25 44 1.4 40.08 24.3 34 4
29 BW 7.6 1910 1222.4 115 Nil 61 85 101 75 1.4 38.076 23.085 60 1
30 BW 8.6 2100 1344 315 Nil 67 284 65 57 1.4 62.124 37.665 59 4
31 BW 7.4 1010 646.4 145 Nil 61 64 92 57 1.4 42.084 25.515 31 2
32 HP 6.9 3310 2118.4 375 Nil 61 568 48 26 1.4 144.288 87.48 82 6
33 BW 6.9 1070 684.8 153 6 43 92 74 88 1.4 40.08 24.3 36 3
Group III
1 BW 6.9 2490 1593.6 330 Nil 73 284 45 48 1.5 118.236 71.685 61 5
2 BW 8.2 2120 1356.8 240 Nil 61 278 57 141 1.5 64.128 38.88 65 6
3 BW 8.1 1180 755.2 150 Nil 92 57 22 22 1.5 48.096 29.16 38 2
4 BW 6.9 1280 819.2 150 Nil 49 64 31 53 1.6 40.08 24.3 54 3
5 BW 8.3 2410 1542.4 240 Nil 104 341 65 44 1.6 52.104 31.59 98 3
6 BW 8.3 1700 1088 75 Nil 61 85 55 44 1.6 14.028 8.505 46 5
7 BW 7.3 1480 947.2 60 6 31 71 21 194 1.6 40.08 24.3 24 3
8 BW 7.8 1490 953.6 175 Nil 37 128 43 172 1.6 56.112 34.02 40 1
2504 Appl Water Sci (2017) 7:2501–2512
123
Table 1 continued
S. No Well type pH EC TDS TH CO32- HCO3
- Cl- SO42- NO3
- F- Ca2? Mg2? Na? K?
9 BW 7.1 1650 1056 120 Nil 61 57 67 62 1.7 36.072 21.87 23 1
10 BW 7.4 1040 665.6 185 Nil 91 71 98 70 1.7 30.06 18.225 43 4
11 HP 7.6 1890 1209.6 170 Nil 61 199 55 35 1.7 40.08 24.3 56 6
12 BW 6.9 1150 736 175 Nil 43 149 120 123 1.8 44.088 26.73 76 6
13 BW 7.2 1860 1190.4 150 Nil 61 99 62 66 1.8 40.08 24.3 62 1
14 BW 8.3 1830 1171.2 225 Nil 61 511 77 163 1.8 70.14 42.525 94 10
15 BW 7.2 3170 2028.8 250 Nil 73 429 137 84 1.9 68.136 41.31 134 7
Group IV
1 BW 7.9 1590 1017.6 115 Nil 61 36 49 123 2 36.072 21.87 33 2
2 BW 7.3 1690 1081.6 190 Nil 61 675 97 22 2.1 50.1 30.375 96 3
3 BW 7.8 1540 985.6 200 Nil 99 270 51 13 2 40.08 24.3 102 3
4 BW 7.6 1870 1196.8 225 Nil 92 124 79 62 2 44.088 26.73 82 4
5 HP 8.9 1390 889.6 50 9 18 36 21 9 2.2 10.02 6.075 30 2
6 BW 7.6 1260 806.4 175 Nil 73 57 78 198 2.1 26.052 15.795 59 3
Except pH, EC is expressed as lS cm-1, and all other parameters are expressed as mg L-1
HP hand pump, BW bore well, OW open well
Table 2 Descriptive statistics for F- and other physicochemical parameters
Parameters pH EC TDS TH HCO3- Cl- SO4
2- NO3- F- Ca2? Mg2? Na? K?
Min 6.8a 1070 684.8 65 24 25 25 9 0.4 10.02 6.075 31 1
6.8b 1010 646.4 75 31 28 25 20 1 26.052 15.795 17 1
6.9c 1040 665.6 60 31 57 21 22 1.5 14.028 8.505 23 1
7.3d 1260 806.4 50 18 36 21 9 2 10.02 6.175 30 2
Max 8.4a 3740 2393.6 565 104 973 108 361 0.9 186.372 112.995 117 61
8.6b 3850 2464 415 134 746 156 321 1.4 144.288 87.48 121 85
8.3c 3170 2028.8 330 104 511 137 194 1.9 118.236 71.685 134 10
8.9d 1870 1196.8 225 99 675 97 198 2.2 50.1 30.375 102 4
Mean 7.5a 2020.4 1293.06 218.08 59.62 254.64 63.84 123.6 0.706 61.48 37.28 65.96 7.96
7.5b 1866.06 1194.28 213.76 68.94 220.21 69.94 104.35 1.20 54.78 33.21 65.45 6.85
7.6c 1782.67 1140.91 179.67 63.93 188.20 63.67 88 1.66 50.77 30.78 60.93 4.20
7.5d 1556.67 996.27 159.17 67.33 199.67 62.50 71.13 2.07 34.40 20.86 67.00 2.83
Median 7.4a 1860 1190.4 200 61 207.5 56 110 0.7 56.112 34.02 67 4
7.4b 1830 1171.2 210 61 170 65 79.2 1.2 54.108 32.805 65 4
7.4c 1700 1088 175 61 128 57 66 1.6 44.088 26.73 56 4
7.6d 1565 1001.6 182.5 67 90.5 64.5 41.8 2.05 38.076 23.085 70.5 3
SD 0.51a 711.94 455.64 101.29 17.32 186.75 24.43 85.20 0.14 34.14 20.70 22.01 12.46
0.62b 580.73 371.67 69.96 20.38 147.35 33.29 55.48 0.12 23.82 14.44 29.80 2.57
0.62c 580.73 371.67 69.96 20.38 147.35 33.29 55.48 0.12 23.82 14.44 29.80 2.57
0.47d 215.93 138.20 64.92 28.84 249.22 27.35 75.57 0.08 14.42 8.74 31.24 0.75
EC is expressed as lS cm-1, and all other parameters are expressed as mg L-1
a Group Ib Group IIc Group IIId Group IV
Appl Water Sci (2017) 7:2501–2512 2505
123
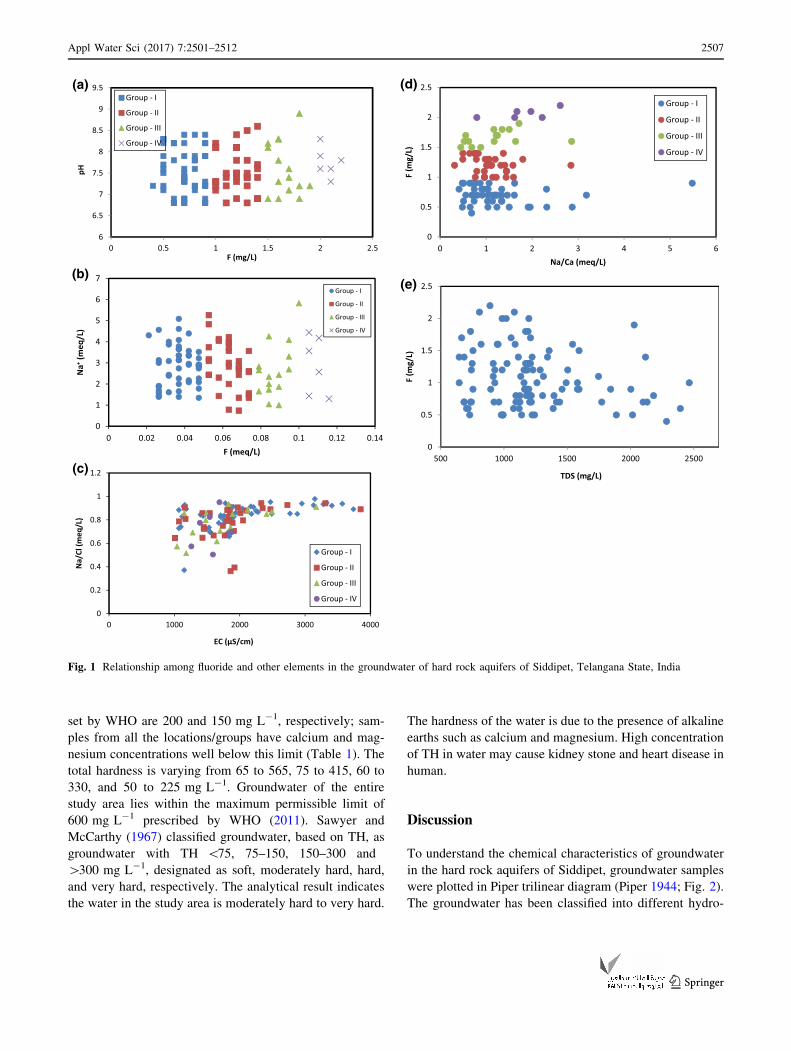
solution, which is also observed by several other authors
(Rafique et al. 2009; Saxena and Ahmed 2003; Rao 2009;
Ravindra and Garg 2007; Vikas et al. 2009). In the present
case, group III and IV water samples were found alkaline in
nature and their pH value varies from 7.3 to 8.9. It is
interesting that about 84 % of the samples lie between pH
7.1 and 8.9 (Tables 1, 2), which indicates that the dissolved
carbonates are predominantly in the HCO3- form (Adams
et al. 2001). A positive correlation (Fig. 1a; Table 3) is
seen between the pH of groundwater and the fluoride
content indicating that the pH, and hence alkalinity,
influences the fluoride content in the groundwater. In
general, the concentration of nitrate does not exceed
10 mg L-1 in water under natural conditions (Cushing
et al. 1973). However, nitrate varies from 9 to 361, 20 to
321, 22 to 194, and 9 to 198 mg L-1 in group I–IV,
respectively (Table 1).
The possible sources of nitrates are poultry farms, ani-
mal wastages and septic tank leakages, and agricultural
activities, which are noticed in the study area. These results
suggest that groundwater has an elevated level of nitrate,
greater than the drinking water guideline value of
45 mg L-1 (WHO 2011). The presence of high nitrate
concentration in the drinking water increases the incidence
of gastric cancer and other potential hazards to infants and
pregnant women (Nagireddi Srinivasa Rao 2006) birth
malformations, and hypertension (Majumdar and Gupta
2000). Chloride occurs naturally in all types of water. The
concentration of chloride content in the water samples was
recorded from 25 to 973, 28 to 746, 57 to 511, and 36 to
675 mg L-1 (Table 1). The majority of groundwater shows
concentration of chloride above the WHO (2011) suggested
maximum permissible limit of 250 mg L-1. The
bicarbonate concentration in the groundwater ranges from
24 to 104, 31 to 134, 31 to 104, and 18 to 99 mg L-1 in
group I–IV, respectively (Table 1). The high concentration
of bicarbonate when compared to carbonate in the water is
the result of the reactions of soil CO2 with dissolution of
silicate minerals. TDS include inorganic salts, such as
calcium, magnesium, potassium, and organic matter that
are dissolved in water. As per the TDS classification
(Fetters 1990) 72, 70, 60, and 40 % from group I, II, III,
and IV belongs to brackish type (TDS [1000 mg L-1).
Electrical conductivity ranges from 1070 to 3740, 1010 to
3850, 1040 to 3170, and 1260 to 1870 lS/cm from groups
I, II, III, and IV, respectively (Table 1). According to a
report of International Water Management Institute
(IWMI), the TDS did not play direct role in health risks,
but prolonged consumption of high salt containing water
(TDS above 500 mg L-1) can cause kidney stone, a phe-
nomenon widely reported from many parts of the country.
The sodium concentration in groundwater ranges from 31
to 117, 17 to 121, 23 to 134, and 30 to 102 mg L-1, in
group I–IV, respectively (Tables 1, 2). The high concen-
tration of sodium ions among the cationic concentrations
reflects rock weathering and/or dissolution of soil salts
stored by the influence of evaporation (Stallard and
Edmond 1983). The permissible limit of Na?, in
potable water is 200 mg L-1, and none of the samples
exceed the limit. The concentration of calcium ranges from
10 to 186, 26 to 144, 14 to 144, and 10 to 50 mg L-1 and
magnesium 6 to 112, 15 to 87, 6 to 71 and 6 to 30 mg L-1,
respectively (Table 1). The calcium and magnesium ions
present in the groundwater are possibly derived from
leaching of calcium and magnesium-bearing rock-forming
silicates. The permissible limit for calcium and magnesium
Table 3 Correlation coefficient of analyzed chemical parameters of groundwater in hard rock aquifers of Siddipet, Medak, Telangana, India
pH EC TDS TH CO3- HCO3
- Cl- SO42- NO3
- F- Ca2? Mg? Na? K?
pH 1.00
EC -0.12 1.00
TDS -0.15 0.65 1.00
TH 0.34 0.64 0.64 1.00
CO2- -0.13 -0.04 -0.04 -0.23 1.00
HCO3- -0.09 0.03 0.03 0.20 -0.20 1.00
Cl- 0.07 0.61 0.61 0.53 -0.07 0.10 1.00
SO42- 0.17 0.10 0.10 0.12 0.00 0.17 0.12 1.00
NO3- 0.18 0.40 0.40 0.40 0.03 -0.06 0.39 0.22 1.00
F- 0.35 -0.31 -0.36 -0.17 -0.12 0.12 -0.15 0.04 -0.23 1.00
Ca2? -0.37 0.56 0.56 0.68 -0.22 0.05 0.57 0.13 0.52 -0.22 1.00
Mg2? 0.34 0.56 0.56 0.65 -0.23 0.05 0.57 0.13 0.52 -0.25 1.00 1.00
Na? -0.02 0.50 0.51 0.53 -0.10 0.29 0.67 0.28 0.37 0.46 0.37 0.37 1.00
K? 0.01 0.16 0.16 0.10 0.43 0.02 0.22 0.18 0.33 -0.13 0.01 0.01 0.37 1.00
2506 Appl Water Sci (2017) 7:2501–2512
123
set by WHO are 200 and 150 mg L-1, respectively; sam-
ples from all the locations/groups have calcium and mag-
nesium concentrations well below this limit (Table 1). The
total hardness is varying from 65 to 565, 75 to 415, 60 to
330, and 50 to 225 mg L-1. Groundwater of the entire
study area lies within the maximum permissible limit of
600 mg L-1 prescribed by WHO (2011). Sawyer and
McCarthy (1967) classified groundwater, based on TH, as
groundwater with TH \75, 75–150, 150–300 and
[300 mg L-1, designated as soft, moderately hard, hard,
and very hard, respectively. The analytical result indicates
the water in the study area is moderately hard to very hard.
The hardness of the water is due to the presence of alkaline
earths such as calcium and magnesium. High concentration
of TH in water may cause kidney stone and heart disease in
human.
Discussion
To understand the chemical characteristics of groundwater
in the hard rock aquifers of Siddipet, groundwater samples
were plotted in Piper trilinear diagram (Piper 1944; Fig. 2).
The groundwater has been classified into different hydro-
6
6.5
7
7.5
8
8.5
9
9.5
0 0.5 1 1.5 2 2.5
pH
F (mg/L)
Group - I
Group - II
Group - III
Group - IV
(a)
0
1
2
3
4
5
6
7
0 0.02 0.04 0.06 0.08 0.1 0.12 0.14
Na+
(meq
/L)
F (meq/L)
Group - I
Group - II
Group - III
Group - IV
(b)
0
0.2
0.4
0.6
0.8
1
1.2
0 1000 2000 3000 4000
Na/
Cl (m
eq/L
)
EC (µS/cm)
Group - I
Group - II
Group - III
Group - IV
(c)
0
0.5
1
1.5
2
2.5
0 1 2 3 4 5 6
F (m
g/L)
Na/Ca (meq/L)
Group - I
Group - II
Group - III
Group - IV
(d)
0
0.5
1
1.5
2
2.5
500 1000 1500 2000 2500
F (m
g/L)
TDS (mg/L)
(e)
Fig. 1 Relationship among fluoride and other elements in the groundwater of hard rock aquifers of Siddipet, Telangana State, India
Appl Water Sci (2017) 7:2501–2512 2507
123
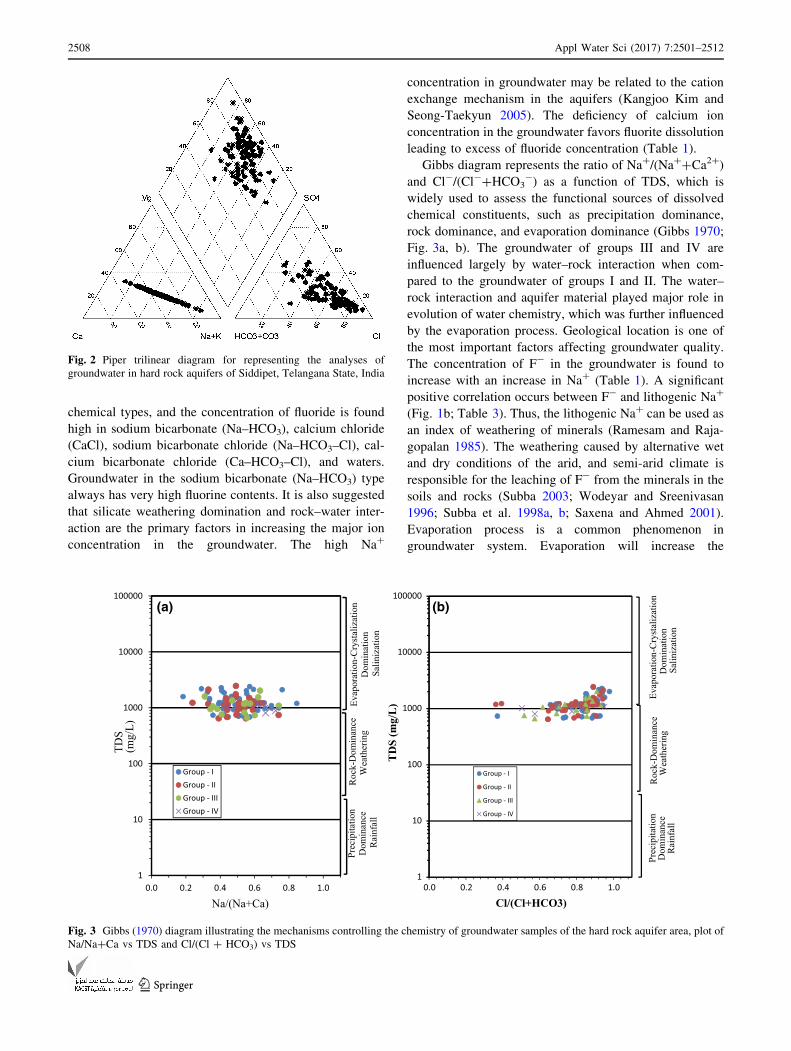
chemical types, and the concentration of fluoride is found
high in sodium bicarbonate (Na–HCO3), calcium chloride
(CaCl), sodium bicarbonate chloride (Na–HCO3–Cl), cal-
cium bicarbonate chloride (Ca–HCO3–Cl), and waters.
Groundwater in the sodium bicarbonate (Na–HCO3) type
always has very high fluorine contents. It is also suggested
that silicate weathering domination and rock–water inter-
action are the primary factors in increasing the major ion
concentration in the groundwater. The high Na?
concentration in groundwater may be related to the cation
exchange mechanism in the aquifers (Kangjoo Kim and
Seong-Taekyun 2005). The deficiency of calcium ion
concentration in the groundwater favors fluorite dissolution
leading to excess of fluoride concentration (Table 1).
Gibbs diagram represents the ratio of Na?/(Na??Ca2?)
and Cl-/(Cl-?HCO3-) as a function of TDS, which is
widely used to assess the functional sources of dissolved
chemical constituents, such as precipitation dominance,
rock dominance, and evaporation dominance (Gibbs 1970;
Fig. 3a, b). The groundwater of groups III and IV are
influenced largely by water–rock interaction when com-
pared to the groundwater of groups I and II. The water–
rock interaction and aquifer material played major role in
evolution of water chemistry, which was further influenced
by the evaporation process. Geological location is one of
the most important factors affecting groundwater quality.
The concentration of F- in the groundwater is found to
increase with an increase in Na? (Table 1). A significant
positive correlation occurs between F- and lithogenic Na?
(Fig. 1b; Table 3). Thus, the lithogenic Na? can be used as
an index of weathering of minerals (Ramesam and Raja-
gopalan 1985). The weathering caused by alternative wet
and dry conditions of the arid, and semi-arid climate is
responsible for the leaching of F- from the minerals in the
soils and rocks (Subba 2003; Wodeyar and Sreenivasan
1996; Subba et al. 1998a, b; Saxena and Ahmed 2001).
Evaporation process is a common phenomenon in
groundwater system. Evaporation will increase the
Fig. 2 Piper trilinear diagram for representing the analyses of
groundwater in hard rock aquifers of Siddipet, Telangana State, India
1
10
100
1000
10000
100000
0.0 0.2 0.4 0.6 0.8 1.0
Group - IGroup - IIGroup - IIIGroup - IV
Evap
orat
ion-
Cry
stal
izat
ion
Dom
inat
ion
Salin
izat
ion
Roc
k-D
omin
ance
Wea
ther
ing
Prec
ipita
tion
Dom
inan
ce
Rai
nfal
l
Na/(Na+Ca)
TDS
(mg/
L)
(a)
1
10
100
1000
10000
100000
0.0 0.2 0.4 0.6 0.8 1.0
TD
S (m
g/L
)
Cl/(Cl+HCO3)
Group - I
Group - II
Group - III
Group - IV
Evap
orat
ion-
Cry
stal
izat
ion
Dom
inat
ion
Salin
izat
ion
Roc
k-D
omin
ance
Wea
ther
ing
Prec
ipita
tion
Dom
inan
ce
Rai
nfal
l
(b)
Fig. 3 Gibbs (1970) diagram illustrating the mechanisms controlling the chemistry of groundwater samples of the hard rock aquifer area, plot of
Na/Na?Ca vs TDS and Cl/(Cl ? HCO3) vs TDS
2508 Appl Water Sci (2017) 7:2501–2512
123
concentration of total dissolved solids in groundwater, and
the Na?/Cl- ratio remains the same, and it is one of the
good indicative factors of evaporation (Fig. 1c). This
observation indicates that evaporation may not be the
major geochemical process controlling the chemistry of
groundwater in this study region or ion exchange reaction
dominating over evaporation. It is also observed that the
ratio of Na?/Ca? is increased with reference to the increase
in fluoride concentration (Fig. 1d) in all groups. A negative
correlation between TDS and F- is observed which sug-
gests the influence of rock–water interaction (Fig. 1e;
Table 3). Na?/Cl- ratio is found greater than one in all
groups indicating that the Na is released from silicate
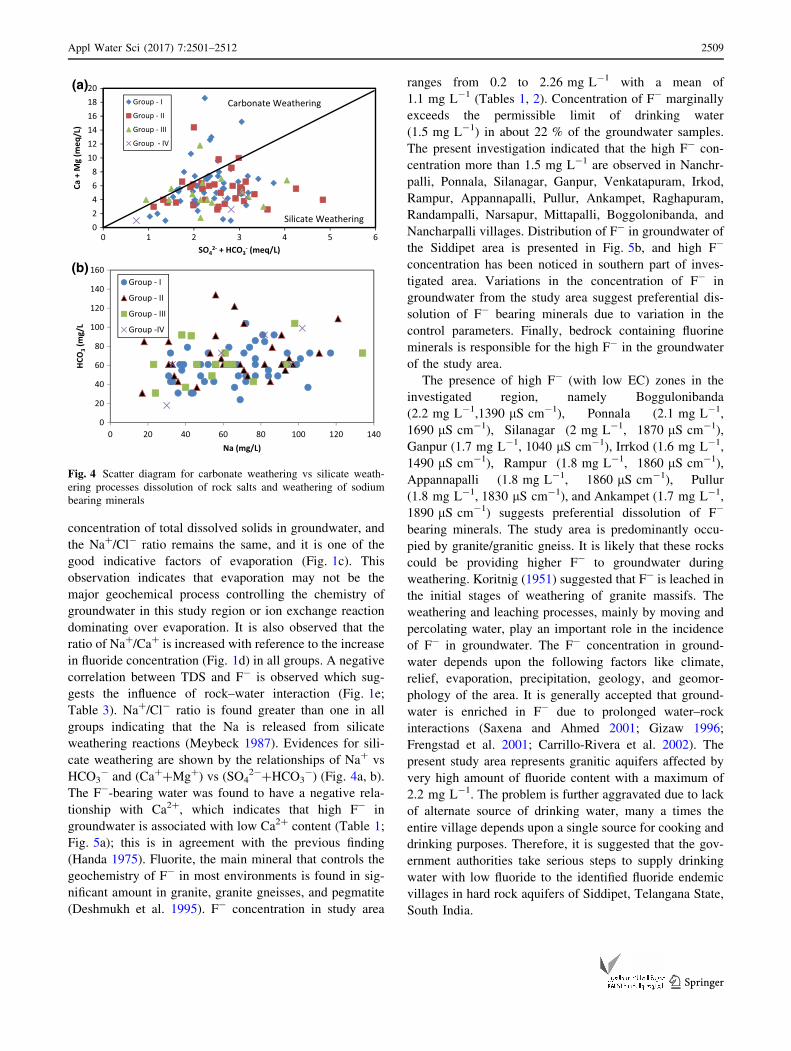
weathering reactions (Meybeck 1987). Evidences for sili-
cate weathering are shown by the relationships of Na? vs
HCO3- and (Ca??Mg?) vs (SO4
2-?HCO3-) (Fig. 4a, b).
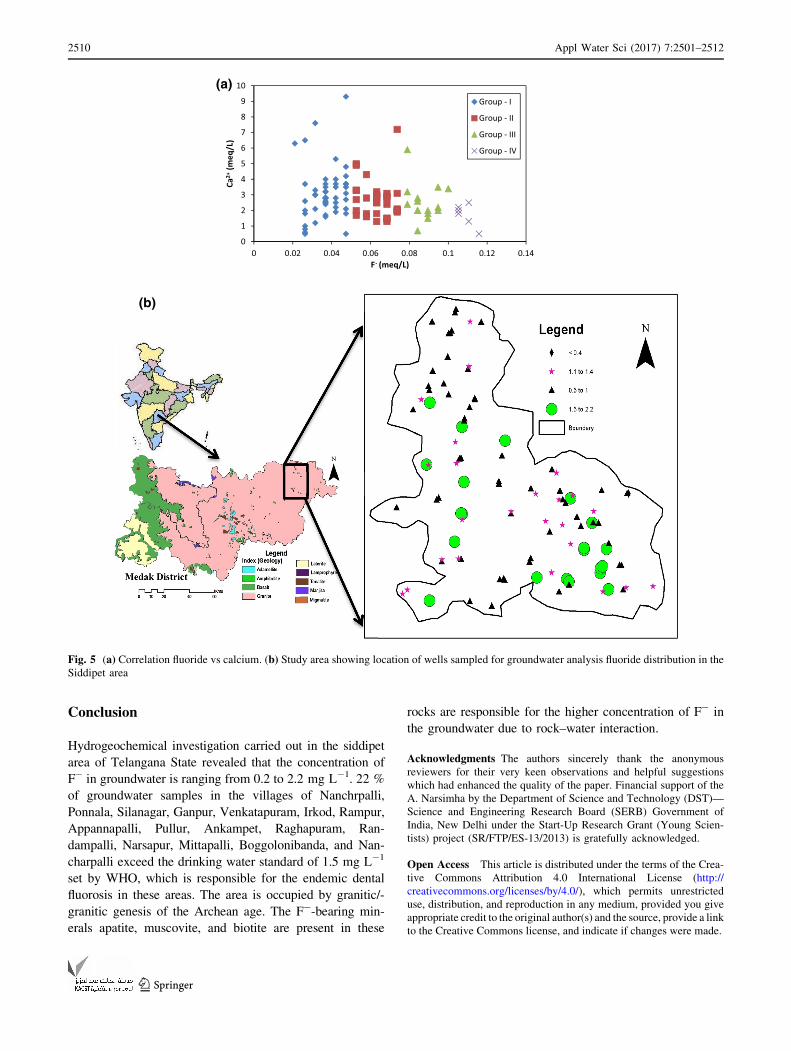
The F--bearing water was found to have a negative rela-
tionship with Ca2?, which indicates that high F- in
groundwater is associated with low Ca2? content (Table 1;
Fig. 5a); this is in agreement with the previous finding
(Handa 1975). Fluorite, the main mineral that controls the
geochemistry of F- in most environments is found in sig-
nificant amount in granite, granite gneisses, and pegmatite
(Deshmukh et al. 1995). F- concentration in study area
ranges from 0.2 to 2.26 mg L-1 with a mean of
1.1 mg L-1 (Tables 1, 2). Concentration of F- marginally
exceeds the permissible limit of drinking water
(1.5 mg L-1) in about 22 % of the groundwater samples.
The present investigation indicated that the high F- con-
centration more than 1.5 mg L-1 are observed in Nanchr-
palli, Ponnala, Silanagar, Ganpur, Venkatapuram, Irkod,
Rampur, Appannapalli, Pullur, Ankampet, Raghapuram,
Randampalli, Narsapur, Mittapalli, Boggolonibanda, and
Nancharpalli villages. Distribution of F- in groundwater of
the Siddipet area is presented in Fig. 5b, and high F-
concentration has been noticed in southern part of inves-
tigated area. Variations in the concentration of F- in
groundwater from the study area suggest preferential dis-
solution of F- bearing minerals due to variation in the
control parameters. Finally, bedrock containing fluorine
minerals is responsible for the high F- in the groundwater
of the study area.
The presence of high F- (with low EC) zones in the
investigated region, namely Boggulonibanda
(2.2 mg L-1,1390 lS cm-1), Ponnala (2.1 mg L-1,
1690 lS cm-1), Silanagar (2 mg L-1, 1870 lS cm-1),
Ganpur (1.7 mg L-1, 1040 lS cm-1), Irrkod (1.6 mg L-1,
1490 lS cm-1), Rampur (1.8 mg L-1, 1860 lS cm-1),
Appannapalli (1.8 mg L-1, 1860 lS cm-1), Pullur
(1.8 mg L-1, 1830 lS cm-1), and Ankampet (1.7 mg L-1,
1890 lS cm-1) suggests preferential dissolution of F-
bearing minerals. The study area is predominantly occu-
pied by granite/granitic gneiss. It is likely that these rocks
could be providing higher F- to groundwater during
weathering. Koritnig (1951) suggested that F- is leached in
the initial stages of weathering of granite massifs. The
weathering and leaching processes, mainly by moving and
percolating water, play an important role in the incidence
of F- in groundwater. The F- concentration in ground-
water depends upon the following factors like climate,
relief, evaporation, precipitation, geology, and geomor-
phology of the area. It is generally accepted that ground-
water is enriched in F- due to prolonged water–rock
interactions (Saxena and Ahmed 2001; Gizaw 1996;
Frengstad et al. 2001; Carrillo-Rivera et al. 2002). The
present study area represents granitic aquifers affected by
very high amount of fluoride content with a maximum of
2.2 mg L-1. The problem is further aggravated due to lack
of alternate source of drinking water, many a times the
entire village depends upon a single source for cooking and
drinking purposes. Therefore, it is suggested that the gov-
ernment authorities take serious steps to supply drinking
water with low fluoride to the identified fluoride endemic
villages in hard rock aquifers of Siddipet, Telangana State,
South India.
0
20
40
60
80
100
120
140
160
0 20 40 60 80 100 120 140
HCO
3(m
g/L
Na (mg/L)
Group - I
Group - II
Group - III
Group -IV
(b)
02468
101214161820
0 1 2 3 4 5 6
Ca +
Mg
(meq
/L)
SO42- + HCO3
- (meq/L)
Group - I
Group - II
Group - III
Group - IV
Carbonate Weathering
Silicate Weathering
(a)
Fig. 4 Scatter diagram for carbonate weathering vs silicate weath-
ering processes dissolution of rock salts and weathering of sodium
bearing minerals
Appl Water Sci (2017) 7:2501–2512 2509
123
Conclusion
Hydrogeochemical investigation carried out in the siddipet
area of Telangana State revealed that the concentration of
F- in groundwater is ranging from 0.2 to 2.2 mg L-1. 22 %
of groundwater samples in the villages of Nanchrpalli,
Ponnala, Silanagar, Ganpur, Venkatapuram, Irkod, Rampur,
Appannapalli, Pullur, Ankampet, Raghapuram, Ran-
dampalli, Narsapur, Mittapalli, Boggolonibanda, and Nan-
charpalli exceed the drinking water standard of 1.5 mg L-1
set by WHO, which is responsible for the endemic dental
fluorosis in these areas. The area is occupied by granitic/-
granitic genesis of the Archean age. The F--bearing min-
erals apatite, muscovite, and biotite are present in these
rocks are responsible for the higher concentration of F- in
the groundwater due to rock–water interaction.
Acknowledgments The authors sincerely thank the anonymous
reviewers for their very keen observations and helpful suggestions
which had enhanced the quality of the paper. Financial support of the
A. Narsimha by the Department of Science and Technology (DST)—
Science and Engineering Research Board (SERB) Government of
India, New Delhi under the Start-Up Research Grant (Young Scien-
tists) project (SR/FTP/ES-13/2013) is gratefully acknowledged.
Open Access This article is distributed under the terms of the Crea-
tive Commons Attribution 4.0 International License (http://
creativecommons.org/licenses/by/4.0/), which permits unrestricted
use, distribution, and reproduction in any medium, provided you give
appropriate credit to the original author(s) and the source, provide a link
to the Creative Commons license, and indicate if changes were made.
0
1
2
3
4
5
6
7
8
9
10(a)
0 0.02 0.04 0.06 0.08 0.1 0.12 0.14
Ca2+
(meq
/L)
F- (meq/L)
Group - I
Group - II
Group - III
Group - IV
(b)
Fig. 5 (a) Correlation fluoride vs calcium. (b) Study area showing location of wells sampled for groundwater analysis fluoride distribution in the
Siddipet area
2510 Appl Water Sci (2017) 7:2501–2512
123
References
Adams S, Titus R, Pietersen K, Tredoux G, Harris C (2001)
Hydrochemical characteristics of aquifers near Sutherland in the
Western Karoo, South Africa. J Hydrol 241:91–103
Apambire WB, Boyle DR, Michel FA (1997) Geochemistry, genesis,
and health implications of fluoriferous groundwaters in the upper
regions of Ghana. Environ Geol 33:13–24
APHA (2005) Standard methods for examination of water and
wastewater, 21st edn. American Public Health Association,
American Water Works Association and the Water and Envi-
ronment Federation, Washington
Ayoob S, Gupta AK (2006) Fluoride in drinking water: a review on
the status and stress effects. Crit Rev Environ Sci Technol
36:433–487
Carrillo-Rivera JJ, Cardona A, Edmunds WM (2002) Use of
abstraction regime and knowledge of hydrogeological conditions
to control high-fluoride concentration in abstracted groundwater:
San Luis Potosı basin, Mexico. J Hydrol 261:24–47
Cushing EM, Kantrowitz IH, Taylor KR (1973) Water resources of
the Delmarva Peninsular. U S geological survey professional
paper 822, Washington DC
Deshmukh AN, Shah KC, Sriram A (1995) Coal Ash: a source of
fluoride pollution, a case study of Koradi thermal power station,
District Nagpur, Maharashtra. Gondwana Geol Mag 9:21–29
Fantong WY, Satake H, Ayonghe SN, Suh EC et al (2009)
Geochemical provenance and spatial distribution of fluoride in
groundwater of Mayo Tsanaga river basin, Far North Region,
Cameroon: implications for incidence of fluorosis and optimal
consumption dose. Environ Geochem Health 32:147–163
Felsenfeld AJ, Robert MA (1991) A report of fluorosisin the United
Statessecondary to drinking well water. J Am Med Assoc
265(4):486–488
Fetter CW (1990) Applied hydrogeology. CBS Publishers and
Distributors, New Delhi
Fordyce FM, Vrana K, Zhovinsky E, Povoroznuk V, Toth G, Hope
BC, Iljinsky U, Baker J (2007) A health risk assessment for
fluoride in Central Europe. Environ Geochem Health 29:83–102
Frengstad B, Banks D, Siewers U (2001) The chemistry of Norwegian
groundwaters: the dependence of element concentrations in
crystalline bedrock groundwaters. Sci Total Environ
277:101–117
Gaciri SJ, Ad Davis TC (1993) The occurrence and geochemistry of
fluoride in some natural waters of Kenya. J Hydrol 143:395–412
Ghosh Aniruddha, Mukherjee Kakali, Sumanta KG, Saha Bidyut
(2013) Sources and toxicity of fluoride in the environment. Res
Chem Intermed 39:2881–2915
Gibbs RJ (1970) Mechanisms controlling world water chemistry.
Science 17:1088–1090
Gizaw B (1996) The origin of high bicarbonate and fluoride
concentrations in waters of the main Ethiopian Rift Valley.
J Afr Earth Sci 22:391–402
Gupta S, Banerjee S, Saha R, Datta JK, Mondal N (2006) Fluoride
geochemistry of ground water in Nalhati-1 block of Birbhum
district, West Bengal, India. Fluoride 39(4):318–320
Handa BK (1975) Geochemistry and genesis of fluoride containing
groundwaters in India. Groundwater 13:275–281
Hong-jian Gao, You-qian Jin, Jun-ling Wei (2013) Health risk
assessment of fluoride in drinking water from Anhui Province in
China. Environ Monit Assess 185:3687–3695
Indian Council of Medical Research (ICMR) (1975) Manual of
standards of quality for drinking water supplies. In: Special
report series, 2nd edn. New Delhi, p 44
Jacks G, Rajagopalan K, Alveteg T, Jonsson M (1993) Genesis of
high-F groundwaters, Southern India. Appl Geochem 2:241–244
Jha SK, Nayak AK, Sharma YK (2010) Potential fluoride contam-
ination in the drinking water of Marks Nagar, Unnao district,
Uttar Pradesh, India. Environ Geochem Health 32:217–226
Kaminsky LS, Mahoney MC, Leach J, Melius J, Miller JM (1990)
Fluoride: benefits and risks of exposure. Crit Rev Oral Biol Med
1:261–281
Karro Enn, Uppin Marge (2013) The occurrence and hydrochemistry
of fluoride and boron in carbonate aquifer system, central and
western Estonia. Environ Monit Assess 185:3735–3748
Karthikeyan G, Anitha CED, Vishwanathan G (2005) Effect of
certain macro and micro minerals on fluoride toxicity. Indian J
Environ Prot 25:601–609
Keshavarzi B, Moore F, Esmaeili A, Rastmanesh F (2010) The source
of fluoride toxicity in Muteh area, Isfahan, Iran. Environ Earth
Sci 61:777–786
Kim Kangjoo, yun Seong-Taek (2005) Buffering of sodium concen-
tration by cation exchange in the groundwater system of a sandy
aquifer. Geochem J 39:273–284
Koritnig S (1951) Ein Beitrag zur Geochemie des Fluor (A
contribution to the geochemisty of fluorine). Geochim Cos-
mochim Acta 1:89–116
Li Y, Liang CK, Katz BP, Niu S, Cao S, Stookey GK (1996) Effect of
fluoride exposure and nutrition on skeletal fluorosis. J Dent Res
75:2699
Majumdar D, Gupta N (2000) Nitrate pollution of ground water and
associated human health disorders. Indian J Environ Health
42(1):28–39
Mesdaghinia Alireza, Vaghefi Kooshiar Azam, Montazeri Ahmad,
Mohebbi Mohammad Reza, Saeedi Reza (2010) Monitoring of
fluoride in groundwater resources of Iran. Bull Environ Contam
Toxicol 84:432–437
Meybeck M (1987) Global chemical weathering of surficial rocks
estimated from river dissolved loads. Am J Sci 287:401–428
Moghaddam Asghar Asghari, Fijani Elham (2008) Distribution of
fluoride in groundwater of Maku area, northwest of Iran. Environ
Geol 2008:56–116
Murray JJ (1996) Appropriate use of fluorides for human health.
World Health Organization, Geneva
Narsimha A, Sudarshan V (2013) Hydrogeochemistry of groundwater
in Basara area, Adilabad District, Andhra Pradesh, India. J Appl
Geochem 15(2):224–237
Naseem S, Rafique T, Bashir E, Bhanger MI, Laghari A, Usmani TH
(2010) Lithological influences on occurrence of high-fluoride
groundwater in Nagar Parkar area, Thar desert, Pakistan.
Chemosphere 78:1313–1321
Oruc N (2008) Occurrence and problems of high fluoride waters in
Turkey: an overview. Environ Geochem Health 30:315–323
Ozsvath DL (2006) Fluoride concentrations in a crystalline bedrock
aquifer Marathon County. Environ Geol 50:132–138
Piper AM (1944) A graphical procedure in the geochemical
interpretation of water analysis. Trans Am Geophys Union
25:914–923
Rafique T, Naseem S, Usmani TH, Bashir E, Khan FA, Bhanger MI
(2009) Geochemical factors controlling the occurrence of high
fluoride groundwater in the Nagar Parkar area, Sindh, Pakistan.
J Hazard Mater 171:424–430
Ramesam V, Rajagopalan K (1985) Fluoride ingestion into the natural
water of hardrock areas, peninsular India. J Geol Soc India
26:125–132
Rao Nagireddi Srinivasa (2006) Nitrate pollution and its distribution
in the groundwater of Srikakulam district, Andhra Pradesh,
India. Environ Geol 51(4):631–645
Rao NS (2009) Fluoride in groundwater, Varaha river basin,
Visakhapatnam District, Andhra Pradesh, India. Environ Monit
Assess 152:47–60
Appl Water Sci (2017) 7:2501–2512 2511
123
Ravindra K, Garg VK (2007) Hydro-chemical survey of groundwater
of Hisar City and assessment of defluoridation methods used in
India. Environ Monit Assess 132:33–43
Sawyer GN, McCarthy DL (1967) Chemistry of sanitary engineers,
2nd edn. Mc Graw Hill, New York, p 518
Saxena VK, Ahmed S (2001) Dissolution of fluoride in groundwater:
a water–rock interaction study. Environ Geol 40:1084–1087
Saxena V, Ahmed S (2003) Inferring chemical parameters for the
dissolution offluoride in groundwater. Environ Geology
43(6):731–736
Short HE, McRobert TW, Bernard AS, Mannadinayer AS (1937)
Endemic fluorosis in Madras presidency. Indian J Med Res
25:553–561
Stallard RE, Edmond JM (1983) Geochemistry of Amazon River: the
influence of the geology and weathering environment on the
dissolved load. J Geophys Res 88:9671–9688
Subarayan BG, Viswanathan Gopalan, Siva IS (2012) Prevalence of
fluorosis and identification of fluoride endemic areas in Manur
block of Tirunelveli district, Tamil Nadu, South India. Appl
Water Sci 2:235–243
Subba RN (2003) Groundwater quality: focus on fluoride concentra-
tion in rural parts of Guntur district, Andhra Pradesh, India.
Hydrol Sci J 48:835–847
Subba Rao N, Krishna Rao G, John Devadas D (1998a) Variation of
fluoride in groundwaters of crystalline terrain. J Environ Hydrol
6:1–5
Subba Rao N, Prakasa Rao J, Nagamalleswara Rao B, Niranjan Babu
P, Madhusudhana Reddy P, John Devadas D (1998b) A
preliminary report on fluoride content in groundwaters of Guntur
area, Andhra Pradesh, India. Curr Sci 75:887–888
Susheela AK, Kumar A, Bhatnagar M, Bahadur R (1993) Prevalence
of endemic fluorosis with gastro-intestinal manifestations in
people living in some North-Indian villages. Fluoride 26:97–104
Vikas C, Kushwaha K, Pandit MK (2009) Hydrochemical status of
groundwater in district Ajmer (NW India) with reference to
fluoride distribution. J Geol Soc India 73:773–784
WHO (2011) Guidelines for drinking-water quality, 4th edn, vol 1:
recommendations. World Health Organization, Geneva
Wodeyar BK, Sreenivasan G (1996) Occurrence of fluoride in the
groundwaters and its impact in Peddavankahalla basin, Bellary
district, Karnataka, India—a preliminary study. Curr Sci
70:71–74
2512 Appl Water Sci (2017) 7:2501–2512
123