Embed Size (px)
Citation preview

Southern Illinois University CarbondaleOpenSIUC
Theses Theses and Dissertations
12-1-2010
CONTAMINATION EVENTS ANDLINKAGES IN WORLD RICE MARKETSMana-anya Iemsam-arngSouthern Illinois University Carbondale, [email protected]
Follow this and additional works at: http://opensiuc.lib.siu.edu/theses
This Open Access Thesis is brought to you for free and open access by the Theses and Dissertations at OpenSIUC. It has been accepted for inclusion inTheses by an authorized administrator of OpenSIUC. For more information, please contact [email protected].
Recommended CitationIemsam-arng, Mana-anya, "CONTAMINATION EVENTS AND LINKAGES IN WORLD RICE MARKETS" (2010). Theses. Paper339.
CONTAMINATION EVENTS AND LINKAGES IN WORLD RICE MARKETS
by
Mana-anya Iemsam-arng
Bachelor of Science in Post Harvest Technology, Maejo University, 2007
A Thesis Submitted in Partial Fulfillment
of the Requirements for the
Master of Science Degree
Department of Agribusiness Economics
in the Graduate School
Southern Illinois University at Carbondale
December 2010

THESIS APPROVAL
CONTAMINATION EVENTS AND LINKAGES IN WORLD RICE MARKETS
by
Mana-anya Iemsam-arng
A Thesis Submitted in Partial
Fulfillment of the Requirements
for the Degree of
Master of Science
in the field of Agribusiness Economics
Approved by:
Dr. Dwight Sanders, Chair
Dr. Charles Rendelman
Dr. David Lightfoot
Graduate School
Southern Illinois University Carbondale
November 9, 2010

i
AN ABSTRACT OF THE THESIS OF
Mana-anya Iemsam-arng, for the Master’s degree in Agribusiness Economics, presented
on November 9, 2010, at Southern Illinois University Carbondale.
TITLE: Contamination Events and Linkages in World Rice Markets
MAJOR PROFESSOR: Dr. Dwight Sanders
In August of 2006, genetically modified LibertyLink rice contaminated the
supply of non-GMO rice in the United States, causing damage to the U.S. rice production
sector’s credibility in their export market. The damage to the United States' credibility
included doubt as to whether or not they had the ability to separate GMO and non-GMO
rice strains during planting and/or production. This may have caused a short-term decline
in the price of U.S. rice. The purpose of this paper is to examine rice price relationships
from August 1997 to February 2010 among the four major rice exporting countries
(Thailand, Vietnam, the United States, and India) before and after the genetically
modified rice contamination event. Using unit root tests and cointegration tests, the
results show that international rice export prices are independent from each other, yet the
U.S., Thailand, and Vietnam 5 percent broken DWP rice prices tended to change in the
same direction. The fact that the change in rice prices occurred right after the U.S. GMO
contamination event of August 2006 is statistically significant. However, the results of
this study cannot be proven to indicate that the contamination event’s impact caused this
change in rice export prices.
Keywords: Rice prices, Contamination Events
ii
ACKNOWLEDGMENTS
First of all, I would like to sincerely thank the chairman of my thesis committee,
Dr. Dwight Sanders, for his commitment, encouragement, and helpful guidance
throughout the thesis. This thesis would not have been possible without the patient
assistance and kindness of Dr. Dwight Sanders.
My appreciation goes to Dr. Charles Rendleman as a thesis committee member
for his valuable suggestions and comments. I also gladly express my appreciation for Dr.
David Lightfoot, a member of my thesis committee, for his suggestion and comments on
genetically modified crops and writing technique.
Finally, my thanks to all of the faculty members, staff, and fellow graduate
students in the Department of Agribusiness Economics for making my study interesting
and meaningful.
iii
TABLE OF CONTENTS
CHAPTER PAGE
ABSTRACT ..................................................................................................................... i
ACKNOWLEDGMENTS ............................................................................................. ii
LIST OF TABLES ......................................................................................................... iv
LIST OF FIGURES ........................................................................................................ v
CHAPTERS
CHAPTER 1 – Introduction............................................................................................ 1
CHAPTER 2 – International Rice Trade ...................................................................... 24
CHAPTER 3 – Data and Method.................................................................................. 44
CHAPTER 4 – Result and Discussion .......................................................................... 59
CHAPTER 5 –Conclusion and Recommendation ........................................................ 79
BIBLIOGRAPHY ......................................................................................................... 84
APPENDICIES
Appendix A – Definition of variables ........................................................................... 90
Appendix B – Rice Exporting Rice .............................................................................. 91
VITA ........................................................................................................................... 97

iv
LIST OF TABLES
TABLE PAGE
Table 1.1 Rice Nutrition ................................................................................................. 6
Table 1.2 Cointegration Result of Carter and Smith..................................................... 18
Table 2.1 Leading Rice Producing, Consuming, Exporting
And Importing Countries……………………………………………………..28
Table 2.2 The World Top 10 Exporting and Importing Countries ............................... 29
Table 2.3 The World Top 10 Producing and Consuming Countries ............................ 30
Table 2.4 Major Traders by Type of Rice ..................................................................... 33
Table 4.1 Descriptive Data, August 1997-August 2006 .............................................. 64
Table 4.2 Unit Root Result, August 1997-August 2006 ............................................... 65
Table 4.3 Cointegration Result, August 1997-August 2006 ......................................... 66
Table 4.4 Descriptive Data, August 1997-February 2010 ............................................ 72
Table 4.5 Unit Root Result, August 1997-Febraury 2010 ............................................ 73
Table 4.6 Cointegration Result, August 1997-February 2010 ...................................... 74
Table 4.7 Ordinary Least Square Model, August 1997-Febraury 2010 ..................... 75
Table 4.8 Unit Root Result from Regression Equation ............................................... 76
Table 4.9 Correlation between Prices, August 1997-Febraury 2010 ............................ 77
Table A. Definitions of Variables ................................................................................. 90
Table B. International Rice Exporting Prices ............................................................... 91

v
LIST OF FIGURES
FIGURE PAGE
Figure 2.1 Rice Type and Degree of Milling ................................................................ 31
Figure 3.1 Rice Prices of the U.S., Thailand, Vietnam and India ................................. 46

1
CHAPTER I
INTRODUCTION
This chapter constitutes an overview of rice cultivation along with a general
background of rice and its nutritional qualities. It also demonstrates the effect of the
contamination of rice crops with genetically modified varieties, literature review and a
problem statement, with justifications for the objective of the study.
The Recent Situation
In mid-August 2006, the USDA confirmed the finding of LL601 rice traces in
commercial samples of long-grain rice in Arkansas and Missouri awakening concern for
the contamination of conventional varieties by genetically modified rice (Vogel, 2008).
After the announcement, the European Union affirmed the existence of the traces of
LL601in rice that had been imported from the U.S since January 2006 (Li et al, 2006).
The rice strain LL601 is not commercially approved in the U.S., yet it has found its way
into non-GM crops. Representatives of anti-GM groups questioned how the
contamination happened since rice is a self-pollinating plant. Consequently, U.S. rice
prices fell nearly 10 percent in 2 days (Vogel, 2008). Europe and Japan, two large high-
quality rice markets for the U.S., stopped any further imports of U.S. rice right after the
discovery of LibertyLink rice. The European Union responded to the incident by
searching for ways to prevent future contamination. The discovery of traces of LL601 in
U.S. supplies was said to be a failure of biotechnology companies in containing field
trials and of the government’s inability to control and keep food supplies secure from
unapproved trials (Vermij, 2006). Demont and Devos (2008) suggest potential sources of
2
the contamination of non-GM crops by GM crops including impure seed, cross-
fertilization between neighbor crop trials and the use of the same machines for both GM
and non-GM crops in both pre- and post-harvest operations.
Furthermore, in the same year, the unauthorized Bt63 strain had contaminated
Chinese rice exports both in wholesale rice supplies and in processed food products in
European countries and another commercially unapproved rice strain, Bayer GM’s LL62
variety, also imported from the U.S., was detected in France (Vogel, 2006). The GM rice
contamination has affected many people in the rice production chain: rice producers,
millers, traders, and retailers, around the world. Costs included those of testing recalled
rice along with, import bans, and the distrust of consumers resulting from them. The
consequence of this scandal is likely to have an impact on finances and international trade
agreements (Gurere, Bouet and Mevel, 2007).
Although genetically modified rice is still controversial internationally, China, the
world’s largest rice producer and consumer, is considering allowing the first
authorizations for marketing several GM rice varieties without funding from
biotechnology companies, despite strong opposition in Europe to GM crops and the
imposition of trade restrictions (Wang and Johnson, 2007). Despite these contamination
events, the United Sates still maintains 57.7 million hectares of genetically modified
crops of soy and maize for research and commerce. Although genetically modified crops
are not yet widely acceptable in international trading due to the uncertainty surrounding
them, many countries around the world have adopted the trials including Argentina,
3
Brazil, Canada, India, Paraguay and South Africa, the only African country allowing the
use of GM-crops.
Overview and Background of Rice Cultivation
Most of the world’s population consumes rice, which accounts more than 50
percent of their calories consumed (“Rice is Life”, 2004). It is believed that rice
cultivation began over 6,500 years ago in many countries in India and Indo-China: China,
Thailand, Cambodia, Vietnam and Southern India (Grit, 1984). The most commonly
produced Asian rice types are: Indica, a long-grain irrigated rice of warm tropical zones
with long, thin, flat grains, which accounts for more than 75 percent of the world’s rice
trade at the present day, Japonica, a scented short-grain rice grown in cooler climates
with medium or short grains, Aromatic, a scented long-grain variety, and Glutinous, with
a waxy grain that is very sticky when cooked. Rice was adapted for farming in the
Middle East and Mediterranean Europe in 800 B.C. Rice was brought to the U.S. in the
late 1600’s by a ship from Madagascar, though rice did not become commercially viable
there until irrigation systems were introduced to many states south of the Ohio River and
the east of the Mississippi as well as in Illinois, Virginia, Arkansas, California and Texas
(Childs, 2009).
There are two main rice species that are used currently: Oryza sativa, a common
variety found in most rice-producing countries, and Oryza glaberrima, an annual species
originating in West Africa found mostly in a large region extending from the central
Delta of the Niger River to Senegal (Grist, 1978). The most widely produced of these two
species is O. sativa, an Asian rice species that is now grown on all continents. Rice is a
4
cereal of the grass family, the same family as wheat, rye, oats and barley, but rice has a
wider range of suitable planting temperatures than those crops. Although rice is widely
consumed and produced, the area for farming it is limited due to the availability and
control of water, temperature, wind, light, length of day, and soil type.
Human Nutrition
Almost half of the world’s population relies on rice as a staple food (“Rice is
Life,” 2004). It is more convenient to cook rice than most other staple foods because it
requires less fuel and can be stored for long periods. In addition, rice is inexpensive and
accessible to both rural and urban areas. Rice is a source of carbohydrates, magnesium,
thiamin, niacin, phosphorus, vitamin B6, zinc and copper. A rice grain consists of the hull
(including the awn, lemma and palea) and the caryopsis, which is edible. Rice that
includes the caryopsis, is called brown rice (“The Stabilization,” 1955). Levels of dietary
fiber, minerals and B-vitamins are highest in the bran and lowest in the aleurone layers.
The endosperm is rich in carbohydrates and contains a fair amount of digestible protein,
composed of an amino acid profile, which compares favorably with other grains.
Moreover, rice has high good protein content, comparable to lentil and peanut proteins.
However, the nutrition content of rice varies according to varieties.
Rice Nutrition Table.1 shows that there is no clear indication from studies that
rice with less milling has more nutritive value than polished rice (“Rice is Life,” 2004).
However, certain nutrients will occur at different levels as a result of each method of rice
processing, which will be discussed in Chapter 2. Rice lacks many other important
nutrients such as vitamins C and D, beta-carotene and other micronutrients, which can

5
result in protein-energy malnutrition and deficiencies in vitamin A, iron, calcium and
protein for peoples in the East. The causes of these deficiencies are that the rice grain
itself lacks certain nutrients and that the milling process removes the brown outer layer
(the bran) leaving only the white grain. Although the white grain takes less time to cook
and has a longer storage life, this process removes many important nutrients. The starch
content of rice changes after harvesting. The change in the starch content of paddy results
in a grain of firmer texture than is that of freshly-harvested rice. Not only is the rice grain
rich in many important nutrients, growing rice also improves conditions in the
surrounding environment. Because planting rice requires a wetland ecosystem containing
an enormous number of food sources, this healthy ecosystem also benefits other plants,
insects, amphibians and reptiles existing naturally in the watery field.

6
Table 1.1
Rice Nutrient Database for Standard Reference
Brown White Parboiled
Nutrient Unit ¼ cup raw
(46.25grams)
¼ cup raw
(46.25grams)
¼ cup raw
(46.25grams)
Calories kcal 171 169 172
Protein g 3.64 3.30 3.14
Total Fat g 1.35 0.31 0.26
Carbohydrate g 35.72 36.98 37.80
Fiber g 1.62 0.60 0.79
Mineral
Calcium, Ca mg 10.64 12.95 27.75
Iron, Fe mg 0.68 0.37 0.69
Magnesium,
Mg
mg 66.14 11.56 14.34
Phosphorus, P mg 154.01 53.19 62.90
Potassium, K mg 103.14 53.19 55.50
Sodium, Na mg 3.24 2.31 2.31
Zinc, Zn mg 0.93 0.50 0.44
Copper, Cu mg 0.13 0.10 0.09
Manganese, Mn mg 1.73 0.50 0.39
Vitamins
Vitamin C mg 0.00 0.00 0.00
Thiamin mg 0.19 0.03 0.05
Vitamin B-6 mg 0.24 0.08 0.16
Folate mcg 9.25 3.70 7.86
Vitamin B-12 mcg 0.00 0.00 0.00
Vitamin A mcg 0.00 0.00 0.00
Vitamin E IU 0.33 0.06 0.07 Source: Adjust from The United States Department of Agriculture, Agricultural Research
Service, 2002.

7
Genetically Modified Rice
A concern has grown that much of the world’s population, mostly in Southeast
Asia, are facing malnourishment and vitamin A deficiency. This is combined with the
rapid increase in population which is proportionally greater in developing countries
(Enserink, 2008). In 1999, Potrykus, a German Plant biotechnologist, and his colleagues
introduced “Golden Rice,” a rice variety that contains pro-vitamin A in its seed. This rice
variety has been claimed to be the solution for the malnutrition and vitamin deficiencies
of the world’s poor. However, opponents argue that the real motivation behind the
introduction of Golden Rice is to open the door for the usage of other genetically
modified crops and that consumers’ preference for genetically modified crops has an
unacceptable impact on conventional crops and their prices.
The wide range of rice production and consumption emphasizes its importance in
feeding half of the world’s population (“Rice is life,” 2004). Innovations in
biotechnology research have led to the development of genetically modified crops as a
means of improving various aspects of rice production (Ching, 2004). Research on GM
rice is conducted in order to create trails with the following charactertistics: 1) Herbicide
tolerance. LLRICE06 and LLRICE62, developed by Aventis, contain the herbicide
glufosinate and can now be grown commercially in the U.S., but still lacks both domestic
and international markets to support its production. 2) Insect resistance. Crytoxin genes,
usually Cry1Ab and Cry1Ac genes, from the bacterium Baccillus thuringiensis (Bt) have
been introduced into rice to protect the crop from Lepidopteran pests. 3) Disease
resistance. Researchers use genetic modification to build resistance to diseases caused by

8
bacterium blight, the fungus Pyricularia oryzae and the rice yellow mottle virus. 4)
Tolerance to abiotic stress. Genetically engineered rice has been developed to tolerate
low iron availability in alkaline soil with the insertion of the barley gene Hva1 into rice to
reduced drought damage. 5) Nutritional enhancement. Pro-vitamin A has been inserted
into Golden Rice grains as a cure for vitamin A deficiency, while a ferritin gene from the
bean Phaselus valguris has been used in GM rice to combat iron deficiency anemia. 6)
Production of pharmaceuticals. GE rice is being developed in California to produce the
human milk proteins lactoferrrin, lysozyme and alpha-1-antitrypsin.7) High yields. A rice
variety producing high yields was created during the Green Revolution to increase global
food production.
Because of the importance of rice for the world’s population, the attempt to
alleviate for malnutrition can be seen in many active international programs, companies
and organizations (Brookes and Barfoot, 2003). The Asian Rice Biotechnology Network
(ARBN) supported by the Asian Development Bank (ADB), the German government,
and the Swiss Federal Institute of Technology, which the latest initially developed
Golden Rice, are one of several international rice programs that aim at developing rice
biotechnology, focusing on increasing farmer’s incomes and promoting human nutrition.
Aventis, BASF Plant Science GmbH, Dow AgroScience, Dupont (Pioneer), Monsanto,
Syngenta, Applied Phytologics Inc., Crop Design, Orynova NV, and Paradigm Genetics
are examples of companies that are involved in developing genetically modified crops,
specifically rice for both research and commerce. Aventis is the first company to become
involved in GM rice research, operating since the mid 90s. It has spread its GM rice field

9
trials throughout the United States, South America, Europe and Japan. Pioneer, originally
known as Dupont, began research on genetically modified rice in India. Its main purposes
for GM rice research were improved yield, food quality and disease resistance. Pioneer’s
rice research is now conducted as a model for further GM corn studies. The International
Rice Research Institute (IRRI) is an agricultural non-profit organization that concentrates
on rice research for low-income and developing countries. GM rice research is one of the
company’s research specializations.
Despite the positive outlook for genetically engineered rice, it is still not widely
accepted by consumers due to its unknown impact on human health, socio-economic
factors, and the environment (“Rice is Life,” 2004). The health concerns are that
genetically engineering rice through the random insertion of DNA sequences into the
plant genome, which may disrupt or silence genes, activate silent genes or modify gene
expression, may have unintended effects. Studies by independent researchers show
differences in the behavior of animals fed with GM and non-GM crops, though the results
are not the same as those from studies conducted by biotech industries.
Rice is more than a diet crop for many people, found to be bonded with the
culture, religions, and social characteristics of many societies (“Rice is Life,” 2004).
Rice-growing communities often have elaborate festivals- during their planting and
harvest seasons. In Thailand, the Royal Ploughing Ceremony signals the beginning of the
rice-planting season. There is a festival in southern India in which newly harvested rice is
offered to cows, and in Korea, rice farmers will keep rice is a small jar and worship it as a
household god. Moreover, rice is an important source of employment and income in

10
many developing regions of the world. Thus, contamination by GM rice could potentially
have an impact on farmers’ income and welfare, rural employment ethics and ideas about
agriculture, and technology. Furthermore, the adoption of genetically modified rice might
jeopardize people’s right to choose non-GM rice and affect export markets. GM rice that
has been planted in the same field as non-GM rice could cause cross-pollination leading
to the spread of genetically modified rice. In addition, there are issues surrounding
intellectual property rights (IPRs) involving genetically modified rice. To be precise,
owners of GMO rice would control rice seeds, so that farmers could no longer save,
replant, or sell the seeds of GMO rice. The potential socio-economic issues arising from
the adoption of genetically modified rice include the inequitable distribution of benefits,
land concentration and labor displacement (Annou, Thomsen and Wailes, 2001). Many
developed countries such as Japan, South Korea, some European countries and Russia,
have put restrictions on genetically modified crops.
A study conducted by Gruere et al (2007) indicates that the fear of losing export
markets is the main reason that many developing countries have not yet approved the use
of genetic modification technology. India and China have developed GM cotton, which
generates benefits for their farmers. GM cotton has been partly regularized for large-scale
production in India, yet because cotton is not used for food; there is no need for GM
cotton to be tested for food safety, or to be labeled or traced. In fact, Gruere et al claim
that due to misinformation and a lack of knowledge about international trade systems,
countries adopting GM technologies have not lost export shares for certain commodities.
Although it is believed marketing GM and non-GM crops separately is infeasible and

11
costly, countries producing large GM crops such as the U.S., Argentina, Canada and
South Africa produce and separate conventional non-GM crops for both domestic and
international markets.
Problem Statement
Since rice is a staple food for many people from many cultures, societies, and
economics regions, protectionist attempts to reach national self-sufficiency are of
particular interest to governments (David and Huang, 1996). Although the production and
consumption of corn and soy dominate a great share of U.S. agricultural commodities, an
increase in its domestic population tending to cultural diversity owing to second and/or
third generation immigrants combined with the emergence of new market niches in the
Middle East has caused rice to gain its part in the United States’ production and trading
(Childs, 2009). Because growing rice involves high costs in production, irrigation,
fertilizer and labor, and because rice paddy needs particular physical requirements for
planting, there is a demand for researchers and scientists to create new rice strains.
Genetically modified rice has been developed in order for the U.S. to be more
competitive with Asian rice producing countries in the international rice trade. Due to
strong opposition from the European Union and Japan, two of the biggest rice markets,
many rice-producing countries retain GM-free practices in order to remain in these
markets.
Li et al (2010) conducted a recent study on genetically modified rice
contamination focusing on its impact on rice prices in the U.S. and Thailand. However,
global rice markets trade rice of various milling degrees and types from other major rice

12
exporters. Thus, this study examines the effects of LL601 contamination on four major
rice-exporting countries: India, Vietnam, Thailand and the U.S. The rice from these
countries in term of its quality is substitutable, and changes in rice policy and levels of
rice stocks in each country potentially have an impact upon the world’s rice prices.
Regarding genetically modified crops, the U.S. is an open country that has adopted GM
crops since the mid-1990s. The existing research on world rice prices is quite limited due
to the fact that the rice trade is a segment market. There has not been much research on
the dynamics of rice prices in the world market. The study of rice price dynamics is
important as it comes at a time when U.S. producers both of non-GM and of GM rice are
looking for ways to have some understanding over the prices they receive in the domestic
market. Vinuya (2006) indicates that a cointegrated market will need to achieve
equilibrium in the long-run necessitating an adjustment of prices. Those adjustments may
come as suppliers adjust their behavior to maximize profit and from the demand side in a
movement away from more expensive suppliers.
Specific Objectives of the Research
The main purpose of this study is to understand the long-and short-run
equilibrium of rice prices in the export markets of India, Thailand, Vietnam and the
United States individually and in pairs. More specifically, the purposes of the study are as
follows:
a. To analyze the long-run rice price relationship among the four major rice exporters
before and after the occurrence of genetically modified rice contamination.

13
b. To analyze the short-run relationship among rice markets due to the effects of
contamination.
c. To explain the impact of contamination using both statistical modeling and policy
analysis.
For the purpose of analyzing long-run equilibrium of agricultural commodities
in the world market, three approaches are commonly used by researchers. These include:
(a) stationary trend, (b) long-run equilibrium cointegration, and (c) error correction
models for short run equilibrium. This study will analyzes these three approaches.
LITERATURE REVIEW
Although there has been much economic research on rice, most of it has studied
competition and market structure. Recently, the effects of genetically modified crop
contamination has gained some attention from researchers examining its effect on
particular aspects including consumers’ acceptance of GM food , the effect of adopting
GM rice on producers’ benefits, the impact on prices of non-Gm and GM crops, and how
trade agreements and regulations change due to both the contamination and the adoption
of GM crops.
Carter and Smith (2003) study the effect of StarLink contamination on U.S. corn
prices. The shock of this contamination appeared to hurt U.S. corn markets domestically
and internationally because of the domination of corn production in the U.S. economy,
mostly in the corn-belt region. As with many other crops, corn biogenetic technology
research has attempted to improve corn production with a greater benefit to producers.
Although one-third of U.S domestic corn production is biogenetic, StarLink corn was not
14
approved for human consumption by the U.S. government because it contains Cry9C, a
protein that might be allergenic in humans. With a split license approval, it is acceptable
for animal feed. However, StarLink corn was first discovered in processed human food
within the U.S. in September 2000. Starlink contamination was also discovered in Japan,
and then in South Korean and Canadian corn supplies. The effect of the contamination
was reflected in declining corn future prices.
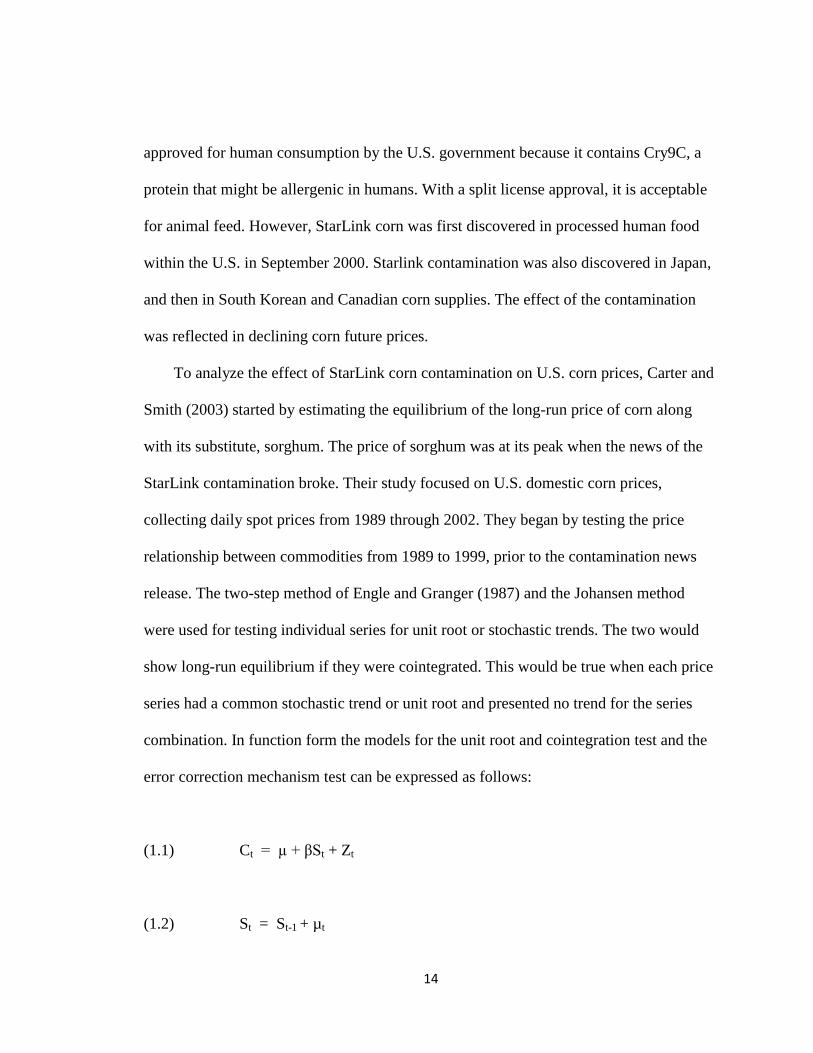
To analyze the effect of StarLink corn contamination on U.S. corn prices, Carter and
Smith (2003) started by estimating the equilibrium of the long-run price of corn along
with its substitute, sorghum. The price of sorghum was at its peak when the news of the
StarLink contamination broke. Their study focused on U.S. domestic corn prices,
collecting daily spot prices from 1989 through 2002. They began by testing the price
relationship between commodities from 1989 to 1999, prior to the contamination news
release. The two-step method of Engle and Granger (1987) and the Johansen method
were used for testing individual series for unit root or stochastic trends. The two would
show long-run equilibrium if they were cointegrated. This would be true when each price
series had a common stochastic trend or unit root and presented no trend for the series
combination. In function form the models for the unit root and cointegration test and the
error correction mechanism test can be expressed as follows:
(1.1) Ct = µ + βSt + Zt
(1.2) St = St-1 + µt

15
where:
Ct = log price of corn
St = log price of sorghum
Zt = stationary error term
µt = stationary error term
(1.3 a) ΔCt = α Zt-1 + γc (L) ΔCt-1 + δc (L) Δ St-1 + εct
(1.3 b) ΔSt = α Zt-1 + γS (L) ΔCt-1 + δS (L) Δ St-1 + εst
where:
γc(L), δc (L), γS(L) and δS (L) are polynomials in the lag operator
The results of the study by Carter and Smith (2003) are summarized in Table 1.2. As
shown in the tables, cointegration results from Augmented Dickey-Fuller Tests and the
Johansen Test are similar. Corn and sorghum prices significantly present a unit root trend
as in individual series and the prices and corn and sorghum are cointegrated at a level of
0.05. These indicate that there was a stable long-run relationship between corn and
sorghum prices from 1989-1999.
They then incoperated the StarLink contamination period into a model and tested for
a stable cointegration of the two prices by using Hansen (1991) and Bai and Perron
(1998). The Hansen test is a sup F-test, used for a single structural break in cointegration.
16
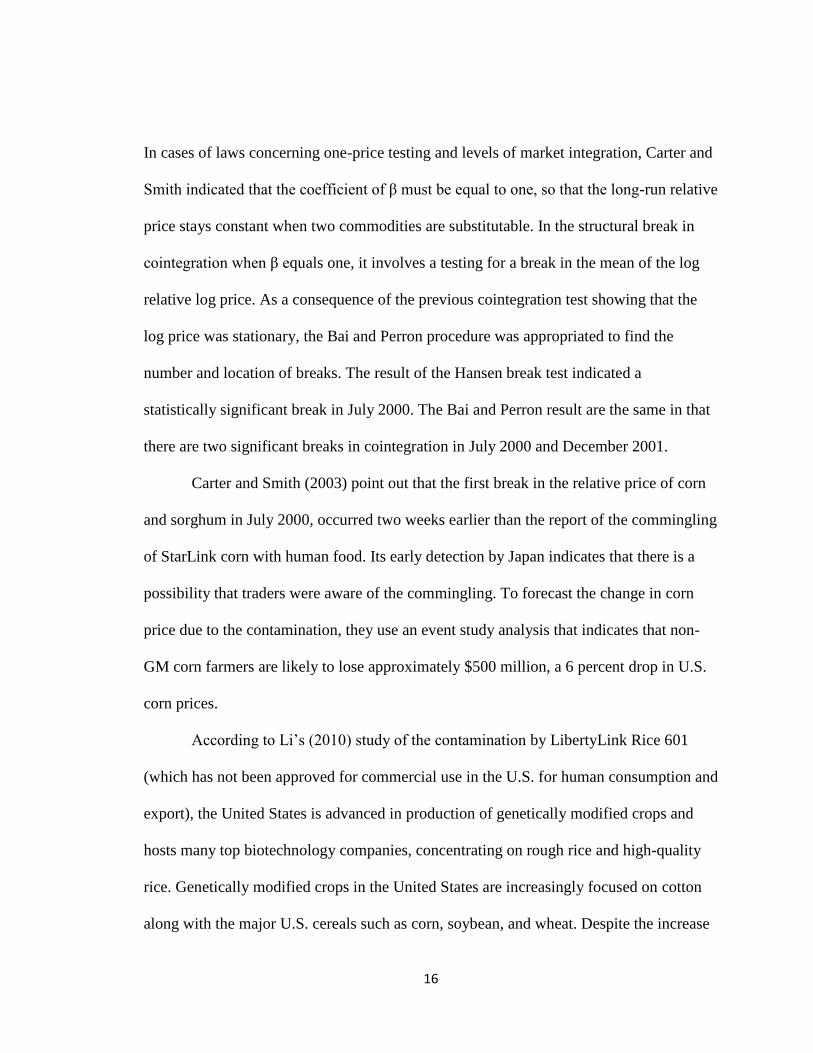
In cases of laws concerning one-price testing and levels of market integration, Carter and
Smith indicated that the coefficient of β must be equal to one, so that the long-run relative
price stays constant when two commodities are substitutable. In the structural break in
cointegration when β equals one, it involves a testing for a break in the mean of the log
relative log price. As a consequence of the previous cointegration test showing that the
log price was stationary, the Bai and Perron procedure was appropriated to find the
number and location of breaks. The result of the Hansen break test indicated a
statistically significant break in July 2000. The Bai and Perron result are the same in that
there are two significant breaks in cointegration in July 2000 and December 2001.
Carter and Smith (2003) point out that the first break in the relative price of corn
and sorghum in July 2000, occurred two weeks earlier than the report of the commingling
of StarLink corn with human food. Its early detection by Japan indicates that there is a
possibility that traders were aware of the commingling. To forecast the change in corn
price due to the contamination, they use an event study analysis that indicates that non-
GM corn farmers are likely to lose approximately $500 million, a 6 percent drop in U.S.
corn prices.
According to Li’s (2010) study of the contamination by LibertyLink Rice 601
(which has not been approved for commercial use in the U.S. for human consumption and
export), the United States is advanced in production of genetically modified crops and
hosts many top biotechnology companies, concentrating on rough rice and high-quality
rice. Genetically modified crops in the United States are increasingly focused on cotton
along with the major U.S. cereals such as corn, soybean, and wheat. Despite the increase

17
in research and attention on GM commodities in the U.S., Europe and some Asian
countries such as Japan and South Korea, have strict regulations on importing genetically
modified crops due to their potentially negative effects on human health.
Li et al (2010) state that after the USDA’s announcement of GM contamination in
August 2006, there was an impact on domestic traders and farmers and on international
trade and regulations. From 2008, Europe stopped purchasing U.S. rice exports that were
not certified as free of GM. Japan also banned imports of any long grain rice from the
U.S. These reactions to the contamination resulted in the decline of long-grain rice
futures.
To estimate long-run stable relationships between two commodities, the
commodities have to be substitutable either in their consumption or in production, so that
Thai rice, which is a main competitor for U.S. long-grain rice in international markets, is
considered to be a substitute in its production. Li et al conduct a study of contamination
of unapproved rice to estimate its impact on U.S. rice prices. Time series techniques are
used to test contamination events. First, Li al et conduct the study by determining the
existence of a unit root for the pre-event of the contamination with logarithms of U.S.
rice prices and Thailand 100% grade B using the Augmented Dickey-Fuller (ADF)
approach. The unit root will serve as an indicator to determine long-run cointegration
relationship for the data. If the data series is found to be cointegrated, the next step is to
forecast prices. An error correction model (ECM) is useful for this purpose. The formula
for this model can be expressed as follows:

18
Table 1.2
Cointegration Tests
Test
Statistic
5% Critical
Value Conclusion
Augmented Dickey-Fuller Tests
Corn -1.72 -2.86 Unit Root
Sorghum -1.93 -2.86 Unit Root
Log Difference -4.33 -2.86 Cointegration
OLS Residual -5.13 -4.71 Cointegration
Johansen Tests
Trace: r=0 51.58 19.96
Cointegration Trace: r=1 5.36 9.24
Source: Adjusted from Carter and Smith (2003)

19
(1.3a) ΔPtUS
= λ + ρµt-1 +
+ γ
+ Vt
(1.3b) ΔPtThai
= λ + ρµt-1 +
+ γ
+ Vt
where :
P = logged price
Δ= difference operator
µt-1 = error correction term
k and l = number of lags
Vt = a stationary, white noise; a residual term
Because there is a unit root between U.S. and Thai rice prices, the cointegration test
is processed to find whether a stable long-run relationship between the two price series
exists. From that, the two rice price series are cointegrated. The last procedure is to
estimate the ECM, which uses the residual from the equilibrium regression of the
cointegrated variables. The results from the event study window shows that U.S. rice
prices decreased significantly (by 7.36 percent of the price forecast) after the USDA’s
announcement, but the response was short-lived. The price recovered by September of
the same year. There was a slight decrease in Thai rice prices due to the harvest cycle, but
there is no evidence of an impact from GM contamination on Thai rice prices.
Another study involving a unit root test and cointegration approach is conducted by
Gordon and Hannessson (1996). Gordon and Hannessson examine frozen and fresh cod
fish in three European importers of cod (France, Germany and United Kingdom) and the

20
U.S. They state that if the cod market is well integrated in the international market, prices
change in Europe and the U.S. market should move according to the same pattern. The
purpose of the study is to inquire into the long-run and short-run relationships of import
frozen and fresh cod, separately, in France, Germany, the United Kingdom and the
United States from January 1980 to December 1992. The study looks into both statistical
results and policy analysis to explain the outcome. Frozen cod fillets and fresh cod are
imported from Canada, Ireland and Norway. The monthly cod import data for the U.S. is
collected by the U.S. Department of Commerce, showing quantity and value in U.S.
dollars. The data is then converted into ECUs and the other three European countries data
are collected monthly by Eurostat, presenting quantity and value in ECUs. Over time,
there is a fluctuation in the quantity and import value in all four countries.
The study by Gordon and Hannessson uses the same theory and framework as the
previous two studies, first testing for long-run stability in each price series and then
determining cointegration relationship use the Engle and Granger method. After this, the
more complicated procedure of Johansen and Joselius is used for testing more than one
cointegrating vector. The formula for the model can be expressed as:
(1.4a) αγ γ γ ε
where is the difference operator and T is the time trend. The null hypothesis is that the
series is non-stationary. With the result that the hypothesis cannot be rejected, it refers to
each price series as ~I(1) and continues with the cointegration testing. The result from the

21
cointegration test indicates that there is no evidence for a long-run relationship among
fresh cod in Europe and the U.S. In the other words, the U.S. fresh cod market is
separate from the three European countries’ fresh cod markets. In the frozen market,
there is one weak cointegation derived from the Engle and Granger procedure. The
Johansen procedure is applied to test for cointegration in both frozen and fresh cod for a
comparison. The results from both procedures indicate that there is no evidence of a long-
run relationship among the U.S. and the three European countries in fresh cod. However,
there is a weak cointegation among them in the frozen market.
Next, the study looks for short-run movement using the error correction model for
frozen cod in those four countries and for the fresh cod markets in the European
countries. The equation for the error correction model can be expressed as:
(1.4b)
Where y and the vector X represent the different fish price and is the lagged value of
the estimated error term and is a random error term. The result for the error correction
model shows that both fresh and frozen cod markets in the U.S. have no short-run
relationship with the three European markets, while France dominates European cod
prices over Germany and the UK.
Approaches to Long-Run Equilibrium
22
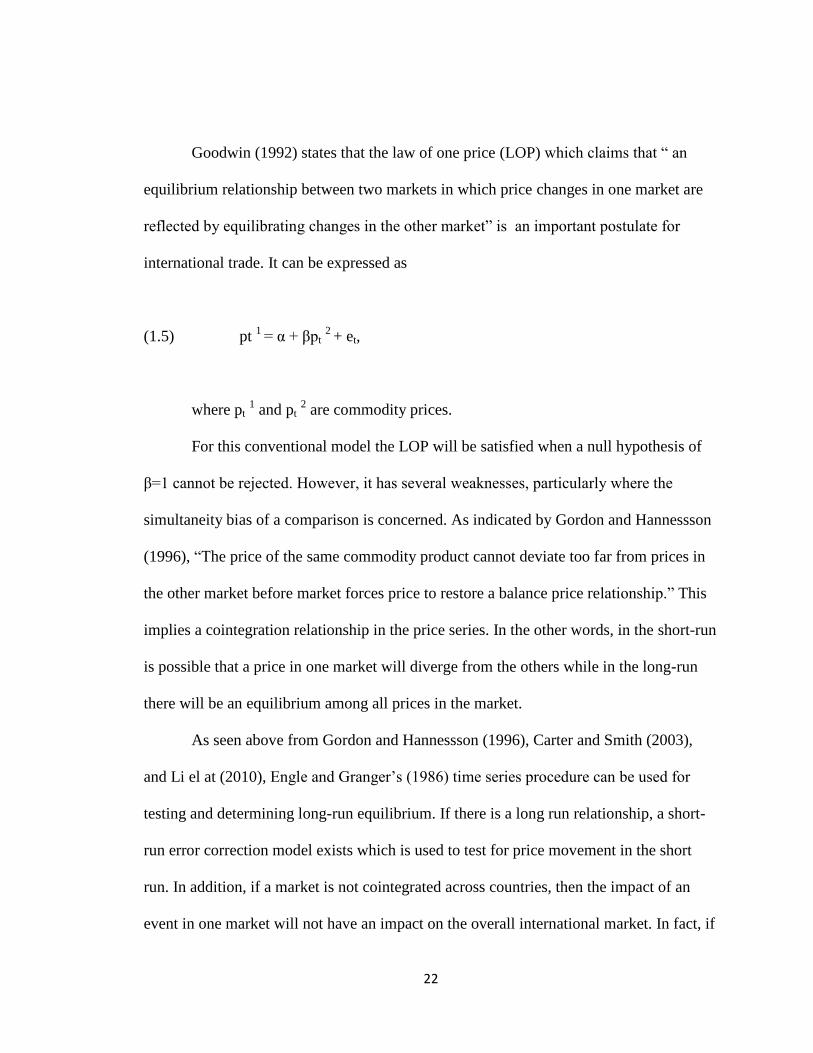
Goodwin (1992) states that the law of one price (LOP) which claims that “ an
equilibrium relationship between two markets in which price changes in one market are
reflected by equilibrating changes in the other market” is an important postulate for
international trade. It can be expressed as
(1.5) pt 1
= α + βpt 2 + et,
where pt 1 and pt
2 are commodity prices.
For this conventional model the LOP will be satisfied when a null hypothesis of
β=1 cannot be rejected. However, it has several weaknesses, particularly where the
simultaneity bias of a comparison is concerned. As indicated by Gordon and Hannessson
(1996), “The price of the same commodity product cannot deviate too far from prices in
the other market before market forces price to restore a balance price relationship.” This
implies a cointegration relationship in the price series. In the other words, in the short-run
is possible that a price in one market will diverge from the others while in the long-run
there will be an equilibrium among all prices in the market.
As seen above from Gordon and Hannessson (1996), Carter and Smith (2003),
and Li el at (2010), Engle and Granger’s (1986) time series procedure can be used for
testing and determining long-run equilibrium. If there is a long run relationship, a short-
run error correction model exists which is used to test for price movement in the short
run. In addition, if a market is not cointegrated across countries, then the impact of an
event in one market will not have an impact on the overall international market. In fact, if

23
international markets are linked, a price shock in one country will lead to a short-run
effect on the international market, but will clear out in the long-run.

24
CHAPTER 2
INTERNATIONAL TRADE
This chapter documents international rice production, consumption,
quality, rice types, global trade, and the effect of policies on genetically modified rice on
major rice exporting countries, along with tariff aspects. The focus will be on the
importance of rice production and domestic and international policies in four major rice-
exporting countries: Thailand, Vietnam, the United States and India.
The global rice market pattern is small and thin with about 7 percent of world
trade due to the residual character of exchanges (producing countries preserve rice grains
for their own consumption first) (“The Stabilization”, 1955). The volume of trade is
estimated to be between 25 and 27 million tons per year. Rice has retained an important
role in Asia both economically and politically although several commodities including
cotton, corn, coffee, rubber, and wheat are much more important than rice in international
trade (David and Huang, 1996). Rice production is practices worldwide; yet, Asian
countries are the dominant suppliers for the international market. Mediterranean Europe
and the United States also play an important role in global trade owing to the
development of new food trends in developed countries and new market niches in
developing countries (Childs, 2009). Long-time rice exporters Thailand and India are
close competitors for part of the U.S. rice market due to improvements in quality and
grading systems. The top export markets for the U.S. are Mexico and Central America
along with Canada and the European Union. Rice in international markets is traded across

25
frontiers either (a) by a government as in Japan and Myanmar or (b) by private traders
subject to very detailed government permits as in Thailand and Italy or (c) by private
traders subject at most to very general controls as in the Netherlands and the U.K. (“The
Stabilization”, 1955).
Rice Global Production and Global Consumption
In most of Asia, rice is grown on small farms, primarily to meet basic needs. Rice
production is more concentrated in the monsoon regions (Hareau et al, 2002). Table 2.1
lists the top 10 countries in milled rice production, consumption, exporting and
importing. China is the leader in rice production and consumption, but with its high
domestic consumption and continuously increasing population most of China’s rice is
preserved for domestic use. The same situation applies to most of the rice producing
countries. The Philippines is one of the countries in which rice production has been
increasing over the years, from 9,775 metric tons in 2003 to 108,000 in September 2010
(Table 2.3). However, the government is still required to import rice for consumption.
This is due more to the proportional increase in its population than to its rice production
or the geography of the country.
Rice consumption in Asia has tended to increase over time due to the rise in
population and an increase in per capita rice disappearance in non-Asian nations mostly
in the West and the Middle East (Hareau et al, 2002). This has created a new market for
many rice-producing and exporting countries. High-income countries in Asia show a
slight slowdown in rice consumption due to the fact that a higher income leads to diet
diversification. India has slowed its rice exporting in the previous year (Table 2.2) which

26
is a result of security food notion because of the significant increase in its population and
domestic consumption. The international rice trade has been stable for the past 2-3 years
after a 90 percent increase in trade volume caused by an increase in rice production and
yield (Brookes and Barfoot, 2003). For example, rice production in Thailand and China
has increased from 18,250 and 127,200 metric tons respectively in 2006 to 20,400 and
136,000 metric tons in 2011(September). Rice production has increased over time due to
better technology and production systems resulting in an increase in the number of rice-
exporting countries (Table 2.3).
Quality and Types
As indicated in the first chapter, rice is widely consumed and produced around the
globe. Global trade prices for rice are classified mainly according to quality and type
(Kang, Kennedy and Hilbun, 2009). The International Rice Research Institute (IRRI) has
collected more than 83,000 varieties of rice genes for research, in which there are
differences in morphology, productivity, and resistance to and tolerance of biotic and
non-biotic factors (Jayne, 1993). Currently, four main rice varieties are commonly used:
Indica, Japonica, Aromatic and Glutinous.
The rice trade consists almost entirely of grain that has undergone some milling in
contrast to other cereals (“The Stabilization”, 1955). The different degrees of rice milling
are a response to consumers’ preferences with thousands of rice strains being produced.
This indicates that rice is not completely homogenous. One could classify rice according
to its grading, type, parboiling process, and milling process (“Rice Industry is in Crisis”,
2007). Thailand, the United States, and India dominate the premium high-quality rice

27
market. High-quality rice containing less than 10 percent broken grains is preferred
mostly in the developed countries and the Middle East. The market for medium-quality
rice containing 15 to 20 percent broken grains and low-quality rice containing 25 to 35
up to 100 percent broken grains are dominated by Thailand, India and Vietnam along
with other developing countries in Asia, Africa and Latin America.
In addition, rice is traded internationally in many different forms depending on its
final usage and the preferences of its consumers (Jayne, 1993). The most common types
of rice in terms of modes of processing traded in the current market are brown, white, and
red rice. The latest one is considered a non-tradable variety. Rough rice or paddy rice is
rice as it is found in the field with its kernels encased in an inedible, protective hull.
Brown rice is the least processed form of threshed rice, as the kernels have had only the
hull removed. Its light brown color is due to the presence of bran layers, which are rich in
minerals and vitamins, especially the B-complex group. With a natural aroma and flavor
similar to that of roasted nuts or popcorn, it is chewier and slightly more nutritious than
white rice, but takes longer to cook. Brown rice may be eaten as is or milled into white
rice. Rice that the outer layer (the husk and bran) has been removed is called white rice.
Though it is believed to have less nutritional value than brown rice, in some countries it
can be enriched to recover its original nutritional value. Many importing countries prefer
this form of rice because it is cheaper to ship along with the fact that the value of the husk
is low compared to the cost of milling.

28
Table 2.1
Leading Rice Producing, Consuming, Exporting and Importing Countries
Rank Producing Consuming Exporting Importing
1 China China Thailand The Philippines
2 India India United States Nigeria
3 Indonesia Indonesia Vietnam EU-27
4 Bangladesh Bangladesh Pakistan Saudi Arabia
5 Thailand Vietnam India Iran
6 Myanmar The Philippines China Iraq
7 The Philippines Myanmar Cambodia Malaysia
8 Brazil Thailand Myanmar Cote d'Ivoire
9 United States Brazil Argentina South Africa
10 Japan Japan Brazil Senegal
Source: Brookes and Barfoot (2003)
UNCTAD Secretariat of the Food and Agriculture Organization of the United
Nations (FAO) data, USDA&PSD Online

29
Table 2.2
The World’s Top 10 Rice Exporting and Importing Countries,
2006/07(Aug)-2010/11(Sep)
Exports 2006/07 2007/08 2008/09 2009/10 2010/11Aug 2010/11Sep
Thailand 9557 10011 8570 9000 10000 10000
United States 3003 3219 2983 3525 3475 3550
Vietnam 4522 4649 5950 6200 5800 5800
Pakistan 2696 3050 3187 3800 3600 2850
India 6301 3383 2123 2200 2500 2500
China 1340 969 783 850 900 900
Cambodia 450 500 800 850 850 850
Myanmar 31 541 1052 300 700 700
Argentina 436 408 594 550 600 600
Brazil 201 511 591 325 500 500
Imports 2006/07 2007/08 2008/09 2009/10 2010/11Aug 2010/11Sep
The Philippines 1900 2500 2000 2600 2500 2500
Nigeria 1550 1800 2000 1700 1900 1900
EU-27 1342 1520 1383 1350 1350 1350
Saudi Arabia 961 1166 1095 1100 1300 1300
Iran 1500 1550 1470 1150 1500 1200
Iraq 613 975 1089 1100 1150 1150
Malaysia 799 1039 1070 1020 1020 1020
Cote d'Ivoire 980 800 800 860 900 900
South Africa 960 650 745 800 850 850
Senegal 700 860 715 700 700 700
United States12
695 651 682 650 665 665
Source: Brookes and Barfoot (2003)
USDA, PSD
Note: Units are in thousands of metric tons.

30
Table 2.3
The World’s Top 10 Rice Producing and Consuming Countries,
2006/07(Aug)-2010/11(Sep)
Milled Production 2006/07 2007/08 2008/09 2009/10 2010/11Aug 2010/11Sep
China 127200 130224 134330 137000 137500 136,000
India 93350 96690 99180 89130 99000 99,000
Indonesia 35300 37000 38300 37100 40000 38,000
Bangladesh 29000 28800 31000 31000 32300 32,300
Thailand 18250 19800 19850 20260 20600 20,400
Burma 10600 10730 10150 10597 11000 11,000
The Philippines 9775 10479 10755 9772 10800 10,800
Brazil 7695 8199 8570 7641 8400 8,400
United States 6088 6149 6400 6917 7680 7,975
Japan 7786 7930 8029 7711 7850 7,850
Consumption 2006/07 2007/08 2008/09 2009/10 2010/11Aug 2010/11Sep
China 127200 127450 133000 134500 135500 135,000
India 86700 90466 91090 85430 98000 98,000
Indonesia 35900 36350 37090 37600 39500 38,150
Bangladesh 29764 30747 31000 31600 32700 32,700
Vietnam 18775 19400 19000 19150 19500 19,500
The Philippines 12000 13499 13650 13640 13700 13,700
Burma 10670 10249 9648 10000 10100 10,100
Thailand 9780 9600 9500 9700 9800 9,900
Brazil 7925 8254 8530 8550 8600 8,600
Japan 8250 8177 8326 8200 8125 8,125
United States13
3959 3919 3964 3861 4047 3,985
Source: Brookes and Barfoot (2003)
USDA, PSD
Note: Units are in thousands of metric tons.

31
Figure 2.1
Rice Types and Degrees of Milling for International Trade
Paddy
Milling
Processes
Rough
Parboiled
Brown
White/Polished
Quality
High
Medium
Low
Broken
Varieties
Indica
(Long grain)
Japonica
(Short grain)Aromatic
Jasmine
Basmati
Glutinous

32
Differences among types of rice and methods of processing strongly reflects
consumer preferences for certain types and forms, so that one can say rice is not a
homogenous commodity like corn and wheat, the other staple grains (“The Stabilization,”
1955). Rice also differs from other grains in international trade in its processing after
threshing. Typically, rice will undergo a milling process after threshing before being
exported while the threshing process is sufficient for other grains. One of these post-
threshing processes is parboiling. It is believed that this practice began in Southeast Asia
or in tropical Africa. Parboiling involves the soaking, pressure steaming and drying of
rice. It is then milled to remove the outer hull. This procedure gelatinize the starch in the
grain, hardening it, which results in less breakage and ensures a firmer, more separate
grain (Gariboldi, 1984).

33
Table 2.4
Major Traders by Types of Rice
TYPE QUALITY MAJOR EXPORTERS MAJOR IMPORTERS
Indica, Milled broken Thailand, Myanmar Senegal, Madagascar,
Vietnam, The Gambia
low Thailand, Pakistan,
China, Myanmar
Indonesia, most of West
Africa
medium United States, Thailand,
Pakistan
Brazil, Hong Kong,
Indonesia, USSR
high United States, Thailand Western Europe, Iran, Irag,
Malaysia
Indica, Parboiled
Milled
low Myanmar, Thailand Bangladesh, Sri Lanka
high United States, Thailand Nigeria, Saudi Arabia,
Western Europe
Japonica -- Japan, China, Australia Indonesia, South Korea
Brown parboiled -- West Europe, South Africa
Source: Jayne (1993)

34
Distortion of Rice Prices and Future Markets
Table 2.4 illustrates the preferences of major trade countries for various types of
rice. The demand for high-quality milled rice comes mostly from Europe, Iran, Iraq and
Saudi Arabia while low-quality types are concentrated in poorer countries (Jayne, 1993).
The rice trade is unique because there are distinct differences between various types of
rice. Surpluses and shortages of varieties of rice can occur according to the distinct
preferences of rice consumers. In other words, prices of Indica and Japonica rice may
move independently. Currently, Indica is the dominant rice variety being traded
internationally.
The main factors determining the price of rice are supply and demand. The
amount of paddy entering the milling process, the amount of milled rice sold and the
amount being held in stock are the primary determinants for local markets (Jayne, 1993).
The greater the volume of rice that is milled, the more its price will drop. This can be
observed during the harvest season. In Thailand’s harvest season in mid-December the
price will drop due to the greater supply, when 80 to 90 percent of all rice produced goes
to a mill. Another factor affecting rice prices is the report produced by the United States
Department of Agriculture (USDA). The USDA applies a satellites system called the
Geographical Information System (GIS) to monitor how much rice is being grown
anywhere in the world along with data on weather, pests and diseases that will affect rice
crops. Although this information does not seem to benefit local rice growers, it is used to
determine rice prices after milling.

35
Pricing rice is difficult because, as a crop rice is extremely susceptible to poor
weather conditions and is dependent upon the weather patterns of the countries in which
it is grown (Jayne, 1993). Another difficulty in setting rice prices lies in the fact that there
is no widespread use of future markets in rice. Although rice stock is being traded, it has
a small role in determining worldwide rice prices without a future market. There is no
universal standardized grading in the rice trade, nor is there any “reliable internationally
accepted spot or futures prices can be quotes for each type or quality of rice” (Jayne,
1993). In general, the majority of agricultural commodities are subjected to a commodity
market. Most commodities are traded through future contracts. In order for a commodity
to be considered tradable in a future market, it must meet the following requirements: 1).
It must be standardized for agricultural and industrial commodities. Rice obviously fails
to meet this requirement. 2). Perishable commodities must have an adequate shelf life,
due to the fact that delivery on future contracts will be delayed. This is a requirement that
is met by rice. 3). Cash commodities’ prices must fluctuate enough to create uncertainty.
Again, rice meets this requirement. In addition, the rice market has failed to establish a
forum in which sellers and buyers can interact at a low cost and it lacks reliable trade
information about the market, allowing rice brokers. This means that the lack of
information allows brokers to earn more (Roggemann, 2005).
International Trade and Rice Policies
International Rice’s Economic Structure
The future of the rice international rice trade depends on the exporting sector
(Ryan, 2006).With improvements in production technology, rice yields have become

36
more predictable and stable over time. The international rice trade is highly centralized in
four major rice-exporting countries: Thailand, Vietnam, the United States and India
(Kang, Kennedy and Hilbun, 2009). However, without an external demand for an
increased production, a domestic rice price would eventually decrease resulting in low
net returns and less incentives for farmers. To solve this problem, rice-producing
countries tried to form an incorporated cartel modeled upon the OPEC oil cartel in order
to control both domestic and international rice prices and quantity (Dawe, 2002). Unlike
oil, rice production is aggregated among many individual rice producers and relies
heavily on weather (Hettel, 2006). It is difficult or impossible to control production and
determine a surplus. Secondly, rice is a perishable commodity which can be stored for a
limited time. This can be costly for sellers. Thirdly, differences in trade purposes and
interests among rice producers constitute another difference between a rice cartel and the
OPEC group.
The rice market has stayed more efficiently stable in its production due to new
technologies such as better irrigation systems (Dawe, 2002). Three periods present a
change in international rice prices: 1950-1964, 1965-1981, and 1985-1998. During the
first period, prior to the Green Revolution, world rice prices were high and stable. During
the Green Revolution between 1965 and 1981, world rice prices were unstable due to the
world food crisis in 1973-1975 that led to changes in many Asian countries’ policies. The
price instabilities were due in part to the adoption of new fertilizers in many countries.
World rice prices went back to once again stable and low in the post-Green Revolution
phase, 1985-1998. At present, many more rice-exporting countries rely on the global
37
market, creating government revenue for their nations. This results in more stable rice
prices. Furthermore, as compared to previous decades, the volume of rice trade is
increasing caused by an expansion of trade coming from Latin America since their
markets were opened to imports in the late 1980s.
Trade Liberalization and International Rice Policy
Wiles (2003) opposes the conclusion made by Jayne (1993) that the international
instability of the international price of rice is more the result of rice’s thin and relatively
small trade character than the impact of domestic stabilization policies. He points out
several factors that contribute to the volatility of rice prices such as domestic stabilization
policies, geography of rice production areas, inelasticity in consumer’s preferences and
production methods, a thin and fragmented market, and low world stockholdings. As
stated above most rice-producing countries trade their rice internationally using the
residual from domestic consumptions. This is linked to the concept of food security and
trade liberalization. Hettel (2006) explains that trade liberalization means that the
domestic price of a commodity is that same as its price outside the country. Food security
is defined as having supplies sufficient for both domestic and global levels, an amount
that will promote the well-being of consumers (“Trade Reform and Food Security”,
2003). Free trade liberalization is believed to be a tool to support poor countries by
promoting a country’s comparative advantages.
In theory, the price of rice should be determined by integration between supply
and demand; however, in most rice-growing countries, the price is controlled by an unfair
allocation resulting in a violation of the law of supply and demand. Rice prices are
38
distorted by subsidies, tariff, and food aid program (Roggemann, 2005). The low percent
of rice that is traded is the result of self-sufficiency policies, particularly in Asian. These
protectionist policies aim to support domestic producers, stabilize domestic rice prices
and maintain food security. Government policies in both rice-producing and consuming
countries play an important role in controlling the level of rice production, which
eventually has an impact on world rice prices. Whether or not a country gains from trade
liberalization depends on how well it adjusts to an increase in international trade
(Odularu, 2010). Trade liberalization is likely to improve self-sufficiency policies in
developing countries. The removal of farm subsidies in developed countries results in an
increase in the international price, which in turns harms consumers in developing
countries. However, an increase in price results in expansion of production. A market will
gain economic market efficiency when tariffs and regulations are removed. This also
causes increasing economic growth, but the degree of economic growth depends on a
country’s trade position regarding its net import and export. The domestic price for an
import country with high tariffs will decline if an increase in international price is greater
than a decrease in tariffs. In this case, consumers will pay less and producers will gain
more. On the other hand, if tariffs are initially low, domestic producers will benefit from
an increase in price. Exporting countries will benefit from more market access resulting
in an increase in exports to developing countries.
Trade liberalization under the Uruguay Round Agreement has a great influence on
the rice trade due to highly protectionist domestic policies, which double the volume of
trade and consumption (Brookes and Barfoot, 2003). Agricultural products are highly

39
protected in both industrial and agricultural countries (Aksoy and Beghin, 2004). In the
past 20 years, world trade has increased rapidly in the industrial sector with low levels of
protection, while moving more slowly in the agricultural sector with high protection
levels. Changes in rice policies in Asia are mainly caused by world rice variability
(Dawe, 2002), causing governments to favor policies relating to the expansion of
production system, irrigation and fertilizer to increase their rice productions. The increase
in domestic rice production leads these countries to reach a position of self-sufficiency
and to be less reliant on the world market.
As rice is a segmented market, rice prices and their related policies for different
varieties, quality and milling process are different in each country (Brookes and Barfoot,
2003). Not only major exporting countries, but also rice-importing countries play an
important role on influencing international rice policy. The United States, the European
countries and Japan highly protect their rice industries with domestic regulations. Their
regulations upon adopting genetically modified rice have a great impact on the world rice
trade although Demont and Devos (2008) point out that the European Union regulations
concerning the coexistence of GM and conventional crops may be too strict and
overstated.
The following section describes policies in several rice producing, consuming and
exporting countries that significantly influence the world’s rice trade, volume and prices.
Specifically, the policies of China, India, Japan, Vietnam, Thailand, and The United
States are examined regarding both domestic regulations and international policies and
trade agreements.

40
China
China’s rice production accounts for one-third of the world’s total rice yield
(Wiles, 2003). Like other Asian countries, food security in China is fulfilled through
maintaining a high level of rice production and the stabilization of domestic prices and
supplies. The country’s current policy is to concentrate on quality rather than quantity. As
medium-grain rice is the most highly protected type in international trade, China, as the
largest producer of medium-grain rice, has benefited from trade liberalization reform.
China exports medium-grain rice mainly to the markets of Russia, Japan, South Korea,
and North Korea. China is also an important low-quality rice exporter to Cote d’lvoire,
Indonesia and Cuba. Fragrant Jasmine rice production in China is increasing and is likely
to reduce the country’s demanded for Thai fragrant Jasmine.
India
As the world’s second-largest rice producer and consumer, India’s trade actions
and policies play a significant role in the international rice trade (Wiles, 2003). India
specializes in low-quality long grain and fragmented basmati rice. Food security is
achieved with government interventions such as grain procurement, price supports and
export subsidies. The domestic rice stock is refilled with 25 percent of the annual crop
and India has been subsidizing its rice exports at a 50 percent rate, making its low-quality
parboiled rice and long-grain rice prices lower than competitors: Vietnam, Thailand and
Pakistan. The main export markets for low-quality long grain rice are Indonesia, the
Philippines, Bangladesh, Nigeria, Cote d’Ivoire, South Africa, Saudi Arabia, the

41
European Union, Kuwait, the United Arab Emirates and Iran are the main export markets
for India Basmati rice.
Japan
Price supports of agricultural commodities such as rice in Japan are high and
protected (Brookes and Barfoot, 2003). Rice Farming Income Stabilization was
introduced as a part of policy reform in 1998 because of the higher cost of rice production
and the effect of the WTO agreement in the Uruguay Round. The program aims to
support farmers when the price of rice is less than the average price standard, giving
farmers 80 percent of the differences between the prices. The payment is contributed by
the government to rice producers who participate in the program at a ratio of 1: 3 (Wiles,
2003). In order to receive the full benefit of the program, rice producers are required to
enroll in the Production Adjustment Promotion Program (PAPP) in which rice producers
receive an additional payment by allocating rice land for other crops. This program leads
to a reduction in land for rice production in Japan.
Thailand
This country has been the world’s leading rice exporter for several years although
its domestic production has one of the highest yields in the world (Brookes and Barfoot,
2003). Thailand is well-known for its high-quality and fragmented Jasmine rice. The
level of protection for agriculture is low and the amount of planting in determined in
consideration of the market. The government provides a price floor support for farmers
when the international rice price is low and offers a paddy mortgage or loan program
operated under the Bank for Agriculture and Agricultural Cooperatives (BAAC) which

42
sets the price at 95 percent of a target price (Wiles, 2003). The more farmers enter this
program, the more the increasing government’s rice stock increases.
Vietnam
The adoption of a new rice variety and economic reform by the government led
to a rapid increase in rice production in the mid-1990s resulting in Vietnam’s reaching
the second rank among the world’s rice exporters (Wiles, 2003). Its main exporting
markets for both high- and low-quality rice are Iraq, Indonesia, Cuba, Malaysia, and the
African countries. Vietnam is the world’s major rice producer and consumer. Although
there is no major production policy within the country, the Vietnamese government’s
priority is to ensure food and income security for farmers. The government provides
domestic assistance in the form of a price support program and by providing private rice
storage when there is a rice surplus (Brookes and Barfoot, 2003).
The United States of America
As one of the world’s top four rice-exporting countries, the United States has
several policies to support its domestic rice sector such as Commodity Loans, Production
Flexibility Contracts (PFCs), Loan Deficiency Payments (LDPs), Counter Cyclical
Payment (CCPs) and Average Crop Avenue Election (ACRE) (Brookes and Barfoot,
2003, Childs, 2009). In 2000, payments received from these programs were high as 40
percent of total farm revenues, which made rice production attractive to farmers. The
Export Credit Guarantee Program, the Market Access Program and the Foreign Market
Development Program help promote U.S. rice purchases in foreign countries. The U.S.
concentrates on unmilled, parboiled, brown and milled rice. Its markets for unmilled rice
43
are Mexico and Central America and the other large markets for unmilled rice are
Northeast Asia, the Caribbean, and the Middle East.

44
CHAPTER 3
DATA AND METHODOLOGY
This chapter presents and discusses the source and types of data used to analyze
the rice prices of four major rice-exporting countries: India, Thailand, Vietnam and the
United States. The second part presents the methodology and econometric models used in
the study and the theoretical and practical frameworks used for analysis of the
relationship of rice prices among different markets.
Types and Sources of Data
Monthly data from August 1997 to February 2010 from four important rice-
exporting countries are used in this study. All aggregated data has been collected from
secondary sources. Data pertaining to India’s 5 percent broken parboiled price series,
Thailand’s 100 percent grade B price series, Vietnam’s 5 percent broken DWP price
series, Vietnam’s 5 percent broken price series and the U.S.’ long-grain Texas price
series were taken online from the Rice Year Book, from the Economics Research Service
(ERS: this is a USDA database containing time-series information). All prices are quoted
in U.S. dollars with the quantity in tone. The unit quantity has been converted to
hundredweight units. Ghoshray and Lloyd (2003) point out several criticisms of the use
of price quotes in economic analysis. First, there is concern that the quoted price might
not represent the actual price. Although this might be true, a quoted price will still follow
the law of supply and demand and therefore might be able to speak for the actual price.
Second, data frequency in an economic analysis is significant for its results. The last
concern is the effect of subsidies on diverging quoted prices and actual prices.

45
Information from the source mentioned above has been supplemented by data collected
from Commodities Prices yearbooks and Rice Situation and Outlook reports.
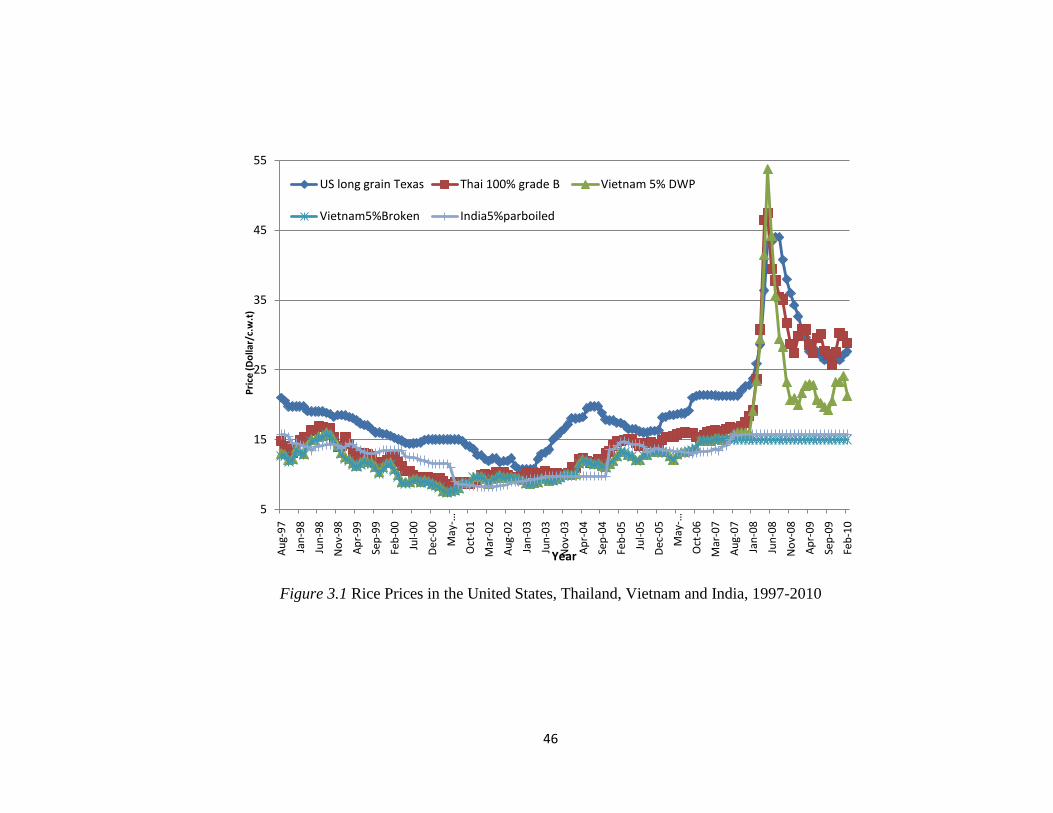
A graphical representation of the rice price trends from the four top rice-exporting
countries in each product classification is given in Figure 3.1. Although there are
observable differences from month to month, the five price series (Thailand’s 100 percent
grade B price series, Vietnam’s price series in 5 percent broken and 5 percent broken
DWP, and India’s price series 5 percent parboiled broken) seem to share a similar pattern
throughout the period from August 1997 to around February 2008. During the same
period, the U.S.’ price series was consistently higher that the other price series. Since
February 2008, there were two separate patterns to be observed. The first pattern appears
among the US’, Thailand’s and Vietnam’s 5 percent broken DWP in the skyrocketing
movement of their price series. The second pattern is to be seen in the constancy of the
price series, which can be observed by comparing Vietnam’s 5 percent broken and
India’s 5 percent broken parboiled price series. The second price series pattern was the
result of trade actions in the two countries, taken in order to preserve their rice supply for
domestic consumption. The main hypothesis of this study focuses on the impact of the
contamination of U.S. supplies by genetically modified rice. Nonetheless, Figure 3.1
shows that there was no price decline from any of the five-price series from the month-to-
month. Thus, it is necessary to examine the sample for a long-run cointegation
relationship to be able to verify the hypothesis.
46
Figure 3.1 Rice Prices in the United States, Thailand, Vietnam and India, 1997-2010
5
15
25
35
45
55
Au
g-9
7
Jan
-98
Jun
-98
No
v-9
8
Ap
r-9
9
Sep
-99
Feb
-00
Jul-
00
Dec
-00
May
-…
Oct
-01
Mar
-02
Au
g-0
2
Jan
-03
Jun
-03
No
v-0
3
Ap
r-0
4
Sep
-04
Feb
-05
Jul-
05
Dec
-05
May
-…
Oct
-06
Mar
-07
Au
g-0
7
Jan
-08
Jun
-08
No
v-0
8
Ap
r-0
9
Sep
-09
Feb
-10
Pri
ce (
Do
llar/
c.w
.t)
Year
US long grain Texas Thai 100% grade B Vietnam 5% DWP
Vietnam5%Broken India5%parboiled
47
Econometric Methodology
Zohrabyan, Leatham and Bessler (2007) point out that methodology is the heart of
a study since the researcher can present the best method by which a reliable and
creditable outcome may be ensured. In the present study, long-run equilibrium prices
have been investigated to determine the impact of genetically modified rice
contamination in U.S. supplies on international rice-exporting prices. As Ghoshray and
Lloyd (2003) indicate in their study on the law of one price in the international wheat
market, a commodity price in one market may be independent from another if the price
difference between the two markets is great enough to separate a price in one country
from an equilibrium market. It is possible for markets to be tied together in the long-run
even though, individually, each price behaves differently. Testing for integration is an
introduction to an investigation into the price of a commodity among various markets.
Some of the studies that have tested for unit root and long-run cointegration have been
discussed in the previous chapter’s literature review.
Unit Root Tests
Generally, time series trend upward over time and can measure both nominal
price and real levels of economic variables (Davidson and Mackinnon, 1993). Two
common time series models reflect upward trends as follows:
(3.1 a) (3.1 b)

48
(3.2 a) (3.2 b)
The equation in (3.1a) is trend-stationary while in the equation (3.2 a) has a
random walk with a drift. Although both terms cause an upward trend in the
time series, the behavior of in both equations is different when the time series is
converted to a stationary one. To transform a random walk with or without a drift to a
stationary process, it is necessary simply to subtract from or differencing,
resulting in a differencing-stationary as in equation (3.2b). The same method may be
applied to detrend processing of the non-stationary equation (3.1a) into a stationary
process (equation 3.2b).
When working with long-run equilibrium, stationary and non-stationary variables
must be distinguished for the time series properties. Failing to do so will lead to a
spurious regression with a high R2 and significant t-statistic lacking any economic
meaning. In equation 3.1, Enders (1996) explicates the general regression model when
both { } and { } are stationary and has a zero mean and finite variance. The presence
of a non-stationary variable, however, leads to a spurious result.
(3.2 a)
Regarding equation 3.2, there are four cases in which users should be aware of
and stationary and non-stationary variables:

49
a) When both { } and { } are stationary as in equation 3.1, the general
equation is appropriate for further testing.
b) When { } and { } are cointegrated at different orders, the use of the normal
equation is meaningless.
c) When both { } and { } are non-stationary and cointegrated at the same
order and a residual sequence contains a stochastic trend, the regression is
spurious and the result is meaningless.
d) When both { } and { } are non-stationary and cointegrated at the same
order while the residual is stationary, { } and { } are cointegrated
Unstable price series referred to as non-stationary can be made stable if converted
to a difference (d) one or more times (Gordon, 1996). In this case, it is referred to as an
integrated series of order d, [~I (d)]. In economics, most macroeconomic variables are
integrated to order one. If two variables are non-stationary, transformation of the
variables may cause them to become stationary, and the two variables are said to be
cointegrated. Generally, the unit root test initiates the cointegration procedure. If
variables are cointegrated according to different orders, their long-run equilibrium will
not be cointegrated. The Augmented Dickey-Fuller (ADF) test is employed to test for
stationary and non-stationary trends among variables. The general form of the ADF test
is:
(3.2b)

50
The value of m or amount of time lagged can be determined by applying Akaike
criteria or Schwarz-Bayesian criteria to maximize the amount of information. The ADF
test can be used with a constant and a time trend.
Cointegration Test and Long-Run Equilibrium
Engle and Granger (1987) provide two steps to test for cointegration in a single
equation after the result of two variables, x and y, are cointegrated of order I(1) (Enders,
p375,1996). The function for estimating long run equilibrium between price series is
expressed as presented in equation (3.3 a):
(3.3 a)
where denotes the estimated residual term of the long-run equilibrium relationship.
If the deviations of the estimated residual of the long run equilibrium, , are
stationary, then it can be concluded that { } and { } are cointegrated of order (1,1).
(3.3 b)
In detail, the DF test is used to test for the parameter in equation (3.3 b). If the
null hypothesis that is no different from zero cannot be rejected, then the estimated
residual contains a unit root which indicates non-cointegation between { } and { }.
Thus, and are not cointegrated of order I(1,1). There is no linear combination
between variables in the long-run equilibrium relationship.

51
In addition to the Engle and Granger procedure, the Johansen procedure can also
be used to perform cointegration of the data when the data series are cointegrated of the
same order. In many economic studies, researchers prefer the Johansen to the Engle and
Granger procedure. Nicols and Ahmadi-Esfahani (2009) test the law of one price in the
Australian vegetable market using the Johansen procedure because it allows for and is
capable of testing a hypothesis for the LOOP. In addition, Gordon and Hannesson (1996)
state that the Johansen procedure (1988) and Johansen and Juselius procedure (1990)
methods that are based on the concept of canonical correlations for multivariate analysis.
Under the assumption of I(1), the linear combinations are cointegrated or stationary. The
data is divided into two parts: a differenced part and a level part. The linear combinations
are found in levels data that are highly correlated with difference data.
Error Correction Models and Short-Run Equilibrium
If the variables from the cointegration procedure are cointegrated (rejecting the
null hypothesis of the cointegation relationship), the next step is to construct an error
correction model using the residual that was estimated from the regression equation (3.3)
(Enders, 1996). The procedures presented so far are useful for capturing the long-run
equilibrium relationship of price series. Clearly, good models should be able to describe
both long-run and short-run relationships and movements. The error correction model
developed by Engle and Granger has been used in time series econometrics since1964
(Goodwin, 1992). The error correction functions for cointegration can be expressed as
follows:

52
(3.4 a)
(3.4 b)
Where , , , , , , and are all parameters.
is the residual from the estimation of the long-run relationship in equation
(3.3).
Specification of the Statistical Model
This study uses a statistical model in order to explain the long-run equilibrium
relationship in international rice prices. In order for international rice prices to be
cointegrated, all rice should share the same long-run price pattern regardless of rice types
or country of origin. Generally, economic time series change over time. If the changes are
stable or predictable, the mean and variance of the relationship will be defined. On the
other hand, the mean and variance of series with unstable changes will fluctuate over
time. The cointegration approach developed by Engle and Granger (1986) is the main
method used in this study because its simplicity and directness of application. This study
will include one additional explanatory variable as specified in the error correction model
in equations 3.3a and 3.3b (the official announcement of the contamination event in
August 2006). The main interest in studying rice price relationships among the four major
rice-exporting countries is to examine the impact upon the international rice market of
genetically modified LibertyLink rice in U.S. rice supplies. The potential benefit or harm
that genetically modified crops may have for society is still being debated.

53
Procedures of Analysis
An initial analysis is done by testing for stationary and non-stationary variables on
time series data of rice-exporting prices in the U.S., Thailand, India and Vietnam
markets. The study’s procedures are divided into two sections: pre-testing for rice price
relationships among these markets between August 1997 and August 2006, prior to the
official announcement of the LibertyLink Rice contamination, and testing for rice price
relationships including the contamination period between August 1997 and February
2010. Both test sections make use of the same procedures. However, isolating the data
pertaining to the contamination event provides an overall view of the rice-exporting price
markets’ behavior and relationships prior to and after the contamination.
This first procedure determines the properties of each price series in order to
proceed to the next procedure. The price series are denoted as follows: U.S. long-grain
Texas, Thailand 100 percent grade B, Vietnam 5 percent broken DWP, Vietnam 5
percent broken, and India 5 percent broken parboiled for the August 1997 to August 2006
data set. To derive results from the Augmented Dickey and Fuller procedure, the t-
statistic of each price series is used and compared with the t-critical value of Dickey and
Fuller and optimally lagged from AIC criteria. If the null hypothesis is rejected for each
price series, then we will conclude that that particular price series is stationary. In other
word, that price series must be eliminated before adopting the next procedure.
The next step is to run the data that are cointegrated of the same order from the
first procedure. Both sets of data are looked at for the t-statistic value and p-value to
determine whether or not to reject the null hypothesis of no cointegration as compared to

54
the t-critical value of the Engle and Granger procedure (adapted from Ardeni, 1989).
Keep in mind that the numbers of the price series of the data set for this procedure
depend on the conclusion drawn from the first procedure, the unit root test. The data are
then tested for short-run dynamics using an error correction model to carry on the
numbers of the price series from the cointegrated pairs.
After determining the rice price relationship among the four markets before the
contamination event, the data set expands to cover the event period from August 1997 to
February 2010. In this section, the procedure of testing for rice price equilibrium is the
same as that used for testing for price relationships prior to the contamination event,
starting with a unit root test using the Augmented Dickey and Fuller for stationary and
non-stationary variables. Then, the Engle and Granger procedure is performed for long-
run cointegration relationship ending with determining a possible short-run price dynamic
between cointegrated price series pairs.
This object of this study is to determine whether a structural change has occurred.
Structural change is defined as a change in the pattern of the relationship between the
dependent variable and independent variables over the study period. To determine
whether or not a structural change has occurred , the data will be split into two subgroups
denote as a dummy event. This variable will be added to the error correction model to
determine whether there is a different pattern within each subgroup of the two prices
series that show a long-run equilibrium relationship. Thus, using the general equation
formulas in (3.4 a) and (3.4 b), the specific model can be expressed as follows:

55
(3.5 a)
(3.5 b)
(3.5 c)
where:
= the coefficient of the independent variable in the simple regression between both
variables that are cointegrated
= the coefficient of time lagged of the dependent variable
= the coefficient of time lagged of the independent variable
= the coefficient of the dummy EVENT 2006 variable
Event 0 = August 1997 – August 2006
Event 1= September 2006- February 2010
= the coefficient of the error term from the equation (3.5 a)
The hypothesis to be tested is:
a. Ho: = 0
b. Ha: 0
The null hypothesis suggests that the parameters of event 0 and event 1 are not
different, meaning structural change did not occur due to the impact of the contamination.
In other words, the estimated value of the parameter is no different from zero. If the p-
value is greater than the -value, we cannot reject the null hypothesis and conclude that a

56
structural change did not occur. However, if the -value is greater than the p-value, we
must conclude that a structural change did occur. If there is no evidence of a structural
change, the next procedure is to identify outliers referring to a difference between the
actual and predicted value of more than two standard deviations.
Multiple Regression Analysis
Multiple regression analysis is a common quantitative method used to identify
relationships among variables in an analysis (Gujarati, 2005). A regression model is used
in this study to explain the price series variables that account for the variation in the U.S.
exporting-rice price from 1997 to 2010. The main advantage of using multiple regression
analysis is its ability to handle both quantitative and qualitative data without any
restriction on data size. Moreover, it is used to measure the influence of one variable
when holding the effect of other variables constant. A function model can be expressed as
follows:
(3.6) Yi = f {X1, X2, X3, X4,…,Xn}
where Yi = dependent (explained) variable
Xs = independent variables
To estimate the relationships of the U.S. rice-exporting price series and the other
independent variables upon the genetically modified contamination event, an ordinary
least-squares regression equation has been developed. The structural model can be
represented as follows:

57
(3.7) Yi = a0 + b1X1i + b2X + ei
where Yi = the U.S. long-grain Texas rice price
X1 = independent variables
X2 = dummy variable
X2 = 0 denotes the period before the contamination event
X2 = 1 denotes the period after the contamination event
B2 = the estimated of regression coefficients
a0 = the intercept term
ei = the error term
It is assumed that the estimated coefficients are the best linear unbiased estimators
(BLUEs) of the regression parameter. The coefficient b1 in the equation 3.7 measure the
changes in Yi, which is the U.S. long-grain rice price for this study, with a unit change in
X1, denoting the other major rice-exporting countries, on the assumption that all other
variables in the regression equation are held constant. Likewise, b2 measures the changes
in Yi in response to a unit change in X2, accounted for by the contamination event.
To determine whether or not individual regression coefficients differ significantly
from zero, a t-test statistic is an important test to verify a test’s significance. The t-
statistic is calculated as follows:
(3.8)

58
where b is the value of a particular estimated coefficient and is the standard error of
the regression coefficient. This t-statistic is compared with the critical t-values obtained
from the t-table for different confidence levels. The null hypothesis will be retained if the
computed t-statistic is less than or equal to the critical t-value from the t-distribution table
meaning that an individual price series is not accounted for by the change in the U.S. rice
prices. On the other hand, the null hypothesis will be rejected if the t-statistic value is
greater than the critical t-value. Saying that, an individual price series is significant it is
accounted for by the change in the U.S. rice price.

59
CHAPTER 4
EMPIRICAL RESULTS
This research uses time-series data from the ERS, USDA to analyze long- run and
short- run equilibrium relationship for rice-exporting prices due to the impact of
contamination of conventional rice supplies by genetically modified rice. The study
concerns four major rice-exporting countries: Thailand, Vietnam, the United States and
India covering the period 1997-2010.
General Procedure Description
All of the full models described in Chapter 3 to capture a stationary trend in each
price series along with the long-run and short run-rice price relationships regarding the
genetically modified rice contamination event are run separately using TSP 5.1 software.
This study analyzes the long-run equilibrium and, if any, short-run equilibrium of the
four major rice-exporting countries: India, Thailand, Vietnam and the United States. A
cointegration procedure is used to measure the long-run price relationships. For the short-
run effect, an error correction model is applied, consisting of a short-run dynamic term
and an error correction term. The hypothesis of this study states that international rice
exporting prices are cointegrated and had been affected by the contamination event.
Several models were developed. Only those equations that are economically and
statistically relevant and important are presented. The procedures for this study are as
follows: pre-test for long-run equilibrium from the data set prior to the contamination,
between August 1997 and August 2006, and then testing overall for the long-run
60
equilibrium of price series including the contamination event. The short-run dynamic
price is tested if there is a long-run cointegration between a pair of price series that are
cointegrated and which include the dummy variable of the contamination event.
To determine the impact of the contamination event on rice prices among supplier
countries, the data from August 1997 to August 2006 is first tested for long-run
equilibrium prior to the contamination event. Table 4.1 shows the mean, standard
deviation, maximum and minimum of the 109 variables studied. All price series appear to
have a close range of standard deviation with each price series ranging from a high of 2.6
in the U.S. price series to a low of 1.9 in the Vietnam 5 percent broken price series. The
Vietnam 5 percent broken price series presents the lowest price, 7.5 dollars per
hundredweight while the US long grain price series contains the highest price, 21 dollars
per hundredweight.
Pre-test, August 1997-August 2006
Unit Root Results
Starting with the test for their order of integration throughout the series, the
Augmented Dickey Fuller (ADF) tests for each price series is used for both periods
expressed as a nominal-level. The null hypothesis is that each price series is non-
stationary [~I(1)], against the alternative hypothesis that each price series is stationary
[~I(0)]. The results of the ADF tests are reported in Table 4.2. Optimum lag lengths for
each price series have been chosen based on the Akaike Information Criteria (AIC). In
the five rice prices series, the null hypothesis cannot be rejected at a 10 percent level of
confidence, so the prices of each price series has a unit root or non-stationary trend.

61
There is evidence for the presence of a unit root in every case, thus indicating the non-
stationary nature of each of the price series.
Cointegration Results
The rice export prices are examined in pairs to demonstrate their long-run
relationships. Cointegration in pairs is tested by the Engle and Granger procedure (1987),
keeping in mind that the cointegration tests are done using prices in a level form (the non-
stationary form). The presence of a common stochastic trend indicates the cointegration
of a time series pair. Individually, each price series contains a unit root trend, yet the
linear combination shows no trend. Examining for the pairs’ cointegration is done by
making use of the data obtained from the results of the unit root test (ADF). All five price
series are shown to be non stationary according to the result of the unit root. This
cointegration is shown in Table 4.3. The rejection point is at a 10 percent level of
confidence. U.S. long grain rice prices show no equilibrium relationship of a linear
combination with the four price series: Thailand 100 percent grade B price, Vietnam 5
percent broken DWP price, Vietnam 5 percent broken price and India 5 percent broken
parboiled price. Although the U.S. rice price series do not show a linear combination
equilibrium with the others, an individual equation testing the null hypothesis of the
presence of the cointegration between the U.S. price and the Vietnam 5 percent broken
DWP and the Vietnam 5 percent broken prices are rejected at a 5 percent level of
confidence when the U.S. price series is an independent variable. The null hypothesis is
also rejected at a 1 percent level of confidence in the cointegration equations that have

62
the Thailand price series and the India 5 percent broken parboiled price series as
independent variables in the equations.
The Thailand rice price series is statistically significant at a 1 percent level of
confidence, along with the Vietnam 5 percent broken price series and 5 percent broken
DWP prices series. We may conclude that the linear combination of the Thailand and the
Vietnam rice prices are I(0). In other words, there is a long-run equilibrium between the
Thailand and the Vietnam rice prices series. The null hypothesis cannot be rejected
between the cointegrated pairs consisting of the Thailand and the India 5 percent broken
parboiled price series at a 10 percent level of confidence. Thus, there is no evidence of a
long-run relationship between the Thailand price series and the India 5 percent parboiled
price series.
By designating the two Vietnam rice price series as dependent variables and
testing for cointegration, the null hypothesizes of both equations are rejected a at 5
percent level of confidence. The Vietnam 5 percent broken price series and the Vietnam 5
percent broken DWP price series present a cointegration of the linear combination in
their long run relationship. The null hypotheses cannot be rejected for the other price
series of the paired equations in either the Vietnam price series or the India 5percent
broken parboiled price series at a 10 percent level of confidence.
To sum up the cointegration results, there is strong evidence of the presence of a
linear combination in the long-run relationship between the Thailand price series and the
Vietnam 5 percent broken DWP price series pair and between the Thailand price series
and the Vietnam 5 percent broken price series pair. Moreover, the relationship between
63
the two Vietnam prices series show a cointegration of their long-run equilibrium while
the U.S. price series does not show cointegration with any price series during the time of
this study. The presence of the cointegration results between Thailand and Vietnam rice
prices reveals that there is a link among those markets through either substitution or
arbitrage during August 1997 to August 2006 whereas the U.S. rice price is not linked to
Thailand’s, Vietnam’s and India’s rice prices during the same period.

64
Table 4.1
Descriptive Data 1997 (Aug)-2006 (Aug)
Variablesa Obs Mean Std.Dev Minimum Maximum
US 109 16.15541 2.62972 10.75 21
THB 109 12.21615 2.47197 8.49 16.88
VT_DWP 109 11.13486 2.0779 7.5 16
VT_BKN 109 10.98211 2.05661 7.4 15.75
IN_PARB 109 11.84587 2.2967 8.25 15.75 aThe definitions of each price variable are in Appendix Table1.

65
Table 4.2
Univariate Stationary Tests: ADF Statistics
1997(Aug)-2006(Aug)
Augmented Dickey
Variablesa
Fuller Test
Statisticsb P-Value
Lag
Order
US -1.98256 0.61090 6
THB -1.13034 0.92383 5
VT_DWP -1.33288 0.87956 4
VT_BKN -1.34912 0.87524 4
IN_PARB -1.41743 0.85572 2
aThe definitions of each price variable are in Appendix Table1.
bThe critical values for the t-statistics are from Fuller (Adjusted from
Arden, 1989);
100 obs – 3.51(99 percent); - 2.89(95 percent); - 2.58(90 percent)
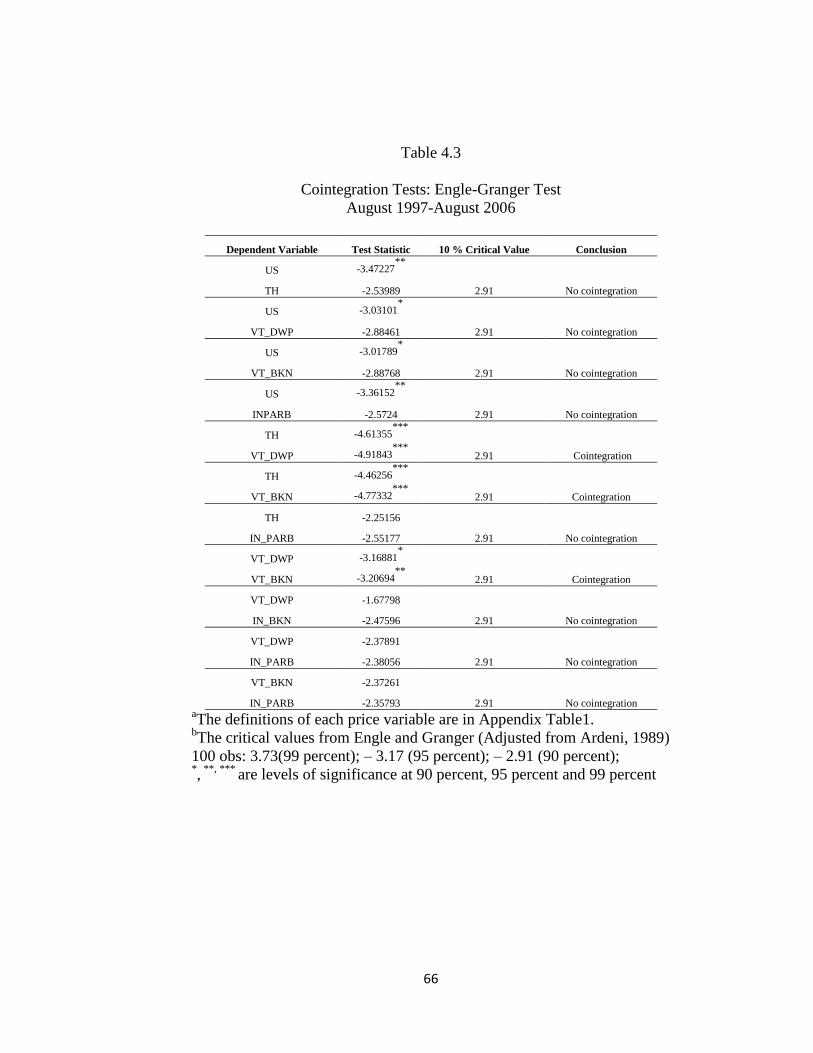
66
Table 4.3
Cointegration Tests: Engle-Granger Test
August 1997-August 2006
Dependent Variable Test Statistic 10 % Critical Value Conclusion
US -3.47227**
2.91 No cointegration TH -2.53989
US -3.03101*
2.91 No cointegration VT_DWP -2.88461
US -3.01789*
2.91 No cointegration VT_BKN -2.88768
US -3.36152**
2.91 No cointegration INPARB -2.5724
TH -4.61355***
2.91 Cointegration VT_DWP -4.91843***
TH -4.46256***
2.91 Cointegration VT_BKN -4.77332***
TH -2.25156
2.91 No cointegration IN_PARB -2.55177
VT_DWP -3.16881*
2.91 Cointegration VT_BKN -3.20694**
VT_DWP -1.67798
2.91 No cointegration IN_BKN -2.47596
VT_DWP -2.37891
2.91 No cointegration IN_PARB -2.38056
VT_BKN -2.37261
2.91 No cointegration IN_PARB -2.35793 aThe definitions of each price variable are in Appendix Table1.
bThe critical values from Engle and Granger (Adjusted from Ardeni, 1989)
100 obs: 3.73(99 percent); – 3.17 (95 percent); – 2.91 (90 percent); *, **, ***
are levels of significance at 90 percent, 95 percent and 99 percent

67
Overall Data Results August 1997-February 2010
The sample data have been expanded to include the contamination event, testing
with the same procedures as above: first testing for a unit root for a long-run relationship
among the price series and then examining the presence of short- run dynamics, if there is
a result from the cointegration procedure that can be used. Table 4.4 shows the
descriptive data from August1997 to February 2010. A total of 151 prices for each series
have been observed. The Thailand 100 percent grade B price series appears to have the
most variation in price over time at a standard deviation of 7.78. Its price ranges from a
high of 47.45 dollars per hundredweight to a low of 8. 49 dollars per hundredweight. The
Vietnam 5 percent broken price series contains the most stable price at a standard
deviation of 2.45 with a high and a low price of 15.75 and 7.4 dollars per hundredweight,
respectively. The Vietnam 5 percent broken DWP price series presents the overall highest
price at 53.75 dollars per hundredweight.
When compared with the descriptive data in Tables 4.1 to 4.4, it can be seen both
similarities and differences between the two data periods. The standard deviations of the
Vietnam 5 percent broken price and the India 5 percent broken parboiled between August
1997 and August 2006 shows a pattern consistent with the overall standard deviation of
data from August 1997 and February 2010. However, the standard deviations of the U.S.
long grain Texas price, the Thailand 100 percent price and the Vietnam 5 percent broken
DWP price shows no consistent pattern between the two data periods.

68
Unit root test
The next procedure is testing for a unit root. The results are shown in Table 4.5.
The four main international rice price markets (the Thailand 100 percent grade B price,
the Vietnam 5 percent broken price, and the India 5percent broken parboiled price) fail to
reject the null hypotheses at a 10 percent level of confidence. In other words, these rice
prices series have unit root trends. These three rice prices series are non-stationary, and
the stationary trends of these price series are fulfilling after the first differencing. The
U.S. long grain Texas price series rejects the null hypothesis at a 10 percent level of
confidence but fails to reject the null at a 5 percent level of confidence. The Vietnam 5
percent DWP price series variable fails to reject the null hypothesis at a 1 percent level of
confidence; that is , to say, the residual of the variable is stationary. Next, we proceed to
the test for cointegration in the long-run relationship.
Cointegration Results
Examining for cointegrated pairs, this section carries on from the results of the
unit root test (ADF) by dropping the U.S. long-grain price series variable and the
Vietnam 5 percent DWP price series variable because the price series are not ~I(1) as has
been explained earlier regarding the previous result. The results shown in Table 4.6
reveal that all the price series pairs fail to reject the null hypothesis at a 10 percent level
of confidence in testing for the presence of linear combinations of long-run equilibrium.
There is no evidence of cointegration in any possible combination of the price series in
the three export markets.

69
Consequently, the cointegration results do not provide a consistent test for the
existence of a long-run equilibrium relationships among the Thailand price series, the
Vietnam prices series and the India price series. That there are no long-run relationships
among the Thailand price, the Vietnam price and the India rice price prove that different
rice prices from those countries can be separted without common factors holding their
prices together (Gordon and Hannesson, 1996). However, Ghoshray and Lloyd (2003)
suggest failing to find a cointegration relationship of a commodity between markets does
not mean two market prices are permanently independent of each other.
Comparing the results of the cointegration tests of both data sets, we end up with
a different long-run equilibrium relationship before and after the contamination event.
First of all, the U.S. rice price series does not show a long-run cointegration relationship
with the other rice prices series for either the period before the contamination event or
afterward. The linear combinations of the cointegration containing the U.S. price series
fail to reject the null hypothesis of the presence of cointegration. From August 1997 to
August 2006, the Thailand price series is cointegrated with both the Vietnam 5 percent
broken DWP price series and 5 percent broken price series, yet there is no linear
cointegration relationship between the Thailand price series and the Vietnam 5 percent
broken price series from the second data set. However, from the second data set, August
1997 to February 2010, there is no presence of a cointegration relationship among the
price series.

70
Multiple Regression Results
As stated earlier, the main purpose of this study is to determine the impact of
genetically modified rice contamination on the rice-exporting markets; yet the
coingetration tests from the pre-test data sample and the overall sample show that U.S.
rice price series do not indicate a linear combination of a long-run equilibrium
relationships among the other rice price series events though there is a presence of a
linear combination of long-run relationships in the Thailand price series and the Vietnam
prices series pairs in the pre-test. Clearly, the relationships between the U.S. rice prices
and the other rice price series are the concentration of this study. Thus, an error
correction model could not proceed for an investigation of further short-run price
dynamics.
Instead, a general multiple regression model is used to determine the relationship
of the U.S price series with the others. In addition, the model includes the dummy
variable denoting 0 as “before August 2006” and 1 as “after August 2006” to capture the
potential impact of the contamination on rice-exporting prices in the sample. Table 4.7
presents the results of the multiple regression equations between the U.S price series and
the other rice price series. The adjusted R-square ranges from 0.89 to 0.61 for the sample
data. Every price series rejects the null hypothesis, indicating that the estimated
coefficients of each price series, the Thailand price, the Vietnam 5 percent DWP price,
the Vietnam 5 percent broken price and the India 5 percent broken parboiled price, is
different from zero at a 1 percent level of confidence ( 0.746628, 0.733735, 0.990985,
and 0.968845, respectively).

71
The other variable in the multiple regression equation is the dummy variable
denoting the periods before and after the contamination event (August 2006). The
estimated coefficients of the dummy event in each price equation are -1.85730 for the
Thailand price equation, -3.94160 for the Vietnam 5 percent broken DWP equation, -
7.84903 for the Vietnam 5 percent broken price equation, and -8.51568 for the India 5
percent broken parboiled price. The equations show a negative sign and are statistically
different from zero at a 1 percent level of confidence. The negative sign of the estimated
coefficient indicates that the period before August 2006 has less impact on the changes of
the U.S. rice price than the period after the contamination event. From these multiple
regression equations, the question arises whether error terms of these equations would
still present a unit root trend while holding the contamination event variable constant.
The results shown in Table 4.8 indicate that the error terms from the U.S. rice price, the
Thailand rice price, the Vietnam 5 percent broken and 5 percent broken DWP and the
India’s 5 percent parboiled rice price equations present a stationary trend. In other words,
there is no unit root in an error term from regression equations.
Price correlation and Movements
The rice price series in the data sample is estimated for correlation relation and
price movement because international rice prices show fluctuation between August 1997
and February 2010 ( Figure 3.1 and Appendix Table.2). The correlation estimated and the
correlation significant test results are shown in Table 4.9. The correlation coefficient
estimate explains the relationship between the price series along with the previous test.
Although there is no linear combination of the long run equilibrium between U.S. price
72
series and its price series pairs before or including the contamination event periods, the
prices’ movements and their estimated relationship directions may be observed. Since
rice prices of the data sample both in the pre-test and overall- test contain a non-
stationary or unit root trend, estimating for a correlation coefficient would lead to a
spurious result. Price change levels are then used for the correlation estimation test. The
estimated correlation coefficients of the Thailand price and the Vietnam 5 percent DWP
price are statistically significant indicating that the Thailand price and the Vietnam price
tend to change in the same direction as the U.S. price.

73
Table 4.4
Descriptive Data 1997(August) -2010(February)
Variablesa Obs Mean Std. Dev Minimum Maximum
US 151 19.42179 6.87399 10.75 44
TH_B 151 15.89907 7.78118 8.49 47.45
VT_DWP 151 14.09238 6.7882 7.5 53.75
VT_BKN 151 12.07517 2.48814 7.4 15.75
IN_PARB 151 12.77252 2.51343 8.25 15.75 aThe definitions of each price variable are in Appendix Table1.
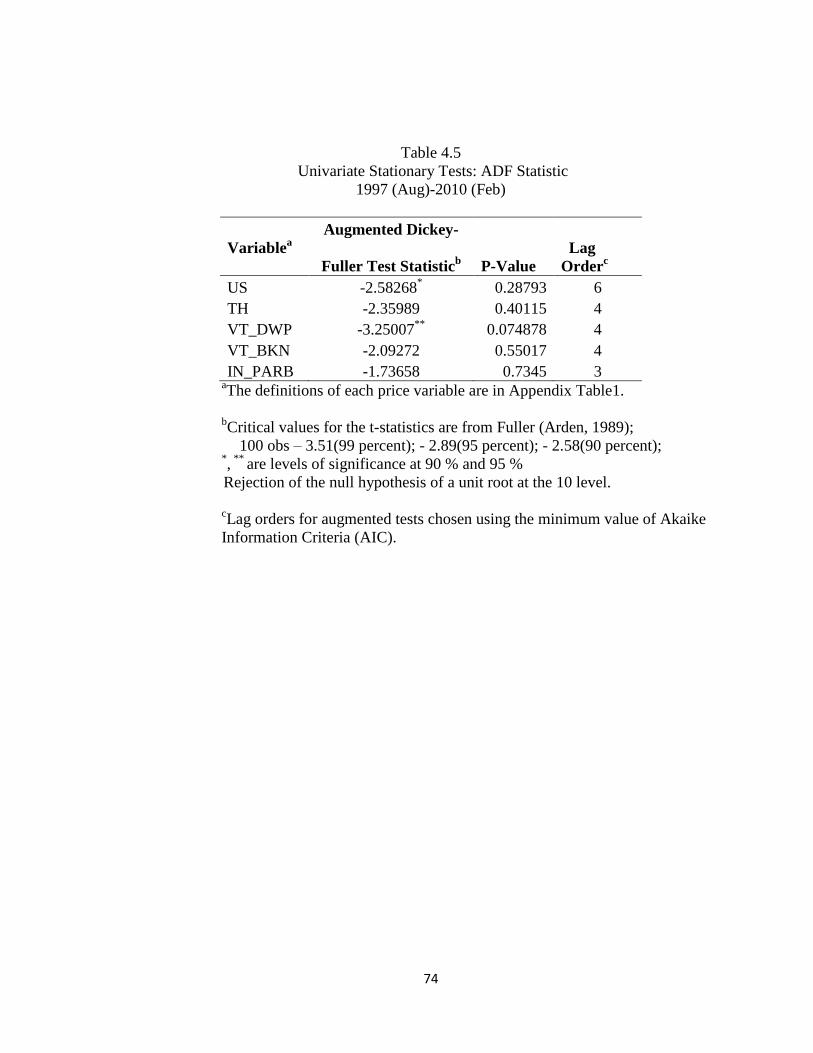
74
Table 4.5
Univariate Stationary Tests: ADF Statistic
1997 (Aug)-2010 (Feb)
Augmented Dickey-
Variablea
Fuller Test Statisticb P-Value
Lag
Orderc
US -2.58268* 0.28793 6
TH -2.35989 0.40115 4
VT_DWP -3.25007**
0.074878 4
VT_BKN -2.09272 0.55017 4
IN_PARB -1.73658 0.7345 3 aThe definitions of each price variable are in Appendix Table1.
bCritical values for the t-statistics are from Fuller (Arden, 1989);
100 obs – 3.51(99 percent); - 2.89(95 percent); - 2.58(90 percent); *, **
are levels of significance at 90 % and 95 %
Rejection of the null hypothesis of a unit root at the 10 level.
cLag orders for augmented tests chosen using the minimum value of Akaike
Information Criteria (AIC).

75
Table 4.6
Cointegration Test: Engle-Granger Test
August 1997-February 2010
Dependent
Variablea
Test
Statistic
10 % Critical
Value Conclusion
TH -2.92652 2.91
No
cointegration
VT_BKN -2.4842
TH -3.36792 2.91
No
cointegration IN_PARB -2.77765
VT_BKN -3.48547
2.91
No
cointegration
IN_PARB -2.8414
aThe definitions of each price variable are in Appendix Table1.
bCritical value from Engle and Granger (Adjusted from Ardeni, 1989)
100 obs: 3.73(99 percent); – 3.17 (95 percent); – 2.91 (90 percent); *, **
, ***
are levels of significance at 90%, 95 % and 99%, respectively

76
Table 4.7
Ordinary Least Squared Regression Models, August 1997-February 2010
Independent Estimated Standard T-statistic Adj.R
2
Variablesa Coefficient Error
THB 0.746628 0.038049 19.623***
0.884601 EVENT
-1.8573 0.658536 -2.82035***
Before Aug 2006
VT_DWP 0.733735 0.044713 16.41***
0.852583 EVENT
-3.9416 0.675123 -5.83834***
Before Aug 2006
VT_BKN 0.990985 0.189793 5.22141***
0.649012 EVENT
-7.84903 1.05039 -7.4725***
Before Aug 2006
IN_PARB 0.968845 0.160612 6.03221***
0.666381 EVENT
-8.51568 0.897926 -9.48372***
Before Aug 2006
aThe definitions of each price variable are in Appendix Table1.
*, **
, ***
are levels of significance at 10%, 5 % and 1%, respectively
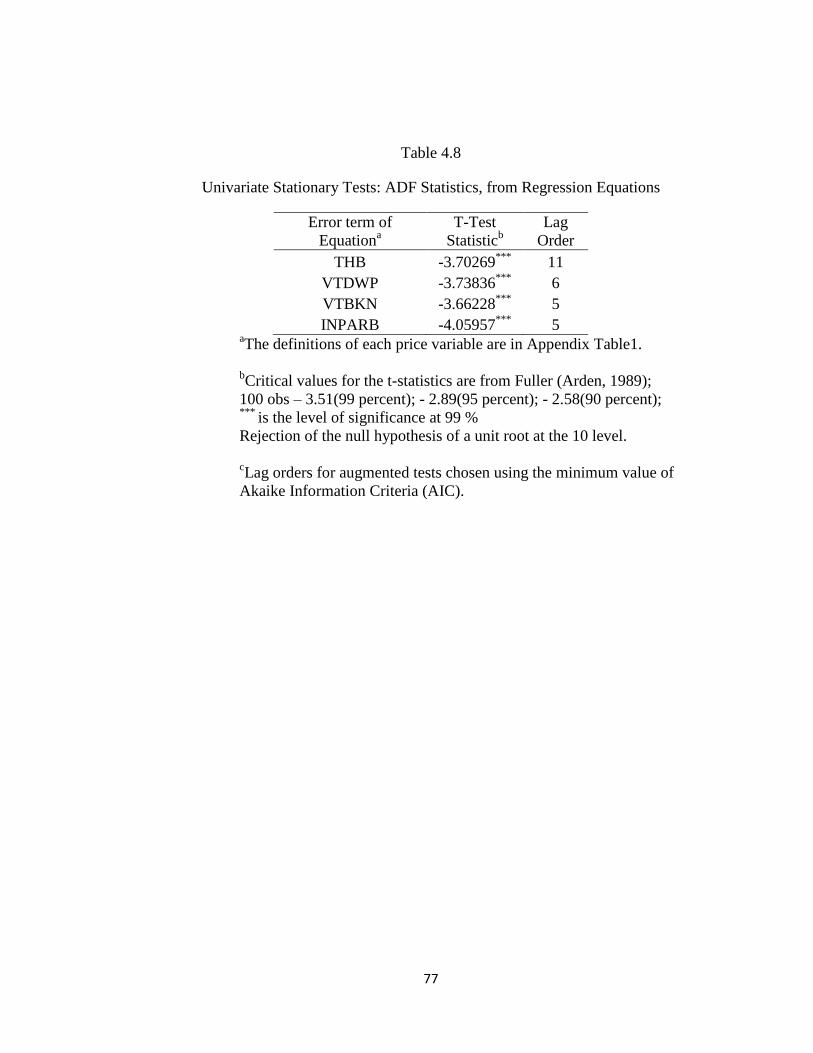
77
Table 4.8
Univariate Stationary Tests: ADF Statistics, from Regression Equations
Error term of
Equationa
T-Test
Statisticb
Lag
Order
THB -3.70269***
11
VTDWP -3.73836***
6
VTBKN -3.66228***
5
INPARB -4.05957***
5
aThe definitions of each price variable are in Appendix Table1.
bCritical values for the t-statistics are from Fuller (Arden, 1989);
100 obs – 3.51(99 percent); - 2.89(95 percent); - 2.58(90 percent); ***
is the level of significance at 99 %
Rejection of the null hypothesis of a unit root at the 10 level.
cLag orders for augmented tests chosen using the minimum value of
Akaike Information Criteria (AIC).

78
Table 4.9
Correlation between Prices Series, August 1997-February 2010
UST THBT VTDWPT VTBKNT INPARBT
USTa Pearson Correlation 1 .825** .780** 0.156 0.114
Sig. (2-tailed) 0.000 0.000 0.056 0.164
THBT Pearson Correlation
1 .925** .235** .275**
Sig. (2-tailed)
0 0.004 0.001
VTDWPT Pearson Correlation
1 .243** .214**
Sig. (2-tailed)
0.003 0.008
VTBKNT Pearson Correlation
1 .303**
Sig. (2-tailed)
0
INPARBT Pearson Correlation
1
Sig. (2-tailed)
aThe definitions of each price variable are in Appendix Table1.
**
is the level of significance at 95 %

79
CHAPTER 5
CONCLUSION
Changes in domestic and international policy in both rice-producing and rice-
consuming nations, increasing trade volume, and the potential of declining prices
compared with other cereal crops has had an impact on the international rice market
(Kang, Kennedy and Hilbun, 2009). In addition, a change in one country’s domestic
regulations is believed to affect other countries in the market. Most agricultural
commodities such as corn, wheat and soybeans are traded within a free trade
environment, unrestricted in terms of trade regulations for both sellers and buyers. The
fact that rice is not truly categorized as a freely trade commodity in the international
market due to governments’ regulation domestically and internationally may explain the
unstable behavior of the rice trade. Major rice-exporting countries are responsible for
changes in the trade because, unlike other cereals, rice is traded at a volume that is
proportionally low in comparison with its production. This research tests if a
cointegration in international rice prices has lead to a long run price equilibrium
relationship, or if the same price movement path will be found among four major rice-
exporting countries: Thailand, Vietnam, the United States, and India.
Thailand is a one of the world’s top rice producers and the largest rice exporter.
Its main export markets are Iran, Indonesia, Singapore and the United States (“Rice is
life”, 2004). The country is well-known for its high-quality long-grain white rice and this
is one of the reasons for a limiting willingness of farmers for an adoption of a GM high-
yielding rice variety. The country remains a GM-free country for commercial crops.

80
Historically, Vietnam was one of the world’s original cultivators of rice. Vietnam
is the world’s second largest rice-exporting countries. Despite this, its farmers still benefit
little due to the low price of Vietnamese rice.
The United States’ dominant rice producing regions are in Arkansas’s Grand
Prairie, the Mississippi Delta, the Gulf Coast, and the Sacramento Valley of California
(Childs, 2009). It is one of the world’s major rice-exporting countries despite its small
domestic production.
India, another of the world’s rice producers, is also one of the world’s main rice-
exporters. Rice cultivation is practiced all around the country and rice production
accounts for much of the country’s income and employment.
The overall objective of this research is to determine the impact of genetically
modified rice contamination on rice-export prices by answering the following questions:
1. In general, is there any relationship among prices of rice internationally?
2. What impact, if any, did the 2006 contamination event have on rice exporting
markets?
The empirical results provide consistent evidence that the U.S. rice market is not
integrated in the long-run with any of the other main rice-exporting markets nor is there
any price integration among all the five rice-exporting markets. However, we may
observe some evidence of long-run price relationships of the prices among Thailand’s
100 percent grade B and both of Vietnam’s markets, the 5 percent broken DWP and the
5 percent broken, for the period before the contamination event. In addition, Vietnam
markets show long-run price linkages. Put differently, these three rice prices must
81
converge into an equilibrium price path to prevent the prices to separate too far from each
other.
The results of an extended time period including the contamination event are the
same. There is no evidence of price integration among prices in the U.S. and the other
rice-exporting countries. In other words, the five markets are not linked. The prices of
rice in these five countries occasionally diverge considerably during the time of the study.
Nonetheless, the U.S. price, Thailand price and Vietnam 5 percent broken DWP price
present the same price relationship in terms of pattern and direction. Moreover,
Thailand’s, Vietnam’s, and India’s rice prices, individually, all positively correlate to
changes in the U.S. rice price. The price of rice is the U.S. changes less during the period
before the announcement of the contamination of genetically modified LibertyLink rice
has during less the period afterward.
Gordon and Hannesson (1996) state that if there is a well-integrated relationship
in a market, a trade restrictions from the side of either supply or demand will result in a
shock to the price system. The effect of the shock, however, does not last long and the
market will return to its equilibrium price. Thus, the effect of one major exporting rice
country’s trade action would possibly lead to a permanent impact on the rice price system
due to that fact that the rice-exporting market is not well cointegrated. The non-integrated
pattern of rice price markets seen in this study may be a result of trade actions of the four
countries. Rice prices of the U.S., Thailand, Vietnam and India are independent of each
other with or without the impact of the contamination of genetically modified rice.
Gordon (1996) concludes that if the two rice prices are not cointegrated, a shock in one

82
country will have a long permanent impact on that country without an international
spillover. An institutional factor within a country and/or among countries might be one of
the reasons that international rice prices are not linked. Another explanation is the
changes of explicit and implicit costs such as exchange rate and transportation cost. One
implication of this study can be useful for the rice-producing sector and rice policy
makers, which is that rice-producing farmers should pay more attention to the demand for
GM crops. Although genetically modified crops are not currently proven to be safe for
human consumption in international level, many countries allow the use of GM crops for
other usages such as for animal, in industrial sectors, and in research. Thus, it is likely
that GM crops would trade in a certain new market. Policy makers could use the
contamination event as a guideline and adjust their regulations for the greatest most
possible benefit.
Recommendation for Further Research
Although the regression results did capture the impact upon Thailand’s,
Vietnam’s, and India’s rice price from the changes in the U.S. rice price due to the
contamination event, it is possible that result does not reflect the impact of the GM rice
contamination event. Thus, it is very important that a researcher select an accurate data
sample for a specific research question when conducting a test for a secondary data. In
addition, studying the price behavior and price variability of different types of rice from
various groups of rice-related countries such as those of low and high-income may help
measure the impact of genetically modified rice. Trade policies and potential price
imparts relating to genetically modified crops are worth further research.

83
BIBLIOGRAPHY
Aksoy, M. Ataman and John C. Beghin. 2004. “Global Agricultural Trade and
Developing Countries.” The International Bank for Reconstruction and
Development. The World Bank. Washington D.C. Chapter 1. pp 1-16
Annou, Mamane, Michael Thomsen, and Eric Wailes. 2001. “Impact of Herbicide
Resistant Rice Technology on Rice-Soybean Rotation.” Journal of Agricultural
Agrobiotechnology Management and Economics, 4(2), pp 79-86.
Ardeni, Pier Giorgio. August 1989. “Does the Law of One Price Really Hold for
Commodity Price?” American Journal of Agricultural Economics: 71, pp. 661-
669.
Brookes, Graham and Peter Barfoot. 2003. “GM Rice: Will This Lead The Way for
Global Acceptance of GM Crop Technology?” Abridged version of the June 2002
PG Economics Report. Made available to ISAAA for publication.
Carter, Colin A. and Aaron Smith. (2003). “StarLink Contamination and Impact on Corn
Prices.” Contributed Paper Presented at the International Conference
Agricultural Policy Reform and the WTO: Where are We Heading? Capri, Italy,
June 23-26, 2003. AgEcon Search.
Childs, Nathan. November 2009. “Rice: Background and Policy.” Rice Briefing Room.
Economics Research Service. The United States Department of Agriculture.
Ching, Lim Li. November 2004. “Safety Consideration for Genetically Engineering
Rice.” Asian Biotechnology and Development Review: 7(1), pp 67-80.

84
Demont, Matty and Yann Devos. April 2008. “Regulating Coexistence of GM and Non-
GM crops Without Jeopardizing Economic Incentives.” Trends in Biotechnology:
26(7), pp 353-358.
David, Cristina C. and Jikun Huang. 1996. “Political Economy of Rice Price Protection
in Asia.” Economic Development and Cultural Change: 44(3), pp 463-483.
AgEcon Search.
David, Russell and James G. Mackinnon. 1993. “Estimation and Inference in
Econometrics.” New York, Oxford University Press.
Dawe, David. 2002. “The Changing Structure of the World Rice Markets, 1950-2000.”
Food Policy: 27, pp 355-370.
Enders, Walter. 1996. Applied Econometric Time Series. Wiley Publisher: Second
edition.
Enserink, Martin. 2008. “Tough Lessons from Golden Rice.” Science Magazine : 320, pp
468-471
Hareau, Guy, Brandford F. Mills, Georage W. Norton and Darrell Bosch. “The Economic
Impact of GMO in Small Developing Countries.” Paper prepared for
presentation at the Annual Meeting of the American Agricultural Economics
Association. Long Beach, CA, July 28-31, 2002.
Hettel, Gene. 2006. “Trick of the Trade.”.Rice Today: 5(3), pp 16-17.
Gariboldi, F. 1984. “Rice Parboiling.” FAO Agricultural Services Bulletin 56. Rome:
Food and Agriculture Organization of the United Nations.

85
Ghoshray, Atanu and Tim Lloyd. “ Price Linkages in the International Wheat Market.”
Selected Paper for Presentation to the International Association of Agricultural
Economists Triennial Conference, Durban, South Africa, August,18-22, 2003.
AgEcon Research.
Goodwin, Barry K. (1992) “Multivariate Cointegration Tests and the Law of One Price in
International Wheat Markets.” Review of Agricultural Economics: 14(1), pp 117-
124.
Gordon, Daniel V. and Rognvaldur Hanessesson. 1996. “On Price of Fresh and Frozen
Cod Fish in Europe and U.S. Markets.” Marine Resources Economics: 11, pp
223-238. AgEcon Search.
Grist, D.H. 1978. “Rice.” Longman Group. London and New York .
Gruere, Guillaume, Antoine Bouet and Simon Mevel. December 2007. “Genetically
Modified Food and International Trade: The Case of India, Bangladesh, Indonesia
and the Philippines.” Discussion paper. International Food Policy Research
Institue. Ecohost Database.
Gujarati, Damodar N. 2005. “Basic Econometrics.” Fourth Edition. New York. Tata
McGraw-Hill .
Kang, Hyunsoo, P. Lynn Kennedy, and Brian Hilbun. “Structure and Conduct of the
World Rice Market.” Selected Paper for Presentation at the Southern
Agricultural Economics Association Annual Meeting, Atlanta, Georgia, January
31- February 3, 2009. AgEconSreach.

86
Li, Yarui, J. Wailes, A. McKenzie and M. Thomsen. 2010. “LL601 Contamination and
Its Impact on U.S. Rice Prices.” Journal of Agricultural and Applied Economics:
42 (1), pp 31-38. AgEcon Search.
Jayne, T.S. 1993. “Sources and Effect of Instability in the World Rice Market.” Michigan
State University International Development Papers. AgEcon Search.
Nicols, Panos and Fredoun Ahmadi-Esfahani. “Are Australian Wholesale Vegetable
Markets LOOPy?” Contributed paper presented at the Australian Resource
Economics Society, 53rd
Annual Conference in Carins, Queensland, February 11-
13, 2009.
Odularu, Gbadebo olusegun. May 2010. “Rice Trade Policy Options in an Open
Developing Economy: The Nigerian Case Study.” Journal of Development and
Agricultural Economics: 2(5), pp 166-177.
“Rice Industry in Crisis: Major Rice Markets Close Doors to Genetically Engineered
Rice After Contamination of the Global Food Supply Chain.” 2007. Greenpeace
International.
“Rice is Life: International Year of Rice 2004 and its Implementation.” International Rice
Commission. Food and Agriculture Organization of the United Nations. Rome,
Italy. October, 2005.
Roggemann, Ellen. August 2005. “Fair Trade Thai Jasmine Rice: Social Change and
Alternative Food Strategies Across Borders.” Educational Networks for Global
and Grassroots Exchange (ENGAGE). Migration Policy and Resource Center.
Urban and Environmental Policy Institute.

87
Ryan, James G. January 1999. “Assessing the Impact of Rice Policy Changes in Vietnam
and the Contribution of Policy Research: Impact Assessment Discussion Paper
No.8.” International Food Policy Research Institute.
“Trade Reforms and Food Security: Conceptualizing Linkages.” Commodity Policy and
Projection Service: Commodity and Trade Division. Food and Agricultural
Organization of the United Nations. Rome, Italy. 2003
“The Stabilization of the International Trade in Rice: A Report on Possible Measures.”
August, 1955. Commodity Policy Studies No.7. Food and Agriculture
Organization of the United Nations. Rome, Italy.
Vermij, Peter. 2006. “Liberty Link Rice Raises Specter of Tightened Regulations.”
Nature Biotechnology: 24(11), pp 1301-1302.
Vogel, Gretchen. 2008. “Tracing the Transatlantic Spread of GM Rice.” ScienceMag
313: 1714.
Vinuya, Ferdinand. “Testing for Market Integration and the Law of One Price in World
Shrimp Markets.” Selected paper prepared for presentation at the Southern
Agricultural Economics Association Annual Meeting, Orlando, Florida, February
5-8, 2006. AgEcon Search.
Wailes, Eric J. 2004. “Global Trade and Protection Regimes in Rice Trade.” Global
Agricultural Trade and Developing Countries. Chapter 10, pp 177-194.
Washington D.C. The World Bank.
Wang, Yanging and Sam Johnson. 2007. “The Status of GM Rice in R&D in China.”
Nature Biotechnology: 25(7), pp 717-718.

88
Zohrabyan, Tatevik, David Leatham and David Bessler. “Cointegration Analysis of
Regional House Prices in the U.S.” Proceedings of Regional Research Committee
NC-1014 St. Louis, Missouri October 4-5, 2007. Dr. Michael A. Gunderson,
Editor.

APPENDICES

90
APPENDICIES
Table A. The Definitions of Variables
Variables Definitions
US Export U.S. rice price (U.S. dollar/cwt)
source: U.S. Long Grain Texas. ERS, USDA
TH Export Thailand rice price (U.S. dollar/cwt)
source: Thai 100% Grade B. ERS, USDA
VT_DWP Export Vietnam rice price (U.S. dollar/cwt)
source: Vietnam 5% Broken, Double Water Polished. ERS,
USDA
VT_BKN Export Vietnam rice price (U.S. dollar/cwt)
source: Vietnam 5% Broken. ERS, USDA
IN_PARB Export India rice price (U.S. dollar/cwt)
source: India 5% Broken Parboiled. ERS, USDA
EVENT0 Period before the contamination event, August 2006
EVENT1 Period after the contamination event, August 2006
UST Export U.S. rice price change (U.S. dollar/cwt)
source: U.S. long grain Texas. ERS, USDA
THT Export Thai rice price change (U.S. dollar/cwt)
source: Thai 100% Grade B. ERS, USDA
VT_DWPT Export Vietnam rice price change (U.S. dollar/cwt)
source: Vietnam 5% Broken, Double Water Polished. ERS,
USDA
VT_BKNT Export Vietnam rice price change (U.S. dollar/cwt)
source: Vietnam 5% Broken. ERS, USDA
IN_PARBT Export India rice price change (U.S. dollar/cwt)
source: India 5% Broken Parboiled. ERS, USDA
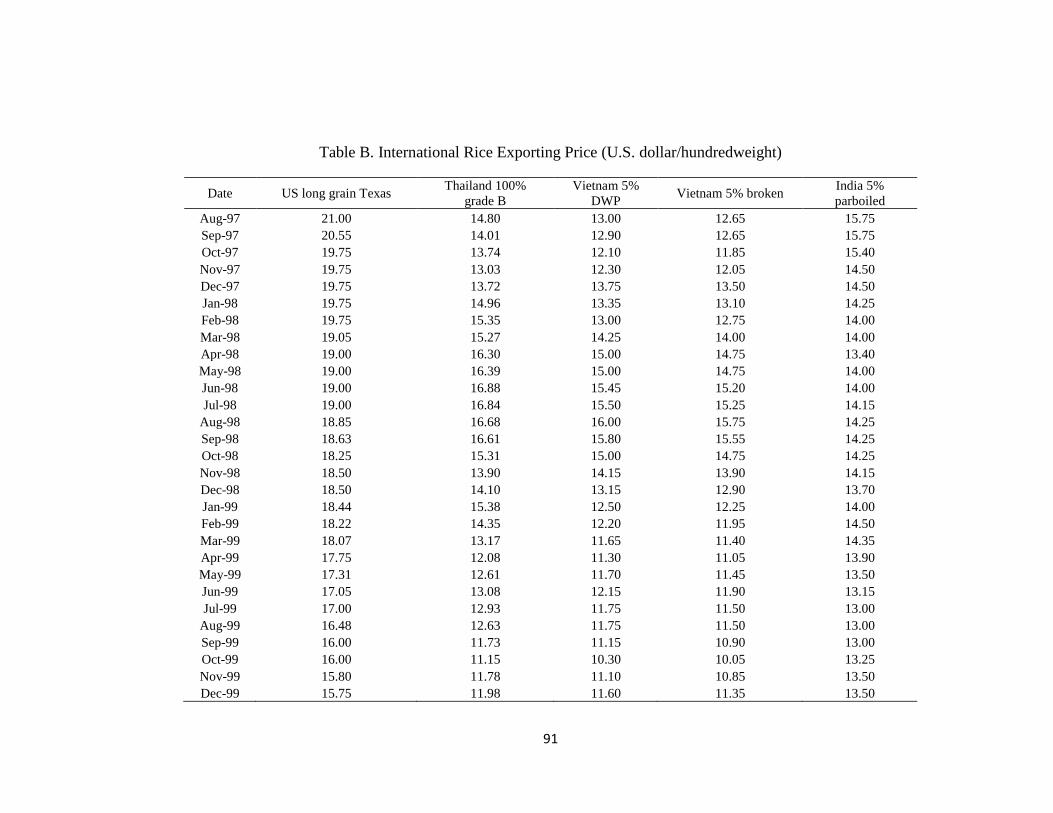
91
Table B. International Rice Exporting Price (U.S. dollar/hundredweight)
Date US long grain Texas Thailand 100%
grade B
Vietnam 5%
DWP Vietnam 5% broken
India 5%
parboiled
Aug-97 21.00 14.80 13.00 12.65 15.75
Sep-97 20.55 14.01 12.90 12.65 15.75
Oct-97 19.75 13.74 12.10 11.85 15.40
Nov-97 19.75 13.03 12.30 12.05 14.50
Dec-97 19.75 13.72 13.75 13.50 14.50
Jan-98 19.75 14.96 13.35 13.10 14.25
Feb-98 19.75 15.35 13.00 12.75 14.00
Mar-98 19.05 15.27 14.25 14.00 14.00
Apr-98 19.00 16.30 15.00 14.75 13.40
May-98 19.00 16.39 15.00 14.75 14.00
Jun-98 19.00 16.88 15.45 15.20 14.00
Jul-98 19.00 16.84 15.50 15.25 14.15
Aug-98 18.85 16.68 16.00 15.75 14.25
Sep-98 18.63 16.61 15.80 15.55 14.25
Oct-98 18.25 15.31 15.00 14.75 14.25
Nov-98 18.50 13.90 14.15 13.90 14.15
Dec-98 18.50 14.10 13.15 12.90 13.70
Jan-99 18.44 15.38 12.50 12.25 14.00
Feb-99 18.22 14.35 12.20 11.95 14.50
Mar-99 18.07 13.17 11.65 11.40 14.35
Apr-99 17.75 12.08 11.30 11.05 13.90
May-99 17.31 12.61 11.70 11.45 13.50
Jun-99 17.05 13.08 12.15 11.90 13.15
Jul-99 17.00 12.93 11.75 11.50 13.00
Aug-99 16.48 12.63 11.75 11.50 13.00
Sep-99 16.00 11.73 11.15 10.90 13.00
Oct-99 16.00 11.15 10.30 10.05 13.25
Nov-99 15.80 11.78 11.10 10.85 13.50
Dec-99 15.75 11.98 11.60 11.35 13.50

92
International Rice Exporting Price (U.S. dollar/hundredweight)-Continue1
Date US long grain Texas Thailand 100%
grade B
Vietnam 5%
DWP Vietnam 5% broken
India 5%
parboiled
Jan-00 15.55 12.41 11.70 11.45 13.50
Feb-00 15.25 12.58 10.75 10.50 13.50
Mar-00 15.00 11.74 9.90 9.70 13.50
Apr-00 14.84 11.25 9.00 8.75 13.50
May-00 14.48 10.54 8.90 8.65 12.60
Jun-00 14.38 10.49 9.00 8.75 12.50
Jul-00 14.43 9.94 9.35 9.15 12.50
Aug-00 14.50 9.66 9.35 9.15 12.30
Sep-00 14.56 9.23 9.00 8.80 12.00
Oct-00 14.95 9.62 9.20 8.95 12.00
Nov-00 15.00 9.55 9.05 8.80 11.65
Dec-00 15.00 9.49 8.70 8.50 11.50
Jan-01 15.00 9.51 8.50 8.40 11.50
Feb-01 15.00 9.49 8.30 8.15 11.50
Mar-01 15.00 9.08 7.70 7.55 11.50
Apr-01 15.00 8.49 7.50 7.40 11.50
May-01 15.00 8.58 7.65 7.55 11.00
Jun-01 15.00 8.83 7.80 7.70 9.00
Jul-01 15.00 8.85 8.05 7.95 8.50
Aug-01 14.81 8.71 8.90 8.80 8.55
Sep-01 14.25 8.89 8.75 8.65 8.50
Oct-01 14.00 8.72 8.90 8.80 8.40
Nov-01 13.63 8.97 9.65 9.55 8.35
Dec-01 12.75 9.22 9.70 9.60 8.25
Jan-02 12.75 9.85 9.70 9.60 8.25
Feb-02 12.25 10.05 9.35 9.25 8.25
Mar-02 11.92 9.88 8.70 8.60 8.25
Apr-02 12.30 9.79 9.35 9.25 8.25
May-02 12.30 10.35 9.50 9.40 8.25
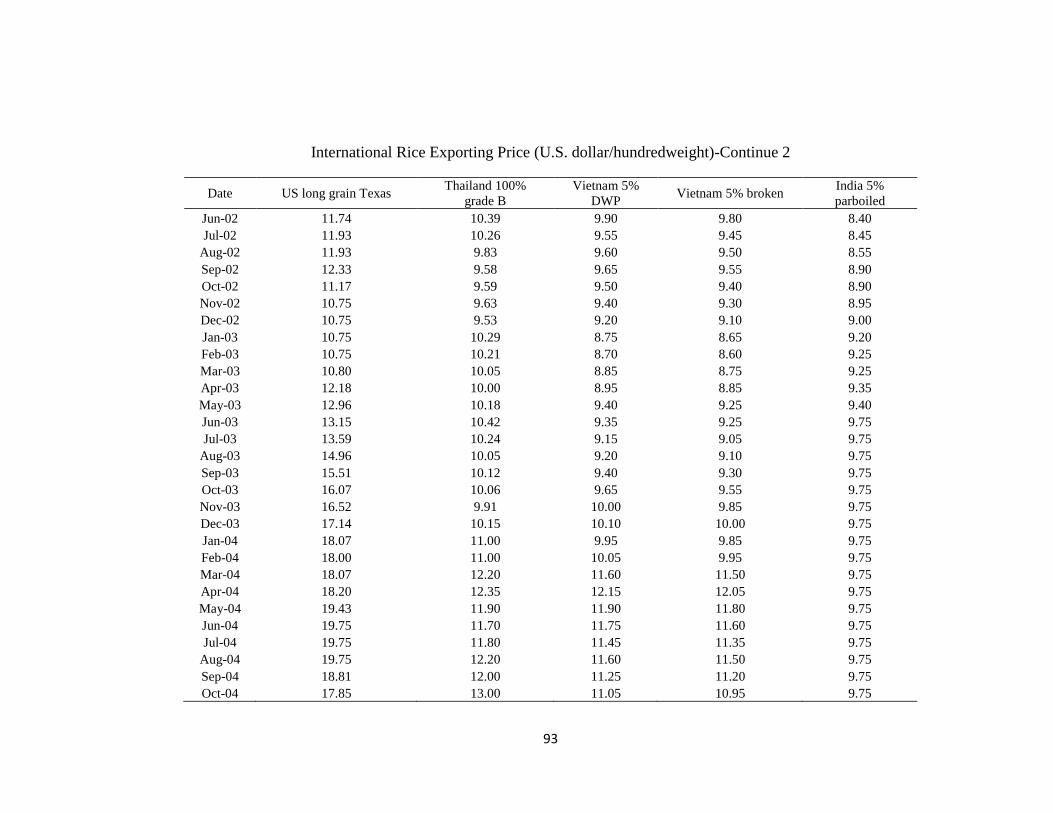
93
International Rice Exporting Price (U.S. dollar/hundredweight)-Continue 2
Date US long grain Texas Thailand 100%
grade B
Vietnam 5%
DWP Vietnam 5% broken
India 5%
parboiled
Jun-02 11.74 10.39 9.90 9.80 8.40
Jul-02 11.93 10.26 9.55 9.45 8.45
Aug-02 11.93 9.83 9.60 9.50 8.55
Sep-02 12.33 9.58 9.65 9.55 8.90
Oct-02 11.17 9.59 9.50 9.40 8.90
Nov-02 10.75 9.63 9.40 9.30 8.95
Dec-02 10.75 9.53 9.20 9.10 9.00
Jan-03 10.75 10.29 8.75 8.65 9.20
Feb-03 10.75 10.21 8.70 8.60 9.25
Mar-03 10.80 10.05 8.85 8.75 9.25
Apr-03 12.18 10.00 8.95 8.85 9.35
May-03 12.96 10.18 9.40 9.25 9.40
Jun-03 13.15 10.42 9.35 9.25 9.75
Jul-03 13.59 10.24 9.15 9.05 9.75
Aug-03 14.96 10.05 9.20 9.10 9.75
Sep-03 15.51 10.12 9.40 9.30 9.75
Oct-03 16.07 10.06 9.65 9.55 9.75
Nov-03 16.52 9.91 10.00 9.85 9.75
Dec-03 17.14 10.15 10.10 10.00 9.75
Jan-04 18.07 11.00 9.95 9.85 9.75
Feb-04 18.00 11.00 10.05 9.95 9.75
Mar-04 18.07 12.20 11.60 11.50 9.75
Apr-04 18.20 12.35 12.15 12.05 9.75
May-04 19.43 11.90 11.90 11.80 9.75
Jun-04 19.75 11.70 11.75 11.60 9.75
Jul-04 19.75 11.80 11.45 11.35 9.75
Aug-04 19.75 12.20 11.60 11.50 9.75
Sep-04 18.81 12.00 11.25 11.20 9.75
Oct-04 17.85 13.00 11.05 10.95 9.75

94
International Rice Exporting Price (U.S. dollar/hundredweight)-Continue 3
Date US long grain Texas Thailand 100% grade
B
Vietnam 5%
DWP Vietnam 5% broken
India 5%
parboiled
Nov-04 17.75 13.30 11.55 11.50 13.55
Dec-04 17.75 14.15 12.00 11.95 13.55
Jan-05 17.42 14.70 12.65 12.55 14.10
Feb-05 17.38 14.80 13.40 13.30 14.60
Mar-05 17.06 14.90 13.20 13.15 14.75
Apr-05 16.50 15.10 12.85 12.80 14.50
May-05 16.50 15.00 12.60 12.55 14.25
Jun-05 16.50 14.55 12.05 12.00 14.30
Jul-05 16.13 14.10 12.10 12.05 14.30
Aug-05 16.00 14.45 12.80 12.75 14.00
Sep-05 16.00 14.55 12.80 12.75 13.20
Oct-05 16.20 14.60 13.30 13.20 13.35
Nov-05 16.25 14.15 13.30 13.20 13.65
Dec-05 16.31 14.30 13.30 13.20 13.65
Jan-06 18.17 14.90 13.25 13.15 13.50
Feb-06 18.25 15.35 13.20 13.10 13.40
Mar-06 18.50 15.40 12.65 12.55 13.40
Apr-06 18.50 15.45 12.15 12.05 13.30
May-06 18.63 15.70 12.95 12.85 13.25
Jun-06 18.75 15.95 13.20 13.10 13.25
Jul-06 18.75 16.05 13.20 13.10 13.10
Aug-06 19.13 15.95 13.40 13.30 13.10
Sep-06 21.00 15.90 13.60 13.50 13.00
Oct-06 21.27 15.35 13.90 13.80 13.10
Nov-06 21.38 15.10 14.85 14.75 13.25
Dec-06 21.38 15.60 14.85 14.75 13.25
Jan-07 21.38 16.00 14.85 14.75 13.25
Feb-07 21.38 16.15 14.85 14.75 13.40
Mar-07 21.31 16.35 15.15 15.00 13.65

95
International Rice Exporting Price (U.S. dollar/hundredweight)-Continue 4
Date US long grain Texas Thailand 100%
grade B
Vietnam
5% DWP Vietnam 5% broken
India 5%
parboiled
Apr-07 21.25 16.20 15.15 15.00 13.40
May-07 21.25 16.25 15.00 15.00 13.95
Jun-07 21.25 16.55 15.15 15.00 14.15
Jul-07 21.25 16.75 15.35 15.00 15.00
Aug-07 21.25 16.70 15.80 15.00 15.75
Sep-07 21.25 16.60 16.00 15.00 15.55
Oct-07 22.05 16.85 16.00 15.00 15.75
Nov-07 22.63 17.45 16.00 15.00 15.75
Dec-07 22.78 18.40 16.00 15.00 15.75
Jan-08 23.72 19.20 19.05 15.00 15.75
Feb-08 25.84 23.70 23.35 15.00 15.75
Mar-08 28.60 30.75 29.40 15.00 15.75
Apr-08 36.38 46.45 41.50 15.00 15.75
May-08 43.00 47.45 53.75 15.00 15.75
Jun-08 43.40 39.45 44.15 15.00 15.75
Jul-08 44.00 37.80 35.60 15.00 15.75
Aug-08 44.00 35.45 29.40 15.00 15.75
Sep-08 40.75 35.05 28.30 15.00 15.75
Oct-08 38.00 31.70 23.25 15.00 15.75
Nov-08 36.00 28.70 20.65 15.00 15.75
Dec-08 34.25 27.40 20.95 15.00 15.75
Jan-09 32.63 29.90 19.95 15.00 15.75
Feb-09 30.88 30.75 21.65 15.00 15.75
Mar-09 29.63 30.75 22.75 15.00 15.75
Apr-09 27.63 28.60 23.00 15.00 15.75
May-09 27.63 27.35 22.85 15.00 15.75
Jun-09 27.63 29.60 20.75 15.00 15.75
Jul-09 27.03 30.10 20.25 15.00 15.75
Aug-09 26.38 27.65 19.65 15.00 15.75
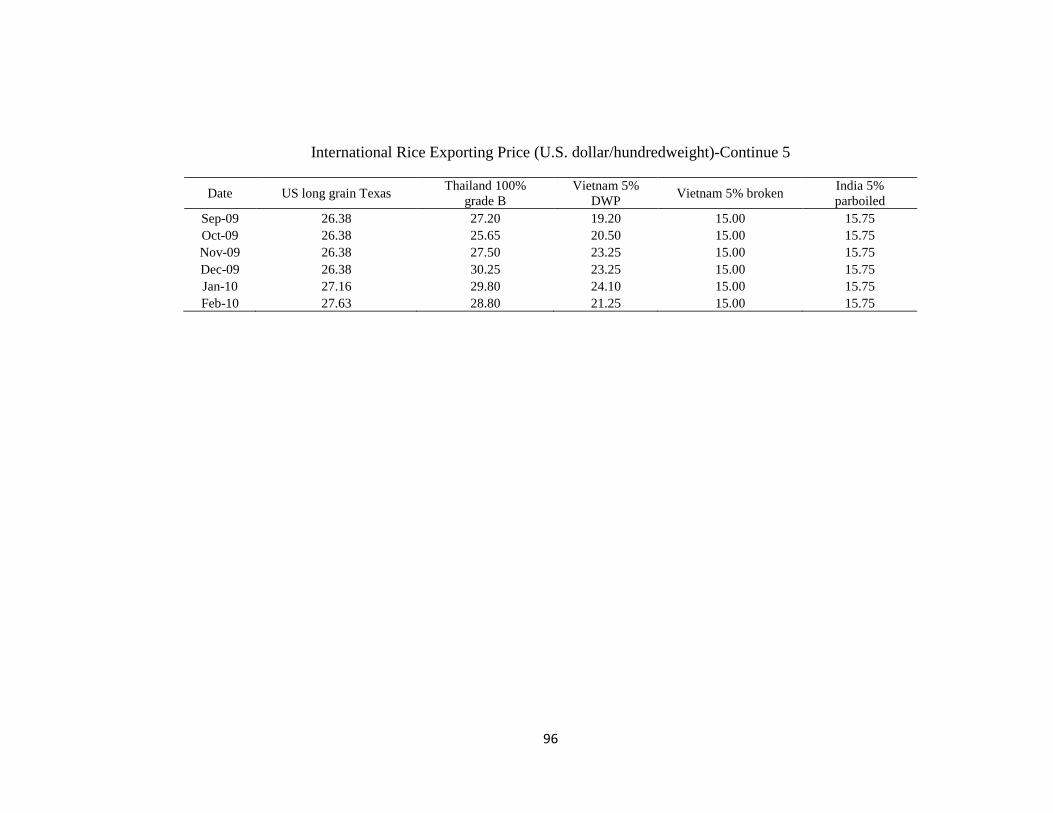
96
International Rice Exporting Price (U.S. dollar/hundredweight)-Continue 5
Date US long grain Texas Thailand 100%
grade B
Vietnam 5%
DWP Vietnam 5% broken
India 5%
parboiled
Sep-09 26.38 27.20 19.20 15.00 15.75
Oct-09 26.38 25.65 20.50 15.00 15.75
Nov-09 26.38 27.50 23.25 15.00 15.75
Dec-09 26.38 30.25 23.25 15.00 15.75
Jan-10 27.16 29.80 24.10 15.00 15.75
Feb-10 27.63 28.80 21.25 15.00 15.75

97
VITA
Graduate School
Southern Illinois University
Mana-anya Iemsam-arng Date of Birth: February 23, 1985
756 N. Lake Drive, Du Quoin, IL 62832
11 Lane 7B, Paaton Road, Amphur Muang, Chiangmai, Thailand 50300
MaeJo University, Thailand
Bachelor of Science, Post Harvest Technology, May 2007
Thesis Title: Contamination Events and Linkages in World Rice Markets
Major Professor: Dr. Dwight Sanders