Embed Size (px)
Citation preview

CONTAMINATION AND SURFACE PREPARATION EFFECTS ON COMPOSITE BONDING
Eileen O. Kutscha1, Paul G. Vahey1, Marcus A. Belcher1, Peter J. VanVoast1, William B. Grace1, Kay Y. Blohowiak1, Frank L. Palmieri2, John W. Connell2
1Boeing Research and Technology
Seattle, WA 98124 USA
2National Aeronautics and Space Administration Langley Research Center
Hampton, VA 23681 USA
ABSTRACT
Results presented here demonstrate the effect of several prebond surface contaminants (hydrocarbon, machining fluid, latex, silicone, peel ply residue, release film) on bond quality, as measured by fracture toughness and failure modes of carbon fiber reinforced epoxy substrates bonded in secondary and co-bond configurations with paste and film adhesives. Additionally, the capability of various prebond surface property measurement tools to detect contaminants and potentially predict subsequent bond performance of three different adhesives is also shown. Surface measurement methods included water contact angle, Dyne solution wettability, optically stimulated electron emission spectroscopy, surface free energy, inverse gas chromatography, and Fourier transform infrared spectroscopy with chemometrics analysis. Information will also be provided on the effectiveness of mechanical and energetic surface treatments to recover a bondable surface after contamination. The benefits and drawbacks of the various surface analysis tools to detect contaminants and evaluate prebond surfaces after surface treatment were assessed as well as their ability to correlate to bond performance. Surface analysis tools were also evaluated for their potential use as in-line quality control of adhesive bonding parameters in the manufacturing environment.
INTRODUCTION
This work was performed as part of NASA’s Advanced Composites Program. Benefits of the project are outlined below. Bonding System Assessment – Contamination and Surface Preparation Effects A bonding system is comprised of the substrate(s), surface treatment(s), adhesive, and process to form the adhesive bond. Changing any one of these can affect bond performance. Substrate, surface preparation, adhesive, and contaminant effects on bond performance reported here provides initial direction to the industry in selecting a bonding system. Results presented here identified certain parameters that have more of an impact on bond performance than others. This work provides a better understanding of the effects of different types of contaminants and surface preparations on bond performance with select adhesives.
https://ntrs.nasa.gov/search.jsp?R=20170006189 2020-07-11T08:16:14+00:00Z

Bonding System Evaluation Methods for Pre-Certification Testing The number of reworks in the development process and the timeline to certification can be reduced by early identification of bonding systems with good performance. This effort evaluates the effect of surface preparations, adhesives, bonding processes, and contaminants on bond performance utilizing the double cantilever beam (DCB) test. The DCB coupon configuration stresses the substrate-adhesive interface and is sensitive to detecting the effects of prebond surface conditions on adhesion. Utilization of the various test methods investigated herein can identify threats at the substrate-adhesive interface for a specific bonded system under consideration. Surface Analysis Tool Capabilities for In-Line Bond Process Monitoring and Control Guaranteed bond reliability and robustness will enable higher usage of bonded joints in service which can potentially result in subsequent cost savings. Strict process control can provide verification of surface treatment, surface consistency and cleanliness, and subsequently bond reliability in alignment with recommendations in Federal Aviation Administration (FAA) Advisory Circular AC 20-107B. This work identified limits and thresholds for bonding process control based on output of analytical tools used to measure the prebond surface. Understanding the limits and capabilities of the analytical methods is critical to whether they can be used in bond process monitoring. Work here demonstrated that surface analysis methods must be tailored to the specific bonding system in order to capture the benefits. Targeting resources in areas of value - Savings of Time and Money Better understanding the threat level of various contaminants can be utilized to better direct resources to areas of greatest need. Knowing the impact of various contaminants on bond performance can assist in defining realistic requirements for process environment controls. Contaminants requiring the highest level of controls can be identified or eliminated from the production environment entirely. Cost savings can be captured in avoiding attempts to control every material and thereby avoiding implementation of unnecessary requirements. Thus, resources can be focused on targeting the highest risk contaminants that are known to impact bond performance.
EXPERIMENTATION
Composite panel fabrication
DCB adherends were constructed using 10 plies of 177 ºC (350ºF) cure carbon fiber epoxy prepreg. The eight inner plies were unidirectional tape (Torayca [P2352W-19] T800S/3900-2B UD) and the two outer plies were fabric [Torayca (FM6673G-37K) T830H-6K-PW/3900-2D]. Witness panels for surface analysis were fabricated using only two plies of the fabric prepreg. Panels were cured against a tool treated with Frekote 710NC mold release agent (control), against a 1-3 mil thick, non-perforated, fluorinated ethylene propylene (FEP) film on a tool, or with one of two different peel plies: Precision Fabrics Group 60001/049/0009 polyester peel ply (PP) or Style 52006 nylon peel ply (NY). Panels without peel ply were solvent wiped with Eastman™ methyl propyl ketone (MPK) prior to any surface treatment using cleaning cloths meeting the requirements of AMS3819B Class 2 Grade A.

Contaminant application
After peel ply removal and before surface treatment, contaminants were applied to the prebond surfaces using an airbrush or high-volume, low-pressure (HVLP) spray gun (Figure 1) at coat weights shown in Table 1. Coat weights were determined by weight using a 102 x 152 x 0.51 mm (4 x 6 x 0.02 in) clad aluminum witness panel.
Figure 1. Spray application of diluted contaminants onto panels with HVLP spray gun Table 1. Contaminant target and actual coat weights
Target Actual
Witness μg/cm2
Actual DCB μg/cm2
mg/ft2 μg/cm2 Avg St
Dev Avg
St Dev
Frekote 710NC (silicone) (FK)
Low 2 2 1.9 1.1 0.8 0.5 High 8 9 11 2.8 5 0.0
Chain Lube (hydrocarbon) (HC)
Low 10 11 14 3 12 3 High 50 54 43 12 57 4
Syntilo9828 (machining fluid) (MF)
Low 10 11 6.5 0.91 8.3 0.91 High 50 54 51 2.3 64 8.7
latex glove extract (LG)
Low 2 2 1.9 0 1.6 0.46 High 8 9 * 29 8.2 7 0.0
*inadvertently high application of contaminant
Contaminants were diluted in hexanes (FK, HC), isopropyl alcohol (MF) or analytical grade methyl propyl ketone (LG) prior to application. Latex glove extract was generated by soaking gloves in MPK for approximately 30 days. It should be noted that contaminants were applied at levels beyond what is normally seen in production except in the case of Frekote which can be found on tool surfaces in this range and bond failures are known to occur at these levels.
Surface treatments
After contamination, panels were surface treated by grit blasting (GB) using 180 grit aluminum oxide, random orbital sanding (ROS) using 180 grit aluminum oxide Merit sand paper, or energetic surface treatment with laser ablation (LR) or plasma (PL). Laser ablation was performed at NASA Langley Research Center using a PhotoMachining, Inc. system with a Coherent®, Avia®, frequency tripled, Nd:YAG laser (7 W nominal pulsed output at 355 nm and 10 ns pulse duration)

with a speed of 25.4 cm/s (10 in/s) and an average fluence of 19.4 mJ/mm2. Atmospheric pressure plasma treatment was performed at Boeing using a Plasmatreat system consisting of five RD1004 heads each with a 17° nozzle tip at one operating parameter set.
DCB coupon bonding and test
DCB assemblies were secondarily bonded using Henkel™ EA9696 0.06 psf 121ºC (250ºF) cure film adhesive cured in an autoclave or Henkel™ EA9394 paste adhesive cured at 82ºC (180ºF) in a press or co-bonded using 3M™ Scotch-Weld™ AF 555M 0.05 psf 177ºC (350ºF) cure film adhesive. Bonded coupon configuration is shown in Figure 2.
Figure 2. DCB coupon bonding configuration using EA9696 film
Coupons were tested in accordance with ASTM D 5528 at a loading rate of 1 inch (25mm) per min after the specimen was precracked by hand. The propagated strain energy release rate G1P, or fracture toughness, was calculated using the area under the load displacement curve in accordance with Equation 1.
G1P = E / (A x B) Eq 1
E – area of the load deflection curve between the initial and final crack positions A – crack length extension corresponding to E, initial crack tip to final crack tip B – specimen width
Surface Analysis
Prebond surfaces before and after surface treatment were characterized using the following: 1) ballistic drop deposition water contact angle (WCA) measured with a Surface Analyst Model SA1001 from BTG, 2) Dyne solution wettability based on methods in ASTM D 2578 using solutions between 30 and 70 dyne/cm from Accu Dyne TestTM, 3) optically stimulated electron emission (OSEE) using an ultraviolet light prototype instrument at NASA Langley Research Center, 4) surface free energy (SFE) calculated using sessile drop contact angles of deionized water, diiodomethane, and ethylene glycol measured using a Krüss DSA100 Drop Shape Analysis system, and 5) inverse gas chromatography (IGC) using an SMS-IGC from Surface Measurement Systems, London, UK with a thin film cell clamp attachment. Chemical signature information was gathered using Fourier transform infrared (FTIR) spectroscopy measured using an Agilent model 4100 "Exoscan" spectrometer with a spherical diamond attenuated total reflectance (D-ATR) attachment. Spectra were collected from panels by placing the D-ATR directly on the surface and

also using a residue method. The residue method eliminates the effect of the composite background by lifting the D-ATR off the surface prior to data collection. Chemometrics on FTIR spectra was performed with Unscrambler® X Version 10.3 software from Camo Software and principal component analysis (PCA).
RESULTS
Bonding Results
The effects of contaminants and surface preparation on fracture toughness and failure mode of DCB coupons are shown below in Figure 3 and
Figure 4 for EA9696 121ºC (250°F) cure film adhesive, Figure 5 and Figure 6 for EA9394 180°F cure, paste adhesive, and
Figure 8 and Figure 9 for AF 555M 350°F cure film adhesive. Baseline fracture toughness values are shown for comparison and were selected based on test data generated here or supplier values for the adhesive found in their technical data sheets. Contaminants were applied at levels beyond what is normally seen in production except in the case of Frekote. Frekote at levels applied here can be found in production at these coat weights on tools surfaces and bond failures are known to occur in these ranges.
Figure 3. DCB results for EA9696 250°F film adhesive after contamination or surface preparation, as-tooled surfaces (left) and peel ply surfaces (right)
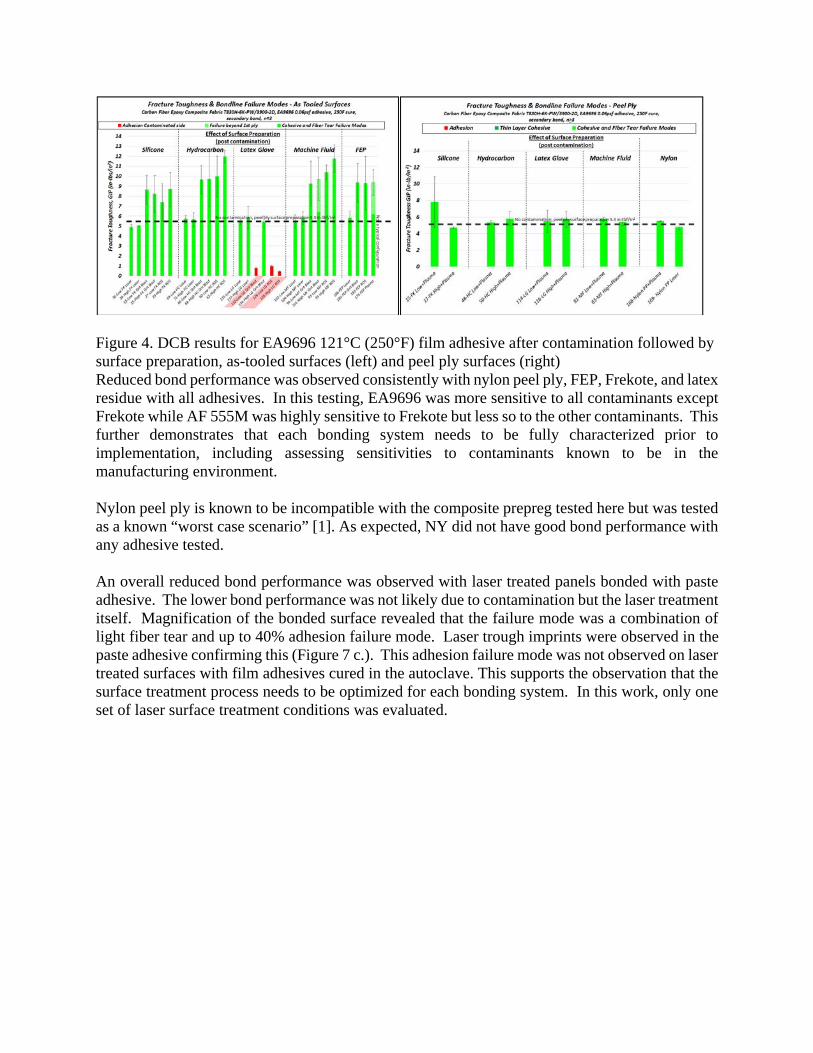
Figure 4. DCB results for EA9696 121°C (250°F) film adhesive after contamination followed by surface preparation, as-tooled surfaces (left) and peel ply surfaces (right) Reduced bond performance was observed consistently with nylon peel ply, FEP, Frekote, and latex residue with all adhesives. In this testing, EA9696 was more sensitive to all contaminants except Frekote while AF 555M was highly sensitive to Frekote but less so to the other contaminants. This further demonstrates that each bonding system needs to be fully characterized prior to implementation, including assessing sensitivities to contaminants known to be in the manufacturing environment. Nylon peel ply is known to be incompatible with the composite prepreg tested here but was tested as a known “worst case scenario” [1]. As expected, NY did not have good bond performance with any adhesive tested.
An overall reduced bond performance was observed with laser treated panels bonded with paste adhesive. The lower bond performance was not likely due to contamination but the laser treatment itself. Magnification of the bonded surface revealed that the failure mode was a combination of light fiber tear and up to 40% adhesion failure mode. Laser trough imprints were observed in the paste adhesive confirming this (Figure 7 c.). This adhesion failure mode was not observed on laser treated surfaces with film adhesives cured in the autoclave. This supports the observation that the surface treatment process needs to be optimized for each bonding system. In this work, only one set of laser surface treatment conditions was evaluated.

Figure 5. DCB results for EA9394 paste adhesive after contamination or surface preparation, as-tooled surfaces (left) and peel ply surfaces (right)
Figure 6. DCB results for EA9394 paste adhesive after contamination followed by surface preparation, as-tooled surfaces (left) and peel ply surfaces (right)
Figure 7. EA9394 paste bonded panels with visible troughs indicating “adhesion” failure mode between adhesive and substrate on laser treated substrates
a. b. c.
~10mm ~100 μm ~250 μm

Figure 8. DCB results for AF 555M 177°C (350°F) film adhesive after contamination or surface preparation, as-tooled surfaces (left) and peel ply surfaces (right)
Figure 9. DCB results for AF 555M 177°C (350°F) film adhesive after contamination followed by surface preparation, as-tooled surfaces (left) and peel ply surfaces (right) Pre-bond composite surfaces cured against a tool with FEP did not have good subsequent bond performance either. The FTIR residue method identified that some FEP material was left behind on the cured composite surface (Figure 10).
Figure 10. Detection of FEP with FTIR residue method
Cured on FEP FEP
Cured on Tool, no FEP

Previous work using X-ray photoelectron spectroscopy (XPS) confirmed FTIR results and showed fluorine does transfer to the surface of a composite panels from FEP [2]. All bonded panels were compacted with red perforated FEP with no observable impact to bond performance. Heat during cure may play a role in residue transfer of the FEP residue.
A summary of the bond performance results are shown in Table 2. Table 2. Summary of bond performance results of three adhesives
In general, as-tooled surfaces were more sensitive to contaminants than peel ply treated surfaces prior to surface treatment. Surface preparation prior to bonding enabled good bond performance with the tested film adhesives, regardless of type or level of contamination. AF 555M cured at 177°C (350°F) with a low viscosity during cure in particular was more able to accommodate the presence of all contaminants after surface treatments. The paste adhesive tested here, however, had more difficulty overcoming the knockdown from the presence of contaminants in the bondline even after surface treatment. Because it is not clear whether adhesive cure temperature, bonding process (press versus autoclave), adhesive chemistry, or surface treatment affected the bond performance, testing of the specific bonding system to optimize performance is required early on in the development phase.
Surface Analysis
Ballistic drop deposition water contact angle (WCA) measurements
WCA measurements are shown in Figure 11 for as-tooled and peel ply surfaces. Results demonstrated that ballistic WCA was capable of differentiating between uncontaminated and contaminated surfaces. The one exception was that ballistic WCA was not able to differentiate

between polyester and nylon peel ply surfaces. Ballistic WCA was also able to differentiate between surfaces with and without surface treatment with the exception of as-tooled surfaces as shown in Figure 12.
Figure 11. Ballistic WCA - Effect of contaminants – as-tooled (left) and peel ply surfaces (right)
Figure 12. Ballistic WCA - Effect of surface preparations
Dyne solution wettability
Effect of surface preparation and contamination is shown in Figure 13 for as-tooled and peel ply surfaces. In some cases, Dyne solution wettability was able to detect the presence of contaminants. For example, the surface energy decreased significantly with FEP and silicone on as-tooled surfaces, which also correlated to poor bond performance. In other cases, the contaminants were detected but the surface wettability increased contrary to the expected result.
Dyne solutions were able to easily detect laser, ROS, and GB surface treatments on as-tooled and peel ply surfaces as dyne solutions will completely wet out on abraded surfaces (Figure 14). Dyne solutions were not able to detect plasma treatment of as-tooled surfaces or the difference between as-tooled and NY or PP surface which all had a dyne solution reading of 42 dyne/cm.

Figure 13. Effect of surface preparation and contamination on dyne solution results, as-tooled surfaces (left) and peel ply surfaces (right)
Figure 14. Example of dyne solutions applied to unsanded, as-tooled side (left) and grit blasted surfaces (right)
Optically stimulated electron emission spectroscopy (OSEE)
OSEE spectroscopy results from panels treated with various contaminants demonstrated that the technique could distinguish between a clean baseline panel and contaminated panels except for machining fluid ( Figure 15). Additionally, results showed that ROS, GB, and laser treated panels were “cleaner” than the baseline clean and contaminated panels. However, there were some incongruous results with the contaminated panels that received subsequent abrasion. The contaminated and surface treated panels appeared cleaner than the baseline panel. These incongruous results may be due to the fact that this technique is more sensitive at lower concentrations. Additionally, the OSEE technique is sensitive to the amount of exposed fiber and epoxy resin on the surface. A surface preparation that removes epoxy resin as it removes contamination may result in a stronger OSEE signal that could easily exceed the signal measured from the baseline material.

Figure 15. OSEE - Effect of surface preparation
Surface free energy (SFE)
Surface free energy (SFE) values for contaminated surfaces are shown in Figure 16. For peel ply surfaces, limited data were available due to the irregular droplet shapes, particularly on highly contaminated, peel ply surfaces. On as-tooled surfaces, SFE was reduced with FEP and FK (silicone) as would be expected. There was an expected inverse correlation with machining fluid based on previous ballistic WCA measurements. Inconclusive results were obtained with the other contaminants.
Figure 16. Surface free energy ability to detect contaminants, as-tooled surfaces (left) and peel ply surfaces (right) SFE was a good indicator of all surface treatments as shown in Figure 17. There is some indication that the dispersive component may provide more information than the polar component, except in the case of machining fluid. Overall, SFE was not a good indicator of bond performance.

Figure 17. Surface free energy ability to detect surface preparations, polar and dispersive components
Inverse gas chromatography
Only selected panels were evaluated with IGC due to the 12 hour measurement time required. Error of the IGC method has been demonstrated to be quite low [3] so these differences can be considered to be statistically significant. IGC was not successful at distinguishing machining fluid from non-contaminated panels (data not shown). However, the IGC dispersive component and the acetone polar component did differentiate between no, low, and high FK on as-tooled surfaces (Figure 18). Additionally some expected differences were observed on peel ply panels with low Frekote and plasma treatment (Figure 19). On all other surface energy measurement methods (Dyne, WCA, SFE), the plasma treated samples had extremely high surface energy or low contact angle values. This same trend was not observed with IGC. However, these panels were not measured immediately after plasma treatment.
Figure 18. IGC detection of Frekote levels – Dispersive Surface Energy (left) and Acetone polar component (right)

Figure 19. IGC detection of plasma and low Frekote – Dispersive Surface Energy (left) and Acetone polar component (right)
FTIR and Chemometrics
Chemometrics analyses of FTIR data presented here focused on the as-tooled surfaces as those were the most affected by applied contaminants. Principal components analysis (PCA) of the FTIR residue data showed clustering of surface contamination data in Figure 20 (left). The PC-2 versus PC-1 scores plot shows no contamination at the center "bullseye" cluster and more highly contaminated samples farther away from the center. Such clustering of data can be used to sort degree of contamination. A PCA scores plot showing the effect of different surface treatments within the FTIR data is shown in Figure 20 (right). There is an apparent difference between the untreated composite surface (NA) and all of the other surface treatments. It is thought that these differences reflect the amount and state of the resin remaining on the surface after treatment. With more "training" these models can be used with the handheld FTIR Exoscan instrument to identify the presence of contaminants or surface treatments.
Figure 20. Chemometrics of FTIR residue data, detection of contaminants (left) and surface treatments (right)

Overall, chemometrics was able to differentiate between high and low contaminant levels and was able to detect contaminants known to be a threat to bond performance on as-tooled surfaces including FEP and Frekote and latex residues. Chemometrics analysis was also able to detect and differentiate between different surface treatments.
Summary of Surface Analysis Methods
A summary of the surface analysis tools is shown below in Table 3 along with capabilities, benefits, and limitations.
Table 3. Surface analysis tool assessment Detection of
Contaminants Detection of Surface Preparation
Correlate to bond performance
Benefits Limitations
Surface Energy – Goniometer
Selected contaminants as-tooled surface only
Yes Minimal Frekote and FEP on as-tooled surfaces only
Collects both polar and dispersive components. Portable unit available
Small detection area Introduces contaminants to surface. Some fluids are hazardous. More time consuming. Difficulty measuring on peel ply surfaces.
IGC Selected (limited panels measured)
minimal Measures large area Potential for method to be tuned to a known contaminant with a specific probe molecule. No contamination of surface
Time consuming, Not portable yet - Requires pressurized gas flow and sophisticated equipment and data post processing Does not detect all contaminants.
FTIR residue – chemometrics
Yes Type and amount of contaminants
Yes NA – complex correlation to selected peak height or area required
Portable, fast Tune-able to specific contaminants No contamination of surface After initial calibration does not require post processing of data
Small detection area May be affected by surface roughness. Process parameters are more difficult to identify than type/amount of contaminant
FTIR direct – chemometrics
Identified higher concentration contaminants that were detrimental to bond performance.
NA – complex correlation to selected peak height or area required
See above See above
Brighton Water Contact Angle
Yes except Nylon PP
Yes In presence of contaminant or PP (not good on as-tooled surfaces)
No Frekote on as-tooled only
Handheld, portable unit Correlates to contaminant and surface treatment well
Small detection area Difficult droplet detection on some surfaces
Dyne Solutions Generally Yes Not on plasma
No FEP, Laser and GB only
Portable Low tech Provides information about surface energy properties
Small detection area Limitation on high and low surface energies that can be measured Sensitive to operator technique Chemicals are hazardous Introduces contaminants to surface.
OSEE Yes except machining fluid
Yes No Frekote only
Successful and detecting contaminants and surface treatments
Requires argon purge and flat surface,

Detection of Contaminants
Detection of Surface Preparation
Correlate to bond performance
Benefits Limitations
Larger detection area contaminant must be photo emitter
FTIR (no chemometrics)
Yes Yes Would require detailed peak area or height analysis Depends upon type and amount of contaminant
Handheld, portable unit No contamination of surface
Small detection area FTIR will detect unknown contaminants but data analysis and interpretation required to ID them.
The suite of analytical tools tested here are capable of evaluating pre-bond surfaces but must be tailored to the specific bonded system being evaluated.
CONCLUSIONS
As-tooled surfaces were more sensitive to contamination than peel ply treated surfaces. Reduced bond performance was observed consistently with nylon peel ply, FEP, Frekote,
and latex residue with all adhesives. The paste adhesive tested here was not able to accommodate the presence of contaminants
as well as the film adhesive. Surface analysis tools, including wettability, contact angle methods and chemical
fingerprint FTIR methods with chemometrics, were successful at distinguishing between contaminants and surface treatments in selected cases.
Inverse gas chromatography surface energy methods were not as successful at detecting surface differences.
Surface texture played a role in the ability to collect reliable and consistent wettability measurements (Dyne, WCA, SFE).
The ballistic water drop contact angle method was more consistent and reliable at collecting information than the sessile drop goniometer method.
Surface analysis methods tested here did not provide good bond performance, fracture toughness and failure mode, prediction information.
Overall, results demonstrated that compatibility of the entire bonding system (substrate, surface preparation, adhesive, and bonding process) was critical for good bond performance. The material is based upon work supported by NASA under Award No. NNL09AA00A, Agreement No: C15-2A38-Boeing. Acknowledgements to Diane LaRiviere for her insight on FTIR spectra collection and analysis, Ryan Wilson for inverse gas chromatography and goniometer investigations, Ashley Tracey for consulting on surface energy, Dan Perey and Josh Brown, and John Hopkins from NASA for the OSEE results and laser surface treatment processing, respectively.

REFERENCES
1. Flinn, B., Phariss, M. "The Effect of Peel-Ply Surface Preparation Variables on Bond Quality," in DOT/FAA/(AR)-06/28. 2006.
2. Encinas, N., Oakley, B. R., Belcher, M. A., Blohowiak, K. Y. “Surface Modification of Aircraft Used Composites for Adhesive Bonding.” International Journal of Adhesion & Adhesives, 2014: 157-163.
3. Johnson, R. T., Blohowiak, K., Osborne, J., Wilson, R., & Flinn, B. D. “Improving Adhesive Bonding of Composites Through Surface Characterization Using Inverse Gas Chromatography (IGC) Methods.” Seattle: University of Washington. 2016.