Embed Size (px)
Citation preview

Printed on Recycled Paper
Contaminant CandidateList RegulatoryDetermination SupportDocument for Naphthalene


Printed on Recycled Paper
Contaminant Candidate ListRegulatory Determination Support Document
for Naphthalene
U.S. Environmental Protection AgencyOffice of Water (4607M)
Standards and Risk Management DivisionWashington, DC 20460
http://www.epa.gov/SAFEWATER/ccl/cclregdetermine.html
EPA-815-R-03-14July 2003

Regulatory Determination Support Document for Naphthalene July 2003
Disclaimer
This document is designed to provide supporting information regarding theregulatory determinations for naphthalene as part of the ContaminantCandidate List (CCL) evaluation process. This document is not a regulation,and it does not substitute for the Safe Drinking Water Act (SDWA) or theEnvironmental Protection Agency’s (EPA’s) regulations. Thus, it cannotimpose legally-binding requirements on EPA, States, or the regulatedcommunity, and may not apply to a particular situation based upon thecircumstances. Mention of trade names or commercial products does notconstitute endorsement or recommendation for use.

Regulatory Determination Support Document for Naphthalene July 2003
i
ACKNOWLEDGMENTS
This document was prepared in support of the EPA’s Office of Ground Water and Drinking Water(OGWDW) regulatory determination for naphthalene as part of the Contaminant Candidate List (CCL)evaluation process. Karen Wirth and Tom Carpenter served as EPA’s Co-Team Leaders for the CCLregulatory determination process and Ephraim King as Standards and Risk Management DivisionDirector. Harriet Colbert served as Work Assignment Manager. The CCL Work Group providedtechnical guidance throughout. In particular, Karen Wirth, Dan Olson, and Joyce Donohue providedscientific and editorial guidance. External expert reviewers and many stakeholders provided valuableadvice to improve the CCL Program and this document. The Cadmus Group, Inc., served as theprimary contractor providing support for this work. The major contributions of Matt Collins, EmilyBrott, Ashton Koo, Richard Zeroka, and Brent Ranalli are gratefully acknowledged. George Hallbergserved as Cadmus’ Project Manager.

This page intentionally left blank.

Regulatory Determination Support Document for Naphthalene July 2003
iii
USEPA, Office of Water Report: EPA 815-R-03-014, July 2003
CONTAMINANT CANDIDATE LIST REGULATORY DETERMINATION SUPPORT DOCUMENT
FOR NAPHTHALENE
EXECUTIVE SUMMARY
Naphthalene was a 1998 Contaminant Candidate List (CCL) regulatory determination prioritycontaminant. Naphthalene was one of the contaminants considered by the United States EnvironmentalProtection Agency (EPA) for a regulatory determination. The available data on occurrence, exposure,and other risk considerations suggest that regulating naphthalene may not present a meaningfulopportunity to reduce health risk. EPA presented preliminary CCL regulatory determinations andfurther analysis in the June 3, 2002 Federal Register Notice (USEPA 2002a; 67 FR 38222) andconfirmed the final regulatory determinations in a July 18, 2003 Federal Register Notice (USEPA2003a; 68 FR 42898).
To make this regulatory determination for naphthalene, EPA used approaches guided by theNational Drinking Water Advisory Council’s (NDWAC) Work Group on CCL and Six-Year Review. The Safe Drinking Water Act (SDWA) requirements for National Primary Drinking Water Regulation(NPDWR) promulgation guided protocol development. The SDWA Section 1412(b)(1)(A) specifiesthat the determination to regulate a contaminant must be based on a finding that each of the followingcriteria are met: (i) “the contaminant may have adverse effects on the health of persons”; (ii) “thecontaminant is known to occur or there is substantial likelihood that the contaminant will occur in publicwater systems with a frequency and at levels of public health concern”; and (iii) “in the sole judgementof the Administrator, regulation of such contaminant presents a meaningful opportunity for health riskreduction for persons served by public water systems.” Available data were evaluated to address eachof the three statutory criteria.
Naphthalene is a volatile organic compound (VOC) that is naturally present in fossil fuels such aspetroleum and coal, and is produced when wood or tobacco are burned. Naphthalene is primarilyused as an intermediary in the production of phthalate plasticizers, resins, phthaleins, dyes,pharmaceuticals, and insect repellents. Crystalline naphthalene is used as a moth repellent and a solidblock deodorizer for diaper pails and toilets. Naphthalene is also used to make the insecticide carbaryland synthetic leather tanning agents. Releases of naphthalene to the environment, reported through theToxic Release Inventory (TRI), are widespread. The occurrence of naphthalene in site samplesrecorded in the Agency for Toxic Substances and Disease Registry’s (ATSDR) Hazardous SubstanceRelease and Health Effects Database (HazDat) and at National Priorities List (NPL) hazardous wastesites provides further evidence for the widespread use and environmental release of naphthalene.
Naphthalene was monitored from 1987 to 1999 under the SDWA Unregulated ContaminantMonitoring (UCM) program. Naphthalene is also monitored or regulated by other federal programsincluding the Clean Water Act Priority Pollutants list, the Clean Air Act Hazardous Air Pollutant list, the

Regulatory Determination Support Document for Naphthalene July 2003
iv
Comprehensive Environmental Response, Compensation, and Liability Act (CERCLA), the ResourceConservation and Recovery Act (RCRA), the Federal Insecticide, Fungicide, and Rodenticide Act(FIFRA), and the TRI.
Because of concerns about human health risk, EPA issued a drinking water health advisory fornaphthalene in 1990 at 100 µg/L and later recommended guidelines for exposure to naphthalene indrinking water. Other federal agencies and organizations have issued recommendations foroccupational exposure.
Naphthalene has been detected in ambient ground water as noted by the United States GeologicalSurvey’s (USGS) National Water Quality Assessment (NAWQA) program. Detection frequenciesand concentrations in ground water are relatively low, with naphthalene occurrence considerably higherin urban wells than in rural wells. Naphthalene detection frequencies in urban and highway surfacerunoff are slightly higher than in ground water, but concentrations are lower. Maximum concentrationsin surface runoff and in ground water, however, are both well below the Health Reference Level (HRL)of 140 µg/L, a preliminary health effect level used for this analysis.
Naphthalene has also been detected in PWS samples collected under SDWA. Occurrenceestimates are low, with less than 0.5% of all samples showing detections for both rounds of UCMmonitoring. The percentages of public water systems (PWSs) with detections are 0.75% and 1.18%for the two rounds of UCM monitoring. Percentages of PWSs with detections greater than half theHealth Reference Level (> ½ HRL) are considerably lower: approximately 0.01% for both rounds. National estimates for the population served by PWSs with detections are also low, especially fordetections greater than the HRL. It is estimated, based upon Round 1 data, that less than 0.01% of thenational PWS population is served by systems with detections greater than the HRL (approximately16,000 people). While detection frequencies and concentrations are low, the geographic distribution ofdetections is widespread. Thirty two out of the 43 States reporting UCM data for naphthalene reportdetections. Only one State reports detections greater than the HRL.
The available toxicological data indicate that naphthalene has the potential to cause adverse healtheffects in humans and animals at high doses. In humans, hemolytic anemia is the most commonmanifestation of naphthalene toxicity. There are inadequate data to support a conclusion about thecarcinogenicity of naphthalene by the oral route of exposure.
Monitoring data indicate that naphthalene is infrequently detected in public water supplies. Furthermore, when naphthalene is detected, it very rarely exceeds the HRL or a value of one-half of theHRL. Additionally, when average daily intakes from drinking water are compared with intakes fromfood, air, and soil, drinking water accounts for a relatively small proportion of total naphthalene intake.Therefore, regulation of naphthalene in drinking water is unlikely to represent a meaningful opportunityfor health risk reduction.

Regulatory Determination Support Document for Naphthalene July 2003
v
TABLE OF CONTENTS
ACKNOWLEDGMENTS . . . . . . . . . . . . . . . . . . . . . . . . . . . . . . . . . . . . . . . . . . . . . . . . . . . . . . . i
EXECUTIVE SUMMARY . . . . . . . . . . . . . . . . . . . . . . . . . . . . . . . . . . . . . . . . . . . . . . . . . . . . . . iii
TABLE OF CONTENTS . . . . . . . . . . . . . . . . . . . . . . . . . . . . . . . . . . . . . . . . . . . . . . . . . . . . . . . . v
LIST OF TABLES . . . . . . . . . . . . . . . . . . . . . . . . . . . . . . . . . . . . . . . . . . . . . . . . . . . . . . . . . . . . vii
LIST OF FIGURES . . . . . . . . . . . . . . . . . . . . . . . . . . . . . . . . . . . . . . . . . . . . . . . . . . . . . . . . . . . ix
1.0 INTRODUCTION . . . . . . . . . . . . . . . . . . . . . . . . . . . . . . . . . . . . . . . . . . . . . . . . . . . . . . . . . . 11.1 Purpose and Scope . . . . . . . . . . . . . . . . . . . . . . . . . . . . . . . . . . . . . . . . . . . . . . . . . . . . . . . 11.2 Statutory Framework/Background . . . . . . . . . . . . . . . . . . . . . . . . . . . . . . . . . . . . . . . . . . . . 11.3 Statutory History of Naphthalene . . . . . . . . . . . . . . . . . . . . . . . . . . . . . . . . . . . . . . . . . . . . . 21.4 Regulatory Determination Process . . . . . . . . . . . . . . . . . . . . . . . . . . . . . . . . . . . . . . . . . . . . 31.5 Determination Outcome . . . . . . . . . . . . . . . . . . . . . . . . . . . . . . . . . . . . . . . . . . . . . . . . . . . . 4
2.0 CONTAMINANT DEFINITION . . . . . . . . . . . . . . . . . . . . . . . . . . . . . . . . . . . . . . . . . . . . . . 52.1 Physical and Chemical Properties . . . . . . . . . . . . . . . . . . . . . . . . . . . . . . . . . . . . . . . . . . . . 5
3.0 OCCURRENCE AND EXPOSURE . . . . . . . . . . . . . . . . . . . . . . . . . . . . . . . . . . . . . . . . . . . . 63.1 Use and Environmental Release . . . . . . . . . . . . . . . . . . . . . . . . . . . . . . . . . . . . . . . . . . . . . . 7
3.1.1 Production and Use . . . . . . . . . . . . . . . . . . . . . . . . . . . . . . . . . . . . . . . . . . . . . . . . . . 73.1.2 Environmental Release . . . . . . . . . . . . . . . . . . . . . . . . . . . . . . . . . . . . . . . . . . . . . . . . 7
3.2 Ambient Occurrence . . . . . . . . . . . . . . . . . . . . . . . . . . . . . . . . . . . . . . . . . . . . . . . . . . . . . . 93.2.1 Data Sources and Methods . . . . . . . . . . . . . . . . . . . . . . . . . . . . . . . . . . . . . . . . . . . . 93.2.2 Results . . . . . . . . . . . . . . . . . . . . . . . . . . . . . . . . . . . . . . . . . . . . . . . . . . . . . . . . . . . 10
3.3 Drinking Water Occurrence . . . . . . . . . . . . . . . . . . . . . . . . . . . . . . . . . . . . . . . . . . . . . . . . 113.3.1 Data Sources, Data Quality, and Analytical Approaches . . . . . . . . . . . . . . . . . . . . . . 11
3.3.1.1 UCM Rounds 1 and 2 . . . . . . . . . . . . . . . . . . . . . . . . . . . . . . . . . . . . . . . . 123.3.1.2 Developing a Nationally Representative Perspective . . . . . . . . . . . . . . . . . . 12
3.3.1.2.1 Cross-Section Development . . . . . . . . . . . . . . . . . . . . . . . . . . . . . . . 133.3.1.2.2 Cross-Section Evaluation . . . . . . . . . . . . . . . . . . . . . . . . . . . . . . . . . 14
3.3.1.3 Data Management and Analysis . . . . . . . . . . . . . . . . . . . . . . . . . . . . . . . . . 173.3.1.4 Occurrence Analysis . . . . . . . . . . . . . . . . . . . . . . . . . . . . . . . . . . . . . . . . . 17
3.3.2 Results . . . . . . . . . . . . . . . . . . . . . . . . . . . . . . . . . . . . . . . . . . . . . . . . . . . . . . . . . . . 193.3.2.1 Occurrence Estimates . . . . . . . . . . . . . . . . . . . . . . . . . . . . . . . . . . . . . . . . 193.3.2.2 Regional Patterns . . . . . . . . . . . . . . . . . . . . . . . . . . . . . . . . . . . . . . . . . . . 20
3.4 Conclusion . . . . . . . . . . . . . . . . . . . . . . . . . . . . . . . . . . . . . . . . . . . . . . . . . . . . . . . . . . . . 25
4.0 HEALTH EFFECTS . . . . . . . . . . . . . . . . . . . . . . . . . . . . . . . . . . . . . . . . . . . . . . . . . . . . . . . 25
Regulatory Determination Support Document for Naphthalene July 2003
vi
4.1 Hazard Characterization and Mode of Action Implications . . . . . . . . . . . . . . . . . . . . . . . . . 264.2 Dose-Response Characterization and Implications in Risk Assessment . . . . . . . . . . . . . . . . 274.3 Relative Source Contribution . . . . . . . . . . . . . . . . . . . . . . . . . . . . . . . . . . . . . . . . . . . . . . . 284.4 Sensitive Populations . . . . . . . . . . . . . . . . . . . . . . . . . . . . . . . . . . . . . . . . . . . . . . . . . . . . . 294.5 Exposure and Risk Information . . . . . . . . . . . . . . . . . . . . . . . . . . . . . . . . . . . . . . . . . . . . . 304.6 Conclusion . . . . . . . . . . . . . . . . . . . . . . . . . . . . . . . . . . . . . . . . . . . . . . . . . . . . . . . . . . . . 30
5.0 TECHNOLOGY ASSESSMENT . . . . . . . . . . . . . . . . . . . . . . . . . . . . . . . . . . . . . . . . . . . . . 305.1 Analytical Methods . . . . . . . . . . . . . . . . . . . . . . . . . . . . . . . . . . . . . . . . . . . . . . . . . . . . . . 315.2 Treatment Technology . . . . . . . . . . . . . . . . . . . . . . . . . . . . . . . . . . . . . . . . . . . . . . . . . . . . 31
6.0 SUMMARY AND CONCLUSIONS - DETERMINATION OUTCOME . . . . . . . . . . . . . . 32
REFERENCES . . . . . . . . . . . . . . . . . . . . . . . . . . . . . . . . . . . . . . . . . . . . . . . . . . . . . . . . . . . . . . . 35
APPENDIX A: Abbreviations and Acronyms . . . . . . . . . . . . . . . . . . . . . . . . . . . . . . . . . . . . . . . . . 41

Regulatory Determination Support Document for Naphthalene July 2003
vii
LIST OF TABLES
Table 2-1: Physical and chemical properties . . . . . . . . . . . . . . . . . . . . . . . . . . . . . . . . . . . . . . . . . . . 6Table 3-1: Environmental releases (in pounds) for naphthalene in the United States (1988-1998)
. . . . . . . . . . . . . . . . . . . . . . . . . . . . . . . . . . . . . . . . . . . . . . . . . . . . . . . . . . . . . . . . . . . . . . . . . 8Table 3-2: Naphthalene detections and concentrations in ground water . . . . . . . . . . . . . . . . . . . . . . 10Table 3-3: Cross-section States for Round 1 (24 States) and Round 2 (20 States) . . . . . . . . . . . . . 15Table 3-4: Summary occurrence statistics for naphthalene . . . . . . . . . . . . . . . . . . . . . . . . . . . . . . . . 21

This page intentionally left blank.

Regulatory Determination Support Document for Naphthalene July 2003
ix
LIST OF FIGURES
Figure 3-1: Geographic distribution of cross-section States for Round 1 (left) and Round 2 (right) . . . . . . 16Figure 3-2: States with PWSs with detections of naphthalene for all States with data in URCIS (Round 1)
and SDWIS/FED (Round 2) . . . . . . . . . . . . . . . . . . . . . . . . . . . . . . . . . . . . . . . . . . . . . . . . . . . . 22Figure 3-3: States with PWSs with detections of naphthalene (any PWSs with results greater than the
Minimum Reporting Level [MRL]) for Round 1 (above) and Round 2 (below) cross-section States. . . . . . . . . . . . . . . . . . . . . . . . . . . . . . . . . . . . . . . . . . . . . . . . . . . . . . . . . . . . . . . . . . . . . . . . 23
Figure 3-4: Cross-section States (Round 1 and Round 2 combined) with PWSs with detections ofnaphthalene (above) and concentrations greater than the Health Reference Level (below) . . . . . . . . . . 24

This page intentionally left blank.

Regulatory Determination Support Document for Naphthalene July 2003
1
1.0 INTRODUCTION
1.1 Purpose and Scope
This document presents scientific data and summaries of technical information prepared for, andused in, the United States Environmental Protection Agency’s (EPA) regulatory determination fornaphthalene. Information regarding naphthalene’s physical and chemical properties, environmental fate,occurrence and exposure, and health effects is included. Analytical methods and treatment technologiesare also discussed. Furthermore, the regulatory determination process is described to provide therationale for the decision.
1.2 Statutory Framework/Background
The Safe Drinking Water Act (SDWA), as amended in 1996, requires the EPA to publish a list ofcontaminants (referred to as the Contaminant Candidate List, or CCL) to assist in priority-settingefforts. The contaminants included on the CCL were not subject to any current or proposed NationalPrimary Drinking Water Regulations (NPDWR), were known or anticipated to occur in public watersystems, and were known or suspected to adversely affect public health. These contaminants thereforemay require regulation under SDWA. The first Drinking Water CCL was published on March 2, 1998(USEPA, 1998b; 63 FR 10273), and a new CCL must be published every five years thereafter.
The 1998 CCL contains 60 contaminants, including 50 chemicals or chemical groups, and 10microbiological contaminants or microbial groups. The SDWA also requires the Agency to select 5 ormore contaminants from the current CCL and determine whether or not to regulate these contaminantswith an NPDWR. Regulatory determinations for at least 5 contaminants must be completed 3½ yearsafter each new CCL.
Language in SDWA Section 1412(b)(1)(A) specifies that the determination to regulate acontaminant must be based on a finding that each of the following criteria are met:
Statutory Finding i: the contaminant may have adverse effects on the health of persons;
Statutory Finding ii: the contaminant is known to occur or there is substantial likelihood that the contaminant will occur in public water systems with a frequency and at levels of publichealth concern; and
Statutory Finding iii: in the sole judgement of the Administrator, regulation of such contaminant presents a meaningful opportunity for health risk reduction for persons served bypublic water systems.
The geographic distribution of the contaminant is another factor evaluated to determine whether itoccurs at the national, regional, or local level. This consideration is important because the Agency is

Regulatory Determination Support Document for Naphthalene July 2003
2
charged with developing national regulations and it may not be appropriate to develop NPDWRs forregional or local contamination problems.
EPA must determine if regulating this CCL contaminant will present a meaningful opportunity toreduce health risk based on contaminant occurrence, exposure, and other risk considerations. TheOffice of Ground Water and Drinking Water (OGWDW) is charged with gathering and analyzing theoccurrence, exposure, and risk information necessary to support this regulatory decision. TheOGWDW must evaluate when and where this contaminant occurs, and what would be the exposureand risk to public health. EPA must evaluate the impact of potential regulations as well as determine theappropriate measure(s) for protecting public health.
For each of the regulatory determinations, EPA first publishes in the Federal Register the draftdeterminations for public comment. EPA responds to the public comments received, and then finalizesregulatory determinations. If the Agency finds that regulations are warranted, the regulations must thenbe formally proposed withing 24 months, and promulgated 18 months later. EPA has determined thatthere is sufficient information to support a regulatory determination for naphthalene.
1.3 Statutory History of Naphthalene
Naphthalene has been monitored under the SDWA Unregulated Contaminant Monitoring (UCM)program since 1987. It was among 14 volatile organic compounds (VOCs) included for discretionarymonitoring (USEPA, 1987; 52 FR 25690). Monitoring for naphthalene under UCM continuedthroughout the 1990s, but ceased for small public water systems (PWSs) under a direct final rulepublished January 8, 1999 (USEPA, 1999a; 64 FR 1494). Monitoring ended for large PWSs withpromulgation of the new Unregulated Contaminant Monitoring Regulation (UCMR) issued September17, 1999 (USEPA, 1999b; 64 FR 50556) and effective January 1, 2001. At the time the UCMR listswere developed, the Agency concluded there were adequate monitoring data for a regulatorydetermination. This obviated the need for continuing monitoring under the new UCMR list.
EPA issued a drinking water health advisory for naphthalene in 1990, and later recommendedguidelines for exposure to naphthalene in drinking water (USEPA, 1990; Agency for Toxic Substancesand Disease Registry (ATSDR), 1996). As part of the CCL process, health effects data have beenreviewed. These are summarized in section 4.0 of this document.
Naphthalene is regulated or monitored by other federal programs as well. It is included on theClean Water Act Priority Pollutants list for which the EPA establishes ambient water quality criteria. Itis also listed as a Hazardous Air Pollutant under the Clean Air Act and subject to Best AvailableControl Technology limits. Both the Comprehensive Environmental Response, Compensation, andLiability Act (CERCLA or “Superfund”) and the Resource Conservation and Recovery Act (RCRA)include it as a hazardous substance and a hazardous constituent, respectively (USEPA, 2000a). CERCLA’s listing requires reporting of releases over a certain “reportable quantity” which, fornaphthalene, is 100 pounds (ATSDR, 1996).

Regulatory Determination Support Document for Naphthalene July 2003
3
Naphthalene’s sale, use, and distribution is controlled under the Federal Insecticide, Fungicide, andRodenticide Act (FIFRA). FIFRA was most recently amended in 1996 under the Food QualityProtection Act (FQPA). FIFRA requires registration of all pesticides with EPA, and certain labeling,application, and use restrictions. Moreover, pesticide manufacturing plants must be registered, and themanufacturer must provide EPA with scientific data regarding the product’s efficacy and demonstratingthat it does not pose an unreasonable risk to people or the environment (USEPA, 1998a; USEPA,2000a). Naphthalene is also a Toxic Release Inventory (TRI) chemical. The TRI was established bythe Emergency Planning and Community Right-to-Know Act (EPCRA). EPCRA requires certainindustrial sectors to publicly report the environmental release or transfer of chemicals included in thisinventory (USEPA, 1996a).
Finally, the Occupational Safety and Health Administration (OSHA) recommends an occupationalexposure limit of 10 parts naphthalene per million in air (10 ppm) for an 8-hour workday over a 40-hour workweek. The American Conference of Governmental and Industrial Hygienists (ACGIH) andthe Mine Safety and Health Administration (MSHA) recommend the same weekly limit (USDHHS,1993). The National Institute for Occupational Safety and Health (NIOSH) considers over 250 ppmof naphthalene in air to be life-threatening (ATSDR, 1996).
1.4 Regulatory Determination Process
In developing a process for the regulatory determinations, EPA sought input from experts andstakeholders. EPA asked the National Research Council (NRC) for assistance in developing ascientifically sound approach for deciding whether or not to regulate contaminants on the current andfuture CCLs. The NRC’s Committee on Drinking Water Contaminants recommended that EPA: (1)gather and analyze health effects, exposure, treatment, and analytical methods data for eachcontaminant; (2) conduct a preliminary risk assessment for each contaminant based on the availabledata; and (3) issue a decision document for each contaminant describing the outcome of the preliminaryrisk assessment. The NRC noted that in using this decision framework, EPA should keep in mind theimportance of involving all interested parties.
One of the formal means by which EPA works with its stakeholders is through the NationalDrinking Water Advisory Council (NDWAC). The NDWAC comprises members of the generalpublic, State and local agencies, and private groups concerned with safe drinking water, and advisesthe EPA Administrator on key aspects of the Agency’s drinking water program. The NDWACprovided specific recommendations to EPA on a protocol to assist the Agency in making regulatorydeterminations for current and future CCL contaminants. Separate but similar protocols weredeveloped for chemical and microbial contaminants. These protocols are intended to provide aconsistent approach to evaluating contaminants for regulatory determination, and to be a tool that willorganize information in a manner that will communicate the rationale for each determination tostakeholders. The possible outcomes of the regulatory determination process are: a decision toregulate, a decision not to regulate, or a decision that some other action is needed (e.g., issuance ofguidance).

Regulatory Determination Support Document for Naphthalene July 2003
4
The NDWAC protocol uses the three statutory requirements of SDWA Section 1412(b)(1)(A)(i)-(iii) (specified in section 1.2) as the foundation for guiding EPA in making regulatory determinationdecisions. For each statutory requirement, evaluation criteria were developed and are summarizedbelow.
To address whether a contaminant may have adverse effects on the health of persons (statutoryrequirement (i)), the NDWAC recommended that EPA characterize the health risk and estimate ahealth reference level for evaluating the occurrence data for each contaminant.
Regarding whether a contaminant is known to occur, or whether there is substantial likelihood thatthe contaminant will occur, in public water systems with a frequency, and at levels, of public healthconcern (statutory requirement (ii)), the NDWAC recommended that EPA consider: (1) the actual andestimated national percent of public water systems (PWSs) reporting detections above half the healthreference level; (2) the actual and estimated national percent of PWSs with detections above the healthreference level; and (3) the geographic distribution of the contaminant.
To address whether regulation of a contaminant presents a meaningful opportunity for health riskreduction for persons served by public water systems (statutory requirement (iii)) the NDWACrecommended that EPA consider estimating the national population exposed above half the healthreference level and the national population exposed above the health reference level.
The approach EPA used to make regulatory determinations followed the general formatrecommended by the NRC and the NDWAC to satisfy the three SDWA requirements under section1412(b)(1)(A)(i)-(iii). The process was independent of many of the more detailed and comprehensiverisk management factors that will influence the ultimate regulatory decision making process. Thus, adecision to regulate is the beginning of the Agency regulatory development process, not the end.
Specifically, EPA characterized the human health effects that may result from exposure to acontaminant found in drinking water. Based on this characterization, the Agency estimated a healthreference level (HRL) for each contaminant.
For each contaminant EPA estimated the number of PWSs with detections >½HRL and >HRL, thepopulation served at these benchmark values, and the geographic distribution, using a large number ofoccurrence data (approximately seven million analytical points) that broadly reflect national coverage.Round 1 and Round 2 UCM data, evaluated for quality, completeness, bias, and representativeness,were the primary data used to develop national occurrence estimates. Use and environmental releaseinformation, additional drinking water data sets (e.g., State drinking water data sets, EPA NationalPesticide Survey, and Environmental Working Group data reviews), and ambient water quality data(e.g., United States Geological Survey’s (USGS) National Water Quality Assessment (NAWQA)program, State and regional studies, and the EPA Pesticides in Ground Water Database (PGWD))were also consulted.

Regulatory Determination Support Document for Naphthalene July 2003
5
The findings from these evaluations were used to determine if there was adequate information toevaluate the three SDWA statutory requirements and to make a determination of whether to regulate acontaminant.
1.5 Determination Outcome
The Agency has made a determination not to regulate naphthalene with an NPDWR because it isnot known to occur in public water systems at levels of public health concern. Monitoring data indicatethat naphthalene is infrequently detected in public water supplies. When naphthalene is detected, it veryrarely exceeds the HRL or a value of one-half of the HRL. All CCL regulatory determinations andfurther analysis are formally presented in the Federal Register Notices (USEPA, 2002a; 67 FR38222; and USEPA, 2003a; 68 FR 42898). The following sections summarize the data used by theAgency to reach this decision.
2.0 CONTAMINANT DEFINITION
Naphthalene, a VOC, is a white solid with a strong odor. Common synonyms for naphthaleneinclude: mothballs, mothflakes, tar camphor, white tar, naphthene, and albocarbon. Naphthalene isnaturally present in fossil fuels such as petroleum and coal, and is produced when wood or tobacco areburned. Most of naphthalene consumption (60%) is as an intermediary in the production of phthalateplasticizers, resins, phthaleins, dyes, pharmaceuticals, and insect repellents. Crystalline naphthalene isused as a moth repellent and a solid block deodorizer for diaper pails and toilets. Naphthalene is alsoused to make the insecticide carbaryl, synthetic leather tanning agents, and surface active agents(ATSDR, 1995).
2.1 Physical and Chemical Properties
Table 2-1 lists summary information regarding naphthalene’s physical and chemical properties. Also included are its CAS Registry Number and molecular formula.
2.2 Environmental Fate/Behavior
Naphthalene solid evaporates easily in air and is readily degraded in the atmosphere by hydroxylradicals (half life<1 day). The half life of naphthalene in water depends on local conditions and variesfrom a couple of days to a few months. Biodegradation of naphthalene in soil occurs quickly (half life a

Regulatory Determination Support Document for Naphthalene July 2003
6
Table 2-1: Physical and chemical properties
Identification
CAS number 91-20-3
Molecular Formula C10H8
Physical and Chemical Properties
Boiling Point 218 °C at 760 mm Hg
Melting Point 80.5 °C
Molecular Weight 128.19 g/mol
Log Koc 2.97
Log Kow 3.29
Water Solubility 31.7 mg/L at 25 °C
Vapor Pressure 0.087 mm Hg at 25 °C
Henry’s LawConstant ^
1.88 x 10⁻²
source: ATSDR, 1995.^ note: this quantity is expressed in a dimensionless form.
few hours to days) if the soil is contaminated with other polycyclic aromatic hydrocarbons. If the soil isfree of such contaminants, the half life of naphthalene is greater than 80 days (Howard, 1989).
Naphthalene’s evaporation rate is significant at the soil surface but slowly decreases as depthincreases. Its sorption to soil is slow to moderate depending on the soil’s organic carbon content. Naphthalene travels rapidly through sandy soil (Howard, 1989).
When released into the water, naphthalene either volatilizes, degrades by photolysis, adsorbs tosurfaces, or biodegrades. It biodegrades significantly faster when adsorbed to sediment than whencontained in the upper layers of water. Volatilization is primarily responsible for naphthalene’s removalin turbulent water. In slower moving waters, biodegradation is the more significant process. Naphthalene can also biodegrade in ground water under aerobic conditions (Howard, 1989).

Regulatory Determination Support Document for Naphthalene July 2003
7
3.0 OCCURRENCE AND EXPOSURE
This section examines the occurrence of naphthalene in drinking water. While no complete nationaldatabase exists of unregulated or regulated contaminants in drinking water from PWSs collected underSDWA, this report aggregates and analyzes existing State data that have been screened for quality,completeness, and representativeness. Populations served by PWSs exposed to naphthalene areestimated, and the occurrence data are examined for regional or other special trends. To augment theincomplete national drinking water data and aid in the evaluation of occurrence, information on the useand environmental release, as well as ambient occurrence of naphthalene, is also reviewed.
3.1 Use and Environmental Release
3.1.1 Production and Use
Naphthalene is naturally present in fossil fuels such as petroleum and coal, and is generated whenwood or tobacco are burned. Naphthalene is produced in commercial quantities from either coal tar orpetroleum. Most of the naphthalene produced in the United States comes from petroleum by thedealkylation of methyl naphthalenes in the presence of hydrogen at high temperature and pressure. Another common production method is the distillation and fractionation of coal tar. Most naphthaleneconsumption (60%) is through use as an intermediary in the production of phthalate plasticizers, resins,phthaleins, dyes, pharmaceuticals, and insect repellents. Crystalline naphthalene is used as a mothrepellent and a solid block deodorizer for diaper pails and toilets. Naphthalene is also used to make theinsecticide carbaryl, synthetic leather tanning agents, and surface active agents (ATSDR, 1995).
Naphthalene production in the United States dropped from 900 million lbs/yr in 1968 to 354 millionlbs/yr in 1982. Approximately 7 million lbs of naphthalene were imported and 9 million lbs wereexported in 1978. By 1989, imports had dropped to 4 million lbs, and exports increased dramaticallyto 21 million lbs (ATSDR, 1995).
3.1.2 Environmental Release
Naphthalene is listed as a toxic release inventory chemical. In 1986, the Emergency Planning andCommunity Right-to-Know Act (EPCRA) established the TRI of hazardous chemicals. Created underthe Superfund Amendments and Reauthorization Act (SARA) of 1986, EPCRA is also sometimesknown as SARA Title III. The EPCRA mandates that larger facilities publicly report when TRIchemicals are released into the environment. This public reporting is required for facilities with morethan 10 full-time employees that annually manufacture or produce more than 25,000 pounds, or usemore than 10,000 pounds, of TRI chemical (USEPA, 1996a; USEPA, 2000e).
Under these conditions, facilities are required to report the pounds per year of naphthalene releasedinto the environment both on- and off-site. The on-site quantity is subdivided into air emissions, surfacewater discharges, underground injections, and releases to land (see Table 3-1). For naphthalene, airemissions constitute most of the on-site releases. Also, surface water discharges exhibit no obvious

Regulatory Determination Support Document for Naphthalene July 2003
8
trend over the period for which data is available (1988-1998), but discharges hit a low in 1996 and1997, and increase again in 1998. These TRI data for naphthalene were reported from 47 States(excluding Idaho, New Hampshire, and Vermont) indicating the widespread production or use of thischemical (USEPA, 2000c).
Although the TRI data can be useful in giving a general idea of release trends, it is far fromexhaustive and has significant limitations. For example, only industries which meet TRI criteria (at least10 full-time employees and manufacture and processing of quantities exceeding 25,000 lbs/yr, or use ofmore than 10,000 lbs/yr) are required to report releases. These reporting criteria do not account forreleases from smaller industries. Threshold manufacture and processing quantities also changed from1988-1990 (dropping from 75,000 lbs/yr in 1988 to 50,000 lbs/yr in 1989 to its current 25,000 lbs/yrin 1990) creating possibly misleading data trends. Finally, the TRI data is meant to reflect releases andshould not be used to estimate general exposure to a chemical (USEPA, 2000d; USEPA, 2000b).
Table 3-1: Environmental releases (in pounds) for naphthalene in the United States (1988-1998)
Year
On-Site Releases Off-SiteReleases
Total On- & Off-site
ReleasesAir
EmissionsSurface Water
DischargesUnderground
InjectionReleases
to Land1998 3,374,439 34,148 191,677 1,251,040 827,708 5,679,0121997 2,449,488 13,333 187,927 82,204 491,124 3,224,0761996 2,863,431 11,836 296,776 301,513 582,717 4,056,2731995 2,690,669 43,311 44,318 32,085 474,106 3,284,4891994 2,889,514 28,557 97,186 47,017 496,501 3,558,7751993 2,744,887 31,179 79,814 49,886 334,985 3,240,7511992 2,626,986 28,925 78,227 1,667,150 667,556 5,068,8441991 2,927,511 31,508 39,112 55,278 983,371 4,036,7801990 3,912,253 36,821 28,130 143,196 919,225 5,039,6251989 3,523,562 146,983 39,552 118,409 1,054,602 4,883,1081988 5,165,426 22,518 50,946 123,697 1,359,184 6,721,771
source: USEPA 2000c
Naphthalene is also included in the ATSDR Hazardous Substance Release and Health EffectsDatabase (HazDat). This database records detections of listed chemicals in site samples; naphthalenewas detected in 44 States (States without detections are AK, AZ, HI, NV, ND, UT; ATSDR, 2000). The National Priorities List (NPL) of hazardous waste sites, created in 1980 by CERCLA, is a listingof some of the most health-threatening waste sites in the United States. Naphthalene was againdetected in all but six States (excluding HI, NE, NV, NM, ND, WV; USEPA, 1999c).
In summary, most of naphthalene’s consumption is through use as an intermediary in the productionof phthalate plasticizers, resins, phthaleins, dyes, pharmaceuticals, and insect repellents. Its productionin the United States declined from 1968 to 1982, however its import decreased and export increasedfrom 1978 to 1989. The widespread use and production of naphthalene in the United States isevidenced by its presence in hazardous waste sites in at least 44 States (at NPL sites), its presence in
Regulatory Determination Support Document for Naphthalene July 2003
9
site samples in at least 44 States (listed in ATSDR’s HazDat), and its direct release into theenvironment in at least 47 States (based on TRI data).
3.2 Ambient Occurrence
To understand the presence of a chemical in the environment, an examination of ambientoccurrence is useful. In a drinking water context, ambient water is source water existing in surfacewaters and aquifers before treatment. The most comprehensive and nationally consistent datadescribing ambient water quality in the United States are being produced through the USGS’sNAWQA program. (NAWQA, however, is a relatively young program and complete national dataare not yet available from their entire array of sites across the nation.)
3.2.1 Data Sources and Methods
To examine water quality status and trends in the United States, the USGS instituted the NAWQAprogram in 1991. NAWQA is designed and implemented in such a manner as to allow consistencyand comparison between representative study basins located around the country, facilitatinginterpretation of natural and anthropogenic factors affecting water quality (Leahy and Thompson,1994).
The NAWQA program consists of 59 significant watersheds and aquifers referred to as “studyunits.” The study units represent approximately two thirds of the overall water usage in the UnitedStates and a similar proportion of the population served by public water systems. Approximately onehalf of the nation’s land area is represented (Leahy and Thompson, 1994).
To facilitate management and make the program cost-effective, approximately one third of thestudy units at a time engage in intensive assessment for a period of 3 to 5 years. This is followed by aperiod of less intensive research and monitoring that lasts between 5 and 7 years. This way all 59 studyunits rotate through intensive assessment over a ten-year period (Leahy and Thompson, 1994). Thefirst round of intensive monitoring (1991-96) targeted 20 watersheds. This first group was moreheavily slanted toward agricultural basins. A national synthesis of results from these study units andother research initiatives focusing on pesticides and nutrients is being compiled and analyzed (Kolpin etal., 2000; Larson et al., 1999).
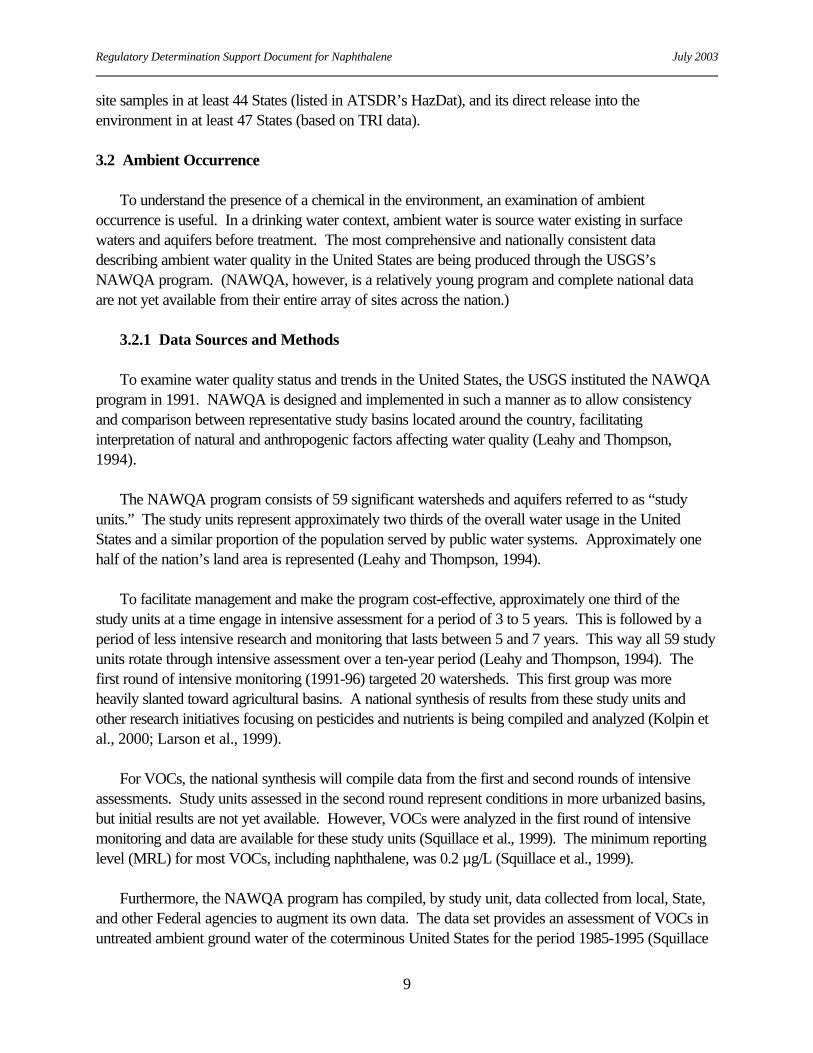
For VOCs, the national synthesis will compile data from the first and second rounds of intensiveassessments. Study units assessed in the second round represent conditions in more urbanized basins,but initial results are not yet available. However, VOCs were analyzed in the first round of intensivemonitoring and data are available for these study units (Squillace et al., 1999). The minimum reportinglevel (MRL) for most VOCs, including naphthalene, was 0.2 µg/L (Squillace et al., 1999).
Furthermore, the NAWQA program has compiled, by study unit, data collected from local, State,and other Federal agencies to augment its own data. The data set provides an assessment of VOCs inuntreated ambient ground water of the coterminous United States for the period 1985-1995 (Squillace

Regulatory Determination Support Document for Naphthalene July 2003
10
et al., 1999). Data were included in the compilation if they met certain criteria for collection, analysis,well network design, and well construction (Lapham et al., 1997). They represent both rural and urbanareas, but should be viewed as a progress report as NAWQA data continue to be collected that mayinfluence conclusions regarding occurrence and distribution of VOCs (Squillace et al., 1999).
The National Highway Runoff Data and Methodology Synthesis has reviewed 44 highway andurban runoff studies implemented since 1970 (Lopes and Dionne, 1998). Two national studies wereincluded in this review: the National Urban Runoff Program (NURP) and studies associated with theEPA National Pollution Discharge Elimination System (NPDES) municipal stormwater permits. NURP, conducted in the 1970s and early 1980s, had the most extensive geographic distribution. TheNPDES studies took place in the early to mid- 1990s (Lopes and Dionne, 1998). Naphthalene was ananalyte in both studies.
3.2.2 Results
Naphthalene was detected in both rural and urban wells of the local, State, and Federal data setcompiled by NAWQA (Table 3-2). The data represent untreated ambient ground water of theconterminous United States for the years 1985-1995 (Squillace et al., 1999). Detection frequenciesand median concentrations are low, especially for rural areas. Occurrence of naphthalene in rural areasis an order of magnitude lower than in urban areas, a trend generally observed for VOCs throughoutthe United States (Miller, 2000). The exception to this trend for naphthalene is the maximumconcentration, a parameter more likely to be influenced by extreme values (outliers) that do not wellrepresent the overall data.
The NURP and NPDES studies analyzing urban and highway runoff also found naphthalene (Lopesand Dionne, 1998). Naphthalene was detected in 11% of NURP samples making it among the 3 mostdetected VOCs in the study. Its detection frequency was 7% in the NPDES studies. The maximumconcentration was 2.3 µg/L in NURP samples and 5.1 µg/L in NPDES samples.
Table 3-2: Naphthalene detections and concentrations in ground water
Detection frequency (% of sampled wells > MRL*)
Concentrations(of detections; µg/L)
Percent exceeding HAL**(20 µg/L)
median maximum all wellsdrinking water
wells
urban 3.0% 3.9 43 0.4 0
rural 0.2% 0.4 70 0.1 0
after Squillace et al.,1999* MRL for naphthalene in water: 0.2 µg/L ** USEPA, 1996b; ATSDR, 1996

Regulatory Determination Support Document for Naphthalene July 2003
11
The maximum values for urban and highway runoff are well below the Health Advisory Level(HAL) of 20 µg/L cited by Lopes and Dionne (1998), the HAL in effect at the time (USEPA, 1996b). The ground water studies also reported few exceedances of the 20 µg/L HAL (Squillace et al., 1999). The maximum values for runoff and ground water are considerably less than the current HAL of 100µg/L (USEPA, 2000f) and even more so for the HRL of 140 µg/L used as a preliminary health effectslevel for the drinking water data analysis presented below.
3.3 Drinking Water Occurrence
The SDWA, as amended in 1986, required PWSs to monitor for specified “unregulated”contaminants, on a five year cycle, and to report the monitoring results to the States. Unregulatedcontaminants do not have an established or proposed NPDWR, but they are contaminants that wereformally listed and required for monitoring under federal regulations. The intent was to gather scientificinformation on the occurrence of these contaminants to enable a decision as to whether or notregulations were needed. All non-purchased community water systems (CWSs) and non-purchasednon-transient non-community water systems (NTNCWSs), with greater than 150 service connections,were required to conduct this unregulated contaminant monitoring. Smaller systems were not requiredto conduct this monitoring under federal regulations, but were required to be available to monitor if theState decided such monitoring was necessary. Many States collected data from smaller systems. Additional contaminants were added to the UCM program in 1991 (USEPA, 1991; 56 FR 3526) forrequired monitoring that began in 1993 (USEPA, 1992; 57 FR 31776).
Naphthalene has been monitored under the SDWA UCM program since 1987 (USEPA, 1987; 52FR 25690). Monitoring for naphthalene under UCM continued throughout the 1990s, but ceased forsmall PWSs under a direct final rule published January 8, 1999 (USEPA, 1999a; 64 FR 1494). Monitoring ended for large PWSs with promulgation of the new Unregulated Contaminant MonitoringRegulation (UCMR) issued September 17, 1999 (USEPA, 1999b; 64 FR 50556) and effectiveJanuary 1, 2001. At the time the UCMR lists were developed, the Agency concluded there wereadequate monitoring data for a regulatory determination. This obviated the need for continuedmonitoring under the new UCMR list.
3.3.1 Data Sources, Data Quality, and Analytical Approaches
Currently, there is no complete national record of unregulated or regulated contaminants in drinkingwater from public water systems collected under SDWA. Many States have submitted theirunregulated contaminant PWS monitoring data to EPA databases, but there are issues of data quality,completeness, and representativeness. Nonetheless, a significant amount of State data are available forUCM contaminants that can provide estimates of national occurrence. The contaminant occurrenceanalyses findings presented in this report are based on a national cross-section of aggregated state data(i.e., a representative subset of available State data) derived from the Safe Drinking Water InformationSystem (Federal version; SDWIS/FED) database.

Regulatory Determination Support Document for Naphthalene July 2003
12
The National Contaminant Occurrence Database (NCOD) is an interface to the actual occurrencedata stored in the SDWIS/FED and can be queried to provide a summary of the data in SDWIS/FEDfor a particular contaminant. The data used in this report were derived from the data in SDWIS/FEDand another database called the Unregulated Contaminant Information System (URCIS). Note,however, that the SDWIS/FED data used in this report have been reviewed, edited, and filtered tomeet various data quality objectives for the purposes of this analysis. Hence, not all data from aparticular source were used, only data meeting the quality objectives described below. The sources ofthese data, their quality and national aggregation, and the analytical methods used to estimate a givencontaminant’s national occurrence (from these data) are discussed in this section (for further details seeUSEPA, 2001a, 2001b).
3.3.1.1 UCM Rounds 1 and 2
The 1987 UCM contaminants include 34 VOCs, divided into two groups: one with 20 VOCs formandatory monitoring, and the other with 14 VOCs for discretionary monitoring (USEPA, 1987; 52FR 25690). Naphthalene was among the 14 VOCs included for discretionary monitoring. The UCM(1987) contaminants were first monitored coincident with the Phase I regulated contaminants, duringthe 1988-1992 period. This period is often referred to as “Round 1” monitoring. The monitoring datacollected by the PWSs were reported to the States (as primacy agents), but there was no protocol inplace to report these data to EPA. These data from Round 1 were collected by EPA from many Statesover time.
The Round 1 data were put into a database called URCIS. Most of the Phase 1 regulatedcontaminants were also VOCs. Both the unregulated and regulated VOCs are analyzed using the samesample and the same laboratory methods. Hence, the URCIS database includes data on all of these 62contaminants: the 34 UCM (1987) VOCs; the 21 regulated Phase 1 VOCs; 2 regulated syntheticorganic contaminants (SOCs); and 5 miscellaneous contaminants that were voluntarily reported bysome States (e.g., isomers of other organic contaminants).
The 1993 UCM contaminants include 13 SOCs and 1 inorganic contaminant (IOC) (USEPA,1992; 57 FR 31776). Monitoring for the UCM (1993) contaminants began coincident with the PhaseII/V regulated contaminants in 1993 through 1998. This is often referred to as “Round 2” monitoring. The UCM (1987) contaminants were also included in the Round 2 monitoring. As with othermonitoring data, PWSs reported these results to the States. EPA, during the past several years,requested that the States submit these historic data to EPA.
The details of the actual individual monitoring periods are complex. The timing of requiredmonitoring was staggered related to different size classes of PWSs, and the program was implementedsomewhat differently by different States. While Round 1 includes the period from 1988-1992, it alsoincludes results from samples analyzed prior to 1988 that were “grandfathered” into the database (forfurther details see USEPA, 2001a, 2001b).

Regulatory Determination Support Document for Naphthalene July 2003
13
3.3.1.2 Developing a Nationally Representative Perspective
The Round 1 and Round 2 databases contain contaminant occurrence data from a total of 40 and35 primacy entities (largely States), respectively. However, data from some States are incomplete andbiased. Furthermore, the national representativeness of the data is problematic because the data werenot collected in a systematic or random statistical framework. These State data could be heavilyskewed to low-occurrence or high-occurrence settings. Hence, the State data were evaluated basedon pollution-potential indicators and the spatial/hydrologic diversity of the nation. This evaluationenabled the construction of a cross-section from the available State data sets that provides a reasonablerepresentation of national occurrence.
A national cross-section comprised of the Round 2 State contaminant occurrence databases wasestablished using the approach developed for the EPA report A Review of Contaminant Occurrencein Public Water Systems (USEPA, 1999d). This approach was developed to support occurrenceanalyses for EPA’s Chemical Monitoring Reform (CMR) evaluation, and was supported by peerreviewers and stakeholders. The approach cannot provide a “statistically representative” samplebecause the original monitoring data were not collected or reported in an appropriate fashion. However, the resultant “national cross-section” of States should provide a clear indication of the centraltendency of the national data. The remainder of this section provides a summary description of how thenational cross-section from the SDWIS/FED (Round 2) database was developed. The details of theapproach are presented in other documents (USEPA, 2001a, 2001b); readers are referred to these formore specific information.
3.3.1.2.1 Cross-Section Development
As a first step in developing the cross-section, the State data contained in the URCIS database(that contains the Round 1 monitoring results) and SDWIS/FED database (that contains the Round 2monitoring results) were evaluated for completeness and quality. For both the URCIS (Round 1) andSDWIS/FED (Round 2) databases, some State data were unusable for a variety of reasons. SomeStates reported only detections, or the data were recorded with incorrect units. Data sets onlyincluding detections are obviously biased, over-representing high-occurrence settings. Other problemsincluded substantially incomplete data sets without all PWSs reporting. Also, data from Washington,D.C. and the Virgin Islands were excluded from this analysis because it was difficult to evaluate themfor the current purposes in relation to complete State data (USEPA, 2001a sections II and III).
The balance of the States remaining after the data quality screening were then examined to establisha national cross-section. This step was based on evaluating the States’ pollution potential andgeographic coverage in relation to all States. Pollution potential is considered to ensure a selection ofStates that represent the range of likely contaminant occurrence and a balance with regard to likely highand low occurrence. Geographic consideration is included so that the wide range of climatic andhydrogeologic conditions across the United States are represented, again balancing the variedconditions that affect transport and fate of contaminants, as well as conditions that affect naturallyoccurring contaminants (USEPA, 2001b sections III.A. and III.B.).

Regulatory Determination Support Document for Naphthalene July 2003
14
The cross-section States were selected to represent a variety of pollution potential conditions. Twoprimary pollution potential indicators were used. The first factor selected indicates pollution potentialfrom manufacturing/population density and serves as an indicator of the potential for VOCcontamination within a State. Agriculture was selected as the second pollution potential indicatorbecause the majority of SOCs of concern are pesticides (USEPA, 2001b section III.A.). The 50individual States were ranked from highest to lowest based on the pollution potential indicator data. For example, the State with the highest ranking for pollution potential from manufacturing received aranking of 1 for this factor and the State with the lowest value was ranked as number 50. States wereranked for their agricultural chemical use status in a similar fashion.
The States’ pollution potential rankings for each factor were subdivided into four quartiles (fromhighest to lowest pollution potential). The cross-section States were chosen equally from all quartilesfor both pollution potential factors to ensure representation, for example, from: States with highagrichemical pollution potential rankings and high manufacturing pollution potential rankings; States withhigh agrichemical pollution potential rankings and low manufacturing pollution potential rankings; Stateswith low agrichemical pollution potential rankings and high manufacturing pollution potential rankings;and States with low agrichemical pollution potential rankings and low manufacturing pollution potentialrankings (USEPA, 2001b section III.B.). In addition, some secondary pollution potential indicatorswere considered to further ensure that the cross-section States included the spectrum of pollutionpotential conditions (high to low). At the same time, States within the specific quartiles wereconsidered collectively across all quartiles to attempt to provide a geographic coverage across allregions of the United States.
The data quality screening, pollution potential rankings, and geographic coverage analysisestablished national cross-sections of 24 Round 1 (URCIS) States and 20 Round 2 (SDWIS/FED)States. In each cross-section, the States provide good representation of the nation’s varied climaticand hydrogeologic regimes and the breadth of pollution potential for the contaminant groups (Table 3-3and Figure 3-1).
3.3.1.2.2 Cross-Section Evaluation
To evaluate and validate the method for creating the national cross-sections, the method was usedto create smaller State subsets from the 24-State, Round 1 cross-section. Again, States were chosento achieve a balance from the quartiles describing pollution potential, and a balanced geographicdistribution, to incrementally build subset cross-sections of various sizes. For example, the Round 1cross-section was tested with subsets of 4, 8 (the first 4 State subset plus 4 more States), and 13 (8State subset plus 5) States. Two additional cross-sections were included in the analysis forcomparison; a cross-section composed of 16 States with biased data sets eliminated from the 24 Statecross-section for data quality reasons and a cross-section composed of all 40 Round 1 States(USEPA, 2001b section III.B.1).
These Round 1 incremental cross-sections were then used to evaluate occurrence for an array ofboth high and low occurrence contaminants. The comparative results illustrate several points. The

Regulatory Determination Support Document for Naphthalene July 2003
15
results are quite stable and consistent for the 8, 13 and 24 State cross-sections. They are much less sofor the 4 State, 16 State (biased), and 40 State (all Round 1 States) cross-sections. The 4 State cross-section is apparently too small to provide balance both geographically and with pollution potential, afinding that concurs with past work (USEPA, 1999d). The CMR analysis suggested that a minimum of6-7 States was needed to provide balance both geographically and with pollution potential, and theCMR report used 8 States out of the available data for its nationally representative cross-section. The16 State and 40 State cross-sections, both including biased States, provided occurrence results thatwere unstable and inconsistent for a variety of reasons associated with their data quality problems(USEPA, 2001b section III.B.1)
The 8, 13, and 24 State cross-sections provide very comparable results, are consistent, and areusable as national cross-sections to provide estimates of contaminant occurrence. Including greaterdata from more States improves the national representation and the confidence in the results–as long asthe States are balanced related to pollution potential and spatial coverage. The 24 and 20 State cross-sections provide the most nationally representative cross-sections for the Round 1 and Round 2 data
Table 3-3: Cross-section States for Round 1 (24 States) and Round 2 (20 States)
Round 1 (URCIS) Round 2 (SDWIS/FED)
Alabama Alaska*ArizonaCaliforniaFloridaGeorgiaHawaiiIllinoisIndianaIowaKentucky*Maryland*
Minnesota*MontanaNew JerseyNew Mexico*North Carolina*Ohio*South DakotaTennesseeUtahWashington*West VirginiaWyoming
Alaska*ArkansasColoradoKentucky*MaineMaryland*MassachusettsMichiganMinnesota*Missouri
New HampshireNew Mexico*North Carolina*North DakotaOhio*OklahomaOregonRhode IslandTexasWashington*
* cross-section State in both Round 1 and Round 2

Regulatory Determination Support Document for Naphthalene July 2003
16
Figure 3-1: Geographic distribution of cross-section States for Round 1 (left) and Round 2(right).
Regulatory Determination Support Document for Naphthalene July 2003
17
3.3.1.3 Data Management and Analysis
The cross-section analyses focused on occurrence at the water system level; i.e., the summary datapresented discuss the percentage of public water systems with detections, not the percentage ofsamples with detections. By normalizing the analytical data to the system level, skewness inherent inthe sample data, particularly over the multi-year period covered in the URCIS data, is avoided. System level analysis was used since a PWS with a known contaminant problem usually has to samplemore frequently than a PWS that has never detected the contaminant. Obviously, the results of asimple computation of the percentage of samples with detections (or other statistics) can be skewed bythe more frequent sampling results reported by the contaminated site. This level of analysis isconservative. For example, a system need only have a single sample with an analytical result greaterthan the MRL, i.e., a detection, to be counted as a system with a result “greater than the MRL.”
Also, the data used in the analyses were limited to only those data with confirmed water source andsampling type information. Only standard SDWA compliance samples were used; “special” samples,or “investigation” samples (investigating a contaminant problem that would bias results), or samples ofunknown type were not used in the analyses. Various quality control and review checks were made ofthe results, including follow-up questions to the States providing the data. Many of the most intractabledata quality problems encountered occurred with older data. These problematic data were, in somecases, simply eliminated from the analysis. For example, when the number of data with problems wereinsignificant relative to the total number of observations they were dropped from the analysis (Forfurther details see Cadmus, 2000).
As indicated above, New Hampshire generally is included in the 20-State, Round 2 national cross-section. Naphthalene occurrence data from the State of New Hampshire, however, are biased. NewHampshire reports only 5 samples from three systems for Naphthalene with each system showing adetection. Though these results are simple detections not violating a health effect standard, andinclusion of the data does not significantly affect overall summary statistics, to maintain a consistentmethod for managing biased data, New Hampshire’s naphthalene data were omitted from Round 2cross-section occurrence analyses and summaries presented in this report.
3.3.1.4 Occurrence Analysis
To evaluate national contaminant occurrence, a two-stage analytical approach has been developed. The first stage of analysis provides a straightforward, conservative, non-parametric evaluation ofoccurrence of the CCL regulatory determination priority contaminants as described above. TheseStage 1 descriptive statistics are summarized here. Based in part on the findings of the Stage 1Analysis, EPA will determine whether more rigorous parametric statistical evaluations, the Stage 2Analysis, may be warranted to generate national probability estimates of contaminant occurrence andexposure for priority contaminants (for details on this two stage analytical approach see Cadmus, 2000,2001).

Regulatory Determination Support Document for Naphthalene July 2003
18
The summary descriptive statistics presented in Table 3-4 for naphthalene are a result of the Stage1 analysis and include data from both Round 1 (URCIS, 1987-1992) and Round 2 (SDWIS/FED,1993-1997) cross-section States (minus New Hampshire). Included are the total number of samples,the percent samples with detections, the 99th percentile concentration of all samples, the 99th percentileconcentration of samples with detections, and the median concentration of samples with detections. The percentages of PWSs and population served indicate the proportion of PWSs whose analyticalresults showed a detection(s) of the contaminant (simple detection, > MRL) at any time during themonitoring period; or a detection(s) greater than half the HRL; or a detection(s) greater than the HealthReference Level.
Naphthalene is not considered to be a linear carcinogen by the oral route of exposure. Accordingly, the Maximum Contaminant Level Goal (MCLG) is derived using a Reference Dose (RfD)approach. The value used as the HRL for this occurrence evaluation is derived from the RfD using thefollowing equation:
HRL = RfD x Body Weight x Relative Source ContributionDrinking Water Intake
The body weight used in the calculation is an average adult body weight (70 Kg) and the value for dailywater intake is 2 L. In the calculation of the HRL, the relative source contribution is 20%. A differentrelative source factor might be used to calculate the MCLG if a determination is made to regulatenaphthalene.
The 99th percentile concentration is used here as a summary statistic to indicate the upper bound ofoccurrence values because maximum values can be extreme values (outliers) that sometimes result fromsampling or reporting error. The 99th percentile concentration is presented for both the samples withonly detections and all of the samples because the value for the 99th percentile concentration of allsamples is below the MRL (denoted by “<” in Table 3-4). For the same reason, summary statisticssuch as the 95th percentile concentration of all samples or the median (or mean) concentration of allsamples are omitted because these also are all “<” values. This is the case because only 0.43% and0.23% of all samples recorded detections of naphthalene in Round 1 and Round 2, respectively.
As a simplifying assumption, a value of half the MRL is often used as an estimate of theconcentration of a contaminant in samples/systems whose results are less than the MRL. With acontaminant with relatively low occurrence such as naphthalene in drinking water occurrence databases,the median or mean value of occurrence using this assumption would be half the MRL (0.5 * MRL). However, for these occurrence data this is not straightforward. For Round 1 and Round 2, States havereported a wide range of values for the MRLs. This is in part related to State data managementdifferences as well as real differences in analytical methods, laboratories, and other factors.
The situation can cause confusion when examining descriptive statistics for occurrence. Forexample, for Round 2 most States reported non-detections as zeros resulting in a modal MRL value ofzero. By definition the MRL cannot be zero. This is an artifact of State data management systems.
Regulatory Determination Support Document for Naphthalene July 2003
19
Because a simple meaningful summary statistic is not available to describe the various reported MRLs,and to avoid confusion, MRLs are not reported in the summary table (Table 3-4).
In Table 3-4, national occurrence is estimated by extrapolating the summary statistics for the 24and 20 State cross-sections (minus New Hampshire) to national numbers for systems, and populationserved by systems, from the Water Industry Baseline Handbook, Second Edition (USEPA, 2000g). From the handbook, the total number of CWSs plus NTNCWSs is 65,030, and the total populationserved by CWSs plus NTNCWSs is 213,008,182 persons (see Table 3-4). To generate the estimateof national occurrence based on the cross-section occurrence findings, the national number of PWSs(or population served by PWSs) is simply multiplied by the percentage value for the particular crosssection occurrence statistic [e.g., the national estimate for the total number of PWSs with detections(769) is the product of the total number of PWSs (65,030) and the percentage of PWSs withdetections (1.18%) and the national estimate for the total number of PWSs (65,030)].
Because the State data used for the cross-section are not a strict statistical sample, nationalextrapolations of these Stage 1 analytical results can be problematic, especially for contaminants withvery low occurrence like naphthalene and other CCL regulatory determination priority contaminants. For this reason, the nationally extrapolated estimates of occurrence based on Stage 1 results are notpresented in the Federal Register Notice. The presentation in the Federal Register Notice of only theactual results of the cross-section analysis maintains a straight-forward presentation, and the integrity ofthe data, for stakeholder review. The nationally extrapolated Stage 1 occurrence values are presentedhere, however, to provide additional perspective. A more rigorous statistical modeling effort, the Stage2 analysis, could be conducted on the cross-section data (Cadmus, 2001). The Stage 2 results wouldbe more statistically robust and more suitable to national extrapolation. This approach would provide aprobability estimate and would also allow for better quantification of estimation error.
Round 1(1987-1992) and Round 2 (1993-1997) data were not merged because they representdifferent time periods, different States (only eight States are represented in both rounds), and eachround has different data management and data quality problems. The two rounds are only merged forthe simple spatial analysis overview presented in section 3.3.2.2 and Figures 3-2 and 3-4.
3.3.2 Results
3.3.2.1 Occurrence Estimates
While States with detections of naphthalene are widespread (Figure 3-2), the percentages of PWSsby State with detections are modest (Table 3-4). In aggregate, the cross-sections show approximately0.8% to 1.2% of PWSs in both rounds experienced detections (> MRL), affecting 3.0% to 4.8% ofthe population served (approximately 6 - 10 million people). Percentages of PWSs with detectionsgreater than half the Health Reference Level (> ½ HRL) are much lower for both rounds: 0.01%. Thepercentage of PWSs exceeding the Health Reference Level (> HRL) is also very small (see also Figure3-4). Detections greater than the HRL were only reported in Round 1: 0.01% of PWSs, affecting apopulation of approximately 16,000.

Regulatory Determination Support Document for Naphthalene July 2003
20
Note that for the Round 1 cross-section, the total number of PWSs (and the total population servedby the PWSs) is not the sum of the number of ground water and surface water systems (or thepopulations served by those systems). Because some public water systems are seasonally classified aseither surface or ground water, some systems may be counted in both categories. The populationnumbers for the Round 1 cross-section are also incomplete. Not all of the PWSs for which occurrencedata was submitted reported the population they served. (However, the population numbers presentedin Table 3-4 for the Round 1 cross-section are reported from approximately 95% of the systems.)
The national estimates extrapolated from Round 1 and Round 2 PWS numbers and populations arenot additive either. In addition to the Round 1 classification and reporting issues outlined above, theproportions of surface water and ground water PWSs, and populations served by them, are differentbetween the Round 1 and 2 cross-sections and the national estimates. For example, approximately63% of the population served by PWSs in the Round 2 cross-section States are served by surfacewater PWSs (Table 3-4). Nationally, however, that proportion changes to 60%.
Both Round 1 and Round 2 national cross-sections show a proportionate balance in PWS sourcewaters compared to the national inventory. Nationally, 91% of PWSs use ground water (and 9% ofsurface water): Round 1 shows 89% and Round 2 shows 90% of systems using ground water. Therelative populations served are not as closely comparable. Nationally, about 40% of the population isserved by PWSs using ground water (and 60% by surface water). Round 2 data is most representativewith 37% of the cross-section population served by ground water; Round 1 shows about 55%.
There are differences in the occurrence results between Round 1 and Round 2, as should beexpected. The differences are not great, however, particularly when comparing the proportions ofsystems affected. The results range from 0.8% to 1.2% of PWSs with detections of naphthalene andrange from 0.00% to 0.01% of PWSs with detections greater than the HRL of 140 µg/L. These arenot substantively different, given the data sources. The differences in the population extrapolationsappear greater, but still constitute relatively small proportions of the population. Less than 5.0% of thepopulation served by PWSs in either round are served by systems with detections and only 0.01% ofthe population served by Round 1 PWSs were served by systems with detections greater than theHRL.
The Round 2 cross-section provides a better proportional balance related to the national populationof PWSs and may have fewer reporting problems than Round 1. The non-zero estimate of the nationalpopulation served by PWSs with detections greater than the HRL using Round 1 data can also providean upper bound estimate in considering the data.
3.3.2.2 Regional Patterns
Occurrence results are displayed graphically by State in Figures 3-2, 3-3, and 3-4 to assesswhether any distinct regional patterns of occurrence are present. Combining Round 1 and Round 2data (Figure 3-2), there are forty-seven States reporting. Four of those States have no data fornaphthalene, while another 11 have no detections of the chemical. The remaining 32 States have

Regulatory Determination Support Document for Naphthalene July 2003
21
24 State
Cross-Section1
(Round 1)
20 State
Cross-Section2
(Round 2)Total Number of Samples 45,567 94,910
Percent of Samples with Detections 0.43% 0.23%
99t h
Percentile Concentration (all samples) < (Non-detect) < (Non-detect)
Health Reference Level 140 µg/L 140 µg/L
Minimum Reporting Level (MRL) Variable4
Variable4
99t h
Percentile Concentration of Detections 900 µg/L 73 µg/L
Median Concentration of Detections 1.0 µg/L 0.73 µg/L
Total Number of PWSs 13,452 22,923Number of GW PWSs 12,034 20,524Number of SW PWSs 1,502 2,399
Total Population 77,209,916 67,498,059Population of GW PWSs 42,218,746 25,185,032Population of SW PWSs 41,987,010 42,313,027
Occurrence by System Round 1 Round 2 % PWSs with detections (> MRL) 1.18% 0.75% 769 491
Range of Cross-Section States 0 - 28.24% 0 - 4.48% N/A N/AGW PWSs with detections 1.08% 0.62% 642 368SW PWSs with detections 1.93% 1.92% 108 107
% PWSs > 1/2 Health Reference Level (HRL) 0.01% 0.01% 10 6Range of Cross-Section States 0 - 1.53% 0 - 0.06% N/A N/AGW PWSs > 1/2 Health Reference Level 0.02% 0.01% 10 6SW PWSs > 1/2 Health Reference Level 0.00% 0.00% 0 0
% PWSs > Health Reference Level 0.01% 0.00% 10 0Range of Cross-Section States 0 - 1.53% 0.00% N/A N/AGW PWSs > Health Reference Level 0.02% 0.00% 10 0SW PWSs > Health Reference Level 0.00% 0.00% 0 0
Occurrence by Population Served% PWS Population Served with detections 2.910% 4.790% 6,198,000 10,204,000
Range of Cross-Section States 0 - 37.22% 0 - 31.41% N/A N/AGW PWS Population with detections 4.005% 1.162% 3,431,000 995,000SW PWS Population with detections 1.323% 6.950% 1,685,000 8,849,000
% PWS Population Served > 1/2 Health Reference Level 0.007% 0.002% 16,000 5,000Range of Cross-Section States 0 - 0.23% 0 - 0.01% N/A N/AGW PWS Population > 1/2 Health Reference Level 0.013% 0.007% 11,000 6,000SW PWS Population > 1/2 Health Reference Level 0.000% 0.000% 0 0
% PWS Population Served > Health Reference Level 0.007% 0.000% 16,000 0Range of Cross-Section States 0 - 0.23% 0.000% N/A N/AGW PWS Population > Health Reference Level 0.013% 0.000% 11,000 0SW PWS Population > Health Reference Level 0.000% 0.000% 0 0
--
--
--
213,008,182
--
--
--
85,681,696127,326,486
National Extrapolation5
Frequency Factors
59,4405,590
National System &
Population Numbers3
--
65,030
Table 3-4: Summary occurrence statistics for naphthalene
1. Summary Results based on data from 24-State Cross-Section, from URCIS, UCM (1987) Round 1.2. Summary Results based on data from 20-State Cross-Section (minus New Hampshire), from SDWIS/FED, UCM (1993) Round 2.3. Total PWS and population numbers are from EPA March 2000 Water Industry Baseline Handbook.4. See Section 3.3.1.4 for discussion5. National extrapolations are from the 24-State data and 20-State data using the Baseline Handbook system and population numbers.- PWS = Public Water Systems; GW = Ground Water; SW = Surface Water; MRL = Minimum Reporting Level (for laboratory analyses); - HRL = Health Reference Level, an estimated health effect level used for preliminary assessment for this review; N/A = Not Applicable- The Health Reference Level used for naphthalene is 140 :g/L. This is a draft value for working review only.- Total Number of Samples = the total number of analytical records for naphthalene.- 99th Percentile Concentration = the concentration value of the 99th percentile of either all analytical results or just the samples with detections (in :g/L).- Median Concentration of Detections = the median analytical value of all the detections (analytical results greater than the MRL (in :g/L).- Total Number of PWSs = the total number of public water systems with records for naphthalene.- Total Population Served = the total population served by public water systems with records for naphthalene.- % PWS with detections, % PWS > ½ Health Reference Level, % PWS > Health Reference Level = percent of the total number of public water systems with atleast one analytical result that exceeded the MRL, ½ Health Reference Level, Health Reference Level, respectively.

Regulatory Determination Support Document for Naphthalene July 2003
22
Naphthalene Detections in Round 1 and Round 2
All States
States not in Round 1 or Round 2No data for NaphthaleneStates with No Detections (No PWSs > MRL)States with Detections (Any PWS > MRL)
Figure 3-2: States with PWSs with detections of naphthalene for all States with data in URCIS(Round 1) and SDWIS/FED (Round 2)

Regulatory Determination Support Document for Naphthalene July 2003
23
Naphthalene Occurrence in Round 1States not in Cross-SectionNo data for Naphthalene0.0 0% PWSs > MRL0.0 1 - 1.00% PWSs > MRL1.0 0 - 4.00% PWSs > MRL** Outliers: State of Alabama at 28.3%; State of Florida at 7.0%
States not in Cross-SectionNo data for N aphthalene0.00% PWSs > MRL0.01 - 1.00% PWSs > MRL1.00 - 4.00% PWSs > MRL** State of New Hampshire is an outlier at 100%
Naphthalene Occurrence in Ro und 2
Figure 3-3: States with PWSs with detections of naphthalene (any PWSs with results greaterthan the Minimum Reporting Level [MRL]) for Round 1 (above) and Round 2 (below) cross-section States

Regulatory Determination Support Document for Naphthalene July 2003
24
Naphthalene Occurrence in Round 1 and Round 2
States not in Cross-SectionNo data for Naphthalene0.0 0% PWSs > MRL0.0 1 - 1.00% PWSs > MRL1.0 0 - 4.00% PWSs > MRL** Outliers: State of Alabama at 28.3%; State of Florida at 7.0%; State of New Hampshire at 100%
Naphthalene Occurrence in Round 1 and Round 2
States not in Cross-SectionNo data for Naphth alene
0.01 - 1.00% PWSs > H RL1.00 - 4.00% PWSs > H RL
0.00% PWSs > HRL
Figure 3-4: Cross-section States (Round 1 and Round 2 combined) with PWSs with detectionsof naphthalene (above) and concentrations greater than the Health Reference Level (below)

Regulatory Determination Support Document for Naphthalene July 2003
25
detected naphthalene in drinking water and are well distributed throughout the United States. Incontrast to the summary statistical data presented in the previous section, this simple spatial analysisincludes the biased New Hampshire data.
The simple spatial analysis presented in Figures 3-2, 3-3, and 3-4 suggests that special regionalanalyses are not warranted because naphthalene occurrence at concentrations below the HRL iswidespread. While no clear geographical patterns of occurrence are apparent, comparisons withenvironmental use and release information are useful (see also section 3.1.2). The 47 TRI Statesreporting releases of naphthalene to the environment include all of the States that detected it in drinkingwater except New Hampshire. Also, four of the six States that have not detected naphthalene in sitesamples reported to ATSDR’s HazDat database, and three of the six States where it was not detectedat CERCLA NPL sites, have detected it in drinking water.
3.4 Conclusion
Naphthalene has been detected in untreated ambient ground water samples reviewed and/oranalyzed by the USGS NAWQA program. Detection frequencies and concentrations for all wells arerelatively low; however, occurrence is considerably higher for urban wells when compared to ruralwells. Naphthalene has been detected at slightly higher frequencies in urban and highway runoff. Concentrations in runoff are low, with maximum concentrations well below the current HAL of 100µg/L. Naphthalene has also been found at ATSDR HazDat and CERCLA NPL sites across thecountry and releases have been reported through the Toxic Release Inventory.
Naphthalene has also been detected in PWS samples collected under SDWA. Occurrenceestimates are low for Round 1 and Round 2 monitoring with only 0.43% and 0.23% of all samplesshowing detections, respectively. Significantly, the values for the 99th percentile and medianconcentrations of all samples are less than the MRL. For Round 1 samples with detections, the medianconcentration is 1.0 µg/L and the 99th percentile concentration is 900 µg/L. Median and 99th percentileconcentrations for Round 2 detections are 0.73 µg/L and 73 µg/L, respectively. Systems withdetections constitute only 1.2% of Round 1 systems and 0.8% of Round 2 systems (an estimate of 769(Round 1) and 491 (Round 2) systems nationally). National estimates for the population served byPWSs with detections are also low, especially for detections greater than the HRL. It is estimated thatless than 0.01% of the national PWS population is served by systems with detections greater than theHRL (approximately 16,000 people).
In summary, the occurrence data indicate that naphthalene is infrequently detected in ambientwaters or public water systems in the United States. Furthermore, when naphthalene is detected, itvery rarely exceeds the HRL or a value of one-half of the HRL. Therefore, in relation to the keydetermination criterion the occurrence data indicate that naphthalene does not occur in public watersystems with a frequency, or at levels, of public health concern.

Regulatory Determination Support Document for Naphthalene July 2003
26
4.0 HEALTH EFFECTS
A full description of the health effects and the dose-response information for threshold and non-threshold effects associated with exposure to naphthalene are presented in Chapters 7 and 8 of theHealth Effects Support Document for Naphthalene (USEPA, 2003). A summary of the pertinentfindings are presented below.
4.1 Hazard Characterization and Mode of Action Implications
Data for the human health effects of naphthalene are limited. Medical case reports of accidentaland intentional ingestion identify hemolytic anemia (breakdown of red-blood cells) and cataracts assignificant outcomes of oral exposure in humans. Case reports of individuals (primarily infants) exposedto naphthalene via dermal contact, inhalation, or a combination of both exposure routes point tohemolytic anemia and its consequences such as jaundice and enlargement of the spleen as the mostcommonly manifested toxic effects in humans following exposure at concentrations that exceed averageenvironmental levels. There are no reliable human toxicity data for subchronic or chronic exposure tonaphthalene.
In animals, acute or subchronic exposure to relatively high oral doses (200 to 700 mg/kg orgreater) of naphthalene resulted in hemolytic anemia (dogs only) and cataracts (rats and rabbits). Lower oral doses of naphthalene (less than 200 to 400 mg/kg) administered to rats and mice in threesubchronic studies resulted in decreased body weight, central nervous system depression, and alteredorgan weights, but did not result in hemolytic anemia or cataracts. No treatment-related lesions wereobserved in studies reporting histopathology. A limitation of the health effects database for naphthaleneis the lack of adequately designed chronic oral exposure studies in animals.
There is no evidence of developmental effects in animals after exposure to naphthalene doses of120 mg/kg or less. Developmental studies at higher doses produced inconsistent results with regard tomaternal and fetal effects.
The available data for mode of action indicate that oxidative metabolism of naphthalene followingoral or inhalation exposure produces a variety of reactive metabolites. These metabolites subsequentlyreact with cellular macromolecules such as those in cell membranes or enzymes to elicit toxicity in targettissues such as the blood, eye, and (in animal inhalation studies) nose and lung. Direct exposure of thecells lining the respiratory tract causes inflamation, tissue damage, and reparative cell division. Althoughnaphthalene does not appear to be directly genotoxic, long term inhalation exposure of mice and ratshas caused development of adenomas (benign tumors) and carcinomas in the nasal cavity (rats) andlungs (female mice). Naphthalene does not appear to be carcinogenic by the oral route.
People with impaired cellular defense capabilities may be more susceptible to naphthalene toxicity. The finding that individuals deficient in the enzyme glucose-6-phosphate dehydrogenase (G6PD) aremore likely to develop hemolytic anemia following exposure to naphthalene confirms this prediction andidentifies this group as a potentially susceptible population. Individuals with this deficiency have lower

Regulatory Determination Support Document for Naphthalene July 2003
27
levels of reduced glutathione, a compound which normally protects red blood cells against oxidativedamage. G6PD-deficient neonates, infants, and the fetus are particularly sensitive to naphthalenetoxicity because the metabolic pathways responsible for detoxification of reactive naphthalenemetabolites are not yet well developed. In addition, these groups have low levels of methemoglobinreductase, increasing their vulnerability in the period immediately after birth. Methemoglobin is a formof hemoglobin in which the iron has been changed so that the red blood cell can no longer carryoxygen. Naphthalene and other chemicals can change the iron in hemoglobin from its +2 to its +3 statecausing methemoglobinemia. The enzyme methemoglobin reductase is responsible for returning the ironin hemoglobin to its normal +2 state and restoring the ability to bind with oxygen.
4.2 Dose-Response Characterization and Implications in Risk Assessment
Information on the human health effects of naphthalene has been obtained from medical casereports of intentional or accidental ingestion. The usefulness of case study data for assessing risk fromdrinking water ingestion are limited by one or more of the following factors: quantitative exposure dataare not available in most case reports; the toxicokinetics of a single large dose may differ from those ofchronic low-level exposure; and/or the low aqueous solubility of naphthalene may prevent theoccurrence of concentrations in drinking water that are comparable to the doses that require medicalattention. The limited human exposure data from case reports suggest that cataracts occurred followinga single dose of approximately 71 mg/kg consumed over 13 hours (Lezenius, 1902). Indications ofhemolytic anemia resulted after a single oral dose of approximately 109 mg/kg (Gidron and Leurer,1956).
All available dose-response information for naphthalene toxicity in animals is extensivelysummarized in Table 7-7 in the Health Effects Support Document for Naphthalene (USEPA, 2003). Five key studies are summarized below. These five studies currently provide the most reliableinformation on threshold levels for naphthalene toxicity in animals exposed via the oral route. Includedin this group are two short-term studies and three subchronic studies. There are presently noadequately designed chronic oral exposure studies.
In short-term studies, a Lowest Observed Adverse Effect Level (LOAEL) of 50 mg/kg-day (thelowest dose tested) was identified for transient signs of neurotoxicity (i.e. slowed respiration andmovement) in pregnant rats administered naphthalene on gestation days 6–15 (NTP, 1991). A NoObserved Adverse Effect Level (NOAEL) of 53 mg/kg-day and LOAEL of 267 mg/kg-day wereidentified for effects on body weight and organ weight observed in a 14-day study conducted in mice(Shopp et al., 1984). In subchronic studies, NOAEL and LOAEL values of 100 mg/kg-day and 200mg/kg-day, respectively, were identified in 13-week studies conducted in rats and mice (BCL, 1980a,b). The corresponding duration-adjusted values are 71 mg/kg-day and 143 mg/kg-day, respectively. The LOAEL in rats was identified on the basis of decreased terminal body weight, while the LOAEL inmice was identified on the basis of transient clinical signs of toxicity observed during weeks 3 to 5 of thestudy. In the third subchronic study, NOAEL and LOAEL values of 53 mg/kg-day and 133 mg/kg-day, respectively, were identified on the basis of changes in organ weights and data suggestive of

Regulatory Determination Support Document for Naphthalene July 2003
28
changes in enzyme activity observed in mice administered naphthalene for 90 days (Shopp et al.,1984).
For hemolytic anemia and cataracts (the endpoints of greatest relevance to humans), the availableanimal data are limited by deficiencies in study design, including the use of a single high dose (typically500 to 2,000 mg/kg-day) and/or an inadequate number of test animals. NOAEL and LOAEL valuestherefore cannot be identified in these studies. Holmen et al. (1999) identified a LOAEL of 500 mg/kg-day for ocular changes in a multidose study where rats were dosed twice weekly for 10 weeks.
To place short-term and subchronic dose-response information in perspective, a high-end estimateof naphthalene intake can be calculated. The solubility of naphthalene in water is 31 mg/L. Assumingthat naphthalene is present at the limit of solubility, the dose to a 70 kg adult consuming 2 L of drinkingwater per day would be 0.9 mg/kg-day. The dose to a 10 kg child consuming 1 L of drinking waterper day would be 3.1 mg/kg-day. Comparison of these doses to the threshold levels for naphthalenetoxicity indicates that the human LOAEL values are at least an order of magnitude greater than theestimated high-end dose.
The RfD for naphthalene is 2 × 10⁻² mg/kg-day (USEPA, 1998c). The RfD is an estimate (withuncertainty spanning perhaps an order of magnitude) of a daily oral exposure to the human population(including sensitive subgroups) that is likely to be without an appreciable risk of deleterious effectsduring a lifetime. Because there are no adequate chronic oral exposure studies for naphthalene, theRfD is based on a NOAEL of 71 mg/kg-day identified for lack of effect on terminal body weight inmale rats orally exposed to naphthalene for 13 weeks (BCL, 1980a). An uncertainty factor of 3,000was used in the derivation of the RfD to account for use of a subchronic study (factor of 10),extrapolation from humans to animals (factor of 10), variability in human populations (factor of 10), andlack of multidose studies in species that are sensitive to hemolytic anemia and cataracts (factor of 3). The derivation of the RfD for naphthalene is discussed in section 8.1.1 of the Drinking Water SupportDocument for Naphthalene (USEPA, 2003).
The Reference Concentration (RfC) for naphthalene is 3 × 10⁻³ mg/m3 (USEPA, 1998c). The RfCis an estimate (with uncertainty spanning perhaps an order of magnitude) of a continuous inhalation doseto the human population (including sensitive subgroups) that is likely to be without appreciable risk ofadverse effects over a lifetime of exposure. The RfC for naphthalene is based on lesions of the noseobserved in a chronic inhalation study of naphthalene in mice (NTP, 1992). Details of the RfCderivation are provided in section 8.1.6 of the Health Effects Support Document for Naphthalene(USEPA, 2003). Comparison of inhalation doses to the RfC can be useful in the risk assessment ofcontaminants that readily volatilize from drinking water during household activities. In the case ofnaphthalene, volatilization from water is expected to be minimal.
No quantitative dose-response analysis (including dose-conversion, extrapolation methods, oralslope factor or inhalation unit risk) for cancer is presented at this time due to the weakness of evidencethat naphthalene may be carcinogenic in humans.
Regulatory Determination Support Document for Naphthalene July 2003
29
4.3 Relative Source Contribution
Relative source contribution analysis compares the magnitude of exposure expected via drinkingwater to the magnitude of exposure from intake of naphthalene in other media such as food, air, andsoil. To perform this analysis, intake of naphthalene from drinking water must be estimated. Drinkingwater occurrence data for naphthalene are presented in section 3.3. The median and 99th percentileconcentrations for naphthalene were below the MRL when all samples (i.e., those with detectable andnondetectable levels of naphthalene) from either Round 1 or Round 2 were analyzed.
As a simplifying assumption, a value of one-half of the MRL is often used as an estimate of theconcentration of a contaminant when the results are less than the MRL. Because a single estimate ofthe MRL for naphthalene was unavailable [see section 5.4.1 of the Health Effects Support Documentfor Naphthalene (USEPA, 2003)], two alternative approaches were used to estimate average dailyintakes from drinking water. The reported detection limits for naphthalene range from 0.01 :g/L for themost sensitive to 3.3 :g/L for the least sensitive methods (ATSDR, 1995). If a value of one-half thedetection limit is used as a rough estimate of the concentration of naphthalene, this equates to a range of0.005 to 1.65 :g/L. Assuming intake of 2 L/day of drinking water by a 70 kg adult, the average dailydose would be 1.4 × 10⁻³ to 47.1 × 10⁻³ :g/kg-day (1.4 to 47.1 ng/kg-day). The corresponding dosefor a 10 kg child consuming 1 L/day of drinking water would be 0.5 x 10⁻³ to 165 × 10-3 :g/kg-day(0.5 to 165 ng/kg-day). Alternatively, if the median concentration for naphthalene in samples withdetectable levels (approximately 1 :g/L) is used, the average daily doses to an adult and child would be28.6 × 10-3 and 100 × 10-3 :g/kg-day (28.6 and 100 ng/kg-day), respectively.
Collectively, available data indicate that intake from drinking water will often be relatively low whencompared to intake from other media. The estimated average daily intakes of naphthalene fromdrinking water (based on median detected concentrations) and other media were used to calculateestimated ratios of the exposure from each medium to the exposure from water. The estimatedfood:drinking water exposure ratio ranges from 1 to 8 for an adult and from 2 to 9 for a child. Theestimated air:drinking water exposure ratio is 39 for an adult and 45 for a child. The range of estimatednaphthalene intake from soil is very broad for both children and adults; thus the soil water intake ratiowill be highly scenario-dependent. For an adult, the estimated soil:drinking water exposure ratio rangesfrom less than 1 to 103. For a child, the estimated soil:drinking water exposure ratio ranges from 2 to430.
4.4 Sensitive Populations
The sensitive populations identified for naphthalene include individuals (including infants, neonatesand the fetus) deficient in the enzyme G6PD. This enzyme helps protect red blood cells from oxidativedamage. The enzyme deficiency makes red blood cells more sensitive to a variety of toxins, includingnaphthalene. Thus, the hemolytic response to naphthalene is enhanced in G6PD-deficient individuals. Higher rates of inherited G6PD deficiency are found among the people of Asia, Greece, Italy, the

Regulatory Determination Support Document for Naphthalene July 2003
30
Middle East, and Africa. In the United States, an estimated 5.2% to 11.5% of the population has aninherited G6PD deficiency (Luzzatto and Mehta, 1989). Because this defect is linked to the X-chromosome, males are more likely to be affected than females.
New-born infants are generally considered to be more sensitive to naphthalene toxicity because themetabolic pathways for conjugation of naphthalene are not well developed. New-born infants alsohave low levels of methemoglobin reductase, which may compound and prolong some effects ofhemolytic anemia.
Calculation of medium-specific exposure ratios indicates that naphthalene intake from air is about40-fold greater than intake from water. Naphthalene intakes from food and soil may also besignificantly greater (up to 9-fold greater and 430-fold greater for a child, respectively) than from water,depending on the exposure scenario. Therefore, regulation of naphthalene in drinking water would beunlikely to significantly reduce the risk to sensitive populations.
4.5 Exposure and Risk Information
Approximately 6 to 10 million people are served by systems with detections greater than the MRL. An estimated 5,000 of these individuals may be served by systems with detections greater than one-halfthe HRL based on Round 2 monitoring data, but exposures above the HRL would be rare andlocalized. Prevalence data for G6PD deficiency in the United States indicate that 5.2% to 11.5% of theexposed individuals may have reduced activity of G6PD and, thus, have an increased risk formethemoglobinemia and possibly hemolytic anemia if exposed to moderate-to-high doses ofnaphthalene. Methemoglobinemia is a precursor event to hemolysis induced by naphthalene, as well asby a variety of other chemical agents. Hemolytic anemia is an acute effect that is precipitated when theoxidative damage to the red blood cell is sufficient to cause breakdown of the cell membrane. Neonates and infants have reduced protection against methemoglobinemia due to developmental delaysin the activity of methemoglobin reductase, a protective enzyme.
Hemolytic anemia is an acute effect that occurs at moderate-to-high doses of naphthalene. Whenaverage daily intakes from drinking water are compared with intakes from food, air and soil, drinkingwater accounts for a relatively small proportion of total naphthalene intake. On the basis of theseobservations, the impact of regulating naphthalene concentrations in drinking water on health risk islikely to be small.
4.6 Conclusion
In conclusion, while there is evidence that naphthalene may have adverse health effects in humans athigh doses, it is unlikely that it will occur in drinking water at frequencies or concentrations that are ofpublic health concern. There are inadequate data to support a conclusion about the carcinogenicity ofnaphthalene by the oral route of exposure. All CCL regulatory determinations and further analysis areformally presented in the Federal Register Notices (USEPA, 2002a; 67 FR 38222; and USEPA,2003a; 68 FR 42898).

Regulatory Determination Support Document for Naphthalene July 2003
31
5.0 TECHNOLOGY ASSESSMENT
If a determination has been made to regulate a contaminant, SDWA requires development ofproposed regulations within two years of making the decision. It is critical to have suitable monitoringmethods and treatment technologies to support regulation development according to the schedulesdefined in the SDWA.
5.1 Analytical Methods
The availability of analytical methods does not influence EPA’s determination of whether or not aCCL contaminant should be regulated. However, before EPA actually regulates a contaminant andestablishes a Maximum Contaminant Level (MCL), there must be an analytical method suitable forroutine monitoring. Therefore, EPA needs to have approved methods available for any CCL regulatorydetermination contaminant before it is regulated with an NPDWR. These methods must be suitable forcompliance monitoring and should be cost effective, rapid, and easy to use.
Naphthalene is an unregulated contaminant for which monitoring was required under theUnregulated Contaminant Monitoring program (USEPA, 1987; 52 FR 25690). It already has well-documented analytical methods developed specifically for low-level drinking water analyses.
For naphthalene, there are two analytical methods available. EPA Method 524.2 is a wellestablished, and sensitive, purge and trap gas chromatographic/mass spectrometry (GC/MS) methodwith a detection limit of 0.04 µg/L. EPA Method 502.2, a purge and trap method using conventionalgas chromatography detectors (PID and ELCD in series), has a method detection limit of 0.02 µg/L.
5.2 Treatment Technology
Treatment technologies also do not influence the determination of whether or not a contaminantshould be regulated. But before a contaminant can be regulated with an NPDWR, treatmenttechnologies must be readily available. EPA’s Office of Research and Development (ORD) hasresearched treatment technologies for all of the organic compounds listed as regulatory determinationpriorities on the CCL, including naphthalene. The two appropriate technologies reviewed weregranular activated carbon (GAC) and air stripping.
Granular activated carbon treatment removes contaminants via the physical and chemical process ofsorption, by which the contaminants attach to the carbon surface as water passes through the carbonbed. Activated carbon has a large sorption capacity for many water impurities including syntheticorganic contaminants, taste and odor causing compounds, and some species of mercury. Adsorptioncapacity is typically represented by the Freundlich isotherm constants, with higher Freundlich (K) valuesindicating greater sorption potential.

Regulatory Determination Support Document for Naphthalene July 2003
32
Air stripping involves the continuous contact of air with the water being treated, allowing volatiledissolved contaminants to transfer from the source water to the air. After contact, the “contaminatedair” is swept from the system, taking the contaminant out of contact with the treated water. The drivingforce for the water-to-air transfer of the volatile contaminants is the contaminant’s concentrationgradient between the water and air. The Henry’s Law constant is a commonly used indicator of thetendency of a contaminant to partition from water to air. A larger Henry’s constant indicates a greaterequilibrium of the contaminant in the air. Thus, contaminants having larger Henry’s constant are moreeasily removed by air stripping.
Predictive computer modeling and specific chemical characteristics were used to determine theisotherm constants needed to evaluate the two treatment technologies. The rule of thumb used forSDWA compounds, learned through the development of cost-and-technology documents to supportother drinking water regulations, is that GAC is considered to be cost-effective if the contaminant has aFreundlich (K) value above 200 (Speth and Adams, 1993). For air stripping, a compound with aHenry’s constant above dibromochloropropane (0.005) or ethylene dibromide (0.037) is consideredstrippable at a reasonable cost.
Naphthalene has a predicted Freundlich (K) value of 25,000, so it can be effectively treated by theGAC method. However, because its predicted Henry’s Law constant is 0.02, naphthalene can onlyundergo effective air stripping procedures under certain concentration conditions.
6.0 SUMMARY AND CONCLUSIONS - DETERMINATION OUTCOME
Three statutory criteria are used to guide the determination of whether regulation of a CCLcontaminant is warranted: 1) the contaminant may adversely affect the health of persons; 2) thecontaminant is known or is likely to occur in public water systems with a frequency, and at levels, ofpublic health concern; and 3) regulation of the contaminant presents a meaningful opportunity for healthrisk reduction for persons served by public water systems. As required by SDWA, a decision toregulate a contaminant commits the EPA to propose an MCLG and promulgate a NPDWR for thecontaminant. A decision not to regulate a contaminant is considered a final Agency action and issubject to judicial review. The Agency can choose to publish a Health Advisory (a nonregulatoryaction) or other guidance for any contaminant on the CCL that does not meet the criteria for regulation.
The available toxicological data indicate that naphthalene has the potential to cause adverse healtheffects in humans and animals at high doses. In humans, hemolytic anemia is the most commonmanifestation of naphthalene toxicity. There are inadequate data to support a conclusion about thecarcinogenicity of naphthalene by the oral route of exposure.
Monitoring data indicate that naphthalene is infrequently detected in public water supplies. Whennaphthalene is detected, it very rarely exceeds the HRL) or a value of one-half of the HRL. Theavailable data for naphthalene production show downward trends. The physiochemical properties ofnaphthalene, and the available data for environmental fate, indicate that naphthalene in surface water is

Regulatory Determination Support Document for Naphthalene July 2003
33
likely to be rapidly degraded by biotic and abiotic processes and that it has little potential forbioaccumulation. Based on these data, it is unlikely that naphthalene will occur in public water systemsat frequencies or concentration levels that are of public health concern.
EPA considers exposure to both the general public and sensitive populations, including the fetus,infants, and children, in making its regulatory determination. Approximately 6 to 10 million people areserved by PWSs with detections greater than the Minimum Reporting Level. Based on Round 1monitoring, an estimated 16,000 individuals (about 0.007% of the population served by PWSs) areexposed to naphthalene at levels that exceed both one-half the HRL and the HRL. However, thisestimate was heavily influenced by results from samples collected at two ground water systems in oneof the cross-section States that can be considered to be outlier values. The Round 2-based estimate of5,000 individuals (approximately 0.002% of the population served) exposed to concentrations greaterthan ½ the HRL with no exposures at concentrations greater than the HRL appears to be a betterestimate of possible national exposure.
Infants and neonates (approximately 1.3% of the national population) and the fetus (approximately2.4% of the national population) may experience greater sensitivity to naphthalene toxicity than thegeneral population. Individuals deficient in the G6PD enzyme (approximately 5.2%-11.5% of thenational population) are also believed to be more sensitive to development of hemolytic anemia than thegeneral population. When average daily intakes from drinking water are compared with intakes fromfood, air and soil, drinking water accounts for a relatively small proportion of total naphthalene intake. These observations suggest that naphthalene regulation in drinking water would not present a meaningfulopportunity for health risk reduction.
While there is evidence that naphthalene may have adverse health effects in humans at high doses, itis unlikely that it will occur in drinking water at frequencies or concentrations that are of public healthconcern or that regulation of naphthalene represents a meaningful opportunity for health risk reduction inpersons served by public water systems. All CCL regulatory determinations and further analysis areformally presented in the Federal Register Notices (USEPA, 2002a; 67 FR 38222; and USEPA,2003a; 68 FR 42898).

This page intentionally left blank.

Regulatory Determination Support Document for Naphthalene July 2003
35
REFERENCES
Agency for Toxic Substances and Disease Registry (ATSDR). 1995. Toxicological Profile forNaphthalene (Update). Atlanta: Agency for Toxic Substances and Disease Registry. 200pp.
ATSDR. 1996. ToxFAQ for Naphthalene. Atlanta: Agency for Toxic Substances and DiseaseRegistry. Available on the Internet at http://www.atsdr.cdc.gov/toxfaq.html Last modified June 21,2001.
ATSDR. 2000. Hazardous Substance Release and Health Effects Database. Available on theInternet at: http://www.atsdr.cdc.gov/hazdat.htm Last modified August 19, 2000.
Batelle Columbus Laboratories (BCL). 1980a. Unpublished subchronic toxicity study: naphthalene(C52904) Fisher 344 rats. Report to the US Department of Health and Human Services, NationalToxicology Program, Research Triangle Park, NC, by BCL, Columbus, OH, under SubcontractNo. 76-34-106002.
BCL. 1980b. Unpublished subchronic toxicity study: naphthalene (C52904) B6C3F1 mice. Reportto the US Department of Health and Human Services, National Toxicology Program, ResearchTriangle Park, NC, by BCL, Columbus, OH, under Subcontract No. 76-34-106002.
Cadmus Group, Inc (Cadmus). 2000. Methods for Estimating Contaminant Occurrence and
Exposure in Public Drinking Water Systems in Support of CCL Determinations. Draft reportto USEPA, Washington, D.C., by Cadmus Group, Waltham, MA, July 25, 2000.
Cadmus. 2001. Occurrence Estimation Methodology and Occurrence Findings Report for Six-Year
Regulatory Review. Draft report to USEPA, Washington, D.C., by Cadmus Group, Waltham,MA,
October 5, 2001.
Gidron, E. and J. Leurer. 1956. Naphthalene Poisoning. Lancet. 4:228-230 (as cited in ATSDR,1995).
Gilliom, R.J., D.K. Mueller, and L.H. Nowell. 1998. Methods for Comparing Water-QualityConditions Among National Water-Quality Assessment Study Units, 1992-95. US GeologicalSurvey Open-File Report 97-589. Available on the Internet at:http://ca.water.usgs.gov/pnsp/rep/ofr97589/ Last updated October 09, 1998.
Holmen, J.B., B. Ekesten and B. Lundgren. 1999. Naphthalene-Induced Cataract Model in Rats: A
Comparative Study Between Slit and Retroillumination Images, Biochemical Changes andNaphthalene Dose and Duration. Curr. Eye Res. 19(5):418-425.

Regulatory Determination Support Document for Naphthalene July 2003
36
Howard, P.H. 1989. Handbook of Environmental Fate and Exposure Data for OrganicChemicals: Volume 1: Large Production and Priority Pollutants. Chelsea, MI: LewisPublishers, Inc. 574 pp.
Kolpin, D.W., J.E. Barbash, and R.J. Gilliom. 2000. Pesticides in Ground Water of the United States, 1992-1996. Ground Water. 38(6):858-863.
Lapham, W.W., K.M. Neitzert, M.J. Moran, and J.S. Zogorski. 1997. USGS Compiles Data Set forNational Assessment of VOCs in Ground Water. G. Water Mon. Rem. 17(4):147-157.
Larson, S.J., R.J. Gilliom, and P.D. Capel. 1999. Pesticides in Streams of the UnitedStates--Initial Results from the National Water-Quality Assessment Program. US GeologicalSurvey Water-Resources Investigations Report 98-4222. 99 pp. Available on the Internet at:http://water.wr.usgs.gov/pnsp/rep/wrir984222/ Last modified May 6, 1999.
Leahy, P.P., and T.H. Thompson. 1994. The National Water-Quality Assessment Program. USGeological Survey Open-File Report 94-70. 4 pp. Available on the Internet at:http://water.usgs.gov/nawqa/NAWQA.OFR94-70.html Last modified August 23, 2000.
Lezenius, A. 1902. [A Case of Naphthalene Cataract in Man]. Monatblatter für Augenheitkunde. 40:129-141 (original in German; as cited in USEPA, 1998c).
Lopes, T.J. and S.G. Dionne. 1998. A Review of Semivolatile and Volatile Organic Compoundsin Highway Runoff and Urban Stormwater. US Geological Survey Open-File Report 98-409. 67 pp.
Luzzatto, L. and A. Mehta. 1989. Glucose-6-Phosphate Dehydrogenase Deficiency. In: TheMetabolic Basis of Inherited Disease. Ed. C. Scriver, A.L. Beaudet, W.S. Sly, and D. Valle. New York: McGraw Hill Information Services Co. pp. 2237-2239.
Miller, T. 2000. Selected Findings and Current Perspectives on Urban Water Quality--theNational Water Quality Assessment (NAWQA) Program of the US Geological Survey. Paperpresented to the NAWQA National Liaison Committee, June 13, 2000. 8 pp.
National Toxicology Program (NTP). 1991. Final Developmental Toxicity of Naphthalene (CAS no.91-20-3) in Sprague-Dailey CD Rats on Gestational Day 6–15. Report to NTP by ResearchTriangle Institute, Research Triangle Part, NC, under Contract No. NO1-ES-95255 (as cited inUSEPA, 1998c).
NTP. 1992. Toxicology and Carcinogenesis Studies of Naphthalene (CAS no. 91-20-3) inB6C3F1 mice (inhalation studies). NTP Technical report series No. 410. NIH Publication No.92-3141.

Regulatory Determination Support Document for Naphthalene July 2003
37
Shopp, G.M., K.L. White, Jr., M.P. Holsapple, et al. 1984. Naphthalene Toxicity in CD-1 Mice:General Toxicology and Immunotoxicology. Fund. Appl. Toxicol. 4:406-419.
Speth, T.F. and J.Q. Adams. 1993. GAC and Air-Stripping Design Support for the Safe DrinkingWater Act. In: Strategies and Technologies for Meeting SDWA Requirements. Eds. R. Clarkand R.S. Summers. Lancaster, PA: Technomic Publ. Co.
Squillace, P.J., M.J. Moran, W.W. Lapham, C.V. Price, R.M. Clawges, and J.S. Zogorski. 1999. Volatile Organic Compounds in Untreated Ambient Groundwater of the United States, 1985-1995. Env. Sci. and Tech.. 33(23):4176-4187.
U.S. Department of Health and Human Services (USDHHS). 1993. Registry of Toxic Effects ofChemicalSubstances (RTECS, online database). Available on the Internet at:http://www.epa.gov/ttn/uatw/hlthef/naphthal.html Last modified May 26, 1998.
U.S. Environmental Protection Agency (USEPA). 1987. National Primary Drinking WaterRegulations-Synthetic Organic Chemicals; Monitoring for Unregulated Contaminants; Final Rule. Federal Register 52, no. 130 (8 July): 25690.
USEPA. 1990. Drinking Water Health Advisory for Naphthalene. Washington, D.C. : Office ofAssistant Administrator for Water. 28 pp.
USEPA. 1991. National Primary Drinking Water Regulations - Synthetic Organic Chemicals andInorganic Chemicals; Monitoring for Unregulated Contaminants; National Primary Drinking WaterRegulations Implementation; National Secondary Drinking Water Regulations; Final Rule. FederalRegister 56, no. 20 (30 January): 3526.
USEPA. 1992. Drinking Water; National Primary Drinking Water Regulations – Synthetic OrganicChemicals and Inorganic Chemicals; National Primary Drinking Water Regulations Implementation. Federal Register 57, no. 138 (17 July): 31776.
USEPA. 1996a. Emergency Planning and Community Right-to-Know Section 313, List of ToxicChemicals. 45 pp. Available on the Internet at: http://www.epa.gov/tri/chemls2.pdf Last modifiedMarch 23, 2000. Link to site at: http://www.epa.gov/tri/chemical.htm
USEPA. 1996b. Drinking Water Regulations and Health Advisories. Office of Water. EPAReport 822-B-96-002. 16 pp.
USEPA. 1998a. Laws & Regulations. Washington, DC: Environmental Protection Agency.Available on the Internet at: http://www.epa.gov/reg5foia/pest/history.html Last modified August20, 1998.

Regulatory Determination Support Document for Naphthalene July 2003
38
USEPA. 1998b. Announcement of the Drinking Water Contaminant Candidate List; Notice. FederalRegister 63, no. 40 (2 March): 10273.
USEPA. 1998c. Toxicological Review of Naphthalene (CAS 91-20-3): In Support of SummaryInformation on the Integrated Risk Information System (IRIS). Washington, D.C.: USEPA. 124 pp. Available on the Internet at: http://www.epa.gov/iris/toxreviews/nap-tox2.pdf Link to siteat: http://www.epa.gov/iris/subst/0436.htm
USEPA. 1999a. Suspension of Unregulated Contaminant Monitoring Requirements for Small PublicWater Systems; Final Rule and Proposed Rule. Federal Register 64, no. 5 (8 January): 1494.
USEPA. 1999b. Revisions to the Unregulated Contaminant Monitoring Regulation for Public WaterSystems; Final Rule. Federal Register 64, no. 180 (17 September): 50556.
USEPA. 1999c. Superfund Hazardous Waste Site Basic Query Form. Washington, D.C.:USEPA. Available on the Internet at: http://www.epa.gov/superfund/sites/query/basic.htm Lastmodified December 1, 1999.
USEPA. 1999d. A Review of Contaminant Occurrence in Public Water Systems. Office ofWater. EPA Report 816-R-99-006. 78 pp.
USEPA. 2000a. Regulatory Matrix of TRI Chemicals in Other Federal Programs. Washington,D.C.: USEPA. Available on the Internet at: www.epa.gov/tri/chemicals.htm Last modified March23, 2000.
USEPA. 2000b. TRI Explorer: Are Year-to-Year Changes Comparable? Washington, D.C.:USEPA. Available on the Internet at: www.epa.gov/triexplorer/yearsum.htm Last modified May5, 2000.
USEPA. 2000c. TRI Explorer: Trends. Washington, D.C.: USEPA. Available on the Internet at:http://www.epa.gov/triexplorer/trends.htm Last modified May 5, 2000.
USEPA. 2000d. The Toxic Release Inventory (TRI) and Factors to Consider when Using TRIData. Washington, D.C.: USEPA. Available on the Internet at:http://www.epa.gov/tri/tri98/98over.pdf Last modified August 11, 2000. Link to site at:http://www.epa.gov/tri/tri98
USEPA. 2000e. What is the Toxic Release Inventory? Washington, D.C.: USEPA. Available onthe Internet at: http://www.epa.gov/tri/general.htm Last modified February 28, 2000.
USEPA. 2000f. Drinking Water Standards and Health Advisories. Office of Water. EPA Report822-B-00-001.
Regulatory Determination Support Document for Naphthalene July 2003
39
USEPA. 2000g. Water Industry Baseline Handbook. Second Edition (Draft). Washington, D.C.:US
Environmental Protection Agency.
USEPA. 2001a. Analysis of National Occurrence of the 1998 Contaminant Candidate ListRegulatory Determination Priority Contaminants in Public Water Systems. Office of Water. EPA Report 815-D-01-002. 77 pp and appendices.
USEPA. 2001b. Occurrence of Unregulated Contaminants in Public Water Systems: An Initial Assessment. Office of Water. EPA Report 815-P-00-001. 50 pp.
USEPA. 2003. Health Effects Support Document for Naphthalene. Office of Water. EPA Report 822-R-03-005. 149 pp.

This page intentionally left blank.

Regulatory Determination Support Document for Naphthalene July 2003
41
APPENDIX A: Abbreviations and Acronyms
ACGIH - American Conference of Governmental Industrial HygienistsATSDR - Agency for Toxic Substances and Disease RegistryCAS - Chemical Abstract ServiceCCL - Contaminant Candidate ListCERCLA - Comprehensive Environmental Response, Compensation & Liability ActCMR - Chemical Monitoring ReformCWS - community water systemECD - electron capture detectorsELCD - electrolytic conductivity detectorEPA - Environmental Protection AgencyEPCRA - Emergency Planning and Community Right-to-Know ActFDA - Food and Drug AdministrationFIFRA - Federal Insecticide, Fungicide, and Rodenticide ActFQPA - Food Quality Protection ActFR - federal registerG6PD - glucose-6-phosphate dehydrogenaseGAC - granular activated carbon (treatment technology for organic compounds)GC - gas chromatography (a laboratory method)g/mol - grams per moleGW - ground waterHAL - Health Advisory levelHazDat - Hazardous Substance Release and Health Effects DatabaseHRL - Health Reference LevelIOC - inorganic compoundIRIS - Integrated Risk Information SystemKoc - organic carbon partition coefficientKow - octanol-water partitioning coefficientL - literLOAEL - lowest observed adverse effect levelMCL - maximum contaminant levelMCLG - maximum contaminant level goalMDL - method detection limitmg - milligrammg/kg-day - milligram per kilogram per daymm Hg - millimeter mercuryMRL - minimum reporting levelMS - mass spectrometry (a laboratory method)MSHA - Mine Safety and Health AdministrationNAWQA - National Water Quality Assessment ProgramNCOD - National Drinking Water Contaminant Occurrence Database

Regulatory Determination Support Document for Naphthalene July 2003
42
NDWAC - National Drinking Water Advisory CouncilNIOSH - National Institute for Occupational Safety and HealthNIRS - National Inorganic and Radionuclide Surveynm - nanometerNOAEL - no observed adverse effect levelNPDES - National Pollution Discharge Elimination SystemNPDWR - National Primary Drinking Water RegulationNPL - National Priorities ListNPS - National Pesticide SurveyNTNCWS - non-transient non-community water systemNTP - National Toxicology ProgramNURP - National Urban Runoff ProgramOGWDW - Office of Ground Water and Drinking WaterORD - Office of Research and DevelopmentOSHA - Occupational Safety and Health AdministrationPGWD - Pesticides in Ground Water DatabasePID - photoionization detectorppm - part per millionPWS - public water systemRCRA - Resource Conservation and Recovery ActRfD - reference doseSARA Title III - Superfund Amendments and Reauthorization ActSDWA - Safe Drinking Water ActSDWIS/FED - Federal Safe Drinking Water Information SystemSOC - synthetic organic compoundSW - surface water TRI - Toxic Release InventoryUCM - Unregulated Contaminant MonitoringUCMR - Unregulated Contaminant Monitoring Regulation/RuleURCIS - Unregulated Contaminant Monitoring Information SystemUSDHHS - United States Department of Health and Human ServicesUSEPA - United States Environmental Protection Agency USGS - United States Geological SurveyVOC - volatile organic compoundµg - micrograms>MCL - percentage of systems with exceedances>MRL - percentage of systems with detections