Embed Size (px)
Citation preview
Container Shipping in India:Container Shipping in India:Mapping the cargoMapping the cargo
Containers India 2014Containers India 2014
Navin KumarEmail: [email protected] 20 Aug 2014
Presentation outline
India’s international trade
Cargo / hinterland mapping
Trade partners
Outlook
Conclusions
© Drewry 2014
2Drewry | Container India 2014
India’s international trade
Cargo / hinterland mapping
INDIA’S INTERNATIONAL TRADE
© Drewry 2014
3Drewry | Container India 2014
INDIA’S INTERNATIONAL TRADE
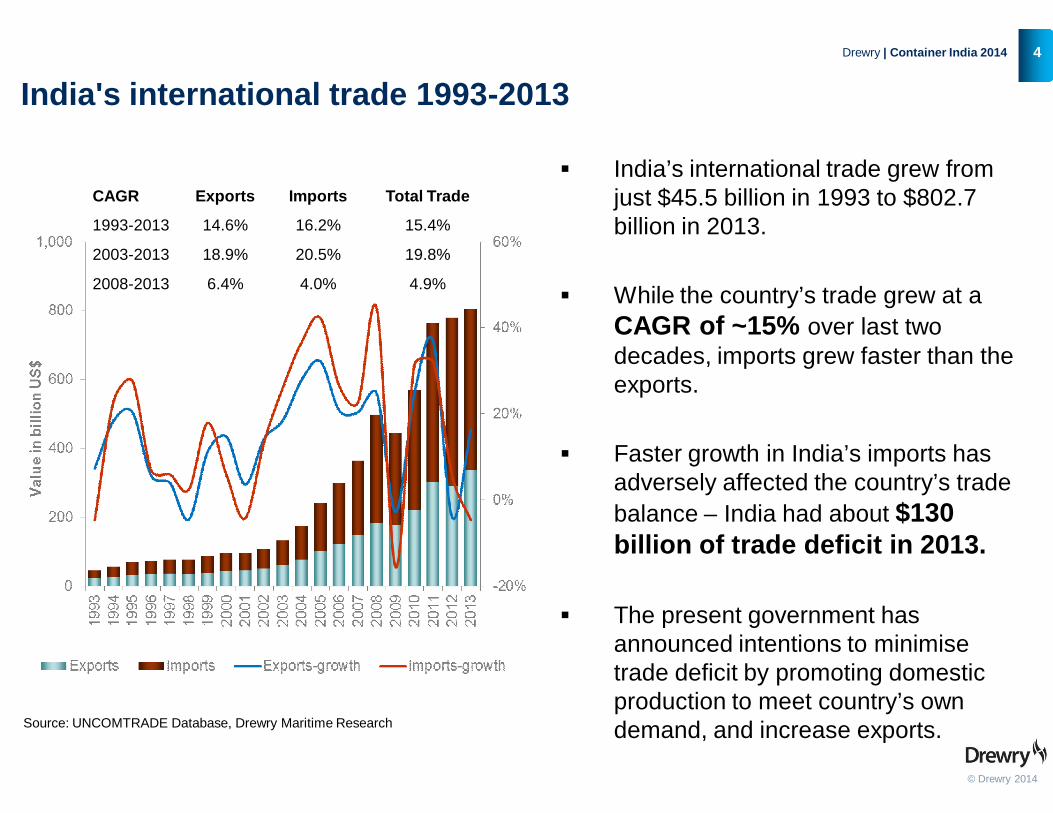
India's international trade 1993-2013
Source: UNCOMTRADE Database, Drewry Maritime Research
CAGR Exports Imports Total Trade
1993-2013 14.6% 16.2% 15.4%
2003-2013 18.9% 20.5% 19.8%
2008-2013 6.4% 4.0% 4.9%
© Drewry 2014
4Drewry | Container India 2014
2013
India’s international trade grew from just $45.5 billion in 1993 to $802.7 billion in 2013.
While the country’s trade grew at a CAGR of ~15% over last two decades, imports grew faster than the exports.
Faster growth in India’s imports has adversely affected the country’s trade balance – India had about $130 billion of trade deficit in 2013.
The present government has announced intentions to minimise trade deficit by promoting domestic production to meet country’s own demand, and increase exports.
India's container throughput
Source: Drewry Maritime Research
3.6
4.4
5.0
5.8
7.3
8.0 7.6
9.0
9.7 9.9
10.4
8%
19%
14%
17%
26%
10%
-5%
18%
7%
3%
5%
-10%
-5%
0%
5%
10%
15%
20%
25%
30%
0
2
4
6
8
10
12
2003 2004 2005 2006 2007 2008 2009 2010 2011 2012 2013
Throughput (million teu) Annual growth-right
© Drewry 2014
5Drewry | Container India 2014
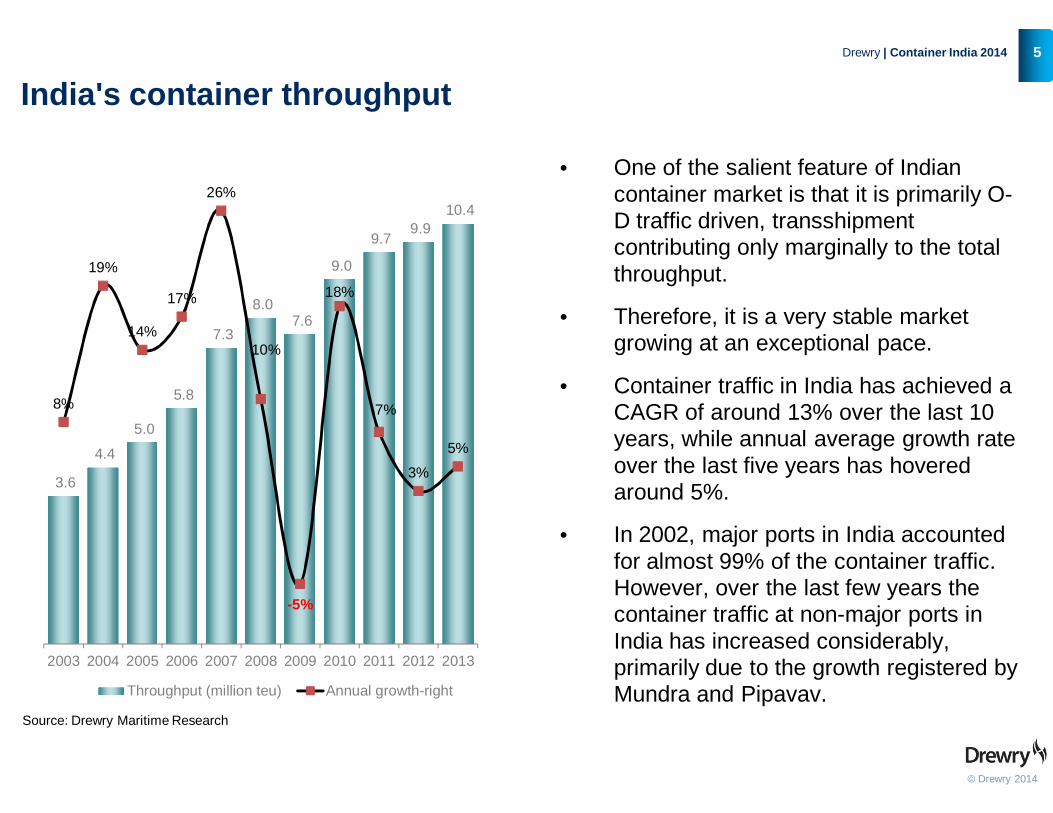
• One of the salient feature of Indian container market is that it is primarily O-D traffic driven, transshipment contributing only marginally to the total throughput.
• Therefore, it is a very stable market growing at an exceptional pace.
• Container traffic in India has achieved a CAGR of around 13% over the last 10 years, while annual average growth rate over the last five years has hovered around 5%.
• In 2002, major ports in India accounted for almost 99% of the container traffic. However, over the last few years the container traffic at non-major ports in India has increased considerably, primarily due to the growth registered by Mundra and Pipavav.
CARGO / HINTERLAND MAPPING
© Drewry 2014
6Drewry | Container India 2014
CARGO / HINTERLAND MAPPING
Product category wise India’s trade 2013
Source: UNCOMTRADE Database, classified and compiled by Drewry Maritime Research
Imports
Export
Electrical & electronic
goods17%
Machinary/ spares
16%
Chemicals12%
Steel Products8%
Food Products6%
Others41%
RMG/Textiles11%
Chemicals11%
Fabric/Yarn10%
Steel Products9%
Reefer food products
8%
Others51%
© Drewry 2014
7Drewry | Container India 2014
wise India’s trade 2013
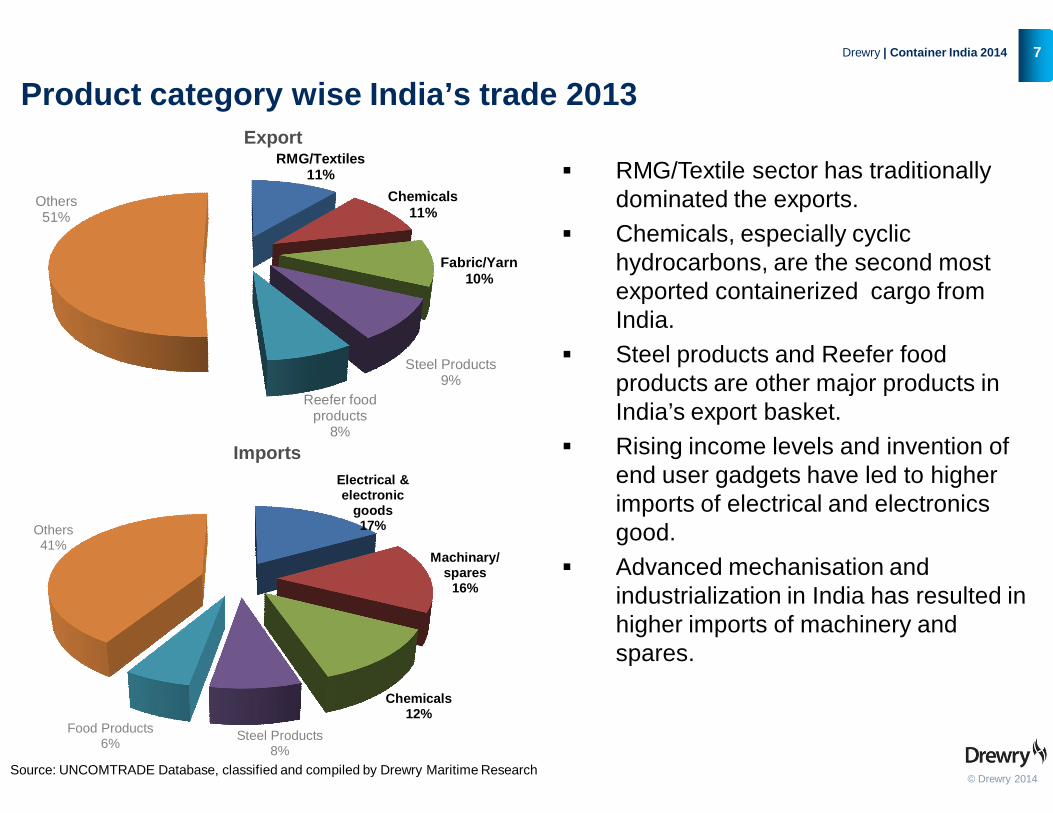
RMG/Textile sector has traditionally dominated the exports.
Chemicals, especially cyclic hydrocarbons, are the second most exported containerized cargo from India.
Steel products and Reefer food products are other major products in India’s export basket.
Rising income levels and invention of end user gadgets have led to higher imports of electrical and electronics good.
Advanced mechanisation and industrialization in India has resulted in higher imports of machinery and spares.
Source: UNCOMTRADE Database, classified and compiled by Drewry Maritime Research
Major centres of cargo origin – Exports from
Source: Drewry Maritime Research © Drewry 2014
8Drewry | Container India 2014
Exports from India
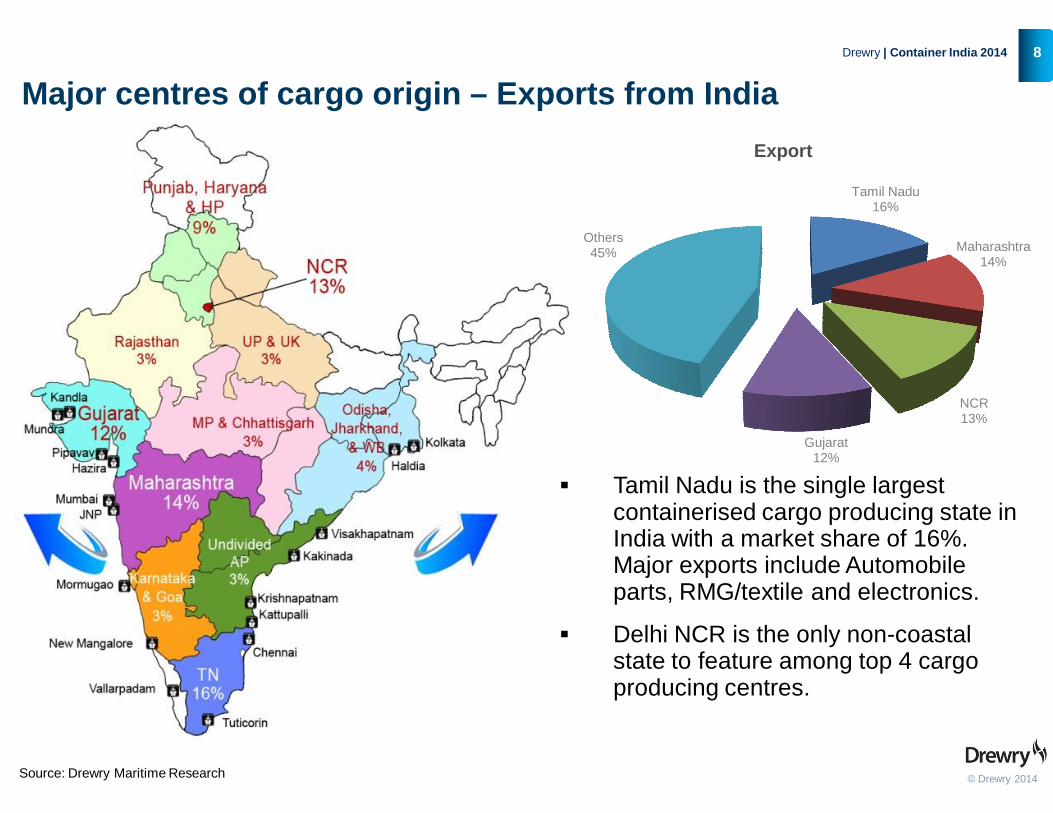
Tamil Nadu16%
Maharashtra14%
NCR13%
Gujarat12%
Others45%
Export
Tamil Nadu is the single largest containerised cargo producing state in India with a market share of 16%. Major exports include Automobile parts, RMG/textile and electronics.
Delhi NCR is the only non-coastal state to feature among top 4 cargo producing centres.
Major centres of cargo destination
Source: Drewry Maritime Research© Drewry 2014
9Drewry | Container India 2014
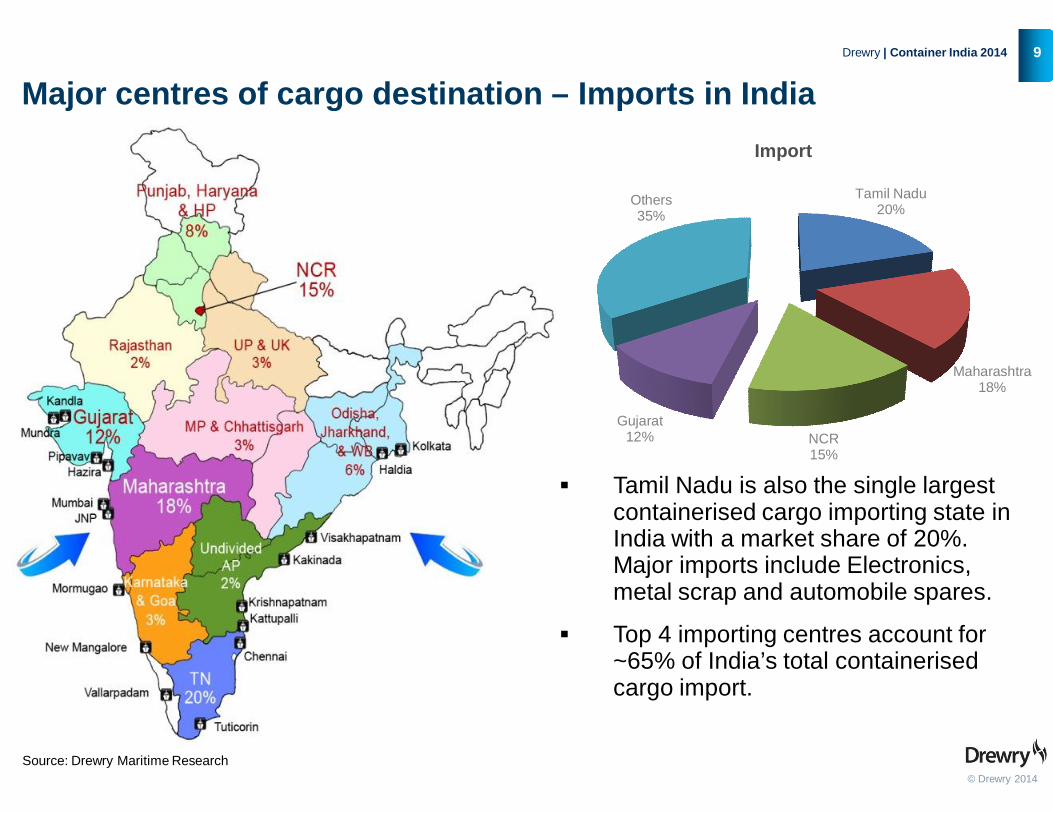
Major centres of cargo destination – Imports in IndiaImport
Tamil Nadu20%
Maharashtra18%
NCR15%
Gujarat12%
Others35%
Tamil Nadu is also the single largest containerised cargo importing state in India with a market share of 20%. Major imports include Electronics, metal scrap and automobile spares.
Top 4 importing centres account for ~65% of India’s total containerised cargo import.
TRADE PARTNERS
© Drewry 2014
10Drewry | Container India 2014

Country wise trade direction of India’s container trade
Country 1993 2003 2013
USA 1 1 1
China 17 5 2
UAE 4 2 3
Germany 2 4 4
UK 3 3 5
Changing ranks of India’s export partners
Source: UNCOMTRADE Database, classified and compiled by Drewry Maritime Research
Exports-2013
28.4
11.5 9.9 7.6 7.4 5.5 4.8 4.5 4.1 4.0
© Drewry 2014
11Drewry | Container India 2014
Country wise trade direction of India’s container trade (in $ billion)
Changing ranks of India’s import partners
Country 1993 2003 2013
China 10 2 1
USA 1 1 2
Germany 2 3 3
Korea, Rep. 5 4 4
Japan 3 5 5
Source: UNCOMTRADE Database, classified and compiled by Drewry Maritime Research
Imports-201345.9
12.2 10.7 10.2 8.7 7.3 6.7 5.2 4.4 3.7
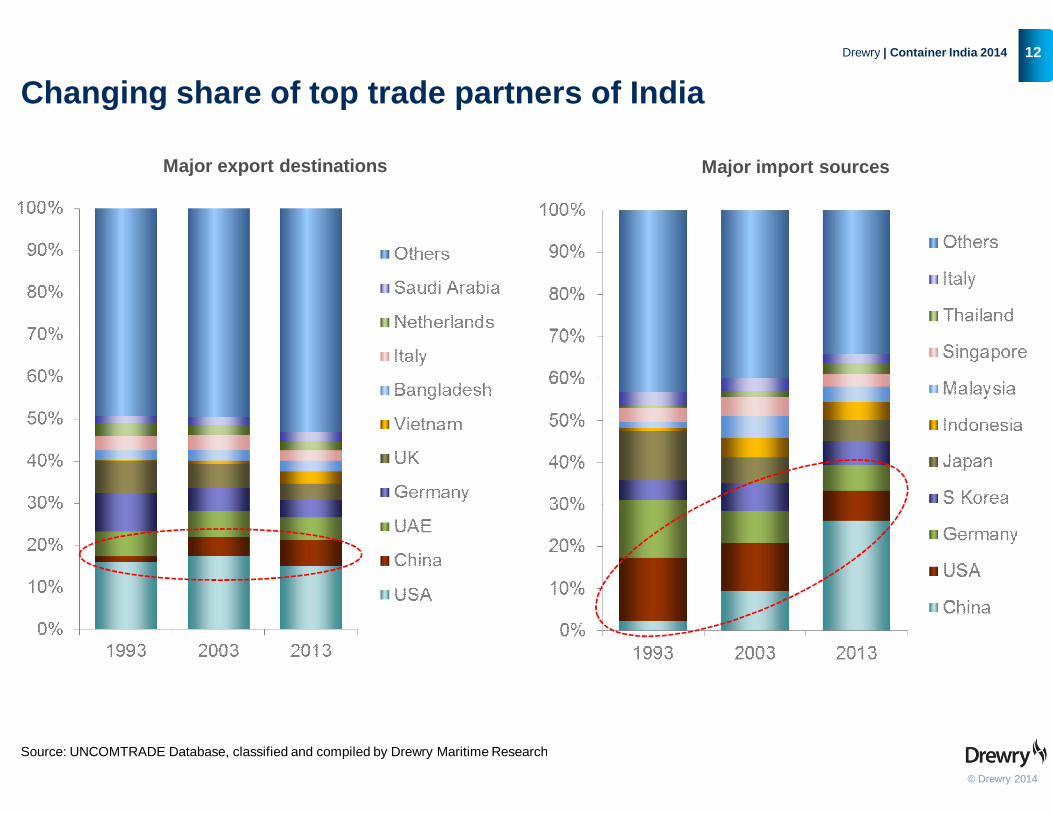
Changing share of top trade partners of India
Source: UNCOMTRADE Database, classified and compiled by Drewry Maritime Research
Major export destinations
© Drewry 2014
12Drewry | Container India 2014
Changing share of top trade partners of India
Source: UNCOMTRADE Database, classified and compiled by Drewry Maritime Research
Major import sources

OUTLOOK
© Drewry 2014
13Drewry | Container India 2014
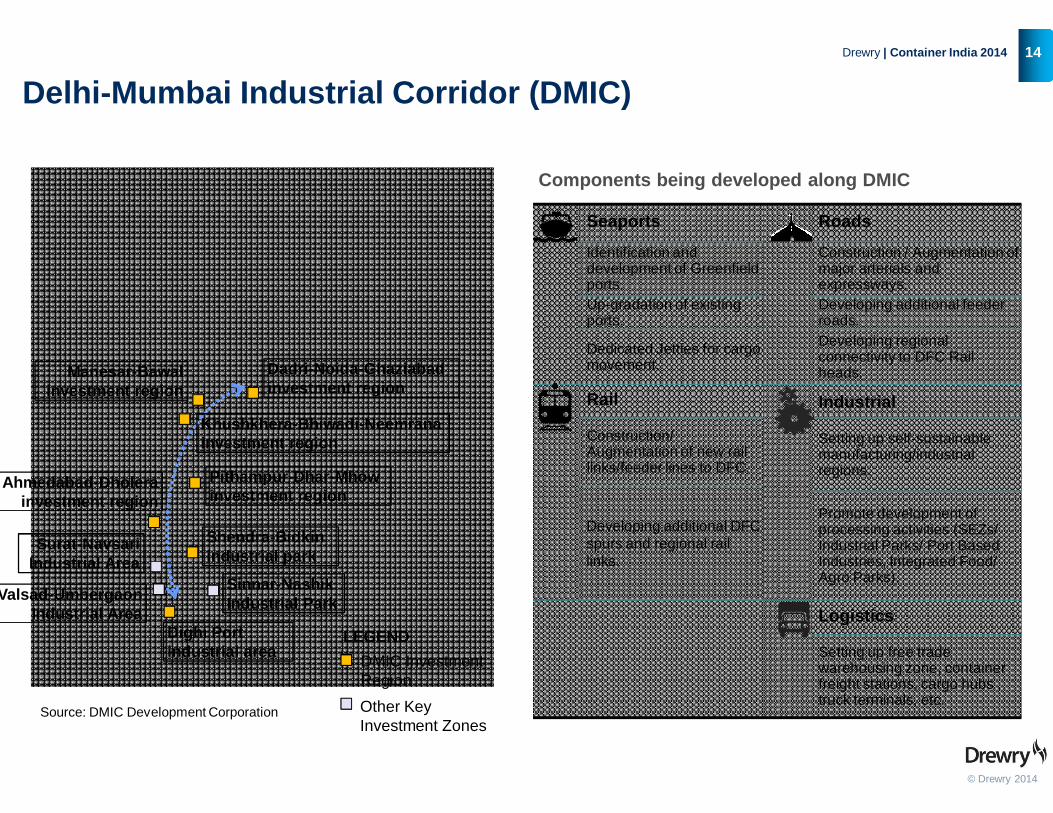
Source: DMIC Development Corporation
Dadri-Noida-Ghaziabadinvestment region
Manesar-Bawal investment region
Khushkhera-Bhiwadi-Neemrana investment region
Pithampur-Dhar-Mhowinvestment region
Ahmedabad-Dholerainvestment region
Shendra-Bidkin industrial park
Dighi Portindustrial area DMIC Investment
Region
LEGEND
Other Key Investment Zones
Valsad-Umbergaon Industrial Area
Surat-Navsari Industrial Area
Sinnar-Nashik Industrial Park
Delhi-Mumbai Industrial Corridor (DMIC)
© Drewry 2014
14Drewry | Container India 2014
Seaports Roads
Identification and development of Greenfield ports.
Construction / Augmentation of major arterials and expressways.
Up-gradation of existing ports.
Developing additional feeder roads.
Dedicated Jetties for cargo movement.
Developing regional connectivity to DFC Rail heads.
Rail Industrial
Construction/ Augmentation of new rail links/feeder lines to DFC.
Setting up self-sustainable manufacturing/industrial regions.
Developing additional DFC spurs and regional rail links.
Promote development of processing activities (SEZs/ Industrial Parks/ Port Based Industries, Integrated Food/ Agro Parks).
Logistics
Setting up free trade warehousing zone, container freight stations, cargo hubs , truck terminals, etc.
Components being developed along DMIC
Mumbai Industrial Corridor (DMIC)
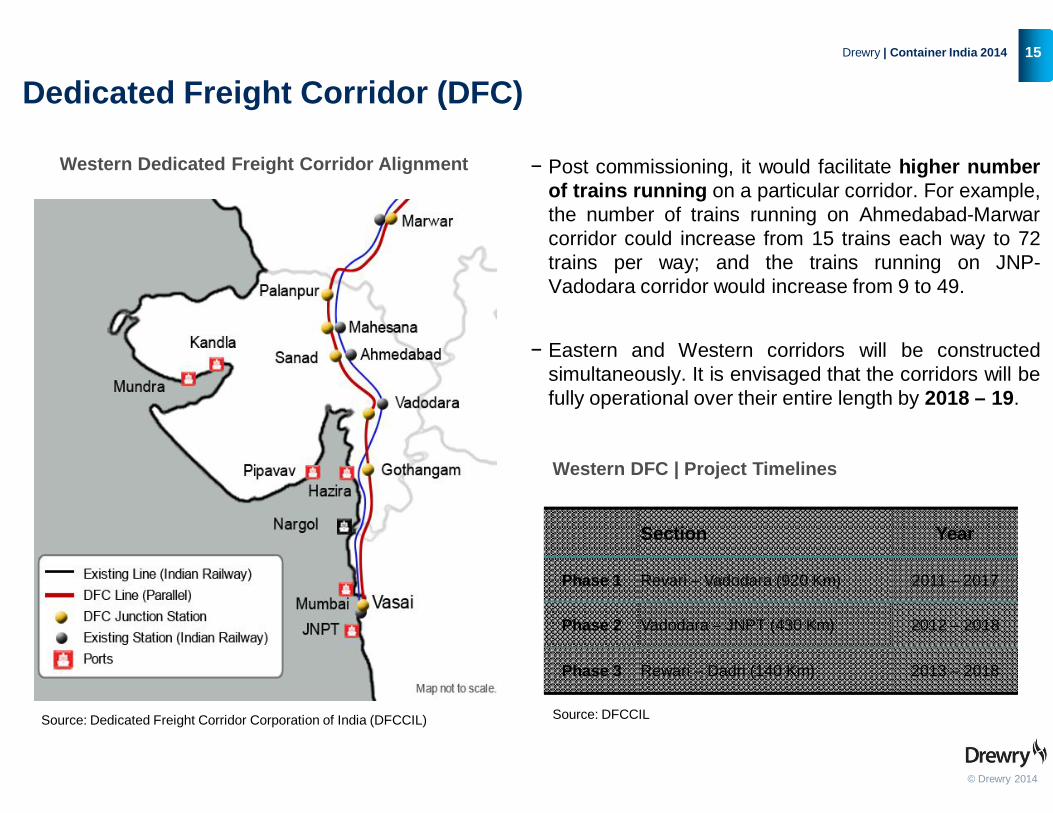
Western Dedicated Freight Corridor Alignment
Source: Dedicated Freight Corridor Corporation of India (DFCCIL)
Dedicated Freight Corridor (DFC)
© Drewry 2014
15Drewry | Container India 2014
− Post commissioning, it would facilitate higher numberof trains running on a particular corridor. For example,the number of trains running on Ahmedabad-Marwarcorridor could increase from 15 trains each way to 72trains per way; and the trains running on JNP-Vadodara corridor would increase from 9 to 49.
− Eastern and Western corridors will be constructedsimultaneously. It is envisaged that the corridors will befully operational over their entire length by 2018 – 19.
Section Year
Phase 1 Revari – Vadodara (920 Km) 2011 – 2017
Phase 2 Vadodara – JNPT (430 Km) 2012 – 2018
Phase 3 Rewari – Dadri (140 Km) 2013 – 2018
Western DFC | Project Timelines
Source: DFCCIL

CONCLUSIONS
© Drewry 2014
16Drewry | Container India 2014
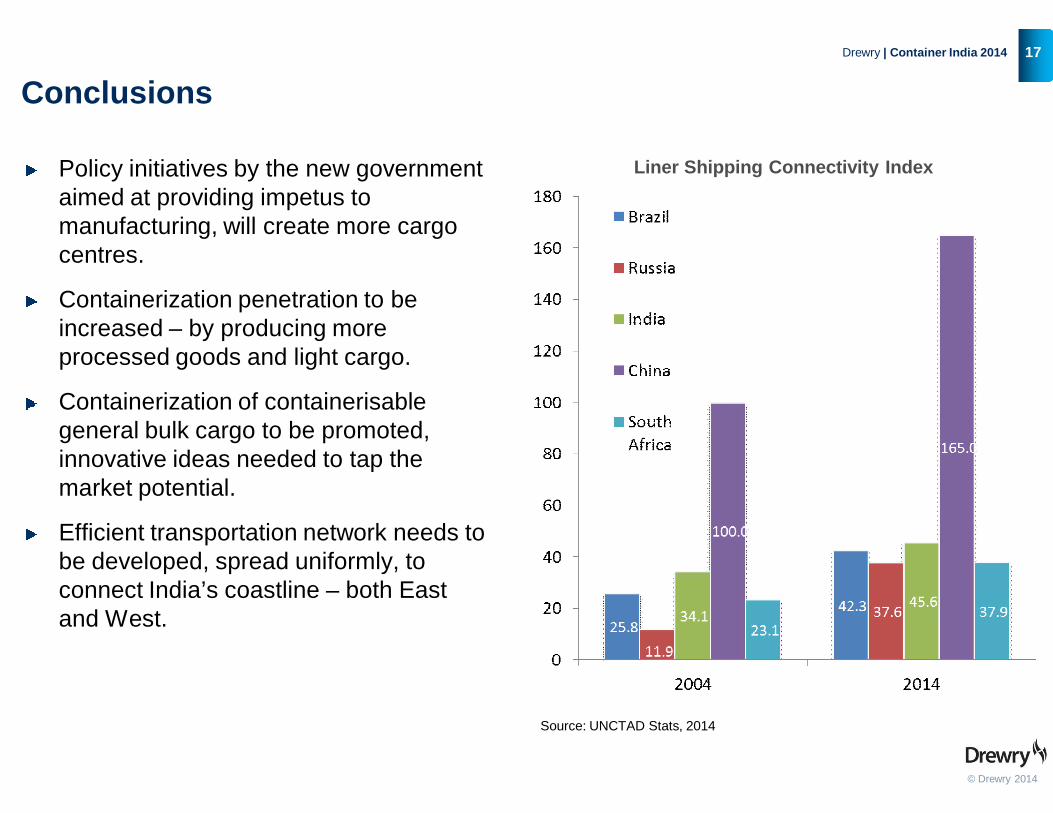
Conclusions
Policy initiatives by the new government aimed at providing impetus to manufacturing, will create more cargo centres.
Containerization penetration to be increased – by producing more processed goods and light cargo.
Containerization of containerisable general bulk cargo to be promoted, innovative ideas needed to tap the market potential.
Efficient transportation network needs to be developed, spread uniformly, to connect India’s coastline – both East and West.
© Drewry 2014
17Drewry | Container India 2014
Liner Shipping Connectivity Index
Source: UNCTAD Stats, 2014

Drewry was founded in 1970 Drewry was founded in 1970 as a provider of as a provider of independent information and independent information and advice advice to the global to the global maritime industry. Since then we have worked maritime industry. Since then we have worked with over 4,000 clients in more than 100 with over 4,000 clients in more than 100 countries. countries.
LondonDrewry15-17 Christopher StreetLondon EC2A 2BS,United KingdomT: +44 (0)20 7538 0191E: [email protected]
DelhiDrewry 209 Vipul Square, Sushant Lok-1 Gurgaon 122002, IndiaTelephone: +91 124 40476 31/32E: [email protected]
Thank You!
© Drewry 2014
18Drewry | Container India 2014
SingaporeDrewry 15 Hoe Chiang Road, #13-02 Tower FifteenSingapore 089316T: +65 6220 9890E: [email protected]
We are privately owned with research and advisory teams in London, Delhi, Singapore and Shanghai.
ShanghaiDrewry 555, 5th floor Standard Chartered Tower,201 Shi Ji Avenue, Pudong District, Shanghai, China 200120T: +86 (0)21 6182 6759

![Thakur Educational Trust’s (Regd.) THAKUR VIDYA … IV.pdf · Thakur Educational Trust’s (Regd.) THAKUR VIDYA MANDIR HIGH SCHOOL & JUNIOR COLLEGE ... Q1 A] Fill in the blanks](https://img.pdfslide.us/doc/110x75/5af067447f8b9abc788d1c95/thakur-educational-trusts-regd-thakur-vidya-ivpdfthakur-educational-trusts.jpg)


![Navin Anwani arXiv:1811.10678v2 [cs.NE] 29 Jul 2019 · 2019. 7. 30. · Navin Anwani Department of Electrical Engineering Indian Institute of Technology Bombay Mumbai, 400076, India](https://img.pdfslide.us/doc/110x75/601e239f0960b352b3785f3c/navin-anwani-arxiv181110678v2-csne-29-jul-2019-2019-7-30-navin-anwani.jpg)