Embed Size (px)
Citation preview

CONTACT DETAILS REGISTRY
Level 16, 61 Lavender Street c/- Link Market Services Limited Ardent Leisure Trust Milsons Point NSW 2061 Level 12, 680 George Street ARSN 093 193 438 AUSTRALIA Sydney NSW 2000 Ardent Leisure Limited Telephone +61 2 9409 3670 Locked Bag A14 ABN 22 104 529 106 Investor Services 1800 ARDENT Sydney South NSW 1235 Ardent Leisure Management Limited Fax +61 2 9409 3670 Telephone 1300 720 560 ABN 36 079 630 676 www.ardentleisure.com.au [email protected] (AFS Licence No. 247010)
AMF Bowling | d’Albora Marinas | Dreamworld | Goodlife Health Clubs | Kingpin Bowling Main Event Entertainment | SkyPoint | SkyPoint Climb | WhiteWater World
ASX RELEASE 23 May 2013 The Manager Company Notices Section ASX Limited 20 Bridge Street SYDNEY, NSW 2000 Dear Sir/Madam
MAIN EVENT ENTERTAINMENT PRESENTATION
Please find attached for release to the market a presentation on the Main Event Entertainment division to be given to investors today. Yours faithfully Alan Shedden Company Secretary Ardent Leisure Group is a specialist operator of leisure and entertainment assets across Australia, New Zealand and the United States. The Group operates Dreamworld, WhiteWater World, SkyPoint, SkyPoint Climb, d’Albora Marinas, AMF and Kingpin bowling centres and Goodlife fitness centres across Australia and New Zealand. The Group also operates the Main Event family entertainment centres in the United States. For further information on the Group’s activities please visit our website at www.ardentleisure.com.au
For
per
sona
l use
onl
y

INVESTOR PRESENTATION May, 2013
1
For
per
sona
l use
onl
y
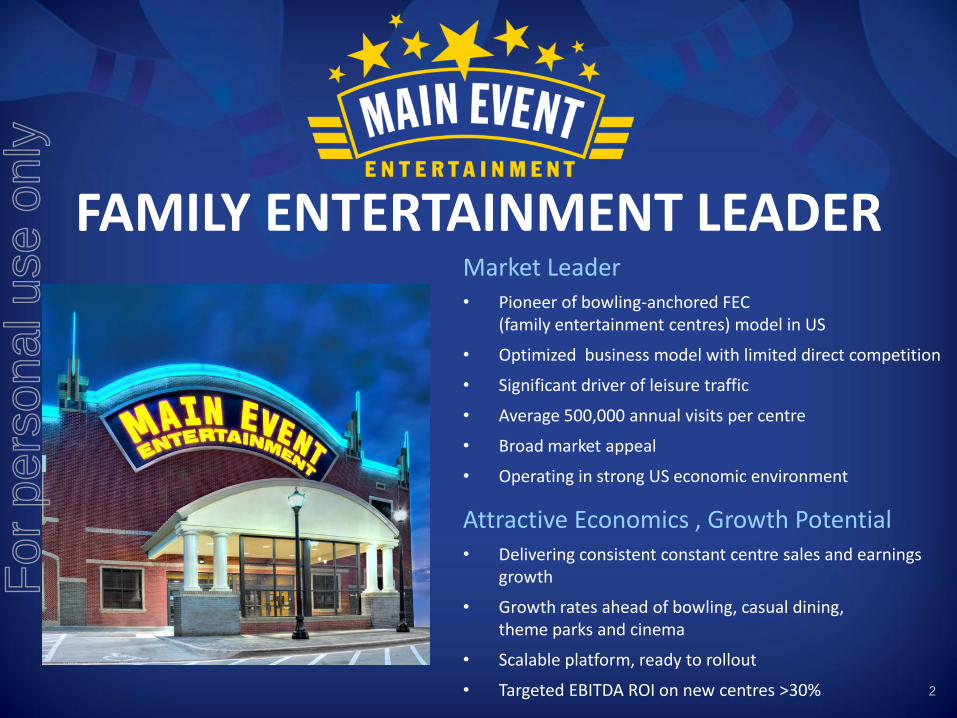
FAMILY ENTERTAINMENT LEADER Market Leader • Pioneer of bowling-anchored FEC
(family entertainment centres) model in US
• Optimized business model with limited direct competition
• Significant driver of leisure traffic
• Average 500,000 annual visits per centre
• Broad market appeal
• Operating in strong US economic environment
Attractive Economics , Growth Potential • Delivering consistent constant centre sales and earnings
growth
• Growth rates ahead of bowling, casual dining, theme parks and cinema
• Scalable platform, ready to rollout
• Targeted EBITDA ROI on new centres >30%
2
For
per
sona
l use
onl
y

STRONG TRACK RECORD Revenue/EBRITDA Growth (in US$ Millions)
3
FY99 FY00 FY01 FY02 FY03 FY04 FY05 FY06 FY07 FY08 FY09 FY10 FY11 FY12
Revenue 2.4 3.1 6.7 10.3 11.5 16.5 24.8 34 38.9 49.1 46.4 45.7 50.6 56.7
EBRITDA 1.6 1.8 3 4 4.2 5.8 10 13.1 16 16.8 15.5 14.6 16.9 20.1
Source: Main Event management accounts
FY 13, 9 months revenue up 28.1% and EBRITDA up 36.1% on the prior corresponding period
For
per
sona
l use
onl
y

THIRD QUARTER FY 13 HIGHLIGHTS
• Main Event continues to deliver strong earnings growth.
• Year to date revenues of US$53.10 million, up 28.1% on prior year revenues of US$41.46 million.
• Year to date EBITDA of US$12.75 million, up 38.1% on prior year EBITDA of US$9.23 million.
• Solid constant centre performance with revenues up 4.8%.
• New centres continue to deliver well above portfolio average.
• Construction underway on Tempe, Arizona
• On track to meet or exceed target of 19 centres by FY 15.
4
For
per
sona
l use
onl
y
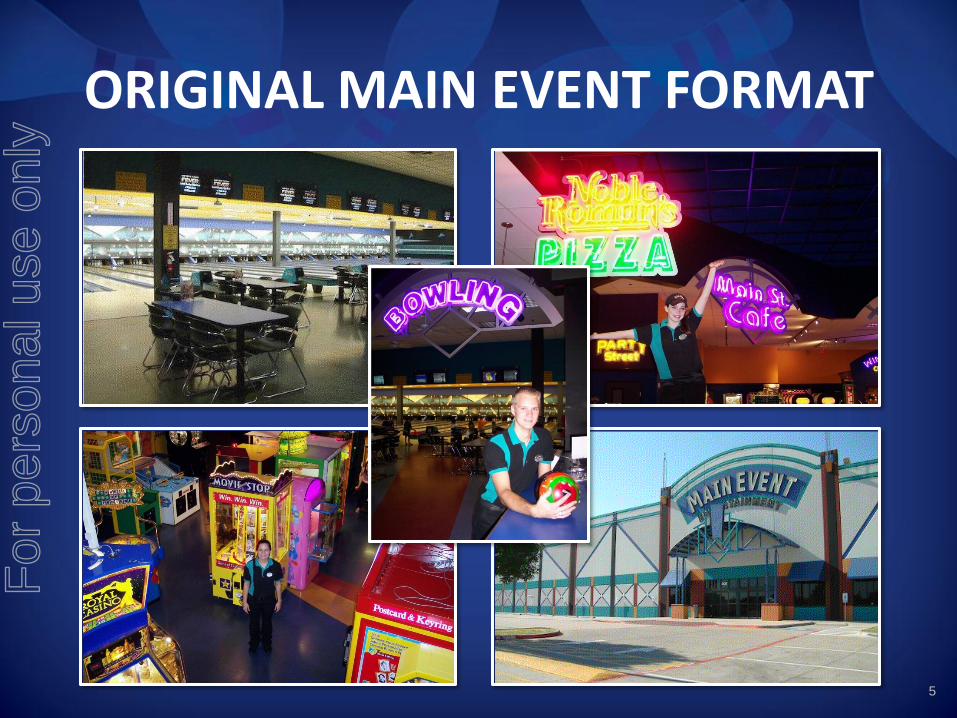
ORIGINAL MAIN EVENT FORMAT
5
For
per
sona
l use
onl
y
6
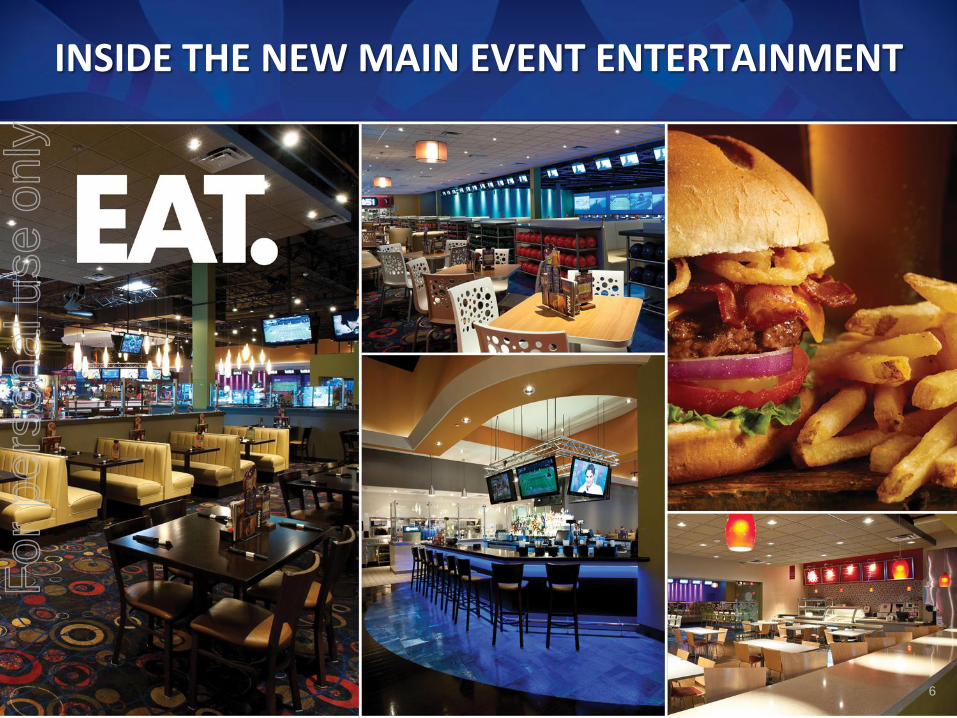
INSIDE THE NEW MAIN EVENT ENTERTAINMENT
6
For
per
sona
l use
onl
y

7
INSIDE THE NEW MAIN EVENT ENTERTAINMENT
7
For
per
sona
l use
onl
y

INSIDE THE NEW MAIN EVENT ENTERTAINMENT
8
For
per
sona
l use
onl
y
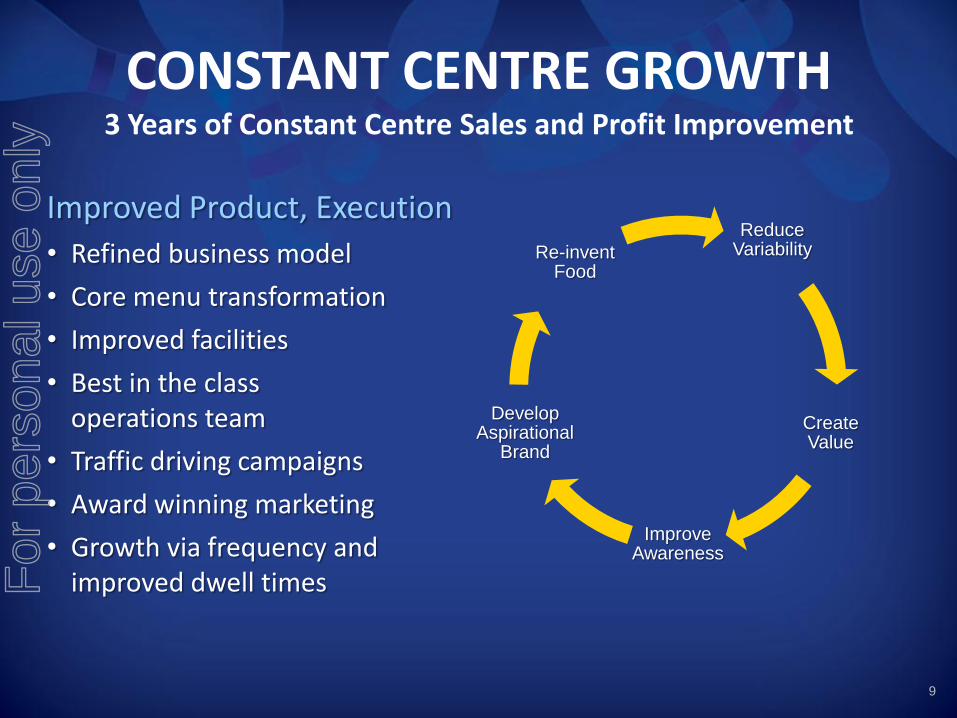
CONSTANT CENTRE GROWTH 3 Years of Constant Centre Sales and Profit Improvement
Reduce Variability
Create Value
Improve Awareness
Develop Aspirational
Brand
Re-invent Food
Improved Product, Execution
• Refined business model
• Core menu transformation
• Improved facilities
• Best in the class operations team
• Traffic driving campaigns
• Award winning marketing
• Growth via frequency and improved dwell times
9
For
per
sona
l use
onl
y
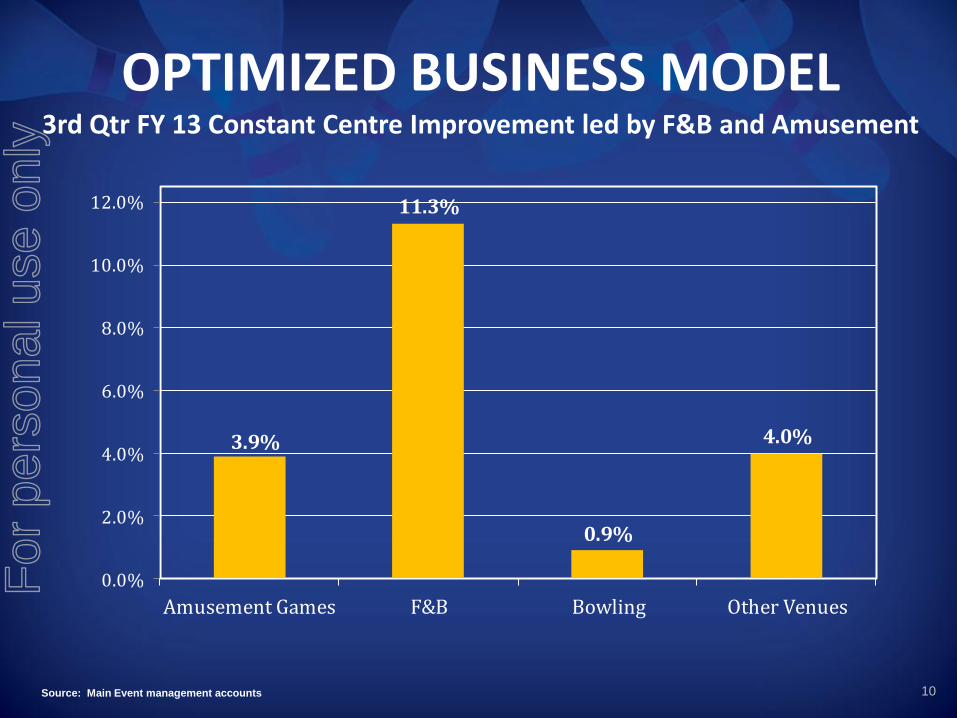
OPTIMIZED BUSINESS MODEL 3rd Qtr FY 13 Constant Centre Improvement led by F&B and Amusement
3.9%
11.3%
0.9%
4.0%
0.0%
2.0%
4.0%
6.0%
8.0%
10.0%
12.0%
Amusement Games F&B Bowling Other Venues
10 Source: Main Event management accounts
For
per
sona
l use
onl
y
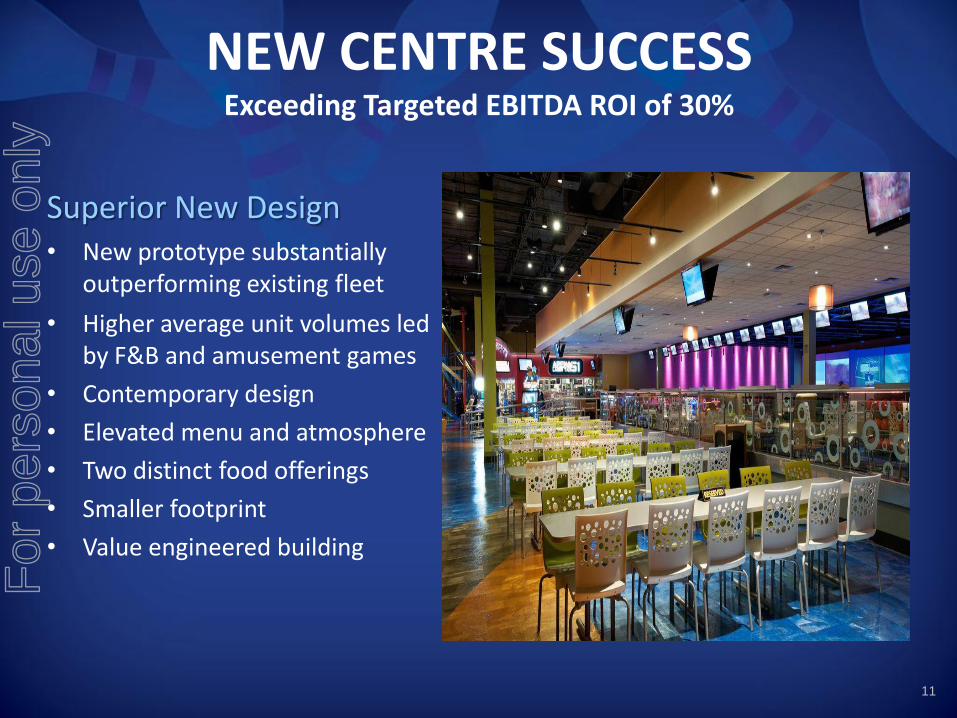
NEW CENTRE SUCCESS Exceeding Targeted EBITDA ROI of 30%
Superior New Design • New prototype substantially
outperforming existing fleet
• Higher average unit volumes led by F&B and amusement games
• Contemporary design
• Elevated menu and atmosphere
• Two distinct food offerings
• Smaller footprint
• Value engineered building
11
For
per
sona
l use
onl
y
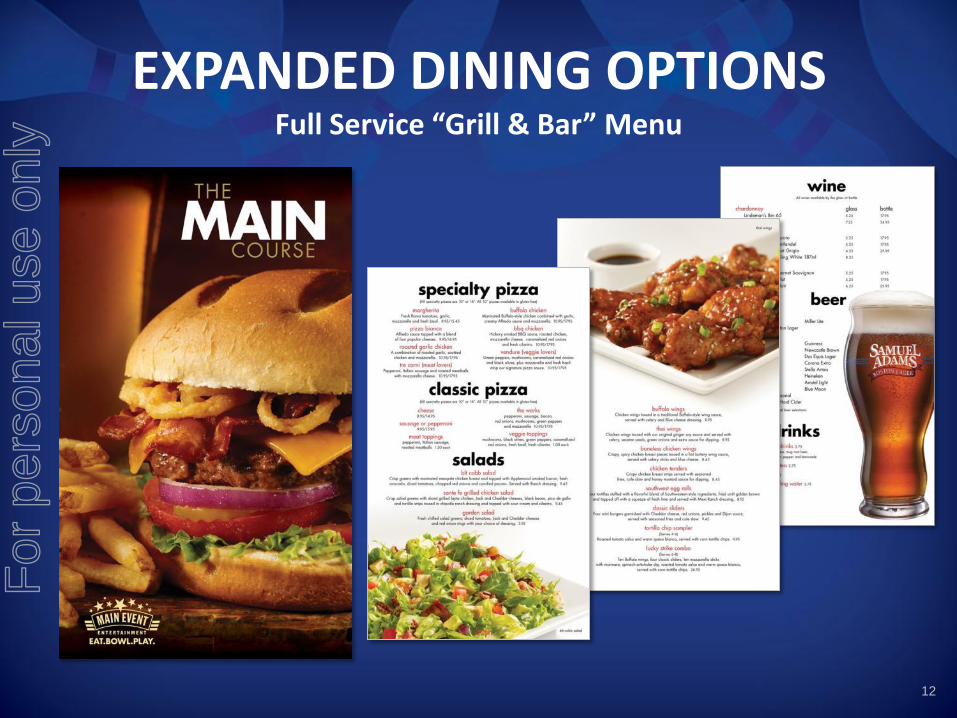
EXPANDED DINING OPTIONS Full Service “Grill & Bar” Menu
12
For
per
sona
l use
onl
y
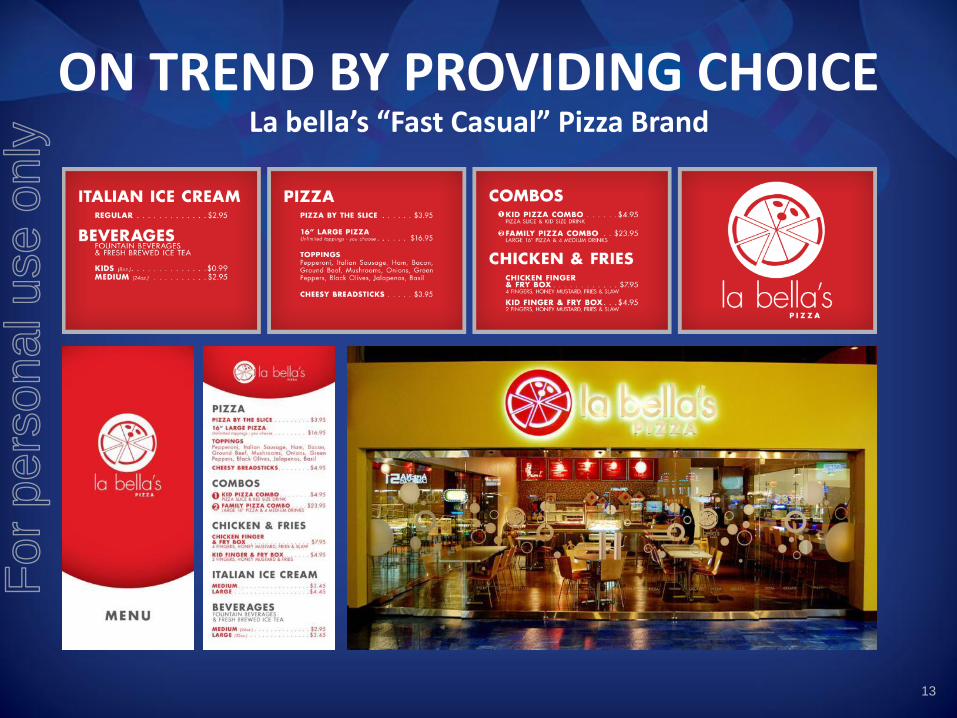
ON TREND BY PROVIDING CHOICE La bella’s “Fast Casual” Pizza Brand
13
For
per
sona
l use
onl
y
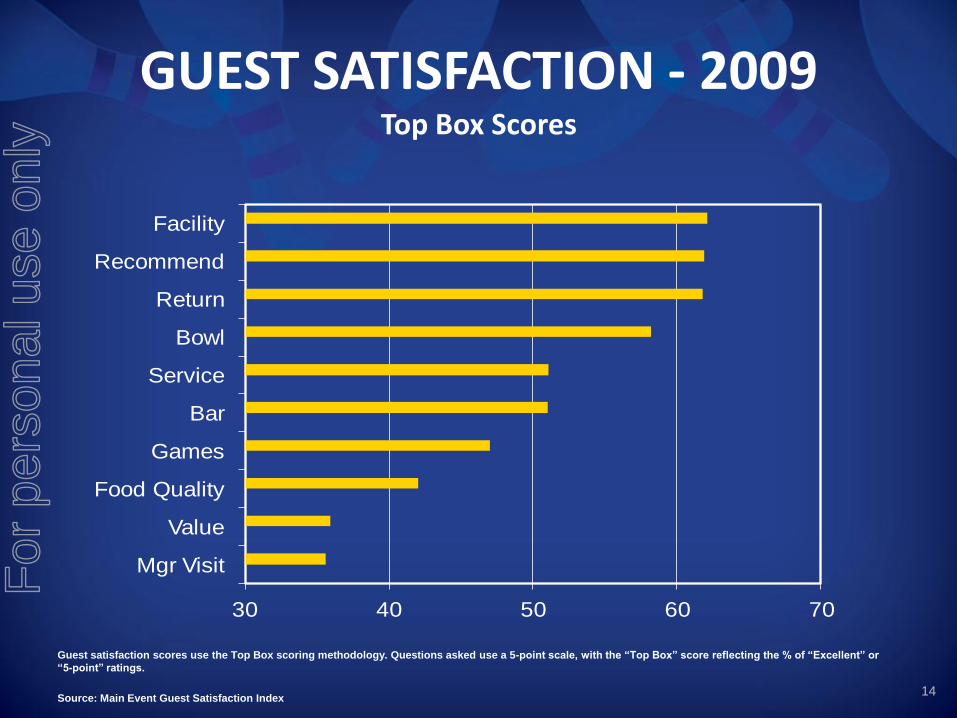
GUEST SATISFACTION - 2009 Top Box Scores
30 40 50 60 70
Mgr Visit
Value
Food Quality
Games
Bar
Service
Bowl
Return
Recommend
Facility
14 Source: Main Event Guest Satisfaction Index
Guest satisfaction scores use the Top Box scoring methodology. Questions asked use a 5-point scale, with the “Top Box” score reflecting the % of “Excellent” or
“5-point” ratings.
For
per
sona
l use
onl
y
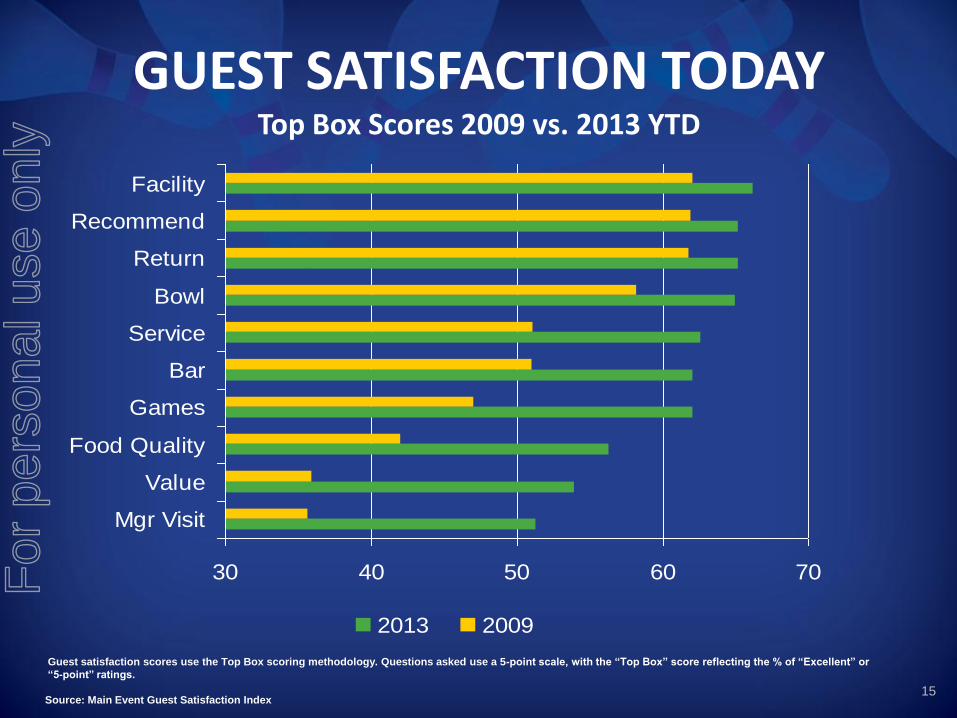
GUEST SATISFACTION TODAY Top Box Scores 2009 vs. 2013 YTD
15
30 40 50 60 70
Mgr Visit
Value
Food Quality
Games
Bar
Service
Bowl
Return
Recommend
Facility
2013 2009
Source: Main Event Guest Satisfaction Index
Guest satisfaction scores use the Top Box scoring methodology. Questions asked use a 5-point scale, with the “Top Box” score reflecting the % of “Excellent” or
“5-point” ratings.
For
per
sona
l use
onl
y
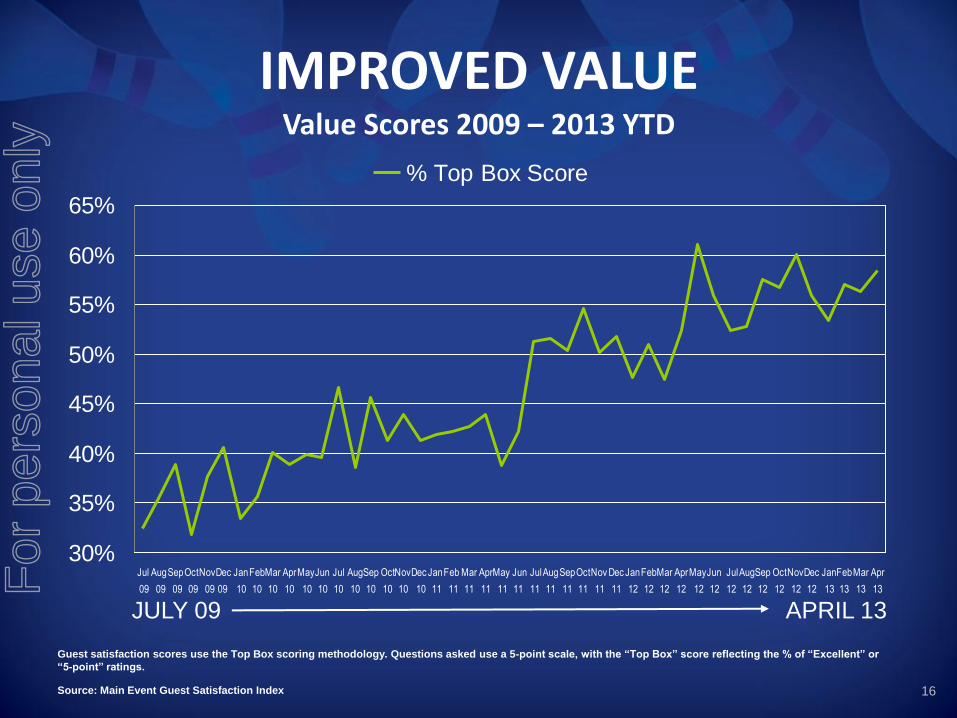
IMPROVED VALUE Value Scores 2009 – 2013 YTD
30%
35%
40%
45%
50%
55%
60%
65%
Jul
09
Aug
09
Sep
09
Oct
09
Nov
09
Dec
09
Jan
10
Feb
10
Mar
10
Apr
10
May
10
Jun
10
Jul
10
Aug
10
Sep
10
Oct
10
Nov
10
Dec
10
Jan
11
Feb
11
Mar
11
Apr
11
May
11
Jun
11
Jul
11
Aug
11
Sep
11
Oct
11
Nov
11
Dec
11
Jan
12
Feb
12
Mar
12
Apr
12
May
12
Jun
12
Jul
12
Aug
12
Sep
12
Oct
12
Nov
12
Dec
12
Jan
13
Feb
13
Mar
13
Apr
13
% Top Box Score
JULY 09 APRIL 13
16 Source: Main Event Guest Satisfaction Index
Guest satisfaction scores use the Top Box scoring methodology. Questions asked use a 5-point scale, with the “Top Box” score reflecting the % of “Excellent” or
“5-point” ratings.
For
per
sona
l use
onl
y
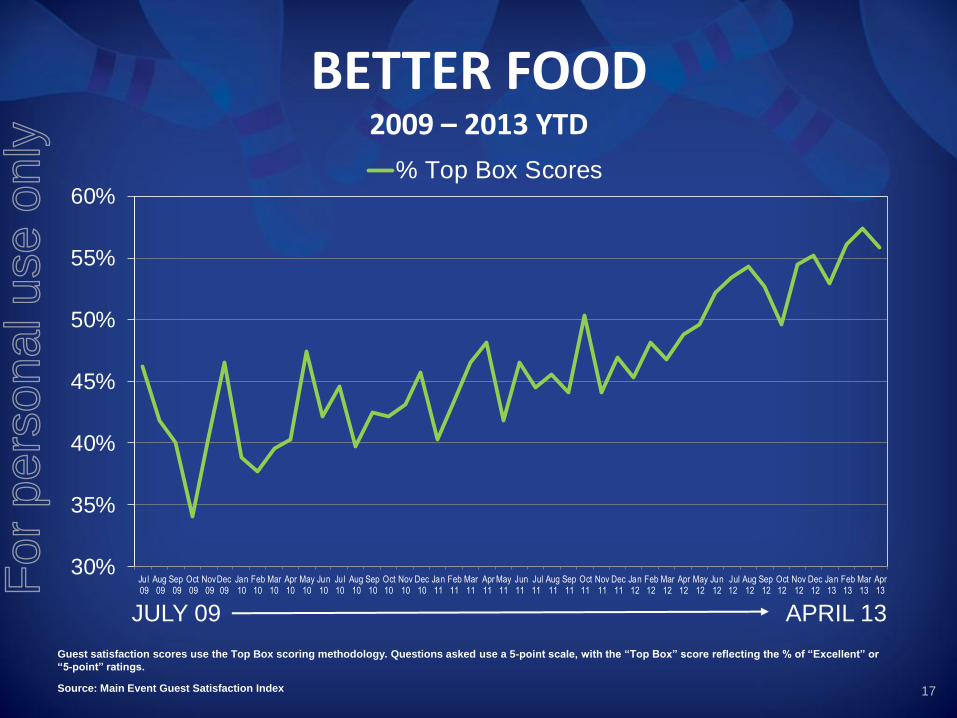
BETTER FOOD 2009 – 2013 YTD
30%
35%
40%
45%
50%
55%
60%
Jul 09
Aug 09
Sep 09
Oct 09
Nov 09
Dec09
Jan10
Feb10
Mar10
Apr10
May10
Jun10
Jul10
Aug10
Sep10
Oct10
Nov10
Dec10
Jan11
Feb11
Mar11
Apr11
May11
Jun11
Jul11
Aug11
Sep11
Oct11
Nov11
Dec11
Jan12
Feb12
Mar12
Apr12
May12
Jun12
Jul12
Aug12
Sep12
Oct12
Nov12
Dec12
Jan13
Feb13
Mar13
Apr13
% Top Box Scores
JULY 09 APRIL 13
17 Source: Main Event Guest Satisfaction Index
Guest satisfaction scores use the Top Box scoring methodology. Questions asked use a 5-point scale, with the “Top Box” score reflecting the % of “Excellent” or
“5-point” ratings.
For
per
sona
l use
onl
y
18
For
per
sona
l use
onl
y

BROAD PSYCHOGRAHIC APPEAL Main Event Entertainment vs. US Profile
Source: Buxton Research
0
2
4
6
8
10
12
14
16
A01
A
02
A03
A
04
A05
A
06
A07
B
01
B02
B
03
B04
B
05
B06
C
01
C02
C
03
C04
C
05
D01
D
02
D03
D
04
E01
E
02
E03
E
04
E05
E
06
F01
F
02
F03
F
04
F05
G
01
G02
G
03
G04
H
01
H02
H
03
H04
I0
1 I0
2 I0
3 I0
4 I0
5 J0
1 J0
2 J0
3 J0
4 J0
5 K
01
K02
K
03
K04
K
05
K06
L
01
L02
L
03
Perc
en
t
Psychographic segment
Top 3 Locations U.S. Profile
19
For
per
sona
l use
onl
y
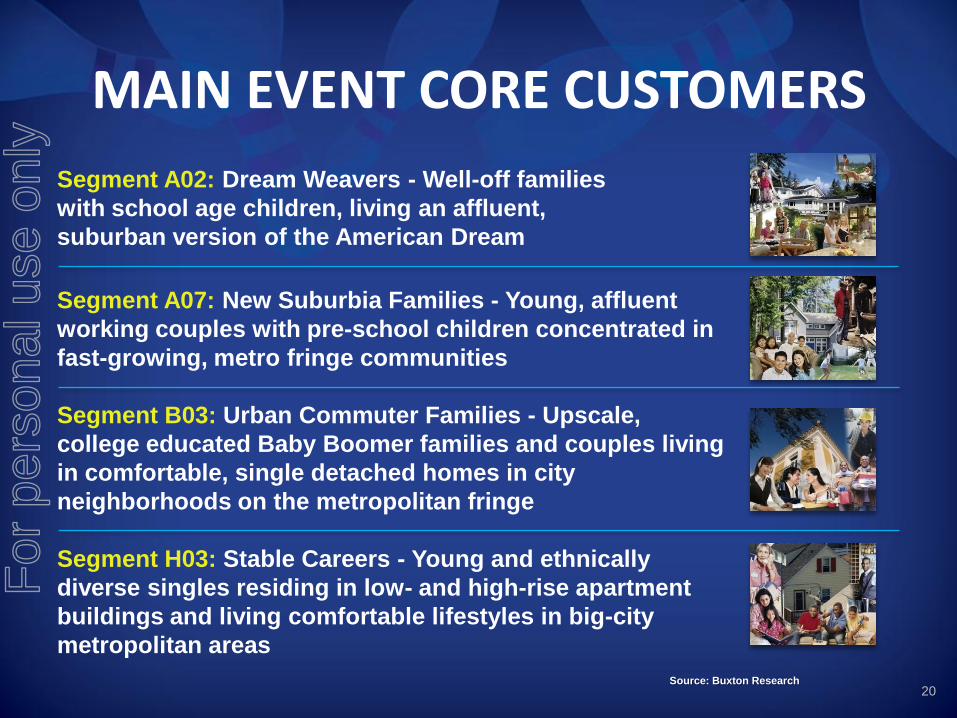
MAIN EVENT CORE CUSTOMERS
Source: Buxton Research
Segment A02: Dream Weavers - Well-off families
with school age children, living an affluent,
suburban version of the American Dream
Segment A07: New Suburbia Families - Young, affluent
working couples with pre-school children concentrated in
fast-growing, metro fringe communities
Segment B03: Urban Commuter Families - Upscale,
college educated Baby Boomer families and couples living
in comfortable, single detached homes in city
neighborhoods on the metropolitan fringe
Segment H03: Stable Careers - Young and ethnically
diverse singles residing in low- and high-rise apartment
buildings and living comfortable lifestyles in big-city
metropolitan areas
20
For
per
sona
l use
onl
y
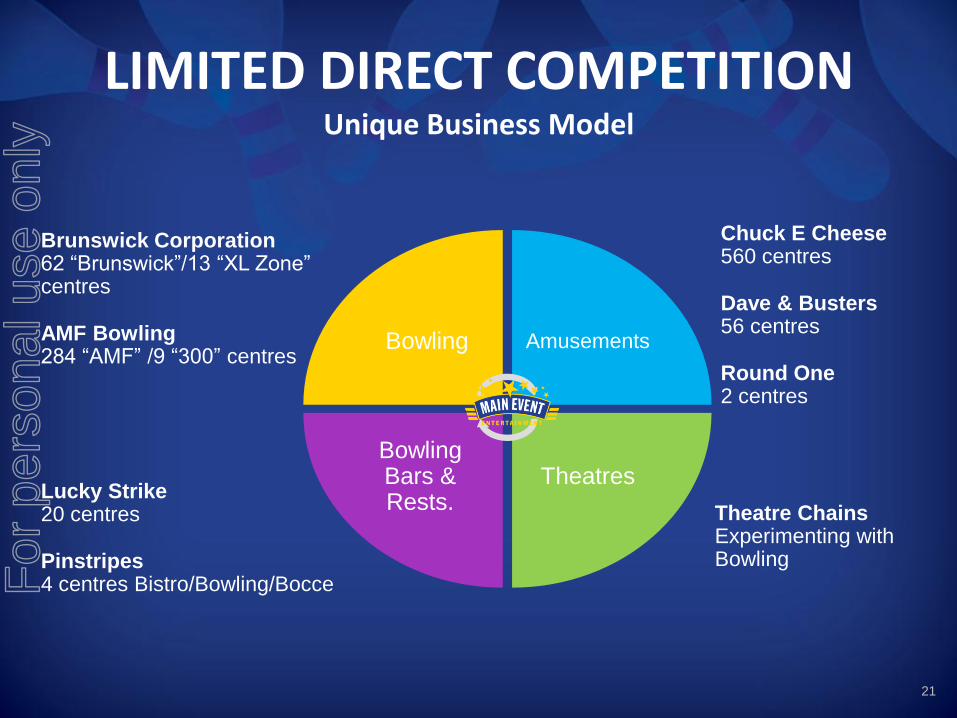
LIMITED DIRECT COMPETITION Unique Business Model
Brunswick Corporation 62 “Brunswick”/13 “XL Zone” centres
AMF Bowling 284 “AMF” /9 “300” centres
Lucky Strike 20 centres
Pinstripes 4 centres Bistro/Bowling/Bocce
Chuck E Cheese 560 centres
Dave & Busters 56 centres
Round One 2 centres
Theatre Chains Experimenting with Bowling
Bowling Amusements
Theatres Bowling Bars & Rests.
21
For
per
sona
l use
onl
y
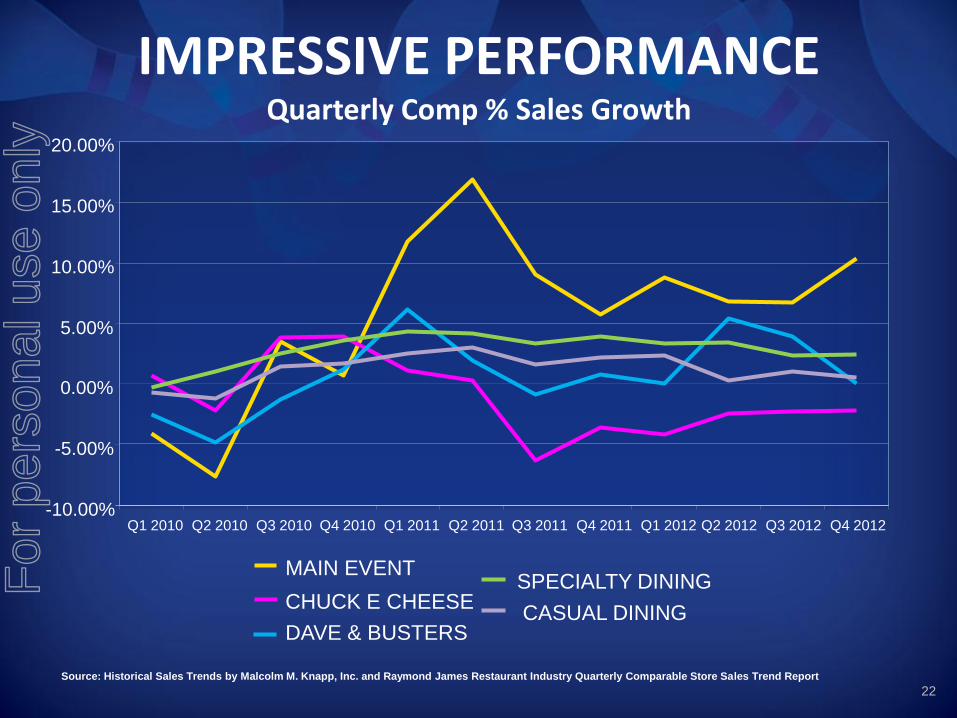
IMPRESSIVE PERFORMANCE Quarterly Comp % Sales Growth
Source: Historical Sales Trends by Malcolm M. Knapp, Inc. and Raymond James Restaurant Industry Quarterly Comparable Store Sales Trend Report
-10.00%
-5.00%
0.00%
5.00%
10.00%
15.00%
20.00%
Q1 2010 Q2 2010 Q3 2010 Q4 2010 Q1 2011 Q2 2011 Q3 2011 Q4 2011 Q1 2012 Q2 2012 Q3 2012 Q4 2012
MAIN EVENT
CHUCK E CHEESE
DAVE & BUSTERS
SPECIALTY DINING
CASUAL DINING
22
For
per
sona
l use
onl
y

23
For
per
sona
l use
onl
y

2013 HALF YEAR RESULTS
(1) EBITDA growth 39.6% when normalized for sale leaseback at Webster, Lubbock and Frisco
Revenue $32,058 $26,067 23.0%
EBRITDA $10,652 $8,316 28.1%
% 33.2% 31.9%
Property Costs ($4,384) ($3,161) 38.7%
EBITDA $6,268 $5,155 21.6%(1)
% 19.6% 19.8%
HY 13 HY 12 % Change
24
US$’000
For
per
sona
l use
onl
y
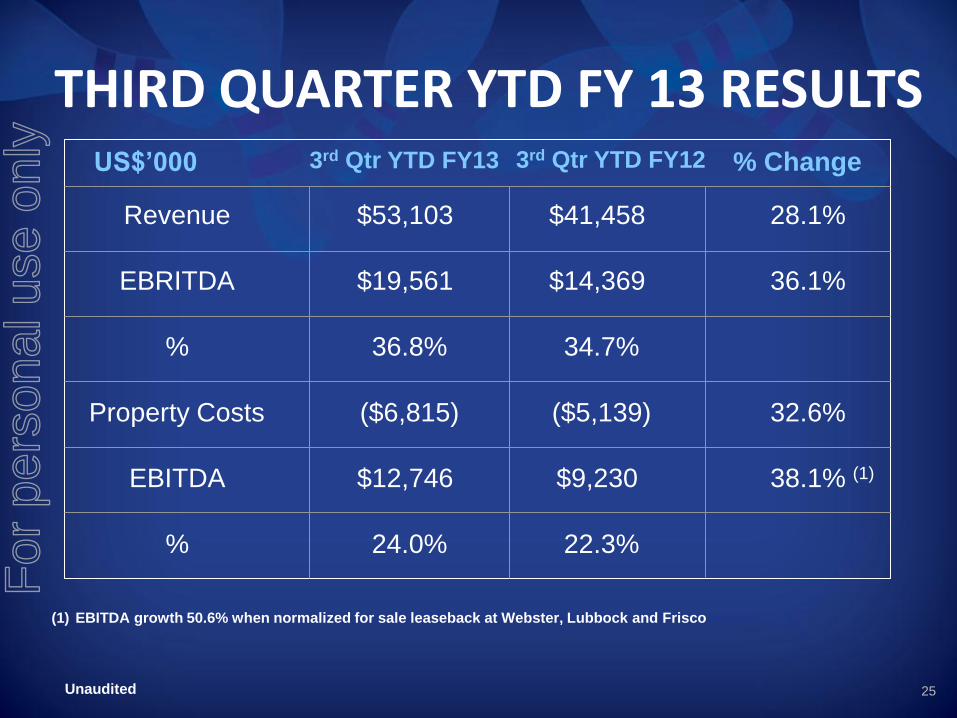
THIRD QUARTER YTD FY 13 RESULTS
(1) EBITDA growth 50.6% when normalized for sale leaseback at Webster, Lubbock and Frisco
Revenue $53,103 $41,458 28.1%
EBRITDA $19,561 $14,369 36.1%
% 36.8% 34.7%
Property Costs ($6,815) ($5,139) 32.6%
EBITDA $12,746 $9,230 38.1% (1)
% 24.0% 22.3%
3rd Qtr YTD FY13 % Change 3rd Qtr YTD FY12
Unaudited 25
US$’000
For
per
sona
l use
onl
y

FINANCIAL HIGHLIGHTS
• Total revenue trends continuing to grow: HY 13 up 23.0% to US$32.1M; 3rd Qtr YTD FY 13 up 28.1% to US$53.1M
• 3rd Qtr YTD FY 13 constant centre revenue grew 4.8%; EBITDA grew 8.9% excluding additional sale and leaseback rents.
• Value promotions driving increased traffic and guest spend.
• Strong performance at new centres: San Antonio, Katy and Stafford ahead of expectations
• Total EBITDA trends continuing to grow: HY 13 EBITDA grew 21.6% to US$6.3M; 3rd Qtr YTD FY 13 grew 38.1% to US$12.7M.
• EBITDA growth rates for HY 13 and 3rd Qtr YTD FY 13 are 39.6% and 50.6% respectively when normalized for rentals from sale and leasebacks.
26
For
per
sona
l use
onl
y
$400,000
$600,000
$800,000
$1,000,000
$1,200,000
$1,400,000
$1,600,000
$1,800,000
$2,000,000
2010 2011 2012 2013
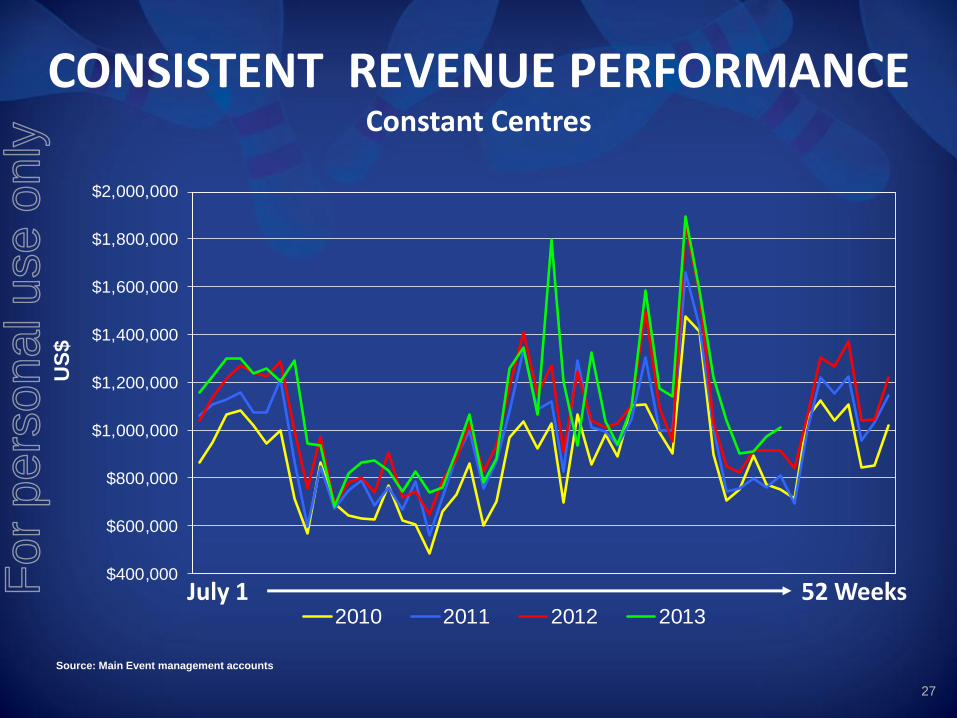
CONSISTENT REVENUE PERFORMANCE Constant Centres
July 1 52 Weeks
Source: Main Event management accounts
27
US
$
For
per
sona
l use
onl
y
28
For
per
sona
l use
onl
y
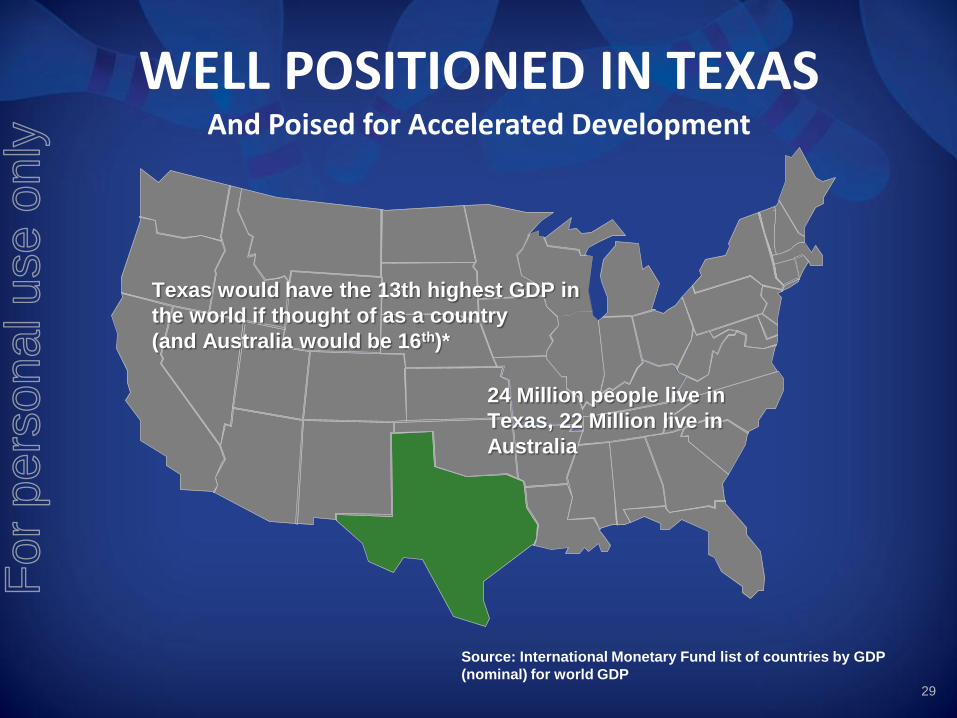
WELL POSITIONED IN TEXAS And Poised for Accelerated Development
Texas would have the 13th highest GDP in
the world if thought of as a country
(and Australia would be 16th)*
24 Million people live in
Texas, 22 Million live in
Australia
Source: International Monetary Fund list of countries by GDP
(nominal) for world GDP 29
For
per
sona
l use
onl
y
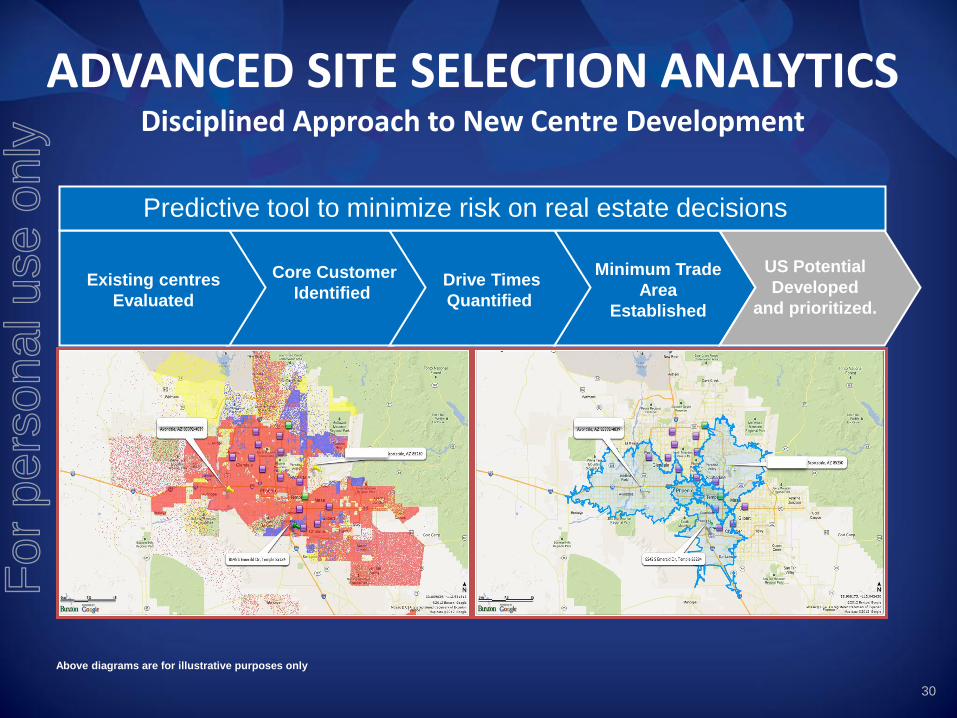
ADVANCED SITE SELECTION ANALYTICS Disciplined Approach to New Centre Development
Core Customer
Identified
Minimum Trade
Area
Established
Existing centres
Evaluated
Drive Times
Quantified
US Potential
Developed
and prioritized.
Predictive tool to minimize risk on real estate decisions
30
Above diagrams are for illustrative purposes only
For
per
sona
l use
onl
y

MAIN EVENT ENTERTAINMENT New Prototype Elevation
31
For
per
sona
l use
onl
y
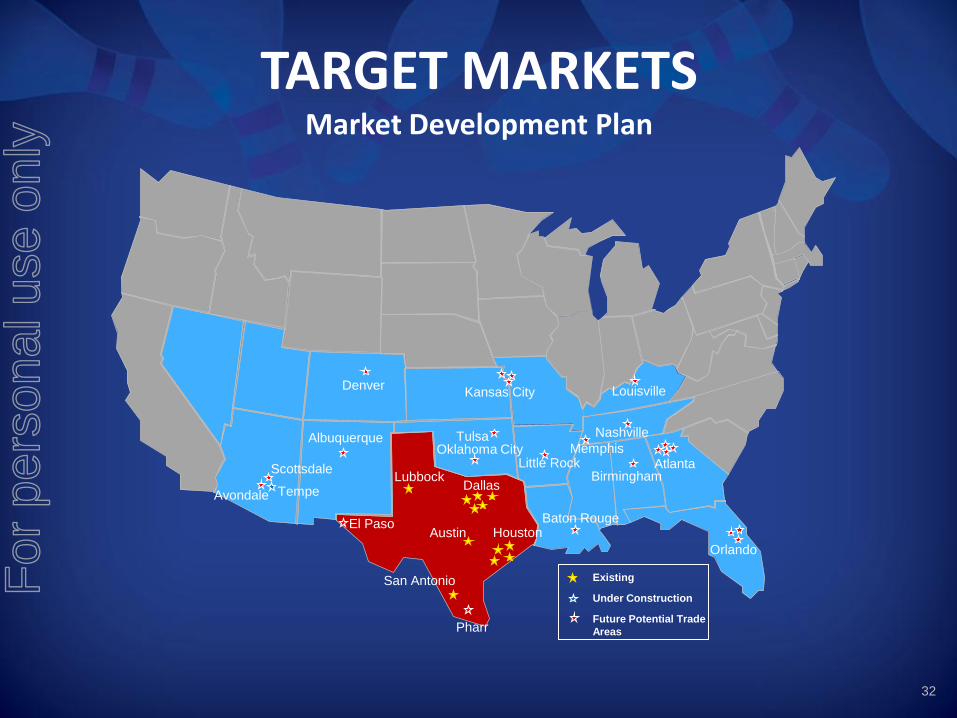
TARGET MARKETS Market Development Plan
Tempe
Kansas City
Atlanta
Pharr
Houston
Lubbock Dallas
Austin
San Antonio
Scottsdale
Avondale
El Paso
Denver
Tulsa Nashville
Little Rock
Orlando
Albuquerque
Baton Rouge
Birmingham
Louisville
Memphis Oklahoma City
Existing
Under Construction
Future Potential Trade
Areas
32
For
per
sona
l use
onl
y
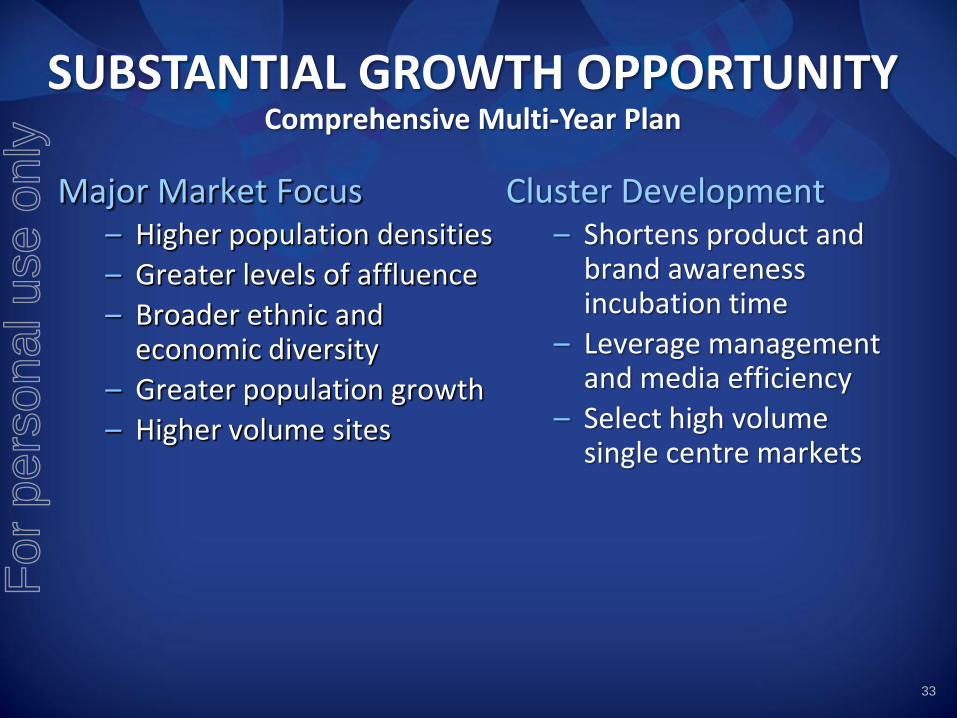
SUBSTANTIAL GROWTH OPPORTUNITY Comprehensive Multi-Year Plan
Major Market Focus – Higher population densities
– Greater levels of affluence
– Broader ethnic and economic diversity
– Greater population growth
– Higher volume sites
Cluster Development – Shortens product and
brand awareness incubation time
– Leverage management and media efficiency
– Select high volume single centre markets
33
For
per
sona
l use
onl
y

34
For
per
sona
l use
onl
y
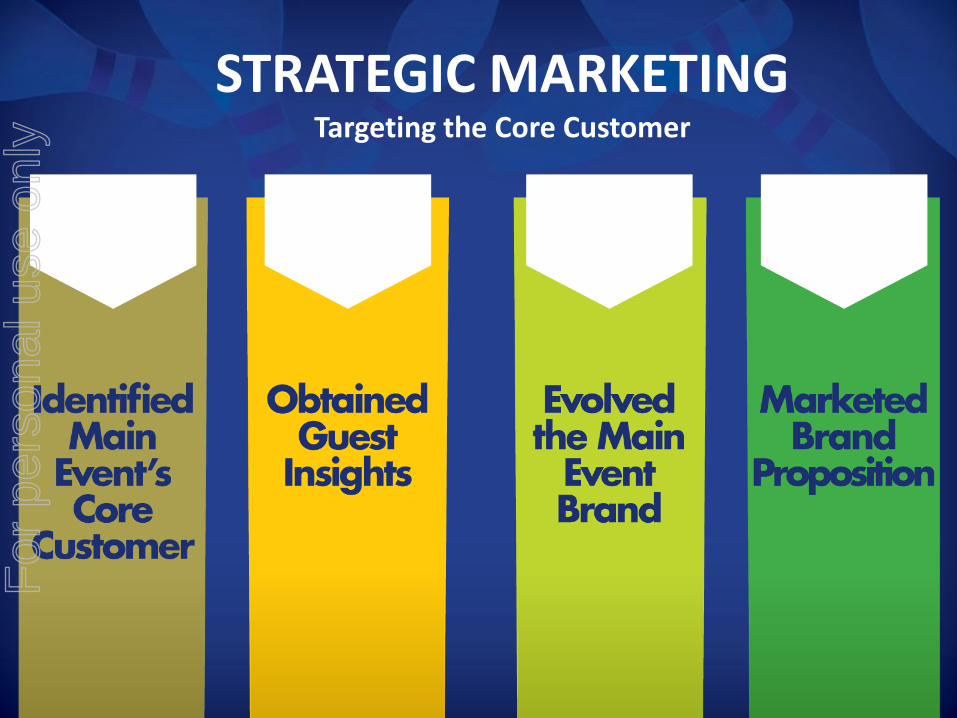
STRATEGIC MARKETING Targeting the Core Customer
For
per
sona
l use
onl
y
36
For
per
sona
l use
onl
y
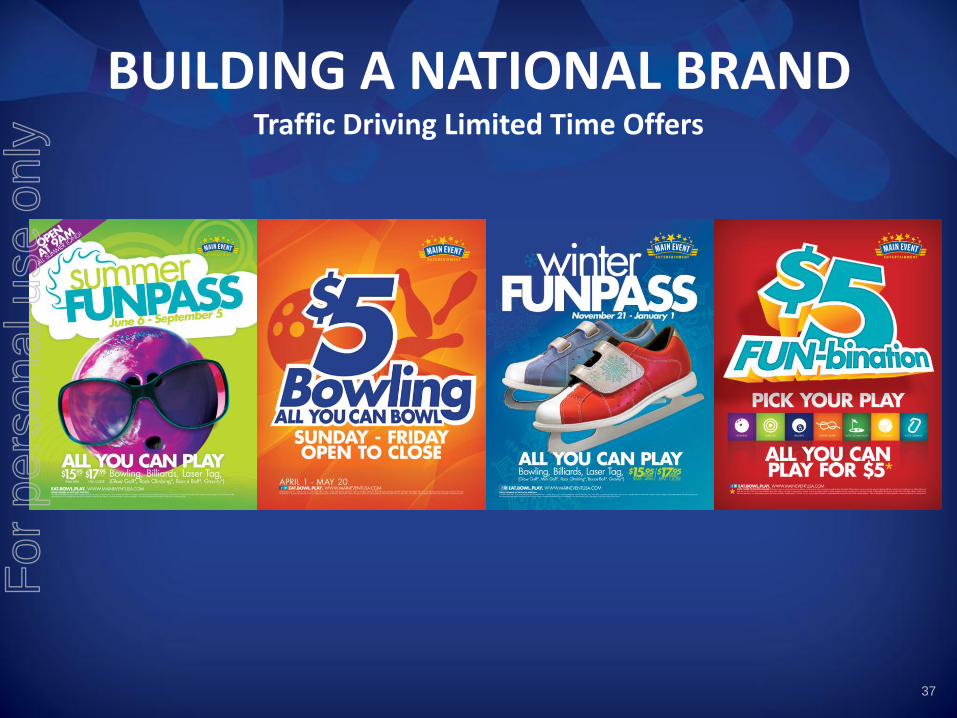
BUILDING A NATIONAL BRAND Traffic Driving Limited Time Offers
37
For
per
sona
l use
onl
y

38
For
per
sona
l use
onl
y
39
For
per
sona
l use
onl
y
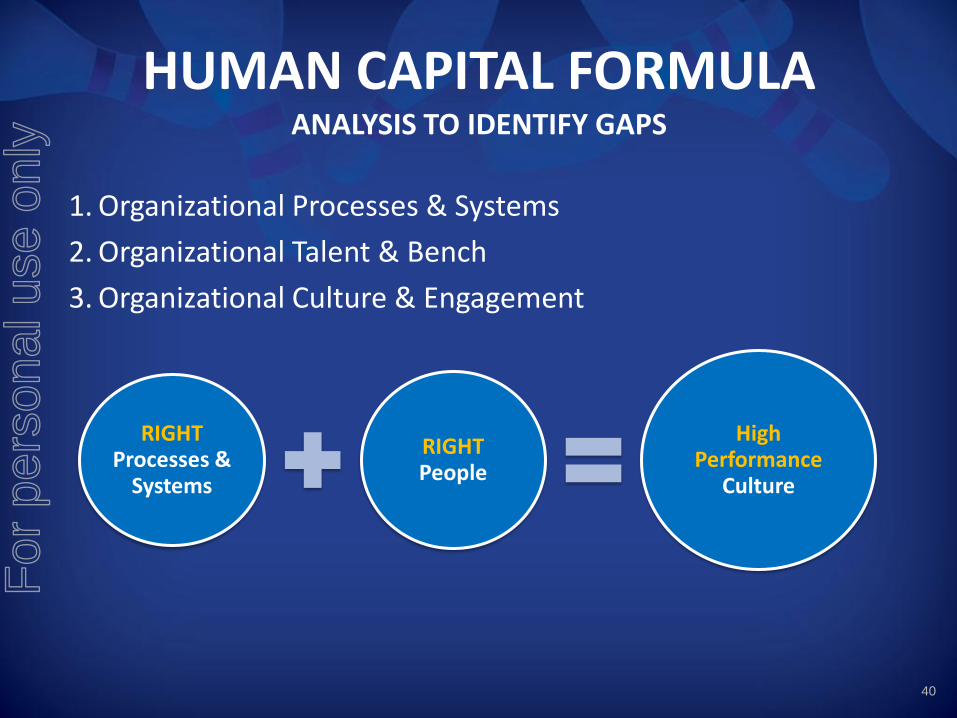
HUMAN CAPITAL FORMULA ANALYSIS TO IDENTIFY GAPS
1. Organizational Processes & Systems
2. Organizational Talent & Bench
3. Organizational Culture & Engagement
RIGHT Processes &
Systems
RIGHT People
High Performance
Culture
40
For
per
sona
l use
onl
y
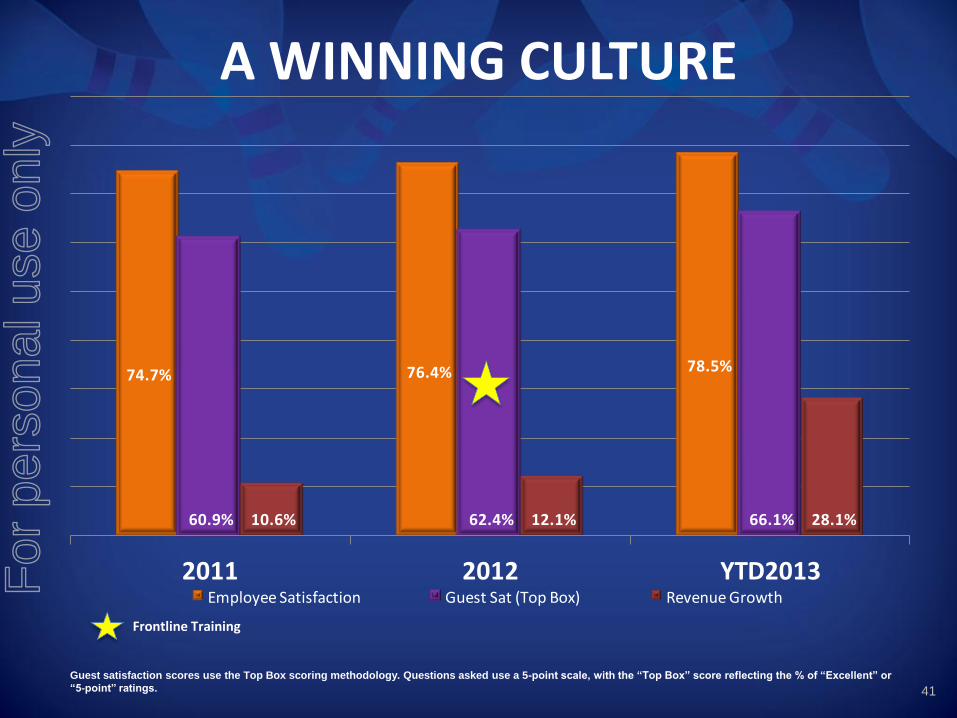
74.7% 76.4% 78.5%
60.9% 62.4% 66.1%10.6% 12.1% 28.1%
2011 2012 YTD2013Employee Satisfaction Guest Sat (Top Box) Revenue Growth
A WINNING CULTURE
Frontline Training
Guest satisfaction scores use the Top Box scoring methodology. Questions asked use a 5-point scale, with the “Top Box” score reflecting the % of “Excellent” or
“5-point” ratings. 41
For
per
sona
l use
onl
y

PREPARING FOR GROWTH TALENT STRATEGY
Attract & Retain “Noticeably Better People” Incorporate automated selection assessments for the frontline
Incorporate talent planning to assess promotable bench at all levels
Develop & execute talent acquisition strategy to build for the future
Incorporate strategies to ensure market competitive compensation
Create a “Noticeably Distinctive Culture” Design competency based leadership development tools
Design scalable organizational structures with the capacity for growth
Identify & design career mapping processes to retain top talent
42
For
per
sona
l use
onl
y

WRAP-UP Q & A
43
For
per
sona
l use
onl
y
DISCLAIMER This information has been prepared for general information purposes only, is not general financial product advice and has been prepared by Ardent Leisure Management Limited ABN 36 079 630 676 (ALML), without taking into account any potential investors’ personal objectives, financial situation or needs. Past performance information provided in this presentation may not be a reliable indication of future performance. Due care and attention has been exercised in the preparation of forecast information, however, forecasts, by their very nature, are subject to uncertainty and contingencies many of which are outside the control of ALML and Ardent Leisure Limited (ALL). Actual results may vary from forecasts and any variation may be materially positive or negative. ALML provides a limited $5 million guarantee to the Australian Securities and Investments Commission in respect of ALML's Corporations Act obligations as a responsible entity of a managed investment scheme. Neither ALML nor any other Ardent Leisure Group entity otherwise provides assurances in respect of the obligations of any entity within Ardent Leisure Group. The information contained herein is current as at the date of this presentation unless specified otherwise.
44
For
per
sona
l use
onl
y


![Copyright © C. J. Date 2005page 97 S#Y S1DURINGS3DURING [d04:d10][d08:d10] S2DURINGS4DURING [d02:d04][d04:d10] [d08:d10] WITH ( EXTEND T2 ADD ( COLLAPSE](https://img.pdfslide.us/doc/110x75/56649c765503460f9492abbb/copyright-c-j-date-2005page-97-sy-s1durings3during-d04d10d08d10.jpg)