Embed Size (px)
Citation preview

�
�
�
�
CONSUMPTION, SPENDING AND INVESTMENT BEHAVIOUR OF MALAYSIA GENERATION Y
AMIRTHA SANGEETHA GANESAN
A research project submitted in partial fulfilment of the requirement for the degree of
Master of Business Administration
Universiti Tunku Abdul Rahman
Faculty of Accountancy and Management
May 2012
�
�
���
�
CONSUMPTION, SPENDING AND INVESTMENT
BEHAVIOUR OF MALAYSIA GENERATION Y
By
Amirtha Sangeetha Ganesan
This research project is supervised by:
Dr Lim Chee Seong Assistant Professor
Department of Economic Faculty of Accountancy and Management

�
�
����
�
Copyright @ 2012
ALL RIGHT RESERVED. No part of this paper may be reproduced, stored in a
retrieval system, or transmitted in any form or by any means, graphic, electronic,
mechanical, photocopying, recording, scanning, or otherwise, without the prior
consent of the authors.

�
�
���
�
DECLARATION
I hereby declare that :
(1) This GBMZ2016 Research Project is the end result of my own work and
that due acknowledgement has been given in the references to all sources of
information be they printed, electronic, or personal.
(2) No portion of this research project has been submitted in support of any
application for any other degree or qualification of this or any other
university, or other institutes of learning.
(3) The word count of this research project is _________16,771_____________
Name of Student : Amirtha Sangeetha Ganesan
Student ID : _____080UKM1961_______
Signature : _______________________
Date : _______31 May 2012______

�
�
��
�
ACKNOWLEDGMENTS
I would like to take this opportunity to thank a number of people that have been
helping me on this journey and in completing this research project.
Firstly, I would like to express sincere gratitude to my wonderful supervisor, Dr.
Lim Chee Seong, for sparing his time in providing me with advice and support
from the very start to the end. Without his guidance and encouragement, I would
not have been able to complete this research project.
Also, I want to thank my family for their overwhelming love, support, and
encouragement throughout this course. Additionally, I must thank all the
respondents and friends who devoted their time in taking part in this research
project. It would not have been completed without you. Last but not least I would
like to thank the staff of Institute of Postgraduate Studies and Research

�
�
���
�
TABLE OF CONTENTS Page
Copyright Page ii
Declaration iii
Acknowledgments v
Table of Contents iv
List of Tables xii
List of Figures xiii
Abstract xv
CHAPTER 1 INTRODUCTION 1
1.1 Research Background 1
1.2 Problem Statement 4
1.3 Research Questions 5
1.4 Research Objectives 6
1.41 General Objective 6
1.4.2 Specific Objective 6
1. 5 Limitation of Study 7

�
�
����
�
1. 6 Significance of the Study 7
1. 7 Organisation of Study 8
CHAPTER 2 LITERATURE REVIEW 9
2.1 Introduction 9
2.1 Generation Y 9
2.1.1 Who is Generation Y? 9
2.2.2 Characteristics for Generation Y 10
2.3 Consumption and Spending of Generation Y 11
2.4 Saving and Investment Behaviour 13
2.4.1 Saving behaviours and motivation to save 13
2.4.2 Investment Behaviour 15
2. 5 Communication Channels 17
2.6 Hypotheses 20
2.6.1 Hypotheses on saving 20
2.6.2 Hypotheses on Spending 21
2.6.3 Hypotheses on Investing in high risk financial 22
Products
�
�
�����
�
2.6.3.1 Relationship between Gender and 22
preferences in investing in high risk
financial Products
2.6.3.2 Relationship between Race and 23
preferences in investing in high�risk
financial Products
2.6.3.3 Relationship between Marital Status and 23
preferences in investing in high risk
financial Products
2.6.3.4 Relationship between Marital Status and 24
preferences in investing in high risk
financial Products
2.6.4 Hypotheses on Investing in high risk financial 24
Products
CHAPTER 3 RESEARCH METHODOLOGY 25
3.1 Introduction 25
3.2 Population/ Research Sample 25
3.2.1 Primary Data Collection 25
3.2.2 Secondary Data Collection 26
3.3 Questionnaire Design 26

�
�
���
�
3.4 Questionnaire distribution 27
3.5 Pilot test 28
3.5.1 Reliability Analysis 28
3.6 Descriptive Analysis 29
3.7 Inferential Analysis 30
3.7. 1 Cross-tabulation and Chi-square 30
3.7.2 Multiple Regressions 31
3.8 Data Analysis Procedure 32
CHAPTER 4 RESEARCH RESULT 33
4.1 Introduction 33
4.2 Descriptive Statistics 33
4.2.1 Demographic Profile 33
4.2.1.1 Age profile of respondant 34
4.2.1.2 Gender profile of respondants 35
4.2.1.3 Marital Status of Respondants 35
4.2.1.4 Ethinc of Respondants 36
4.2.1.5 Education level of Respondants 36�
�
�
��
�
4.2.1.6 Current Working Position of Respondants 37
4.2.1.7 Income level of respondant 38
4.2.2 Information Sources 39
4.2.3 Spending and Saving Patterns by Malaysian 41
Generation Y
4.2.3.1 Method of Saving 42
4.2.3.2 Main purposed of saving 42
4.2.3.3 Factor that Hinder from Saving 43
4.2.3.4 Monthly Spending 44
4.2.3.5 Monthly income spend out of budget 44
4.2.3.6 Retirement and Debt 45
4.2.4 Investment Techniques 45
4.2.4.1 Diversify portfolio 45
4.2.4.2 Preferred methods of 45
purchasing shares
4.2.4.3 Preferred type of Unit Trust 46
4.2.5 Investment Risk Profile of Malaysian 47
Generation Y
�
�
���
�
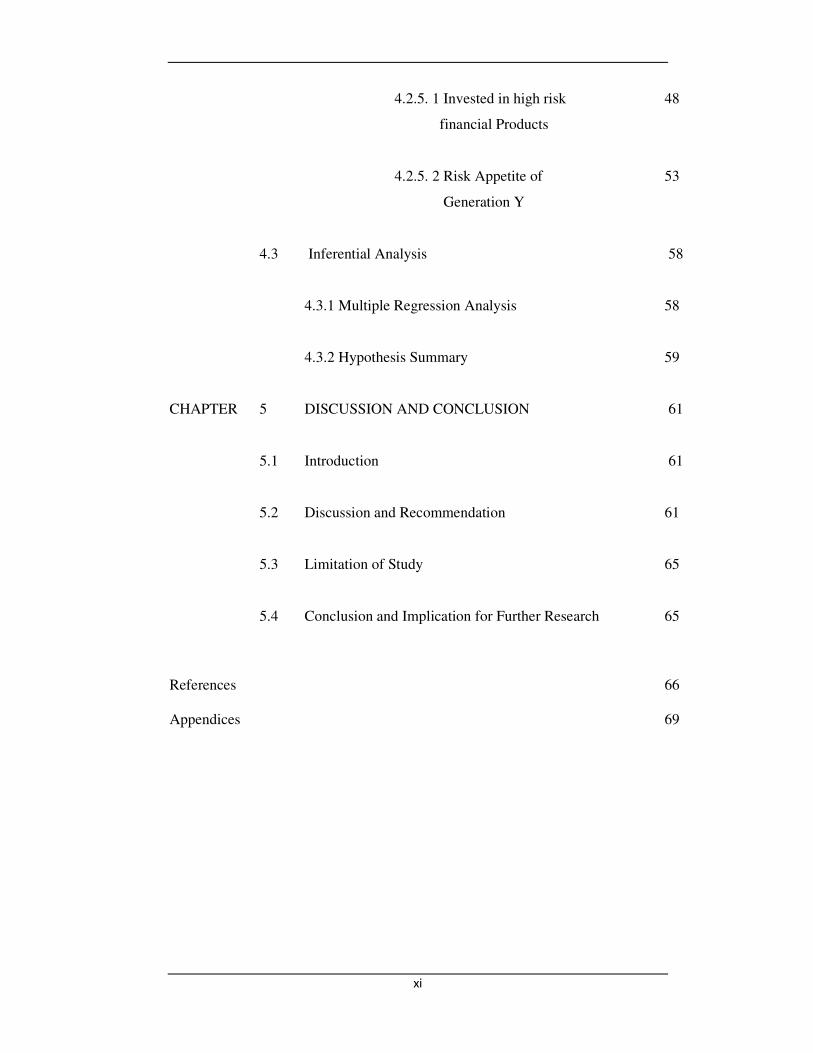
4.2.5. 1 Invested in high risk 48
financial Products
4.2.5. 2 Risk Appetite of 53
Generation Y
4.3 Inferential Analysis 58
4.3.1 Multiple Regression Analysis 58
4.3.2 Hypothesis Summary 59
CHAPTER 5 DISCUSSION AND CONCLUSION 61
5.1 Introduction 61
5.2 Discussion and Recommendation 61
5.3 Limitation of Study 65
5.4 Conclusion and Implication for Further Research 65
References 66 Appendices 69

�
�
����
�
LIST OF TABLES Page
Table 1: Malaysian Population 2010 2
Table 2: Reliability Statistics 29
Table 3: Preferred communication channel of Malaysian Generation Y 39
Table 4: Preferred Channel of Communication on Investment 40
Schemes/Packages offered by the Banks
Table 5: Monthly Income Saved and Income Spent 41
Table 6: One-Sample T Test 41
Table 7: Saving Method of Malaysian Generation Y 42
Table 8: Main purposed of saving 43
Table 9: Reasons that hider Generation Y from Saving 43
Table 10: Monthly Spending of Generation Y 44
Table11: Spent of of budgt by gender 44
Table 12: Worry about Retirement and Debt 45
Table13: Preferred methods for purchasing shares by Generation Y 46
Table 14: Selection of Unit Trust type by Generation Y 47

�
�
�����
�
Table 15: Factors consider before investing by Generation Y 47
Table 16: Investing in stock Market in risky 48
Table 17: Preferred to in Invest in Bursa Malaysia 48
Table 18: Cross tabulation investing high risk financial products 48
vs Gender
Table 19:�Cross tabulation investing high risk financial products 50
vs Race
Table 20: Cross tabulation investing high risk financial products 51
vs Marital Status
Table 21: Cross tabulation investing high risk financial products 53
vs Income
Table 22: Cross tabulation Risk Appetite in Investing 54
Table 23: Model summary of Multiple Regression Analysis for Saving 55
Table 24: Anova for Saving 55
Table 25: Coefficients of Multiple Regression Analysis for Saving 56
Table 26: Model summary of Multiple Regression Analysis for Spending 57
Table 27: Anova for Spending 57
Table 28: Coefficients of Multiple Regression Analysis for Spending 58
Table 29: Summary of Hypotheses 59
�
�
����
�
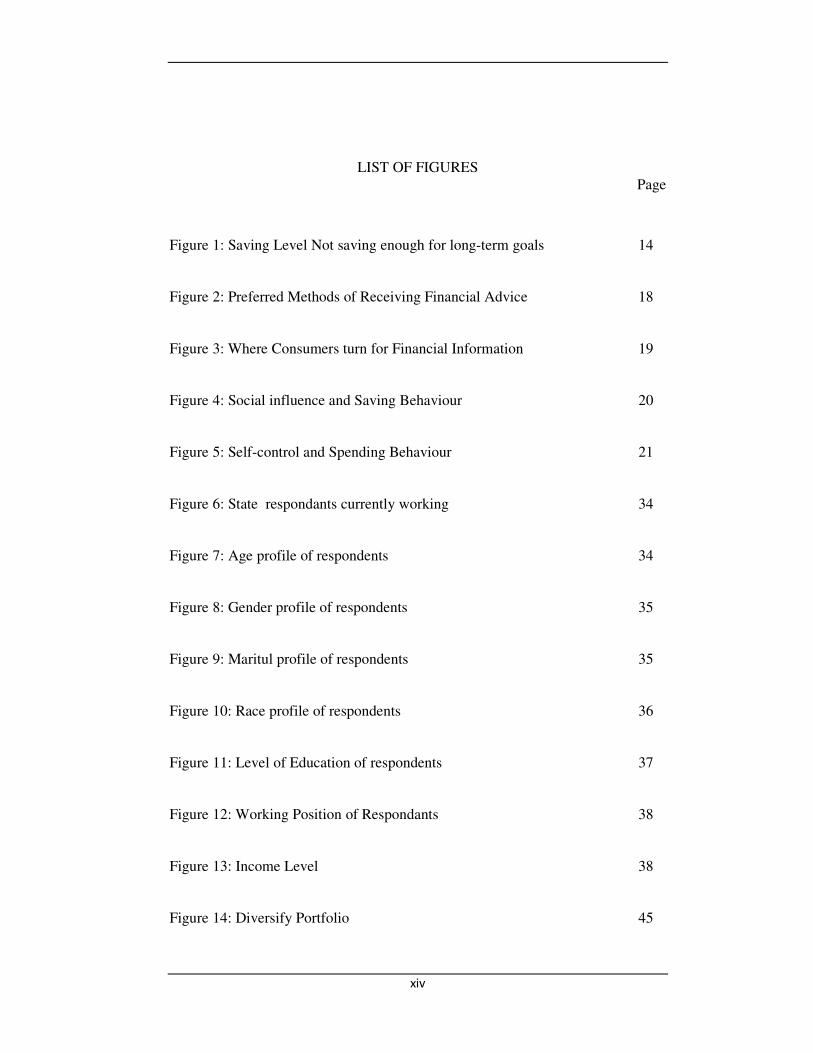
LIST OF FIGURES Page
Figure 1: Saving Level Not saving enough for long-term goals 14
Figure 2: Preferred Methods of Receiving Financial Advice 18
Figure 3: Where Consumers turn for Financial Information 19
Figure 4: Social influence and Saving Behaviour 20
Figure 5: Self-control and Spending Behaviour 21
Figure 6: State respondants currently working 34�
Figure 7: Age profile of respondents 34
Figure 8: Gender profile of respondents 35
Figure 9: Maritul profile of respondents 35
Figure 10: Race profile of respondents 36
Figure 11: Level of Education of respondents 37
Figure 12: Working Position of Respondants 38
Figure 13: Income Level 38
Figure 14: Diversify Portfolio 45�

�
�
���
�
ABSTRACT �
In Malaysia, there is little investigation on Generation Y consumption and
spending behaviour which directly affect their saving and investment decision.
Therefore this study is to know more about Malaysian Generation Y and to fill the
knowledge gap on their spending, saving and investment behaviour. The main
purposed of this study is firstly to determine the consumption and spending
patterns of Malaysia Generation Y, secondly to determine the level of saving and
the forms of saving performed by them. Thirdly is to determine the method of
investments practice by Malaysia Generation Y and their awareness of risk
management investment and lastly is to determine the effective channels of
communication with Generation Y.
This research adopts quantitative approach where data for this studies has been
conducted by survey method targeted to Malaysian Generation Y those age
between 19-32. A total of 592 set of questionnaire has been collected both
manually and online survey form responded in 11 capital city of peninsular
Malaysia. Form the study it was known that the average Gen Y spend 60% of their
monthly income. It is also know that that most Malaysian Generation Y define
investing in stock market are risky and majority of Malaysia Generation Y do not
prefer investing in high risk investment. (Future Markets 84%, Forex Markets
98% and Commodity Markets 91%).The finding from this study also show that
the prefer method of communication between with Malaysian Generation Y and
Financial Institution/Banks are through online medium that is through email and
online social media communication

�
�
Page 1 of 83�
CHAPTER 1
INTRODUCTION This chapter presents the overview of the research that will be studied, its problem
statements, research questions and the research objective of this project.
1.1 Research Background
The focus on studying Generation Y is significant as this group of the population
will soon dominate the consumer market as the Baby Boomer generations are
aging. With the Baby Boomers generation getting closer to retirement and their
population getting smaller, their children the Generation Y are poised to take over
as the largest group for policy makers and marketers to focus on. However, these
generation groups have different characteristic compared to their parents and
policy makers as well as marketers are required to change their strategies to
accommodate this generation.
Generation Y are viewed “as a generation with very high buying power” as they
have annual incomes totaling USD211 billion and spend USD39 billion per year
(Nowak, Thach and Olsen 2006). In (Visa USA Inc., 2007) statistics it stated that
by 2015 Generation Y will account for approximately USD2.45 trillion in annual
spending. Therefore, businesses across all industries will need to know and
appreciate the qualities and values of the Gen Y and being sensitive to their needs
willed be the key factor in expanding current businesses.
�
�
Page 2 of 83�
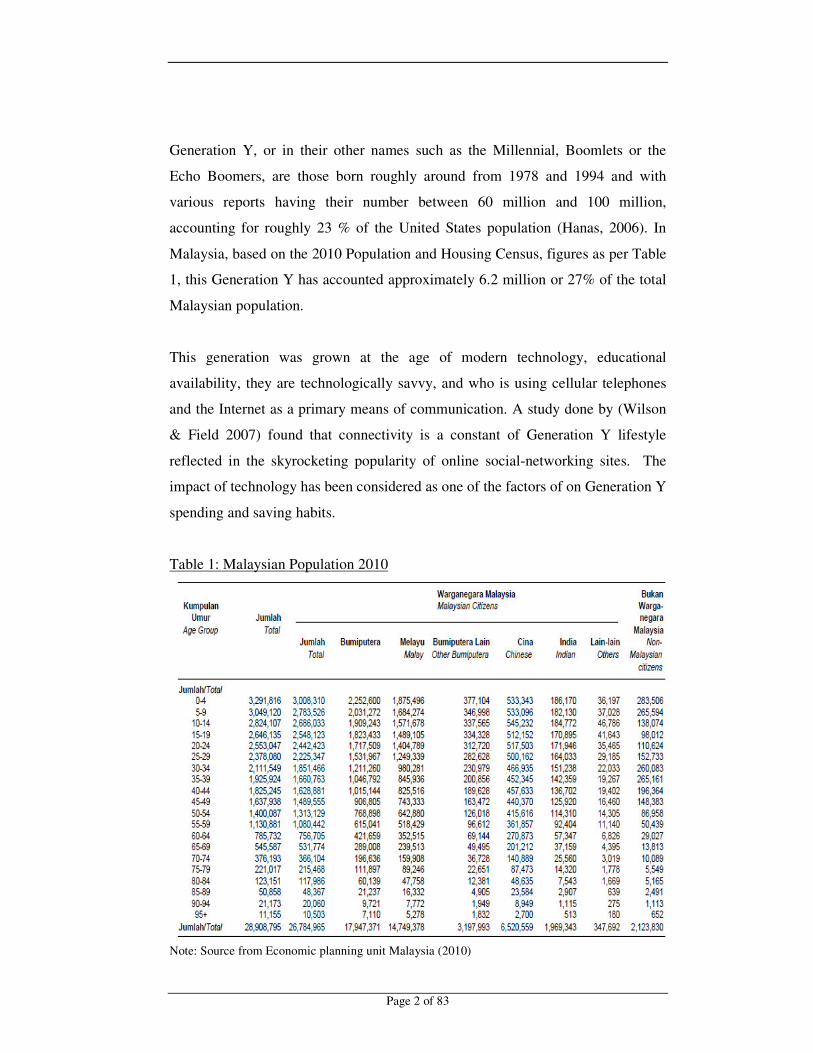
Generation Y, or in their other names such as the Millennial, Boomlets or the
Echo Boomers, are those born roughly around from 1978 and 1994 and with
various reports having their number between 60 million and 100 million,
accounting for roughly 23 % of the United States population (Hanas, 2006). In
Malaysia, based on the 2010 Population and Housing Census, figures as per Table
1, this Generation Y has accounted approximately 6.2 million or 27% of the total
Malaysian population.
This generation was grown at the age of modern technology, educational
availability, they are technologically savvy, and who is using cellular telephones
and the Internet as a primary means of communication. A study done by (Wilson
& Field 2007) found that connectivity is a constant of Generation Y lifestyle
reflected in the skyrocketing popularity of online social-networking sites. The
impact of technology has been considered as one of the factors of on Generation Y
spending and saving habits.
Table 1: Malaysian Population 2010
Note: Source from Economic planning unit Malaysia (2010)

�
�
Page 3 of 83�
A research conducted by Martin and Turley (2004), found that Generation Y
adult in US is strongly motivated by objective. This generation highlight on the
value of product purchased and as for managing their financial and investment
requirements, Generation Y may turn out to be the financially savviest generation,
where they are knowledgeable about investments and eager to strike out on their
own with start-up businesses.
However, the study done by Der Hovanesian (1999) claimed that the Generation
Y are conscious of money, but do not have the knowledge about it. It is also
known that this generation tends to spend their cash as soon as they get it, and its
usually on consumer goods, while some Generation Y is precocious in getting
involved in investing and small business, as they think success is not only
possible, but inevitable.
The investment habit of Generation Y will also be looked into. According to the
Investment Company Institute (ICI), based on data as of 2010 (as cited in John
Ameriks & Utkus 2011) younger generations of investors are now less likely to
own any equities than in the past. For investors born in the 1950s, ownership of
stocks rose rapidly from ages 35 to 45. For investors born in the 1960s, ownership
of stocks grew quite rapidly even earlier: between ages 25 and 35. But for
investors born in the 1970s, stock ownership rose quickly from ages 25 to 27, and
slumped thereafter. These data are also partially reflected in a 2010 ICI survey of
investor risk tolerance Younger Generation Y investors were less likely to take
“above average risk” and more likely to take “average” risk than Generation X
investors.
�
�
Page 4 of 83�
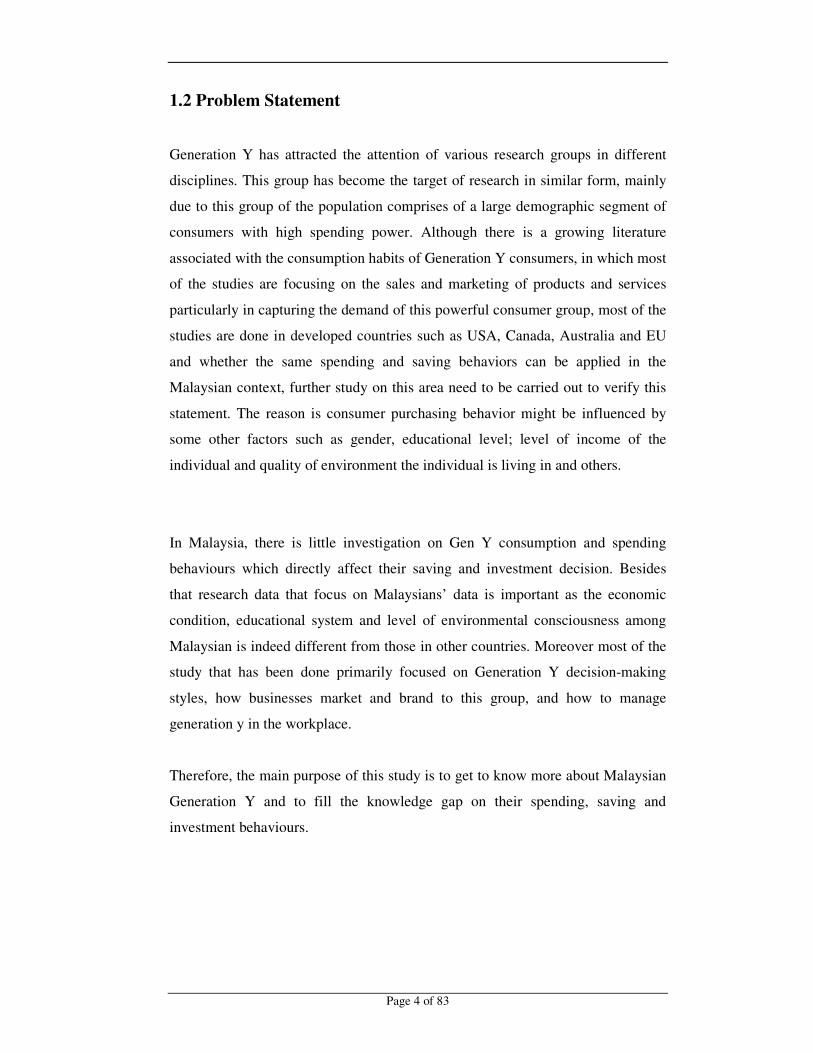
1.2 Problem Statement
Generation Y has attracted the attention of various research groups in different
disciplines. This group has become the target of research in similar form, mainly
due to this group of the population comprises of a large demographic segment of
consumers with high spending power. Although there is a growing literature
associated with the consumption habits of Generation Y consumers, in which most
of the studies are focusing on the sales and marketing of products and services
particularly in capturing the demand of this powerful consumer group, most of the
studies are done in developed countries such as USA, Canada, Australia and EU
and whether the same spending and saving behaviors can be applied in the
Malaysian context, further study on this area need to be carried out to verify this
statement. The reason is consumer purchasing behavior might be influenced by
some other factors such as gender, educational level; level of income of the
individual and quality of environment the individual is living in and others.
In Malaysia, there is little investigation on Gen Y consumption and spending
behaviours which directly affect their saving and investment decision. Besides
that research data that focus on Malaysians’ data is important as the economic
condition, educational system and level of environmental consciousness among
Malaysian is indeed different from those in other countries. Moreover most of the
study that has been done primarily focused on Generation Y decision-making
styles, how businesses market and brand to this group, and how to manage
generation y in the workplace.
Therefore, the main purpose of this study is to get to know more about Malaysian
Generation Y and to fill the knowledge gap on their spending, saving and
investment behaviours.
�
�
Page 5 of 83�
1.3 Research Questions
In order to attain the above-mentioned purposes of this study, the following
research questions will be answer:
Question 1: What are the preferred channels of communication of
Malaysian Generation Y? Do they prefer to obtain information
on saving and investment through Bank or through online
resources?
Question 2: Are Malaysian Generation Y saving habits is influence by
information that they received from the media?
Question 3: Do female Malaysian Generation Y spend more than male
generation Y?
Question 4: Do Malaysian Generation Y usually spent out of their budget?
Question 5: What is the average saving and spending rate of Malaysian
Generation Y? Does Malaysian Generation Y save less than
the national saving rate?
Question 6: What are the preferred methods of saving by Malaysian
Generation? Y
Question 7: Have Malaysian Generation Y started saving for their
retirement?
Question 8: What are the preferred methods of investment of Malaysian
Generation Y?
Question 9: Do Malaysian Generation Y have a diversify investment
portfolio?
Question 10: Do Malaysian Generation Y invest their money in risky
market?

�
�
Page 6 of 83�
1.4 Research Objectives
1.41 General Objective
The objective for this research is to explore the demographic of Malaysia’s
Generation Y, specifically in investigating their consumption and spending
behaviour as well on their saving and investment habits.
1.4.2 Specific Objective
This study attempts to accomplish six main objectives as follows:
1. To determine the consumption and spending patterns of Generation Y.
2. To determine the level of saving and the forms of saving performed by
Generation Y.
3. To study the method of investments (if any, such as equities, real estate,
unit trusts and others) practiced by Generation Y.
4. To assess the awareness of risk management in investment of Generation
Y.
5. To determine the effective channels of communication with Generation Y.
6. To make recommendation for appropriate selling/marketing channel of
investment linked products target Generation Y, based on the preferred
channel selected from the survey.

�
�
Page 7 of 83�
1. 5 Limitation of Study
This study focuses on Malaysian Generation Y age 19 -32 years old and which are
currently working and just entered the workforce. The data collected are
dependent on the sincerity of their spending, saving and investment habit of the
participation of respondents. Thus getting their assistance to respond to the
questionnaires sincerity is one of the obstacles.
Another limitation of this study is geographically this study is concentrated to
Malaysian Gen Y in major city, beside that data was only able to be collected on
Generation Y respondent in peninsular Malaysia due to time constrain. Another
limitation of this study is there little research done by others on the saving
spending and investment habit of Malaysian Generation Y therefore it was litter
resources to compare with.
1. 6 Significance of the Study
This study will be beneficial to businesses in terms that Generation Y will be a
lucrative and profitable target segment for Malaysian marketers as they have an
enormous drive to spend and have the financial ability to satisfy their wants and
desires. The analysis results shall be of great interests of policy makers such as
government and businesses in providing appropriate products and services in line
with their consumption, spending, and investment behaviours.
Specifically, it is hoped that the present study contributes to the following areas:
1. To provide insight on the spending, saving and investments patterns in
reaching and matching the conception and investment need of
Malaysian Generation Y
2. To assist businesses to better understanding the effective channels to
communicate with generation Y.

�
�
Page 8 of 83�
3. To assist better understanding of saving, investments and risk profile
of Generation Y to as to cultivate saving and investing culture as well
as to increase financial literacy of the nation.
1. 7 Organisation of Study
This research project has been organised into five chapters.
Chapter 1 - Introduction: The first chapter is the overview and introductory of
the research study. Here the research problem, research questions and objective of
the research are reported. The limitation and signification of this research study
are also reported in this chapter.
Chapter 2 - Literature Review: The second chapter is literature review it will
report on the pass reviews and previous studies regarding this topic. The
hypotheses will also be reported.
Chapter 3 - Research Methodology: The third chapter explains on the
methodology and tools of analysis used for this study, where it will discuss on the
targeted population, sample and sampling approach, survey instrument and pilot
test and data collection methods.
Chapter 4 - Research Findings: The chapter will report on data that have been
collected from your survey. From the data analysis the research result will be
reported in this chapter.
Chapter 5 - Discussion and conclusion: This chapter the will discuss on the
research results, where recommendations, implication weaknesses of the research
study will be identify. The conclusion for this study will be summarised based on
the result from this study.
.
�
�
Page 9 of 83�
CHAPTER 2
LITERATURE REVIEW 2.1 Introduction
This chapter provides a review of literature on Generation Y characteristic, it’s
spending and saving behaviour, investment habits and channels of
communication. This chapter will also present the project hypotheses.
2.2 Generation Y
2.2.1 Who is Generation Y?
Generation Y has been referred as “Millennial”, “Internet (or dot.com)
Generation”, “Nexters” and “Echo Boomers.” In the Advertising Age a marketing
magazine (as sited in Constantine, 2010) it had coined the term “Generation Y” in
the early 1990s, as a way to differentiate the group from Generation X. As for the
classification on who makes up as Generation Y it varies from different study.
Martin and Turley (2004) define Generation Y as individuals born between 1980
and 1994, with the older segment of this group born between the years of 1980
and1986. Whereas Bloch, Ridgway and Dawson’s (as cited by Hughes & Black)
define the term Generation Y as the unit of Americans born roughly between 1980
and 1995.
�
�
Page 10 of 83�
However the definition used by Javelin Strategy & Research (2011) is by
overlapping 20 years periods that is baby boomers (1945-1965), Gen X (1961-
1981) and Gen Y (1979-1999). This explanation put Generation Y between the
age of 12 and 32 in the year 2011.
In Malaysia, people in the age group between 15 and 29 years old has grown from
5.6 million in 1999 to 6.9 million in 2009, it is also equivalent to 26.9% of
Malaysia’s population (US Census Bureau, 2009). In PricewaterhouseCoopers
(2010) report, this group makes up approximately 62% of the Malaysia workforce
in 2009. By understanding Malaysian Generation Y habit, we can see a rough
pictures of theirs saving, spending as they will have more income joining the
workforce.
2.2.2 Characteristics for Generation Y
This generation of this group grew up in an environment of fast paced change.
There were full employment, dual income household with increasing employment
for women and increasing awareness and respect for cultural diversity. They were
also born into an era of electronic, technological and wireless society where global
boundaries have been blurred (Williams and Page, 2010) According to Martin
(2005), the Generation Y cohort is technology savvy, independent, self-reliant and
entrepreneurial thinkers. Generation Y has also been described as well-educated,
confident, passionate, upbeat, and socially conscious with high integrity (Geyzel,
2009).
Halstead (2006) in her research has identified three characteristics unique to this
and with these three characteristics it may be the factor that influence of
Generation Y saving consumption patterns. The characteristics are:
(1) Greater racial and ethnic diversity;
(2) more personal independence than prior generations due to the Internet and the
rise in divorce; and
(3) greater optimism than Generation X about money and job security
.

�
�
Page 11 of 83�
Meanwhile a study by Syrett and Lammiman (as sited by Toh, Lim & Cheng,
2011) has defined five different characteristics of Generation Y.
Following are the five characteristics:
(1) Intimacy – the ability to establish and sustain close relationships over the
internet.
(2) Loyalty – to their own closely-guarded personal networks and, less
consistently or reliably, to brands and employers.
(3) Awareness – of social issues inside and outside work, of the need for
transparency and honesty and awareness of hypocrisy in brand management or
human resource strategies.
(4) Balance – in the interface between work and personal life, millenials are also
willing to embrace in a 24/7lifestyles; and
(5) Risk – in their openness to frequent change and their willingness to be open,
that is to be flexible and mobile.
In Harris Interactive Group’s research (as cited in Featherstone, 2007) found that
Generation Y consumer are more optimistic economical than previous generation
as they have grown up in prosperous time, they are not easily swayed by
advertisements and creative marketing schemes, they are comfortable receiving
fragmented media messages from multiple avenue and lastly this group is
sophisticated with high brand awareness.
2.3 Consumption and Spending of Generation Y
In a study conducted by Visa USA Inc., (2007) it stated that by 2015 the Gen Y
will account for approximately USD2.45 trillion in annual spending. Moreover
Generation Y consumers are very likely to spend their cash as quickly as they
acquire it, usually on consumer goods and personal services (Der Hovanesian,
1999).
As consumers, Generation Y are independent, non-traditional and sophisticated,
brand and fashion conscious, but not necessarily brand loyal (Daniels, 2007).

�
�
Page 12 of 83�
These consumers also have a wide-reaching social network that influences their
buying decisions. Such vast networks are basically changing the way in which
Generation Y shop. Waters’s study (as cited in�Daniels, 2007) stated that word-of-
mouth influence no longer comes at a party or family gathering, but from an
extensive band of members of their online network.
In a research done by Kovach (cited by Williams and Page, 2011) reports that
Generation Y spends about $200 billion per year of their own and their parents’
money and influence $300 billion to $400 billion in expenditures, which is about
21 % of total US annual spending.
Martin & Turley 2004 has reported that Generation Y consumers attending
college have purchasing power of $105 billion, and earn nearly $6,000 annually.
In the United States alone, over 15 million older Generation Y students are
currently attending college, with 8 million of these students being classified as
full-time. Additionally, the average college student spends nearly $300 per month
on personal or discretionary items, with the greatest amount of this spending being
used for food, personal care, and music purchases.
In the study done by Alch (2000) he had pointed out that Generation Y consumers
spend most of their discretionary income on three product categories: (1) apparel
34% (2) entertainment 22%; and (3) food 16%. Apparel plays an important role in
how these individuals spend their money, in part because hanging out at the mall
is an important part of socializing with friends for this generation. In Alch (2000)
study as well also identified several consumption characteristics for this
generation. Generation Y are: (1) Internet-connected in order to seek information
about products; (2) savvy about media and advertisements; (3) willing to incur
debt to make purchases; (4) brand conscious; and (5) materialistic. However a
study conducted by Milner (as cited by Halstead & Marie, 2006) indicate that
some of these characteristics have been further researched such as the importance
of the Internet and credit card usage, but the results lack depth and detail

�
�
Page 13 of 83�
Little research can be found in the academic literature about Malaysian
Generation Y consumer behaviour. Hence, Generation Y will be a lucrative and
profitable target segment for Malaysian marketers as they have an enormous drive
to spend and have the financial ability to satisfy their wants and desires.
2.4 Saving and Investment Behaviour
2.4.1 Saving behaviours and motivation to save
According to social learning theory, spending behaviour can be seen as learned
behaviour often transmitted by parents and other influential individuals. It is,
therefore, mainly passed from generation to generation Carrier and Maurice,
(1998). Lunt and Livingstone (as cited in Booth, Grimmond and Stroombergen,
2000) indicated that saving has important cultural meanings, so that understanding
socio-economic practices, moral judgements and the everyday understandings and
attributions of the people involved is essential in understanding how people
calculate benefits from consumption or saving decisions.
According to Booth, Grimmond and Stroombergen (2000) saving behaviour are
origin as follows
(1) The influence of childhood learning: skills learned or not learned in childhood
can affect people’s saving behaviour when they get older. Psychologists have
found that it is hard to change behaviour that has been learned in childhood.
(2) Self-control: some researchers claim that certain people fundamentally lack
self-control and so cannot use savings or credit facilities responsibly. Instead, they
spend whatever funds are available.
A survey conducted by REST Industry Super (2011) on Australian youth sawing,
their results shows that Generation Y develop a good saving habit but these saving
tend to be focused on short-terms goals. Meanwhile the Cisco Survey conducted
on 1,055 US consumer interaction preference (as sited by Philip, Macaulay &
Ericssion 2010) to commit (money or capital) in order to gain a financial return
Generation X and, to a smaller degree, Generation Y are also more concerned than
�
�
Page 14 of 83�
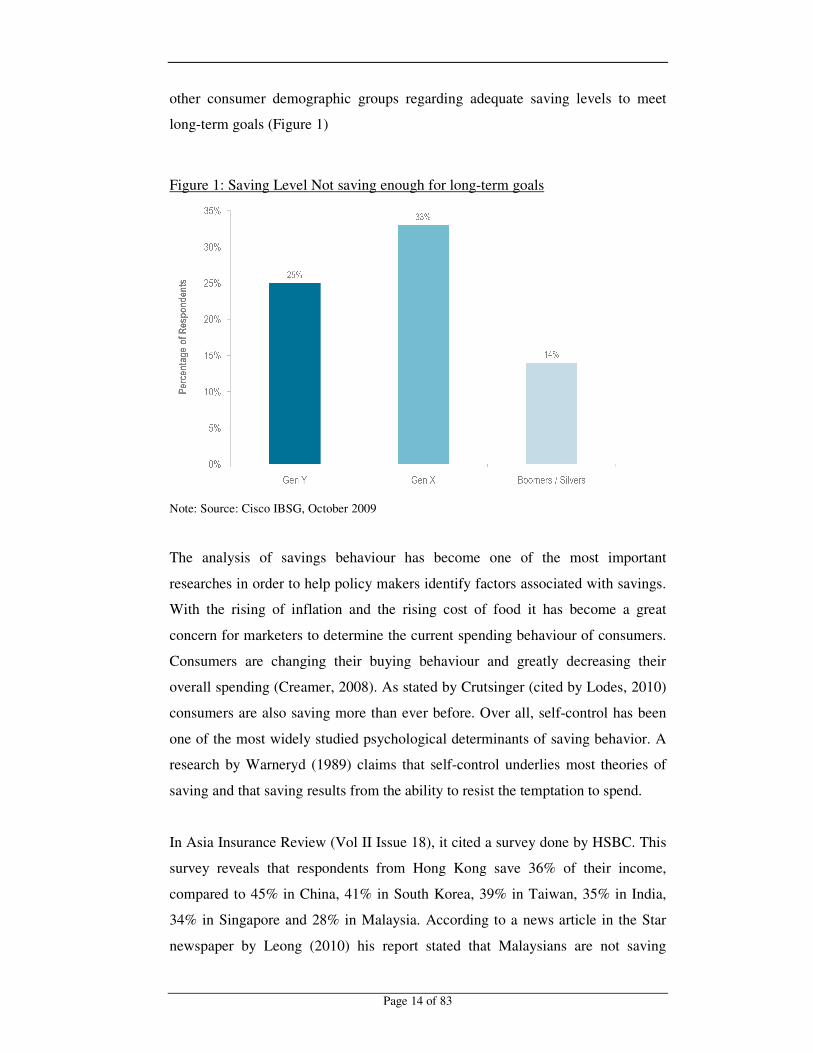
other consumer demographic groups regarding adequate saving levels to meet
long-term goals (Figure 1)
Figure 1: Saving Level Not saving enough for long-term goals
Note: Source: Cisco IBSG, October 2009
The analysis of savings behaviour has become one of the most important
researches in order to help policy makers identify factors associated with savings.
With the rising of inflation and the rising cost of food it has become a great
concern for marketers to determine the current spending behaviour of consumers.
Consumers are changing their buying behaviour and greatly decreasing their
overall spending (Creamer, 2008). As stated by Crutsinger (cited by Lodes, 2010)
consumers are also saving more than ever before. Over all, self-control has been
one of the most widely studied psychological determinants of saving behavior. A
research by Warneryd (1989) claims that self-control underlies most theories of
saving and that saving results from the ability to resist the temptation to spend.
In Asia Insurance Review (Vol II Issue 18), it cited a survey done by HSBC. This
survey reveals that respondents from Hong Kong save 36% of their income,
compared to 45% in China, 41% in South Korea, 39% in Taiwan, 35% in India,
34% in Singapore and 28% in Malaysia. According to a news article in the Star
newspaper by Leong (2010) his report stated that Malaysians are not saving

�
�
Page 15 of 83�
enough and they are not prepared to face a financial meltdown should they lose
their job or be retrenched. In this reports only two in five (39%) Malaysians
actually save and less than one-in-three (28%) make and stick to a monthly
budget. While a majority of Malaysians saved up to 20% of their monthly income
excluding the 11% in the Employees’ Provident Fund and 12% said they do not
save anything at all. In Leong’s report as well he has indicated that, one-in-five
indicated their savings would last for only four weeks, and on average Malaysians
reported having 11 weeks of savings in reserve.
There is not much research done on the saving patterns and habits of Malaysian
Generation Y. In this research study we will examine whether Malaysian
Generation Y saving is similar to the national saving rate. This research project
will study also study whether there is any difference on saving habits for Malaysia
Generation Y compare to the above review of saving habit by Generation Y.
2.4.2 Investment Behaviour
The definition of Investment as coined by Investopedia dictionary is an asset or
item that is purchased with the hope that it will generate income or appreciate in
the future. In terms of an economic sense it’s stated that an investment is the
purchase of goods that are not consumed today but are used in the future to create
wealth. Meanwhile in finance terms it stated that an investment is a monetary
asset purchased with the idea that the asset will provide income in the future or
appreciate and be sold at a higher price. (Investopedia).
Investment differs from savings in a way that in savings, you will generally get
back your savings, plus some interest. However, in an investment, you may or
may not get back the sum invested or you may get much more than the initial
amount invested. The potentially higher return is to compensate you for the higher
risks undertaken by you.
�
�
Page 16 of 83�
In the MFS Investment Management reports, 2011 which they have conducted a
survey which focused on USA’s Generation Y investors (age 18-30). Their
finding found that younger investors are anxious about their investments, and as a
result they are investing conservatively.
Their report also identified that:
(1) 40 % of Gen Y agreed with the statement "I will never feel comfortable
investing in the stock market.”
(2) Gen Y investors agreed that they are likely to feel overwhelmed by all the
choices they have (54 %), put off investment decisions (47 %), and
consider themselves to be savers more than investors (59 %).
(3) 30 % of Gen Y said that their primary investment objective was protecting
principal/not losing money, only marginally smaller than those who said
their primary goal was growing assets (34 %).
(4) Gen Y has allocated more money to cash than other age groups, at 30 % on
average nearly as much as they have allocated to U.S. stocks/stock funds
(33 %).
In an online article which study US Generation Y (Generation Y-ers: Fearful of
Wall Street and Not Saving for Retirement) it report that a majority of Generation
Y may not have enough of a financial education or the motivation and confidence
to understand how to invest for their own retirement. The report further stated that
this generation has spent half of their lives in between the dot com crash and real
estate crash and are very wary of Wall Street. The report has gone on to state that
US generation Y have lack financial literacy or do not know the direction needed
to survive through today’s volatile market and unique economic environment.
In Forbes reports (as sited by Risi in her article Gen Y: plenty of time to invest,
but little appetite for risk), it stated that 40% of Generation Y investors agree with
the statement “I will never feel comfortable investing in the stock market.” The
report also states that the average Generation Y investor holds 30% of their assets
in cash, while their position on the equity markets may eventually soften and this

�
�
Page 17 of 83�
show a strong indication of the understandable risk aversion that now plagues
many Generation Y investors.
These data are also partially reflected in a 2010 ICI survey of investor risk
tolerance Younger Generation Y investors were less likely to take “above average
risk” and more likely to take “average” risk than Generation X investors.
A research conducted by Helman and Sutton (as reported by Wang, 2011) reveals
that fewer people have been investing in wealth management and an increased
percentage of people have virtually no investments and saving for retirement. It
further stated that people may attribute the decline in their wealth to job losses,
housing bubble burst, and stock market meltdown, but this research suggests that
the economy may not be entirely to blame.
The earlier an individual start to invest their money, the easier it is to reach their
financial goals. An individual who starts investing when young is more likely to
develop investing habits and is more likely to invest consistently (Hilgert,
Hogarth, 2003)
Therefore in this project we will find out whether Malaysian Generation Y has
started investing, and whether there have a diversify portfolio and also to identify
Malaysian Generation Y risk appetite.
2. 5 Communication Channels
In a research conducted by Junco and Mastrodicasa as cited in (Wierzycka, 2009)
among 7500 Generation Y revealed that a typical profile of this group comprises
of the fact that 40% obtain their information via television, 94% do own a cell
phone and they use text messaging; 28% have a blog and 44% of them read other
people blocks; 34% obtain instant information via websites, 49% download music
using peer to peer file sharing and 16% download software.

�
�
Page 18 of 83�
From the Cisco Survey conducted on 1,055 US consumer interaction preference
(as sited by Philip, Macaulay & Ericssion 2010) , its shows that all three
generation, Baby Boomer, Generation X and Generation Y selected professional
financial advisors as their preferred source of assistance for financial decisions.
Both Generation Y and Generation X also show budding interest in using social
networking, online communities of interest and sharing of experiences and
information with other customers (see Figure 2).
Figure 2: Preferred Methods of Receiving Financial Advice
Note: Source: Cisco IBSG, October 2009
According to the Cisco Survey as well (as cited by Philip, Macaulay & Ericssion
2010) consumer generations differ in where they turn for financial information
(refer Figure 3). US Generation Y is more likely to depend upon a bank rather
than an independent advisor, broker, or other source. This underscores the
potential for banks to deepen their relationships and provide targeted advice to
Generation Y consumers. It is also know that Generation Y makes significantly
more frequent use of both family and friend networks for financial advice and
consults social networking and other online sites more often than older consumers,
this underlining the potential of peer supported online communities.

�
�
Page 19 of 83�
Figure 3: Where Consumers turn for Financial Information
Note: Source: Cisco IBSG, October 2009
Garman & Forgue state (as cited by Delafrooz & Laily, 2011) that financial
literacy is main cause of personal financial problems. Financial literacy is defined
as sufficient knowledge of personal finance facts and terms for successful
personal financial management. Lack of information and low financial literacy
will lead for financial mistakes. With low financial literacy and lack of
information affect the ability to save and to secure a comfortable retirement,
however with financial literacy it will boost the ability of one’s day to day
financial problem and will reduce the negative consequences of poor financial
decisions that might take years to overcome (Delafrooz & Laily, 2011).
This study will also examine to see whether there is similarity to Malaysian
Generation Y in how they seek for financial advice, and what their preferred
communication channels with banks are. We will also see whether Malaysian
Generation Y have adequate financial literacy.
�
�
Page 20 of 83�
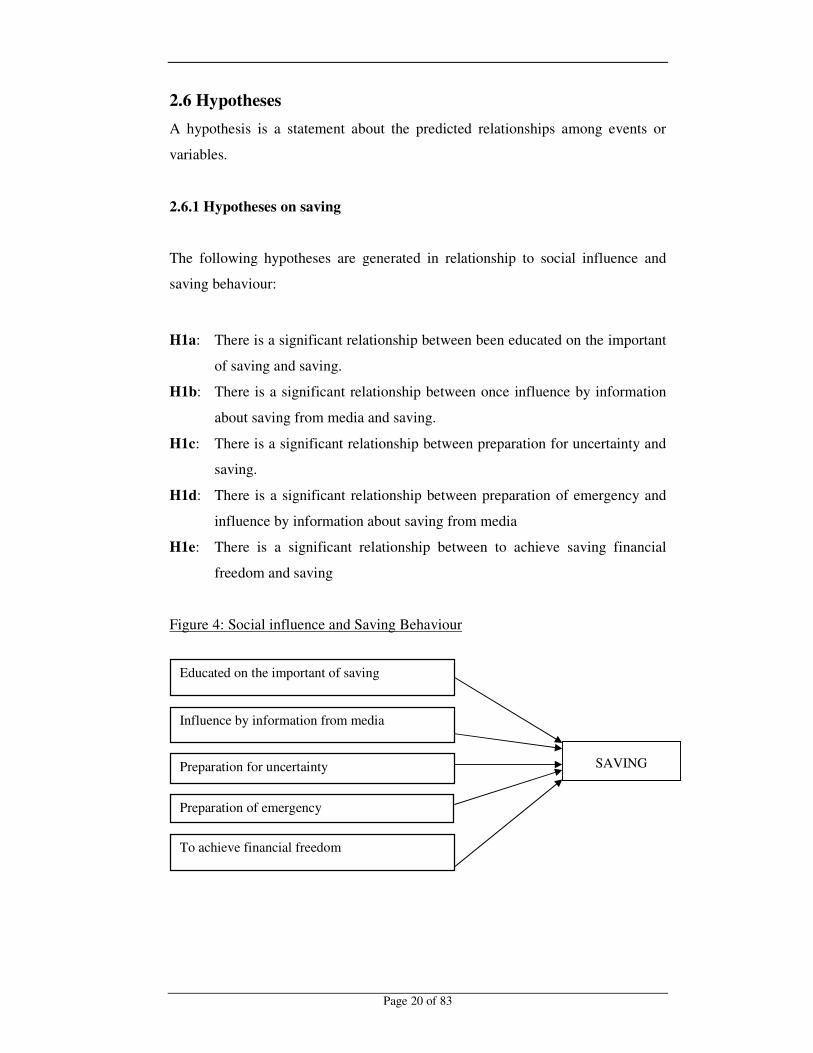
2.6 Hypotheses A hypothesis is a statement about the predicted relationships among events or
variables.
2.6.1 Hypotheses on saving
The following hypotheses are generated in relationship to social influence and
saving behaviour:
H1a: There is a significant relationship between been educated on the important
of saving and saving.
H1b: There is a significant relationship between once influence by information
about saving from media and saving.
H1c: There is a significant relationship between preparation for uncertainty and
saving.
H1d: There is a significant relationship between preparation of emergency and
influence by information about saving from media
H1e: There is a significant relationship between to achieve saving financial
freedom and saving
Figure 4: Social influence and Saving Behaviour
To achieve financial freedom
Preparation of emergency
Preparation for uncertainty
Influence by information from media
Educated on the important of saving
SAVING

�
�
Page 21 of 83�
2.6.2 Hypotheses on Spending
The following hypotheses are generated in relationship to self-control and
spending behaviour:
H2a: There is a significant relationship between been budgeting and
spending.
H2b: There is a significant relationship between and distraction and
spending.
H2c: There is a significant relationship between economic cost
assessment and spending.
H2d: There is a significant relationship between time binding and
spending
H2e: There is a significant relationship between pre-commitment and
spending.
Figure 5: Self-control and Spending Behaviour
Pre-commitment
Time binding
Economic cost assessment
Distraction
Budgeting
SPENDING

�
�
Page 22 of 83�
2.6 3 Hypotheses on Investing in high risk financial Products
2.6.3.1 Relationship between Gender and preferences in investing in high risk
financial Products
H3A0: Gender and preferences of investing in Futures Markets are
independent.
H3A1: Gender and preferences of investing in Futures Markets are
dependent
H3B0: Gender and preferences of investing in Forex Markets are
independent.
H3B1: Gender and preferences of investing in Forex Markets are
dependent
H3C0: Gender and preferences of investing in Commodity Markets are
independent.
H3C1: Gender and preferences of investing in Commodity Markets are
dependent

�
�
Page 23 of 83�
2.6.3.2 Relationship between Race and preferences in investing in high risk
financial Products
H4A0: Race and preferences of investing in Futures Markets are
independent.
H4A1: Race and preferences of investing in Futures Markets are
dependent
H4B0: Race and preferences of investing in Forex Markets are
independent.
H4B1: Race and preferences of investing in Forex Markets are dependent
H4C0: Race and preferences of investing in Commodity Markets are
independent.
H4C1: Race and preferences of investing in Commodity Markets
are dependent
2.6.3.3 Relationship between Marital Status and preferences in investing in
high risk financial Products
H5A0: Marital Status and preferences of investing in Futures Markets are
independent.
H5A1: Marital Status and preferences of investing in Futures Markets are
dependent.
H5B0: Marital Status and preferences of investing in Forex Markets are
independent.
H5B1: Marital Status and preferences of investing in Forex Markets are
dependent.
H5C0: Marital Status and preferences of investing in Commodity Markets
are independent.
H5C1: Marital Status and preferences of investing in Commodity Markets
are dependent.

�
�
Page 24 of 83�
2.6.3.4 Relationship between Marital Status and preferences in investing in
high risk financial Products
H6A0: Income and preferences of investing in Futures Markets are
independent.
H6A1: Income and preferences of investing in Futures Markets are
dependent.
H6B0: Income and preferences of investing in Forex Markets are
independent.
H6B1: Income and preferences of investing in Forex Markets are
dependent.
H6C0: Income and preferences of investing in Commodity Markets are
independent.
H6C1: Income and preferences of investing in Commodity Markets are
dependent.
2.6.4 Hypotheses on Investing in high risk financial Products
H70: Gender and risk appetite of Generation Y are Independent.
H71: Gender and risk appetite of Generation Y are dependent.
H80: Marital status and risk appetite of Generation Y is Independent.
H81: Marital status and risk appetite of Generation Y is dependent.
H90: Income and risk appetite of Generation Y are Independent.
H91: Income and risk appetite of Generation Y are dependent.
H100: Race and risk appetite of Generation Y are Independent.
H101: Race and risk appetite of Generation Y are dependent.
�
�
�
�
�
Page 25 of 83�
�
�
CHAPTER 3
RESEARCH METHODOLOGY
3.1 Introduction This chapter will be on the methodology that has been used in this research study.
It will discuss the research methods that will be adopted to meet the objective of
this research. This chapter will cover the population and sample used
questionnaire design, pilot test, reliability and descriptive analysis and data
analysis procedure.
3.2 Population/ Research Sample
3.2.1 Primary Data Collection
One of the most import parts of the survey process is to determine the sample.
There are various methods of selecting the sample and they are categorized as
probability and non-probability (Sekaran, 2003) for this research study the
targeted population will be working Malaysian Generation Y age between 19- 32
years old.
Convenience Random sampling was used in this study. Convenience random
sampling is one of the main types of non-probability sampling methods. A
convenience random sample is made up of people who are easy to reach.
According to Changing Minds (2009), convenience random sampling generally
assumes a homogeneous population that one person is pretty much like another.
�
�
Page 26 of 83�
A convenience sample that was chosen at the convenience of the study was
randomly selecting respondents that are currently working in the city for each
state in peninsular Malaysia that fit in the Generation Y group. The questionnaire
was distributed in printed copy and through and online survey as well. Details will
be explained under questionnaire distribution section.
3.2.2 Secondary Data Collection
Data for literature review and problem statement were mostly gathered from
secondary data. It comprised journals, an online business magazine, online
newspapers and archive materials Data from the Department of Statistic and the
Economic Planning unit that is the 2010 population census where used to
determine how many respondent that is need to answer the questionnaire in order
to get results that reflect the target population as precisely as needed.
As there are approximately 6.2 million of the total Malaysian population under the
Generation Y group, around 500-600 set of questionnaires will be distributed to
reflect the target population.
3.3 Questionnaire Design
The reason for using a questionnaire is that the opinions of the respondent can be
in a structural manner. As there was no specific questionnaire available for this
study or previously done by other researchers, a questionnaire had to be designed
that could be used for the purpose of the study. The questions was formulated and
selected carefully following the objectives of the study.
According to Sekaran (2003) a questionnaire is a written set of questions to which
respondents record their answer. For this research study a set of questionnaire has
been designed according to the need of this study. The entire questionnaire was
closed ended question where the respondents have to select for a pre-assigned
answer, except for the section where they need to state their percentage of
monthly income save and spent. The questionnaire was designed using English
language and a translational into Bahasa Malaysia was included as well.

�
�
Page 27 of 83�
The questionnaire was divided into five (5) sections. The first section concerned
the characteristics of the respondents where the demographic profile such as age,
gender, race, marital status, current working passion, annual Income are capture.
The second sections of the questionnaire are on the information sources / method
of communication channel preferred. Here we would as what preferred
information sources are in obtain information on saving and investment.
Then third section is on the saving and spending patterns, monthly income spent
and save will be asked, beside that purposed of saving and method of saving as
well as if they have ever spent out of budget and do they allocated money for
emergency will be asked. As for the question on motivation to save and steps to
ensure saving is done this question was done using a 5 point Likert-type scales (1
=Strongly disagree to 5=Strongly agreed).
A Likert scale is a psychometric scale commonly used in questionnaires, and is
the most widely used scale in survey research (Wikipedia, 2011). Respondents
specify their level of agreement to a statement when responding to a Likert
questionnaire item. Likert scale is a direct measure of attitudes developed by
Rensis Likert (Keegan, 2009)
Section four is on Investment Techniques. This portion asked the respondents to
which, if any investment techniques/methods they had done before. The last
section of the questionnaire will be on the risk profile, where the respondents are
ask on their risk appetite in investing and have they every invested in risky
market. The full questionnaire set is attached in Appendix A.
3.4 Questionnaire Distribution
Two methods of distribution were used for the questionnaire, which is by
personally administer questioner and electronic questionnaire that is through an
online survey. For purposes of our survey, we have eliminated Generation Y
which is 18-year-olds or who is still in high school or college/university.
�
�
Page 28 of 83�
The main disadvantage of using questionnaires is that the targeted group will not
return the questionnaires, to eliminate this problem the questionnaires were
distributed and the researcher and assistants where present all the time to answer
and query arise from the respondent related to the questionnaires as well to
personally collected back the questionnaires at the same time, the respondents
were given a token for the complete questionnaires.
As for the online questioners the link to the questionnaires was sent via email and
through Facebook of the researchers’ network list. The advantages of this method
of collection include speed and cost-effectiveness, visual appeal, interactivity and
respondent participation (Zikmund & Babin, 2007). A total of 592 set of
questionnaire has been collected both paper questionnaires and online
questionnaires
3.5 Pilot Test
A pilot test was conducted to ensure the validity and reliability of the
questionnaire. According to Sekaran (2001) a good measurement tool should not
only be easy and efficient to used, but more importantly it should be accurate
indicator of what was purported to measure. A questionnaire is considering
reliable of its repeated applications results in consistent score. Therefore in order
to determine the reliability of the questionnaire of this study and in order to
achieved the study objectives, the questionnaire was distributed randomly to the
targeted population and a total of 20 respondent sample was obtain. Upon the
completion of the pilot test errors found it the questionnaires were identified and
rectified. The questioner was improved before the actual survey was carried out.
3.5.1 Reliability Analysis
Reliability analysis is used to identify the variable which is reliable to make
correlation analysis. In order to interpreter the Cronbach’s alpha correctly,
researcher has referred to Nunnally rule of thumb. According to Nunnally (1997),
result gain must be greater than 0.6 is acceptable, while results gain at 0.7 and

�
�
Page 29 of 83�
above are assumed satisfactory or good. Cronbach's alpha can be written as a
function of the number of test items and the average inter-correlation among the
items. Below, for conceptual purposes, we show the formula for the standardized
Cronbach's alpha:
N•� �=� ----------------------
V + (N -1) ·�
Here N is equal to the number of items, c-bar is the average inter-item covariance
among the items and v-bar equals the average variance.
In the pilot test, reliability testing was carried out using Cronbach’s Alpha. Table
2 shows the Cronbach’s Alpha value for the variables tested . Its is found that
,0.846 Which can be consider acceptable
Table 2: Reliability Statistics
Reliability Statistics
Cronbach's Alpha
Cronbach's Alpha Based on Standardized Items N of Items
0.846 0.865 11
3.6 Descriptive Analysis
Frequency distribution is one of the most common ways to summarise a set of
data (Zikmund and Babin, 2007). A Frequency distribution analysis is a
mathematical distribution where the objective is to obtain a count of the number
of responded associated with different values of one variable to expresses these
counts in percentage terms (Malhotra, 2007).
The major purposed of using descriptive research is to describe characteristics of
objects, people, groups, organisations or environments. (Zikmund and Babin,
2007) Data collected through descriptive research can provide valuable insights
about the study units along relevant characteristics. In this research study
�
�
Page 30 of 83�
distribution were obtain for all the personal data which included demographic
profile such as gender, age, race, marital status, highest education obtain and
income.
3.7 Inferential Analysis
Inferential Analysis defined by the businessdictinory.com as a mathematical
methods that employ probability theory for deducing (inferring) the properties of a
population from the analysis of the properties of a data sample drawn from it. It is
concerned also with the precision and reliability of the inferences it helps to draw. Therefore descriptive statistics are used to reveal patterns through the analysis of
numeric data. Inferential statistics are used to draw conclusions and make
predictions based on the analysis of numeric data.
For this study we will be using inferential analysis to make judgments of the
targeted group and to observed and compare variable as well to test its significant
relationship to draw generalisation. With this these tests of significance it will tell
us the probability that the results of the analysis could have occurred by chance
when there is no relationship at all between the variables we studied in the
targeted population. A Chi-square, one sample t-test and multiple regression will
be used in this study.
�
3.7. 1 Cross-tabulation and Chi-squre
A Cross-tabulation analysis was also done with the purposed of comparing two or
more variable. The Pearson chi-square test is used to test whether a statistically
significant relationship exists between two categorical variables for this research it
will be gender, marital status, and race and income level. The chi-square goodness
of fit test uses frequency data from the sample to test the hypotheses (Carver &
Nash, 2009). Therefor the result derived from the chi-square analysis will proved
an appropriate basis either to reject the null hypothesis and acceptance of the
alternative hypothesis or to retain the null hypothesis and reject the alternative
hypothesis.

�
�
Page 31 of 83�
3.7.2 Multiple Regressions
Multiple Regressions is a statistical technique used to evaluate and establish a
quantitative relationships between multiple dependent and independent variables.
The term Multiple Regressions was first used by Pearson in 1908. For this
research there will be to multiple regression analysis done, first on saving and next
on spending.
The multiple regression equation to if formed saving in this research is:
E (YSV) = �+ �1x1 +�2x2���3x3 +�4x4 +�5x5
YSV = Saving
X1 = Educated on the important of saving
X2 = Influence by information from media
X3 = Preparation for uncertainty
X4 = Preparation of emergency
X5 = Achieve financial freedom
The multiple regression equation to if formed saving in this research is:
E (YSP) = �+ �1x1 +�2x2 +�3x3 +�4x4 +�5x5
YSP = Spending
X1 = Budgeting
X2 = Distraction
X3 = Economic cost assessment
X4 = Time binding
X5 = Pre-commitment

�
�
Page 32 of 83�
3.8 Data Analysis Procedure
The data obtain form the questionnaire has undergone preliminary preparation
before being analysed using statistical technique. There are many soft wares in the
market for analysing social science study. In this study, Statistical Package for the
Social Science (SPSS 17.0) software was used. SPSS is a good statistical package
for people wanting to perform quantitative research in social science because it is
easy to use and because it can be a good starting point to learn more advanced
statistical packages (Harvard-MIT Data Center, 2009).
Before analysing the data, there are several steps that are followed in analysing the
data that was gathered. The process involves the transformation of all raw data
into statically analysis and coverts into a form that is easy to understand and
suitable for analysis, next is checking the completeness of the questionnaire, and
the last step is the coding of all questionnaire to easily classified variables. The
data collected from the questionnaires were initially entered into a Microsoft
Excel spreadsheet to allow for easy classified of the variables as well inspection
of any missing data. After the data cleaning process the data was import to SPSS
software to run the analysis

�
�
Page 33 of 83�
CHAPTER 4
RESEARCH RESULT
4.1 Introduction
This chapter presents the results of the data analysis and reveals the finding of the
study. The discussion will be structured around the objectives and hypotheses as
detailed in Chapter one and two. Data were analysed by using descriptive statistics
and inferential analysis.
4.2 Descriptive Statistics
4.2.1 Demographic Profile
A total of 592 sets of questionnaire has been collected both manually and online
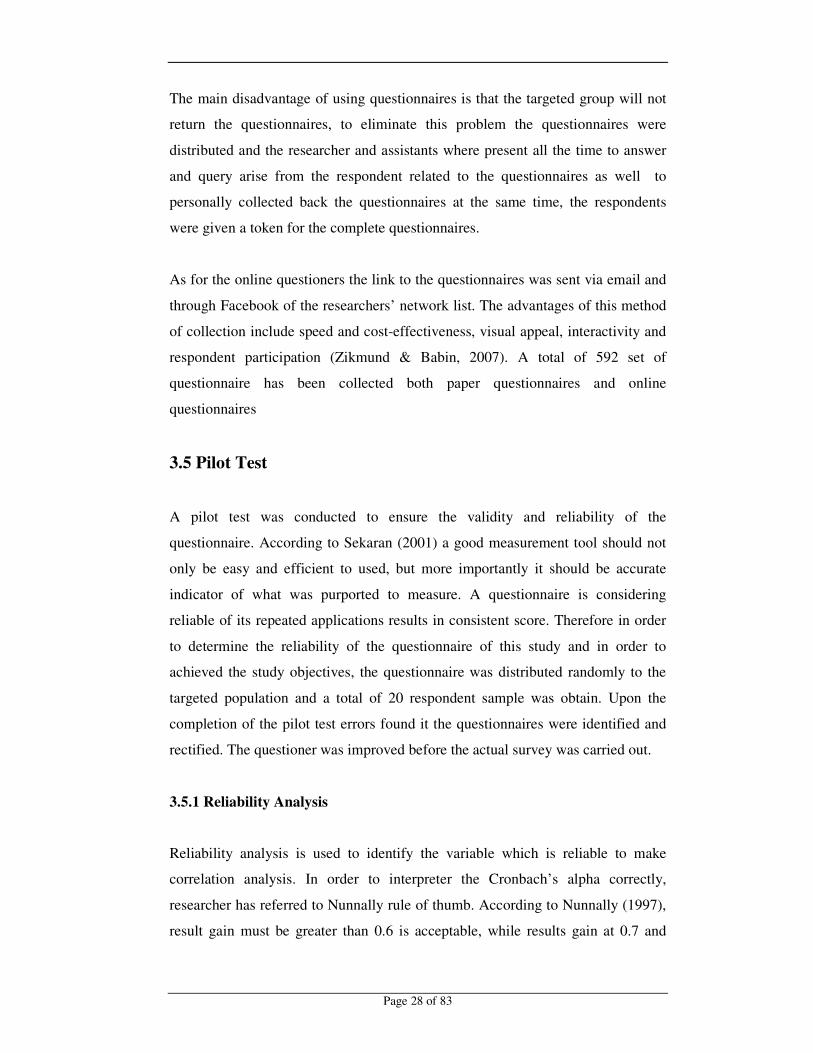
survey form responded from capital city Malaysia. Figure 6 below shows the state
the respondents are currently working. The figure shows that the majority of the
respondents are from Selangor 18.24% (respondents) and Kuala Lumpur 17.74%
(respondents). Respondents from other major city are from Penang 8.11%, Pahang
7.60%, Johor 7.6%, Kedah 7.09 %, Kelantan 6.93%, Negeri Sembilan 6.75%,
Perak 6.76%, Melaka 6.59%, and Terangganu 6.59%. There were no respondent
from Perlis Sabah and Sarawak.
.
�
�
Page 34 of 83�
Figure 6: State respondents currently working
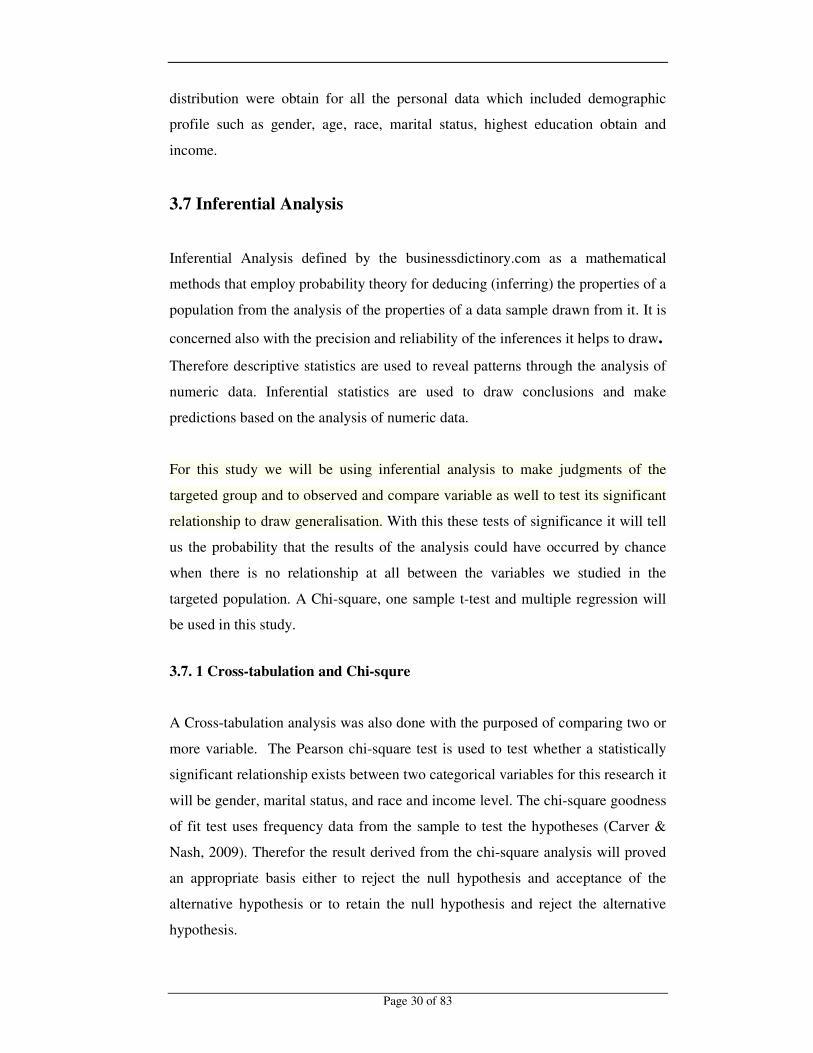
4.2.1.1 Age profile of respondent
Figure 7 below shows the age range of the respondents, the respodants are age
18-35 which falls under the category of Generation Y. Majority of the respondents
were belonging to the age group 20 – 28 which comprise of 84%.
Figure 7: Age profile of respondents
�
�
Page 35 of 83�
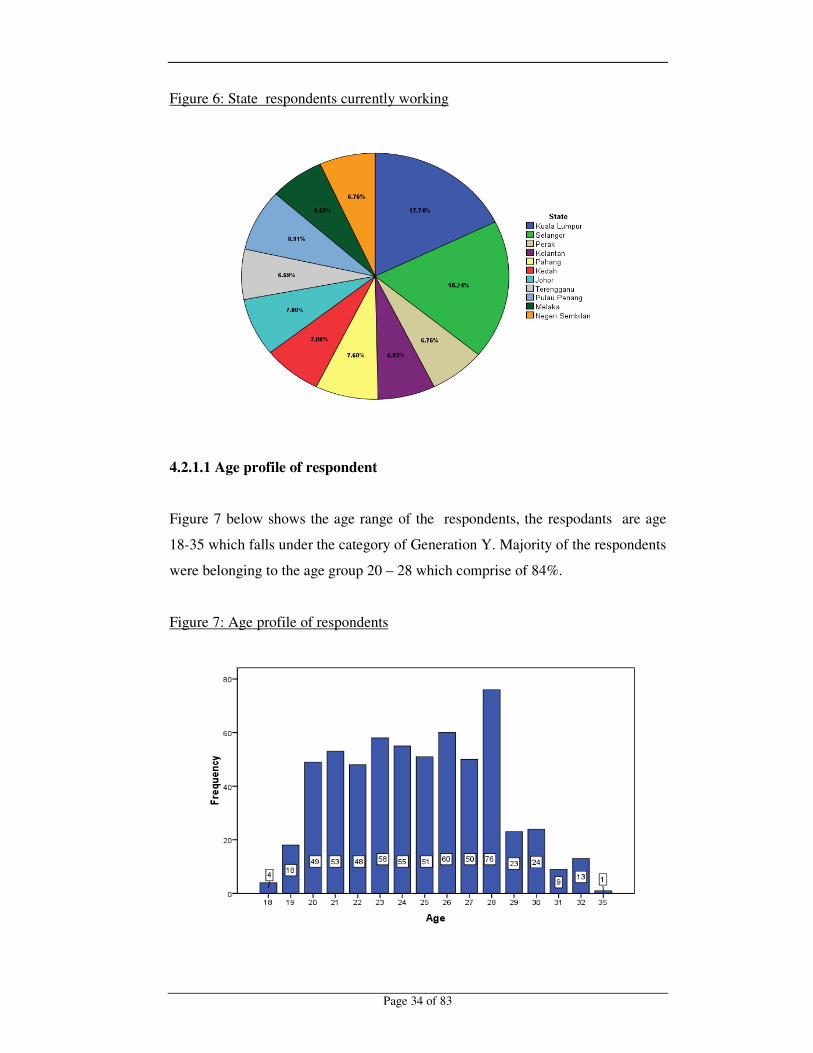
4.2.1.2 Gender profile of respondents
Figure 8 below shows the gender of the respondents. The table shows are 65.03%
are female (385respondents) while 34.97% (207 respondents) are male. Female is
the major gender group of this study.
Figure 8: Gender profile of respondents
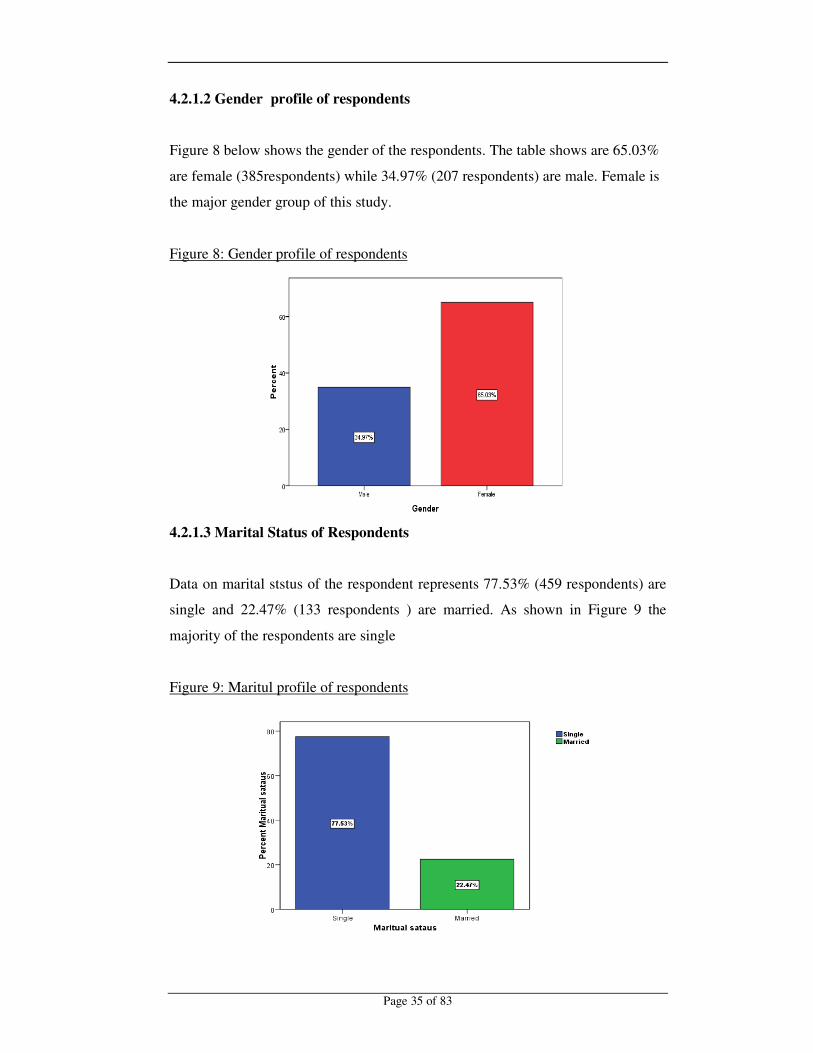
4.2.1.3 Marital Status of Respondents
Data on marital ststus of the respondent represents 77.53% (459 respondents) are
single and 22.47% (133 respondents ) are married. As shown in Figure 9 the
majority of the respondents are single
Figure 9: Maritul profile of respondents
�
�
Page 36 of 83�
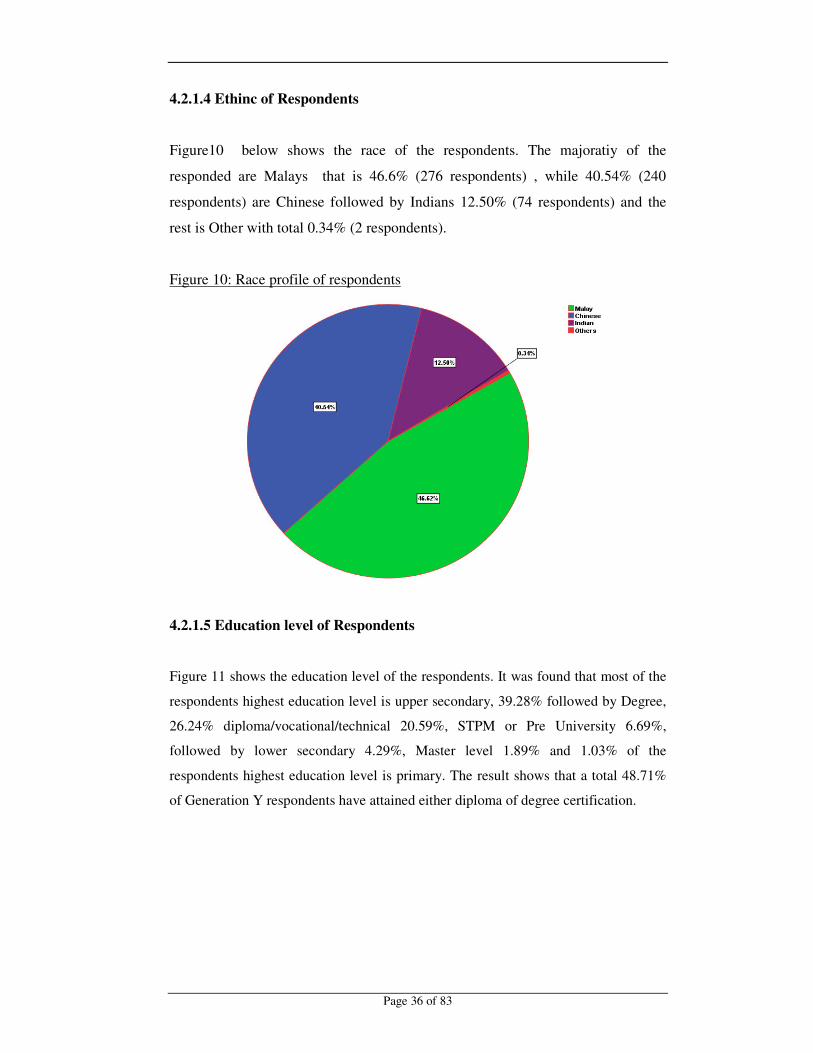
4.2.1.4 Ethinc of Respondents
Figure10 below shows the race of the respondents. The majoratiy of the
responded are Malays that is 46.6% (276 respondents) , while 40.54% (240
respondents) are Chinese followed by Indians 12.50% (74 respondents) and the
rest is Other with total 0.34% (2 respondents).
Figure 10: Race profile of respondents
4.2.1.5 Education level of Respondents
Figure 11 shows the education level of the respondents. It was found that most of the
respondents highest education level is upper secondary, 39.28% followed by Degree,
26.24% diploma/vocational/technical 20.59%, STPM or Pre University 6.69%,
followed by lower secondary 4.29%, Master level 1.89% and 1.03% of the
respondents highest education level is primary. The result shows that a total 48.71%
of Generation Y respondents have attained either diploma of degree certification.

�
�
Page 37 of 83�
Figure 11: Level of Education of respondents
4.2.1.6 Current Working Position of Respondents
The result of respondents current working position is shown in Figure 12. The
finding show that 33.11% (192 respondents) are non – executive , 17.58% (103
respondents) are Junior Executive, 13.65% (80 respondents) have Senior
Executive position , 9.90% (58 respondents) have Managerial position, 0.68% (4
respondents) are in the Top Management and lastlly 25.09% (147 respondents)
are under the others category (i.e working freelance, part-timers). This show that
the majority of Malaysian Generation Y are in the early stage of workforce.
�
�
Page 38 of 83�
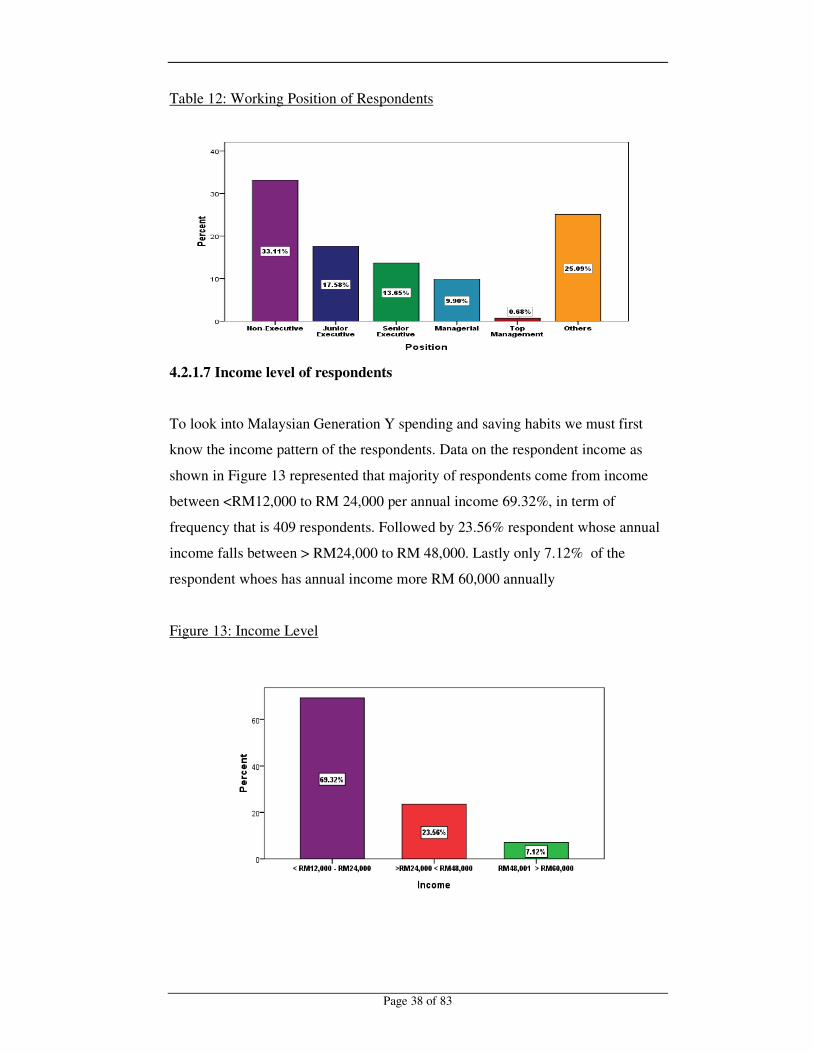
Table 12: Working Position of Respondents
4.2.1.7 Income level of respondents
To look into Malaysian Generation Y spending and saving habits we must first
know the income pattern of the respondents. Data on the respondent income as
shown in Figure 13 represented that majority of respondents come from income
between <RM12,000 to RM 24,000 per annual income 69.32%, in term of
frequency that is 409 respondents. Followed by 23.56% respondent whose annual
income falls between > RM24,000 to RM 48,000. Lastly only 7.12% of the
respondent whoes has annual income more RM 60,000 annually
Figure 13: Income Level
�
�
Page 39 of 83�
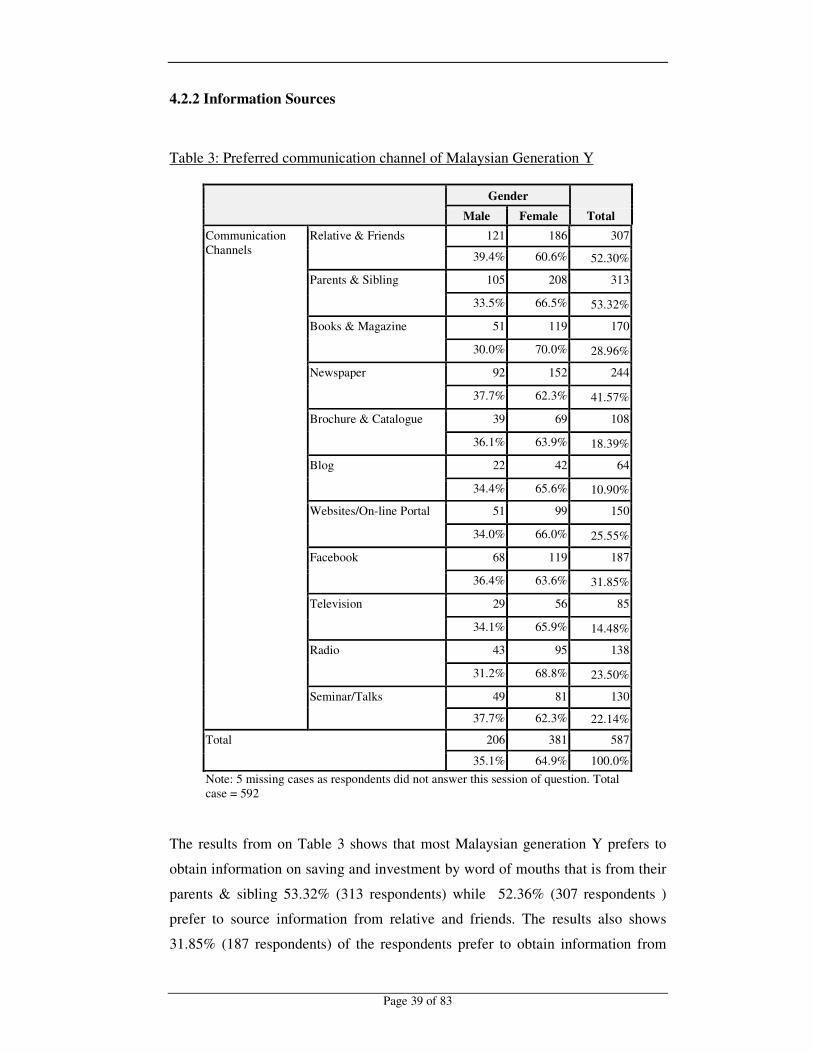
4.2.2 Information Sources
Table 3: Preferred communication channel of Malaysian Generation Y
Gender
Total Male Female Communication Channels
Relative & Friends 121 186 307
39.4% 60.6% 52.30%
Parents & Sibling 105 208 313
33.5% 66.5% 53.32%
Books & Magazine 51 119 170
30.0% 70.0% 28.96%
Newspaper 92 152 244
37.7% 62.3% 41.57%
Brochure & Catalogue 39 69 108
36.1% 63.9% 18.39%
Blog 22 42 64
34.4% 65.6% 10.90%
Websites/On-line Portal 51 99 150
34.0% 66.0% 25.55%
Facebook 68 119 187
36.4% 63.6% 31.85%
Television 29 56 85
34.1% 65.9% 14.48%
Radio 43 95 138
31.2% 68.8% 23.50%
Seminar/Talks 49 81 130
37.7% 62.3% 22.14%
Total 206 381 587
35.1% 64.9% 100.0% Note: 5 missing cases as respondents did not answer this session of question. Total case = 592
The results from on Table 3 shows that most Malaysian generation Y prefers to
obtain information on saving and investment by word of mouths that is from their
parents & sibling 53.32% (313 respondents) while 52.36% (307 respondents )
prefer to source information from relative and friends. The results also shows
31.85% (187 respondents) of the respondents prefer to obtain information from
�
�
Page 40 of 83�
Facebook and 25.55 % (150 respondents ) prefer to source for information from
websites and online portal. The lest preferred way to attain information on saving
and investment is through Blog 10.90% (64 respondents), Television 14.48% (85
respondents)
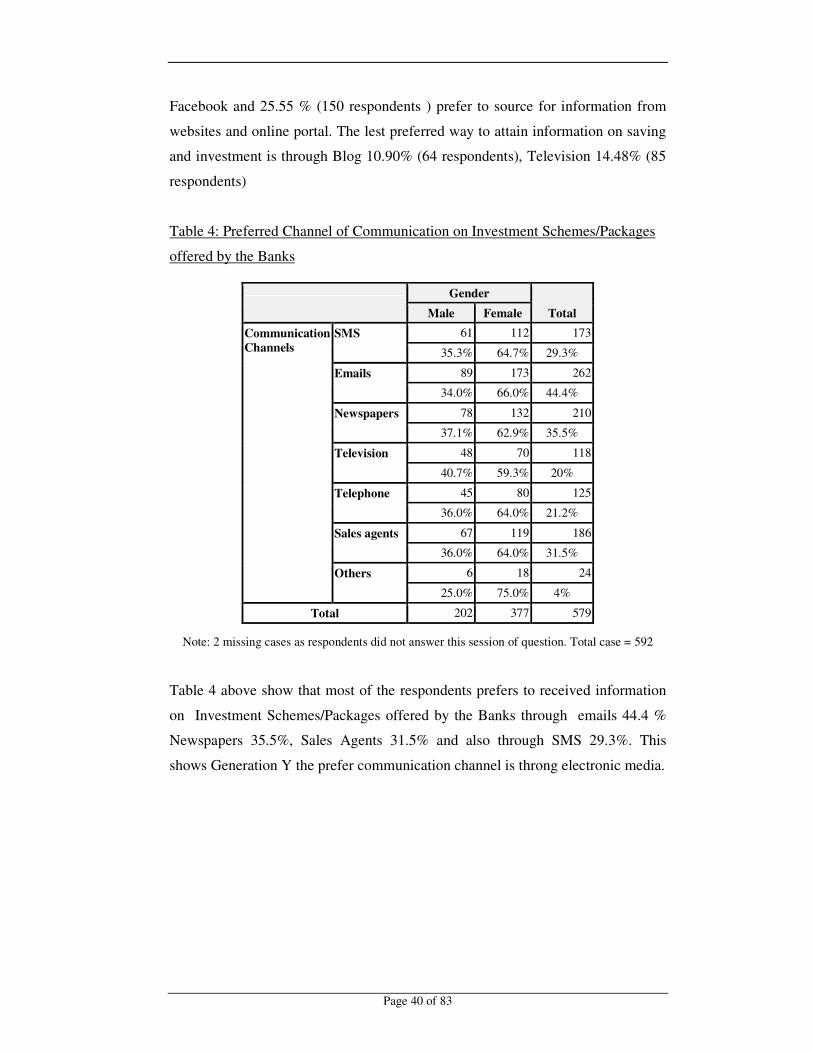
Table 4: Preferred Channel of Communication on Investment Schemes/Packages
offered by the Banks
Gender
Total Male Female Communication Channels
SMS 61 112 173
35.3% 64.7% 29.3%
Emails 89 173 262
34.0% 66.0% 44.4%
Newspapers 78 132 210
37.1% 62.9% 35.5%
Television 48 70 118
40.7% 59.3% 20%
Telephone 45 80 125
36.0% 64.0% 21.2%
Sales agents 67 119 186
36.0% 64.0% 31.5%
Others 6 18 24
25.0% 75.0% 4%
Total 202 377 579
Note: 2 missing cases as respondents did not answer this session of question. Total case = 592
Table 4 above show that most of the respondents prefers to received information
on Investment Schemes/Packages offered by the Banks through emails 44.4 %
Newspapers 35.5%, Sales Agents 31.5% and also through SMS 29.3%. This
shows Generation Y the prefer communication channel is throng electronic media.
�
�
Page 41 of 83�
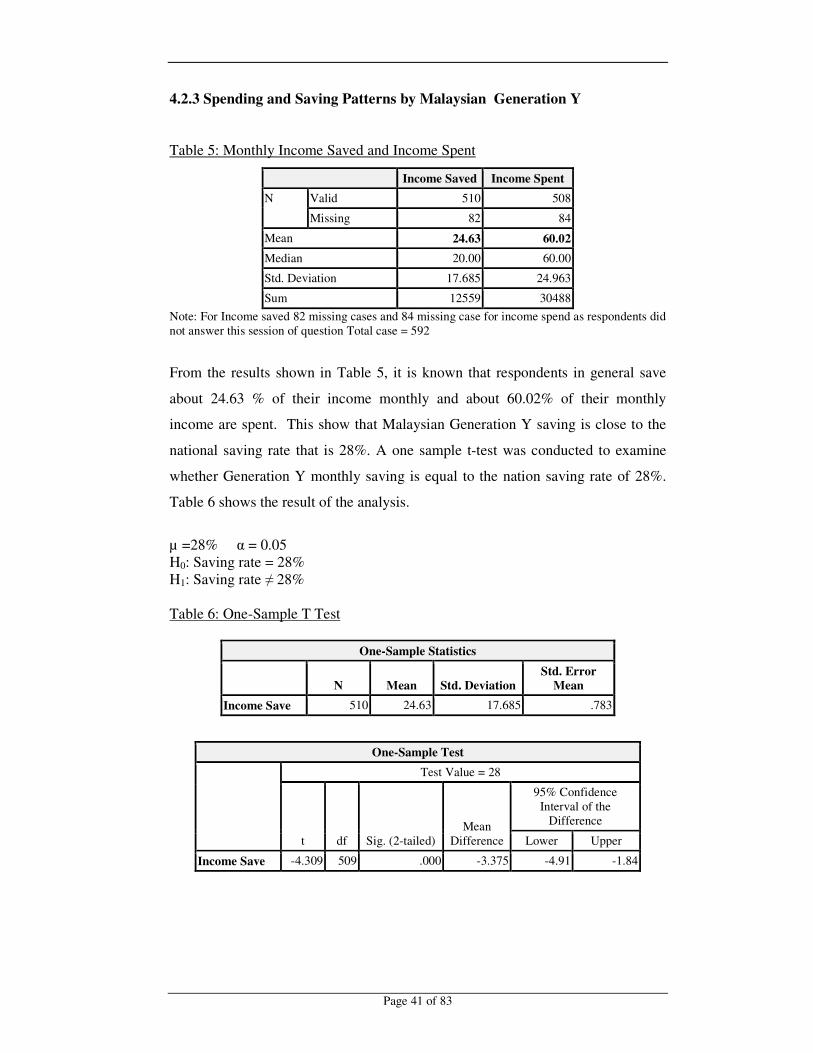
4.2.3 Spending and Saving Patterns by Malaysian Generation Y
Table 5: Monthly Income Saved and Income Spent
Income Saved Income Spent N Valid 510 508
Missing 82 84
Mean 24.63 60.02 Median 20.00 60.00
Std. Deviation 17.685 24.963
Sum 12559 30488 Note: For Income saved 82 missing cases and 84 missing case for income spend as respondents did not answer this session of question Total case = 592
From the results shown in Table 5, it is known that respondents in general save
about 24.63 % of their income monthly and about 60.02% of their monthly
income are spent. This show that Malaysian Generation Y saving is close to the
national saving rate that is 28%. A one sample t-test was conducted to examine
whether Generation Y monthly saving is equal to the nation saving rate of 28%.
Table 6 shows the result of the analysis.
µ =28% � = 0.05 H0: Saving rate = 28% H1: Saving rate � 28% Table 6: One-Sample T Test
One-Sample Statistics
N Mean Std. Deviation Std. Error
Mean Income Save 510 24.63 17.685 .783
One-Sample Test
Test Value = 28
t df Sig. (2-tailed) Mean
Difference
95% Confidence Interval of the
Difference
Lower Upper
Income Save -4.309 509 .000 -3.375 -4.91 -1.84
�
�
Page 42 of 83�
The mean of monthly income saved of Generation Y (µ = 24.63) was
significantly lower than the national saving rate (µ =28) If P is less than or equal
0.05 then H0 is rejected. Therefore we can conclude that Malaysian Generation Y
is not saving enough or as much as other generation group, as their saving rate is
significantly different from the National saving rate.
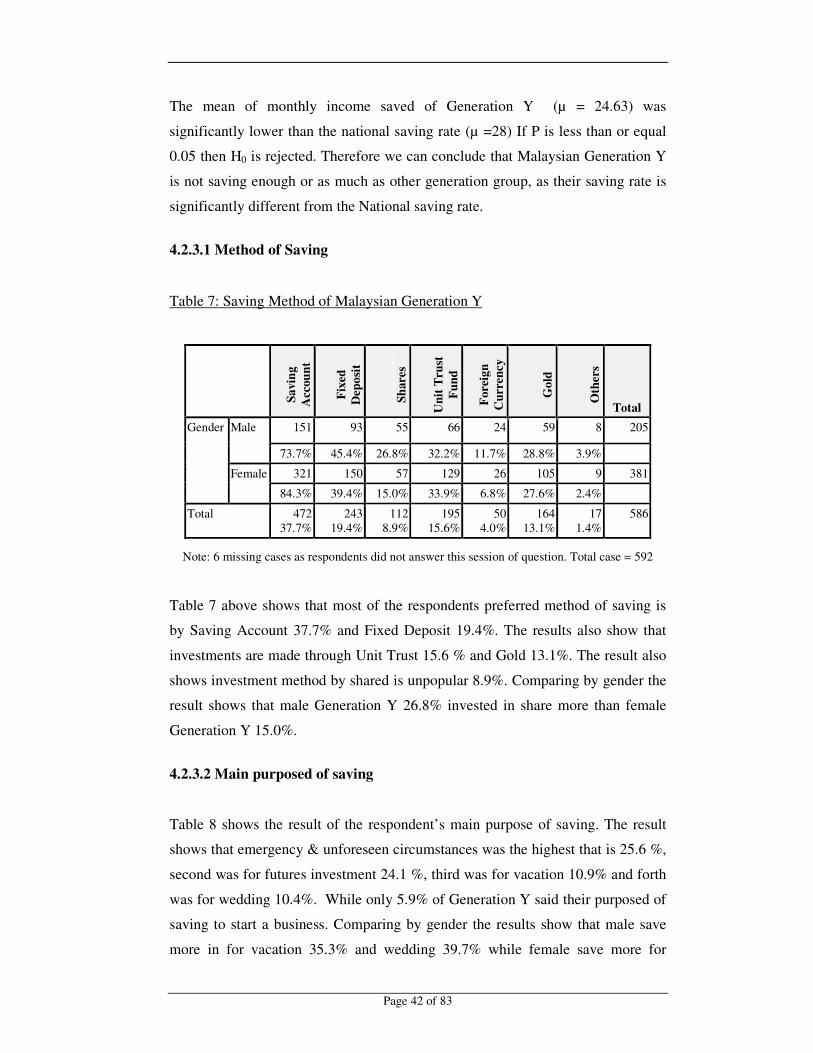
4.2.3.1 Method of Saving
Table 7: Saving Method of Malaysian Generation Y
Savi
ng
Acc
ount
Fixe
d D
epos
it
Shar
es
Uni
t Tru
st
Fund
Fore
ign
Cur
renc
y
Gol
d
Oth
ers
Total Gender Male 151 93 55 66 24 59 8 205
73.7% 45.4% 26.8% 32.2% 11.7% 28.8% 3.9%
Female 321 150 57 129 26 105 9 381
84.3% 39.4% 15.0% 33.9% 6.8% 27.6% 2.4%
Total 472 37.7%
243 19.4%
112 8.9%
195 15.6%
50 4.0%
164 13.1%
17 1.4%
586
Note: 6 missing cases as respondents did not answer this session of question. Total case = 592
Table 7 above shows that most of the respondents preferred method of saving is
by Saving Account 37.7% and Fixed Deposit 19.4%. The results also show that
investments are made through Unit Trust 15.6 % and Gold 13.1%. The result also
shows investment method by shared is unpopular 8.9%. Comparing by gender the
result shows that male Generation Y 26.8% invested in share more than female
Generation Y 15.0%.
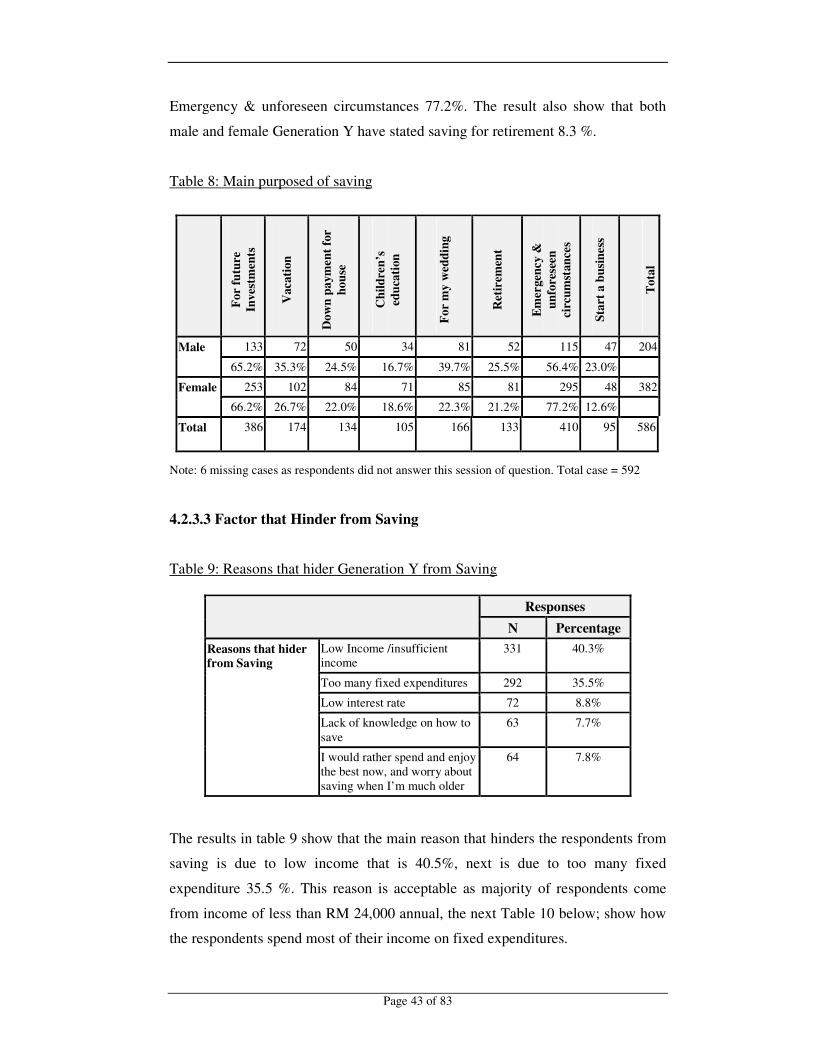
4.2.3.2 Main purposed of saving
Table 8 shows the result of the respondent’ s main purpose of saving. The result
shows that emergency & unforeseen circumstances was the highest that is 25.6 %,
second was for futures investment 24.1 %, third was for vacation 10.9% and forth
was for wedding 10.4%. While only 5.9% of Generation Y said their purposed of
saving to start a business. Comparing by gender the results show that male save
more in for vacation 35.3% and wedding 39.7% while female save more for
�
�
Page 43 of 83�
Emergency & unforeseen circumstances 77.2%. The result also show that both
male and female Generation Y have stated saving for retirement 8.3 %.
Table 8: Main purposed of saving
For
futu
re
Inve
stm
ents
Vac
atio
n
Dow
n pa
ymen
t for
ho
use
Chi
ldre
n’s
educ
atio
n
For
my
wed
ding
Ret
irem
ent
Em
erge
ncy
&
unfo
rese
en
circ
umst
ance
s
Star
t a b
usin
ess
Tot
al
Male 133 72 50 34 81 52 115 47 204
65.2% 35.3% 24.5% 16.7% 39.7% 25.5% 56.4% 23.0%
Female 253 102 84 71 85 81 295 48 382
66.2% 26.7% 22.0% 18.6% 22.3% 21.2% 77.2% 12.6%
Total 386
174
134
105
166
133
410
95
586
Note: 6 missing cases as respondents did not answer this session of question. Total case = 592
4.2.3.3 Factor that Hinder from Saving
Table 9: Reasons that hider Generation Y from Saving
Responses
N Percentage Reasons that hider from Saving
Low Income /insufficient income
331 40.3%
Too many fixed expenditures 292 35.5%
Low interest rate 72 8.8%
Lack of knowledge on how to save
63 7.7%
I would rather spend and enjoy the best now, and worry about saving when I’ m much older
64 7.8%
The results in table 9 show that the main reason that hinders the respondents from
saving is due to low income that is 40.5%, next is due to too many fixed
expenditure 35.5 %. This reason is acceptable as majority of respondents come
from income of less than RM 24,000 annual, the next Table 10 below; show how
the respondents spend most of their income on fixed expenditures.

�
�
Page 44 of 83�
4.2.3.4 Monthly Spending
Table 10 below report on the monthly spending of Generation Y. 77.8% of the
repontend indicated that they need to allocated money for daily necessties this
follows by transportation 64.6 %, parent pocket money 59.5%, entertaiment and
leisure 55.2% and 44.2% for car loan installment. From the result it also show
that generation Y only allocated 18.9% of their monthly income for hosing loan
installmet.
Table 10: Monthly Spending of Generation Y
Car
Loa
n In
stal
men
ts
Hou
sing
Loa
n in
stal
men
t
Hou
se R
enta
l
Edu
catio
n L
oan
or
Tui
tion
Fees
Insu
ranc
e
Dai
ly n
eces
sitie
s
Pare
nts P
ocke
t M
oney
Mon
thly
hou
seho
ld
expe
nditu
re
Tra
nspo
rtat
ion
Ent
erta
inm
ent &
L
eisu
re
Tot
al
Male 108 53 40 61 102 153 107 96 153 126 204
18.6% 9.1% 6.9% 10.5% 17.5% 26.3% 18.4% 16.5% 26.3% 21.6% 35.1%
Female 149 57 81 88 137 300 239 138 223 195 378
25.6% 9.8% 13.9% 15.1% 23.5% 51.5% 41.1% 23.7% 38.3% 33.5% 64.9%
Total 257 110 121 149 239 453 346 234 376 321 582
44.2% 18.9% 20.8% 25.6% 41.1% 77.8% 59.5% 40.2% 64.6% 55.2% 100%
Note: 10 missing cases as respondents did not answer this session of question. Total case = 592 4.2.3.5 Monthly income spend out of budget
The result show in Table 11 below that most of the respontends sometimes
spent out of their monthy budget 49.5 %, and only 4.9% stated that they never
spent out of budget while 19.9% stated that the often spend out of budget.
Table11: Spent of of budgt by gender
Often Sometimes Rarely Never Total Male 40 97 59 11 207
33.9% 33.1% 38.8% 37.9% 35.0%
Female 78 196 93 18 385
66.1% 66.9% 61.2% 62.1% 65.0%
Total 118 293 152 29 592
19.9% 49.5% 25,8% 4.9% 100.0%
�
�
Page 45 of 83�
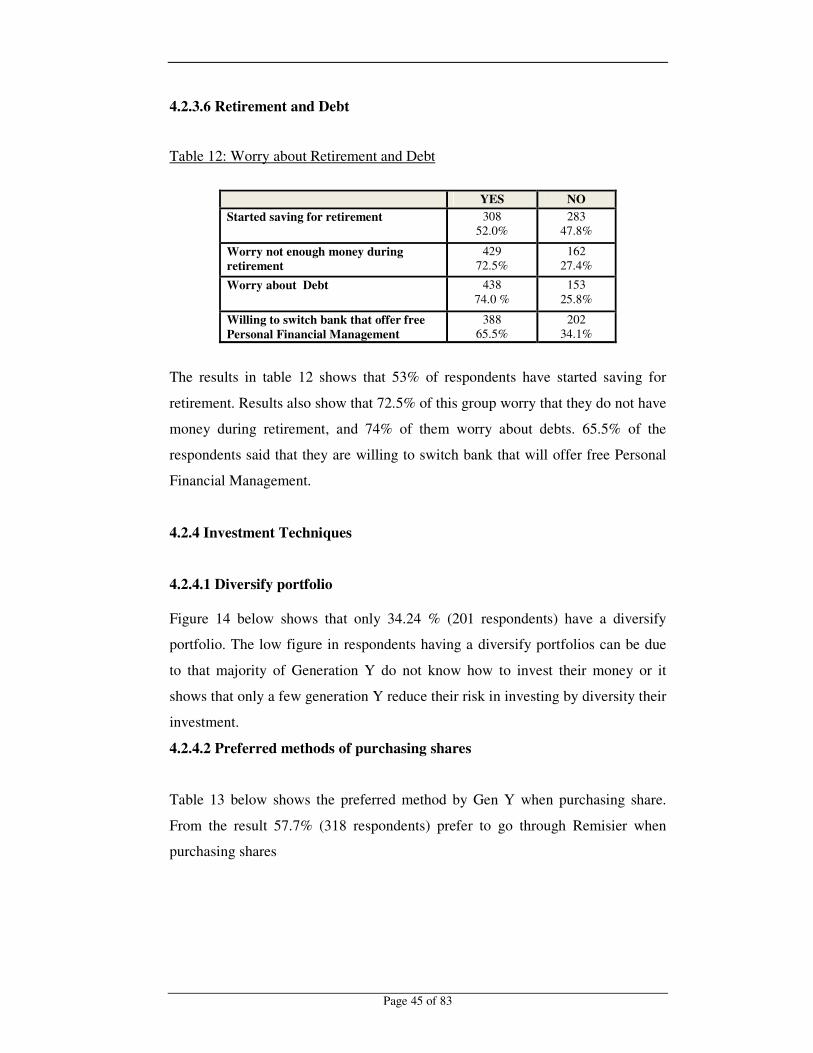
4.2.3.6 Retirement and Debt
Table 12: Worry about Retirement and Debt
YES NO Started saving for retirement 308
52.0% 283
47.8%
Worry not enough money during retirement
429 72.5%
162 27.4%
Worry about Debt 438 74.0 %
153 25.8%
Willing to switch bank that offer free Personal Financial Management
388 65.5%
202 34.1%
The results in table 12 shows that 53% of respondents have started saving for
retirement. Results also show that 72.5% of this group worry that they do not have
money during retirement, and 74% of them worry about debts. 65.5% of the
respondents said that they are willing to switch bank that will offer free Personal
Financial Management.
4.2.4 Investment Techniques
4.2.4.1 Diversify portfolio Figure 14 below shows that only 34.24 % (201 respondents) have a diversify
portfolio. The low figure in respondents having a diversify portfolios can be due
to that majority of Generation Y do not know how to invest their money or it
shows that only a few generation Y reduce their risk in investing by diversity their
investment.
4.2.4.2 Preferred methods of purchasing shares
Table 13 below shows the preferred method by Gen Y when purchasing share.
From the result 57.7% (318 respondents) prefer to go through Remisier when
purchasing shares

�
�
Page 46 of 83�
Figure 14: Diversify Portfolio
Note: 5 missing case as respondents did not answer this session of question. Total case = 592
Table 13: Preferred methods for purchasing shares by Generation Y
Responses
N Percentage
Methods purchase
Online Trading 156 28.3%
Through Remisier 318 57.7%
Through 3rd party 77 14.0%
Total 551 100.0%
Note 41 missing cases as respondents did not answer this session of question. Total case = 592 4.2.4.3 Preferred type of Unit Trust Table 14 shows that the type of unit trust preferred by Generation Y is Growth
Funds 30.3% while the lest preferred choose is 100% Bond Fund that is 11.7%.
Table 14: Selection of Unit Trust type by Generation Y
Responses
N Percentage Unit Trust Growth fund 256 30.3%
Balance Fund 137 16.2%
Capital Fund 140 16.6%
100% bond Fund 99 11.7%
Equity Trust Fund 212 25.1%
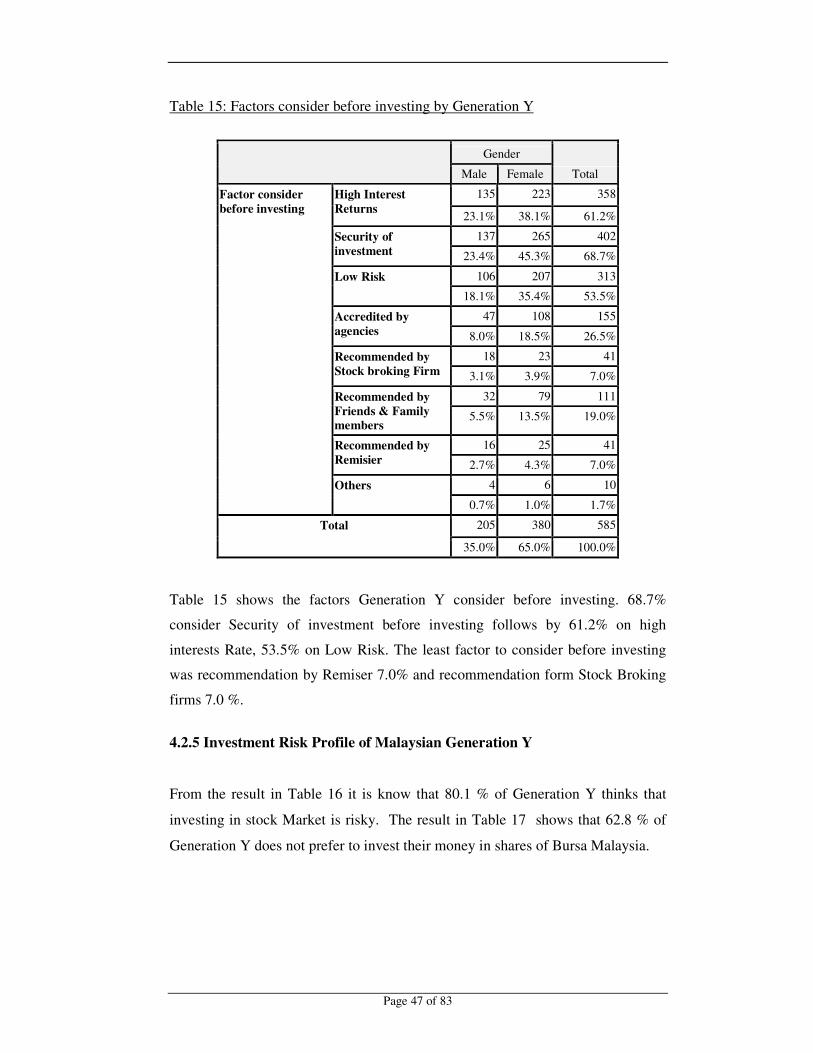
�
�
Page 47 of 83�
Table 15: Factors consider before investing by Generation Y
Gender
Total Male Female
Factor consider before investing
High Interest Returns
135 223 358
23.1% 38.1% 61.2%
Security of investment
137 265 402
23.4% 45.3% 68.7%
Low Risk 106 207 313
18.1% 35.4% 53.5%
Accredited by agencies
47 108 155
8.0% 18.5% 26.5%
Recommended by Stock broking Firm
18 23 41
3.1% 3.9% 7.0%
Recommended by Friends & Family members
32 79 111
5.5% 13.5% 19.0%
Recommended by Remisier
16 25 41
2.7% 4.3% 7.0%
Others 4 6 10
0.7% 1.0% 1.7%
Total 205 380 585
35.0% 65.0% 100.0%
Table 15 shows the factors Generation Y consider before investing. 68.7%
consider Security of investment before investing follows by 61.2% on high
interests Rate, 53.5% on Low Risk. The least factor to consider before investing
was recommendation by Remiser 7.0% and recommendation form Stock Broking
firms 7.0 %.
4.2.5 Investment Risk Profile of Malaysian Generation Y
From the result in Table 16 it is know that 80.1 % of Generation Y thinks that
investing in stock Market is risky. The result in Table 17 shows that 62.8 % of
Generation Y does not prefer to invest their money in shares of Bursa Malaysia.
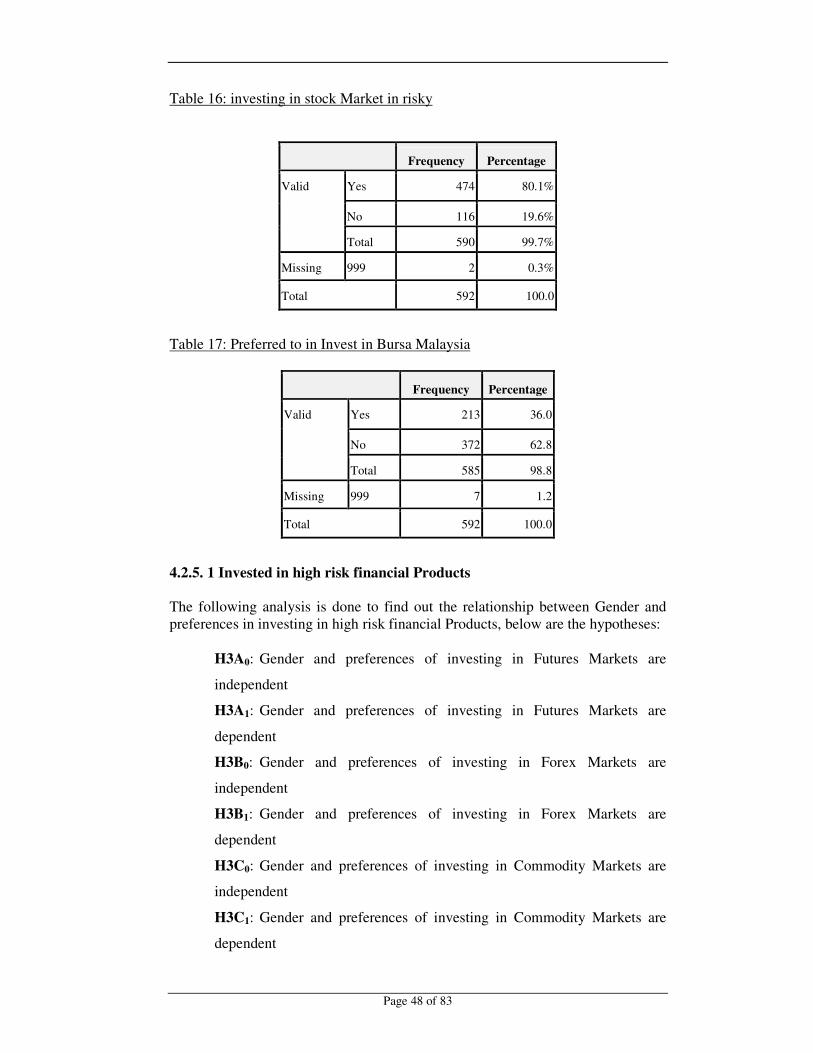
�
�
Page 48 of 83�
Table 16: investing in stock Market in risky
Frequency Percentage
Valid Yes 474 80.1%
No 116 19.6%
Total 590 99.7%
Missing 999 2 0.3%
Total 592 100.0
Table 17: Preferred to in Invest in Bursa Malaysia
Frequency Percentage
Valid Yes 213 36.0
No 372 62.8
Total 585 98.8
Missing 999 7 1.2
Total 592 100.0
4.2.5. 1 Invested in high risk financial Products The following analysis is done to find out the relationship between Gender and preferences in investing in high risk financial Products, below are the hypotheses:
H3A0: Gender and preferences of investing in Futures Markets are
independent
H3A1: Gender and preferences of investing in Futures Markets are
dependent
H3B0: Gender and preferences of investing in Forex Markets are
independent
H3B1: Gender and preferences of investing in Forex Markets are�
dependent
H3C0: Gender and preferences of investing in Commodity Markets are
independent
H3C1: Gender and preferences of investing in Commodity Markets are
dependent
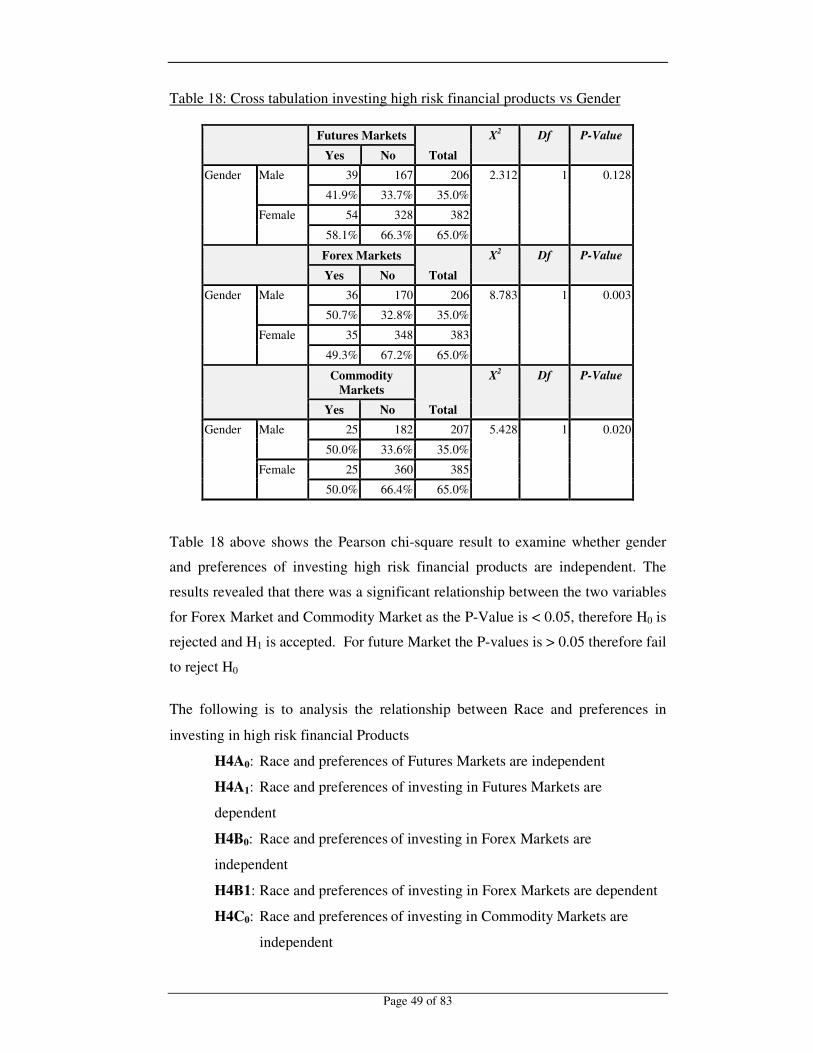
�
�
Page 49 of 83�
Table 18: Cross tabulation investing high risk financial products vs Gender
Futures Markets
Total X2 Df P-Value
Yes No Gender Male 39 167 206 2.312 1 0.128
41.9% 33.7% 35.0%
Female 54 328 382
58.1% 66.3% 65.0%
Forex Markets
Total X2 Df P-Value
Yes No Gender Male 36 170 206 8.783 1 0.003
50.7% 32.8% 35.0%
Female 35 348 383
49.3% 67.2% 65.0%
Commodity
Markets Total
X2 Df P-Value
Yes No Gender Male 25 182 207 5.428 1 0.020
50.0% 33.6% 35.0%
Female 25 360 385
50.0% 66.4% 65.0%
Table 18 above shows the Pearson chi-square result to examine whether gender
and preferences of investing high risk financial products are independent. The
results revealed that there was a significant relationship between the two variables
for Forex Market and Commodity Market as the P-Value is < 0.05, therefore H0 is
rejected and H1 is accepted. For future Market the P-values is > 0.05 therefore fail
to reject H0
The following is to analysis the relationship between Race and preferences in
investing in high risk financial Products
H4A0: Race and preferences of Futures Markets are independent
H4A1: Race and preferences of investing in Futures Markets are
dependent
H4B0: Race and preferences�of investing in Forex Markets are
independent
H4B1: Race and preferences of investing in Forex Markets are dependent
H4C0: Race and preferences�of investing in Commodity Markets are
independent

�
�
Page 50 of 83�
H4C1: Race and preferences of investing in Commodity Markets are
dependent.
Table 19 below show the Pearson chi-square result to examine whether race and
preferences of investing high risk financial products are independent. The results
revealed that there was a significant relationship between the two variables for
Future Market and Commodity Market as the P-Value is < 0.05, therefore H0 is
rejected. The P-values is > 0.05 therefor fail H0 for Forex Market
Table: 19�Cross tabulation investing high risk financial products vs Race
Futures Markets
Total
X2 Df P-Value Yes No
Race Malay 31 241 272 12.187a 3 .007
33.3% 48.7% 46.3%
Chinese 53 187 240
57.0% 37.8% 40.8%
Indian 9 65 74
9.7% 13.1% 12.6%
Others 0 2 2
.0% .4% .3%
Forex Markets
Total X2 Df P-Value
Yes No Race Malay 24 249 273 6.148a 3 0.105
33.8% 48.1% 46.3%
Chinese 34 206 240
47.9% 39.8% 40.7%
Indian 13 61 74
18.3% 11.8% 12.6%
Others 0 2 2
.0% .4% .3%
Commodity Markets
Total
X2 Df P-Value
Yes No Race Malay 17 259 276 8.055a 3 0.045
34.0% 47.8% 46.6%
Chinese 23 217 240
46.0% 40.0% 40.5%
Indian 9 65 74
18.0% 12.0% 12.5%
Others 1 1 2
2.0% .2% .3%

�
�
Page 51 of 83�
The following is to analysis the relationship between Marital Status and
preferences in investing in high risk financial products. Below are the hypotheses:
H5A0: Marital Status and preferences of investing in Futures Markets are
independent
H5A1: Marital Status and preferences of investing in Futures Markets are
dependent
H5B0: Marital Status and preferences of investing in Forex Markets are
independent
H5B1: Marital Status and preferences of investing in Forex Markets are
dependent
H5C0: Marital Status and preferences�of investing in Commodity Markets are
independent
H5C1: Marital Status and preferences of investing in Commodity Markets are
dependent
Table 20: Cross tabulation investing high risk financial products vs Marital Status
Futures Markets
Total
X2 Df P-Value Yes No
Marital status Single 75 381 456 2.312a 1 0.128
80.6% 77.0% 77.6%
Married 18 114 132
19.4% 23.0% 22.4%
Forex Markets
Total
X2 Df P-Value Yes No
Marital status Single 51 406 457 8.783a 1 0.003
71.8% 78.4% 77.6%
Married 20 112 132
28.2% 21.6% 22.4%
Commodity Markets Total X2 Df P-Value
Yes No Marital status Single 35 424 459 5.428a 1 0.020
70.0% 78.2% 77.5%
Married 15 118 133
30.0% 21.8% 22.5%

�
�
Page 52 of 83�
Table 20 above show the Pearson chi-square result to examine whether Marital
Status and preferences of investing high risk financial products are independent.
The results revealed that there was a significant relationship between the two
variables for Forex Market and Commodity Market as the P-Value is < 0.05,
therefore H0 is rejected. The P-values for Future Market is > 0.05 for therefor fail
H0. Thus marital statues are for Forex Market and Commodity Market dependent.
The following is to analysis the relationship between Income and preferences in
investing in high risk financial products. Below are the hypotheses:
H6A0: Income and preferences of investing in Futures Markets are independent
H6A1: Income and preferences of investing in Futures Markets are dependent
H6B0: Income and preferences of investing in Forex Markets are independent
H6B1: Income and preferences of investing in Forex Markets are dependent
H6C0: Income and preferences of investing in Commodity Markets are
independent
H6C1: Income and preferences of investing in Commodity Markets are dependent
Table 21 below show the Pearson chi-square result to examine whether Income
and preferences of investing high risk financial products are independent. The
results revealed that there was a significant relationship between the three
variables for Commodity Market Forex Market and Future Market the P-values is
> 0.05 for therefore fail to reject all 3 Hypotheses. Therefore Income an
preference for investments in risky market are independent
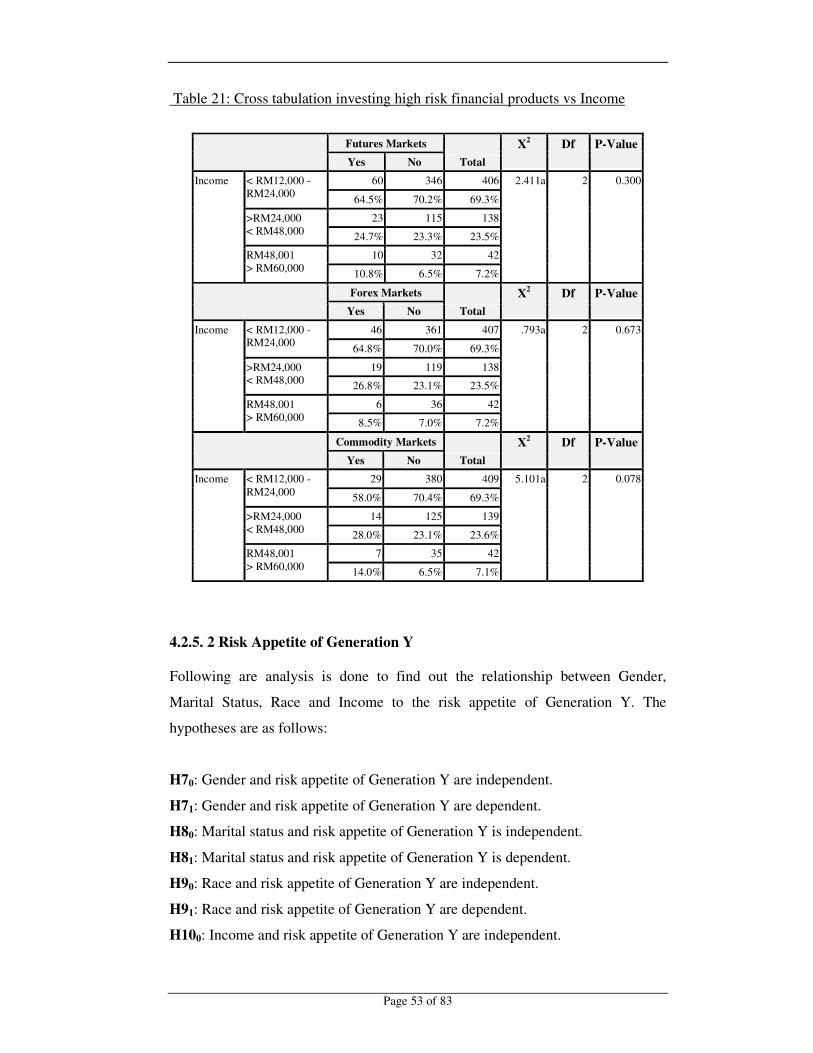
�
�
Page 53 of 83�
Table 21: Cross tabulation investing high risk financial products vs Income
Futures Markets
Total X2 Df P-Value
Yes No
Income < RM12,000 - RM24,000
60 346 406 2.411a 2 0.300
64.5% 70.2% 69.3%
>RM24,000 < RM48,000
23 115 138
24.7% 23.3% 23.5%
RM48,001 > RM60,000
10 32 42
10.8% 6.5% 7.2%
Forex Markets
Total X2 Df P-Value
Yes No
Income < RM12,000 - RM24,000
46 361 407 .793a 2 0.673
64.8% 70.0% 69.3%
>RM24,000 < RM48,000
19 119 138
26.8% 23.1% 23.5%
RM48,001 > RM60,000
6 36 42
8.5% 7.0% 7.2%
Commodity Markets
Total X2 Df P-Value
Yes No
Income < RM12,000 - RM24,000
29 380 409 5.101a 2 0.078
58.0% 70.4% 69.3%
>RM24,000 < RM48,000
14 125 139
28.0% 23.1% 23.6%
RM48,001 > RM60,000
7 35 42
14.0% 6.5% 7.1%
4.2.5. 2 Risk Appetite of Generation Y Following are analysis is done to find out the relationship between Gender,
Marital Status, Race and Income to the risk appetite of Generation Y. The
hypotheses are as follows:
H70: Gender and risk appetite of Generation Y are independent.
H71: Gender and risk appetite of Generation Y are dependent.
H80: Marital status and risk appetite of Generation Y is independent.
H81: Marital status and risk appetite of Generation Y is dependent.
H90: Race and risk appetite of Generation Y are independent.
H91: Race and risk appetite of Generation Y are dependent.
H100: Income and risk appetite of Generation Y are independent.
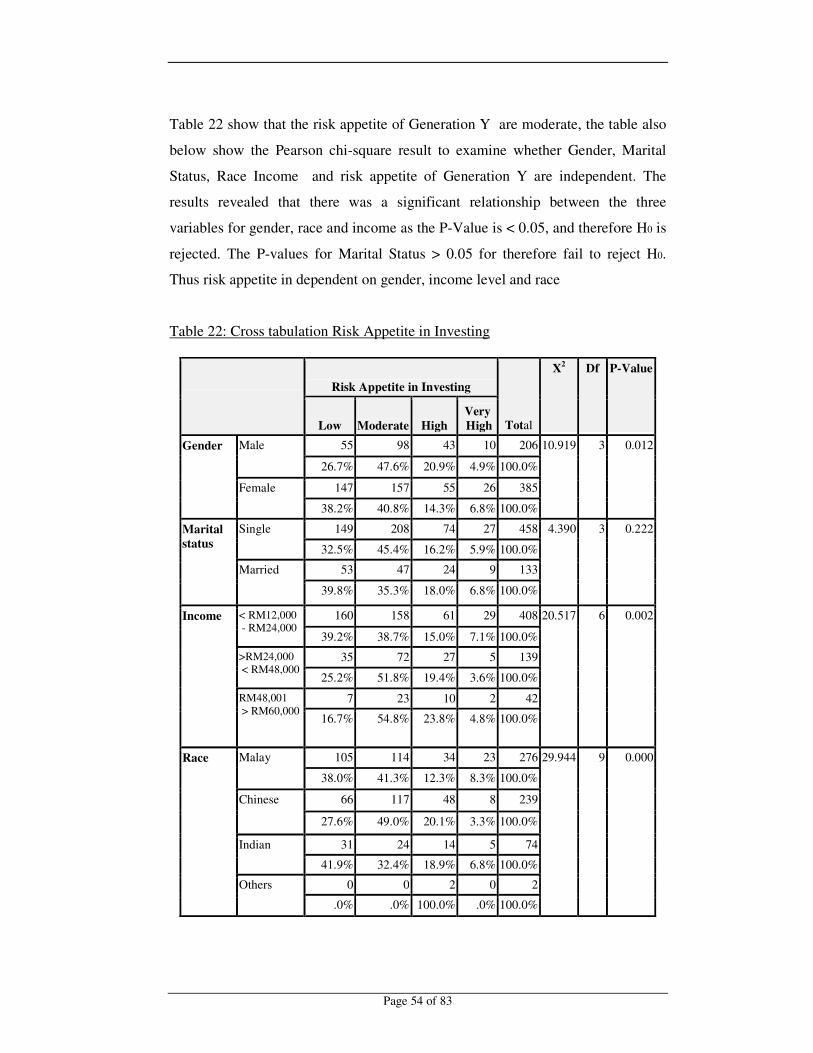
�
�
Page 54 of 83�
Table 22 show that the risk appetite of Generation Y are moderate, the table also
below show the Pearson chi-square result to examine whether Gender, Marital
Status, Race Income and risk appetite of Generation Y are independent. The
results revealed that there was a significant relationship between the three
variables for gender, race and income as the P-Value is < 0.05, and therefore H0 is
rejected. The P-values for Marital Status > 0.05 for therefore fail to reject H0.
Thus risk appetite in dependent on gender, income level and race
Table 22: Cross tabulation Risk Appetite in Investing
Risk Appetite in Investing
Total
X2 Df P-Value
Low Moderate High Very High
Gender Male 55 98 43 10 206 10.919 3 0.012
26.7% 47.6% 20.9% 4.9% 100.0%
Female 147 157 55 26 385
38.2% 40.8% 14.3% 6.8% 100.0%
Marital status
Single 149 208 74 27 458 4.390 3 0.222
32.5% 45.4% 16.2% 5.9% 100.0%
Married 53 47 24 9 133
39.8% 35.3% 18.0% 6.8% 100.0%
Income < RM12,000 - RM24,000
160 158 61 29 408 20.517 6 0.002
39.2% 38.7% 15.0% 7.1% 100.0%
>RM24,000 < RM48,000
35 72 27 5 139
25.2% 51.8% 19.4% 3.6% 100.0%
RM48,001 > RM60,000
7 23 10 2 42
16.7% 54.8% 23.8% 4.8% 100.0%
Race Malay 105 114 34 23 276 29.944 9 0.000
38.0% 41.3% 12.3% 8.3% 100.0%
Chinese 66 117 48 8 239
27.6% 49.0% 20.1% 3.3% 100.0%
Indian 31 24 14 5 74
41.9% 32.4% 18.9% 6.8% 100.0%
Others 0 0 2 0 2
.0% .0% 100.0% .0% 100.0%
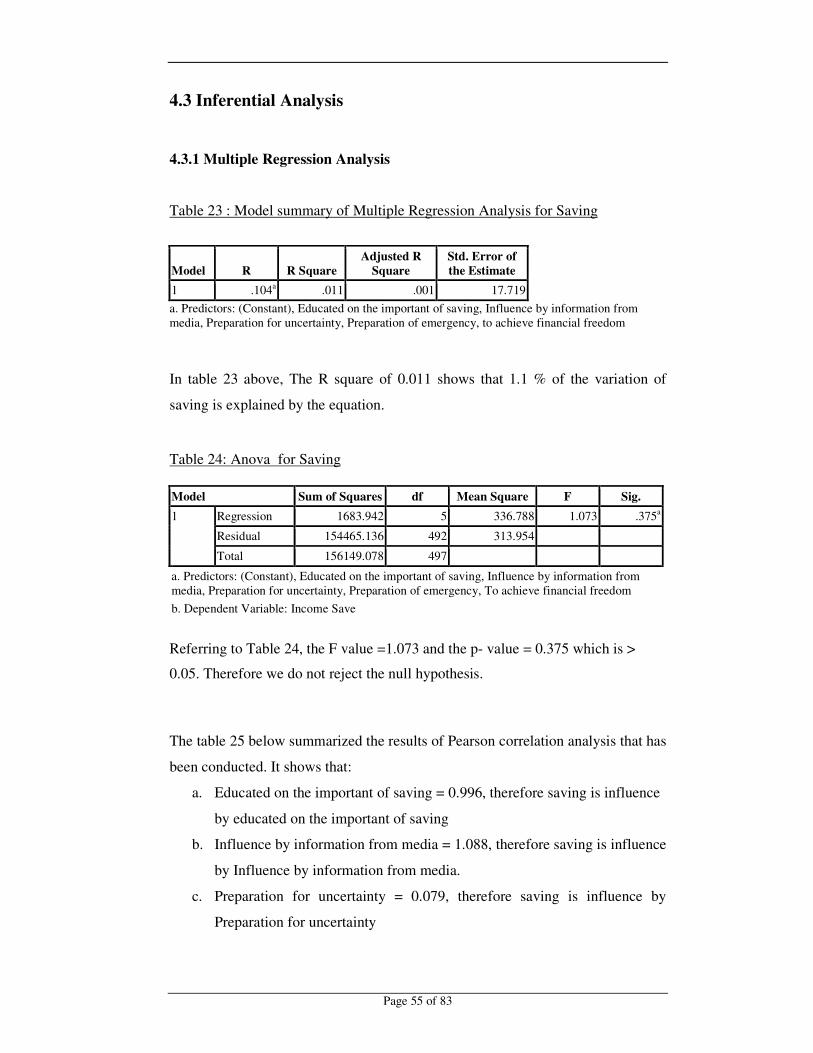
�
�
Page 55 of 83�
4.3 Inferential Analysis
4.3.1 Multiple Regression Analysis
Table 23 : Model summary of Multiple Regression Analysis for Saving
Model R R Square Adjusted R
Square Std. Error of the Estimate
1 .104a .011 .001 17.719 a. Predictors: (Constant), Educated on the important of saving, Influence by information from media, Preparation for uncertainty, Preparation of emergency, to achieve financial freedom
In table 23 above, The R square of 0.011 shows that 1.1 % of the variation of
saving is explained by the equation.
Table 24: Anova for Saving Model Sum of Squares df Mean Square F Sig. 1 Regression 1683.942 5 336.788 1.073 .375a
Residual 154465.136 492 313.954
Total 156149.078 497
a. Predictors: (Constant), Educated on the important of saving, Influence by information from media, Preparation for uncertainty, Preparation of emergency, To achieve financial freedom b. Dependent Variable: Income Save
Referring to Table 24, the F value =1.073 and the p- value = 0.375 which is >
0.05. Therefore we do not reject the null hypothesis.
The table 25 below summarized the results of Pearson correlation analysis that has
been conducted. It shows that:
a. Educated on the important of saving = 0.996, therefore saving is influence
by educated on the important of saving
b. Influence by information from media = 1.088, therefore saving is influence
by Influence by information from media.
c. Preparation for uncertainty = 0.079, therefore saving is influence by
Preparation for uncertainty

�
�
Page 56 of 83�
d. Preparation of emergency = -0.261, therefore saving is negative related to
preparation of emergency.
e. To achieve financial freedom =0.392, therefore saving is influence by to
achieve financial freedom
Table 25: Coefficients of Multiple Regression Analysis for Saving
Model
Unstandardized Coefficients
Standardized Coefficients
t Sig. B Std. Error Beta 1 (Constant) 16.455 5.318 3.094 .002
Educated on the important of saving
.996 .934 .054 1.066 .287
Influence by information from media
1.088 .770 .068 1.414 .158
Preparation for uncertainty .079 1.359 .004 .058 .954
Preparation of emergency -.261 1.437 -.011 -.182 .856
To achieve financial freedom .392 .804 .023 .488 .626
a. Dependent Variable: Income Save
Referring to Table 25, the regression equation based on the indicated regression
parameter estimates would be:
E (Ysv) = �+ �1x1 +�2x2 +�3x3 +�4x4 +�5x5
Saving = 16.455 +0.996 x1+1.088 x2+0.079 x3-0.261 x4 +0.392 x5
Whereby
YSV = Saving
X1 = Educated on the important of saving
X2 = Influence by information from media
X3 = Preparation for uncertainty
X4 = Preparation of emergency
X5 = To Achieve financial freedom
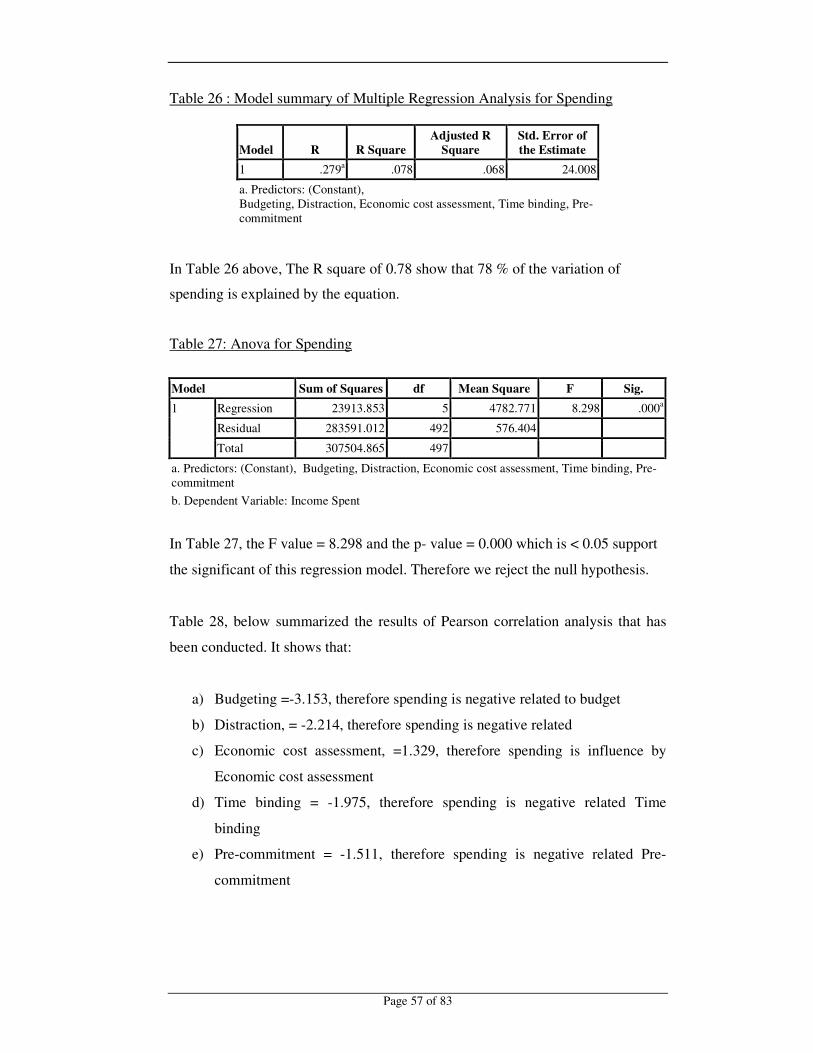
�
�
Page 57 of 83�
Table 26 : Model summary of Multiple Regression Analysis for Spending
Model R R Square Adjusted R
Square Std. Error of the Estimate
1 .279a .078 .068 24.008
a. Predictors: (Constant), Budgeting, Distraction, Economic cost assessment, Time binding, Pre-commitment
In Table 26 above, The R square of 0.78 show that 78 % of the variation of
spending is explained by the equation.
Table 27: Anova for Spending
Model Sum of Squares df Mean Square F Sig. 1 Regression 23913.853 5 4782.771 8.298 .000a
Residual 283591.012 492 576.404
Total 307504.865 497
a. Predictors: (Constant), Budgeting, Distraction, Economic cost assessment, Time binding, Pre-commitment b. Dependent Variable: Income Spent
In Table 27, the F value = 8.298 and the p- value = 0.000 which is < 0.05 support
the significant of this regression model. Therefore we reject the null hypothesis.
Table 28, below summarized the results of Pearson correlation analysis that has
been conducted. It shows that:
a) Budgeting =-3.153, therefore spending is negative related to budget
b) Distraction, = -2.214, therefore spending is negative related
c) Economic cost assessment, =1.329, therefore spending is influence by
Economic cost assessment
d) Time binding = -1.975, therefore spending is negative related Time
binding
e) Pre-commitment = -1.511, therefore spending is negative related Pre-
commitment

�
�
Page 58 of 83�
Table 28 : Coefficients of Multiple Regression Analysis for Spending
Model
Unstandardized Coefficients
Standardized Coefficients
t Sig. B Std. Error Beta 1 (Constant) 86.179 5.059 17.034 .000
Budgeting -3.153 1.361 -.135 -2.316 .021
Distraction -2.214 1.231 -.105 -1.799 .073
Economic cost assessment 1.329 1.412 .052 .941 .347
Time binding -1.975 1.277 -.081 -1.547 .123
Pre-commitment -1.511 1.132 -.071 -1.334 .183
a. Dependent Variable: Income Spent
Referring to Table 28 , the regression equation based on the indicated regression
parameter estimates would be:
E (YSP) = �+ �1x1 +�2x2 +�3x3 +�4x4 +�5x5
Spending = 86.179 -3.153x1-2.219x2+1.329x3-1.975x4 -1.511x5
YSP = Spending
X1 = Budgeting
X2 = Distraction
X3 = Economic cost assessment
X4 = Time binding
X5 = Pre-commitment

�
�
Page 59 of 83�
4.3.2: Hypotheses Summary
Table 29 : Summary of Hypotheses
Hypotheses P-Value Observations
H1a: There is a significant
relationship between been
educated on the important of
saving and saving.
< 0.05
reject Ho
There is a significant
relationship between been
educated on the important
of saving and saving.
H1b: There is a significant
relationship between once
influence by information
about saving from media and
saving.
< 0.05
reject Ho
There is a significant
relationship between once
influence by information
about saving from media
and saving.
H1c: There is a significant
relationship between
preparation for uncertainty
and saving.
< 0.05
reject Ho
There is a significant
relationship between
preparation for uncertainty
and saving.
H1d: There is a significant
relationship between
preparation of emergency
and influence by information
about saving from media
< 0.05
reject Ho
There is a significant
relationship between
preparation of emergency
and influence by
information about saving
from media
H1e: There is a significant
relationship between to
achieve saving financial
freedom and saving
< 0.05
reject Ho
There is a significant
relationship between to
achieve saving financial
freedom and saving
H2a: There is a significant
relationship between been
budgeting and spending.
> 0.05
Fail to reject Ho
There is no a significant
relationship between been
budgeting and spending.
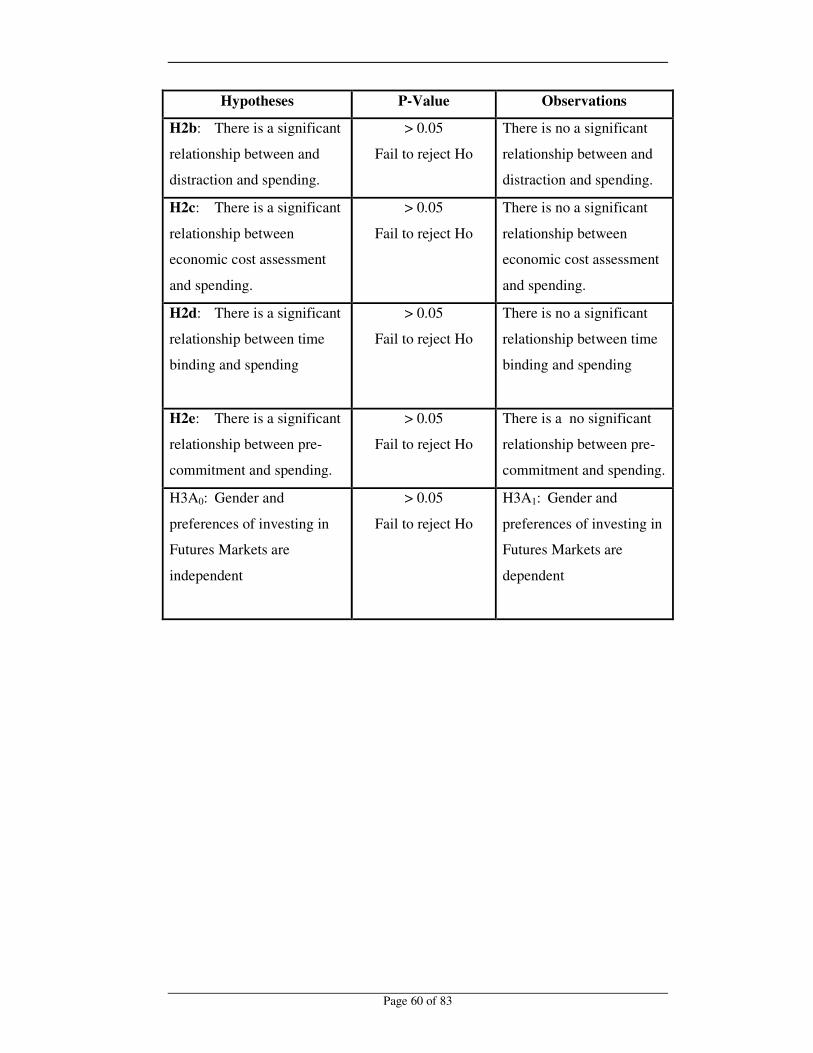
�
�
Page 60 of 83�
Hypotheses P-Value Observations
H2b: There is a significant
relationship between and
distraction and spending.
> 0.05
Fail to reject Ho
There is no a significant
relationship between and
distraction and spending.
H2c: There is a significant
relationship between
economic cost assessment
and spending.
> 0.05
Fail to reject Ho
There is no a significant
relationship between
economic cost assessment
and spending.
H2d: There is a significant
relationship between time
binding and spending
> 0.05
Fail to reject Ho
There is no a significant
relationship between time
binding and spending
H2e: There is a significant
relationship between pre-
commitment and spending.
> 0.05
Fail to reject Ho
There is a no significant
relationship between pre-
commitment and spending.
H3A0: Gender and
preferences of investing in
Futures Markets are
independent
> 0.05
Fail to reject Ho
H3A1: Gender and
preferences of investing in
Futures Markets are
dependent
�

�
�
Page 61 of 83�
CHAPTER 5
DISCUSSION AND CONCLUSION
5.1 Introduction
This chapter discussed the overall finding of the research study. It implications of
the research findings, limitation and directions for future research are reported in
this chapter. The conclusion for this study will be summarised based on the result
from this study.
5.2 Discussion and Recommendation
The data collected was analysed and reported in Chapter 4, with the result from
the data we will look back at our research objective and conclude our findings
The first objective was to determine the consumption and spending patterns of
Generation Y. In terms of spending it was identified the Malaysian Generation Y
spent on average 60% of their monthly income and it is spent mostly of monthly
income for daily necessities that is 77.8%, this follows by transportation 64.6 %,
parent pocket money 59.5%, entertainment and leisure 55.2% and 44.2% for car
loan installment.
The research results also found out that 19.9% of Malaysian Generation Y often
spend out of thier budget, 49.5 % stated they sometimes spent out of their
monthly budget and only 4.9% stated that they never spent out of budget.The

�
�
Page 62 of 83�
results also show that there is a positive relationship between Budgeting,
Distraction, Economic Cost Assessment, Time binding and Pre-commitment with
spending.
The next objective was to determine the level of saving and the forms of saving
performed by Generation Y. In terms of saving it is know that Malaysian
Generation Y save about 24.63 % of their income monthly which is closely to the
national saving rate.
In terms of preferred method of saving the results show that Saving Account
37.7% and Fixed Deposit 19.4% were the preferred choices. The results also show
Malaysian generation Y preferred to save through investments such as Unit Trust
15.6 % and Gold 13.1%. The result also shows investment method by shares is
unpopular 8.9% in this group.
In terms on main purpose of saving, Malaysian Generation Y purpose of saving
are for emergency & unforeseen circumstances 25.6 %, second was for future
investment 24.1 %, third was for vacation 10.9% and forth was for wedding
10.4%. While only 5.9% of Generation Y said their purposed of save to start a
business. The result also show that both male and female Generation Y have
stated saving for retirement 8.3 %.
The results show as well that the main reason that hinder Malaysian Generation Y
from saving is due to low income 40.5%, next is due to too many fixed
expenditure 35.5 %. From our results as well shows that there is a positive
relationship between educated on the important of saving, Influence by
information from media, preparation for uncertainty, preparation of emergency
and to achieve financial freedom.
The next objective was to study the method of investments practiced by
Generation Y. For our results its shows that the type of unit trust preferred by
Generation Y is Growth Funds 30.3% while the lest preferred choose is 100%
Bond Fund 11.7%. The analysis results tell that the factors Generation Y consider
before investing. Is the Security of investment (68.7% ) follows by 61.2% on high

�
�
Page 63 of 83�
interests Rate, and 53.5% on Low Risk. The least factor to consider before
investing was recommendation by Remiser 7.0% and recommendation form Stock
Broking firms 7.0 %.
The next objective is to assess the awareness of risk management in investment of
Generation Y. From the result in Table 16 it is know that 80.1 % of Generation Y
thinks that investing in stock Market is risky. The result in Table 17 shows that
62.8 % of Generation Y does not prefer to invest their money in shares of Bursa
Malaysia.
The next objective is to determine the effective channels of communication with
Generation Y. In terms of communication by word of mouths, Malaysian
Generation Y prefer to obtain information on saving and investments from their
parents & sibling 53.32% while 52.36% prefer to source information from
relative and friends. The results also shows 31.85% of the respondents prefer to
obtain information from Facebook and 25.55 % prefer to source for information
from websites and online portal. Even though this generation group are IT savvy
and prefer online resources, Malaysian Generation Y least prefer to obtain
resources from blog. The reasons to this are maybe they find that the information
from blogs is not viable and reliable, as the information is based on the blog writer
own knowledge
In terms of preferred channel of communication for banks to introduce their
investment schemes, Malaysian Generation Y has responded that they prefers to
receive this information on through emails 44.4 %, Newspapers 35.5%, Sales
Agents 31.5% and also through SMS 29.3%. Therefore the effective channels for
banks and financial institution to communicate with Malaysian Generation Y are
through online communication, such as Facebook, website portal, smart phone
mobile application and emails.
Banks and financial institution who are trying to attractive Malaysia Generation Y
customers need to introduce new offers suited to their needs. These include
innovative products and services, special interest rates, no fee transactions,
customized products. These banks must also show more interest in using the

�
�
Page 64 of 83�
social media communication channels which are preferred by this group such as
Facebook. The banks Facebook site can hosts pages on poll, savings tips, customer
feedback. They can also enhance their bank website to have a personalised budgeting
and financial planning application, where customer can view electronic
presentations on products, and carry out daily banking functions through online
with remote service specialists.
Another way is for banks to come up with an application for smart phone where it
provides customers with seamless access to their finances that combines rich
visualizations and contextual information to communicate the implications and
relationships among financial data. With this Generation Y can have direct control
of their money. The application should include features such as graphic indicator
of available fund, saving application that establishes rules around spending.
This study last objective is to make recommendation for appropriate
selling/marketing channel of investment linked products target Generation Y
based on the preferred channel selected from the survey. As stated above one of
the main purpose of saving of Malaysian Generation Y was for future investment
24.1 %, therefore banks and financial institution can come up with a saving and
investment schemes suitable for Generation Y. This saving and investment
schemes should be unique as they has their own approach to money and spending.
The marketing channel for this investment linked products should be through
social media communication channels.
As most of the Malaysian Generation Y do not have a diversify portfolio in
investment and they think investing their money in stock are risky. Financial
institutions may advice and market to Generation Y to invest in commodities like
gold. The value of gold has remained largely stable for decades therefor it will not
be a risky investment for them to start.
Most of Malaysian Generation Y is at the point of buying their first home/house.
Even though the government have created My First Home Schemes to help
�
�
Page 65 of 83�
Malaysian, this scheme does not help them to own their first home as there are
ineligible to get the loan from the bank. This because with their current income
and spending Generation Y are unable to make the monthly payment. Therefore
the government and the bank sector should relook into this and come up with a
more workable scheme that fit into Generation Y financial situation.
Lastly the key thing that bank and financial institutions as well as government
agency need to do is to creating and maintaining lifelong relationships with
Generation Y. The data shows that 65.5% of the respondents said that they are
willing to switch bank that will offer free Personal Financial Management. Banks
should have a free Personal Financial Management that caters to Generation Y
needs. Such as introducing them with the right financial services, educating them
long-term and helping them use these products and services to reach financial
independence. Generation Y is so different from their other generation group
therefore that banks and financial institutions must understand their needs, if they
want them as their customers. Banks will need to use an approach distinctly
different from anything that they have been familiar. The imperative is that as the
financial power of Generation Y expands its members will change how financial
transactions are conducted together with patterns of spending, saving and
investments in Malaysia.
5.3 Limitation of Study
The first limitation to this study is that there are few research done on the saving
spending and investment habit of Malaysian Generation Y therefore there is
limited comparison can be made in this research. The next limitation is the time
constraint that has retained this research to draw a larger sample size, with a larger
sample size and the result will be more accurate.
�
�
Page 66 of 83�
5.4 Conclusion and Implication for Further Research
The results analysis from this research project shall be of great interests of policy
makers such as government and businesses in providing appropriate products and
services in line with their consumption, spending, and investment behaviours.
Due to the limitations of this research, three recommendations are suggested for
the purpose of enhancing the study for further research.
Further studies may consider increasing the sample size as currently for this
research project only Malaysian Generation Y in major cities was only focused,
and Generation Y in Sabah, Sarawak and Perlis were left out. Therefore, the
findings of this study were unable to be generalizing to all populations of
Malaysian Generation Y group.
Beside that it is recommended that future research shall utilize broader
demographic profile of the generation Y respondents as this study was only
studying on generation Y working in major cities and did not consider those in
rural areas in Malaysia.
�
�
Page 67 of 83�
REFERENCES Alch, M. (2000). The Echo-Boom Generation- A growing force in America
Society . Futurist: 34(5) p. 42-47. Retrieve June 2011 from
http://www.msubillings.edu/casfaculty/mclaughlin/Psyx%20332/Documen
ts/THE%20ECHO.pdf
Asia Insurance Review, Volume II, Issue 18. Retrieve 11 April 2012 from
http://www.asiainsurancereview.com/pages/print2.asp?article_ID=13415
Craig A. Martin and L.W. Turley, (2004) Malls and consumption motivation: an
exploratory examination of older Generation Y consumers, International
Journal Retail Distribution Management 32 (10), pp. 464–475
Carrier, L., & Maurice, D. (1998). Beneath the Surface: the Psychological Side of
Spending Behaviors. Journal Of Financial Planning,11(1), 94-98
Creamer, Matthew. (2008) "Consumers curtail consumption." Advertising Age 6
Oct. 2008: 1-2. Retrieved from ProQuest.
Crutsinger, Martin (2009). "Americans getting increasingly frugal." The Daily
Gazette .Retrieved February 2012 from http://www.dailygazette.com/
Delafrooz, N & Laily Hj Paim (2011) Determinants of Saving Behavior and
Financial Problem among Employees in Malaysia. Australian Journal of
Basic and Applied Sciences, 5(7): 222-228, 2011
Carver, R. H., & Nash, J.G., (2009) Doing Data Analysis with SPSS: Version 14,
(3rd Edition): Cole Cengage Learning.
�
�
Page 68 of 83�
Constantine, G., (2010). “ Tapping Into Generation Y: Nine Ways Community
Financial Institutions Can Use Technology to Capture Young Customers” ,
A First Data White Paper April 2010. Retrived September 2011 from
http://www.firstdata.com/downloads/thought-leadership/geny_wp.pdf
Economic Planning Unit Malaysia (2010). Retrieved June 2011,from
http://www.epu.gov.my/html/themes/epu/epu/images/common/pdf/ec
Daniels, S. (2007) Gen Y Considerations for the Retail Industry. Retrieved
September 2011 from
http://www.buseco.monash.edu.au/centres/acrs/research/whitepapers/
generation-y.pdf
Generation Y-ers: Fearful of Wall Street and Not Saving for Retirement.
Retrieved January 2012 from http://www.fpanet.org/ToolsResources
/ArticlesBooksChecklists/
Articles/Investments/GenerationYersFearfulofWallStreet/
Geyzel, M.V., (2009). Working with Generation Y, Retrieved December 2011
from http://vangeyzel.com/2009/08/20/working-with-gen-y/
Hanas, J. (2006) Yankee Group: 12 Percent of U.S. Young Adults Are Totally
'Wireless' Retrieved June 2011 from
ttp://www.businesswire.com/news/home/20030805005056/ en/Twelve-
Percent-U.S.-Young-Adults-Totally-Wireless
Halstead, K & Marie., M.S. (2006). Socialization Agents Influencing Anglo and
Hispanic American Generation Y Females’ Apparel Consumption. 127 pp.
Retrieved December 2011 from http://libres.uncg.edu/ir/uncg/f/umi-uncg-
1094.pdf
Harved MIT Data Centre –Guide to SPSS (2009). Retrieved March 2012 from:
http://www.hmdc.harvard.edu/projects/SPSS_Tutorial/spsstut.shtml
�
�
Page 69 of 83�
Hilgert,M. A., & Hogarth J. M,(2003) Household Financial Management: The
Connection between Knowledge and Behavior, Federal Reserve Bulletin.
Retrieved September 2011 from http://www.federalreserve.gov/pubs/
bulletin/2003/0703lead.pdf
Javelin Strategy & Research (2011): Gen Y: How to Engage and Service the New
Mobile Generation, March 2011 Retrieved September 2011 from
https://www.javelinstrategy.com/uploads/1108FPM_GenYBrochure.pdf
Risi, K (2012) Gen Y: plenty of time to invest, but little appetite for risk.
Retrieved December 2011 from
http://www.vanguardblog.com/2012.01.13/
geny-plenty-of-time-to-invest-but-little-appetite-for-risk.html
Lodes, M.E., (2010) Are Generation Y(Millennial) Consumers Brand Loyal and is
Their Buying behaviour Affected In a Economic Recession? A preliminary
study. Retrived December 2011 from
http://www.siena.edu/uploadedfiles/home/ Academics/
Schools_and_Departments/School_of_Business/Lodes%20Marketing.pdf
Leong H. Y. (Thursday February 19, 2009) Survey: Malaysians not saving
enough, The Star Online. Retrieved: November, 2011 from
http://biz.thestar.com.my/ news/story.asp?file=/
2009/2/19/business/3295860&sec=business
Malaysia’ s Gen Y unplugged (2011). PricewaterhouseCopper. Retrieved from:
www.pce.com/en_MY/my/assets/publications/gen-y.pdfSimilar
Mara Der Hovanesian, (1999) Spending It, Investing It Coming On Strong: The
children of the baby boomers are affecting spending and investing as
significantly as their parents did; The similarity ends there Wall Street
Journal; New York; Nov 29. Retrieved June 2010 from
http://online.wsj.com/article/SB942785816835228037.html

�
�
Page 70 of 83�
Martin, C.A., (2005), ‘From high maintenance to high productivity : What
managers need to know about Generation Y’ , Emerald Group Publishing
Limited, 37(1), 39-44.
Martin, C.A., & Turley, L.W. (2004). Malls and consumption motivation: an
exploratory examination of older generation Y consumers. International
Journal of Retail & Distribution Management, 32(10): 464 – 475.
MFS Investing Sentiment Survey: Shift to Cash is Deliberate, Fundamental
Change for Investors. Retrived from: http://www.businesswire.com/
news/home/ 20110808006004/en/MFS-Investing-Sentiment-Survey-Shift-
Cash-Deliberate
Nowak, L., Thach, L & Olsen, J.E. (2006). Wowing the millennial: creating brand
equity inthe wine industry. Journal of Product & Brand Management,
15(5): 316-323.
Lunt, P. K., Livingstone, S.M., (1991 )Psychological, social and economic
determinants of saving: comparing recurrent and total savings, Journal of
Economic Psychology, Volume 12, Issue 4, December 1991, Pages 621-
641, ISSN 0167-4870, 10.1016/0167-4870(91)90003-C.Retrieved
February 2012 from http://www.sciencedirect.com/science/
article/pii/016748709190003C
Philip, F., Macaulay, J., & Ericsson, J. (2010). The Next Growth Opportunity for
Banks How the Post-Crisis Financial Needs of Younger Consumers Will
Transform Retail Banking Services. Retrieved from:
http://www.cisco.com/web/about/ac79/docs/fs/nextgrowthopportunityforb
anks.pdf
The Business Dictionary Retrieved: March 2012 from
http://www.businessdictionary.com/
�
�
Page 71 of 83�
Toh, B.H., Lim W.L & Cheng (2011) Generation y and choice of mobile service
provider: A study On their purchasing decisions in choosing a mobile
service provider. 2nd International Conference On Business And
Economic Research (2nd ICBER 2011) Proceeding. Retrieve December,
2011 form http://www.internationalconference. com.my/proceeding/
2ndicber2011_proceeding/226-2nd%20ICBER%
202011%20PG%201083-1101%20Generation%20Y.pdf
REST Wealth White Paper. (2011) Gen Y’ s Spending, Saving and Debt Choices :
Retrieved December 2012from http://www.rest.com.au/getdoc/7fdc04b9-
cf0e-4903-a194-3f2a7115f037/REST_GenY_Wealth_WhitePaper_FINAL
US Census Bureau (2009), “ International Data Base” , Retrieved May 2011 from http://www.census.gov/ipc/www/idb/groups.php
Visa Study: Majority of Baby Boomers and Echo Boomers Predict a Cashless
Society. San Francisco, August 27, 2007 Retrieved June 2010 from
http://www.businesswire. com/news/home/20070827005620/en/Majority-
Baby-Boomers-Echo-Boomers-Predict-Cashless
Wang, A (2011) Younger Generations’ Investing Behaviors in Mutual Funds:
Does Gender Matter?, The Journal Spring 2011 Of Wealth Management.
Wärneryd, K. (1989). On the Psychology of Saving: an Essay on Economic
Behavior. Journal of Economic Psychology, 10(4), 515. Retrieved
December 2011 from
http://www.siena.edu/uploadedfiles/home/Academics/Schools_and_Depart
ments/School_of_Business/Lodes%20Marketing.pdf
Wierzycka, M.(2009) Generation Y me? Retrieved June 12, 2011 from
http://www.moneyweb.co.za/mw/view/mw/en/page292681?oid=283560&
sn=2009+Detail&pid=292681
�
�
Page 72 of 83�
Wilson M. & Field K., (2007) “ Defining Gen Y,” Chain Store Age, March 2007,
35. Retrieved December 2011 from http://www.chainstoreage.com/
article/defining-gen-y
Williams & Page (2010) Marketing to the Generations, Journal of Behavioral
Studies in Business Retrieve December, 2011 from http://www.aabri.com/
manuscripts/10575.pdf
Zikmund, W.G. & Babin, B. 2007. Essentials of Marketing Research. Australia:
Thomson South-Western.

�
�
Page 73 of 83�
APPENDIX A: SURVEY QUESTIONNAIRE
Research Topic: Consumption, Spending and Investment Behavior of
Malaysia Generation Y Dear Sir / Madam, I would be thankful if you could participate in this survey by filling up this questionnaire. This questionnaire is conducted as part of a research project of Master of Business Administration from UTAR. Please be assured that all information will be treated with the strictest confidentiality and only the collective data will be analyzed. Thank you for your precious time in participating in the survey. Regards, Amirtha Sangeetha Ganesan Postgraduate Student, Universiti Tunku Abdul Rahman
SECTION 1 – Demographic Profile (Demografi)
1) Age (Umur) _________
2) Gender (Jantina)
Male (Lelaki) Female (Perempuan)
3) Marital Status (Status Perkahwinan)
Single (Bujang) Married (Berkahwin)
4) Race (Kaum) 1. Malay 2.Chinese 3. Indian 4. Other (Lain-lain)_____
5) Which state are you currently working at? Di negeri manakah anda sedang bekerja ?
Wilayah Persekutuan KL Sabah Selangor Sarawak Perak Johor Kelantan Terengganu Perlis Pulau Penang Pahang Melaka Kedah Negeri Sembilan
� � � �

�
�
Page 74 of 83�
6) What is your highest education attained? Apakah pendidikan tertinggi yang anda perolehi?
7) What is your employment status?
Apakah status perkerjaan anda?
Employee of Private Sector (Pekerja Swasta) Government Employee (Kakitangan Kerajaan) Self-Employed (Bekerja sendiri) Employer (Majikan) Housewife (Surirumah) Others, please specify
____________ Lain lain _______________________
8) Please indicate your current working position? Sila nyatakan jawatan perkerjaan semasa anda?
Junior Executive (Eksekutif Junior) Senior Executive (Eksekutif Senior) Managerial (Pengurus) Top Management (Pengurus atasan) Others, please specify
___________ Lain lain _______________________
9) Please indicate your Annual Income?
Sila nyatakan pendapadatan tahunan anda?
< RM 12,000 RM 12,001 – RM 24,000 RM 24,001 – RM 36,000 RM 36,001 – RM 48,000 RM48, 000 – RM 60,000 > RM60,000
No Schooling (Tidak bersekolah)
Primary (Sek Rendah-UPSR)
Lower Secondary (Sek Men. PMR)
Secondary (Sek Men. - SPM)
STPM/Pre-University (STPM/Pre-U)
Diploma/Vocational/Technical (Diploma)
Degree (Ijazah Muda)
Master/PhD (Pasca graduan)
Other, please specify (Lain-lain, sila nyatakan) :_____________________

�
�
Page 75 of 83�
SECTION 2 – Information Sources (Sumber Informasi)
10) Please select on the following information sources that you prefer to
obtain INFORMATION ON SAVING & INVESTMENT.
Sila pilih pada sumber-sumber maklumat yang berikut yang anda gemar gunakan untuk mendapatkan maklumat mengenai Penjimatan & Pelaburan. Please mark your answer with a "���� ", there can be more than one answer
Relatives & Friends (Saudara mara & rakan-rakan)
Parents & Sibling (Ibubapa & Adik-beradik) Books & Magazine (Buku & Majalah) Newspaper (Suratkhabar) Brochure & Catalogue (Risalah & Katalog) Blog/Facebook (Blog/Facebook) Websites/On-line Portal (Laman web) Radio (Radio) Television (Televisyen) Seminar/Talks (Seminar/Ceramah)
SECTION 3 –Spending & Saving Patterns (Corak Perbelanjaan dan Simpanan)
11) Percentage (%) of MONTHLY income that being SAVED (excluding
EPF)? _____________
Berapa peratus (%) daripada pendapatan BULANAN yang sedang disimpan
(tidak termasuk KWSP)? _________________
Your saving channels (Cara Simpanan Anda ) : There can be more than one (Boleh pilih lebih daripada satu)
Unit Trust (Tabung Amanah) Saving Accounts (Akaun Simpanan Semasa) Fixed Deposit (Akaun Simpanan Tetap) Shares/Security (Saham/Securiti) Investment linked Insurance
Policy (Polisi Insuran Pelaburan)
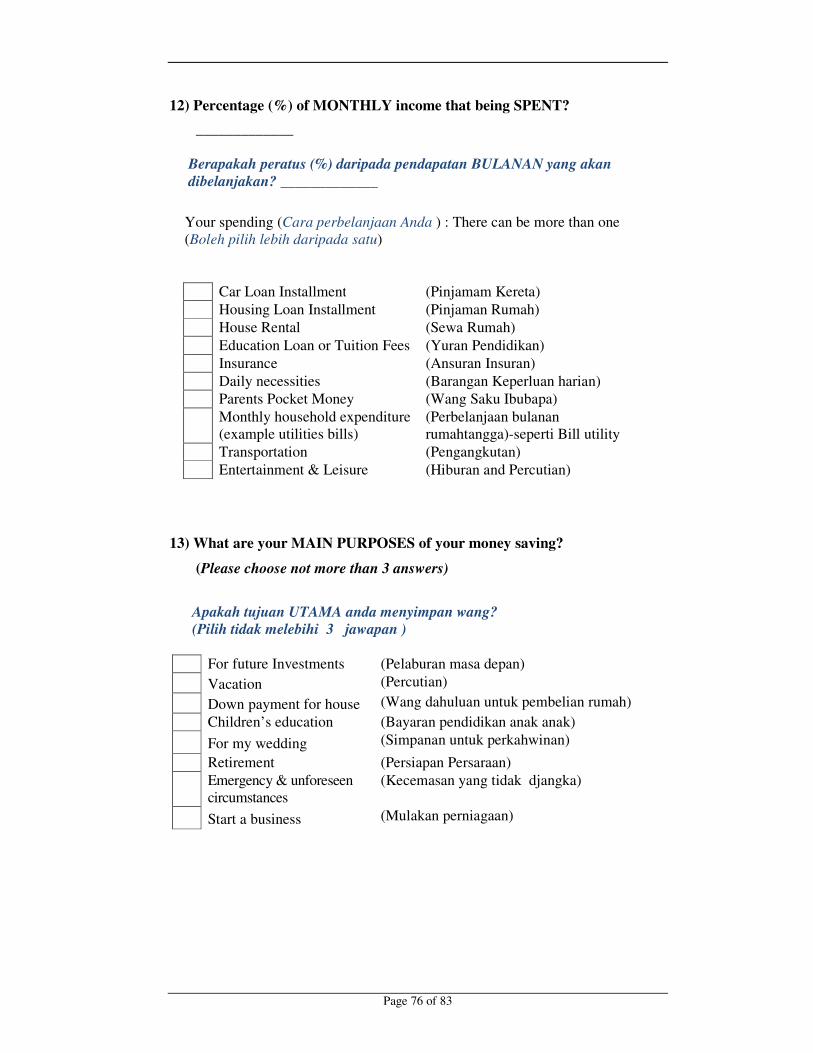
�
�
Page 76 of 83�
12) Percentage (%) of MONTHLY income that being SPENT? _____________ Berapakah peratus (%) daripada pendapatan BULANAN yang akan dibelanjakan? _____________
Your spending (Cara perbelanjaan Anda ) : There can be more than one (Boleh pilih lebih daripada satu)
Car Loan Installment (Pinjamam Kereta) Housing Loan Installment (Pinjaman Rumah) House Rental (Sewa Rumah) Education Loan or Tuition Fees (Yuran Pendidikan) Insurance (Ansuran Insuran) Daily necessities (Barangan Keperluan harian) Parents Pocket Money (Wang Saku Ibubapa) Monthly household expenditure
(example utilities bills) (Perbelanjaan bulanan rumahtangga)-seperti Bill utility
Transportation (Pengangkutan) Entertainment & Leisure (Hiburan and Percutian)
13) What are your MAIN PURPOSES of your money saving?
(Please choose not more than 3 answers)
Apakah tujuan UTAMA anda menyimpan wang? (Pilih tidak melebihi 3 jawapan )
For future Investments (Pelaburan masa depan) Vacation (Percutian) Down payment for house (Wang dahuluan untuk pembelian rumah) Children’ s education (Bayaran pendidikan anak anak) For my wedding (Simpanan untuk perkahwinan)
Retirement (Persiapan Persaraan) Emergency & unforeseen
circumstances (Kecemasan yang tidak djangka)
Start a business (Mulakan perniagaan)
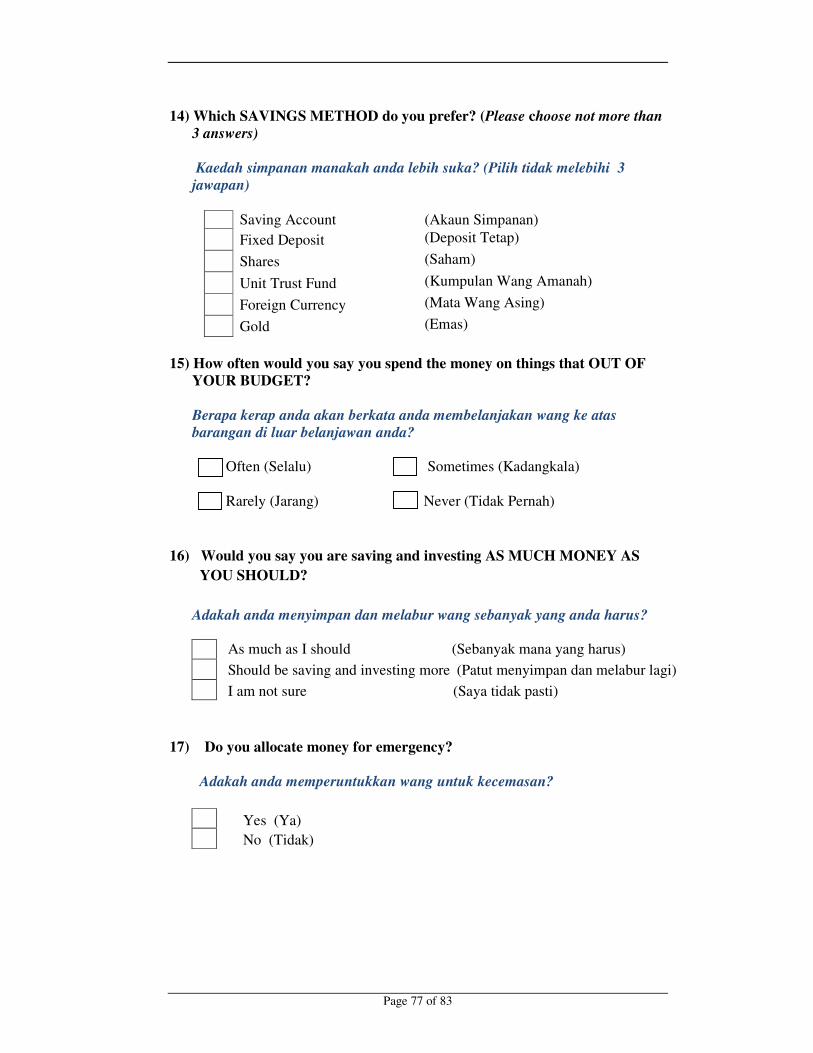
�
�
Page 77 of 83�
14) Which SAVINGS METHOD do you prefer? (Please choose not more than 3 answers) Kaedah simpanan manakah anda lebih suka? (Pilih tidak melebihi 3 jawapan)
Saving Account (Akaun Simpanan) Fixed Deposit (Deposit Tetap) Shares (Saham) Unit Trust Fund (Kumpulan Wang Amanah) Foreign Currency (Mata Wang Asing) Gold (Emas)
15) How often would you say you spend the money on things that OUT OF YOUR BUDGET? Berapa kerap anda akan berkata anda membelanjakan wang ke atas barangan di luar belanjawan anda? Often (Selalu) Sometimes (Kadangkala) Rarely (Jarang) Never (Tidak Pernah)
16) Would you say you are saving and investing AS MUCH MONEY AS YOU SHOULD? Adakah anda menyimpan dan melabur wang sebanyak yang anda harus?
As much as I should (Sebanyak mana yang harus) Should be saving and investing more (Patut menyimpan dan melabur lagi) I am not sure (Saya tidak pasti)
17) Do you allocate money for emergency? Adakah anda memperuntukkan wang untuk kecemasan?
Yes (Ya) No (Tidak)
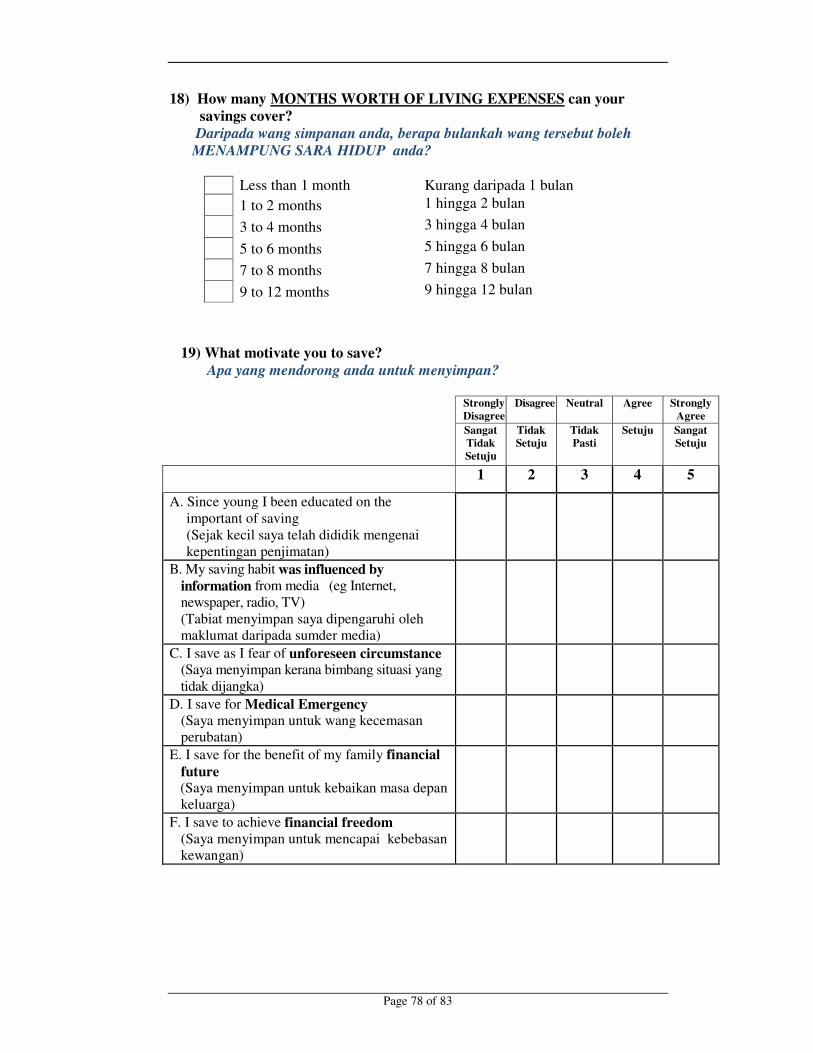
�
�
Page 78 of 83�
18) How many MONTHS WORTH OF LIVING EXPENSES can your savings cover? Daripada wang simpanan anda, berapa bulankah wang tersebut boleh MENAMPUNG SARA HIDUP anda?
Less than 1 month Kurang daripada 1 bulan 1 to 2 months 1 hingga 2 bulan 3 to 4 months 3 hingga 4 bulan 5 to 6 months 5 hingga 6 bulan 7 to 8 months 7 hingga 8 bulan 9 to 12 months 9 hingga 12 bulan
19) What motivate you to save? Apa yang mendorong anda untuk menyimpan?
Strongly Disagree
Disagree Neutral Agree Strongly Agree
Sangat Tidak Setuju
Tidak Setuju
Tidak Pasti
Setuju
Sangat Setuju
1 2 3 4 5
A. Since young I been educated on the important of saving (Sejak kecil saya telah dididik mengenai kepentingan penjimatan)
B. My saving habit was influenced by information from media (eg Internet, newspaper, radio, TV) (Tabiat menyimpan saya dipengaruhi oleh maklumat daripada sumder media)
C. I save as I fear of unforeseen circumstance (Saya menyimpan kerana bimbang situasi yang tidak dijangka)
D. I save for Medical Emergency (Saya menyimpan untuk wang kecemasan perubatan)
E. I save for the benefit of my family financial future
(Saya menyimpan untuk kebaikan masa depan keluarga)
F. I save to achieve financial freedom (Saya menyimpan untuk mencapai kebebasan kewangan)

�
�
Page 79 of 83�
20) What are the steps to ensure saving is done? Apakah langkah-langkah untuk memastikan simpanan dilakukan?
Strongly Disagree
Disagree Neutral Agree Strongly Agree
1 2 3 4 5
A. I always follow a monthly budget (Saya sentiasa mematuhi belanjawan bulanan)
B. I prepare a list of required items ahead of time before shopping (Saya menyediakan senarai Barangan yang diperlukan terlebih dahulu sebelum membeli-belah)
C. I assure that I purchased item which are reasonable price (Saya memastikan bahawa saya membeli barangan yang berpatutan harga)
D. I do not spend on item which I do not required (Saya tidak berbelanja atas barangan yang tidak diperlukan)
E. I always bring small amount of cash to prevent impulse (Saya selalu membawa jumlah wang yang kecil untuk mengelakkan perbelanjaan spontan)
21) What are the reasons that hinder you from saving money? Apakah sebab-sebab yang menghalang anda daripada menyimpan wang? Low Income (Pendapatan rendah/tidak mencukupi) Too many fixed expenditures (Terlalu banyak perbelanjaan tetap) Low interest rate (Kadar faedah yang rendah) Lack of knowledge on how to save (Kurang pengetahuan tentang bagaimana
untuk menjimatkan) I would rather spend and enjoy the
best now, and worry about saving when I’ m much older
(Saya lebih suka membelanja dan menikmati yang terbaik sekarang dan berfikir tentang simpanan kemudiannya)
Others, please specify ____________ Lain lain ______________________
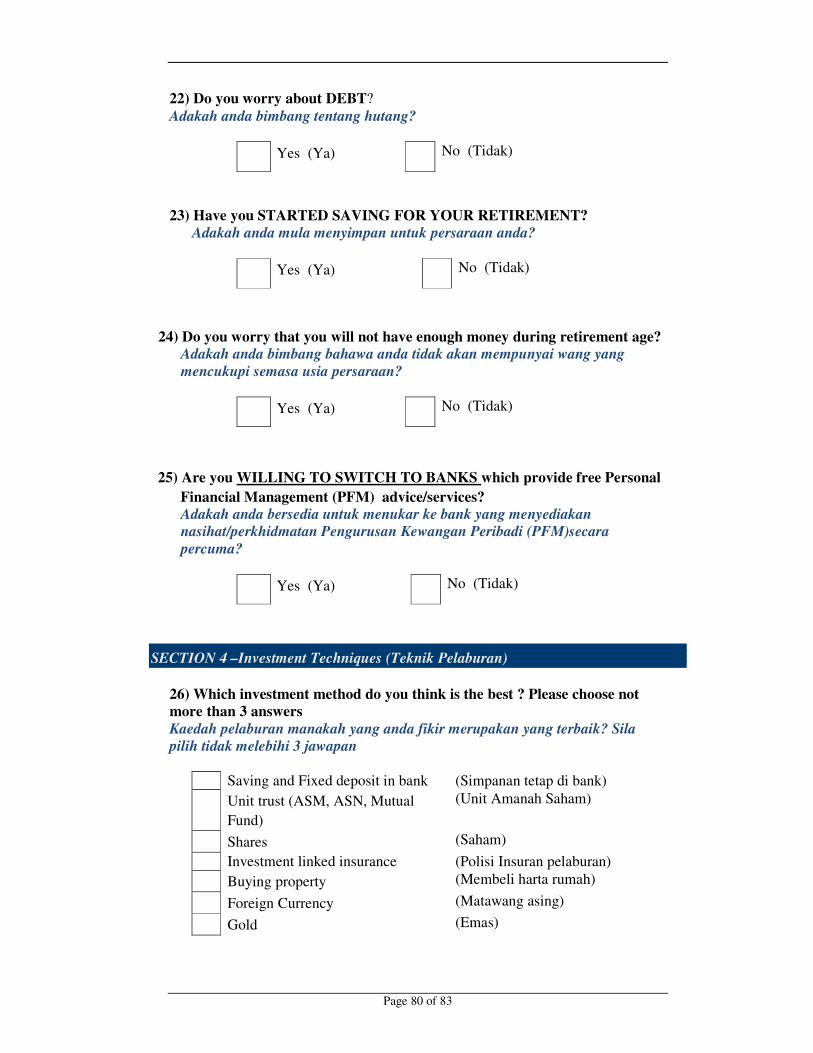
�
�
Page 80 of 83�
22) Do you worry about DEBT? Adakah anda bimbang tentang hutang?
Yes (Ya) No (Tidak)
23) Have you STARTED SAVING FOR YOUR RETIREMENT? Adakah anda mula menyimpan untuk persaraan anda?
Yes (Ya) No (Tidak)
24) Do you worry that you will not have enough money during retirement age?
Adakah anda bimbang bahawa anda tidak akan mempunyai wang yang mencukupi semasa usia persaraan?
Yes (Ya) No (Tidak)
25) Are you WILLING TO SWITCH TO BANKS which provide free Personal Financial Management (PFM) advice/services?
Adakah anda bersedia untuk menukar ke bank yang menyediakan nasihat/perkhidmatan Pengurusan Kewangan Peribadi (PFM)secara percuma?
Yes (Ya) No (Tidak)
SECTION 4 –Investment Techniques (Teknik Pelaburan) 26) Which investment method do you think is the best ? Please choose not more than 3 answers Kaedah pelaburan manakah yang anda fikir merupakan yang terbaik? Sila pilih tidak melebihi 3 jawapan
Saving and Fixed deposit in bank (Simpanan tetap di bank) Unit trust (ASM, ASN, Mutual
Fund) (Unit Amanah Saham)
Shares (Saham) Investment linked insurance (Polisi Insuran pelaburan) Buying property (Membeli harta rumah) Foreign Currency (Matawang asing) Gold (Emas)

�
�
Page 81 of 83�
27) Do you have a DIVERSIFY PORTFOLIO in your investment? Adakah anda mempelbagaikan potfolio pelaburan anda?
Yes (Ya) No (Tidak)
28) When purchasing Share(s) which methods do you prefer? Apakah cara yang anda pilih untuk pembelian saham?
Online trading (Dagangan secara online) Go through remisier (Melalui ‘Wakil Saham’ ) Go through 3rd party (Melalui pihak orang lain)
29) When purchasing Unit Trust, which method do you prefer? Apakah cara yang anda pilih untuk pembelian unit amanah saham?
Sales agent (Agen Jualan) Directly from bank (Melalui bank) Directly from Unit Trust
companies (Syarikat unit amanah saham)
Online (exp: Fundsupermart.com)
(Online seperti Fundsupermart.com)
30) Which type of Unit Trust would you choose? Please choose not more than 3 answers. Apakah jenis unit amanah yang dipilih oleh anda? Sila pilih tidak melebihi 3 jawapan
Growth Fund (Tabung Pertumbuhan) Balance Fund (Tabung Seimbang) Capital Guaranteed Fund (Tabung Jaminan Kapital) 100% bond Fund (Tabuang Bon 100%) Equity Trust Funds (ETF) (Tabungan Amanah Ekuiti)
31) From whom you will seek for INVESTMENT ADVICES? Please choose not more than 3 answers Siapakah yang anda akan mendapatkan nasihan tentang pelaburan ? Sila pilih tidak melebihi 3 jawapan
Friends (Rakan-rakan) Family Members (Ahli Keluarga) Sales agent (Agen Jualan) Banks (Bank) Unit trust companies (Syarikat Unit Amanah Saham) Stock Brokering Firm (Broker saham) Online resources such as blogs
and forum (Komuniti Online)
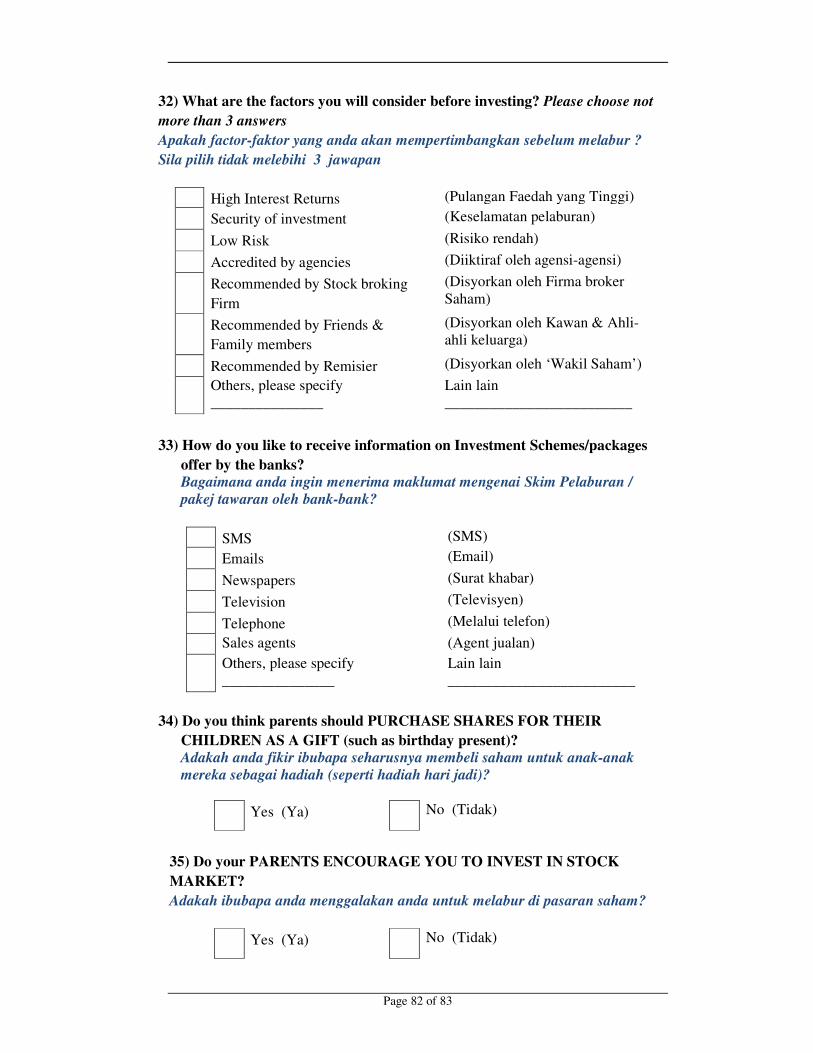
�
�
Page 82 of 83�
32) What are the factors you will consider before investing? Please choose not more than 3 answers Apakah factor-faktor yang anda akan mempertimbangkan sebelum melabur ? Sila pilih tidak melebihi 3 jawapan
High Interest Returns (Pulangan Faedah yang Tinggi) Security of investment (Keselamatan pelaburan) Low Risk (Risiko rendah) Accredited by agencies (Diiktiraf oleh agensi-agensi) Recommended by Stock broking
Firm (Disyorkan oleh Firma broker Saham)
Recommended by Friends & Family members
(Disyorkan oleh Kawan & Ahli-ahli keluarga)
Recommended by Remisier (Disyorkan oleh ‘Wakil Saham’ ) Others, please specify
_______________ Lain lain _________________________
33) How do you like to receive information on Investment Schemes/packages offer by the banks?
Bagaimana anda ingin menerima maklumat mengenai Skim Pelaburan / pakej tawaran oleh bank-bank?
SMS (SMS) Emails (Email) Newspapers (Surat khabar) Television (Televisyen) Telephone (Melalui telefon) Sales agents (Agent jualan) Others, please specify
_______________ Lain lain _________________________
34) Do you think parents should PURCHASE SHARES FOR THEIR CHILDREN AS A GIFT (such as birthday present)?
Adakah anda fikir ibubapa seharusnya membeli saham untuk anak-anak mereka sebagai hadiah (seperti hadiah hari jadi)?
Yes (Ya) No (Tidak)
35) Do your PARENTS ENCOURAGE YOU TO INVEST IN STOCK MARKET? Adakah ibubapa anda menggalakan anda untuk melabur di pasaran saham?
Yes (Ya) No (Tidak)
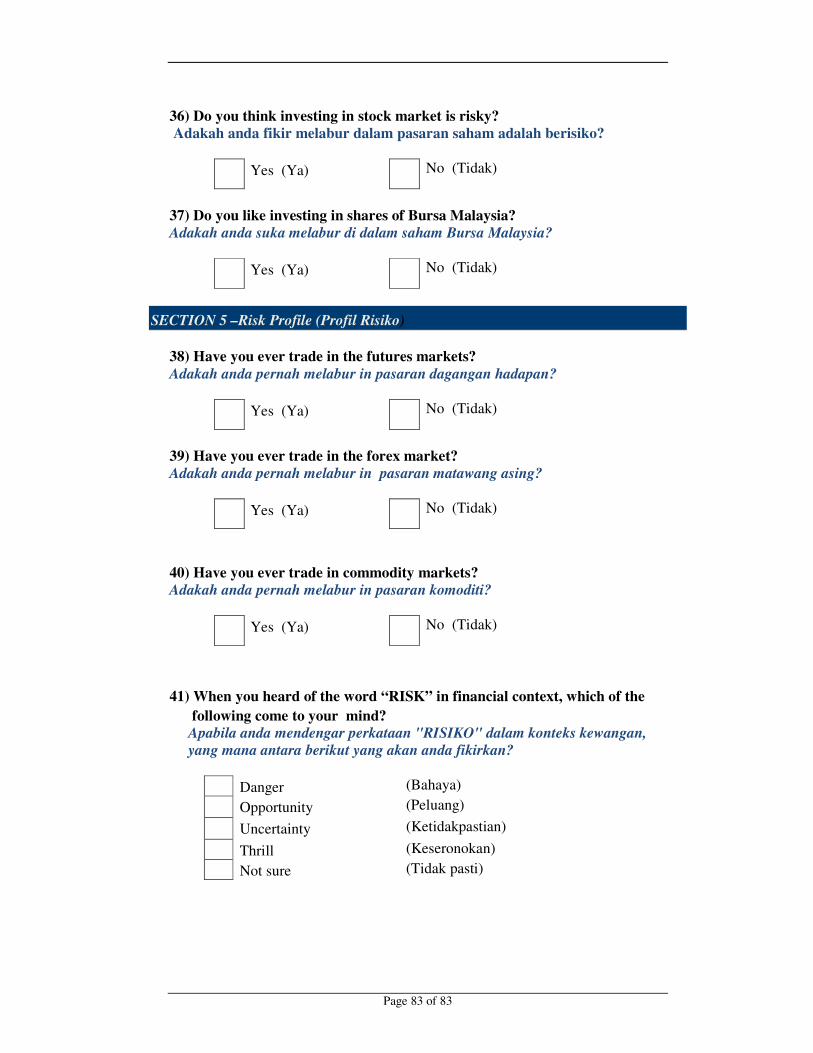
�
�
Page 83 of 83�
36) Do you think investing in stock market is risky? Adakah anda fikir melabur dalam pasaran saham adalah berisiko?
Yes (Ya) No (Tidak)
37) Do you like investing in shares of Bursa Malaysia? Adakah anda suka melabur di dalam saham Bursa Malaysia?
Yes (Ya) No (Tidak)
SECTION 5 –Risk Profile (Profil Risiko)
38) Have you ever trade in the futures markets? Adakah anda pernah melabur in pasaran dagangan hadapan?
Yes (Ya) No (Tidak)
39) Have you ever trade in the forex market? Adakah anda pernah melabur in pasaran matawang asing?
Yes (Ya) No (Tidak)
40) Have you ever trade in commodity markets? Adakah anda pernah melabur in pasaran komoditi?
Yes (Ya) No (Tidak)
41) When you heard of the word “RISK” in financial context, which of the following come to your mind? Apabila anda mendengar perkataan "RISIKO" dalam konteks kewangan, yang mana antara berikut yang akan anda fikirkan?
Danger (Bahaya) Opportunity (Peluang) Uncertainty (Ketidakpastian) Thrill (Keseronokan) Not sure (Tidak pasti)
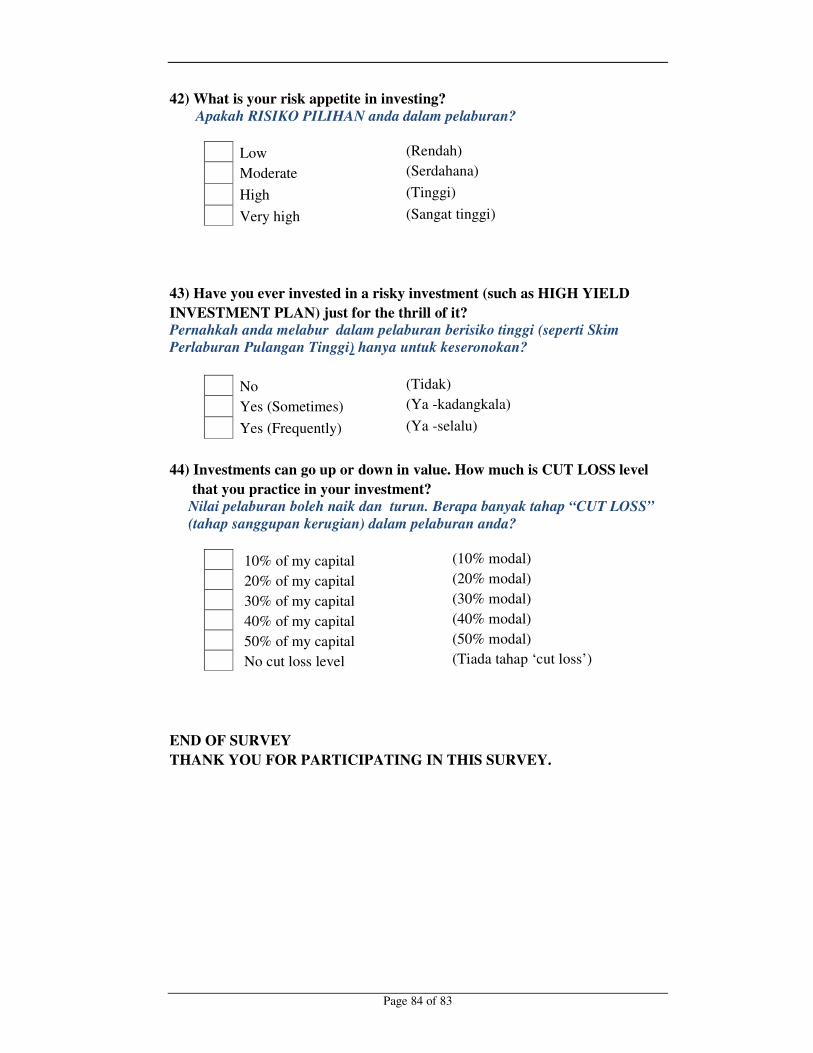
�
�
Page 84 of 83�
42) What is your risk appetite in investing? Apakah RISIKO PILIHAN anda dalam pelaburan?
Low (Rendah) Moderate (Serdahana) High (Tinggi) Very high (Sangat tinggi)
43) Have you ever invested in a risky investment (such as HIGH YIELD INVESTMENT PLAN) just for the thrill of it? Pernahkah anda melabur dalam pelaburan berisiko tinggi (seperti Skim Perlaburan Pulangan Tinggi) hanya untuk keseronokan?
No (Tidak) Yes (Sometimes) (Ya -kadangkala) Yes (Frequently) (Ya -selalu)
44) Investments can go up or down in value. How much is CUT LOSS level that you practice in your investment? Nilai pelaburan boleh naik dan turun. Berapa banyak tahap “CUT LOSS” (tahap sanggupan kerugian) dalam pelaburan anda?
10% of my capital (10% modal) 20% of my capital (20% modal) 30% of my capital (30% modal) 40% of my capital (40% modal) 50% of my capital (50% modal) No cut loss level (Tiada tahap ‘cut loss’ )
END OF SURVEY THANK YOU FOR PARTICIPATING IN THIS SURVEY. �
�
�
�
�
�


![[XLS] IEPF... · Web viewH-A 323 DIVAKARA VILASA "",NAVAL PATTU HOUSING COLONY,TIRUCHIRAPALLI MADRAS, 620016 FOLIONS00001 AMIRTHA GANASAN 8/1,KAJAMALAI HOUSING UNIT,TIRUCHIRAPPALLI,TIRUPUR,](https://img.pdfslide.us/doc/110x75/5accefc77f8b9a6a678ce3f8/xls-iepfweb-viewh-a-323-divakara-vilasa-naval-pattu-housing-colonytiruchirapalli.jpg)