Embed Size (px)
Citation preview

NiklasGökeConsumerBehaviorResearchMethodsChairofMarketingTechnicalUniversityofMunichReviewer:Dipl.-Psych.ArminGranulo,B.Sc.
Submittedon:30.01.2017
ConsumptionofEnergyDrinksAStatisticalAnalysisofConsumerBehavior

Index
1.Introduction 3
2.QuestionnaireaboutEnergyDrinks 4
3.QuestionnaireAnalysis 121.Mainmistakesofpreviousquestionnaire&improvements 122.ScreeningQuestion 123.FactorAnalysisQuestions 124.ClusterAnalysisQuestions 13
4.FrequencyAnalysis 141.Question3:Amountofconsumption 142.Question4:Occasionsforconsumingenergydrinks 153.Question9:Appropriateprice 184.Mean,Median,Modeandothermeasuresofcentraltendency 21
5.DescriptiveAnalysis 221.Question9:Appropriateprice 222.Question15:Intensityofbrandchanging 223.Question20.1:SatisfactionwithDrink1 24
6.ContingencyTables 281.Question7&29:Sexvs.PerceivedEffectiveness 291.Question1&29:Sexvs.ScreeningQuestion 30
7.InferentialStatistics-ComparingSampleParameterstoSpecificValues 321.OneSampleTests 33
1.Question10.2:Istheaverageimportanceof"Brand"equalto4.5? 332.Question10.1:Istheaverageimportanceof"Benefits"equalto7? 343.Question29:Istheproportionofmeninthesampleequalto50%? 35
2.IndependentandRelatedSampleTests 371.Question20.1&29:Arewomenjustassatisfiedwiththeirnumber1energydrinkasmen?372.Question20.1&20.2:Arepeoplemoresatisfiedwiththeirnumber1energydrinkthantheirnumber2energydrink? 383.Question10.2&33:Dopeoplewithadifferenteducationlevelputadifferentaverageimportanceontheattribute"brand?" 394.Question29&33:Istheeducationofrespondentsdistributedequallyacrossgenders? 405.Question29&33:DomoremenhaveaMaster'sdegreethanwomen? 426.Question20.1&20.1:Isthereacorrelationbetweensatisfactionwithdrink1andsatisfactionwithdrink2? 447.Question18.1&9:Isthereacorrelationbetweendrink1providingtheintendedbenefitsandwhatpriceisconsideredappropriate? 45
8.FactorAnalysis-PrincipalComponents,VarimaxRotation 461.Kaiser-Meyer-Olkincriterion&Bartlett'stest 462.NumberofextractedfactorsbasedonScreeplotandEigenvalues 483.Question,forwhichthehighestproportionoftotalvarianceisexplained 494.Factorloadingandchosenfactorof"brand" 505.Analysisandinterpretationofextractedfactors 51
9.Conclusion 54

1.IntroductionThisreportaggregatestheresultsandanalysesofthequantitativeresearchprojectforthecourse"ConsumerBehaviorResearchMethods"attheChairofMarketingoftheTechnicalUniversityofMunichintheFallTermof2016/2017.First,aquestionnairewasdesignedaimingtoinvestigatetheconsumptionbehaviorconsumersexhibitregardingenergydrinks.Second,saidquestionnairewasusedtoacquiredatafromasampleusingnon-probabilityconveniencesampling(basedonavailabilityofparticipants).Third,thedatawasaccumulatedacrossclassparticipants,formatted,andthenanalyzedasawhole.TheanalyseswereconductedwithSPSS.Performedanalysesincludefrequencymeasures,descriptivestatistics,contingencytables,comparingsampleparameterstoestimatepopulationvaluesandafactoranalysis.Totalsamplesizewasn=795.Analysiswillonlybeconductedforvalidresponsesinalltasks.Alltestswillbeconductedata5%significancelevel,unlessstatedotherwise.IdentifiersoffiguresfromSPSSoutputsareinGerman,butallfiguresarelabeledinEnglish(consistentnumberingthroughoutthereport).

2.QuestionnaireaboutEnergyDrinksThissurveyattemptstocollectinformationabouttheconsumptionofenergydrinks.Byparticipatinginthissurvey,youhelpustounderstandhowandwhyenergydrinksareconsumed.Asweareinterestedinyourhonestopinion,therearenorightorwronganswers.Participationinthisresearchstudyiscompletelyvoluntary.Youhavetherighttowithdrawatanytimeorrefusetoparticipateentirely.Alldataobtainedfromparticipantswillbekeptconfidentialandwillonlybereportedinanaggregateformat(byreportingonlycombinedresultsandneverreportingindividualones).Ifyouhavequestionsregardingthisstudy,youmaysendanemailtoniklas.goeke@tum.deIhavereadtheinformationaboveandherebygivemyinformedconsentparticipatinginthisstudy.
Yes No

1) Doyouconsumeenergydrinks?
Ο YES Ο NOà(Ifyouansweris“No”,pleasegotoquestion24)
2) Howdidyougettoknowenergydrinks?
Ο Friends/Family Ο Web/Socialnetworks Ο Events
Ο Promotion Ο Advertising/Sponsorships Ο Other:___________
3) Howoftendoyouconsumeenergydrinks?(justoneanswer)
Ο Manytimesaday Ο Onceaday Ο Manytimesaweek
Ο Onceaweek Ο Manytimesamonth Ο Onceamonth
Ο Seldom
4) Inwhichoccasion(s)doyouconsumeenergydrinks?(moreanswersareallowed)
Ο Inthedisco Ο Beforeaneveningout Ο Todrive
Ο Whenyouarethirsty Ο Todosport Ο Tostudy
Ο Other:____________
5) Whydoyouconsumeenergydrinks?(moreanswersareallowed)
Ο Moreconcentration Ο Goodfeeling
Ο Quickerreaction Ο Quenchyourthirst
Ο Betterperformance Ο Taste
Ο Moreenergy Ο Trend
Ο Other1:__________________ Ο Other2:_________________
6) Ifyouconsumeenergydrinks,doyouobservethebenefitsyouwantedtoget?
Ο Always Ο Often Ο Sometimes Ο Never
7) Whatdoyouthinkabouttheeffectivenessofenergydrinks?
Ο Theyareeffective Ο Itisjustapsychologicalmatter Ο Theydonotwork

8) Wheredoyoubuyenergydrinks?(moreanswersareallowed)
Ο Supermarket Ο Discount Ο Bar/Pub
Ο Vendingmachine Ο Disco Ο Servicestation
Ο Other:______________
9) Whatdoyouthinkisanappropriatepriceforacanatthesupermarket?
Ο Lessthan0.50€ Ο Between0.50€and1€Ο Between1€and1.50€
Ο Between1.50€and2€ Ο Morethan2€
10) Ifyouconsumeenergydrinks,whichIMPORTANCEdothefollowingATTRIBUTEShavein
yourchoice?
(giveanevaluationfrom1to9where1=lessand9=alot)
Less Sufficiently Alot
1 2 3 4 5 6 7 8 9
ItprovidesthebenefitsIwanted
Thebrandisknown
Packaging
Availability
Price
Varietyofproducts
Taste
Healthiness
Sparkling
Freshness
Colorofthebeverage
Calories
Easinesstodigest
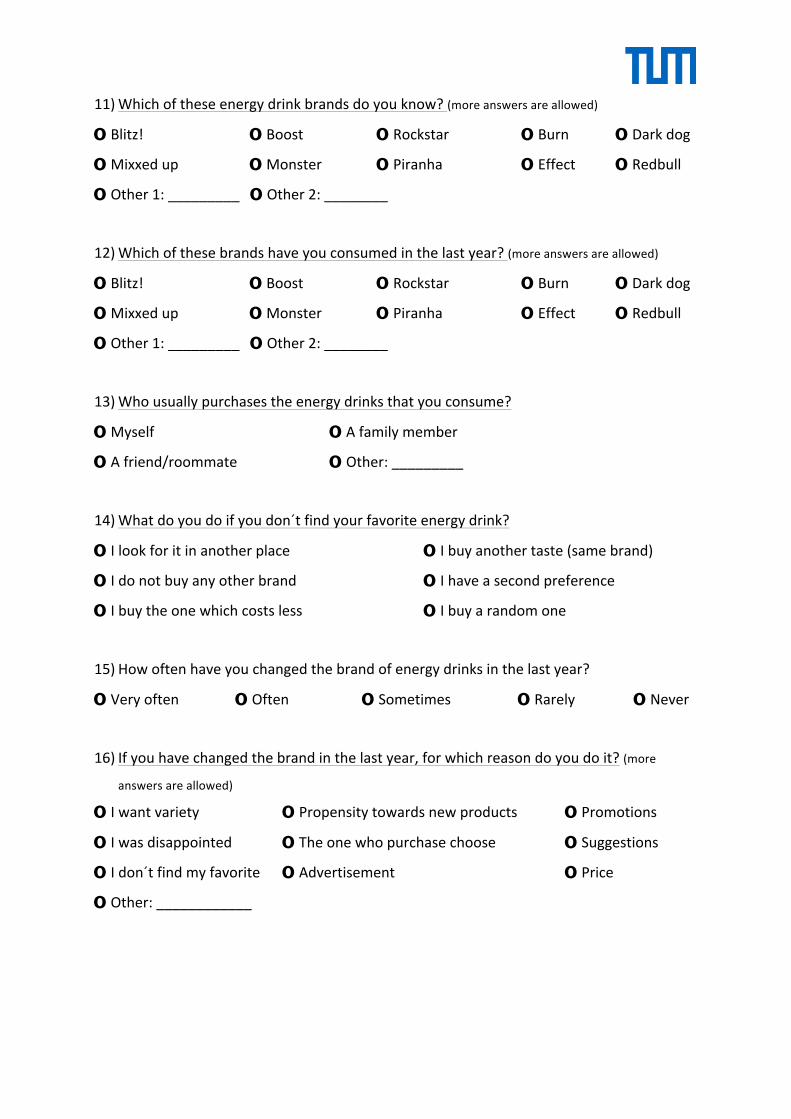
11) Whichoftheseenergydrinkbrandsdoyouknow?(moreanswersareallowed)
Ο Blitz! Ο Boost Ο Rockstar Ο Burn Ο Darkdog
Ο Mixxedup Ο Monster Ο Piranha Ο Effect Ο Redbull
Ο Other1:_________Ο Other2:________
12) Whichofthesebrandshaveyouconsumedinthelastyear?(moreanswersareallowed)
Ο Blitz! Ο Boost Ο Rockstar Ο Burn Ο Darkdog
Ο Mixxedup Ο Monster Ο Piranha Ο Effect Ο Redbull
Ο Other1:_________Ο Other2:________
13) Whousuallypurchasestheenergydrinksthatyouconsume?
Ο Myself Ο Afamilymember
Ο Afriend/roommate Ο Other:_________
14) Whatdoyoudoifyoudon´tfindyourfavoriteenergydrink?
Ο Ilookforitinanotherplace Ο Ibuyanothertaste(samebrand)
Ο Idonotbuyanyotherbrand Ο Ihaveasecondpreference
Ο Ibuytheonewhichcostsless Ο Ibuyarandomone
15) Howoftenhaveyouchangedthebrandofenergydrinksinthelastyear?
Ο Veryoften Ο Often Ο Sometimes Ο Rarely Ο Never
16) Ifyouhavechangedthebrandinthelastyear,forwhichreasondoyoudoit?(more
answersareallowed)
Ο Iwantvariety Ο Propensitytowardsnewproducts Ο Promotions
Ο Iwasdisappointed Ο Theonewhopurchasechoose Ο Suggestions
Ο Idon´tfindmyfavorite Ο Advertisement Ο Price
Ο Other:____________

17) Whichtwoenergydrinksdoyoumainlyconsume?
Drink1:__________________
Drink2:__________________
18) WITHREFERENCETOTHEBRANDofDRINK1THATYOUUSUALLYCONSUME(question
17),howimportantarethefollowingattributes?
Drink1:__________________
Less Sufficiently Alot
1 2 3 4 5 6 7 8 9
ItprovidesthebenefitsIwanted
Thebrandisknown
Packaging
Availability
Price
Varietyofproducts
Taste
Healthiness
Sparkling
Freshness
Colorofthebeverage
Calories
Easinesstodigest
Doyouhaveanyothercomments?
___________________________________________________________________________
___________________________________________________________________________
_________________________________________________________________________

19) WITHREFERENCETOTHEBRANDofDRINK2THATYOUUSUALLYCONSUME(question
17),howimportantarethefollowingattributes?
Drink2:__________________
Less Sufficiently Alot
1 2 3 4 5 6 7 8 9
ItprovidesthebenefitsIwanted
Thebrandisknown
Packaging
Availability
Price
Varietyofproducts
Taste
Healthiness
Sparkling
Freshness
Colorofthebeverage
Calories
Easinesstodigest
Doyouhaveanyothercomments?
___________________________________________________________________________
___________________________________________________________________________
___________________________________________________________________________
20) Ingeneral,howyousatisfiedareyouwiththedrinksthatyouconsume?
Drink1 Notatall Alot
1 2 3 4 5 6 7 8 9
Drink2 Notatall Alot
1 2 3 4 5 6 7 8 9

Doyouthinkthattheenergydrinksareharmfulforthehealth?Ifyouyouransweris“No”,
pleasecontinuewithquestion23
21) ΟYES ΟNO ΟIdonotknow
22) Ifyes,inwhichcircumstances?(moreanswersareallowed)
Ο Ifexcessivelyconsumed Ο Ifconsumedwithmedicines
Ο Ifconsumedwithalcoholicdrinks Ο Ifconsumedwithsmoke
Ο Other:____________________
23) Ifyes,whichproblemsdoyouthinktheycancause?(moreanswersareallowed)
Ο Irritability Ο Insomnia Ο Gastrointestinaldisturbs
Ο Hypertension Ο Tachycardia Ο Other:______________
24) Whichchange(s)orinnovation(s)wouldyouintroducetotheindustry/yourfavorite
brand?(moreanswersareallowed)
Ο Moreadvertisement Ο Moretastes/variations Ο Resalablepackage
Ο Bottleof½liter Ο Canof0.33cl Ο Morepromotions
Ο Lesssparklingdrinks Ο Moreinfoontheingredients Ο Other:______________
PERSONALINFORMATION
Sex: Ο Male Ο Female
Yearofbirth:__________
Nationality:_________
Areyoucurrently:Ο AstudentΟ Full-timeemployedΟ Part-timeemployedΟ Other
Whatisthehighestdegreeofeducationyouhavecompleted?
Ο High-SchoolΟ Bachelor´sdegreeΟ Master´sdegree
Hobby:Ο travelΟ TechnologyΟ Cooking Ο TV/Cinema Ο Reading
Ο Sport,whichone?___________

Doyouhavesomeothercommentsthatyoutowanttotellus?
___________________________________________________________________________
___________________________________________________________________________
___________________________________________________________________________
THANKYOUALOTFORYOURCOLLABORATION!

3.QuestionnaireAnalysisBeforeallparticipantsreceivedafinalversionofthequestionnairefordatacollection,weanalyzedandcorrectedabiasedandincompletevariantofit.Wewerealsoaskedtoidentifythescreeningquestion,aswellasquestionssuitedforafactorandclusteranalysis,respectively.
1.Mainmistakesofpreviousquestionnaire&improvementsInitially,nointroductiontothequestionnairewasprovided.Thisshouldalwaysbeincludedtoprovideparticipantswithnecessarybackgroundinformationaboutthestudy,forexamplehowthedatawillbeused,whetheranonymityisguaranteedandwhatthepurposeofthestudyis.Moreover,includingaquestionofconsenthereensuresthatparticipantsreallyvolunteertheinformationtheyareabouttoprovide.Othermistakes,whichrepeatedlyoccurredwere:
• Nodirectionsforparticipants,whohadtoskipcertainquestions(forexamplebyansweringthescreeningquestionwith"No").
• Missinginformationabouthowmanyanswerstocheck(oneormultiple).• Ambiguousansweroptions("often"issubjective,forexample).• Awkwardandimprecisequestionformulations• Imbalancedscales(forexamplestartingacceptablepricesat0.5€,butnotlower,with
anopenendforpriceshigherthan2€).• Incompatibleattributes(lessvs.good,forexample,insteadoflessvs.alot).• Omittingan"Idon'tknow"option,whichmakesitlesslikelyparticipantswillskipa
question.• Spreadingthecollectionofpersonalinformationthroughoutthequestionnaire,
insteadofcollectingitcentrallyinoneplaceattheend(whichmaximizeschancesofobtainingallrelevantinformation).
2.ScreeningQuestionThescreeningquestionwas"Doyouconsumeenergydrinks?"People,whodonotconsumeenergydrinks,willnothavemuchinformationtoprovideabouttheconsumptionofsuchbeverages.Therefore,theseparticipantsaredirectedrighttothelastquestion,aboutwhichchangestheywouldliketoseeintheenergydrinkindustry.Theanswerscanbeusedtoinferwhatrequirementswouldneedtobefulfilledtomakethemconsumeenergydrinks.
3.FactorAnalysisQuestionsAfactoranalysistriestodeterminetheunderlyingstructureofadataset,byfindinglatentvariables,whicharecorrelatedwiththeobservedones.Theresultscanthenbeusedto

reducethenumberofvariablesaltogether,byrepresentingsomeoftheoriginallymeasuredvariablesasalinearfunctionofanewlyestablished,latentvariable.Therefore,factoranalysisquestionswillusuallybepresentedintheformof"questionbatteries,"whererespondentsrankmultipleitemsonanordinalorintervalscale(forexampleLikertscale).Thecorrelationamongthesecanthenbemeasuredandusedtoextractthefactors,whichlaterturnintothemacro-variablesofthenewmodel.Questionsinthisquestionnaire,whichcanbeusedforafactoranalysis,are:
• Question10• Question18• Question19
Wewillconductafactoranalysisforquestion18lateron.
4.ClusterAnalysisQuestionsAclusteranalysisissimilartoafactoranalysisinthatitalsoaggregatestheavailabledata,yetitdoesnotcumulateinformationonthevariable,butontheobservationlevel.Withhierarchicalclustering,observationsaregroupedintocategoriesbasedonthedifferencesintheirvalues.Thiscanbeusedtodeterminecustomerprofilesandtypes,forexample.Clusteranalysisquestionsthereforeallocaterespondentsintooneorseveralcategoriesatonce,tomakesuretheentiresamplecanbespreadacrossthedefinedclusters.Questionsinthisquestionnaire,whichcanbeusedforaclusteranalysis,are:
• Question2• Question3• Question4• Question5• Question6• Question9• Question11• Question12• Question15• Question24

4.FrequencyAnalysisThefollowingfrequencymeasureswerecomputedforquestions3,4and9,whichrepresenttheamountofconsumption,occasionswhenenergydrinksareconsumedandpricesconsideredasappropriate,respectively.
1.Question3:AmountofconsumptionThisvariableisordinallyscaled.Regardinghowoftentheyconsumedenergydrinks,678respondentsgavevalidanswers.Almostonethirdseldomlyconsumesenergydrinks(lessthanoncepermonth),andslightlyoveronequarterreportstoconsumerenergydrinksonceamonth.Thismeansover50%ofoursampledrinksenergydrinkslessthantwicepermonth.Only2.1%reportedconsumingenergydrinksmultipletimesaday.
Amount Consumption
Häufigkeit Prozent
Gültige
Prozente
Kumulierte
Prozente
Gültig Many times a day 14 1,8 2,1 2,1
Once a day 26 3,3 3,8 5,9
Many times a week 53 6,7 7,8 13,7
Once a week 93 11,7 13,7 27,4
Many times a month 106 13,3 15,6 43,1
Once a month 186 23,4 27,4 70,5
Seldom 200 25,2 29,5 100,0
Gesamt 678 85,3 100,0 Fehlend System 117 14,7 Gesamt 795 100,0 Fig.1:Frequencytableforamountofconsumption

Thebarchartshowsaheavilyleft-tailed,negativelyskeweddistributionfortheamountofconsumption,withover50%ofthedataconcentratedonthefarrightsideofthespectrum.Itisinterestingtonotehere,thattherightsiderepresentslessconsumption,whichiscounter-intuitiveandmakesvisualinterpretationharder.
Fig.2:Frequencybarchartforamountofconsumption
2.Question4:OccasionsforconsumingenergydrinksDifferentconsumersturntoenergydrinksfordifferentreasonsandonvariousoccasions.Outofoursample,667participantesreportedvalidanswersforthisquestions.128observationsaremissing.
Fig.3:Samplesizeforusesofenergydrinks
Fallzusammenfassung
Fälle
Gültig Fehlend Gesamt
N Prozent N Prozent N Prozent
$Usesa 667 83,9% 128 16,1% 795 100,0%
a. Dichotomie-Gruppe tabellarisch dargestellt bei Wert 1.

However,sincemultipleanswerswerepossibleforthisquestion,atotalof1318observationsweremade,equalingalmost2differentchoicesofusecasesperrespondentonaverage.Almost50%ofparticipantsreportedconsumingenergydrinksatthedisco,makingthisthemostcommonusecase.Thesecondmostcommonoccasioniswhilestudying,with41.8%,followedcloselybyaneveningoutwith37%.Drivingisanotherpopularusecase,withalmostonethirdofrespondentsreportingtoconsumeenergydrinksforthisoccasion.Itisinterestingtonotethatonly11.5%ofrespondentsdrinkenergydrinkstoquenchtheirthirst.Mostofthereportedusecasesarescenarioswherewakefulnessandfocusarerequired,whichindicatesrespondentsfromthesampleconsumeenergydrinksmoreforthe"energy"factorthanthe"drink"factor.
Fig.4:Frequencytableforusesofenergydrinks
Häufigkeiten von $Uses
Antworten Prozent der
Fälle N Prozent
$Usesa Disco 333 25,3% 49,9%
Evening Out 247 18,7% 37,0%
To drive 206 15,6% 30,9%
Thirsty 77 5,8% 11,5%
To Do Sport 118 9,0% 17,7%
To Study 279 21,2% 41,8%
Other Occasions 58 4,4% 8,7%
Gesamt 1318 100,0% 197,6%
a. Dichotomie-Gruppe tabellarisch dargestellt bei Wert 1.

Thepiechartforthefrequenciesofusecaseshighlightsthefactthat80%ofoccasionsofuserelatetothese4activitieswell.
Fig.5:Frequencypiechartforusesofenergydrinks

Thebarchartdoesnotreflecttheinformationtoowellhere,sincethevariableisnominalandwetalkaboutkurtosisorskewness.However,ithighlightsthesimilarfrequenciesofstudyingandspendinganightout,aswellasshowsratios,suchasdiscobeingmentionedabout3timesasmuchassport.
Fig.6:Frequencybarchartforusesofenergydrinks
3.Question9:Appropriateprice 85%ofthesamplereportedvalidanswerstothepricingquestion.Thedatagroupsdenselyaroundthecenteroftheintervalscale,withthecentercategory,1to1.5€beingthemostfrequentlymentionedcategory(40.6%).Thetwocategoriesborderingonthemiddleoneshowastrongtilttowardslowerprices.Thecategoryof0.5to1€isbeingconsideredasappropriatepricestwiceasoftenas1.5to2€.Only6%ofrespondentsconsiderthemostextremepricecategoriesasfair,with3.8%optingforlessthan0.5€and2.1%optingformorethan2€.

Appropriate Price
Häufigkeit Prozent
Gültige
Prozente
Kumulierte
Prozente
Gültig Less than 0.50€ 26 3,3 3,8 3,8
Between 0.50€ and 1€ 242 30,4 35,6 39,5
Between 1€ and 1.50€ 276 34,7 40,6 80,1
Between 1.50€ and 2€ 121 15,2 17,8 97,9
More than 2€ 14 1,8 2,1 100,0
Gesamt 679 85,4 100,0 Fehlend System 116 14,6 Gesamt 795 100,0 Fig.7:Frequencytableforappropriatepricesofenergydrinks Thebarchartrevealsadistributionreminiscentofanormaldistribution,albeitaverypeakedandright-skewedone.
Fig.8:Frequencybarchartforappropriatepricesofenergydrinks

ThesamebargraphcomputedinExcelshowsthe2:1ratioofcategory2(0.5-1€)tocategory4(1.5-2€)well.
Fig.9:Frequencybarchartforappropriatepricesofenergydrinks(inExcel) Thepiechart,alsocomputedinExcel,visuallyrevealsthatover75%ofrespondentsperceivepricesbetween0.5and1.5€asfair.However,thisinformationisnotsuitedenoughtodetermineapreciseprice,sinceonlyrangesaregiven.
Fig.10:Frequencypiechartforappropriatepricesofenergydrinks(inExcel)
0 50 100 150 200 250 300
Lessthan0.50€
Between0.50€and1€
Between1€and1.50€
Between1.50€and2€
Morethan2€
AppropriatePriceFrequency
AppropriatePriceFrequency
AppropriatePriceFrequency
Lessthan0.50€
Between0.50€and1€
Between1€and1.50€
Between1.50€and2€
Morethan2€

4.Mean,Median,Modeandothermeasuresofcentraltendency Sinceoccasionofuseisanominalvariable,computingmeasuresofcentraltendencywouldnotmakeanysense-thedifferentmanifestationsofthevariablecan'tberankedorordered.Amountofconsumptionisanordinalvariable-wecannotgiveexactintervals,since"manytimesaday"and"seldom"arenotprecisefrequencies,butwecanrankthevariouscategoriesbyabsoluterecordedfrequency.Appropriatepriceisanintervalvariablewithopenendedscales(lessthan0.5€andmorethan2€marktheendsofourspectrum).
Forbothofthese,measuresofcentraltendencyrevealadditionalinformation.However,sincewecodedthevariableswithnumericvaluesinSPSS,inordertomakeananalysispossible,itisimportanttodecipherthecodeagaincorrectly.
Forexample,themostfrequentlyrecordedvalueforamountofconsumption(mode)is7,whichisthelastcategory,whereenergydrinkconsumptionislowest(seldom).Hence,thehigherthevalue,thelessoftenenergydrinksareconsumed.Themedianbeing6showsusthat50%ofallrespondentsconsumeenergydrinksonceamonthorless,whereasthemeanisslightlyclosertocategory5(manytimesamonth).However,themeanisinfluencedbytheextremevaluesincategory1and7,whereasmeanandmodearenot.Thequartilesrevealthataftercumulating25%ofrespondents'answers,wearealreadydowntoafrequencyofonceperweekorless,meaning3outof4participantsdrinknomorethanoneenergydrinkevery7days.The50%quartilecorrespondstothemedianandsincecategory7isthemostfrequentlyreported,the75%quartile"scoopsup"thelastcategory,completingtheremainderofallobservations.
Fig.11:Measuresofcentraltendencyforamountofconsumptionandappropriatepricesofenergydrinks
Thevariableforappropriatepricehasbeencodedinasimilarfashion,exceptthatabiggercategorynumbercorrespondstoahigherprice,notalowerone.Duetotheheavyconcentrationofobservationsaroundcategories2and3(0.5to1€and1to1.5€,respectively)withover75%ofanswers,calculatingmeansofcentraltendencydoesnotrevealalotofadditionalinformation.The25%markofallobservationsiscrossedincategory2,withthejumptothenextintervalgarneringthebulkoftheremainingvalues,includingthe50%and75%quartiles(aswellasthemedian,whichcorrespondstothe50%quartile).Themodeis3andtheaverageisfairlyclosetothemostcentralcategoryaswellwith2.79.Thistellsusthatlessthan25%ofallrespondentsconsiderpricesabove1.5€asfair.
Amount
Consumption Appropriate Price
N Gültig 678 679
Fehlend 117 116
Mittelwert 5,37 2,79
Median 6,00 3,00
Modus 7 3
Perzentile 25 4,00 2,00
50 6,00 3,00
75 7,00 3,00

5.DescriptiveAnalysis Thisnextsectionoftheanalysisdealswithdescriptivestatistics.Thesemeasureswillrevealhowmuchthedataisgroupedaroundthecenterandhowcloseitcomestoanormaldistribution.Analyzedmeasuresincludemean,variance,standarddeviation,range,kurtosisandskewness.
1.Question9:AppropriatepriceRegardingappropriatenessofenergydrinkprices,wepreviouslydiscussedmean,medianandmode.Sincethisisanintervalvariablecodedordinally,itdoesnotmakesensetocalculatevariance,standarddeviation,skewness,kurtosisandrange.Sincethecategoriesarecodedwithvalues1to5,calculatingtherangeevengetsusaninaccurateresult-afterall,thereare5possiblepriceintervals,not4.Kurtosisisnegative,pointingataflatteneddistribution,whichishardtoverifyvisually.Thesemeasuresdonotmakealotofsense,duetothevariablecoding.
Statistiken
Appropriate Price N Gültig 679
Fehlend 116
Mittelwert 2,79
Median 3,00
Modus 3
Standardabweichung ,852
Varianz ,726
Schiefe ,251
Kurtosis -,311
Spannweite 4
Minimum 1
Maximum 5
Summe 1892
Fig.12:Descriptivestatisticsforappropriatepricesofenergydrinks
2.Question15:IntensityofbrandchangingThesamelogicappliestothevariable"Intensityofbrandchanging,"whichreferstohowoftenpeoplechangetheirpreferredbrandofenergydrinks.Itisanordinalvariable,however,severalproblemsoccurwhentryingtointerpretdatalikemean,variance,etc.First,thecategoriesarenotbalanced.Startingwith"veryoften,"whichisanundefinednumberofbrandchanges(withnotimeintervaltiedtoit),thescaleendsatnever,whichequatestozero.Theoppositewouldbe"always,"whichisanimpossibleanswer,inthiscase.Second,thevariableiscodedthesamewayappropriatepriceis,yetanincreasingvalue

indicatesalowerfrequencyofbrandchange,whichmakesinterpretationeventrickier.Third,the"intervals"ofbrandchangethevariablerepresentsareambiguous."Veryoften,""Often,""Sometimes,"etc.arenotsufficientlydetailedfrequenciestomakemeaningfulconclusions.Hence,itmakesnosensetocomputedescriptivestatisticsforthisvariable.Absoluteobservationsandabarchartareincludedforcompleteness.
Statistiken
Intensity Brand Changing N Gültig 678
Fehlend 117
Mittelwert 3,78
Median 4,00
Modus 4
Standardabweichung 1,005
Varianz 1,010
Schiefe -,608
Standardfehler der Schiefe ,094
Kurtosis -,045
Standardfehler der Kurtosis ,187
Spannweite 4
Minimum 1
Maximum 5
Summe 2560
Fig.13:Descriptivestatisticsforintensityofbrandchangingofenergydrinks
Intensity Brand Changing
Häufigkeit Prozent
Gültige
Prozente
Kumulierte
Prozente
Gültig Very often 18 2,3 2,7 2,7
Often 50 6,3 7,4 10,0
Sometimes 177 22,3 26,1 36,1
Rarely 254 31,9 37,5 73,6
Never 179 22,5 26,4 100,0
Gesamt 678 85,3 100,0 Fehlend System 117 14,7 Gesamt 795 100,0 Fig.14:Frequencytableforintensityofbrandchangingofenergydrinks

Fig.15:Frequencybarchartforintensityofbrandchangingofenergydrinks(withnormaldistributioncurve)
3.Question20.1:SatisfactionwithDrink1 Thelevelofsatisfactionwithrespondents'preferreddrinknumber1ismeasuredona1to9scale,whichisordinalandthus,alsodoesnotreallyhanditselftoadescriptiveanalysis.ThemostmeaningfulstatistictocalculateistheMedian.Meanandmedianarealmostidenticalwith7.01and7,showingthat50%oftheobservationsfellonthetopthreeratings.Alookatthefrequencytable(andtheMode,whichis8)confirmsthis.

Statisfaction Drink 1
Häufigkeit Prozent
Gültige
Prozente
Kumulierte
Prozente
Gültig Not at all 6 ,8 ,9 ,9
2 11 1,4 1,6 2,5
3 14 1,8 2,1 4,6
4 13 1,6 1,9 6,6
5 49 6,2 7,3 13,9
6 113 14,2 16,8 30,7
7 173 21,8 25,8 56,5
8 177 22,3 26,4 82,9
A lot 115 14,5 17,1 100,0
Gesamt 671 84,4 100,0 Fehlend System 124 15,6 Gesamt 795 100,0 Fig.16:Frequencytableforsatisfactionwithdrink1ofpreferredenergydrinksHowever,onehastobecarefulnottoforgetthatanordinaldoesnotequalanintervalvariable.Apersonratingtheirsatisfactionwith9isnotnecessarily3timesashappywiththeirenergydrinkofchoiceasapersonratingtheirsatisfactionwith3.
Statistiken
Statisfaction Drink 1 N Gültig 671
Fehlend 124
Mittelwert 7,01
Median 7,00
Modus 8
Standardabweichung 1,629
Varianz 2,654
Schiefe -1,179
Standardfehler der Schiefe ,094
Kurtosis 1,778
Standardfehler der Kurtosis ,188
Spannweite 8
Minimum 1
Maximum 9
Summe 4707
Fig.17:Descriptivestatisticsforsatisfactionwithdrink1ofpreferredenergydrinksSkewnessisnegative,indicatingaleft-skeweddistribution,withthelongtailofthedataontheleftandthemajorityofobservationsontheright,whichiscorrect.Kurtosisispositive,

hintingatapeakeddistribution,withheavygroupingaroundvalues7and8.Alookatthebarchartwithaplottedcurveconfirmsthis.Onaverage,peoplearepositivelysatisfiedwiththeirchosenenergydrinknumberone.
Fig.18:Frequencybarchartforsatisfactionwithdrink1ofpreferredenergydrinks(withnormaldistributioncurve)Computingthemeanofsatisfactionwithdrink1forgendersseparatelyrevealsthatonaverage,womenareslightlylesssatisfiedwiththeirchosendrinkthanmen.
Gruppenstatistiken
Gender N Mittelwert
Standardabweichu
ng
Standardfehler
des Mittelwertes
Statisfaction Drink 1 Male 367 7,08 1,659 ,087
Female 286 6,91 1,608 ,095
Fig.19:Groupstatisticsforsatisfactionwithdrink1ofpreferredenergydrinksformenandwomenNote:Atthispointintheanalysis,Irealizedseveralvaluesinthefinaldatasetwerecodedinthewrongway.Absolutefrequenciesforsatisfactionwithdrink1showedatotalof671responses,whereasthetotalnumberofvalidresponsescomparedacrossgendersyieldedonly653responses.Somewereindeedmissingvalues,butfor5datapoints,thevaluefor

genderwassetto0.Sincethisvariableiscodedin1formenand2forwomen,these5valuesweredeletedtorecodeinmissingvaluesforfurtheranalysis.However,thebarchartshowsthemeanstobeveryclosetooneanother,makingthisanobservationwehavetobecarefulwithstatinghowstrongitactuallyis.
Fig.20:Barchartforaveragesatisfactionwithdrink1ofpreferredenergydrinksformenandwomenInthissample,30%morementhanwomengavetheiranswerstothisquestion.
Fig.21:Barchartforaveragesatisfactionwithdrink1ofpreferredenergydrinksformenandwomen
Male,367
Female,286

Agoodtitlecouldbe:"Averagesatisfactionwithpreferredchoiceofenergydrinkacrossgenders."Aninterestingquestiontoaskwouldbe"Aremenmoresatisfiedwiththeirenergydrinkofchoicethanwomen?"Toanswerthisquestion,wecanconductat-testtocomparetwomeansofindependentsamples(menandwomenareindependentsub-samples).OurnullhypothesisH0inthiscaseisthatthemeanforsatisfactionwithenergydrink1isthesameformenandwomen-theyarenotdifferent.Thet-testconductedwithSPSSyieldsa2-sidedsignificanceof0.191anda1-sidedsignificancelevelof0.0955,whichisnotenoughtorejectthenullhypothesisona5%significancelevel.Therefore,wecannotrejectthehypothesisthataveragesatisfactionwithdrink1isthesameamongmenandwomen.
Test bei unabhängigen Stichproben
Levene-Test
der
Varianzgleichh
eit T-Test für die Mittelwertgleichheit
F Sig T df
Sig.
(2-
seitig)
Mitt.
Diff.
SF der
Differenz
95%
Konfidenzintervall
der Differenz
Untere Obere
Statisfacti
on Drink 1
Varianzen
sind gleich ,089 ,765 1,310 651 ,191 ,169 ,129 -,084 ,423
Varianzen
sind nicht
gleich
1,315 621,169 ,189 ,169 ,129 -,083 ,422
Fig.22:T-testforindependentsamplesforaveragesatisfactionwithdrink1ofpreferredenergydrinksformenandwomen
6.ContingencyTablesContingencytablesarebestusedtomeasurerelationshipsbetweencategoricalvaluables,forexampleageofbuyerandpurchasepriceofacarorgenderandtypeofpet.Thankstojointfrequenciesfromthetable,itispossibletoinferhowlikelyapersonistoownacarwithacertainpricewhenheorsheisinacertainagegroup,forexample,aswell.Additionally,contingencytablesallowcomputingthelikelihoodofcertaincategoriesapplying,givenwealreadyhavecertainotherinformation,whichiscalledconditionalprobability.Furthermore,theyserveasthebasisofthechi-squaretest,whichisusedtodeterminewhethertwovariablesarestatisticallyindependent,andCramer'sV,whichisamore

accuratemeasureofthesamecharacteristic.Inthissection,wewillanalyzetherelationshipbetweenthevariables"sex,"whichisdichotomousandnominaland"perceivedeffectiveness"(ofenergydrinks),whichisordinal.
1.Question7&29:Sexvs.PerceivedEffectivenessAtotalof660maleandfemalerespondentsreportedvalidanswersforperceivedeffectivenessofconsumption,with135valuesmissing.
Verarbeitete Fälle
Fälle
Gültig Fehlend Gesamt
N Prozent N Prozent N Prozent
Perceived Effectiveness of
Consumption * Gender 660 83,0% 135 17,0% 795 100,0%
Fig.23:TotalnumberofrespondentswhogavevalidanswerstobothperceivedeffectivenessofconsumptionandthegenderquestionThecontingencytableshowsabsoluteandrelativefrequencies,aswellasjointfrequenciesandmarginaldistributionsforallcategories.Wecaninterpretthedatarow-andcolumn-wise.Forexample,outofbothgenders,61.1%reportedtheyperceiveenergydrinkstobeeffectivewhenconsumed.Thisfigureiscalculatedbasedontheaverageoftherelativeshareofallmen,whochosethisanswer(62.3%ofthe371men,whichequatesto231absoluteobservations),andtherelativeshareofwomenwiththesameanswer(59.5%ofall289respondents,whichequatesto172).Thisinturnmeans57.3%ofallthoseinourstudy,whoperceiveenergydrinkstobeeffective,aremen,while42.7%arewomen.Ahypothesiswecouldstatefromthisisthatpeople,whoperceiveenergydrinkstobeeffective,aremorelikelytobementhanwomen.Similarly,wecanmakestatementsaboutthelikelihoodofhowsomeoneperceivesenergydrinkeffectiveness,basedontheirgender.Forexample,sincebothfrequenciesof"theydonotwork"aresimilarlylowformenandwomen,wecansaythatforthissample,about1in20peopleperceiveenergydrinkstonotbeeffective,regardlessofgender.SinceSPSShasalreadycalculatedconditionalprobabilitieshere,wedonotneedtodivideabsolutevaluesbycolumnorrowtotalstocalculatethem.

Perceived Effectiveness of Consumption * Gender Kreuztabelle
Gender
Gesamt Male Female
Perceived
Effectiveness
of
Consumption
They are effective Anzahl 231a 172a 403
% innerhalb von Perceived
Effectiveness of Consumption 57,3% 42,7% 100,0%
% innerhalb von Gender 62,3% 59,5% 61,1%
Korrigierte Residuen ,7 -,7
It is just a psychological
matter
Anzahl 121a 102a 223
% innerhalb von Perceived
Effectiveness of Consumption 54,3% 45,7% 100,0%
% innerhalb von Gender 32,6% 35,3% 33,8%
Korrigierte Residuen -,7 ,7
The do not work Anzahl 19a 15a 34
% innerhalb von Perceived
Effectiveness of Consumption 55,9% 44,1% 100,0%
% innerhalb von Gender 5,1% 5,2% 5,2%
Korrigierte Residuen ,0 ,0 Gesamt Anzahl 371 289 660
% innerhalb von Perceived
Effectiveness of Consumption 56,2% 43,8% 100,0%
% innerhalb von Gender 100,0% 100,0% 100,0%
Jeder tiefgestellte Buchstabe gibt eine Teilmenge von Gender Kategorien an, deren Spaltenanteile sich auf dem
,05-Niveau nicht signifikant voneinander unterscheiden. Fig.24:Crosstabsforperceivedeffectivenessofenergydrinksacrossmenandwomen(absoluteandrelativevalues)
1.Question1&29:Sexvs.ScreeningQuestionAtotalof772respondentsreportedvalidanswersforbothgenderandthescreeningquestion,bothofwhicharebinary,nominalvariables.
Verarbeitete Fälle
Fälle
Gültig Fehlend Gesamt
N Prozent N Prozent N Prozent
Filter question * Gender 772 97,1% 23 2,9% 795 100,0%
Fig.25:TotalnumberofrespondentswhogavevalidanswerstoboththescreeningquestionandthegenderquestionThecontingencytablemustbecomputedasabasisforthechi-squaretest.Amongthosewhosaid"Yes"(consumingenergydrinks),menwherethemajoritygroup,whereasamong

thosewhosaid"No,"womenrepresentedslightlyover50%.Forbothgenders,over80%ofallsurveyparticipantsresponded"Yes"tothefilterquestion.Thishighsample-populationfitisagoodindicatorofthesamplingmethodused(conveniencesampling).
Filter question * Gender Kreuztabelle
Gender
Gesamt Male Female
Filter question Yes Anzahl 370a 285a 655
% innerhalb von Filter
question 56,5% 43,5% 100,0%
% innerhalb von Gender 87,1% 82,1% 84,8%
Korrigierte Residuen 1,9 -1,9 No Anzahl 55a 62a 117
% innerhalb von Filter
question 47,0% 53,0% 100,0%
% innerhalb von Gender 12,9% 17,9% 15,2%
Korrigierte Residuen -1,9 1,9 Gesamt Anzahl 425 347 772
% innerhalb von Filter
question 55,1% 44,9% 100,0%
% innerhalb von Gender 100,0% 100,0% 100,0%
Jeder tiefgestellte Buchstabe gibt eine Teilmenge von Gender Kategorien an, deren
Spaltenanteile sich auf dem ,05-Niveau nicht signifikant voneinander unterscheiden. Fig.26:Crosstabsforanswerstothescreeningquestionacrossmenandwomen(absoluteandrelativevalues)Sincemenarethedominantsegmentofour"energydrinkdrinkers,"wecouldhypothesizethatmenaremorelikelytodrinkenergydrinksthanwomen.Thechi-squaretestisaimedatshowingwhetherthetwotestedvariablesarestatisticallyindependent,meaningwearetestingtheassumptionthatgenderdoesnotinfluencewhethersomeonedrinksenergydrinks,ornot.ThisisinlinewiththeH0hypothesisstatingtheoppositeofwhatweasresearcherswanttoprove.OurnullhypothesisH0isthus"genderhasnoimpactonwhetherapersondrinksenergydrinksornot."Ouralternativehypothesis,H1,becomestheopposite:"genderhasaneffectonwhetherapersonconsumesenergydrinks."

Thechi-squaretestyieldsachi-squarevalueof3.605,whichcorrespondstoanasymptoticsignificancevalueof0.058,meaningwecannotrejectthenullhypothesisata5%significancelevel.
Chi-Quadrat-Tests
Wert df
Asymptotische
Signifikanz
(zweiseitig)
Exakte
Signifikanz (2-
seitig)
Exakte
Signifikanz (1-
seitig)
Chi-Quadrat nach Pearson 3,605a 1 ,058 Kontinuitätskorrekturb 3,232 1 ,072 Likelihood-Quotient 3,586 1 ,058 Exakter Test nach Fisher ,069 ,036
Zusammenhang linear-mit-
linear 3,601 1 ,058
Anzahl der gültigen Fälle 772
a. 0 Zellen (0,0%) haben eine erwartete Häufigkeit kleiner 5. Die minimale erwartete Häufigkeit ist 52,59.
b. Wird nur für eine 2x2-Tabelle berechnet Fig.27:Chi-square-testforindependentsamplesforlikelihoodofconsumingenergydrinksformenandwomenThetableofsymmetricmeasuresconfirmsthis,withPearson'sRandtheSpearmancorrelationcoefficientshowingthesamesignificancevalue.Thus,wecannotrejectthehypothesisthatgenderhasnoimpactonwhethersomeoneconsumesenergydrinksata5%significancelevel.
Symmetrische Maße
Wert
Asymptotischer
standardisierter Fehlera
Näherungsweises
tb
Näherungsweise
Signifikanz
Intervall- bzgl.
Intervallmaß
Pearson-R ,068 ,036 1,901 ,058c
Ordinal- bzgl.
Ordinalmaß
Korrelation nach
Spearman ,068 ,036 1,901 ,058c
Anzahl der gültigen Fälle 772
a. Die Null-Hyphothese wird nicht angenommen.
b. Unter Annahme der Null-Hyphothese wird der asymptotische Standardfehler verwendet.
c. Basierend auf normaler Näherung Fig.28:Correlationtableforscreeningquestionandgender
7.InferentialStatistics-ComparingSampleParameterstoSpecificValuesNowweturntoinferentialstatistics,whichisthepracticeofestimatingfeaturesofthepopulationthatistheaimofourresearchbyanalyzingthedatawehavecollectedfromoursample.Thereisavarietyoftestingmethodswecanuse,andthechoiceofmethoddependsonthe

typeandnumberofsamplesexamined,aswellasthelevelofmeasurementofthedependentvariable.Todeterminethecorrecttest,wecanuseadiagramlistingallavailablemethodsandtheirusecases.
Fig.29:Diagramofstatisticaltests,dependingonlevelofmeasurementofdependentvariableandtypeandnumberofsamples
1.OneSampleTestsWewillstartwithonesampletests,wherewecomparetheparameterofasamplegroupagainstafixedvalue.Thesetestsreveal,inpart,howrepresentativeoursampleisofthepopulationwearelookingtoexamine.
1.Question10.2:Istheaverageimportanceof"Brand"equalto4.5?Tofindoutifthepopulationmeanofbrandimportanceis4.5,wecancanusetheone-samplet-testofthemean,whichcorrespondstothetopleftsectionofthediagram:comparingaratiovariable(Likertscale)fromonesample.Theaveragevalueforbrandimportanceinoursampleis5.37.
Statistik bei einer Stichprobe
N Mittelwert
Standardabweic
hung
Standardfehler
des Mittelwertes
Brand 677 5,37 4,644 ,178
Fig.30:TotalnumberofrespondentswhogavevalidanswerstoimportanceofbrandquestionWewanttoknowifthepopulationmeanisexactly4.5,soourH0becomes"Themeanofbrandimportanceequalsto4.5,"assumingthetwoarenotdifferent.H1wouldthenbe"themeanofbrandimportancedoesnotequal4.5."
Diagram: “When To Use Which Statistical Test”
08.12.2016 1
Measurement Level One sampleDependent variable k=1 k=2 k>2 k=2 k>2
Interval/Ratio t-test (mean)1 t-test (means)2 ANOVA (means)3 t-test (paired) ANOVA (repeated measurement)
SPSS : Compare Means.. One-Sample T Test Independent-Samples One-Way ANOVA Paired-Samples General Linear Model > T Test T Test Repeated Measures
Ordinal Kolmogorov-Smirnov Mann-Whitney U-test Kruskal-Wallis test -Wilcoxon test Friedman test-Sign test
SPSS : Nonparametric 1-Sample K-S* (by hand ) 2 Independent Samples K Independent Samples 2 Related Samples K Related Samples TestsNominal Multiple Choice Chi-square (one sample) Chi-square (cross tabs) Chi-square (cross-tabs) --- --- SPSS Nonparametric Tests .. Descriptive Statistics .. Descriptive Statistics ..
Chi-Square (or by hand) Crosstabs Crosstabs Dichotomy z-test (proportion) z-test (proportions) Chi-square (cross-tabs) --- --- SPSS by hand by hand Descriptive Statistics ..
Crosstabs* SPSS tests only w hether data comes from specif ic distributions (Normal, Poisson, Uniform and Exponential). Other distributions you have to do by hand!** For dichotomy you can use the same tests as Multiple Choice as w ell1If data is nonnormal: N > 202 If data is nonnormal: Each group N > 15
Independent samples Related samples

Thet-testresultsinateststatisticof4.862,withaverylowp-value,indiciatinghighsignificance.Thus,wecanrejectthenullhypothesisona5%significancelevel.Wehaveevidencetobelievethepopulationmeanforbrandimportanceisdifferentfrom4.5.
Test bei einer Sichprobe
Testwert = 4.5
T df Sig. (2-seitig)
Mittlere
Differenz
95% Konfidenzintervall der
Differenz
Untere Obere
Brand 4,862 676 ,000 ,868 ,52 1,22
Fig.31:T-testforthemeanofonesampleforaverageimportanceofbrand
2.Question10.1:Istheaverageimportanceof"Benefits"equalto7?Thistestisperformedexactlylikethepreviousone,becauseimportanceofbenefitsismeasuredwithaLikertscaleaswell.Theaveragevalueofimportanceforbenefitsinoursampleis6.81.
Statistik bei einer Stichprobe
N Mittelwert
Standardabweic
hung
Standardfehler
des Mittelwertes
Benefits 677 6,81 2,091 ,080
Fig.32:TotalnumberofrespondentswhogavevalidanswerstoimportanceofbenefitsquestionOurH0is"Theaverageimportanceofbenefitsisequalto7"withthecorrespondingH1"theaverageimportanceofbenefitsdoesnotequal7."Theresultingteststatisticis-2.353,indicatingthatoursamplemeanissmallerthanthehypothesizedvalue,whichiscorrect(6.81<7).Thep-valuecanthenbeusedtodeterminethesignificanceofthisobservation.Itis0.019,or1.9%,whichmeanswecanagainrejectthenullhypothesisata5%significancelevel(p<0.05).Ouranalysisindicatesthattheaverageimportanceofbenefitsisnotequalto7.

Test bei einer Sichprobe
Testwert = 7
T df Sig. (2-seitig)
Mittlere
Differenz
95% Konfidenzintervall der
Differenz
Untere Obere
Benefits -2,353 676 ,019 -,189 -,35 -,03
Fig.33:T-testforthemeanofonesampleforaverageimportanceofbenefitsItmustbenotedthatasignificantdifferenceisnotautomaticallysubstantive.Here,theaveragedifferencefrom7is-0.189-buthowdoesthattranslatetotheperceivedimportanceinrespondents?Cantheymakeoutthedifferencebetweenvaluingimportanceofbenefitsat7or6.811?Andwhatdobothofthosetranslatetoinabsoluteimportance?Significancedependsonthemagnitudeofthedifferenceandthesamplesize.Asmallerdifferenceismoremeaningfulinalargesamplethaninasmallone.Howrelevantthissignificantdifferenceisishardtosayhere,especiallysincethemeasuredvariableishighlysubjective.
3.Question29:Istheproportionofmeninthesampleequalto50%?Outof773validresponsestothegenderquestion,425werefrommaleparticipants,makingthema55%proportioninoursample.
Gender
Häufigkeit Prozent
Gültige
Prozente
Kumulierte
Prozente
Gültig Male 425 53,5 55,0 55,0
Female 348 43,8 45,0 100,0
Gesamt 773 97,2 100,0 Fehlend System 22 2,8 Gesamt 795 100,0 Fig.34:Frequencytableforproportionsofmenandwomeninthesample(absoluteandrelative)Nowwewanttoinferwhetherwecanexpecttheproportionofmeninthepopulationtobe50%,basedonthisdrawnsample.Sincerespondentscanonlybemaleorfemale,thisisadichotomous,nominalvariable,meaningwehavetocalculateaz-testfortheproportionbyhand(bottomleftcornerofthediagram).Todoso,wecanusethefollowingformula:

Fig.35:Z-testformulaonesamplewithadichotomousdependentvariableOurH0isthattheproportionofmenisequalto50%,H1isthatitisnotequalto50%.Wehavetocalculatethestandarddeviationofthepopulation(anestimate),forwhichweneedsamplesize,thetestvaluewearecomparingoursamplevaluesto(50%)andtheproportioninthesample(55%).First,wecalculatesigma,whichis0.018.
Fig.36:Sigmacalculationforz-testforproportionofmenThen,wesubstitutethevaluesintothez-equationtoobtainthez-valueof2.78.
Fig.37:Z-testcalculationforproportionofmenThisisa2-sidedz-test,sinceforourH1itdoesnotmatterwhethertheproportionisbiggerorsmallerthan50%-aslongasitisdifferentonewayortheotheronasignificantlevel,wewillrejectH0.Toconfirmourtestdonebyhand,wecanusetheMedCalcz-testcalculator,whichyieldsthesameresultandalsogivesusthep-valueof0.0054,whichindicatessignificanceata5%level.
Fig.38:Z-testresultsforproportionofmen
z = 2.780
Significance level P = 0.0054
95% CI of observed proportion 51.41 to 58.55

For2-tailedz-test,thez-valuecorrespondingtoa5%significancelevelis1.96.Ifourcalculatedz-valueishigher,wecanrejectthenullhypothesis.Since2.78>1.96,wecanrejectthenullhypothesisatthe5%significancelevel.Webelievetheproportionofmeninthepopulationisnot50%.
2.IndependentandRelatedSampleTestsWhencomparingvaluesacrossdifferentgroupsorvariables,wehavetodistinguishbetweenindependentandrelatedsamples.Independentsamplesareusedtocompareobservationsofasingleparameter(likeperceivedeffectiveness)acrossdifferentgroups(menandwomen,forexample).Relatedsamplesareusedtocompareresponsestodifferentquestionsfromthesamegroup,forexampleifwomenliketheirenergydrinknumber1asmuchasnumber2.
1.Question20.1&29:Arewomenjustassatisfiedwiththeirnumber1energydrinkasmen?Sincewewanttocomparetheobservationsofoneparameter(satisfactionwithdrink1,ratioscale)fortwoindependentgroups(menandwomen,dichotomousnominalscale)here,wecancomputeanindependentsamplest-testwithSPSS.OurnullhypothesisH0isthatwomenarejustas(ormore)satisfiedwiththeirnumber1energydrinkasmen.H1thenbecomesthatwomenarelesssatisfiedwiththeirnumber1energydrinkthanmen.Inoursample,averagesatisfactionwithdrink1is7.08formenand6.91forwomen.
Gruppenstatistiken
Gender N Mittelwert
Standardabweic
hung
Standardfehler
des Mittelwertes
Statisfaction Drink 1 Male 367 7,08 1,659 ,087
Female 286 6,91 1,608 ,095
Fig.39:Groupstatisticsforsatisfactionwithdrink1acrossmenandwomenThisisa1-sidedt-test,sinceweonlyacceptevidenceforwomenbeingequallysatisfiedormore,notless.Wearenottestingjustadifference,butadifferenceinacertaindirection.Thet-testinSPSSshowsa2-sidedsignificancelevelof0.191.Thisvaluemustbedividedby2,inordertoobtainthe1-sidedsignificancelevel.Thisis0.0955,whichisstillhigherthan0.05.Therefore,wecannotrejectH0ata5%significancelevelandremainwiththehypothesisthatwomenareequallyassatisfiedwithdrink1asmen.

Test bei unabhängigen Stichproben
Levene-Test der
Varianzgleichheit T-Test für die Mittelwertgleichheit
F Sig T df
Sig.
(2-seitig)
Mittlere
Differenz
SF
der
Differ
enz
95%
Konfidenzintervall
der Differenz
Untere Obere
Statisfaction
Drink 1
Varianzen
sind gleich ,089 ,765 1,310 651 ,191 ,169 ,129 -,084 ,423
Varianzen
sind nicht
gleich
1,315 621,169 ,189 ,169 ,129 -,083 ,422
Fig.40:T-testforindependentsamplesforsatisfactionwithdrink1acrossmenandwomen
2.Question20.1&20.2:Arepeoplemoresatisfiedwiththeirnumber1energydrinkthantheirnumber2energydrink?Nowwewanttolearnsomethingaboutresponsestodifferentquestionsfromthesamepeople,namelyiftheirsatisfactionwithdrink1and2differs.Thedependentvariableisintervalscaled(1to9),thuswecanconductapairedt-testinSPSS.Anullhypothesisimpliesthatthereisnoeffectorcorrelationbetweentwovariables,sonowourH0isthatpeoplearenotmoresatisfiedwithdrink1thandrink2.Thenwecantrytofindsignificantevidenceagainstthis,whichisinfavorofH1:"Peoplearemoresatisfiedwiththeirnumber1energydrinkthantheirnumber2energydrink."Toconductthetest,wefirsthavetoobtainaveragesatisfactionwithbothdrinksfromoursample,whichis7.09fordrink1and6.09fordrink2.
Statistik bei gepaarten Stichproben
Mittelwert N Standardabweichung
Standardfehler des
Mittelwertes
Paaren 1 Statisfaction Drink 1 7,09 566 1,609 ,068
Satisfaction Drink 2 6,09 566 1,915 ,080
Fig.41:Descriptivestatisticsforsatisfactionwithdrink1and2Thenwecancalculatethecorrelationamongthetwosatisfactionlevel,whichhasanRvalueof0.339andishighlysignificant.
Korrelationen bei gepaarten Stichproben
N Korrelation Signifikanz
Paaren 1 Statisfaction Drink 1 &
Satisfaction Drink 2 566 ,339 ,000
Fig.42:Correlationforsatisfactionwithdrink1and2

Then,theteststatisticcanbecalculated.Thetableshowsasignificantdifferencewithanaveragevalueofabout1(0.996),indicatingthatonaverage,peoplearemoresatisfiedwithdrink1by1unitascomparedtodrink2.Thus,wecanrejectH0ona5%significancelevelandconcludethatpeopleareindeedmoresatisfiedwithdrink1thandrink2.
Test bei gepaarten Stichproben
Gepaarte Differenzen
T df
Sig.
(2-seitig) Mittelwert Stabw.
Standardfehler
des
Mittelwertes
95% Konfidenzintervall
der Differenz
Untere Obere
Paar 1 Statisfaction
Drink 1 -
Satisfaction
Drink 2
,996 2,041 ,086 ,828 1,165 11,614 565 ,000
Fig.43:Pairedt-testforrelatedsamplesforsatisfactionwithdrink1and2
3.Question10.2&33:Dopeoplewithadifferenteducationlevelputadifferentaverageimportanceontheattribute"brand?"Thisisanotherindependentsampletest,sincethedifferenteducationgroupsaredistinctfromoneanother.Peoplecanonlyhaveone"highestlevelofeducation"outofseveralcategories.Importanceofbrandisintervalscaled,whileeducationlevelisordinal.However,wehavemorethantwoindependentsampleshere,becausethereare3differentcategoriesforhighesteducationlevel(High-School,Bachelor'sDegree,Master'sDegree).Therefore,wemustconductaone-wayANOVAtestinSPSS.H0isthatimportanceisnotvalueddifferentlyacrossvariouseducationlevels,H1isthatpeoplewithdifferenteducationlevelswillperceivethebrandasmoreorlessimportantdependingontheirlevel.Averagevaluesforimportanceacrossthedifferentgroupsrangefrom5.11to5.59inoursample.
ONEWAY deskriptive Statistiken
Brand
N
Mittel-
wert
Standard-
abweichung
Standard-
fehler
95%-Konfidenzintervall für
den Mittelwert
Minimum Maximum Untergrenze Obergrenze
High-school 153 5,11 2,255 ,182 4,75 5,47 1 9
Bachelor´s
degree 381 5,39 5,819 ,298 4,81 5,98 -99 9
Master´s
degree 140 5,59 2,561 ,216 5,16 6,01 1 9
Gesamt 674 5,37 4,653 ,179 5,02 5,72 -99 9
Fig.44:DescriptivestatisticsforimportanceofbrandacrossdifferenteducationlevelsThefollowingone-wayANOVArevealsthatthereisnostatisticallysignificantdifferencebetweenthedifferentgroups.Thep-valueis0.676,whichisnotlessthan0.05andthuswecannotrejectH0.Wecannotvalidateasignificantdifferenceinaverageimportanceofthe

attributebrandacrossgroups.
Einfaktorielle ANOVA
Brand
Quadratsumme df
Mittel der
Quadrate F Signifikanz
Zwischen den Gruppen 16,983 2 8,491 ,392 ,676
Innerhalb der Gruppen 14552,027 671 21,687 Gesamt 14569,010 673 Fig.45:One-wayANOVAtestformeansofindependentsamplesforimportanceofbrandacrossdifferenteducationlevels
4.Question29&33:Istheeducationofrespondentsdistributedequallyacrossgenders?Whethergenderhasanimpactoneducationisanotherindependentsamplestest,sincemenandwomenaredistinctgroups.Thedependentvariableeducationcouldbeconsideredasordinalforvariousreasons(durationofeducation,averagesalary,etc.)butsincewecannotdrawdefiniteconclusionsaboutwhichlevelofeducationis"better,"itistreatedasnominalhere.Thismakestheappropriatetestachi-squaretestusingcrosstabs(contingencytables)for2independentsamples.OurH0isthatgenderdoesnotinfluenceeducationwhatsoever,andthatitisequallydistributedacrossgroups.H1isthatgenderaffectslevelofeducation.Atotalof769respondentshavereportedvalidvaluesforbotheducationandgender.
Verarbeitete Fälle
Fälle
Gültig Fehlend Gesamt
N Prozent N Prozent N Prozent
Education * Gender 769 96,7% 26 3,3% 795 100,0%
Fig.46:TotalnumberofrespondentswhogavevalidanswerstoeducationlevelandthegenderquestionThecrosstabshowsthat,inoursample,menrepresentthemajorityofhighschoolcertificateholderswith55%ofallresponsesinthosecategory.Bachelordegreesarespreadalmostevenlyamongmenandwomen,while65%ofallMaster'sdegreeholdersaremen.

Education * Gender Kreuztabelle
Gender
Gesamt Male Female
Education High-school Anzahl 91 73 164
% der Gesamtzahl 11,8% 9,5% 21,3%
Bachelor´s degree Anzahl 216 211 427
% der Gesamtzahl 28,1% 27,4% 55,5%
Master´s degree Anzahl 116 62 178
% der Gesamtzahl 15,1% 8,1% 23,1%
Gesamt Anzahl 423 346 769
% der Gesamtzahl 55,0% 45,0% 100,0%
Fig.47:Crosstabsforlevelsofeducationacrossgenders
Computingthechi-squaretestwith2degreesoffreedom(alwaysonelessthandependentvariablecategories)generatesachi-squarevalueov10.815atap-valueof0.004.Thecriticalteststatisticvalueforachi-squaretestwith2degreesoffreedomis5.99ata5%significancelevel(takenfromhere).Sinceourteststatisticishigherandsignificancecriteriaarematched,wecanrejectH0andsaythatgenderdoesindeedinfluencelevelofeducation.
Chi-Quadrat-Tests
Wert df
Asymptotische
Signifikanz
(zweiseitig)
Chi-Quadrat nach Pearson 10,815a 2 ,004
Likelihood-Quotient 10,958 2 ,004
Zusammenhang linear-mit-
linear 3,534 1 ,060
Anzahl der gültigen Fälle 769
a. 0 Zellen (0,0%) haben eine erwartete Häufigkeit kleiner 5. Die
minimale erwartete Häufigkeit ist 73,79. Fig.48:Chi-squaretestforindependentsamplesforimpactofgenderonlevelofeducationHowever,themeasuredcorrelationbetweengenderandlevelofeducationisweak,beinginthe(-)0.01-0.1range.Itisalsonothighlysignificant,asthetableofsymmetricmeasuresshows(neitherbelow0.05significancelevelforintervallnorordinalmeasureofthevariable).

Symmetrische Maße
Wert
Asymptotischer
standardisierter
Fehlera
Näherungsweises
tb
Näherungsweise
Signifikanz
Intervall- bzgl.
Intervallmaß
Pearson-R -,068 ,036 -1,883 ,060c
Ordinal- bzgl.
Ordinalmaß
Korrelation nach
Spearman -,069 ,036 -1,906 ,057c
Anzahl der gültigen Fälle 769 a. Die Null-Hyphothese wird nicht angenommen.
b. Unter Annahme der Null-Hyphothese wird der asymptotische Standardfehler verwendet.
c. Basierend auf normaler Näherung Fig.49:Correlationtableforeducationandgender
5.Question29&33:DomoremenhaveaMaster'sdegreethanwomen?Nowwewanttoinvestigatewhethersomeone,whohasaMaster'sdegreeismorelikelytobemalethanfemale.Inthiscase,"hasaMaster'sdegree"isaconditionwesetbeforeconductingthetest,makingthisa"onesample"testforadichotomous,nominalvariable(meaningthedependentvariableiswhethersomeoneismaleorfemale,giventheyhaveaMaster'sdegree).Therefore,ourH0becomes:"MenarelessorequallyaslikelytohaveaMaster’sdegreeaswomen."TheaccordingH1is"MenaremorelikelytohaveaMaster'sdegreethanwomen."Totestthis,wecreateadummyvariable,named"Education=Master'sdegree,"whichassignsavalueof1toanyonewhoownsaMaster'sdegree(valueofeducation=3)andavalueof0toeveryoneelse.Inoursample,178peoplehaveMaster’sdegree,116ofwhicharemale,62ofwhicharefemale.ThismeansalmosttwiceasmanymenholdaMaster'sdegreeaswomen.
Education=Master´s degree * Gender Kreuztabelle
Gender
Gesamt Male Female
Education=Master´s degree ,00 Anzahl 307 284 591
% der Gesamtzahl 39,9% 36,9% 76,9%
1,00 Anzahl 116 62 178
% der Gesamtzahl 15,1% 8,1% 23,1%
Gesamt Anzahl 423 346 769
% der Gesamtzahl 55,0% 45,0% 100,0%
Fig.50:CrosstabsfordistributionofMaster'sdegreesacrossmenandwomen

Thebarchartrepresentsthisvisually.Consideronlytherightside,asthoseareMaster's
degreeholders.
Fig.51:BarchartfordistributionofMaster'sdegreesacrossmenandwomen Usingthez-testformulafromsection7.3foronesample(sinceweonlyconsiderpeople,whohaveaMaster'sdegree)withadichotomousdependentvariable(areMasterdegreeholdersmenorwomen?),wecantestthehypothesis.
GivenH0,ourtestvalueoutsidethesampleis0.5(whichwouldindicatenotmorementhanwomenhaveaMaster'sdegree).Withasamplesizeof178,wecanestimatethepopulationstandarddeviation(sigma)to0.037.
Pluggingthisintoourz-testformula,wesubstractthetestvaluefromtheobservedproportionofmaleMaster'sdegreeholdersinoursample(0.65),dividebysigmaandattainaz-valueof4.04,whichishigherthantheone-sidedz-testvalue1.645(sinceweareonlyinterestedinwhetherlessmenhaveaMaster'sdegreethanwomen,notlessormore).Thus,wecanrejectthenullhypothesisatasignificancelevelof5%.OurconclusionisthatmenareindeedmorelikelytohaveaMaster'sdegreethanwomen.

6.Question20.1&20.1:Isthereacorrelationbetweensatisfactionwithdrink1andsatisfactionwithdrink2?Nowwewanttofindoutiftwovariablesarecorrelatedtooneanother.Forexample,itcouldbethatsomeone,whoreportsahighersatisfactionwithdrink1,alsoreportsahighersatisfactionwithdrink2(anexampleofapositivecorrelation).Alookatthedescriptivestatisticsshowsthataveragesatisfactionwithdrink1isslightlyhigherinoursamplethanwithdrink2(7.01vs.6.09).
Deskriptive Statistiken
Mittelwert
Standardabweic
hung N
Statisfaction Drink 1 7,01 1,629 671
Satisfaction Drink 2 6,09 1,915 566
Fig.52:Descriptivestatisticsforsatisfactionwithdrink1and2OurH0inthiscaseisthatthetwovariablesarenotcorrelated.H1isthatreportingahighsatisfactionwithdrink1leadstoahigherlikelihoodofreportinghighsatistfactionwithdrink2andtheotherwayaround.ComputingthecorrelationtablegivesusaPearson'sRof0.339,whichisconsideredevidenceofastrongassociation(0.30-0.99).Thecorrelationisalsosignificant,ata1%significanceleveleven.SinceRispositive,itindicatesthatpeoplewhoreporthighvaluesforsatisfactionwithdrink1willalsoreporthighlevelsofsatisfactionwithdrink2andviceversa.
Korrelationen
Statisfaction
Drink 1
Satisfaction
Drink 2
Statisfaction Drink 1 Korrelation nach Pearson 1 ,339**
Signifikanz (2-seitig) ,000
Quadratsummen und
Kreuzprodukte 1777,851 590,224
Kovarianz 2,654 1,045
N 671 566
Satisfaction Drink 2 Korrelation nach Pearson ,339** 1
Signifikanz (2-seitig) ,000 Quadratsummen und
Kreuzprodukte 590,224 2072,037
Kovarianz 1,045 3,667
N 566 566
**. Die Korrelation ist auf dem Niveau von 0,01 (2-seitig) signifikant. Fig.53:Correlationtableforsatisfactionwithdrink1and2

7.Question18.1&9:Isthereacorrelationbetweendrink1providingtheintendedbenefitsandwhatpriceisconsideredappropriate?Lastly,we'dliketoknowifsomeone,whoobservesthebenefitsthey'dliketogetfromconsumingenergydrinks,isconsideringahigherpriceasmoreappropriate(andthuswillingtopaymore),orifpeoplewhoconsiderhigherpricesasokaybelievetheirenergydrinkstobenefitthemmore(acorrelationgoesbothways).H0inthiscaseisthereisnocorrelationbetweenperceivingbenefitsasstrongerandconsideringahigherpriceasappropriate(orviceversa).H1thenindicatesthatreportinghigherperceivedbenefitsmakesitlikeliertoalsoreporthigherpricesasappropriate.Descriptivestatisticsshowaveragesforbothvaluesat2.79forappropriateprice(whichcorrespondstothe1€to1.50€level)andaveragelevelofbenefitsperceivedat7.02.
Deskriptive Statistiken
Mittelwert
Standardabweic
hung N
Appropriate Price 2,79 ,852 679
Benefits 7,02 2,014 672
Fig.54:DescriptivestatisticsforobservationofdesiredbenefitsandappropriatenessofpricesofenergydrinksThecorrelationtablerevealsasignificant(atthe1%leveleven)correlation,albeitaweakone.Wecanrejectthenullhypothesis.Therefore,ahigherlevelofwhatpeoplethinkisanappropriatepricehasanimpactonhowmuchtheyobservethebenefitstheydesirefromanenergydrink(andviceversa).
Korrelationen
Appropriate
Price Benefits
Appropriate Price Korrelation nach Pearson 1 ,134**
Signifikanz (2-seitig) ,000
Quadratsummen und
Kreuzprodukte 492,035 154,786
Kovarianz ,726 ,231
N 679 672
Benefits Korrelation nach Pearson ,134** 1
Signifikanz (2-seitig) ,000 Quadratsummen und
Kreuzprodukte 154,786 2722,749
Kovarianz ,231 4,058
N 672 672
**. Die Korrelation ist auf dem Niveau von 0,01 (2-seitig) signifikant. Fig.55:Correlationtableforobservationofdesiredbenefitsandappropriatenessofprice

8.FactorAnalysis-PrincipalComponents,VarimaxRotationAfactoranalysisservesthepurposeofuncoveringlatent(hidden)variablesinadataset,whichmayinfluenceseveralothervariables.Psychologicalconstructs,suchasethnicity,materialismorintroversionarehardtomeasurewithsingularquestions,asanswersaresubjective.Togetamoregranularpicture,itcanhelptoaskmorequestionsaboutsubtlequestions,whichtargetsub-featuresofthemorecomplexconcept.Forexample"Howoftendoyougooutonweekends?"and"Howlikelyareyoutoaskastrangerfordirectionsinpublic?"findoutmoreaboutintroversioninvarioussituations,andcanbepartofalargersetofquestions,whichislatersubjectedtoafactoranalysis.Afactoranalysisletsusfindasmallersetofvariables,whichexplainmostofthevarianceinthedatasetforalltheactuallymeasuredones.Inthisstudy,wewillconductanexploratoryfactoranalysis,whichisusedtolearnmoreaboutadataset.Itisaprincipalcomponentanalysis,usingavarimaxrotation,asweexpecttheresultingfactorstobeindependent.Theanalyzedquestionbatteryisforquestion18,whichasksfortheimportanceofseveralattributesofrespondents'preferreddrinknumber1.Iftheanalysisissuccessful,wecangroupseveralvariablestogetherinafewernumberoffactorsandthensayparticipantsconsiderthesefactorsasimportant,whenchoosingtheirpreferredbrandofenergydrink.
1.Kaiser-Meyer-Olkincriterion&Bartlett'stestBeforeperformingafactoranalysis,it'simportanttoanalyzewhetherafactoranalysismakessenseforthegivendataset.Forthis,thevariableshavetobecorrelated,butnottoomuch(nomulti-collinearityorsingularity,whichisveryhighorperfectcorrelation).Tomeasurethis,wecanusetheKaiser-Meyer-OlkinmeasureofsamplingadequacyandBartlett'stestofsphericity.ThefirstoutputwereceivefromSPSSisthecorrelationmatrixforallvariables.Scanningthisforcorrelationcoefficientshigherthan0.9andsignificancevalues>0.05showsusvariables,whichweshouldconsidereliminatingfromtheanalysis.Onlythesignificanceofbrandisslightlyoverthislimit.Allothervalueslookgood.

Benefits Brand Packaging Availability Price Variety Taste Healthiness Sparkling Freshness Color Calories Digest
Korr. Benefits 1,000 ,285 ,291 ,420 ,197 ,151 ,336 ,087 ,244 ,333 ,116 ,160 ,225
Brand ,285 1,000 ,492 ,382 ,061 ,229 ,113 ,091 ,221 ,203 ,297 ,137 ,265
Packaging ,291 ,492 1,000 ,388 ,161 ,349 ,235 ,199 ,305 ,340 ,442 ,284 ,387
Availability ,420 ,382 ,388 1,000 ,313 ,227 ,324 ,089 ,200 ,332 ,206 ,167 ,247
Price ,197 ,061 ,161 ,313 1,000 ,254 ,192 ,232 ,099 ,159 ,186 ,234 ,211
Variety ,151 ,229 ,349 ,227 ,254 1,000 ,176 ,307 ,283 ,237 ,298 ,390 ,351
Taste ,336 ,113 ,235 ,324 ,192 ,176 1,000 ,085 ,330 ,474 ,239 ,166 ,214
Healthiness ,087 ,091 ,199 ,089 ,232 ,307 ,085 1,000 ,122 ,273 ,283 ,508 ,417
Sparkling ,244 ,221 ,305 ,200 ,099 ,283 ,330 ,122 1,000 ,574 ,348 ,253 ,320
Freshness ,333 ,203 ,340 ,332 ,159 ,237 ,474 ,273 ,574 1,000 ,350 ,317 ,396
Color ,116 ,297 ,442 ,206 ,186 ,298 ,239 ,283 ,348 ,350 1,000 ,374 ,440
Calories ,160 ,137 ,284 ,167 ,234 ,390 ,166 ,508 ,253 ,317 ,374 1,000 ,547
Digest ,225 ,265 ,387 ,247 ,211 ,351 ,214 ,417 ,320 ,396 ,440 ,547 1,000
Sig. (1-seitig) Benefits ,000 ,000 ,000 ,000 ,000 ,000 ,012 ,000 ,000 ,001 ,000 ,000
Brand ,000 ,000 ,000 ,056 ,000 ,002 ,009 ,000 ,000 ,000 ,000 ,000
Packaging ,000 ,000 ,000 ,000 ,000 ,000 ,000 ,000 ,000 ,000 ,000 ,000
Availability ,000 ,000 ,000 ,000 ,000 ,000 ,011 ,000 ,000 ,000 ,000 ,000
Price ,000 ,056 ,000 ,000 ,000 ,000 ,000 ,005 ,000 ,000 ,000 ,000
Variety ,000 ,000 ,000 ,000 ,000 ,000 ,000 ,000 ,000 ,000 ,000 ,000
Taste ,000 ,002 ,000 ,000 ,000 ,000 ,014 ,000 ,000 ,000 ,000 ,000
Healthiness ,012 ,009 ,000 ,011 ,000 ,000 ,014 ,001 ,000 ,000 ,000 ,000
Sparkling ,000 ,000 ,000 ,000 ,005 ,000 ,000 ,001 ,000 ,000 ,000 ,000
Freshness ,000 ,000 ,000 ,000 ,000 ,000 ,000 ,000 ,000 ,000 ,000 ,000
Color ,001 ,000 ,000 ,000 ,000 ,000 ,000 ,000 ,000 ,000 ,000 ,000
Calories ,000 ,000 ,000 ,000 ,000 ,000 ,000 ,000 ,000 ,000 ,000 ,000
Digest ,000 ,000 ,000 ,000 ,000 ,000 ,000 ,000 ,000 ,000 ,000 ,000 a. Determinante = ,026 Fig.56:Coefficientmatrixforfactoranalysis

NowwecancomputetheKMO-valueandBartlett'stest.TheKMOvalueis0.842.Thetestisconsideredaspassedforvaluesof0.5andhigher,whichmeansaccordingtotheKMOtest,thedatasetisfitforafactoranalysis.Theresultingfactorsshouldbereliableandsufficientlydifferentfromoneanother.Bartlett'stesttriestorejecttheH0hypothesisthatthecorrelationmatrixisreallyanidentitymatrix,inwhichallcorrelationcoefficientsarezero,meaningthevariableswouldallbeindependentandthusalsonotsuitableforafactoranalysis.Thetestissignificant(p<0.001),whichmeanswecanrejectthisnullhypothesisandcontinuewithourfactoranalysis.
KMO- und Bartlett-Test
Maß der Stichprobeneignung nach Kaiser-Meyer-Olkin. ,842
Bartlett-Test auf Sphärizität Ungefähres Chi-Quadrat 2420,509
df 78
Signifikanz nach Bartlett ,000
Fig.57:Kaiser-Meyer-OlkincriterionandBartletttestforfactoranalysis
2.NumberofextractedfactorsbasedonScreeplotandEigenvaluesNext,wecanlookatthecomputedScreeplotandEigenvaluetable,inordertodeterminehowmanyfactorsweshouldextractfromourdataset.AllfactorswithanEigenvalue>1willbeextracted,asthevariablesbelongingtotheseexplainmostofthevarianceofthedataset.TheScreeplotshowstheEigenvaluesofthefactorsindecreasingorder,meaningwheretheslopeofthecurveflattensiswhereweshouldstopourextractionprocess.Inthiscase,thecurveflattensafterfactornumber4.
Fig.58:Screeplotforfactoreigenvalues

ThetableofEigenvaluesandexplainedtotalvarianceconfirmsthis.Itshowsusthatthefirst4factorshaveEigenvalues>1.Combined,theyexplain62.52%ofthetotalvarianceinthedataforthisquestion.Thistablealsoshowsthesquaredandrotatedsumsofthefactorloadings,rotatedbeingthefinalsolution,whererelativeimportanceofallfourfactorshasbeenequalized,buttotalexplainedvarianceremainsthesame.
Erklärte Gesamtvarianz
Komponente
Anfängliche Eigenwerte
Summen von quadrierten
Faktorladungen für Extraktion
Rotierte Summe der
quadrierten Ladungen
Gesamt
% der
Varianz
Kumulierte
% Gesamt
% der
Varianz
Kumulierte
% Gesamt
% der
Varianz
Kumulierte
%
1 4,334 33,336 33,336 4,334 33,336 33,336 2,558 19,678 19,678
2 1,528 11,756 45,092 1,528 11,756 45,092 2,077 15,979 35,658
3 1,165 8,965 54,056 1,165 8,965 54,056 1,895 14,576 50,233
4 1,101 8,466 62,522 1,101 8,466 62,522 1,598 12,289 62,522
5 ,785 6,038 68,560 6 ,705 5,424 73,984 7 ,614 4,723 78,707 8 ,559 4,302 83,009 9 ,528 4,059 87,068 10 ,467 3,591 90,658 11 ,455 3,500 94,159 12 ,419 3,223 97,382 13 ,340 2,618 100,000
Extraktionsmethode: Hauptkomponentenanalyse. Fig.59:Eigenvaluesandproportionoftotalvarianceexplainedforsquaredandrotatedfactors
3.Question,forwhichthehighestproportionoftotalvarianceisexplainedAnotheroutputwereceivefromSPSSisthetableofcommunalities.Thisshowsushowmuchofthevarianceinagivenvariable(inthiscasequestion)iscommontotheextractedfactors.Here,itishighestfortheattribute"brand",followedverycloselyby"freshness".Thevalueof0.742means74.2%ofthevariancearoundtheimportanceofbrandisexplainedbyour4chosenfactors.

Kommunalitäten
Anfänglich Extraktion
Benefits 1,000 ,541
Brand 1,000 ,742
Packaging 1,000 ,664
Availability 1,000 ,674
Price 1,000 ,670
Variety 1,000 ,415
Taste 1,000 ,628
Healthiness 1,000 ,615
Sparkling 1,000 ,666
Freshness 1,000 ,734
Color 1,000 ,526
Calories 1,000 ,660
Digest 1,000 ,592
Extraktionsmethode: Hauptkomponentenanalyse. Fig.60:Tableofcommunalities
4.Factorloadingandchosenfactorof"brand"Afterdecidinghowmanyfactorstoextract,wecannowlookatthecomponentmatrixandrotatedcomponentmatrixtoseehowweshouldallocateourvariablestoeachofthe4factors.AccordingtoHairet.al.(1998,pg.111),onlyfactorloadingsof±0.5are"PracticallySignificant"andarethusthemostexpressive,sowewillonlyinterpretthoseinouranalysis.Unlessfactorloadingsareveryclosetooneanother,variablesshouldbeallocatedtothefactorforwhichtheyhavethehighestfactorloading.Forexample,lookingattherotatedcomponentmatrixwithallloadings(novaluescutoff),wecanseethatthevariable"brand"hasa0.848loadingforfactor3,andverylittleloadingsfortheotherfactors(0.035-0.137).Thismeansweshouldallocateittofactor3.

Rotierte Komponentenmatrixa
Komponente
1 2 3 4
Calories ,791 ,160 ,062 ,070
Healthiness ,778 ,023 -,053 ,077
Digest ,666 ,268 ,272 ,060
Variety ,554 ,084 ,263 ,177
Color ,491 ,316 ,421 -,086
Freshness ,259 ,793 ,119 ,152
Sparkling ,187 ,765 ,205 -,061
Taste ,029 ,685 -,023 ,397
Brand ,054 ,035 ,848 ,137
Packaging ,277 ,197 ,726 ,150
Price ,386 -,063 -,117 ,709
Availability ,037 ,177 ,429 ,676
Benefits -,035 ,337 ,261 ,599
Extraktionsmethode: Hauptkomponentenanalyse.
Rotationsmethode: Varimax mit Kaiser-Normalisierung.
a. Die Rotation ist in 9 Iterationen konvergiert. Fig.61:Rotatedcomponentmatrixforfactoranalysiswithallvalues(nocutoffvaluespecified)Wewilllaterseethatthisfactorconsistsofonlytwovariables,yetitexplainsalmost15%ofthetotalvarianceofthedata(seeFig.59),whereasfactor1explainsalmost20%ofthetotalvariance,butalsohas4variablesallocatedtoit.The"strength"of"brand"makessense,asweearlierlearnedthatalmost75%ofthetotalvarianceofthisquestionisexplainedbythe4factors,makingitoneofthestrongestvariablesinthemodelforthesignificanceoftheunderlyingfactors.
5.AnalysisandinterpretationofextractedfactorsLastly,wecanallocatethedifferentvariablestotheextractedfactorswiththerotatedcomponentmatrix.Thefirstiterationoftheanalysisyieldsthecomponentmatrix,wherefactorimportancehasn'tbeenrelativizedyet.

Komponentenmatrixa
Komponente
1 2 3 4
Digest ,695 Freshness ,686 -,459 Packaging ,668 Color ,632 Calories ,619 -,519 Sparkling ,591 Variety ,569 Availability ,563 ,444 Taste ,511 -,471 Benefits ,496 ,469 Healthiness ,488 -,589 Brand ,501 ,584 Price ,404 ,708
Extraktionsmethode: Hauptkomponentenanalyse.
a. 4 Komponenten extrahiert Fig.62:ComponentmatrixforfactoranalysisRotatingthesecomponentsagainwiththeorthogonalVarimaxmethod,wethenreceiveasorted,finalmatrix.Asexplainedabove,wewillonlyconsiderloadingshigherthan±0.5.Toclarifythat"color"willbeomitted,acutoffvalueof0.4wasspecifiedhere.
Rotierte Komponentenmatrixa
Komponente
1 2 3 4
Calories ,791 Healthiness ,778 Digest ,666 Variety ,554 Color ,491 ,421 Freshness ,793 Sparkling ,765 Taste ,685 Brand ,848 Packaging ,726 Price ,709
Availability ,429 ,676
Benefits ,599
Extraktionsmethode: Hauptkomponentenanalyse.
Rotationsmethode: Varimax mit Kaiser-Normalisierung.
a. Die Rotation ist in 9 Iterationen konvergiert. Fig.63:Rotatedcomponentmatrixforfactoranalysis

Asafinalresult,weload"calories","healthiness","digestability"and"variety"onfactor1,"freshness","sparkling"and"taste"onfactor2,"brand"and"packaging"onfactor3and"price","availability"and"benefits"onfactor4.Lookingatthesegroupings,wecannowcomeupwithnamesforourfactorstoseetheunderlyingthemesthatdeterminemostoftherespondents'answersregardingwhat'simportanttothemwhenchoosingtheirnumber1energydrink.Factor1couldbelabeled"Healtheffects",asmostoftheincludedvariablesrelatetohowwellthehumanbodycanhandlethedrink.Fewercalories,healthieringredients,betterdigestabilityandalargervarietyiningredientsallhaveapositiveimpactonhowgoodanenergydrinkwillbeforbodilyhealth(orlessharmful).Factor2couldbecalled"Drinkingexperience",sincefreshness,sparklingandtastecombinedcreatetheexperiencewhentakingasipfromthedrinkandswallowingit.Ifanenergydrinkisfresh,sparklesandtastesgood,peopleenjoytheprocessofdrinkingitmore.Factor3couldbecalled"Marketing"astheentireideaofabrandrepresentscertainattributesandattitudespeopleexpectandassociatewithacertainproductfromacertaincompany.Thepackagingaddstothat.Ifthecanisbeautifullydesignedandeasytouse,peoplearemorelikelytotakeitofftheshelfandbuyitoverothers.Factor4includesprice,availabilityandbenefits,whichiswhywecouldcallit"price-performanceratio",whichdescribeshowmuchofthebenefitspeopledesireget,giventhemoneyandeffortthey'veexertedinattainingthedrink.Themoremoneypeoplespendandtheharderitistogettheirpreferredenergydrink,themoreimportantitbecomestheyreceivethebenefitstheywantfromthedrink.Regardinghowthefactorsaregroupedtogether,allofthefactorsmakepsychologicalsense."Healtheffects"areanissuemostconsumersareconcernedwithformanyfoodanddrinkproducts.Peoplealsodonotbuyproductstheythinktheywillnotenjoy,hence"Drinkingexperience"isalsoalogicfactortoinclude."Marketing"hasbeenproventoaffectconsumerbehavioranddecisionsforaverylongtime."Price-performanceratio"isalsoawell-knownconceptinconsumerbehaviorresearch.Ourfactoranalysishasthusbeensuccessfulinreducingthenumberofvariablesto4factors,which,combined,explainover60%ofthevarianceofallvariablesofquestion18.Thismeansthese4factorsarethemaininfluencefactorsonwhatpeoplethinkisimportantwhenchoosingtheirfavoriteenergydrink.

9.ConclusionUsingvariousstatisticalanalysismethods,wehavelearnedalotmoreabouttheconsumptionofenergydrinksfromthepeopleinourdataset.Welearnedthatmostofthepeopleinourdatasetconsumeenergydrinksrarelyandconsider1€to1.50€asacceptablepricesusingfrequencyanalyses.Wefoundoutthatdescriptivestatisticsdonotalwaysleadtomeaningfulconclusionsandthatsometimes,datamustbeformattedandcorrectedagainmid-waythroughtheanalysis.Wesawfromcrosstabsthateventhoughoursampleindicatedmentendtodrinkenergydrinksmorethanwomen,wecouldnotconfirmthishypothesisonasignificantlevel.Usinginferentialstatistics,wecreatedhypothesesaboutthepopulation,suchasmenandwomenbeingequallysatisfiedwithenergydrinks,yetpeopleingeneralalwayspreferringtheirnumber1energydrinkovernumber2.Usingafactoranalysis,wewereevenabletoaggregateseveralvariablesinto4factors,whichrepresentmeaningfulpsychologicalconstructs,bywhichimportanceofenergydrinkattributescanbemeasured.However,eachstatisticalstudyhasitslimits.Forexample,sinceweusedconveniencesampling,theremightbeaselectionbiasinourdata-peoplewholikeenergydrinksalreadyareofcoursemorelikelytoparticipateinasurveyaboutenergydrinks.Also,sincethedatawasaggregatedacrosssomanydatacollectors(allstudentsintheclass),thesamerespondentsmighthavetakenthequestionnairemultipletimes(forexampleiftwopeoplefromtheclasshappenedtoaskthesamepersontoparticipateandtheydidnotdeclinethesecondrequest).Toverifyandbuildontheclaimsmadeinthisanalysis,manymorestudiesandsurveysaboutenergydrinkswillbeneeded,withdifferentsamplesizes,selectionmethods,surveyquestionsandanalysismethods.Itseemsthatforstatistics,thesameremarksStephenHawkingmadeaboutphysicaltheoriesholdtrue,whichexplainboththebeautyandthecurseofscientificresearch:“Anyphysicaltheoryisalwaysprovisional,inthesensethatitisonlyahypothesis:youcanneverproveit.Nomatterhowmanytimestheresultsofexperimentsagreewithsometheory,youcanneverbesurethatthenexttimetheresultwillnotcontradictthetheory.”
-StephenHawking