Embed Size (px)
Citation preview

Consumption and the Consumption Function in the U.S. 1948-1949 RecessionAuthor(s): Arnold ZellnerSource: The Review of Economics and Statistics, Vol. 39, No. 3 (Aug., 1957), pp. 303-311Published by: The MIT PressStable URL: http://www.jstor.org/stable/1926046 .
Accessed: 28/06/2014 16:25
Your use of the JSTOR archive indicates your acceptance of the Terms & Conditions of Use, available at .http://www.jstor.org/page/info/about/policies/terms.jsp
.JSTOR is a not-for-profit service that helps scholars, researchers, and students discover, use, and build upon a wide range ofcontent in a trusted digital archive. We use information technology and tools to increase productivity and facilitate new formsof scholarship. For more information about JSTOR, please contact [email protected].
.
The MIT Press is collaborating with JSTOR to digitize, preserve and extend access to The Review ofEconomics and Statistics.
http://www.jstor.org
This content downloaded from 193.0.147.17 on Sat, 28 Jun 2014 16:25:04 PMAll use subject to JSTOR Terms and Conditions
CONSUMPTION AND THE CONSUMPTION FUNCTION IN THE U.S. 1948-1949 RECESSION
Arnold Zellner *
CONSUMPTION has been cast as both villain and hero in the 1948-49 recession
in the United States. It has been asserted that a weakening of consumption was important in accounting for the downturn. R. A. Gordon cites the levelling off of consumer demand as one of several factors responsible for the down- turn.1 D. Hamberg has suggested an under- consumptionist explanation of the downturn.2 Even C. A. Blyth who set out to prove that the ". . . most important cause of the I948-I949
recession was a substantial fall in fixed invest- ment . . ." felt compelled to state in his con- clusions, "I accept the view that a reduced rate of growth in consumption - both domestically and in the export trade . . . in I948 caused unplanned inventory accumulation, which in- duced a fall in production of certain nondur- ables and consumer durables."3 Further, it has been argued that it was the strength of con- sumption which at least in part accounted for the mildness of the I949 recession. R. Fels as- serts that an upward shift in the consumption function occurred in I949 which, along with continuing high levels of autonomous invest- ment and government expenditures, accounted for the mildness of the recession.4 R. A. Gor- don had adopted a similar view earlier, both with respect to the mitigating effects of the maintenance of a high level of consumption and to the strength of autonomous investment and government expenditures, although he makes no explicit reference to a shift of the consump-
tion function.5 Hamberg points to the secular rise in the consumption function, deferred con- sumer replacement demand, and high levels of autonomous investment as factors explaining why this recession failed to develop into a major downturn.6 Blyth cites the continued rise in consumption during I949 as one among several factors which modified the recession.7
Since consumption figures largely in explana- tions of the I948-49 cycle, and in fact appears called upon to play a dual role, it may be use- ful to direct careful inquiry into determining what influences prompted consumption to be- have as it did.
Short-Run Consumption Functions
Clearly in discussing the behavior of con- sumption in an episode as short as the I948-49 recession, it is necessary to turn to quarterly data. In a recent paper, the author has esti- mated and tested ten short-run consumption functions using price-deflated, seasonally-ad- justed data, I947-I to I955-IV (excluding I950-
III and IgsI-I) 8 On the basis of several cri- teria, including predictive ability, the following two short-run consumption function estimates were found superior to others tested.9
* I wish to thank Professor R. A. Gordon and my col- leagues at the University of Washington, in particular Pro- fessor P. W. Cartwright, for valuable comments.
'R. A. Gordon, Business Fluctuations (New York, 1952),
440. 2D. Hamberg, "The Recession of I948-49 in the United
States," Economic Journal, IXII (March 1952), I-I4. See also D. Hamberg's rejoinder following E. C. Bratt and J. P. Ondrechen, "I948-49 Recession Re-examined," Economic Journal, LXII (March I953), 98-I04.
'C. A. Blyth, "The I948-49 American Recession," Eco- nomic Journal, LXIV (September I954), 486-5IO, 486 and 509.
4 R. Fels, "Theoretical Significance of the I949 Reces- sion," American Economic Review (Papers and Proceed- ings), xLv (May I955), 358-66.
5R. A. Gordon, op. cit., 442-43.
6D. Hamberg, op. cit., ii.
C. A. Blyth, op. cit., 489. 8A. Zellner, "The Short Run Consumption Function,"
presented to the Seattle meeting of the Econometric Society, August I956. The quarters 195o-III and ig5i-I were ex- cluded from the sample period, since the economy suffered exogenous shocks in these two quarters, namely, the effects of the outbreak of the Korean War in mid-i950 and of mili- tary reverses and the entry of the Chinese into the war, which affected expenditures in early 195I. On this latter point, see B. G. Hickman, "The Korean War and United States Economic Activity, I950-I952," Occasional Paper 49, National Bureau of Economic Research (New York, 1955), 3 and i7.
'Figures in parentheses are standard errors, and R2 is the adjusted coefficient of determination. In the case of A and B, the residuals were found to be non-autocorrelated at the 95% level of significance (Durbin-Watson test). Other functions tested incorporated past peak income, past peak consumption, and income lagged three months, in addition to the variables listed above. Earlier, other less satisfactory estimates had been obtained utilizing quarterly data, I947-I-
[ 303 ]
This content downloaded from 193.0.147.17 on Sat, 28 Jun 2014 16:25:04 PMAll use subject to JSTOR Terms and Conditions
304 THE REVIEW OF ECONOMICS AND STATISTICS
Estimate R A. C/P = -2I.9I + 0.708 YIp + 0.368 (L/P') 1 0.979
(0.02 I) (0.054)
B. C/P = - i8.96 + 0.375 YIP + 0.489 (C/P) -. 0.984 (O.rII0) (o.i6o)
+ 0.2I9 (LIp').. (o.o67)
Above, the following notation has been employed: 10
C/p personal consumption expenditures, seasonally adjusted at annual rates, in billions of dollars, deflated by the BLS Consumer Price Index, I947-49 = I.00.
YIp personal disposable income, seasonally adjusted at annual rates, in billions of dollars, deflated by the BLS Consumer Price Index, I947-49 = I.00.
(CIp)-1 consumption, as above, lagged three months.
(L/p') _1 beginning of quarter liquid assets (indi- viduals' currency, demand and time de- posits, saving and loan association shares, and U. S. Saving Bonds), seasonally ad- justed, in billions of dollars, deflated by the beginning of quarter BLS Consumer Price Index, I947-49 = I.00 (average of index for first month and last month of previous quarter for each quarter).
The a priori grounds for expecting a positive coefficient for consumption lagged one quarter have been discussed previously. They include T. M. Brown's continuous habit persistence hypothesis 11 and a version of M. Friedman's permanent income hypothesis.'2 The "low" estimate of the short-run marginal propensity to consume in estimate B (0.375) is quite close to Brown's estimate of the short-run "intra-
year" marginal propensity to consume (0.3385) derived from his work with annual data for Canada.13 However, it should be noted that the estimated coefficient of income in B has a stand- ard error (o.iio) which is not small.
In what follows, the "direct" least-squares estimates, A and B, will be used as starting points in constructing an explanation of con- sumption's behavior in the I948-49 recession.14 Then, supplementary information will be brought to bear on that part of consumption's variation which is unexplained by these func- tions - that is, an effort will be made to explain the unexplained, where the unexplained is the pattern of the residuals.15
Explanation of Behavior of Consumption
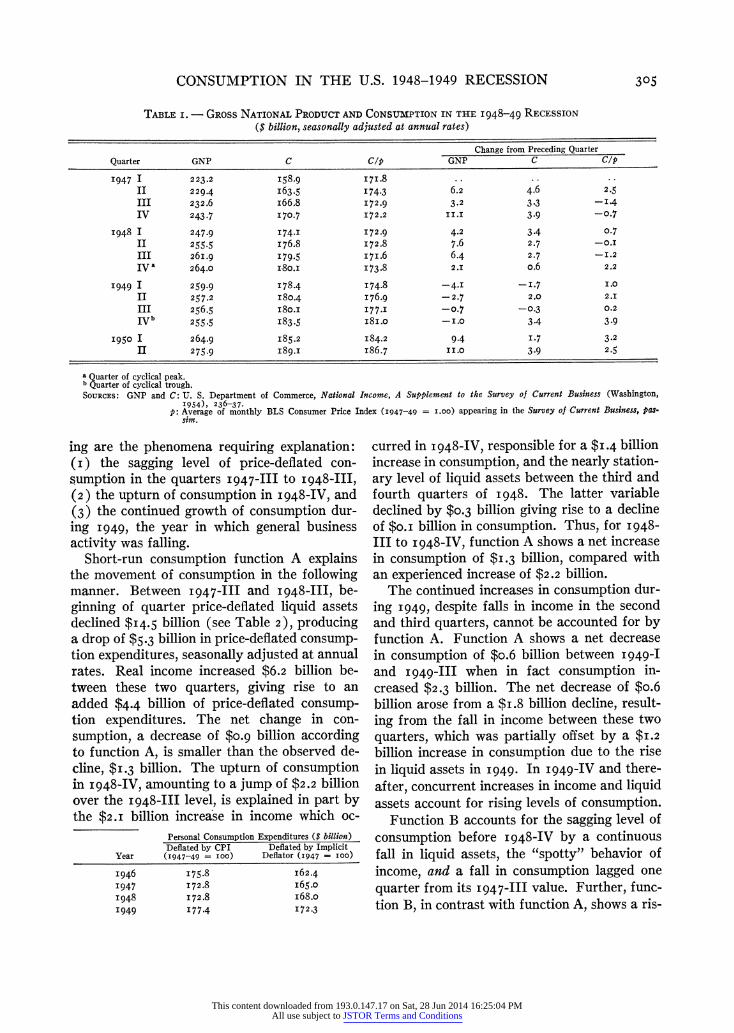
The data in Table i reveal the behavior of consumption in the I948-49 cycle. Undeflated consumption expenditures (C) and GNP rise to a peak in I948-IV. While GNP falls con- tinuously to a trough in I949-IV 16, undeflated consumption expenditures show a decline in I949-I, a substantial increase in I949-II, a slight decline in I949-III, and substantial quar- terly increases thereafter. Price-deflated con- sumption expenditures (C/p), with which this study is concerned, exhibit a pattern of varia- tion which differs from those of GNP and C. Noe that before I948-IV, C/p does not rise smoothly, as was the case with GNP and C, but actually declines during the latter part of I947 and in the second and third quarters of I948. The fourth quarter of I948 saw a sub- stantial increase in C/p, followed by uninter- rupted increases thereafter; that is, C/p shows no downturn at all in I949.l7 Thus, the follow-
I952-IV (excluding 195o-III and I95I-I) and functions involving price-deflated per capita variables. At present, the author is of the opinion that a population variable in a short-run consumption function does not help very much to "explain" the short-run variation of consumption.
10 For sources of data, see Tables i and 2. Use of season- ally adjusted data is necessary since the Department of Commerce's seasonally unadjusted data ". . . are not in- tended for analytical purposes; they are neither completely unadjusted nor completely adjusted for seasonal factors but rather a hybrid." I. Friend with V. Natrella, Individuals' Saving (New York, 1954), 45.
" T. M. Brown, "Habit Persistence and Lags in Consumer Behavior," Econometrica, xx (July I952), 355-7I.
' M. Friedman, A Theory of the Consumption Function (New York, I955), preliminary draft, cited with permission of the author. In A. Zellner, An Empirical and Theoretical Analysis of Short-Run Consumption Functions (Ph.D. dissertation, University of California, i957), ch. 2, it is shown that a version of Friedman's hypothesis implies a positive dependence of current consumption on consumption lagged one period.
' T. M. Brown, op. cit., 368. Note that a very reason- able long-run marginal propensity to consume may be ob- tained from estimate B.
'In A. Zellner, Short-Run Consumption Functions two reduced form estimates are presented.
' The methodology underlying this approach will be dis- cussed in a future article.
" The National Bureau dating of the peak and trough is November I948 and October I949, respectively. See R. A. Gordon, op. cit., 2I6.
"Unfortunately, the Department of Commerce's implicit deflator for personal consumption expenditures is not avail- able on a quarterly basis; therefore it is necessary to rely on the BLS CPI for deflation purposes. That this may be far from satisfactory is revealed from study of the annual personal consumption expenditure data:
This content downloaded from 193.0.147.17 on Sat, 28 Jun 2014 16:25:04 PMAll use subject to JSTOR Terms and Conditions
CONSUMPTION IN THE U.S. 1948-1949 RECESSION 305
ing are the phenomena requiring explanation: (i) the sagging level of price-deflated con- sumption in the quarters I947-III to I948-III, (2) the upturn of consumption in I948-IV, and (3) the continued growth of consumption dur- ing I949, the year in which general business activity was falling.
Short-run consumption function A explains the movement of consumption in the following manner. Between I947-III and I948-III, be- ginning of quarter price-deflated liquid assets declined $I4.5 billion (see Table 2), producing a drop of $5.3 billion in price-deflated consump- tion expenditures, seasonally adjusted at annual rates. Real income increased $6.2 billion be- tween these two quarters, giving rise to an added $4.4 billion of price-deflated consump- tion expenditures. The net change in con- sumption, a decrease of $o.9 billion according to function A, is smaller than the observed de- cline, $I.3 billion. The upturn of consumption in I948-IV, amounting to a jump of $2.2 billion over the I948-Ill level, is explained in part by the $2.I billion increase in income which oc-
curred in I948-IV, responsible for a $I.4 billion increase in consumption, and the nearly station- ary level of liquid assets between the third and fourth quarters of I948. The latter variable declined by $0.3 billion giving rise to a decline of $o.i billion in consumption. Thus, for I948- III to I 948-IV, function A shows a net increase in consumption of $I.3 billion, compared with an experienced increase of $2.2 billion.
The continued increases in consumption dur- ing I949, despite falls in income in the second and third quarters, cannot be accounted for by function A. Function A shows a net decrease in consumption of $o.6 billion between I949-I and I949-III when in fact consumption in- creased $2.3 billion. The net decrease of $o.6 billion arose from a $i.8 billion decline, result- ing from the fall in income between these two quarters, which was partially offset by a $I.2
billion increase in consumption due to the rise in liquid assets in I949. In I949-IV and there- after, concurrent increases in income and liquid assets account for rising levels of consumption.
Function B accounts for the sagging level of consumption before I948-IV by a continuous fall in liquid assets, the "spotty" behavior of income, and a fall in consumption lagged one quarter from its I947-Ill value. Further, func- tion B, in contrast with function A, shows a ris-
TABLE i. - GROSS NATIONAL PRODUCT AND CONSUMPTION IN THE I948-49 RECESSION
($ billion, seasonally adjusted at annual rates)
Change from Preceding Quarter Quarter GNP C C/P GNP C C/P
I947 I 223.2 I58.9 I7I.8 ..
II 229.4 I63.5 I74-3 6.2 4.6 2.5
III 232.6 i66.8 I72.9 3.2 3.3 -I.4
IV 243.7 I70.7 I72.2 II.I 3.9 -0.7
I948 I 247.9 I74-I I72.9 4.2 3.4 0.7
II 255.5 I76.8 I72.8 7.6 2.7 -0J.
III 26I.9 I79.5 I7I.6 6.4 2.7 -I.2
IV a 264.0 I80.I I73.8 2.J o.6 2.2
I949 I 259-9 I78.4 I74.8 -4.I -I.7 1.0
II 257.2 I80.4 I76.9 - 2.7 2.0 2.1
1II 256.5 I80.I I77.I -0.7 -0.3 0.2
IVb 255.5 I83-5 I8I.0 -I.0 3-4 3.9
I950 I 264-9 I85.2 I84.2 9.4 I.7 3.2
II 275.9 I89.I I86.7 II.0 3.9 2.5
a Quarter of cyclical peak. b Quarter of cyclical trough. SOURCES: GNP and C: U. S. Department of Commerce, National Income, A Supplement to the Survey of Current Business (Washington,
I954), 236-37. p: Average of monthly BLS Consumer Price Index (I947-49 = I.OO) appearing in the Survey of Current Business, pas-
sim.
Personal Consumption Expenditures ($ billion) Deflated by CPI Deflated by Implicit
Year (I947-49 = IOO) Deflator (947 = IOO)
I946 I 75.8 I62.4
I947 I72.8 i65.o
I948 I72.8 i68.o
I949 I77.4 I72.3
This content downloaded from 193.0.147.17 on Sat, 28 Jun 2014 16:25:04 PMAll use subject to JSTOR Terms and Conditions
306 THE REVIEW OF ECONOMICS AND STATISTICS
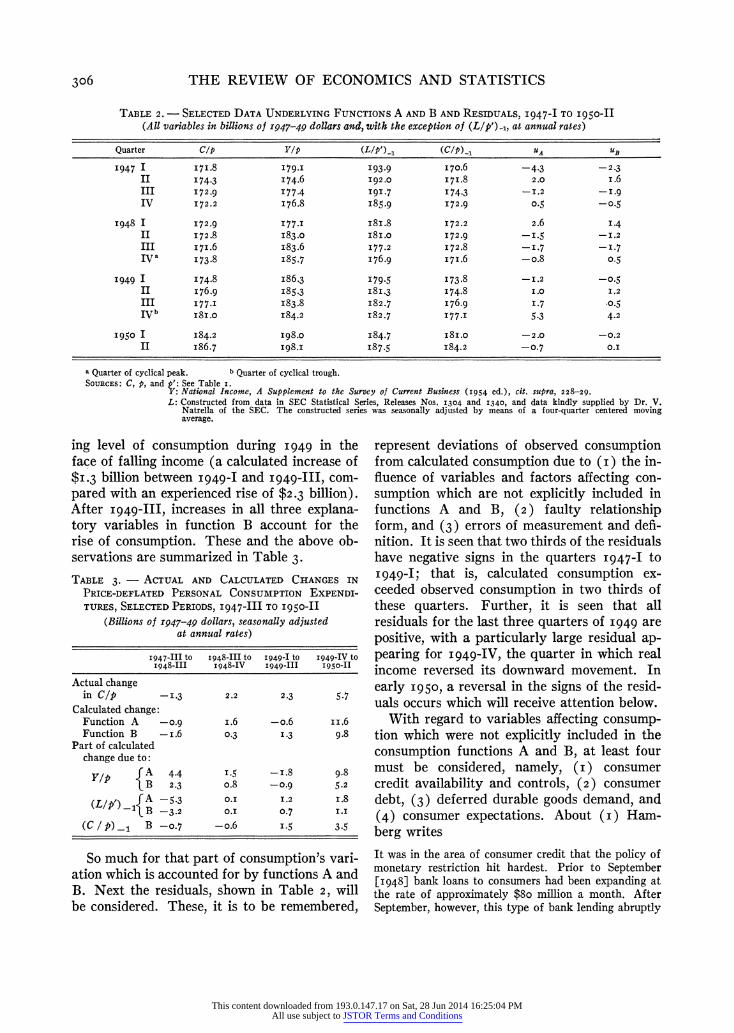
ing level of consumption during I949 in the face of falling income (a calculated increase of $I.3 billion between I949-I and I949-III, com- pared with an experienced rise of $2.3 billion). After I949-III, increases in all three explana- tory variables in function B account for the rise of consumption. These and the above ob- servations are summarized in Table 3.
So much for that part of consumption's vari- ation which is accounted for by functions A and B. Next the residuals, shown in Table 2, will
be considered. These, it is to be remembered,
represent deviations of observed consumption from calculated consumption due to (I) the in- fluence of variables and factors affecting con- sumption which are not explicitly included in functions A and B, (2) faulty relationship form, and (3) errors of measurement and defi- nition. It is seen that two thirds of the residuals have negative signs in the quarters I947-I to I949-I; that is, calculated consumption ex- ceeded observed consumption in two thirds of these quarters. Further, it is seen that all residuals for the last three quarters of I949 are positive, with a particularly large residual ap- pearing for I949-IV, the quarter in which real income reversed its downward movement. In early I950, a reversal in the signs of the resid- uals occurs which will receive attention below.
With regard to variables affecting consump- tion which were not explicitly included in the consumption functions A and B, at least four must be considered, namely, (i) consumer credit availability and controls, (2) consumer debt, (3) deferred durable goods demand, and (4) consumer expectations. About (i) Ham- berg writes
TABLE 2. - SELECTED DATA UNDERLYING FUNCTIONS A AND B AND RESIDUALS, I947-I TO I950-II (All variables in billions of 1947-49 dollars and, with the exception of (L/p')1, at annual rates)
Quarter C/p Y/p (LIP')_1 (C/P)_1 UA UB
I947 I I7I.8 I79-I 193.9 I70.6 -4.3 -2.3 II I74-3 I74.6 I92.0 I7I.8 2.0 i.6 III I72.9 I77-4 I91.7 174.3 -I.2 -I.9 IV I72.2 I76.8 I85.9 I72.9 0.5 -0.5
I948 I I72.9 I77-I I8I.8 172.2 2.6 I.4 II I72.8 I83.0 I8I.0 I72.9 -I.5 -I.2
III I7I.6 183.6 I77.2 I72.8 -I.7 -I.7 IV a I73.8 I85.7 I76.9 I7I.6 -o.8 0.5
I949 I I74.8 I86.3 I79.5 I73.8 -I.2 -0.5
II I76.9 I85.3 I8I.3 I74.8 1.0 I.2
III I77-I I83.8 I82.7 176.9 I.7 -0.5 IVb I8I.0 I84.2 I82.7 I77.I 5.3 4.2
I950 I I84.2 I98.0 I84.7 i8I.o -2.0 -0.2
II I86.7 I98.I I87.5 I84.2 -0.7 O.1
a Quarter of cyclical peak. b Quarter of cyclical trough. SOURCES: C, p, and p': See Table i.
Y: National Income, A Supplement to the Survey of Current Business (I954 ed.), cit. supra, 228-29.
L: Constructed from data in SEC Statistical Series, Releases Nos. I304 and I340, and data kindly supplied by Dr. V. Natrella of the SEC. The constructed series was seasonally adjusted by means of a four-quarter centered moving average.
TABLE 3. - ACTUAL AND CALCULATED CHANGES IN PRICE-DEFLATED PERSONAL CONSUMPTION EXPENDI-
TURES, SELECTED PERIODS, 1947-I11 TO I950-II
(Billions of 1947-49 dollars, seasonally adjusted at annual rates)
I947-III tO I948-III to I949-I to I949-IV to I948-III I948-IV I949-III I950-II
Actual change in C/p -1.3 2.2 2.3 5.7
Calculated change: Function A -0.9 i.6 -o.6 ii.6
Function B -i.6 0.3 I.3 9.8
Part of calculated change due to:
Y/p A 4.4 0.5 -?.8 9.8
lB 2.3 o.8 -0.9 5.2
(LIP') A{ -5. 1. .2 i.8 s B -3.2 0 I 20.7 II8
(C / p)1 B -0.7 -o.6 I.5 3.5
It was in the area of consumer credit that the policy of monetary restriction hit hardest. Prior to September [1948] bank loans to consumers had been expanding at the rate of approximately $8o million a month. After September, however, this type of bank lending abruptly
This content downloaded from 193.0.147.17 on Sat, 28 Jun 2014 16:25:04 PMAll use subject to JSTOR Terms and Conditions
CONSUMPTION IN THE U.S. 1948-1949 RECESSION 307
ceased. Simultaneously, sales of consumer durables, which had been setting records during the first three quarters of the year, suddenly began lagging at an alarm- ing rate. There can be little doubt that the abrupt change in the volume of consumer loans by banks and the sudden sagging tendencies of sales of consumer dur- ables reflected to a large extent the reimposition of con- sumer credit controls by the Federal Reserve System.18
It thus appears warranted to attribute a portion of the large negative residual in I948-III to the reimposition of credit controls. Also part of the negative residuals in the following quarters may be due to the unavailability of consumer credit and the continued effects of consumer controls. The relaxation of credit controls in March and April and their final abandonment in June I949 may help to account for the positive residuals in the second and third quarters of I94919
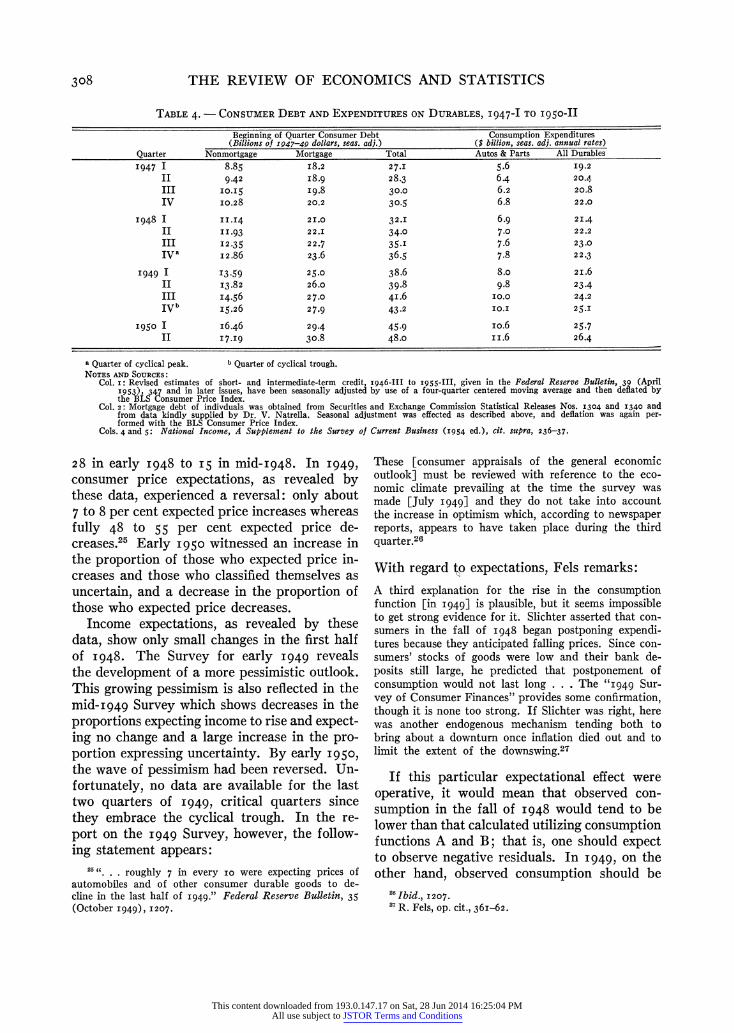
While the influence of consumer debt on ag- gregate consumption has not been established with certainty,20 the possibility exists that con- sumer debt exerts a negative influence on con- sumption. Estimates of consumer debt are pre- sented in Table 4. It is seen that consumer debt rose considerably between I947-I and I949-I. It seems reasonable to conclude tenta- tively, as Gordon does,21 that this increase in debt tended to affect consumption adversely; this may help to explain the preponderance of negative residuals in this period. After I949-I, consumer debt continued to rise throughout quarters in which a majority of the calculated residuals have positive signs. That this is the case is compatible with the hypotheses (i) that consumer debt has little or no effect on aggre- gate consumption or (2) that the action of other influences more than compensated for the adverse effects of debt on consumption after
I949-I. Evidence supporting the latter hypoth- esis will be presented below.
Fels and Hamberg stress the fact that de- ferred auto demand had not yet been satisfied in I948.22 The statistics on consumer expendi- tures on autos and parts (Table 4) show that between I947-IV and I948-IV, seasonally ad- justed expenditures on autos and parts at an- nual rates increased by $i.o billion, while ex- penditures on all durables increased by only $0.3 billion. Between I948-IV and I949-IV, the annual rate of expenditure on all durables increased by $2.8 billion, of which $2.3 billion is accounted for by autos and parts. It should be noted that $i.8 billion of this latter $2.3
billion increase was recorded between I949-I and I949-II, the latter quarter being the quar- ter in which credit controls were relaxed and then abandoned. In the remainder of I949, ex- penditures on autos and parts remained high but did not increase much. The growth of ex- penditures on durables in the third and fourth quarters of I949 was sparked by increases in expenditures on furniture and household equip- ment. Thus, it would appear that the unleash- ing of automobile demand in I949-II may rep- resent a partial explanation of the positive residual observed for that quarter and also a factor tending to produce positive residuals in later quarters of I949.
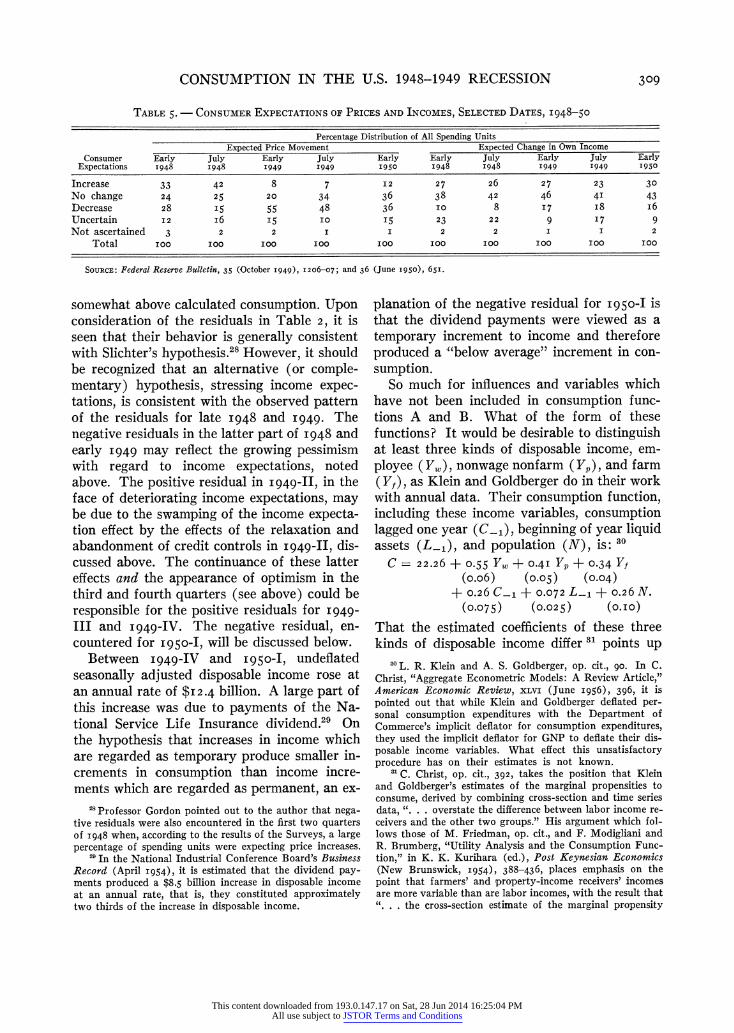
Finally, expectations may not be adequately taken into account in the above consumption functions.23 The Federal Reserve Surveys of Consumer Finances yield the information given in Table 5.
It is pertinent 24 to note that 33 per cent in early I948 and 42 per cent in mid-I948, of those interviewed expected prices to increase. The per- centage expecting price decreases dropped from 18D. Hamberg, "The Recession of I948-49 in the United
States," 10c. cit., 4. 19 M. Moss, "A Study of Instalment Credit Terms,"
Federal Reserve Bulletin, xxxv (December I949), I442-49,
states, "Table I shows that after each amendment to Regu- lation W, there were significant increases in the proportion of contracts at or near the most lenient permissible term limits, implying that the relaxation of down payments and maturity requirements widened the market in addition to enabling a given group of buyers to take advantage of easier terms" (page I443).
' See L. R. Klein and A. S. Goldberger, An Econometric Model of the United States, 1929-1952 (Amsterdam, I955),
8, for a discussion of cross-section studies of the effects of consumer debt on consumption.
21 R. A. Gordon, op. cit., 440.
22R. Fels, op. cit., 36I; D. Hamberg, op. cit., ii. See also, L. J. Atkinson, "The Demand for Consumers' Durable Goods," Survey of Current Business (June I950), 5-IO.
23In L. R. Klein, Economic Fluctuations in the United States, 1921-1941 (New York, I950), 40-50, aggregate con- sumption functions, similar to A and B above, have been derived from theoretical considerations including a simple treatment of consumer expectations.
' In R. Ferber, "On the Stability of Consumer Expecta- tions," this REVIEW, xxxviI (August I955), 256-66, the difficulties in interpreting marginal distributions of this sort are stressed. Before these figures can be entirely satisfac- torily interpreted, it is at least necessary to know more about who held what set of expectations at each date.
This content downloaded from 193.0.147.17 on Sat, 28 Jun 2014 16:25:04 PMAll use subject to JSTOR Terms and Conditions
308 THE REVIEW OF ECONOMICS AND STATISTICS
28 in early I948 to I5 in mid-I948. In I949,
consumer price expectations, as revealed by these data, experienced a reversal: only about 7 to 8 per cent expected price increases whereas fully 48 to 55 per cent expected price de- creases.25 Early I950 witnessed an increase in the proportion of those who expected price in- creases and those who classified themselves as uncertain, and a decrease in the proportion of those who expected price decreases.
Income expectations, as revealed by these data, show only small changes in the first half of I948. The Survey for early I949 reveals the development of a more pessimistic outlook. This growing pessimism is also reflected in the mid-I949 Survey which shows decreases in the proportions expecting income to rise and expect- ing no change and a large increase in the pro- portion expressing uncertainty. By early I950, the wave of pessimism had been reversed. Un- fortunately, no data are available for the last two quarters of I949, critical quarters since they embrace the cyclical trough. In the re- port on the I949 Survey, however, the follow- ing statement appears:
These [consumer appraisals of the general economic outlook] must be reviewed with reference to the eco- nomic climate prevailing at the time the survey was made [July I949] and they do not take into account the increase in optimism which, according to newspaper reports, appears to have taken place during the third quarter.26
With regard to expectations, Fels remarks:
A third explanation for the rise in the consumption function [in I949] is plausible, but it seems impossible to get strong evidence for it. Slichter asserted that con- sumers in the fall of I948 began postponing expendi- tures because they anticipated falling prices. Since con- sumers' stocks of goods were low and their bank de- posits still large, he predicted that postponement of consumption would not last long . . . The "I949 Sur- vey of Consumer Finances" provides some confirmation, though it is none too strong. If Slichter was right, here was another endogenous mechanism tending both to bring about a downturn once inflation died out and to limit the extent of the downswing.27
If this particular expectational effect were operative, it would mean that observed con- sumption in the fall of I948 would tend to be lower than that calculated utilizing consumption functions A and B; that is, one should expect to observe negative residuals. In I949, on the other hand, observed consumption should be
TABLE 4. - CONSUMER DEBT AND EXPENDITURES ON DURABLES, I947-I TO I950-II
Beginning of Quarter Consumer Debt Consumption Expenditures (Billions of I947-49 dollars, seas. adj.) ($ billion, seas. adj. annual rates)
Quarter Nonmortgage Mortgage Total Autos & Parts All Durables I947 I 8.85 I8.2 27.I 5.6 I9.2
II 9.42 I8.9 28.3 6.4 20.4
III 0I.I5 I9.8 30.0 6.2 20.8
IV I0.28 20.2 30.5 6.8 22.0
I948 I IIJ.4 2I.0 32.J 6.9 2I.4
II .II93 22.J 34.0 7.0 22.2
III I2.35 22.7 35-I 7.6 23.0
Iva I2.86 23.6 36.5 7.8 22.3
I 949 I I3 .59 25.0 38.6 8.o 2 I.6 II I3.82 26.o 39.8 9.8 23.4
III I4.56 27.0 4I.6 I0.0 24.2
IVb I5.26 27.9 43.2 MI.1 25.I
I950 I I6.46 29.4 45.9 io.6 25.7
II I7.I9 30.8 48.o i i.6 26.4
a Quarter of cyclical peak. b Quarter of cyclical trough. NOTES AND SOURCES:
Col. i: Revised estimates of short- and intermediate-term credit, I946-III to 1955-Ill, given in the Federal Reserve Bulletin, 39 (April I953), 347 and in later issues, have been seasonally adjusted by use of a four-quarter centered moving average and then deflated by the BLS Consumer Price Index.
Col. 2: Mortgage debt of indivduals was obtained from Securities and Exchange Commission Statistical Releases Nos. I304 and I340 and from data kindly supplied by Dr. V. Natrella. Seasonal adjustment was effected as described above, and deflation was again per- formed with the BLS Consumer Price Index.
Cols. 4 and 5: National Income, A Supplement to the Survey of Current Business (I954 ed.), cit. supra, 236-37.
. . .roughly 7 in every iO were expecting prices of automobiles and of other consumer durable goods to de- cline in the last half of I949." Federal Reserve Bulletin, 35 (October I949), I207.
26 Ibid., I207.
2 R. Fels, op. cit., 36I-62.
This content downloaded from 193.0.147.17 on Sat, 28 Jun 2014 16:25:04 PMAll use subject to JSTOR Terms and Conditions
CONSUMPTION IN THE U.S. 1948-1949 RECESSION 309
somewhat above calculated consumption. Upon consideration of the residuals in Table 2, it is seen that their behavior is generally consistent with Slichter's hypothesis.28 However, it should be recognized that an alternative (or comple- mentary) hypothesis, stressing income expec- tations, is consistent with the observed pattern of the residuals for late I948 and I949. The negative residuals in the latter part of I948 and early I949 may reflect the growing pessimism with regard to income expectations, noted above. The positive residual in I949-II, in the face of deteriorating income expectations, may be due to the swamping of the income expecta- tion effect by the effects of the relaxation and abandonment of credit controls in I949-II, dis- cussed above. The continuance of these latter effects and the appearance of optimism in the third and fourth quarters (see above) could be responsible for the positive residuals for I949-
III and I949-IV. The negative residual, en- countered for I950-I, will be discussed below.
Between I949-IV and I950-I, undeflated seasonally adjusted disposable income rose at an annual rate of $I2.4 billion. A large part of this increase was due to payments of the Na- tional Service Life Insurance dividend.29 On the hypothesis that increases in income which are regarded as temporary produce smaller in- crements in consumption than income incre- ments which are regarded as permanent, an ex-
planation of the negative residual for 195o-I is that the dividend payments were viewed as a temporary increment to income and therefore produced a "below average" increment in con- sumption.
So much for influences and variables which have not been included in consumption func- tions A and B. What of the form of these functions? It would be desirable to distinguish at least three kinds of disposable income, em- ployee (JYf), nonwage nonfarm (Yr), and farm (Yf), as Klein and Goldberger do in their work with annual data. Their consumption function, including these income variables, consumption lagged one year (C-1), beginning of year liquid assets (L-1), and population (N), is: 30
C = 22.26 + 0.55 Y,w + 0.4I Yp + 0.34 Yf
(o.o6) (0.05) (0.04) + 0.26 C-1 + 0.072 L-1 + 0.26 N.
(0.075) (0.025) (O.I0)
That the estimated coefficients of these three kinds of disposable income differ 31 points up
TABLE 5. CONSUMER EXPECTATIONS OF PRICES AND INCOMES, SELECTED DATES, I948-50
Percentage Distribution of All Spending Units Expected Price Movement Expected Change in Own Income
Consumer Early July Early July Early Early July Early July Early Expectations 1948 1948 1949 I949 1950 1948 1948 1949 I949 1950
Increase 33 42 8 7 I2 27 26 27 23 30
No change 24 25 20 34 36 38 42 46 4I 43 Decrease 28 I5 55 48 36 IO 8 I7 i8 i6 Uncertain I2 i6 I5 Io I5 23 22 9 I7 9 Not ascertained 3 2 2 I I 2 2 I I 2
Total ic0 ic0 icc Icc IC0 ICC ICC ICC ICC ICC
SOURCE: Federal Reserve Bulletin, 35 (October 1949), 1206-07; and 36 (June 1950), 651.
28 Professor Gordon pointed out to the author that nega- tive residuals were also encountered in the first two quarters of I948 when, according to the results of the Surveys, a large percentage of spending units were expecting price increases.
29 In the National Industrial Conference Board's Business Record (April I954), it is estimated that the dividend pay- ments produced a $8.5 billion increase in disposable income at an annual rate, that is, they constituted approximately two thirds of the increase in disposable income.
30L. R. Klein and A. S. Goldberger, op. cit., go. In C. Christ, "Aggregate Econometric Models: A Review Article," American Economic Review, XLVI (June I956), 396, it is pointed out that while Klein and Goldberger deflated per- sonal consumption expenditures with the Department of Commerce's implicit deflator for consumption expenditures, they used the implicit deflator for GNP to deflate their dis- posable income variables. What effect this unsatisfactory procedure has on their estimates is not known.
31C. Christ, op. cit., 392, takes the position that Klein and Goldberger's estimates of the marginal propensities to consume, derived by combining cross-section and time series data, ". . . overstate the difference between labor income re- ceivers and the other two groups." His argument which fol- lows those of M. Friedman, op. cit., and F. Modigliani and R. Brumberg, "Utility Analysis and the Consumption Func- tion," in K. K. Kurihara (ed.), Post Keynesian Economics (New Brunswick, I954), 388-436, places emphasis on the point that farmers' and property-income receivers' incomes are more variable than are labor incomes, with the result that ". . . the cross-section estimate of the marginal propensity
This content downloaded from 193.0.147.17 on Sat, 28 Jun 2014 16:25:04 PMAll use subject to JSTOR Terms and Conditions
3IO THE REVIEW OF ECONOMICS AND STATISTICS
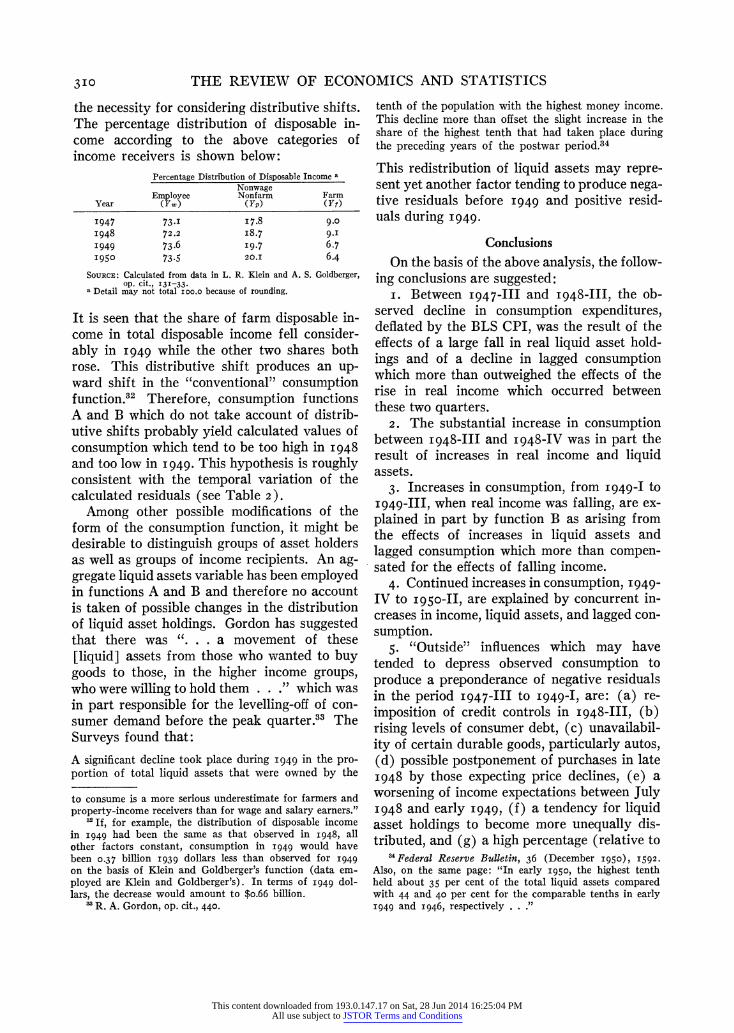
the necessity for considering distributive shifts. The percentage distribution of disposable in- come according to the above categories of income receivers is shown below:
It is seen that the share of farm disposable in- come in total disposable income fell consider- ably in I949 while the other two shares both rose. This distributive shift produces an up- ward shift in the "conventional" consumption function.32 Therefore, consumption functions A and B which do not take account of distrib- utive shifts probably yield calculated values of consumption which tend to be too high in I948 and too low in I949. This hypothesis is roughly consistent with the temporal variation of the calculated residuals (see Table 2 ).
Among other possible modifications of the form of the consumption function, it might be desirable to distinguish groups of asset holders as well as groups of income recipients. An ag- gregate liquid assets variable has been employed in functions A and B and therefore no account is taken of possible changes in the distribution of liquid asset holdings. Gordon has suggested that there was ". . . a movement of these [liquid] assets from those who wanted to buy goods to those, in the higher income groups, who were willing to hold them . . ." which was in part responsible for the levelling-off of con- sumer demand before the peak quarter.33 The Surveys found that:
A significant decline took place during I949 in the pro- portion of total liquid assets that were owned by the
tenth of the population with the highest money income. This decline more than offset the slight increase in the share of the highest tenth that had taken place during the preceding years of the postwar period.34
This redistribution of liquid assets may repre- sent yet another factor tending to produce nega- tive residuals before 1949 and positive resid- uals during I949.
Conclusions On the basis of the above analysis, the follow-
ing conclusions are suggested: i. Between 1947-III and I948-III, the ob-
served decline in consumption expenditures, deflated by the BLS CPI, was the result of the effects of a large fall in real liquid asset hold- ings and of a decline in lagged consumption which more than outweighed the effects of the rise in real income which occurred between these two quarters.
2. The substantial increase in consumption between I948-III and I948-IV was in part the result of increases in real income and liquid assets.
3. Increases in consumption, from 1949-I to I949-Ill, when real income was falling, are ex- plained in part by function B as arising from the effects of increases in liquid assets and lagged consumption which more than compen- sated for the effects of falling income.
4. Continued increases in consumption, I949-
IV to 195o-II, are explained by concurrent in- creases in income, liquid assets, and lagged con- sumption.
5. "Outside" influences which may have tended to depress observed consumption to produce a preponderance of negative residuals in the period I947-III to I949-I, are: (a) re- imposition of credit controls in I948-III, (b) rising levels of consumer debt, (c) unavailabil- ity of certain durable goods, particularly autos, (d) possible postponement of purchases in late I948 by those expecting price declines, (e) a worsening of income expectations between July I948 and early I949, (f) a tendency for liquid asset holdings to become more unequally dis- tributed, and (g) a high percentage (relative to
Percentage Distribution of Disposable Income a
Nonwage Employee Nonfarm Farm
Year (YW) (YP) (Yf)
I947 73.I I 7.8 9.0
I948 72.2 I8.7 9.I
I949 73.6 I9.7 6.7 I950 73.5 20.J 6.4
SOURCE: Calculated from data in L. R. Klein and A. S. Goldberger, op. cit., I3I-33.
a Detail may not total ioo.o because of rounding.
to consume is a more serious underestimate for farmers and property-income receivers than for wage and salary earners."
3 If, for example, the distribution of disposable income in I949 had been the same as that observed in 1948, all other factors constant, consumption in I949 would have been 0.37 billion I939 dollars less than observed for I949 on the basis of Klein and Goldberger's function (data em- ployed are Klein and Goldberger's). In terms of I949 dol- lars, the decrease would amount to $o.66 billion.
3 R. A. Gordon, op. cit., 440.
I' Federal Reserve Bulletin, 36 (December 1950), I592.
Also, on the same page: "In early I950, the highest tenth held about 35 per cent of the total liquid assets compared with 44 and 40 per cent for the comparable tenths in early I949 and I946, respectively . . ."
This content downloaded from 193.0.147.17 on Sat, 28 Jun 2014 16:25:04 PMAll use subject to JSTOR Terms and Conditions
CONSUMPTION IN THE U.S. 1948-1949 RECESSION 3II
later percentages) of disposable income ac- counted for by farm disposable income.
6. Positive residuals, representing observed levels of consumption exceeding calculated levels, during the period I949-II to I949-IV, are possibly explained by: (a) the relaxation and abandonment of credit controls in I949- II, (b) buying on the part of those who had postponed purchases because they expected falling prices, (c) development of optimism in
consumer income expectations in the latter part of I949, (d) a less unequal distribution of liquid assets, (e) a fall in the percentage of disposable income accounted for by farm dis- posable income, and (f) a surge in auto buying in I949.
7. Finally, the short-run consumption func- tion estimates presented in this study have been extremely useful in analyzing consumption's variation in the I948-49 recession.
This content downloaded from 193.0.147.17 on Sat, 28 Jun 2014 16:25:04 PMAll use subject to JSTOR Terms and Conditions