Embed Size (px)
Citation preview

Consumers’ evaluation of line
extensions that are positioned on
atypical attributes
MSc Thesis Management, Economics and Consumer Studies
Marketing and Consumer Behaviour Group
Student: Álvaro Henrique Prado Carvalho (870423327020)
Supervisors: Dr. Erica van Herpen
Dr. Andres Trujilo-Barrera
Wageningen 2013

2
Acknowledgment
I am very grateful for all those who in one way or another were part of my life during my thesis
work. First and foremost I am thankful to God, for he blessed and strengthened me at all times.
I would also like to express my gratitude to my supervisors, Erica van Herpen and Andres Trujillo
Barrera, who provided me the support I needed. In special, I would like to thank Erica, for her always
insightful suggestions and remarks. As I have experienced, supervision is essentially important to a
good work, and undoubtedly hers was excellent. As of many other things that I learned during my
thesis, two things in special I am sure I will never forget. Statistical significance means statistical
significance. And, there might be at least one interaction effect in the research.
My special gratitude for my wife, Mina, who at all times gave me the support I needed, with
encouraging and kind words. I am also thankful to my family, for even far away they undoubtedly are
part of it all.

3
Table of Contents
ACKNOWLEDGMENT ......................................................................................................................................... 2
ABSTRACT .......................................................................................................................................................... 6
1. INTRODUCTION ....................................................................................................................................... 7
2. THEORETICAL BACKGROUND ............................................................................................................... 12
2.1. LINE EXTENSION/BRAND EXTENSION .......................................................................................... 12
2.2. PRODUCT INNOVATIVENESS AND PRODUCT CATEGORIZATION ................................................. 14
2.3. PRODUCT SHELF POSITIONING .................................................................................................... 17
3. INTERACTION EFFECTS ................................................................................................................ 20
4. STUDY ........................................................................................................................................ 25
4.1. PRODUCT CATEGORY ................................................................................................................... 25
4.2. INVESTIGATED BRANDS ............................................................................................................... 25
4.3. ATYPICAL ATTRIBUTES ................................................................................................................. 26
5. PRE-TEST .................................................................................................................................... 27
5.1. REALISM OF THE LINE EXTENSIONS ............................................................................................. 27
5.2. LINE EXTENSIONS ATYPICALITY .................................................................................................... 28
5.3. BRAND FAMILIARITY .................................................................................................................... 28
5.4. DISCUSSION OF THE PRE-TEST ..................................................................................................... 28
6. METHODOLOGY ......................................................................................................................... 29
6.1. PARTICIPANTS .............................................................................................................................. 29
6.2. STIMULI ........................................................................................................................................ 30
6.3. DESIGN AND PROCEDURE ............................................................................................................ 31
7. RESULTS ..................................................................................................................................... 35
7.2. PRODUCT CHOICE ........................................................................................................................ 35
7.2. ATTITUDES.................................................................................................................................... 36
7.3. PURCHASE INTENTIONS ............................................................................................................... 38
4
7.4. ATTRIBUTES OF THE LAUNDRY DETERGENT CATEGORY .............................................................. 40
7.4.1. CLEANNESS AND EASE OF USE............................................................................................ 40
7.5. ATYPICALITY ................................................................................................................................. 40
7.6. BUYING FREQUENCY AND PRODUCT USAGE ............................................................................... 41
7.7. BRAND FAMILIARITY .................................................................................................................... 42
7.8. PARTICIPANTS MOTIVATION ....................................................................................................... 43
7.9. SUMMARY OF HYPOTHESES ........................................................................................................ 44
8. DISCUSSION ............................................................................................................................... 44
8.1. BRAND EQUITY ............................................................................................................................. 45
8.2. PRODUCT SHELF POSITIONING .................................................................................................... 45
8.3. DEGREES OF INCONGRUENCE OF THE NEW ATTRIIBUTE ............................................................ 46
8.4. INTERACTION EFFECTS ................................................................................................................. 46
9. THEORETICAL AND MANAGERIAL IMPLICATIONS ........................................................................ 47
10. LIMITATIONS AND AREA FOR FUTURE RESEARCH ...................................................................... 49
11. CONCLUSIONS .......................................................................................................................... 50
12. REFERENCES ............................................................................................................................. 63
List of Figures
1. CONCEPTUAL MODEL ........................................................................................................................... 24
2. ARCUS LIQUID ....................................................................................................................................... 31
3. OMO LIQUID ......................................................................................................................................... 31
4. ARCUS SACHET ...................................................................................................................................... 31
5. OMO SACHET ........................................................................................................................................ 31
6. SHELVES DESIGN ................................................................................................................................... 33
7. ARCUS LIQUID ....................................................................................................................................... 33
8. REASONING FOR PRODUCT SELECTION ....................................................................................... 36
9. PURCHASE INTENTIONS OF LAUNDRY DETERGENT EXTENSIONS ...................................................... 38
5
10. PRODUCT ATYPICALITY ....................................................................................................................... 41
11. PARTICIPANTS MOTIVATION .............................................................................................................. 43
List of Tables
1. SUMMARY TABLE OF RESEARCH HYPOTHESES.................................................................................... 24
2. LAUNDRY DETERGENT VARIANTS CURRENTLY OFFERED IN THE BRAZILIAN MARKET ..................... 26
3. SUMMARY OF DEMOGRAPHICS .......................................................................................................... 30
4. BINARY LOGISTIC REGRESSION ............................................................................................................ 35
5. SUMMARY OF THE LOGISTIC REGRESSION MODEL ............................................................................ 35
6. MEANS AND STD. ERROR OF THE INTERACTION EFFECTS (ATTITUDES) ........................................... 37
7. MEANS AND STD. ERROR OF THE INTERACTION EFFECTS (PURCHASE INTENTIONS) ....................... 39
8. SUMMARY OF FINDINGS FOR BUYING FREQUENCY AND PRODUCT USAGE EXPERIENCE .............. 42
9. SUMMARY OF RESEARCH HYPOTHESES .............................................................................................. 44
Appendices
1. QUESTIONNAIRE (PORTUGUESE VERSION) ......................................................................................... 51
2. QUESTIONNAIRE (ENGLISH VERSION) ................................................................................................. 57

6
Abstract
Objective: New product launches have always been a common strategy for firms seeking strategic
growth. Nevertheless, product failure rate is significantly high, reaching 70% to 80% in some market
segments. In order to minimize the high product failure risk as well as to differentiate their product
offerings companies are adopting the so called line extension strategy, positioning the new variants
on their atypical attributes. However, there is evidence that this market strategy does not guarantee
the success of the line extension. In the present research it was aimed to investigate how consumers
evaluate line extensions that are positioned on atypical attributes. Method: 424 participants, with
an average age of 30.07 years (SD= 10.43) participated in the experiment. This research used a 2
(brand equity: low vs. high) X 2 (product shelf positioning: centre vs. edge) X 2 (degree of the new
attribute atypicality) between subject design. The dependent variable was the consumers’
evaluation of new product variants. Results: In line with expectations both brand equity and product
shelf positioning had a significant main effect on consumers’ responses. However, the degree of new
attribute atypicality was not found to be significant. With respect to the interaction effects, partial
support was found for the significant interaction effect between brand and degree of the new
attribute atypicality. Conclusion: Parent brand equity is an important asset for the success of the line
extension strategy. Whereas high equity brands are likely to benefit from its image and reputation,
low equity brands might benefit from being innovative when extending their products line. In
addition, this study finds support for the “center-stage effect”, that is, the results indicate that
consumers hold higher evaluations towards products that are positioned in the centre of the shelf
display. Finally, contrary to the well-recognized categorization theory, in this research no support
was found for the fact that the moderate incongruity option will consistently receive higher
evaluations.
Keywords: Line extension, product extension, product shelf positioning, center-stage effect, atypical
attribute, attribute atypicality, degree of product incongruence, categorization theory,
7
1- INTRODUCTION New product launches have always been a common strategy for firms seeking strategic growth
(Reddy et al., 1994). Over the past decade, an unprecedented rate of proliferation of brands and
#new product launches has been observed in every category of consumer goods and services
(Valenzuela et al., 2012). According to the latest figures overall 240,000 new products are introduced
globally (Mintel, 2013). Nevertheless, product failure rate is significantly high, reaching 70% to 80%
in some market segments (Linton, 2012).
One increasingly popular approach that most companies have pursued to reduce the high risk of
product failure is product line extension (Aaker and Keller, 1990;Quelch and Kenny, 1994;Reddy et
al., 1994;Lee et al., 1996). This marketing strategy occurs when an existing brand name offers a new
product in the same product class or category (e.g. Diet Coke, Vanilla Coke, Cool Ranch Doritos,
Liquid Tide, and Tide Pods). In addition, the new variants only differ from their original brand in
relatively minor ways, such as package size, flavours, and product composition (Reddy et al.,
1994;Desai and Keller, 2002). In fact, according to Kim and Sullivan (1998) the majority of product
launches involves line extensions. In line with that, Aaker (1991) reported that in a survey of a
leading consumer goods company it was found that 89% of new product introductions were line
extensions, 6% were brand extension, and 5% bore new brand names. Though the line extension
strategy has been widely used, this marketing strategy does not necessarily guarantee success (Lee
et al., 1996). In fact, the failure rates of product extensions are nearly as high as the failure rate of
new brand introductions (Reddy et al., 1994;Schneider and Hall, 2011).
In addition to aiming to reduce the risk of product failure, the line extension strategy is usually taken
based on two important aspects: firstly, due to the financial risk and high cost of introducing a new
brand; and the latter reason regards the manufactures’ interest in taking the advantage of the
parent brand recognition and its image (Aaker and Keller, 1990). Following such a strategy can be a
way to exploit the most positive aspects owned by a brand. A successful example of line extension is
the case of the Cool Ranch Doritos. Sales of the entire Doritos line of corn chips rose to more than $1
billion due to the success of the Cool Ranch Doritos extension. More recently, in the crowded
laundry detergent category, the company Procter & Gamble launched the Tide Pods (atypical
package), with which the company is estimating $500 million in first-year retail sales for the product
(Neff, 2012). The above figure demonstrates how successful the product launch is, as less than 3% of
new consumer packaged goods exceed first-year retail sales of $50 million, which is considered the
benchmark of a highly successful launch (Schneider and Hall, 2011).
8
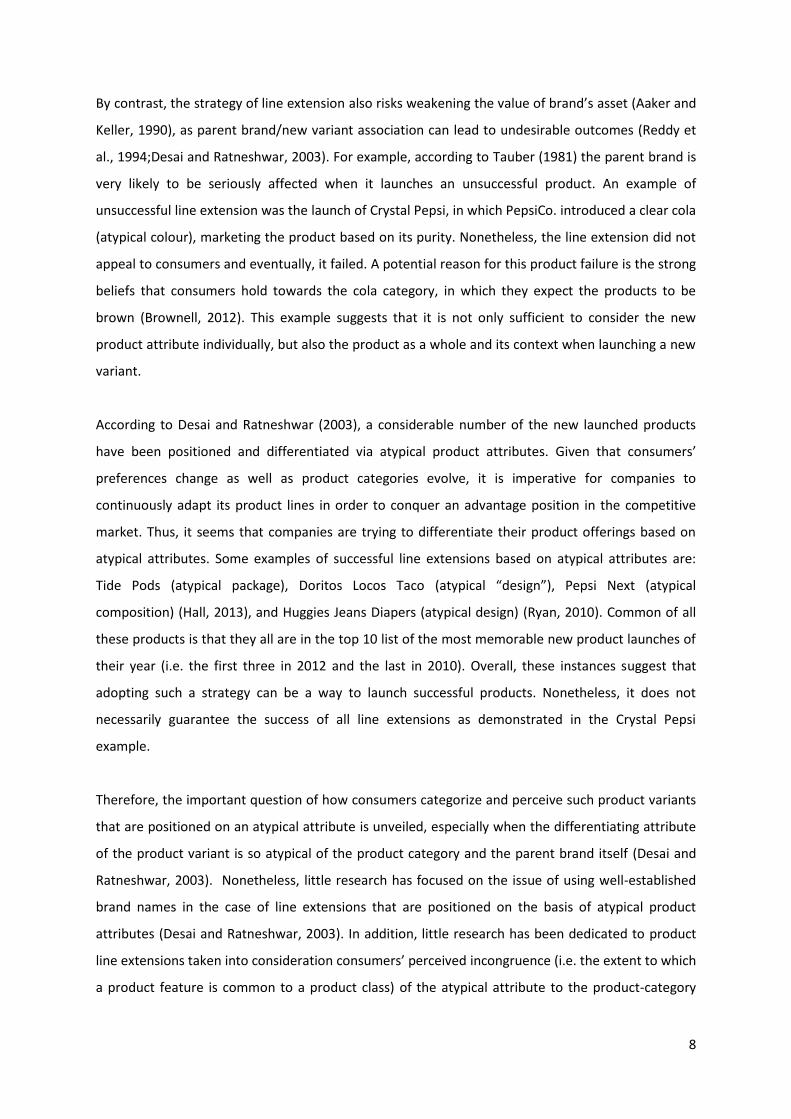
By contrast, the strategy of line extension also risks weakening the value of brand’s asset (Aaker and
Keller, 1990), as parent brand/new variant association can lead to undesirable outcomes (Reddy et
al., 1994;Desai and Ratneshwar, 2003). For example, according to Tauber (1981) the parent brand is
very likely to be seriously affected when it launches an unsuccessful product. An example of
unsuccessful line extension was the launch of Crystal Pepsi, in which PepsiCo. introduced a clear cola
(atypical colour), marketing the product based on its purity. Nonetheless, the line extension did not
appeal to consumers and eventually, it failed. A potential reason for this product failure is the strong
beliefs that consumers hold towards the cola category, in which they expect the products to be
brown (Brownell, 2012). This example suggests that it is not only sufficient to consider the new
product attribute individually, but also the product as a whole and its context when launching a new
variant.
According to Desai and Ratneshwar (2003), a considerable number of the new launched products
have been positioned and differentiated via atypical product attributes. Given that consumers’
preferences change as well as product categories evolve, it is imperative for companies to
continuously adapt its product lines in order to conquer an advantage position in the competitive
market. Thus, it seems that companies are trying to differentiate their product offerings based on
atypical attributes. Some examples of successful line extensions based on atypical attributes are:
Tide Pods (atypical package), Doritos Locos Taco (atypical “design”), Pepsi Next (atypical
composition) (Hall, 2013), and Huggies Jeans Diapers (atypical design) (Ryan, 2010). Common of all
these products is that they all are in the top 10 list of the most memorable new product launches of
their year (i.e. the first three in 2012 and the last in 2010). Overall, these instances suggest that
adopting such a strategy can be a way to launch successful products. Nonetheless, it does not
necessarily guarantee the success of all line extensions as demonstrated in the Crystal Pepsi
example.
Therefore, the important question of how consumers categorize and perceive such product variants
that are positioned on an atypical attribute is unveiled, especially when the differentiating attribute
of the product variant is so atypical of the product category and the parent brand itself (Desai and
Ratneshwar, 2003). Nonetheless, little research has focused on the issue of using well-established
brand names in the case of line extensions that are positioned on the basis of atypical product
attributes (Desai and Ratneshwar, 2003). In addition, little research has been dedicated to product
line extensions taken into consideration consumers’ perceived incongruence (i.e. the extent to which
a product feature is common to a product class) of the atypical attribute to the product-category
9
schema. One of the few examples of study that has evaluated consumers’ perception of product line
extensions positioned on atypical attributes was conducted by Desai and Ratneshwar (2003). Despite
this, the authors did not consider different degrees of incongruence of the atypical attribute to the
product-category schema. As a matter of fact, the researchers investigated the joint effects of brand
familiarity, retail shelf display, and consumer goal orientation on consumers’ perception of new
product variants positioned on an atypical attribute. Conversely, the authors manipulated only one
degree of incongruence of the atypical attribute (i.e. low fat chips) to the product-category schema.
Furthermore, the potential different results of line extension depending on the different parent
brand equities were not taken into consideration either.
Thus, following this reasoning it seems logical that a deeper knowledge on how consumers perceive
and interpret such new variants is needed. Therefore, to address the aforementioned research
voids, the present research has as its aim to investigate how consumers evaluate line extensions that
are positioned on an atypical attribute, depending on different levels of parent brand equity (i.e. the
value of a brand, such as its name and symbols (Aaker, 1991)), different product shelf positioning
(i.e. the physical position of products in retail shelf displays), and different degrees of incongruence
(i.e. the extent to which a product feature is common to a product class) of the atypical attribute to
the product-category schema. These aspects are considered in this research as it is posited that they
have a critical influence on consumers’ evaluations of line extensions when they encounter such
products in the marketplace. This reasoning is put forward based on: (1) consumers are very likely to
assign the quality of the parent brand to the new variant (Aaker and Keller, 1990;Kevin Lane Keller,
2003); (2) the incongruence between the new variant attribute and the product-category schema
affects how consumers evaluate the new variants (Mandler, 1982;Meyers-Levy and Tybout, 1989);
finally, (3) depending on the product shelf positioning consumers assign different meanings to the
products (Wright, 2002;Valenzuela and Raghubir, 2009). To accomplish the research aim, literature
on brand and line extension, categorization theory, as well as shelf positioning is investigated.

10
In order to accomplish the aim of this research the following research question is formulated:
How do consumers evaluate new line extensions that are positioned on atypical attributes?
Sub questions:
How do different brand equities (high vs. low) influence consumers’ evaluation of new line
extensions?
How do consumers evaluate new line extensions depending on the incongruence of the new atypical
attribute to the product-category schema?
How do consumers evaluate new line extensions that are positioned in the centre vs. edge shelf
displays?
Do the interaction effects of the independent variables affect consumers’ evaluation of new line
extension?
In the present research it is proposed that three main aspects are likely to influence consumers’
evaluation of new product variants, namely, (1) parent brand equity; (2) consumers’ perceived
incongruence of the new variant attribute to the product-category schema; (3) new variant
positioning in retail shelf space. In summary, all three factors, separately and through interaction are
likely to affect consumers’ evaluation of new product variants. With respect to the interaction
effects, it is put forward that consumers’ evaluations of new variants are influenced by the joint
effects of the independent variables. All the interaction effects put forward in this research are
discussed in more in-depth in a corresponding section.
With regard to the implications of this research, so long as the theoretical side is concerned, this
research will add to the literature on line extension. As noted by Sinapuelas and Sisodiya (2010) and
Kim et al. (2001) research on product extension has mostly focused on brand extensions. Whereas
little study has been dedicated to line extensions, specially, those that focus on line extensions that
are positioned on atypical attributes (Desai and Keller, 2002), though many line extensions have
been positioned and differentiated via atypical product attributes (Desai and Ratneshwar, 2003).
This in turn makes the endeavour of this work extremely pertinent. In addition, the present research
shares a unique characteristic, which is the investigation of both main effects and the interaction
effects of the factors proposed in this research to influence consumers’ evaluation of new product
variants. For that reason, it is proposed that this research will give insight to an area of the line
11
extension literature that has not been looked at extensively. Moreover, by combining different
streams of literature (i.e. brand and line extension, categorization theory, and shelf positioning
literature) it is posited that this work will be able to extend the knowledge on line extension, which
can lead to a better comprehension of brand positioning and consumer acceptance of new products.
Alternatively, from a managerial perspective, the development of product line extensions is a
competitive reality. As mentioned earlier, line extension accounts for the brands’ major new product
launches (89%) (Aaker, 1996;Kim and Sullivan, 1998). Nevertheless, product failure rate has been
reported to be very high (Reddy et al., 1994;Schneider and Hall, 2011) which shows that a better
comprehension of the implications of the line extension is needed. Therefore, it is proposed that the
outcomes of this research may assist managers on their decision of product line extensions. More
specifically, this study will be applied to the investigation of a potential future line extension sought
for one of the investigated companies. Therefore, the current work has a direct and important
practical implication. In addition, this research is likely to help retailers on their work to organize
their product assortment, positioning the new products in a manner that will increase both product
sales and consumer satisfaction with the store.
With respect to the organization of the paper, it is structured as follows. The next section is
dedicated to the development of the theoretical background, in which the proposed concepts of this
thesis are discussed in detail. In addition, the interactions effects put forward in this work are also
discussed. Subsequently, a conceptual model is proposed, in which the six hypotheses of this
research are illustrated. Following that, the aspects related with the study, such as the product
category, brands, and atypical attributes are covered in-depth. Next, the methodology used in the
research is reported. Then, the results found are presented, followed by a discussion. Next, the
theoretical and managerial implications are proposed. The limitations and area for future research
are then presented. Lastly, the conclusion section ends this research.
12
2- THEORETHICAL BACKGROUND
2.1- Line extension/Brand extension The financial risk, high cost of entering a new market segment, and manufactures’ interest in taking
the advantage of the parent brand recognition and its image, as well as the willingness to reduce the
risk of product failure have been reported as important causes of manufactures to opt for extending
an existing line of products (Aaker and Keller, 1990;Quelch and Kenny, 1994;Reddy et al., 1994;Lee
et al., 1996). For example, the cost of introducing a major new consumer brand in the USA, Japan or
Europe is estimated at one billion dollars, and as such, extension strategies have been a way to
reduce introductory costs (kalamas et al., 2006). In fact, line extension has been reported as the
most common form of new-product launches (Kim and Sullivan, 1998). According to Sinapuelas and
Sisodiya (2010) new product launches represent an opportunity to develop the equity of brands. In
their study the authors examined 318 brands from 30 consumer packaged goods categories, and the
empirical results support their proposition that the number of line extension launches improves
parent brand equity.
However, there has been a focus on the study of brand extension rather than on line extension (Kim
et al., 2001;Sinapuelas and Sisodiya, 2010), even though line extension accounts for the brand’s
major new products introduction efforts (Kim and Sullivan, 1998). Brand extensions occur when
companies launch new products into different categories (e.g. Starbucks coffee liqueur and The Tide
to Go stain removal pen) (Sinapuelas and Sisodiya, 2010), whereas line extensions are a brand’s new
product offerings within the same product category (e.g. Diet Coke, Vanilla Coke, Cool Ranch
Doritos, Liquid Tide, and Tide Pods) (Reddy et al., 1994), typically involving minor modifications from
the parent brand (e.g. packaging and flavour) (Reddy et al., 1994;Desai and Keller, 2002), and
targeting current consumers, which is often the case (Kim and Sullivan, 1998). Further, Kim et al.
(2001) distinguish between two types of line extensions, one called “vertical” (i.e. when it extends
upward or downward, for example, the new variant is launched at different quality levels) and the
other named “horizontal” (i.e. when an extension is launched keeping the same quality level as the
original brand). In either case, line extensions expand the parent brand’s market coverage, as a
wider variety of products is offered, which may attract potential new consumers to the brand
(Sinapuelas and Sisodiya, 2010). In addition, it has been reported that brands which offer a wide
variety of products are likely to benefit, as consumers tend to have higher quality perceptions
towards brands that offer diverse options (Chernev, 2003). Alternatively, there are pitfalls for
launching line extensions. For example, a wide variety of line extensions may confuse consumers
(Quelch and Kenny, 1994), as a brand can be considered without a specific focus, which may distort

13
the brand’s existing image in consumers’ minds (Sinapuelas and Sisodiya, 2010). As a consequence,
this can lead customers to decline the line extension and other related products. In addition, when
consumers perceive line extensions to be inconsistent with the parent brand, the brand is at the risk
of diluting (i.e. negative change in consumer brand association) (Loken and Roedder John,
1993;Boisvert, 2012). Moreover, line extensions can lead to cannibalization of the original brand,
which refers to a decrease in sales volume, sales revenue, or market share of the parent brand, due
to the activities of the line extension (Reddy et al., 1994).
Therefore, the line extension decision is of crucial importance to an organization. The decision has to
be based on the evaluation of the potential rewards and risks involved with the new product
introduction. On the reward side, line extension can result, in among others things, higher market
share and consumers’ loyalty to the parent brand (Sinapuelas and Sisodiya, 2010). On the risk side,
line extension can create damaging associations between the new variant with parent brand that
may be expensive, or even impossible to change (Aaker and Keller, 1990;Desai and Ratneshwar,
2003).
According to the brand extension literature, the consumers’ perceptual fit (i.e. whereby a product
extension is believed to have meaningful associations with the parent brand) between the original
brand and the new product is considered to be a key element in extension success (Tauber,
1988;Aaker and Keller, 1990). In addition, according to Aaker and Keller (1990), a successful product
extension depends on consumers’ beliefs and attitudes towards the parent brand. From this
perspective two opposite situations can take place, (1) consumers hold positive beliefs towards the
original brand, and this in turn is likely to be transferred to the extension, or (2) consumers hold
negative beliefs which can be associated with the new product variant (Aaker and Keller, 1990). The
outcomes of these two situations are quite clear. When the first situation is present, line extensions
are likely to be successful, whereas in the second, the probability of failure is incredibly high.
Support for this proposition is found in the research by Reddy et al. (1994) in which the authors
found that line extensions of symbolic brands as well as of strong brands enjoy greater market
success than those of less symbolic brands as well as of weak brands, respectively. Likewise, Smith
and Park (1992) and Broniarczyk and Alba (1994) reported that the strength of the parent brand is
positively related to the market share of the product extension.
Thus, on the one hand, when consumers believe that a parent brand is of high quality, it is plausible
to propose that they are more likely to associate the line extension with high quality. On the other

14
hand, if consumers associate the original brand with low quality, the extension is likely to be
associated with low quality. According to Kevin Lane Keller (2003) consumers tend to associate high-
equity brands with high quality products and low-equity brands with low quality products. On the
basis of the abovementioned evidences, it is predicted that, all other things equal, consumers with
higher perceived quality towards the parent brand will evaluate more positively the line extension.
Therefore, the following hypothesis is proposed:
H1: The evaluation of line extensions positioned on atypical attributes will be higher when the new
product is of a high-equity brand rather than a low-equity brand.
2.2- Product innovativeness and Product categorization In the face of today’s competitive market environment, companies are searching for advantages to
differentiate one from the other. Therefore, when deciding to launch line extensions, it is essential
for managers to provide innovative variants as a way to stand in the crowd (Boisvert, 2012). As
reported by Danneels and Kleinschmidt (2001), innovativeness have to be addressed both from
consumers’ point of view as well as companies’ perspective. For instance, innovation attributes (e.g.
new functionality or new flavour) is one of the aspects regarded by consumers as forms of product
newness, whilst project-firm fit and technological aspects are considered by companies as part of
product innovativeness (Danneels and Kleinschmidt, 2001). According to Sorescu and Spanjol (2008),
“within supermarket packaged goods categories, innovations are those which provide novel and
significant consumer benefits to the market in the form of new formulation, new packaging, or
incorporating new technology”.
In a recent study carried by Sinapuelas and Sisodiya (2010), it was reported that level of
innovativeness of a new product variant enhances the original brand equity, the higher the newness
of the new variant, the higher is the original brand equity. The authors argue that this is indeed the
case as innovative line extensions provide additional aspects of differentiation for the original brand.
Moreover, according to Aaker (2007) product innovativeness can enhance new variant’s
attractiveness and increase consumer loyalty. One dimension of perceived innovativeness that has
been reported in the literature is product uniqueness (Danneels and Kleinschmidt, 2001), which was
found to have a positive relationship with purchase intentions (Taylor et al., 2007). Therefore, it is
plausible to propose that consumers’ perceived innovativeness of line extensions will in turn affect
purchase likelihood.
15
Nevertheless, the inclusion of an innovative aspect into a line extension product should not be
considered a straightforward process. In other words, just because a new product variant has an
innovative aspect it does not necessarily mean that consumers will hold positive beliefs towards it.
The adverse results might be even more prominent when the innovation aspect is an atypical
attribute. To understand the way costumers assimilate new product extensions, it is fundamental to
considerate the categorization theory. For the way consumers integrate new products into existing
knowledge structure has been shown to influence consumers’ judgements (Stayman et al., 1992),
information search (Ozanne et al., 1992), and evaluations (Meyers-Levy and Tybout, 1989)
depending on how new variants are similar or dissimilar to product-category schemas organized in
memory (Ozanne et al., 1992). According to Stayman et al. (1992), product-category schemas are
organized structures of existing knowledge stored in memory. This prior structure contains
cumulative knowledge about products and brands that consumers acquire through experience. This
proposition is congruent with the work of Rosch (1975), in which it is reported that to help
consumers deal with the overflowing of information that they encounter in daily life a hierarchical
schema-level representation is maintained by them on the basis of perceived similarities and
dissimilarities. In other words, consumers store information in memory around a set of category
expectations, that is, products that share similar attributes are likely to be categorized within one
particular category. When consumers encounter a new product either a match or mismatch will
occur. In the former situation, the product encountered is likely to share attributes that match with
the product-category schema, whereas in the latter scenario the product encountered has attributes
that are inconsistent with the product-category schema. In this last situation, when consumers
experience dissonance a strategy to solve it might be employed, in order to integrate the new
variant into one product-category schema. Examples of such strategies are: assimilation, subtyping,
or even schema switching, depending on the degree of incongruence (Mandler, 1982).
In the categorization literature, congruence has been visualized as a continuum (Stayman et al.,
1992), in which researchers have focused on three points: congruence, moderate incongruence, and
extreme incongruence. On the basis on the model proposed by Mandler (1982), schema congruity
results in mild favourable responses, as assimilation of the new variant occurs easily, without
causing physiological arousal, because the new object is aligned to consumers’ prior expectations.
This proposition is supported by the study of Meyers-Levy and Tybout (1989) in which was found
that product-category schema congruity leads to minor favourable evaluations. Moreover, Ozanne
et al. (1992) found that when a product-category schema is congruent the level of information

16
searched is the lowest. The authors argue that this is the case because the new objects conform to
consumers’ prior expectations. Therefore, the need to search for additional information is minimal.
Unlike product-category schema congruity, moderate incongruity leads to more positive evaluation
due to the arousal caused by the novelty of the object (Meyers-Levy and Tybout, 1989), and greater
cognitive effort required for assimilation within the evoked schema(Stayman et al., 1992). According
to Mandler (1982), moderate incongruities are those which after some cognitive effort consumers
are able to successfully resolve, which results in the optimal level of physiological arousal (Stayman
et al., 1992).
For example, a consumer encounters a new product that is labelled as and contains the general
characteristics of a laundry detergent, although it is a “unit-dose” detergent, an attribute that is
inconsistent with the product category in the Brazilian market. This incongruence with the product-
category schema is likely to be considered moderate if consumers are able to resolve it without
spending a lot of cognitive resources on the task. As mentioned above, strategies such as
assimilation (e.g. “Well, this is just one more laundry detergent.”), or subtyping (e.g. “Well, this is a
laundry detergent, but one that comes in unit-doses.”) can be employed to resolve the
inconsistency. As a consequence of these situations, that is, after the incongruence has been
resolved, consumers are likely to be rewarded with a positive feeling (Mandler, 1982).
A moderate level of incongruence occurs when most, but not all, of the information conveyed by the
new product is consistent with prior product-category schema. In this situation, the new product
characteristics do not conform to the consumers’ expectations, which means that additional
information is ought to be searched in order to solve the discrepancy (Ozanne et al., 1992). In fact,
as demonstrated by Ozanne et al. (1992), at moderate level of incongruence, search for information
reaches the highest level. The argument the authors put forward is that the trade-offs between the
benefits of information acquisition and the costs to get this information is worth the effort. Further,
information acquisition is a viable solution for solving the moderate incongruence. In addition,
moderate schema incongruence is also found to lead to more favourable evaluation than either
schema congruence or extreme schema incongruence (Meyers-Levy and Tybout, 1989).
In contrast, extreme incongruence is hypothesized as incongruence which cannot be solved or
requires a great deal of cognitive effort to make changes in the existing product-category schema.
When the attempt to solve the incongruence is not successful consumers experience strong
17
frustration (Mandler, 1982). On the other hand, even when the attempt to solve the incongruence is
successful consumers are not likely to experience positive feelings as much as they do when they
encounter moderate incongruities (Mandler, 1982).
On the basis of the Mandler’s model, the present work investigates consumers’ evaluations of new
product variants that are positioned on an atypical attribute. Differently from Mandler’s model,
however, low and moderate incongruence are the degrees of incongruence which are considered. It
is posited that the atypical attribute that is added to the new product makes it an instance that
distorts from the congruent product-category schema. As consumers do not expect to find the
atypical attribute in the new variant, their expectations will not be matched, which would
characterize, according to Mandler’s model, a product-category schema incongruity. Therefore, it is
logical to posit that the congruent option does not fit within the scope of this research. Hence, it will
not be further investigated. Further, as line extensions are typically characterized by involving only
minor modifications from the parent brand (Reddy et al., 1994;Desai and Keller, 2002), it is proposed
that companies are not likely to drastically modify the new product variant. A potential explanation
could be that companies fear that consumers may perceive inconsistence between the line
extension and the parent brand, which may lead to brand dilution (Boisvert, 2012). Thus, in reality,
the extreme incongruence option is hardly ever adopted by companies. Therefore, it will not be
further considered in this research. On the basis on the presented evidences, the following
hypothesis is proposed:
H2: The evaluation of line extensions positioned on atypical attributes will be higher when the
degree of incongruence of the new atypical attribute is moderate rather than low.
2.3- Product shelf positioning Optimizing product assortment has been one of the greatest concerns of many retailers, and this
task is becoming increasingly more difficult (Simonson, 1999), as proliferation of brands and new
product launches have been observed, leading to shelf space scarcity (Valenzuela et al., 2012). As a
consequence, this has affected how retailers manage their product assortments (Dhar et al.,
2001;Van Herpen and Pieters, 2002). Recent research has demonstrated the importance of product
assortments in the overall shopping experience, having for example, a significant impact on
consumers’ willingness to buy (Scheibehenne et al., 2010). Moreover, product shelf positioning has
been demonstrated as having the power to influence the attractiveness of offerings (Rettie and
Brewer, 2000) as well as the importance of specific product attributes (Areni et al., 1999). In
addition, Valenzuela et al. (2012), point out the importance of understanding the way consumers

18
interpret the positioning of products and how they deal with product assortment, as these two
aforementioned aspects affect consumers’ judgments and decisions. For this reason, marketers have
demonstrated an ever increasing focus of attention and promotional budget on in-store
merchandise, hoping to attract consumers at the point of purchase (Chandon et al., 2009), for the
way customers choose is fundamentally influenced by the setting in which their choices occur
(Scheibehenne and Todd, 2009). Accordingly, Procter & Gamble (P&G) considers that the first
seconds (i.e. three to seven seconds) that a consumer notices a product on a store shelf as the “first
moment of truth” (Valenzuela et al., 2012).
Retailers can use numerous different ways to present their merchandise to consumers, such as,
organizing by brand or by price, which can ease the comparison and processing of competitive items
(Suri et al., 2012). Previous research has shown that the information conveyed by category labels can
inform customers about the attributes of the products presented under each heading (Johnson and
Payne, 1985). Therefore, the organization of items may help buyers to refine their set of options
(Chakravarti and Janiszewski, 2003), which in turn can lower search costs for quality information
(Alba et al., 1997) and facilitate preference identification (Chakravarti and Janiszewski, 2003).
Furthermore, it has been reported that consumers are likely to assume that every act of
communication is transmitting a message (Clark, 1985). In line with that, prior literature suggests
that consumers share beliefs regarding the shelf positioning of items in the marketplace (Wright,
2002;Valenzuela and Raghubir, 2009). These beliefs that consumers hold about the strategies that
companies use to exert persuasion in the marketplace, that is, the implicit theories that consumers
belief that govern the marketplace are part of the marketplace meta-cognition (Wright, 2002).
Accordingly, Valenzuela and Raghubir (2009) propose that consumers belief that the physical
ordering of products within arrays is part of the rules that govern the marketplace, and therefore
they use the information conveyed by the position of a product to guide their decision.
However, inconsistent findings have been reported regarding of what a position advantage is. A
position advantage is described as “a position that results in more favourable evaluation, a higher
choice likelihood and/or higher sales of a product occupying a specific position in an array”
(Valenzuela and Raghubir, 2009). For example, Chandon et al. (2009) reported that the effects of
shelf position are mixed. It was found that brands positioned on the top shelf and close to the centre
(i.e. vertical positioning) of a shelf improves both attention and evaluation, whereas items placed in
the middle shelf (i.e. horizontal positioning) draw consumers’ attention without increasing
evaluation. Likewise, Chung C. et al. (2007) reported that with respect to the horizontal positioning,
19
centrally located products were preferred in the smaller dairy cases in convenience stores, whereas
for larger and more complex cases in supermarkets an edge shelf positioning was preferred.
In addition, in the study conducted by Inman et al. (1990), it was showed that when an item is
positioned at the end-of-aisle displays consumers evaluate that product more favourably, which
generally leads to an increase in sales. The authors argue that this type of shelf display organization
is interpreted by some consumers as a promotion signal, which in turn leads them to think that the
product is discounted and it consequently alters the brand choice behaviour. The authors point out
that for different consumers’ trait (low need for cognition vs. high need for cognition) the change in
the behaviour towards the product positioned at the end-of aisle is different. In the case of low NFC
only the promotional signal alone is likely to affect their purchase intentions, however, for high NFC,
a simultaneous price cut is needed.
In other research, Shaw et al. (2000) reported that people prefer the centre option rather than the
extremes. The authors carried out three experiments, (1) participants had to choose from a set of
three highlighters and they had to answer a questionnaire that contained three options (e.g. a - b -
c); (2) participants had to choose to sit in a chair from a set of three chairs; (3) participants were
exposed to a set of 3-posters, after this they had to report what they had seen. All three
experiments lent support for people’s preference for the centre option.
In a more recent study, Valenzuela and Raghubir (2009) showed that customers believe that items
positioned in the centre of an array are the most popular (i.e. product most preferred; product with
the highest market share in its category) and they evaluate these products more positively. As a
consequence, consumers assign the centre position as displaying the best products, which leads
them to select these products more often (Valenzuela and Raghubir, 2009). The authors named this
effect as the “center-stage effect”. Support for the center-stage effect is found by Valenzuela et al.
(2012). The researchers showed that consumers do indeed assign the central position to the most
popular products. However, there seems to be some extent of controversy of what mechanism
guides this preference for the centre option. For example, according to Christenfeld (1995) people’s
preference for the centre option is due to their desire to minimize mental effort, which sometimes
can even occur unconsciously. By contrast, Valenzuela and Raghubir (2009) argue that the
preference for the centre option is a reflection of a position-belief mechanism. Nonetheless, it is not
of the scope of this work to investigate what mechanism drives consumers’ preferences for the
centre items. Instead, this research aims to investigate if indeed consumers have higher preferences
20
for items positioned in the centre rather than on the edges of shelf displays. More specifically, this
research investigates whether the “center-stage effect” occurs with respect to the laundry detergent
category. In summary, as noted above, prior literature has shown divergent results of what the ideal
product positioning is. In the present research, based on the findings of Valenzuela and Raghubir
(2009), the following hypothesis is proposed:
H3: The evaluation of line extensions positioned on atypical attributes will be higher when the new
product is positioned in the centre position rather than on the edges of a shelf display.
3- INTERACTION EFFECTS As noted by Valenzuela et al. (2012) prior research has shown examples of position-based schemas,
however it has not taken into consideration consumers’ beliefs about the interaction of the factors
that are likely to influence consumers’ evaluations of products. Therefore, in order to develop a
deeper understanding of how consumers evaluate new products the interaction effects of the
dependent variables must be considered.
One dimension that can be considered is whether different product positioning (i.e. centre vs. edge)
influences how consumers perceive the new attribute incongruence to the product-category
schema. More specifically, will attribute incongruence be perceived differently when the products
are positioned in the centre vs. on the edges of shelf displays? Another dimension that can be
evaluated is whether parent brand equity (i.e. low vs. high-equity) influences consumers’ perception
of the new attributes incongruence to the product-category schema. In other words, will consumers
perceive the new attribute incongruence differently depending on the original brand equity? Finally,
the influence of consumers’ beliefs about the positioning of brands that vary in degree of equity (i.e.
low vs. high brand equity) can be considered. To put it in another way, will consumers’ perception of
the position of brands be altered when the product is of a high equity vs. low equity brand? Hence,
the following section is dedicated to the explanation of the interaction effects that are likely to occur
between the three factors proposed in this research to influence consumers’ evaluations of new
product variants that are positioned on atypical attributes.
As mentioned earlier, when consumers encounter new products that are easily assimilated into the
product schemas they hold in their minds (i.e. when the new variant encountered is congruent with
consumers’ prior expectations), they will experience product-category schema congruity. As a
consequence, consumers’ are not likely to be subjected to physiological arousal, which in turn, will
produce only mild favourable responses towards the product (Mandler, 1982). Likewise, it is

21
proposed that in the case of the new attribute being only a low incongruent to the product-category
schema, consumers are likely to experience a similar process. For example, in the case of the laundry
detergent category in Brazil, the liquid attribute of laundry detergents might be perceived as low
incongruent to the product category, as the powder attribute is the typical feature of the category.
Nonetheless, as Brazilian customers have had some exposure to the liquid variants over the recent
years (Maganhotto, 2012), it is posited that consumers will be able to easily assimilate the new liquid
laundry detergent line extension into the product-category schema. However, it is believed that in
this particular case, the favourable response towards the product will be more positive than in the
case of a perfect match (i.e. product-category congruence), but not as positive as in the case of a
moderate incongruence. With respect to the latter, as noted earlier, when a product is moderate
incongruent to its product-category schema, consumers are likely to have higher evaluations
towards the product (Mandler, 1982;Meyers-Levy and Tybout, 1989). For instance, with respect to
the laundry detergent category in Brazil, a moderate incongruent attribute would be characterized in
the case of a unit-dose package containing the liquid laundry detergent in its inside.
In addition, it is proposed that the effect resulted by the new attribute incongruence is likely to be
more favourable when the new product is placed in the centre position as opposed to being
positioned on the edges of the shelf display. To put it in a different way, consumers’ perceptions of
the incongruence of the new product attribute to the product-category schema are likely to differ
depending on the positioning of the product. The positioning of the product and the degree of
incongruence of the new attribute interact, influencing how consumers evaluate the new variants.
As demonstrated by Valenzuela and Raghubir (2009) consumers believe that products that are
positioned in the centre of an array are the most popular (i.e. the product most preferred and with
the highest market share in its category). In consequence, consumers evaluate these products more
favourably. Therefore, based on this evidence, it is put forward that consumers’ evaluation of the
new variant that contains an incongruent attribute to the product-category schema will be more
positive when the product is positioned in the centre as opposed to the edges of the shelf display.
In short, with regard to the low congruity, even though consumers might easily assimilate the new
instance within their product schema, which causes only mild favourable evaluation towards the
product, when the product is found in the centre position, due to the beliefs consumers hold, it will
be evaluated more positively. Likewise, in the case of the moderate incongruence, consumers will
have higher evaluations towards the product when it is found in the centre of the shelf display.
Nevertheless, it is proposed that the effect of shelf positioning will be stronger for the low
incongruent option. As the moderate incongruent option is likely to result in the most favourable
22
evaluation towards the product (Meyers-Levy and Tybout, 1989), even when the product variant is
positioned on the edges consumers are likely to evaluate the product favourably, because the
moderate incongruity is likely to lead to the optimal level of physiological arousal (Stayman et al.,
1992). By contrast, with regard to the low incongruity variant, it may only benefit when it is
positioned in the centre of the shelf display. Therefore, it is formally proposed that:
H4: The effect of shelf positioning will be stronger when the new attribute is low incongruent to the
product-category schema rather than moderate incongruent.
Similarly, consumers’ perceptions of incongruence of the new attribute are likely to be influenced by
the interaction of the new attribute incongruence with the parent brand equity. More specifically, it
is put forward that the original brand equity influences how the incongruence is perceived. So long
as attribute incongruence is concerned, as noted above, low incongruence of the new attribute to
the product-category schema merely produces minor favourable evaluations towards the product.
Whereas, moderate incongruence results in high product evaluations (Mandler, 1982). Nonetheless,
as consumers tend to associate high-equity brands with high quality products and low-equity brands
with low quality products (Kevin Lane Keller, 2003), and as they are likely to infer that product
launches share the same quality as its parent brand (Broniarczyk and Alba, 1994) it is proposed that
product evaluations of both low and moderate incongruent variants are likely to be more positive
when the product is of a high-equity rather than of a low-equity parent brand. In addition, it is put
forward that for low-equity brands the degree of incongruence will have greater effect than for the
case of high equity brands. As consumers associate products of high equity brands with high quality,
even in the case of low incongruence consumers are likely to have favourable evaluations towards
the product. On contrary, low equity brands may only benefit when consumers encounter moderate
incongruent products.
To sum up, only minor favourable evaluations occur when there is low incongruence between the
new attribute and the product-category schema that consumers hold. Nevertheless, when the new
variant is of a high-equity brand, consumers are likely to have stronger favourable responses
towards it, due to the beliefs that the line extension is a high-quality product, which is not likely to
occur for low equity brands. Hence, the following hypothesis is set:
H5: The effect of the incongruence of the new product attribute to the product-category schema will
be greater for the low rather than for the high equity brand.

23
Furthermore, as mentioned previously, consumers hold beliefs about the shelf positioning of
products in the marketplace (Wright, 2002;Valenzuela and Raghubir, 2009), that is, they expect the
products to have particular characteristics depending on its shelf positioning. According to
Valenzuela et al. (2012), when consumers experience incongruence between their beliefs and the
real market organization adverse effects are likely to occur, including the decrease in the probability
of consumers making a purchase and making consumers loyal to the store (Valenzuela et al., 2009).
By contrast, according to Sujan et al. (1986), when a disparity between consumers’ expectation
about the marketplace and the actual situation encountered occurs, it does not necessarily mean
that consumers will be less satisfied. The authors suggested that consumers’ prior expectations
influence how they process information in the marketplace. Further, it was reported that when
consistence between consumers’ expectations and the actual experience occurs, consumers base
their evaluation on simple heuristics, with minimal search for additional information. In the context
of shelf positioning (centre vs. edge /high vs. low equity brand), consistence occurs when consumers
find popular (high equity brand) in the centre position (Valenzuela and Raghubir, 2009), and
consequently, low equity brands on the edges. In this scenario consumers are likely to base their
product evaluations solely on heuristics (e.g. “Well, the low-equity brand is where it should be
(edge), so there is nothing really different with that product. It is not a really good option.”). On the
other hand, when consumers experience inconsistency between their prior expectation and the real
situation, they are more likely to search for additional information and analytically process specific
arguments at their disposal (Sujan et al., 1986). In the context of shelf positioning, an example of
inconsistency would be when consumers find the low-equity brand in the centre of a shelf display. In
this scenario consumers would experience inconsistency which can lead them to systematically
search for extra information or arguments that could resolve the inconsistency (e.g. “Oh, the low-
equity brand is not positioned where I thought it would be, it is actually in the centre, so probably
there is something up with this product. Maybe, the product is so good that it is becoming popular.
So, I should give it a try.”). Therefore, when a low-equity brand is positioned in the centre of a shelf
display consumers are likely to evaluate the product more favourably than when it is on the edges.
In addition, as consumers already expect to find popular products (high-equity brand) in the centre,
when they do, they will not experience inconsistency. To sum up, it is proposed that the preference
for the centre option is likely to benefit more the low-equity brand rather than the high-equity
brand. Thus, the following hypothesis is formally proposed:
H6: The center stage effect will be stronger for low-equity brands rather than for high-equity brands.

24
Conceptual Model
Table 1 - Summary table of research hypotheses
Hypotheses Parent brand equity Consumers’ evaluation
H1 High equity brand More favourable
Low equity brand
H2
Degree of incongruence Consumers’ evaluation
Moderate More favourable
Low
Shelf positioning Consumers’ evaluation
H3
Centre More favourable
Edges
Interaction effects Consumers’ evaluation
H4 Degree of incongruence Shelf positioning The effect of shelf positioning will be stronger for the low rather than for
moderate incongruent option
H5 Brand equity Degree of incongruence The effect of the incongruence will be
stronger for the low rather than for the high equity brand.
H6 Brand equity Shelf positioning Center effect stage stronger for low-
equity brand
Figure 1 - Conceptual Model
H1
H2
H6
H4 H5
H3

25
4- STUDY This following section is dedicated to the reasoning for the choices of the product category, brands,
and atypical attributes that are investigated in this work.
4.1- Product category The setting for the present empirical investigation is the laundry detergent product category. The
laundry detergent industry is a fertile area for the study of line extensions as line extensions are
commonly found (Lee et al., 1996;Euromonitor, 2012). More specifically, this research focuses on
the investigation of consumers’ evaluation of laundry detergent extensions in the Brazilian market.
In Brazil, over the past ten years an increase in the consumption of household products has been
observed with the laundry care products category accounting for approximately 60% of this market
growth (Datamonitor, 2010) and there is no sign of stagnation in this category (Euromonitor,
2012;Lambrecht, 2012). Nonetheless, compared with developed countries the consumption of
laundry care products in Brazil is still very low (Euromonitor, 2012). For example, with respect to the
consumption of the powder detergent variant, in Brazil the annual consumption is of 3.65kg per
consumer, while in the U.S. it is 5.47kg and in Europe it reaches 8.4kg (Lambrecht, 2012).
Furthermore, together with the rise in the consumption of laundry care items in Brazil it has been
observed that consumers are more willing to pay a premium price for value-added products, such as
eco-friendly formulae, liquid and concentrated versions of detergent, innovative formulations and
packaging, and new fragrances. As a consequence, manufacturers are investing widely in new
product launches (Euromonitor, 2012). Hence, given the abovementioned market characteristics and
extension activities, it is proposed that the laundry detergent category is a good venue in which to
investigate consumers’ evaluation of line extensions positioned on atypical attributes.
4.2- Investigated brands In this work, a high-equity brand and a low-equity brand are investigated. With respect to the high-
equity brand, the selected brand is called OMO. Support for this choice is found on recent market
reports, in which OMO is stated as having the highest market share in the laundry detergent
category in Brazil, accounting for approximately 50% of the sales in the category (Nca Consultoria,
2000). In addition, in a recent market survey carried out in Brazil, OMO was reported as the
strongest brand of 2012. Among the aspects considered in the survey were aspects such as the
brands that consumers remember more frequently and the brands that they are more loyal to
(Redação, 2012). Hence, based on these evidences, it seems plausible to select OMO as the high-
equity brand to be investigated in this study.

26
With regard to the low-equity brand, the selected brand to be investigated is called ARCUS, which
was founded in 2003, focusing its sales exclusively on the textile industry. In 2007, the company
launched its first line extension, when it started spreading its market coverage to household
consumers. Since its establishment, ARCUS has offered its laundry detergents only in the liquid
variant, as the company sees it as a market opportunity, given that the liquid attribute is still an
atypical attribute of the laundry detergent category in Brazil. Nowadays, ARCUS offers its products in
73 different cities, all being located in the state of Minas Gerais (i.e. Southeast of Brazil). The
company has a great potential of growth and it aims to expand its market coverage in the short
future (Arcus, 2012). Nonetheless, ARCUS is still a low-equity brand, therefore its hypothetical line
extensions are further considered in this research. In the table below, the laundry detergent variants
of OMO and ARCUS that are currently offered in the Brazilian market are presented.
Table 2 - Laundry detergent variants currently offered in the Brazilian market
Extension Category
Brand Powder detergent Liquid detergent Unit-dose
Omo 6 2 0
Arcus 0 3 0
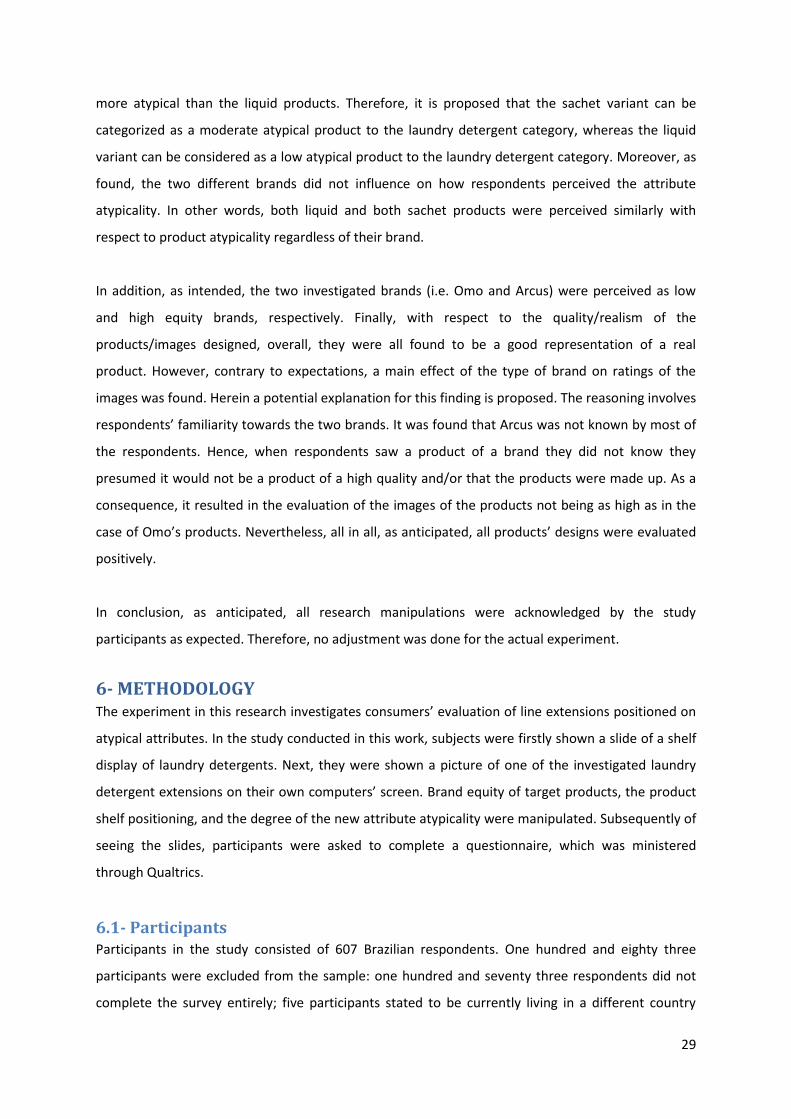
4.3- Atypical attributes In the present research two different degrees of new product attribute incongruence to the product-
category schema are manipulated, low incongruence and moderate incongruence. Among other
ways to differentiate line extensions from its original brand are to modify its composition and/or
package (Reddy et al., 1994;Desai and Keller, 2002). In Brazil, the powder detergent variant is the
most consumed one. In 2011 it accounted for approximately 68% of the total consumption of the
laundry detergent category and it is estimated to account for 65% in 2016 (Maganhotto, 2012). Thus,
the powder variant can be considered as the typical exemplar of the laundry detergent category. On
the other hand, many manufactures are introducing some type of liquid laundry detergent, such as
concentrated versions (i.e. all liquid variants are offered in bottles) and the popularity of these
products is apparently increasing. In 2011, liquid laundry detergents accounted for roughly 5% of the
total expenditure in the category and it is estimated to account for 12% in 2016 (Maganhotto, 2012),
which suggests that the liquid attribute is presently an atypical attribute of the laundry detergent
category. Nonetheless, as consumers have been exposed to some extent to this variation of laundry
detergent, it is proposed that the liquid attribute can be considered as a low incongruent attribute
to the laundry detergent category schema. Therefore, in this present work, the new attribute being
low incongruent to the product-category schema will be manipulated through the hypothetical line
extension of a liquid laundry detergent. More specifically, the hypothetical extension will be a liquid

27
laundry detergent being targeted to wash sportswear, which has been demonstrated to be a recent
marketing trend in the category (Maganhotto, 2012).
With respect to the unit-dose variant, this variant of the product is not yet offered in the Brazilian
market (Maganhotto, 2012), thereby suggesting that unit-dose package is currently an atypical
attribute in the category. Further, different variations of unit-dose laundry detergents can be found
in other markets, such as those in tablets or those alike the Tide Pods (i.e. containing different
chambers within the same package). In this research the moderate incongruent option will be
manipulated through the selection of the simplest version of the unit-dose variant, which occurs
when the liquid detergent is stored in a small plastic bag (i.e. sachet). As consumers have some
degree of familiarity with the liquid version of the laundry detergent, the unit-dose package will not
be perceived as extremely incongruent to the product-category schema. Previous of conducting the
actual experiment a pre-test was carried out in order to assure that respondents would perceive the
research’s manipulations as proposed. Below the pre-test is discussed in more detail.
5- PRE-TEST A pre-test was conducted in order to make certain that the proposed research manipulations were
perceived by the study participants as expected. The data was analysed using ANOVAs. Thirty one
respondents (17 female (55%) and 14 male (45%)) from six different Brazilian States, with the
majority of the participants living in the Minas Gerais State (68%), in a within subjects design,
participated in the pre-test. The age of the participants ranged from 18 to 62 years (M=33.03, SD=
13.09). More specifically, six age groups were established, as follows: <20 (3%), 20-25 (29%), 25-30
(29%), 30-40 (7%), 40-50 (16%), and >50 (5%). In addition, closing the questions pertaining to the
demographics, participants were asked to state their combined monthly household income range.
The highest load was observed in the income range between 5 and 10 Brazilian minimum salaries
(32%) (i.e. one Brazilian minimum salary corresponds to approximately € 245).
5.1- Realism of the line extensions Participants were asked to rate how realistic the products (i.e. pictures) were on three seven-point
items (α =.80) anchored by strongly disagree/strongly agree, with strongly agree indicating a more
positive evaluation (1- The image of the product is of high quality; 2- The product is a good
representation of a product in the laundry detergent category; 3- The image of the product is
realistic). The results showed that for Arcus liquid (M= 5.22, SD=1.07), Arcus sachet (M=5.12,
SD=1.39), Omo liquid (M= 5.73, SD=0.85), and Omo sachet (M= 5.59, SD=0.98). In addition, the
results also showed a significant main effect of the type of brand on ratings of the images,

28
F(1,30)=11.57, p=.002 (i.e. a potential reason for this finding is presented in section 5.4). By contrast,
regarding the format (i.e. degree of atypicality) as expected, results did not show a significant main
effect of format on the evaluations of the images F(1,30)=0.31, p=.582. Finally, there was not a
significant interaction effect between brand and format F(1,30)=0.04, p=.847.
5.2- Line extensions atypicality Participants were asked to rate their perception with respect to the products atypicality to the
product category on three seven-point items (α =.87) anchored by extremely atypical/extremely
typical, not at all unusual/very unusual, and matches very well/does not match at all well. As
expected, results did not show a significant main effect of brand on the perception of atypicality
F(1,30)=0.48, p=.49. Conversely, in line with expectations, there was a significant main effect of the
format on the perception of atypicality F(1,30)=10.87, p=.003. Importantly, results showed that the
sachet variants (M=3.27, SD=1.42) were indeed perceived as more atypical than the liquid products
(M=4.33, SD=1.43). Finally, there was not a significant interaction effect between brand and format
F(1,30)=0.064, p=.802.
5.3- Brand familiarity Participants were then asked to rate their familiarity towards the brands on three seven point items
(α =.79) anchored by strongly disagree/strongly agree (1- “Brand” is the most popular brand of the
laundry detergent category; 2- When I need to buy a laundry detergent, immediately I think of
“brand”; 3- When asked about laundry detergent brands, “brand” is the first one that I think). In line
with expectations, results showed a significant difference regarding brand familiarity F(1,30)=137.11,
p<.001. As expected, results showed that Arcus can indeed be considered a low equity brand (M=
1.90, SD=1.10) whereas Omo can be acknowledged as a high equity brand (M= 5.71, SD=1.27).
Furthermore, participants were asked to answer an open-ended question (i.e. Did you notice
anything unusual about any product?). Considering all provided answers, it can be concluded that
we did not get any adverse comments regarding the realism of the products’ designs that were
developed.
5.4- Discussion of the pre-test The pre-test was of crucial importance in order to assure the internal validity of this research. As it
can be observed from the results herein presented the research manipulations were perceived by
the study respondents as proposed. More specifically, the two different products (i.e. liquid and
sachet variants) were indeed perceived differently. That is, the sachet variants were considered
29
more atypical than the liquid products. Therefore, it is proposed that the sachet variant can be
categorized as a moderate atypical product to the laundry detergent category, whereas the liquid
variant can be considered as a low atypical product to the laundry detergent category. Moreover, as
found, the two different brands did not influence on how respondents perceived the attribute
atypicality. In other words, both liquid and both sachet products were perceived similarly with
respect to product atypicality regardless of their brand.
In addition, as intended, the two investigated brands (i.e. Omo and Arcus) were perceived as low
and high equity brands, respectively. Finally, with respect to the quality/realism of the
products/images designed, overall, they were all found to be a good representation of a real
product. However, contrary to expectations, a main effect of the type of brand on ratings of the
images was found. Herein a potential explanation for this finding is proposed. The reasoning involves
respondents’ familiarity towards the two brands. It was found that Arcus was not known by most of
the respondents. Hence, when respondents saw a product of a brand they did not know they
presumed it would not be a product of a high quality and/or that the products were made up. As a
consequence, it resulted in the evaluation of the images of the products not being as high as in the
case of Omo’s products. Nevertheless, all in all, as anticipated, all products’ designs were evaluated
positively.
In conclusion, as anticipated, all research manipulations were acknowledged by the study
participants as expected. Therefore, no adjustment was done for the actual experiment.
6- METHODOLOGY The experiment in this research investigates consumers’ evaluation of line extensions positioned on
atypical attributes. In the study conducted in this work, subjects were firstly shown a slide of a shelf
display of laundry detergents. Next, they were shown a picture of one of the investigated laundry
detergent extensions on their own computers’ screen. Brand equity of target products, the product
shelf positioning, and the degree of the new attribute atypicality were manipulated. Subsequently of
seeing the slides, participants were asked to complete a questionnaire, which was ministered
through Qualtrics.
6.1- Participants Participants in the study consisted of 607 Brazilian respondents. One hundred and eighty three
participants were excluded from the sample: one hundred and seventy three respondents did not
complete the survey entirely; five participants stated to be currently living in a different country

30
other than Brazil; two participants partially guessed the research aim correctly. Hence, the resulting
sample consisted of 424 participants (287 females and 137 males) from sixteen different Brazilian
States. As in the pre-test the majority of the participants are residents of the Minas Gerais State
(78%). The age of the participants ranged from 17 to 57 (M= 30.07, SD= 10.43). These demographics
as well as some additional ones are summarized in table 3. Furthermore, the information about the
research was spread via email and social network (e.g. Facebook). Voluntary participation was
motivated by an opportunity to win, through a lottery, one of ten prizes (i.e. a kit of promotional
products of one of the brands).
Table 3 - Summary of demographics
GENDER AGE # OF PEOPLE IN THE
HOUSEHOLD
TOTAL HOUSEHOLD
INCOME* (R$)
STATE OF
RESIDENCE
Category % Category % Category % Category % Category %
Female 68 < 20 8 1 13 1-2 7 MG 78
Male 32 20 - 25 31 2 28 2-3 11 SP 13
26 - 30 29 3 20 4-5 21 RJ 2
31 - 40 15 4 23 6-10 26 Others 7
41- 50 7 5 10 11-20 19
> 50 8 >5 6 >20 8
N/A 8
* One Brazilian minimum salary corresponds to approximately € 245
6.2- Stimuli Colour slides were created to simulate laundry detergent displays on the shelves of actual
supermarkets. A Photoshop program was used in order to design the different conditions
investigated in this research. All slides were of the same size and displaying the same number of
products. In addition, to create the laundry detergent extensions for the target brands, the labels
were carefully developed and were pasted on the front side of the package. It was ensured that the
labels would not be perceived as atypical or made up.
To create the low-incongruent variants (i.e. liquid laundry detergent) for the target brands, it was
assured that all the hypothetical extensions were designed according to the main characteristics of
its original brand, such as the package shape, size, and colour as well as labels to ensure that
participants perceived the line extensions as realistically as possible. With respect to the moderate-
incongruent variants (i.e. unit-dose variants, which are new in the Brazilian laundry detergent
category), in order to avoid participants’ suspicion, the package and labels of this variant had a
slightly similar size, shape, and positioning for both brands. The unit-dose variants were also
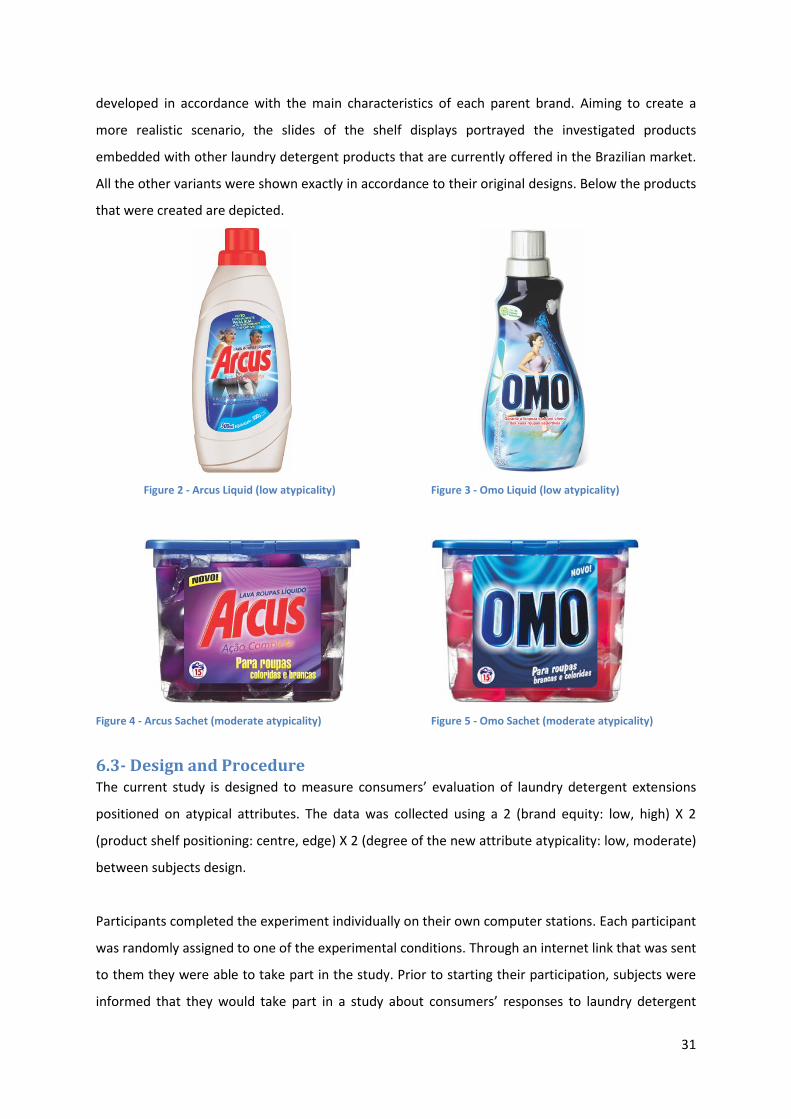
31
developed in accordance with the main characteristics of each parent brand. Aiming to create a
more realistic scenario, the slides of the shelf displays portrayed the investigated products
embedded with other laundry detergent products that are currently offered in the Brazilian market.
All the other variants were shown exactly in accordance to their original designs. Below the products
that were created are depicted.
Figure 2 - Arcus Liquid (low atypicality) Figure 3 - Omo Liquid (low atypicality)
Figure 4 - Arcus Sachet (moderate atypicality) Figure 5 - Omo Sachet (moderate atypicality)
6.3- Design and Procedure The current study is designed to measure consumers’ evaluation of laundry detergent extensions
positioned on atypical attributes. The data was collected using a 2 (brand equity: low, high) X 2
(product shelf positioning: centre, edge) X 2 (degree of the new attribute atypicality: low, moderate)
between subjects design.
Participants completed the experiment individually on their own computer stations. Each participant
was randomly assigned to one of the experimental conditions. Through an internet link that was sent
to them they were able to take part in the study. Prior to starting their participation, subjects were
informed that they would take part in a study about consumers’ responses to laundry detergent
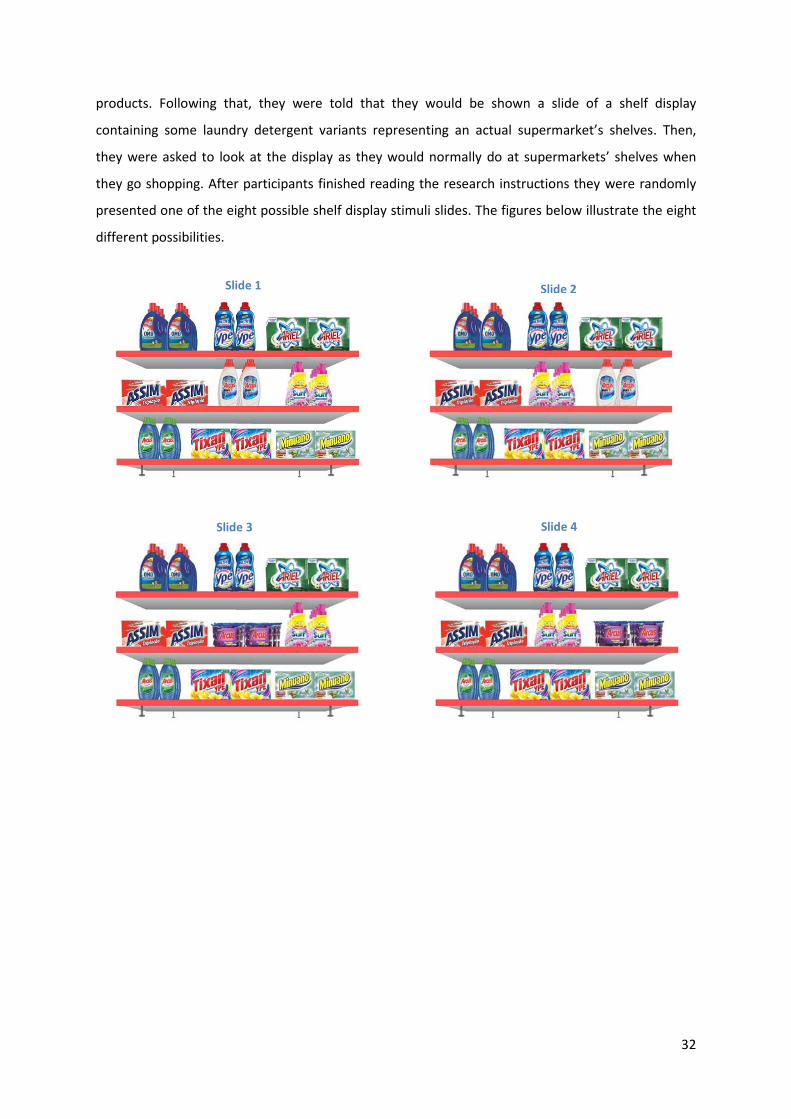
32
products. Following that, they were told that they would be shown a slide of a shelf display
containing some laundry detergent variants representing an actual supermarket’s shelves. Then,
they were asked to look at the display as they would normally do at supermarkets’ shelves when
they go shopping. After participants finished reading the research instructions they were randomly
presented one of the eight possible shelf display stimuli slides. The figures below illustrate the eight
different possibilities.
Slide 2
Slide 4
Slide 1
Slide 3

33
Figure 6 - Shelves design
After seeing one of the above stimuli slides participants were asked to make a choice for a particular
product and briefly explain why (i.e. open-ended question). In the next screen, regardless of their
product choice participants saw a picture of the individual product (i.e. one of the investigated
products) which was the one sought them to evaluate. For example, those participants who saw the
first and second slides were presented the following product. This method was repeated for all other
conditions.
Figure 7 - Arcus Liquid
Slide 5
Slide 6
Slide 7
Slide 8
34
Next, participants were instructed to complete a variety of measures at their own pace. Firstly, they
were asked to rate their attitude towards the products on three seven-point items (α =.89) anchored
by very unfavourable/very favourable, very negative/very positive, and unlikely to be of a high
quality/ likely to be of a high quality. Next, they were asked to rate their willingness to buy the
products on three five-point items (α =.92) anchored by very unlikely/very likely and strongly
disagree/strongly agree (1- It is very likely that I will buy “product”; 2- I will purchase “product” the
next time I need a laundry detergent; 3- I will definitely try “product”). In addition, participants were
asked to answer about their perception of relevant attributes of the laundry detergent category (i.e.
cleanness and ease of use) on a single five-point item anchored by not very clean/very clean and
very difficult/very easy, respectively. Following, they were asked to rate their perception with
respect to the products atypicality to the product category on three seven-point items (α =.85)
anchored by extremely atypical/extremely typical, not at all unusual/very unusual, and matches very
well/does not match at all well. In addition, participants were then asked to rate their familiarity
towards the brands on three seven- point items (α =.83) anchored by strongly disagree/strongly
agree.
Subsequently, participants were asked demographic questions such as age, gender, income, city of
residence, number of people in the household. Next, they were asked to indicate the brand being
currently used at their home. Participants then were asked to state on a single five-point item their
laundry detergent buying experience and usage experience, anchored by never/very often. In
addition, this research assessed respondents’ level of motivation while participating in the
experiment on three seven-point items, with one inverted score item anchored by completely
disagree/completely agree (1- I was very motivated to give an accurate evaluation of the laundry
detergents presented to me; 2- I did not put much effort into the evaluation of the products; 3- It
was very important to read the questions carefully). Additionally, participants were asked to indicate
their judgments of how realistic the experiment was on a single seven-point item (M= 5.32, SD=
1.31). Next, a suspicion probe open-ended question, wherein participants were asked to guess the
purpose of the study was administered. To finalize their participation, respondents were given the
option to provide their emails in order to have the chance to win one of the promotional kits. Then,
they were told that some of the products that had been shown were fictitious. Finally, they were
thanked for their participation in the study.
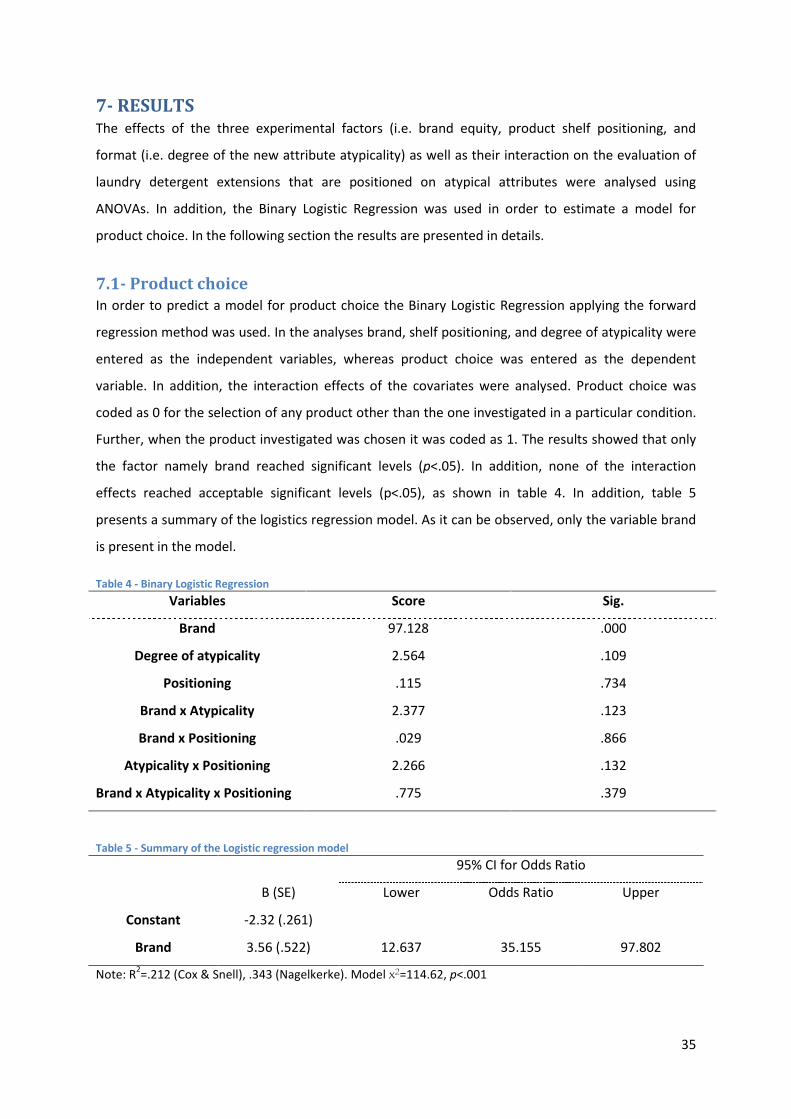
35
7- RESULTS The effects of the three experimental factors (i.e. brand equity, product shelf positioning, and
format (i.e. degree of the new attribute atypicality) as well as their interaction on the evaluation of
laundry detergent extensions that are positioned on atypical attributes were analysed using
ANOVAs. In addition, the Binary Logistic Regression was used in order to estimate a model for
product choice. In the following section the results are presented in details.
7.1- Product choice In order to predict a model for product choice the Binary Logistic Regression applying the forward
regression method was used. In the analyses brand, shelf positioning, and degree of atypicality were
entered as the independent variables, whereas product choice was entered as the dependent
variable. In addition, the interaction effects of the covariates were analysed. Product choice was
coded as 0 for the selection of any product other than the one investigated in a particular condition.
Further, when the product investigated was chosen it was coded as 1. The results showed that only
the factor namely brand reached significant levels (p<.05). In addition, none of the interaction
effects reached acceptable significant levels (p<.05), as shown in table 4. In addition, table 5
presents a summary of the logistics regression model. As it can be observed, only the variable brand
is present in the model.
Table 4 - Binary Logistic Regression
Variables Score Sig.
Brand 97.128 .000
Degree of atypicality 2.564 .109
Positioning .115 .734
Brand x Atypicality 2.377 .123
Brand x Positioning .029 .866
Atypicality x Positioning 2.266 .132
Brand x Atypicality x Positioning .775 .379
Table 5 - Summary of the Logistic regression model
95% CI for Odds Ratio
B (SE) Lower Odds Ratio Upper
Constant -2.32 (.261)
Brand 3.56 (.522) 12.637 35.155 97.802
Note: R2=.212 (Cox & Snell), .343 (Nagelkerke). Model x2=114.62, p<.001

36
Support for this finding is found in the analyses of participants’ reasoning for their product choice. In
an open-ended question participants were asked to explain what motivated them to select a
particular product. After analysing respondents’ answers, each one of them was entered in one or
more categories, depending on the number of arguments provided. The categories were developed
on the basis of the responses provided. As it can be observed below, participants mostly
acknowledged Brand as the most important criteria for choosing a laundry detergent (29%),
followed by Quality (21%), and Cost-benefit (14%).
Figure 8 - Reasoning for product selection
7.2- Attitudes As expected, the analyses of attitudes showed a significant main effect of brand on the evaluations
of the new line extensions F(1,416)=33.99, p<.001. As predicted, the two line extensions of OMO
(high-equity brand) received more favourable evaluations (M=5.30) in comparison with the two new
variants of ARCUS (low-equity brand) (M=4.64). As anticipated, the results also showed a significant
main effect of shelf positioning on the evaluations of the new products F(1,416)=7.99, p=.005,
=.19. More specifically, the evaluations of the new line extensions were higher when they were
positioned in the centre (M=5.13) rather than on the edge (M=4.81). By contrast, with respect to the
format (i.e. degree of atypicality), no significant difference was found in the way that respondents
evaluated both products’ format F(1,416)=.62, p=.431.
Regarding the interaction effects, none of them reached significant levels (p<.05). More specifically,
there was no significant interaction effect between brand and format F(1,416)=2.47, p=.117. In
addition, there was no significant interaction effect between brand and shelf positioning
F(1,416)=2.06, p=.152. Further, the interaction between shelf positioning and format was also found
to be non-significant F(1,416)=.39, p=.533. The results also did not show a significant interaction
effect between the three independent variables F(1,416)=.658, p=.418.
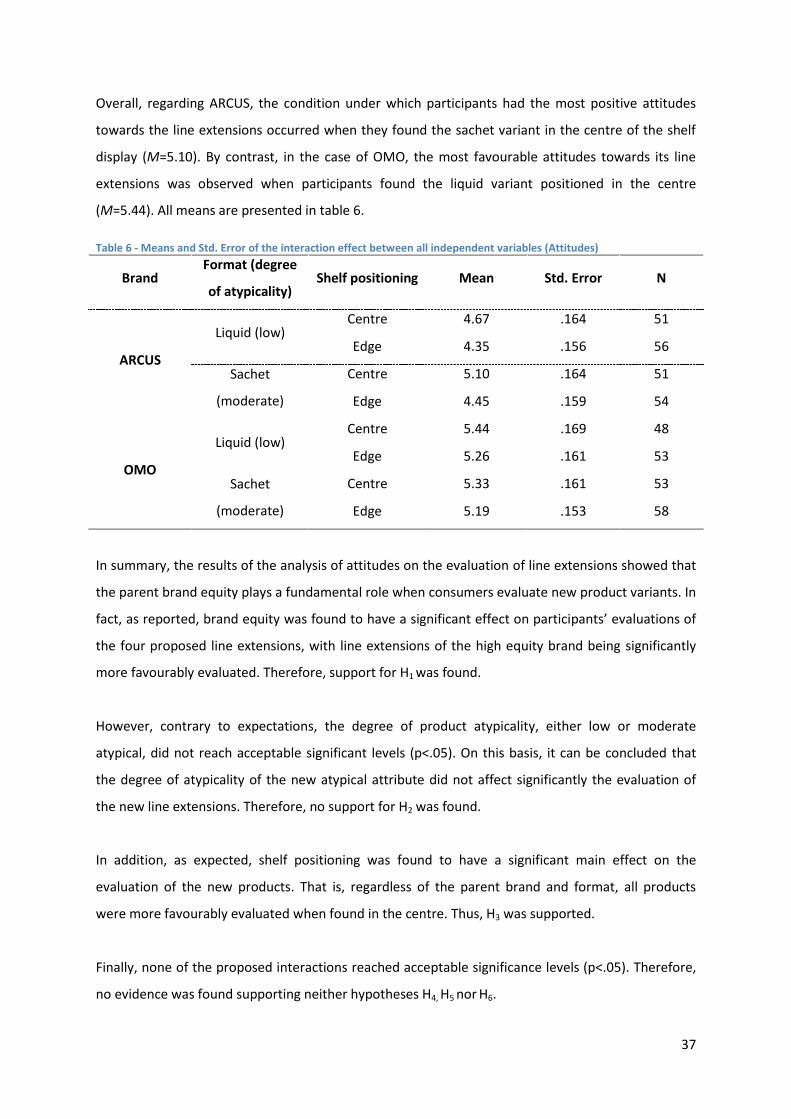
37
Overall, regarding ARCUS, the condition under which participants had the most positive attitudes
towards the line extensions occurred when they found the sachet variant in the centre of the shelf
display (M=5.10). By contrast, in the case of OMO, the most favourable attitudes towards its line
extensions was observed when participants found the liquid variant positioned in the centre
(M=5.44). All means are presented in table 6.
Table 6 - Means and Std. Error of the interaction effect between all independent variables (Attitudes)
Brand Format (degree
of atypicality) Shelf positioning Mean Std. Error N
ARCUS
Liquid (low) Centre 4.67 .164 51
Edge 4.35 .156 56
Sachet
(moderate)
Centre 5.10 .164 51
Edge 4.45 .159 54
OMO
Liquid (low) Centre 5.44 .169 48
Edge 5.26 .161 53
Sachet
(moderate)
Centre 5.33 .161 53
Edge 5.19 .153 58
In summary, the results of the analysis of attitudes on the evaluation of line extensions showed that
the parent brand equity plays a fundamental role when consumers evaluate new product variants. In
fact, as reported, brand equity was found to have a significant effect on participants’ evaluations of
the four proposed line extensions, with line extensions of the high equity brand being significantly
more favourably evaluated. Therefore, support for H1 was found.
However, contrary to expectations, the degree of product atypicality, either low or moderate
atypical, did not reach acceptable significant levels (p<.05). On this basis, it can be concluded that
the degree of atypicality of the new atypical attribute did not affect significantly the evaluation of
the new line extensions. Therefore, no support for H2 was found.
In addition, as expected, shelf positioning was found to have a significant main effect on the
evaluation of the new products. That is, regardless of the parent brand and format, all products
were more favourably evaluated when found in the centre. Thus, H3 was supported.
Finally, none of the proposed interactions reached acceptable significance levels (p<.05). Therefore,
no evidence was found supporting neither hypotheses H4, H5 nor H6.

38
7.3- Purchase intentions The results for willingness to buy the proposed line extensions resembled those for attitudes, except
for the interaction between brand and format, which was found to be significant (p<.05). As
expected the results showed a significant main effect of brand on intentions to buy the new variants
F(1,416)=11.36, p=.001. More specifically, participants indicated to be more willing to buy the
products of OMO (M=3.30) than the new variants of ARCUS (M=2.91). Likewise, there was a
significant main effect of shelf positioning on participants’ purchase intentions F(1,416)=7.74,
p=.006, = .18, such that all products received higher purchase intentions when positioned in the
centre (M=3.26) rather than on the edge (M=2.94). Contrary to expectations, there was no
significant main effect of format (i.e. degree of atypicality) on intentions to buy F(1,416)=2.61,
p=.107.
Importantly, the results showed a significant interaction effect between brand and format
F(1,416)=5.11, p=.024. In line with expectation, the effect of the degree of atypicality was stronger
for the low equity brand than for the high equity brand. In other words, for the high equity brand
the intentions to buy did not significantly alter depending on the format F(1,210)=.167, p=.683,
whereas for the low equity brand participants indicated to have significant higher intentions to buy
the moderate incongruent option (sachet product) F(1,210)=7.63, p=.006. The interaction is shown
in figure 9.
Figure 9 - Purchase intentions of laundry detergent extensions (+SE, -SE)
In the same manner as for attitudes, there was no significant interaction effect between brand and
shelf positioning F(1,416)=.22, p=.637. Regarding the interaction effect between format and shelf
positioning, the results again did not show a significant interaction effect F(1,416)=.142, p=.904.

39
Finally, there was no significant interaction effect between the three independent variables
F(1,416)=1.21, p=.272. All in all, in the same way as for attitudes, for ARCUS, participants
demonstrated to be more willing to buy the sachet variant when it was positioned in the centre of
the display (M=3.33). On the contrary, for OMO, participants indicated to have higher intentions to
buy the liquid variant when it was found in the centre of the shelf display (M= 3.57). All means are
shown in table 7.
Table 7 - Means and Std. Error of the interaction effect between all independent variables (Purchase Intentions)
Brand Format (degree
of atypicality) Shelf positioning Mean Std. Error N
ARCUS
Liquid (low) Centre 2.75 .166 51
Edge 2.62 .158 56
Sachet
(moderate)
Centre 3.33 .166 51
Edge 2.93 .161 54
OMO
Liquid (low) Centre 3.58 .171 48
Edge 3.09 .163 53
Sachet
(moderate)
Centre 3.39 .163 53
Edge 3.13 .156 58
To sum up, resembling the results for attitudes, the findings of the analysis of purchase intentions of
the four line extensions showed that the parent brand equity and shelf positioning had significant
main effects on intentions to buy the products. With respect to the former, in accordance with
expectations, the line extensions of the high equity brand had higher purchase intentions compared
with those of the low equity brand. Regarding the latter, as anticipated, all line extensions when
positioned in centre received higher buying intentions. This research has therefore found evidence
supporting both H1 and H3. However, contrary to expectations, the format of the new product
variant did not reach acceptable significance levels (p<.05). Hence no support for H2 was found.
In addition, a significant interaction effect between brand and format was found. As expected, the
different product formats (liquid vs. sachet) had more influence for the low equity brand rather than
for the high equity brand. To be more precise, the results indicate that the format of the product has
a significant effect on purchase intentions for the low equity brand. Whereas, for the high equity
brand purchase intentions was not found to significantly differ depending on the product format.
Therefore, H5 is supported. This was the only interaction effect that reached significance. Hence no
support for H4 or H6 was found.

40
7.4- Attributes of the laundry detergent category
7.4.1- Cleanness and Ease of use
The analysis of the data showed that for both attributes (i.e. the analyses were run separately) there
was only one main effect that reached significance, namely, brand. To be more precise, in the case
of respondents’ perception of how clean each product would leave their clothes, the analysis
showed that brand had a significant main effect F(1,416)=9.59, p=.002 on respondents’ cleanness
expectations (ARCUS - M=4.15/ OMO – M=4.35). Regarding participants’ perception of how easy the
use of each line extension would be, again the results showed a significant main effect of brand
F(1,416)=10.83, p=.001 on subjects’ perception of easiness of product usage (ARCUS - M=4.05/ OMO
- M=4.29). With respect to the interaction effects, none of them reached acceptable significance
levels (p<.05).
In sum, for both laundry detergent attributes, brand was the only dependent variable found to have
a significant effect. The results is in line with the findings for attitudes and purchase intention, in
which brand was reported to significantly affect respondents’ answers. Differently from the findings
for attitudes and purchase intentions, product shelf positioning was not found to have a significant
effect on participants’ perception. Finally, none of the interaction effects was found to be significant
(p<.05).
7.5- Atypicality
The results found regarding participants’ perception of product atypicality support those found in
the pre-test. More specifically, as expected, there was no significant main effect of brand on
perception of variant atypicality F(1,416)=2.07, p=.151. In other words, subjects’ perceptions of the
new line extensions did not significantly alter depending on the parent brand (ARCUS - M=3.53/
OMO – M=3.73). Importantly, the format of the new products (i.e. liquid vs. sachet) was found to
have a significant main effect on participants’ perception of product atypicality to the product
category F(1,416)=13.70, p<.001. As predicted, participants indicated the sachet variants as being
more atypical (M=3.37) than the liquid products (M=3.88). Conversely, there was no significant main
effect of shelf positioning on perception of product atypicality F(1,416)=.02, p=.900.
Regarding the interaction effects, as found for purchase intentions, the interaction effect between
brand and format was the only one found to reach significance F(1,416)=6.04, p=.014. To be more
precise, the analyses of the interaction of these two factors showed that for the high equity brand
the different products’ format had a greater discrepancy on perception of atypicality compared with
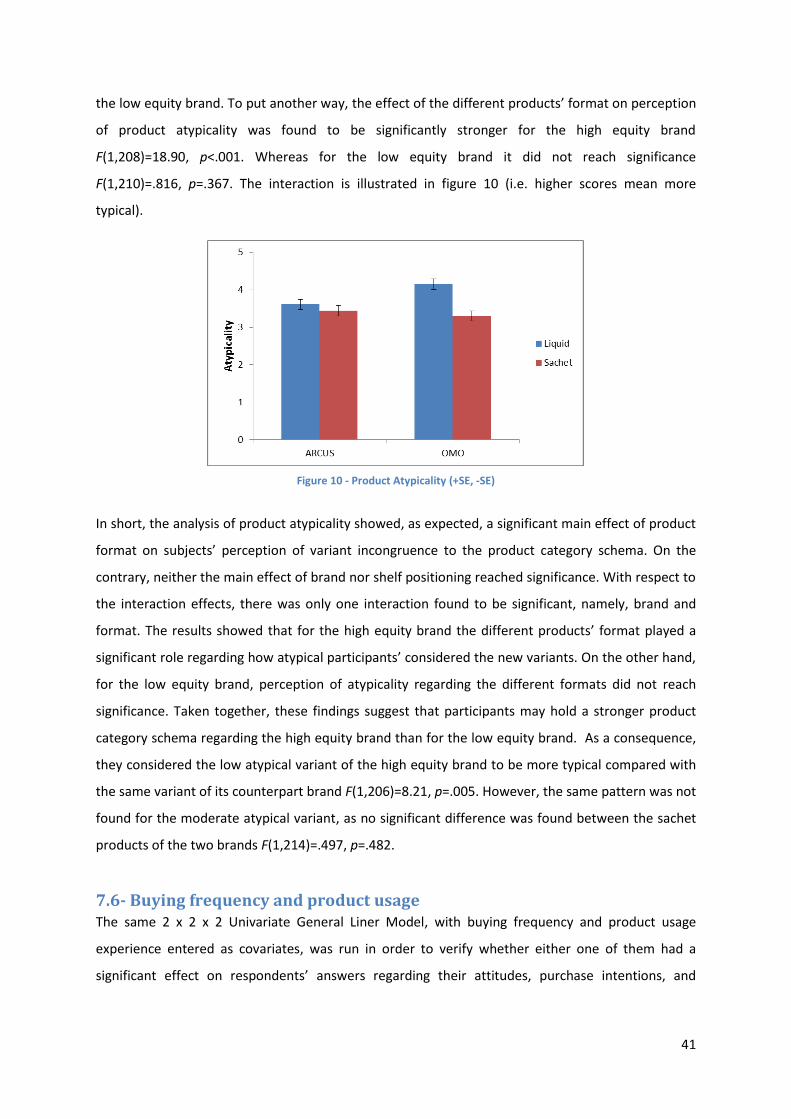
41
the low equity brand. To put another way, the effect of the different products’ format on perception
of product atypicality was found to be significantly stronger for the high equity brand
F(1,208)=18.90, p<.001. Whereas for the low equity brand it did not reach significance
F(1,210)=.816, p=.367. The interaction is illustrated in figure 10 (i.e. higher scores mean more
typical).
Figure 10 - Product Atypicality (+SE, -SE)
In short, the analysis of product atypicality showed, as expected, a significant main effect of product
format on subjects’ perception of variant incongruence to the product category schema. On the
contrary, neither the main effect of brand nor shelf positioning reached significance. With respect to
the interaction effects, there was only one interaction found to be significant, namely, brand and
format. The results showed that for the high equity brand the different products’ format played a
significant role regarding how atypical participants’ considered the new variants. On the other hand,
for the low equity brand, perception of atypicality regarding the different formats did not reach
significance. Taken together, these findings suggest that participants may hold a stronger product
category schema regarding the high equity brand than for the low equity brand. As a consequence,
they considered the low atypical variant of the high equity brand to be more typical compared with
the same variant of its counterpart brand F(1,206)=8.21, p=.005. However, the same pattern was not
found for the moderate atypical variant, as no significant difference was found between the sachet
products of the two brands F(1,214)=.497, p=.482.
7.6- Buying frequency and product usage The same 2 x 2 x 2 Univariate General Liner Model, with buying frequency and product usage
experience entered as covariates, was run in order to verify whether either one of them had a
significant effect on respondents’ answers regarding their attitudes, purchase intentions, and

42
perceived atypicality towards the investigated line extensions. A summary of the findings are shown
in table 8.
Table 8 – Summary of findings for Buying frequency and Product usage experience
Dependent variable Covariate F* Sig. VIF
Attitudes Buying frequency 1.57 .211 1.00
Usage experience .001 .982 1.00
Purchase Intentions Buying frequency 1.06 .305 1.00
Usage experience .53 .469 1.00
Atypicality Buying frequency .001 .976 1.00
Usage experience 2.14 .144 1.00
*df=(1,415)
In short, as it can be seen in the table, there was no significant effect of neither buying frequency
nor product usage experience on any of the three dependent variables. In other words, the results
showed that there was no significant difference among the dependent variables when participants’
buying frequency and their product usage experience were taken into account. The means and
standard deviations found for buying frequency and product usage experience were (M= 3.87, SD=
0.78) and (M= 4.17, SD= 0.72), respectively. Overall, these means suggest that participants were
relatively well-experienced with the product category investigated. At last, the variance inflation
factor (VIF) values, 1.0, indicate that collinearity is not an issue for those models (i.e. they were run
separately for each pair of constructs), as shown in the table above.
7.7- Brand Familiarity As there was only one factor influencing participants’ response regarding their familiarity with the
investigated brands in this research One-Way ANOVA was used to analyse the data. In accordance
with expectations, the results showed that participants indicated to be significantly more familiar
with OMO rather than with ARCUS F(1,422)=943.27, p<.001. Importantly, this result supports the
choice for the investigations of product line extensions of OMO (M=5.57) and ARCUS (M=1.77), as
high and low equity brands, respectively. The means and standard errors are shown in figure 11.

43
Figure 11 - Brand Familiarity (+SE, -SE)
7.8- Participants motivation In this study three questions were ministered to the participants in order to assess their level of
motivation to participate in the study. One of the items was an inverted score item. Therefore, it was
recoded before the analysis was run. For example, a participant who answered 2 in this inverted
score item, ended up scoring a 6. The results showed that M=5.63 and SD=1.36. This finding
indicates that participants demonstrated to have a relatively high level of motivation while taking
part in the study. In addition, in order to rule out any effect of low motivation in the study’s results,
those participants who scored low in the inverted score had their answers excluded from the
analyses. Nonetheless, no significant difference was observed with respect to any result that has
been presented here.
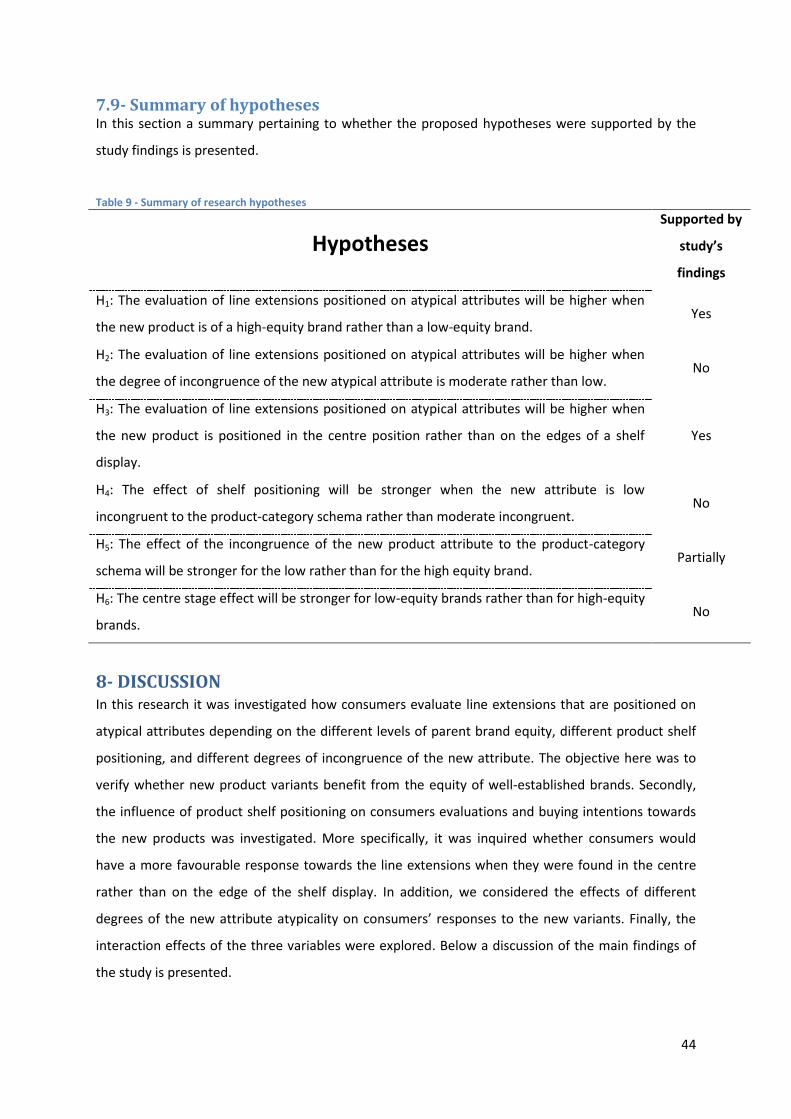
44
7.9- Summary of hypotheses In this section a summary pertaining to whether the proposed hypotheses were supported by the
study findings is presented.
Table 9 - Summary of research hypotheses
Hypotheses
Supported by
study’s
findings
H1: The evaluation of line extensions positioned on atypical attributes will be higher when
the new product is of a high-equity brand rather than a low-equity brand. Yes
H2: The evaluation of line extensions positioned on atypical attributes will be higher when
the degree of incongruence of the new atypical attribute is moderate rather than low. No
H3: The evaluation of line extensions positioned on atypical attributes will be higher when
the new product is positioned in the centre position rather than on the edges of a shelf
display.
Yes
H4: The effect of shelf positioning will be stronger when the new attribute is low
incongruent to the product-category schema rather than moderate incongruent. No
H5: The effect of the incongruence of the new product attribute to the product-category
schema will be stronger for the low rather than for the high equity brand. Partially
H6: The centre stage effect will be stronger for low-equity brands rather than for high-equity
brands. No
8- DISCUSSION In this research it was investigated how consumers evaluate line extensions that are positioned on
atypical attributes depending on the different levels of parent brand equity, different product shelf
positioning, and different degrees of incongruence of the new attribute. The objective here was to
verify whether new product variants benefit from the equity of well-established brands. Secondly,
the influence of product shelf positioning on consumers evaluations and buying intentions towards
the new products was investigated. More specifically, it was inquired whether consumers would
have a more favourable response towards the line extensions when they were found in the centre
rather than on the edge of the shelf display. In addition, we considered the effects of different
degrees of the new attribute atypicality on consumers’ responses to the new variants. Finally, the
interaction effects of the three variables were explored. Below a discussion of the main findings of
the study is presented.
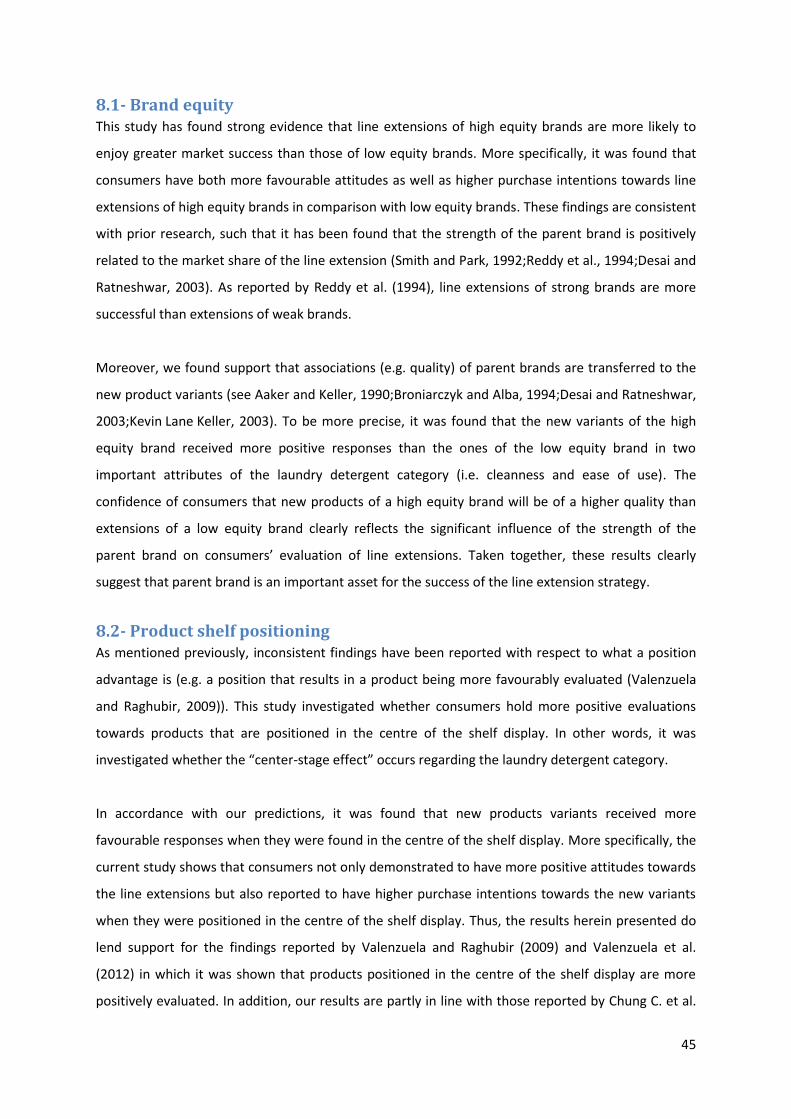
45
8.1- Brand equity This study has found strong evidence that line extensions of high equity brands are more likely to
enjoy greater market success than those of low equity brands. More specifically, it was found that
consumers have both more favourable attitudes as well as higher purchase intentions towards line
extensions of high equity brands in comparison with low equity brands. These findings are consistent
with prior research, such that it has been found that the strength of the parent brand is positively
related to the market share of the line extension (Smith and Park, 1992;Reddy et al., 1994;Desai and
Ratneshwar, 2003). As reported by Reddy et al. (1994), line extensions of strong brands are more
successful than extensions of weak brands.
Moreover, we found support that associations (e.g. quality) of parent brands are transferred to the
new product variants (see Aaker and Keller, 1990;Broniarczyk and Alba, 1994;Desai and Ratneshwar,
2003;Kevin Lane Keller, 2003). To be more precise, it was found that the new variants of the high
equity brand received more positive responses than the ones of the low equity brand in two
important attributes of the laundry detergent category (i.e. cleanness and ease of use). The
confidence of consumers that new products of a high equity brand will be of a higher quality than
extensions of a low equity brand clearly reflects the significant influence of the strength of the
parent brand on consumers’ evaluation of line extensions. Taken together, these results clearly
suggest that parent brand is an important asset for the success of the line extension strategy.
8.2- Product shelf positioning As mentioned previously, inconsistent findings have been reported with respect to what a position
advantage is (e.g. a position that results in a product being more favourably evaluated (Valenzuela
and Raghubir, 2009)). This study investigated whether consumers hold more positive evaluations
towards products that are positioned in the centre of the shelf display. In other words, it was
investigated whether the “center-stage effect” occurs regarding the laundry detergent category.
In accordance with our predictions, it was found that new products variants received more
favourable responses when they were found in the centre of the shelf display. More specifically, the
current study shows that consumers not only demonstrated to have more positive attitudes towards
the line extensions but also reported to have higher purchase intentions towards the new variants
when they were positioned in the centre of the shelf display. Thus, the results herein presented do
lend support for the findings reported by Valenzuela and Raghubir (2009) and Valenzuela et al.
(2012) in which it was shown that products positioned in the centre of the shelf display are more
positively evaluated. In addition, our results are partly in line with those reported by Chung C. et al.
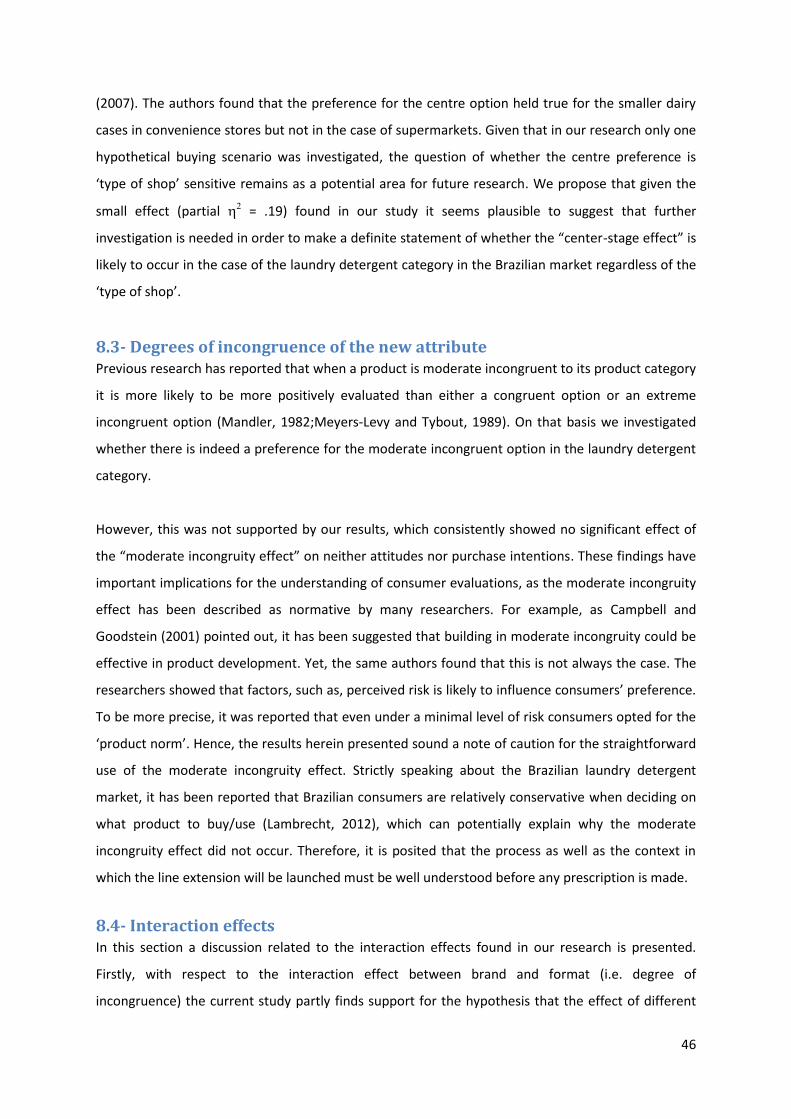
46
(2007). The authors found that the preference for the centre option held true for the smaller dairy
cases in convenience stores but not in the case of supermarkets. Given that in our research only one
hypothetical buying scenario was investigated, the question of whether the centre preference is
‘type of shop’ sensitive remains as a potential area for future research. We propose that given the
small effect (partial = .19) found in our study it seems plausible to suggest that further
investigation is needed in order to make a definite statement of whether the “center-stage effect” is
likely to occur in the case of the laundry detergent category in the Brazilian market regardless of the
‘type of shop’.
8.3- Degrees of incongruence of the new attribute Previous research has reported that when a product is moderate incongruent to its product category
it is more likely to be more positively evaluated than either a congruent option or an extreme
incongruent option (Mandler, 1982;Meyers-Levy and Tybout, 1989). On that basis we investigated
whether there is indeed a preference for the moderate incongruent option in the laundry detergent
category.
However, this was not supported by our results, which consistently showed no significant effect of
the “moderate incongruity effect” on neither attitudes nor purchase intentions. These findings have
important implications for the understanding of consumer evaluations, as the moderate incongruity
effect has been described as normative by many researchers. For example, as Campbell and
Goodstein (2001) pointed out, it has been suggested that building in moderate incongruity could be
effective in product development. Yet, the same authors found that this is not always the case. The
researchers showed that factors, such as, perceived risk is likely to influence consumers’ preference.
To be more precise, it was reported that even under a minimal level of risk consumers opted for the
‘product norm’. Hence, the results herein presented sound a note of caution for the straightforward
use of the moderate incongruity effect. Strictly speaking about the Brazilian laundry detergent
market, it has been reported that Brazilian consumers are relatively conservative when deciding on
what product to buy/use (Lambrecht, 2012), which can potentially explain why the moderate
incongruity effect did not occur. Therefore, it is posited that the process as well as the context in
which the line extension will be launched must be well understood before any prescription is made.
8.4- Interaction effects In this section a discussion related to the interaction effects found in our research is presented.
Firstly, with respect to the interaction effect between brand and format (i.e. degree of
incongruence) the current study partly finds support for the hypothesis that the effect of different
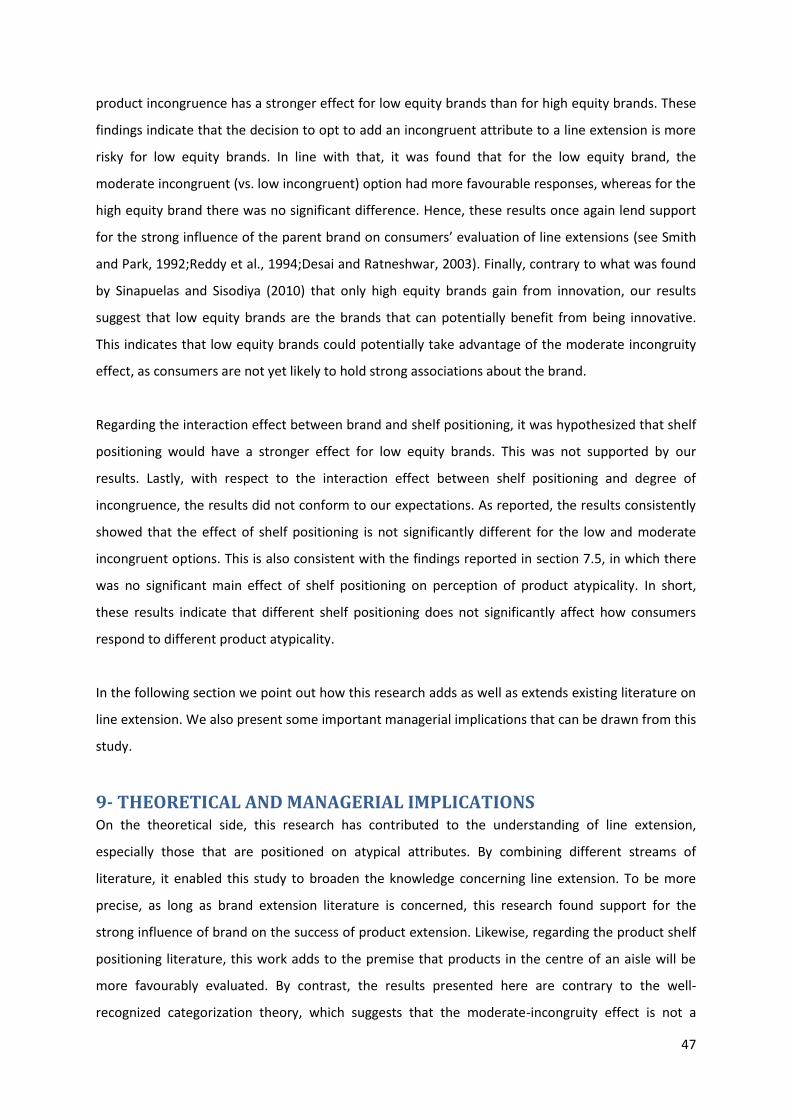
47
product incongruence has a stronger effect for low equity brands than for high equity brands. These
findings indicate that the decision to opt to add an incongruent attribute to a line extension is more
risky for low equity brands. In line with that, it was found that for the low equity brand, the
moderate incongruent (vs. low incongruent) option had more favourable responses, whereas for the
high equity brand there was no significant difference. Hence, these results once again lend support
for the strong influence of the parent brand on consumers’ evaluation of line extensions (see Smith
and Park, 1992;Reddy et al., 1994;Desai and Ratneshwar, 2003). Finally, contrary to what was found
by Sinapuelas and Sisodiya (2010) that only high equity brands gain from innovation, our results
suggest that low equity brands are the brands that can potentially benefit from being innovative.
This indicates that low equity brands could potentially take advantage of the moderate incongruity
effect, as consumers are not yet likely to hold strong associations about the brand.
Regarding the interaction effect between brand and shelf positioning, it was hypothesized that shelf
positioning would have a stronger effect for low equity brands. This was not supported by our
results. Lastly, with respect to the interaction effect between shelf positioning and degree of
incongruence, the results did not conform to our expectations. As reported, the results consistently
showed that the effect of shelf positioning is not significantly different for the low and moderate
incongruent options. This is also consistent with the findings reported in section 7.5, in which there
was no significant main effect of shelf positioning on perception of product atypicality. In short,
these results indicate that different shelf positioning does not significantly affect how consumers
respond to different product atypicality.
In the following section we point out how this research adds as well as extends existing literature on
line extension. We also present some important managerial implications that can be drawn from this
study.
9- THEORETICAL AND MANAGERIAL IMPLICATIONS On the theoretical side, this research has contributed to the understanding of line extension,
especially those that are positioned on atypical attributes. By combining different streams of
literature, it enabled this study to broaden the knowledge concerning line extension. To be more
precise, as long as brand extension literature is concerned, this research found support for the
strong influence of brand on the success of product extension. Likewise, regarding the product shelf
positioning literature, this work adds to the premise that products in the centre of an aisle will be
more favourably evaluated. By contrast, the results presented here are contrary to the well-
recognized categorization theory, which suggests that the moderate-incongruity effect is not a

48
definitive formula for product success. Instead, the findings suggest that the entire context where
the product is to be launched must be well-understood.
Furthermore, there are important managerial implications to the current research. As previously
mentioned, brand has been found to be a crucial factor influencing products’ evaluation.
Nonetheless, it is important to point out that other factors, such as product fit (Aaker, 1991) has
been reported to be also a very important factor affecting consumers’ responses towards new
product variants. This research suggests that managers of high equity brands should take the
advantage of the image and reputation of the brand when launching a new product. On the other
hand, managers of low equity brands are encouraged to emphasize on the benefits that a new
product can offer to its consumers. For example, managers of low equity brands could consider
investing part of the company’s budget on advertising focusing on the positive rewards that
consumers will have by using its products. Additionally, they could also invest on promotional
support (e.g. coupons), so that consumers who are not yet familiar with the products can become
aware of it.
Moreover, given the ever increasing launching of new products shelf space scarcity has been a
prominent issue (Valenzuela et al., 2012). The present study indicates that product managers should
be willing to pay a premium price to have their products positioned in the centre of shelf displays as
to increase the evaluations of their products as well as to foster more positive buying intentions.
Additionally, supermarket managers could also take advantage of the “center-stage effect”. For
example they can position the brands with higher margins in this position. In addition, they can
negotiate with brand managers a higher price for having their products positioned in the centre of
the shelf display. Finally, with respect to the degree of incongruence of the product’s attribute, as it
was found in this research, the different degrees of product atypicality only matters to low equity
brands. Therefore, it is suggested that managers of low equity brands should pay an extra effort
while considering what attribute to add to a product line. Given this study’s findings it is suggested
that a moderate atypical attribute should be preferred rather than a low atypical one as to increase
products’ evaluation and buying intentions.
To sum up, with respect to one of the motivations of this study, which was to investigate a potential
future line extension for Arcus, based on this thesis’s results it can be suggested the following:
The brand should communicate the benefits that its new product brings into the market,
rather than focus on the brand itself;

49
Its managers should battle for the centre position on supermarkets’ shelves. A potential way
to do that is to make a win-win agreement with retailers;
The brand should exploit the innovativeness factor. As it was shown consumers hold more
positive responses towards the moderate incongruity product.
10- LIMITATIONS AND AREA FOR FUTURE RESEARCH This study has various limitations. To begin with, the data was collected through an online
questionnaire, therefore neither control over participants’ behaviour nor over the experimental
environment was possible. As a consequence, as observed in the time respondents took to
participate in the study, it can be seen that some participants took much longer than others, which
may imply that they were distracted during the experiment (i.e. although data was analysed without
outliers and no significant difference was observed). Hence, in order to generalize the study’s
findings it is suggested that future research should aim to create a more neutral environment where
distracters can be minimized. This in turn will enable researchers to estimate the real effect of a
given independent variable.
In addition, only one product category was investigated in this study. Future research could examine
the generalizability of the present findings to other product categories and a much wider range of
product attributes. Furthermore, with respect to the selection of the target brands, it can be said
that each studied brand belongs to a side of a spectrum, that is, Omo as the most popular brand in
the Brazilian market and Arcus at the other extreme. Thus, future investigation could examine other
brands’ equities.
In this research price was not explicitly mentioned to participants. As price is an important
component in products’ evaluation and choice, the results herein presented should be treated
carefully. Nevertheless, it is argued that it’s not consideration in this research does not bias the
results. Brazilian consumers normally have a good estimation of the price of products. In addition,
given that respondents reported a relatively high laundry detergent buying frequency (M= 3.87, SD=
0.78), it can be argued that they are likely to be aware of the price of products. Moreover, prices of
products in the Brazilian laundry detergent market are not likely to vary from product to product (i.e.
small price range difference).
This research also did not take into account participants traits, such as preference for
innovativeness. It is quite possible that those people who score high in this trait will evaluate the
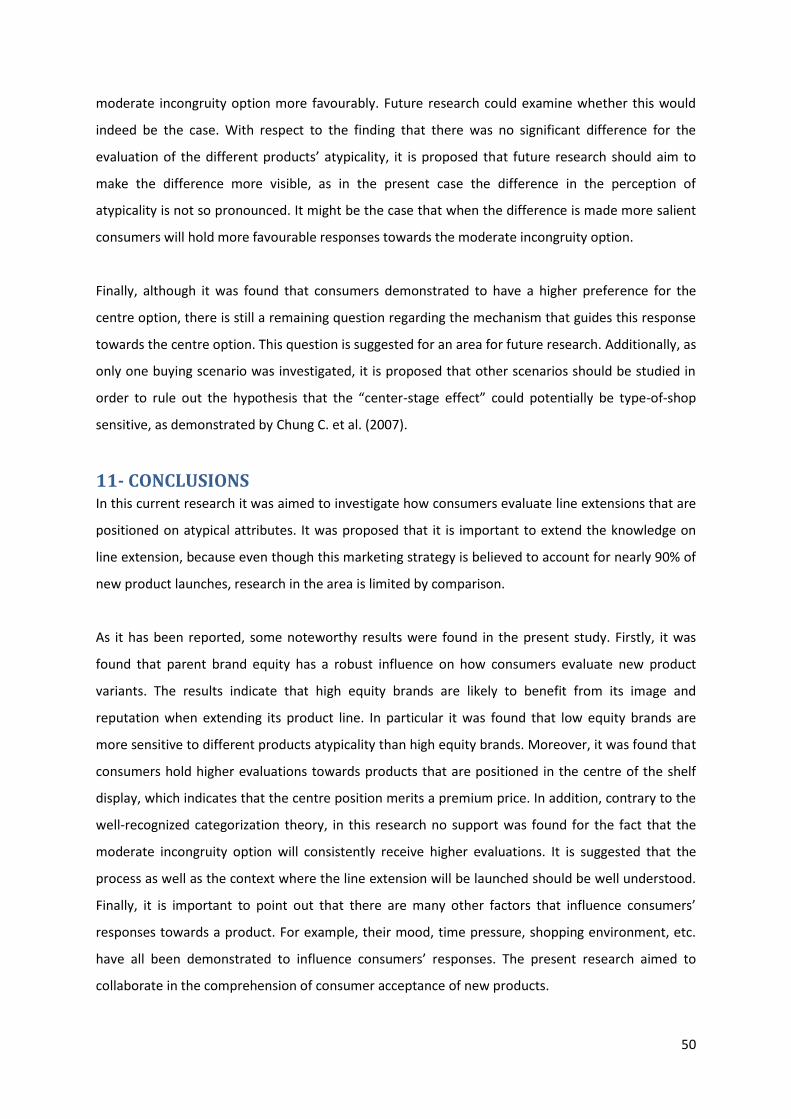
50
moderate incongruity option more favourably. Future research could examine whether this would
indeed be the case. With respect to the finding that there was no significant difference for the
evaluation of the different products’ atypicality, it is proposed that future research should aim to
make the difference more visible, as in the present case the difference in the perception of
atypicality is not so pronounced. It might be the case that when the difference is made more salient
consumers will hold more favourable responses towards the moderate incongruity option.
Finally, although it was found that consumers demonstrated to have a higher preference for the
centre option, there is still a remaining question regarding the mechanism that guides this response
towards the centre option. This question is suggested for an area for future research. Additionally, as
only one buying scenario was investigated, it is proposed that other scenarios should be studied in
order to rule out the hypothesis that the “center-stage effect” could potentially be type-of-shop
sensitive, as demonstrated by Chung C. et al. (2007).
11- CONCLUSIONS In this current research it was aimed to investigate how consumers evaluate line extensions that are
positioned on atypical attributes. It was proposed that it is important to extend the knowledge on
line extension, because even though this marketing strategy is believed to account for nearly 90% of
new product launches, research in the area is limited by comparison.
As it has been reported, some noteworthy results were found in the present study. Firstly, it was
found that parent brand equity has a robust influence on how consumers evaluate new product
variants. The results indicate that high equity brands are likely to benefit from its image and
reputation when extending its product line. In particular it was found that low equity brands are
more sensitive to different products atypicality than high equity brands. Moreover, it was found that
consumers hold higher evaluations towards products that are positioned in the centre of the shelf
display, which indicates that the centre position merits a premium price. In addition, contrary to the
well-recognized categorization theory, in this research no support was found for the fact that the
moderate incongruity option will consistently receive higher evaluations. It is suggested that the
process as well as the context where the line extension will be launched should be well understood.
Finally, it is important to point out that there are many other factors that influence consumers’
responses towards a product. For example, their mood, time pressure, shopping environment, etc.
have all been demonstrated to influence consumers’ responses. The present research aimed to
collaborate in the comprehension of consumer acceptance of new products.
51
APPENDICES
1- QUESTIONNAIRE (Portuguese version)
Prezado(a),
Esta pesquisa tem como objetivo investigar a resposta de pessoas em relação a produtos da
categoria de sabão lava roupas no mercado Brasileiro. Portanto, nós gostarÍamos de saber a sua
opinião em relação à alguns dos produtos na categoria de sabão lava roupas.
Duas imagens serão apresentadas, é muito importante que você veja cada imagem cuidadosamente.
Depois de visualizar cada imagem, você irá responder algumas perguntas. Nós estamos interessados
na sua opinião, portanto não exitem respostas corretas ou erradas. O tempo necessário para
responder este questionário é de aproxidamente 15 minutos. Os resultados desta pequisa serão
tratatos de forma anônima.
Com a sua participação neste estudo você vai ter a chance de concorrer a um kit com produtos
relacionados a categoria de sabão lava roupas.
Muito obrigado por sua ajuda!
Álvaro Henrique Prado Carvalho (MSc student at Wageningen University – MCB group) Supervisors: Dr. Erica van Herpen Dr. Andres Trujilo-Barrera
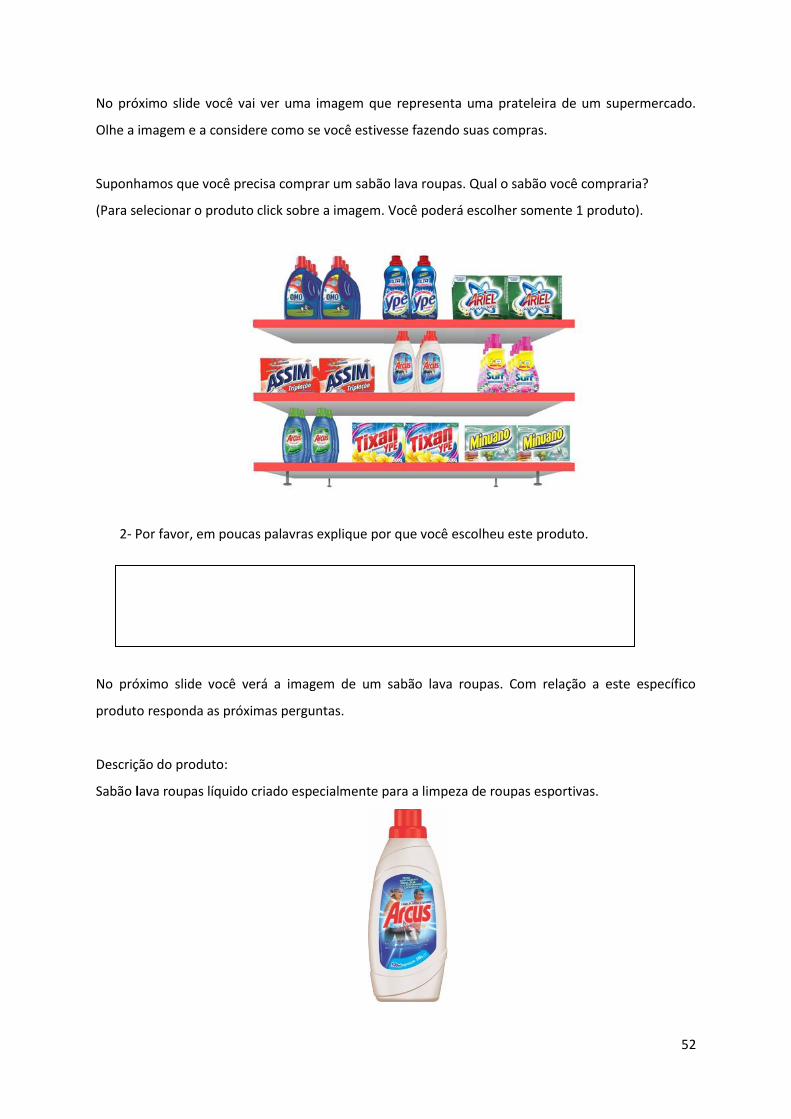
52
No próximo slide você vai ver uma imagem que representa uma prateleira de um supermercado.
Olhe a imagem e a considere como se você estivesse fazendo suas compras.
Suponhamos que você precisa comprar um sabão lava roupas. Qual o sabão você compraria?
(Para selecionar o produto click sobre a imagem. Você poderá escolher somente 1 produto).
2- Por favor, em poucas palavras explique por que você escolheu este produto.
No próximo slide você verá a imagem de um sabão lava roupas. Com relação a este específico
produto responda as próximas perguntas.
Descrição do produto:
Sabão lava roupas líquido criado especialmente para a limpeza de roupas esportivas.
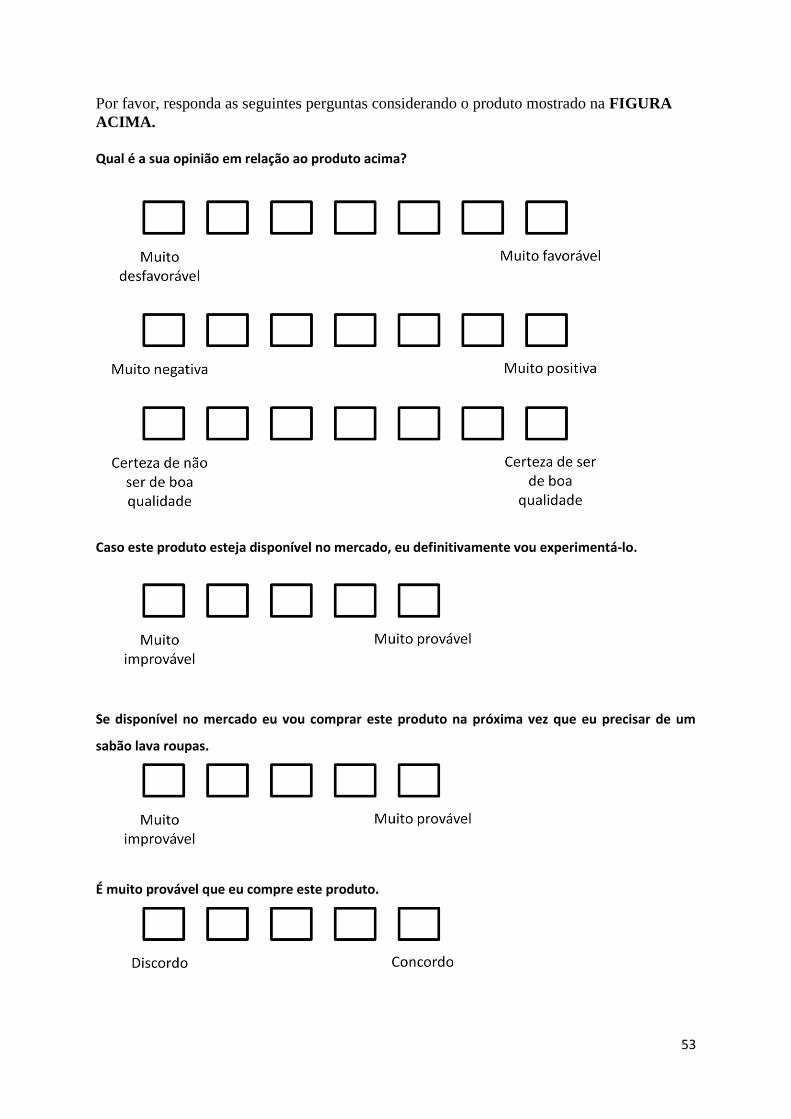
53
Por favor, responda as seguintes perguntas considerando o produto mostrado na FIGURA
ACIMA.
Qual é a sua opinião em relação ao produto acima?
Caso este produto esteja disponível no mercado, eu definitivamente vou experimentá-lo.
Se disponível no mercado eu vou comprar este produto na próxima vez que eu precisar de um
sabão lava roupas.
É muito provável que eu compre este produto.

54
Como você espera que este produto deixe suas roupas?
Como você espera que seja o uso deste produto?
Em geral, como você considera o produto mostrado na FIGURA ACIMA em relação aos demais
produtos da categoria de sabão lava roupas?
Em relação a marca dos produtos apresentados, qual é sua opinião em relação as seguintes afirmativas?
OMO/ARCUS é a marca mais popular da categoria de sabão lava roupas.
Quando eu preciso comprar sabão lava roupas, eu imediatamente penso na marca OMO/ARCUS.

55
Quando perguntado(a) sobre marcas de sabão lava roupas, OMO/ARCUS é a primeira marca que
eu penso.
Qual é a marca de sabão lava roupas que normalmente é usada na sua casa?
ARIEL ARCUS OMO Outra
Qual é a frequêcia que você compra sabão lava roupas?
Qual é a frequêcia que você usa sabão lava roupas?
Qual é a sua idade?
Qual é o seu sexo?
Masculino
Feminino
Quantas pessoas moram na mesma casa que você?
Qual é a renda mensal dos moradores da sua casa? (em salários mínimos)
Até 1 Entre 1 e 2 Entre 2 e 3 Entre 3 e 5 Entre 5 e
10
Entre 10 e
20 Mais de 20
Não
responder

56
Qual é a sua cidade de residência?
Qual a sua opinião em relação as seguintes afirmativas? Por favor escolha a alternativa que
melhor represente sua opinião.
Eu estava motivado em avaliar cuidadosamente os produtos que me foram apresentados.
Eu não me esforcei na avaliação do produto que me foi apresentado.
Foi muito importante para mim ler as perguntas cuidadosamente.
Qual a sua opinião em relação à seguinte afirmativa?
As imagens que foram apresentadas neste estudo representam bem uma situação real.
Para terminar a sua participação neste estudo, por favor responda a seguinte pergunta.
Na sua opinião qual é o objetivo desta pesquisa?
Caso você queira concorrer a um dos kits que serão sorteados escreva o seu email abaixo!!
57
Este é o final do questionário. Para terminar sua participação passe para a próxima página. MUITO
OBRIGADO por sua participação!!! Caso você tenha qualquer dúvida em relação a este estudo, por
favor me envie um email ([email protected]).
Observação: Alguns dos produtos apresentados neste estudo são fictÍcious.
2-QUESTIONNAIRE (English version)
Dear respondent,
This research attempts to investigate consumers’ responses to laundry detergent products in the
Brazilian market. Therefore, we would like to ask your opinion about some of the products in the
laundry detergent category.
On the next pages you will see two pictures ((1) shelf display; (2) laundry detergent product). It is
important that you carefully view each image. After that, you are kindly asked to answer some
questions. We are interested in YOUR opinion, so there are no right or wrong answers. This survey
will take approximately 15 minutes. The results are processed anonymously.
By participating in this research you will have the chance to win one of ten kits of laundry detergent
products.
Thanks for your cooperation!
Álvaro Henrique Prado Carvalho (MSc student at Wageningen University – MCB group) Supervisors: Dr. Erica van Herpen Dr. Andres Trujilo-Barrera

58
One shelf display (i.e. from the four possible conditions) was shown (randomly).
Participants will be asked to look at the displays as they would normally do at supermarket
shelves when they go shopping.
2- Briefly explain why
Regardless of their choice, participants then saw one of the investigated products.
(E.g. participants who saw the image above saw the following product:

59
Based on the product shown participants were asked the following questions:
3- Attitudes towards the product
What is your attitude towards the product X?
4- Purchase intentions
What is your opinion towards the following statements?
1- It is very likely that I will buy (product).
2- I will purchase (product) the next time I need a laundry detergent.
3- I will definitely try (product).

60
5- Relevant attributes
How well do you think the (product) would clean your clothes?
How easy to do think would be to use the (product)?
6- Product atypicality (in relation to the products in the laundry detergent category) í
End of the common part

61
Brand familiarity (randomly presented) anchored by strongly disagree/strongly agree
7- (Arcus or Omo) is the most popular brand of the laundry detergent category
8- When I need to buy a laundry detergent, immediately I think of (Arcus or Omo)
9- When asked about laundry detergent brands, (Arcus or Omo) is the first one that I think
10- What is the brand currently being used at your home?
__Ariel; __Arcus; __Omo; ________Other
11- How often do you buy laundry detergents?
Never___; Rarely ____; Sometimes ____; Quite often ___; Very often ___
12- How often do you use laundry detergents?
Never___; Rarely ____; Sometimes ____; Quite often ___; Very often ___
13- How old are you? __________
14- What is your gender? __________
15- Number of people in the household: ___________
16- What is your combined monthly household income? (Ranges were provided)
17- City of residence: ___________
Participants’ motivation anchored by very untrue/very true
18- I was very motivated to give an accurate evaluation of the laundry detergents presented to me
19- I did not put much effort into the evaluation of the products
20- It was very important to read the questions carefully
21- What is your opinion towards the following statement?
The experiment presented here is realistic.
Suspicion probe
22- Please, could you give a brief explanation of what you think the aim of the study is?
This is the end of the questionnaire, THANK YOU for your cooperation!!!!! If you have any question
regarding this study do not hesitate to contact me at [email protected].

62
If you want to have a chance to win one of the kits, please write your email down in the box below
Note: The products presented in this research are fictitious.

63
12- REFERENCES
Aaker, D. (2007). Innovation: Brand it or lose it. California Management Review 50, 8-24. Aaker, D.A. (1991). Managing Brand Equity. New York: The Free Pres. Aaker, D.A. (1996). Measuring Brand Equity Across Products and Markets. California Management
Review 38, 102-120. Aaker, D.A., and Keller, K.L. (1990). Consumer Evaluations of Brand Extensions. Journal of Marketing
54, 27-41. Alba, J., Lynch, J., Barton, W., Janiszewski, C., Lutz, R., Sawyer, A., and Wood, S. (1997). Interactive
Home Shopping: Consumer, Retailer, and Manufacturer Incentives to Participate in Electronic Marketplaces. Journal of Marketing 61, 38-53.
Arcus (2012). A empresa Arcus [Online]. http://www.usearcus.com.br/empresa. [Accessed 30/03/2013].
Areni, C.S., Duhan, D.F., and Kiecker, P. (1999). Point-of-purchase displays, product organization, and brand purchase likelihoods. Journal of the Academy of Marketing Science 27, 428-441.
Boisvert, J. (2012). The reciprocal impact of vertical service line extensions on parent brands: The roles of innovativeness, quality, and involvement. Managing Service Quality 22, 546-564.
Broniarczyk, S.M., and Alba, J.W. (1994). The Importance of the Brand in Brand Extension. Journal of Marketing Research 31, 214-228.
Brownell, M. (2012). Top 25 Biggest Product Flops Of All Time [Online]. http://www.dailyfinance.com/photos/top-25-biggest-product-flops-of-all-time/#slide=3662634??photo=2. [Accessed 22/03/2013].
Campbell, M.C., and Goodstein, R.C. (2001). The moderating effect of perceived risk on consumers' evaluations of product incongruity: Preference for the norm. Journal of Consumer Research 28, 439-449.
Chakravarti, A., and Janiszewski, C. (2003). The Influence of Macro-Level Motives on Consideration Set Composition in Novel Purchase Situations. Journal of Consumer Research 30, 244-258.
Chandon, P., Hutchinson, J.W., Bradlow, E.T., and Young, S.H. (2009). Does In-Store Marketing Work? Effects of the Number and Position of Shelf Facings on Brand Attention and Evaluation at the Point of Purchase. Journal of Marketing 73, 1-17.
Chernev, A. (2003). When More Is Less and Less Is More: The Role of Ideal Point Availability and Assortment in Consumer Choice. Journal of Consumer Research 30, 170-183.
Christenfeld, N. (1995). Choices from Identical Options. Psychological Science 6, 50-55. Chung C., Schmidt T.M., Dong D., and Kaiser H. M. (2007). Economic Evaluation of Shelf-Space
Management in Grocery Stores. Agribusiness 23, 583-597. Clark, H.H. (1985). Language use and language users. New York: Harpen and Row. Danneels, E., and Kleinschmidt, E.J. (2001). Product innovativeness from the firm's perspective: Its
dimensions and their relation with project selection and performance. Journal of Product Innovation Management 18, 357-373.
Datamonitor (2010). Household Products in Brazil to 2013 [Online]. http://www.marketresearch.com/Datamonitor-v72/Household-Products-Brazil-2616249: MarketResearch.com. [Accessed 28/03/2013].
Desai, K.K., and Keller, K.L. (2002). The effects of ingredient branding strategies on host brand extendibility. Journal of Marketing 66, 73-93.
Desai, K.K., and Ratneshwar, S. (2003). Consumer Perceptions of Product Variants Positioned on Atypical Attributes. Journal of the Academy of Marketing Science 31, 22-35.
Dhar, S.K., Hoch, S.J., and Kumar, N. (2001). Effective category management depends on the role of the category. Journal of Retailing 77, 165-184.
Euromonitor (2012). Laundry Care in Brazil [Online]. http://www.marketresearch.com/Euromonitor-International-v746/Laundry-Care-Brazil-7111217/: MarketReserch.com. [Accessed 28/03/2013].
64
Hall, J. (2013). 6 Key Learnings from the 2012 Most Memorable New Product Launch Survey [Online]. http://mmnpl.wordpress.com/. [Accessed 22/03/2013].
Inman, J.J., McAlister, L., and Hoyer, W.D. (1990). Promotion Signal: Proxy for a Price Cut? Journal of Consumer Research 17, 74-81.
Johnson, E.J., and Payne, J.W. (1985). Effort and accuracy in choice. Management Science 31, 395-414.
kalamas, M., Cleveland, M., and Laroche, M. (2006). The critical role of congruency in prototypical brand extensions. Journal of Strategic Marketing 14, 193-210.
Kevin Lane Keller (2003). Brand Synthesis: The Multidimensionality of Brand Knowledge. Journal of Consumer Research 29, 595-600.
Kim, B.D., and Sullivan, M.W. (1998). The effect of parent brand experience on line extension trial and repeat purchase. Marketing Letters 9, 181-193.
Kim, C.K., Lavack, A.M., and Smith, M. (2001). Consumer evaluation of vertical brand extensions and core brands. Journal of Business Research 52, 211-222.
Lambrecht, I. (2012). Mercado de sabão em pó [Online]. http://www.ebah.com.br/content/ABAAAABbAAK/mercado-sabao-po#. [Accessed 29/03/2013].
Lee, M., Lee, J., and Kamakura, W.A. (1996). "Consumer evaluations of line extensions: A conjoint approach," in Advances in Consumer Research, Vol 23: Research Frame Synergies, eds. K.P. Corfman & J.G. Lynch.), 289-295.
Linton, I. (2012). What Is the Failure Rate of New Items Launched in the Grocery Industry? [Online]. http://smallbusiness.chron.com/failure-rate-new-items-launched-grocery-industry-13112.html. [Accessed 23/02/2013].
Loken, B., and Roedder John, D. (1993). Diluting Brand Beliefs: When Do Brand Extensions Have a Negative Impact? Journal of Marketing 57, 71-84.
Maganhotto, A. (2012). "Customer Conference Novozymes São Paulo". (São Paulo). Mandler, G.P. (1982). "The Structure of Value: Accounting for Taste", in: Affect and Cognition: The
17th Annual Carnegie Symposium on Cognition. (ed.) H. Margaret S. Clark and Susan T. Fiske, Nj: Erlbaum, 3-36.).
Meyers-Levy, J., and Tybout, A.M. (1989). Schema Congruity as a Basis for Product Evaluation. Journal of Consumer Research 16, 39-54.
Mintel (2013). The Global New Products Database [Online]. http://www.gnpd.com/sinatra/gnpd/frontpage/&s_item=home. [Accessed 06/04/2013].
Nca Consultoria (2000). A Marca OMO [Online]. http://www.ncaconsultoria.com.br/Artigos/pdf/A%20Marca%20OMO.pdf. [Accessed 28/03/2013].
Neff, J. (2012). Tide Pods Winning $7 Billion Detergent Wars By Redefing Value [Online]. http://adage.com/article/news/tide-pods-winning-7-billion-detergent-wars-redefining/238779/. [Accessed 22/03/2013].
Ozanne, J.L., Brucks, M., and Grewal, D. (1992). A Study of Information Search Behavior During the Categorization of New Products. Journal of Consumer Research 18, 452-463.
Quelch, J.A., and Kenny, D. (1994). Extend profits not product lines. Harvard Business Review 72, 153-160.
Redação (2012). Omo é marca mais forte do Brasil em 2012 [Online]. http://www.istoedinheiro.com.br/noticias/82578_OMO+E+MARCA+MAIS+FORTE+DO+BRASIL+EM+2012: Istoé Dinheiro. [Accessed 30/03/2013].
Reddy, S.K., Holak, S.L., and Bhat, S. (1994). To Extend or Not to Extend: Success Determinants of Line Extensions. Journal of Marketing Research 31, 243-262.
Rettie, R., and Brewer, C. (2000). The verbal and visual components of package design. Journal of Product & Brand Management 9, 56-70.
65
Rosch, E. (1975). Cognitive Representations of Semantic Categories. Journal of Experimental Psychology: General 104, 192-233.
Ryan, T. (2010). Most Memorable New Product Launch of 2010 [Online]. http://mmnpl.files.wordpress.com/2008/11/mmnpl-pr-20103.pdf. [Accessed 22/03/2013].
Scheibehenne, B., Greifeneder, R., and Todd, P.M. (2010). Can there ever be too many options? A meta-analytic review of choice overload. Journal of Consumer Research 37, 409-425.
Scheibehenne, B., and Todd, P.M. (2009). Introduction to the special issue on assortment structure and choice. Psychology and Marketing 26, 195-196.
Schneider, J., and Hall, J. (2011). "Why Most Product Launches Fail", in: Harvard Business Review.). Shaw, J.I., Bergen, J.E., Brown, C.A., and Gallagher, M.E. (2000). Centrality preferences in choices
among similar options. Journal of General Psychology 127, 157-164. Simonson, I. (1999). The effect of product assortment on buyer preferences. Journal of Retailing 75,
347-370. Sinapuelas, I.C., and Sisodiya, S.R. (2010). Do line extensions influence parent brand equity? An
investigation of supermarket packaged goods. Journal of Product & Brand Management 19, 18-26.
Smith, D.C., and Park, C.W. (1992). The Effects of Brand Extensions on Market Share and Advertising Efficiency. Journal of Marketing Research 29, 296-313.
Sorescu, A.B., and Spanjol, J. (2008). Innovation's effect on firm value and risk: Insights from consumer packaged goods. Journal of Marketing 72, 114-132.
Stayman, D.M., Alden, D.L., and Smith, K.H. (1992). Some Effects of Schematic Processing on Consumer Expectations and Disconfirmation Judgments. Journal of Consumer Research 19, 240-255.
Sujan, M., Bettman, J.R., and Sujan, H. (1986). Effects of Consumer Expectations on Information Processing in Selling Encounters. Journal of Marketing Research 23, 346-353.
Suri, R., Cai, J.Z., Monroe, K.B., and Thakor, M.V. (2012). Retailers' Merchandise Organization and Price Perceptions. Journal of Retailing 88, 168-179.
Tauber, E.M. (1981). Brand Franchise Extensions: New Products Benefit from Existing Brand Names. Business Horizons 24, 36-41.
Tauber, E.M. (1988). Brand Leverage - Strategy for growth in a cost-control world. Journal of Advertising Research 28, 26-30.
Taylor, S.A., Hunter, G.L., and Lindberg, D.L. (2007). Understanding (customer-based) brand equity in financial services. Journal of Services Marketing 21, 241 - 252.
Valenzuela, A., Dhar, R., and Zettelmeyer, F. (2009). Contingent response to self-customization procedures: Implications for decision satisfaction and choice. Journal of Marketing Research 46, 754-763.
Valenzuela, A., and Raghubir, P. (2009). Position-based beliefs: The center-stage effect. Journal of Consumer Psychology 19, 185-196.
Valenzuela, A., Raghubir, P., and Mitakakis, C. (2012). Shelf space schemas: Myth or reality? Journal of Business Research.
Van Herpen, E., and Pieters, R. (2002). The variety of an assortment: An extension to the attribute-based approach. Marketing Science 21, 331-341.
Wright, P. (2002). Marketplace Metacognition and Social Intelligence. Journal of Consumer Research 28, 677-682.