Embed Size (px)
Citation preview

Health Insurance Authority A review of Private Health Insurance in Ireland, 2017

Background and Methodology
2
• A nationally represented sample of 1,891 interviews were conducted face-to-face in September and October 2017, mirroring the timing of research previously undertaken. In order to ensure a representative sample of the Adult population in the Republic of Ireland (aged 18+), quotas were set around gender, social class and region. Data for the years preceding 2009 have been taken from published reports as previous research was not conducted by Kantar Millward Brown.
• When reading figures presented in the report it is important to note that the margin of error for a sample of 1,891 is +/- 2.3%. For a sub
sample such as the number of respondents with PHI insurance (819 of the sample) the Margin of Error is +/-3.4%, and the MoE for those without PHI (1,072) is 3.0%.
• Specific questions were asked of policy and non policy holders with a group of questions towards the end of the survey being asked of the entire population. Topics included; - Incidence of Health Insurance - Reasons for not having Health Insurance and the possibility of taking out Private Health Insurance in the future - Awareness and attitudes towards the Lifetime Community Rating Initiative. - The number of adults and children on the policy, duration of being insured - Questions around switching (- incidence and consideration) - Perceptions of cost - Past actions and future intentions, Incidence of “dropping” cover for other family members and reasons why - Claim experience, Complaint experience - Attitudes towards PHI, Awareness of the Health Insurance Authority (HIA)

Executive Summary
3

Executive Summary
4
Update of PHI, and Profile among PHI holders
The proportion of those who have Private Health Insurance has increased again this year. 43% of the population now claim to be covered by PHI; an increase of two percentage points, broadly reflecting more buoyant economic circumstances.
Those with PHI are more likely to be from the more affluent white collar workers/professional cohort (ABC1s), whilst those from more manual professions or reliant on state benefits are significantly less likely to have cover.
Uptake of PHI under-indexes among younger adults (under the age of 35). Whilst they account for nearly 30% of the adult population, only 21% have cover.
Nearly four in ten (39%) of those with health insurance have dependent children, whilst nearly seven in ten policy holders are married– this may be more related to their age as opposed to other reasons.
VHI remains the largest provider of health insurance, and accounts for over half of all policies.
Laya has increased its share of the market significantly, and now has 27% of the market. It should be noted that the number of companies in the Health Insurance arena has decreased since 2015.
The profile of each of the main companies’ customer base remains different. VHI’s customer base tends to grow with age, but is balanced in terms of gender and Social Class.
Laya attracts the younger cohort (18-34 year olds), while Irish Life attracts those in the middle age groups (35-54 year olds).

Executive Summary
5
Attitudes towards PHI
At an overall level, there continues to be a strong belief that PHI allows people to skip queues (59%) and ensures they receive a better level of service (57%). It is also deemed a necessity, not a luxury by nearly six in ten (58%).
Among those with PHI, the main reasons given for having such insurance are that the cost of medical treatment/accommodation is high (mentioned by 40% in total, a significant rise from 31% in 2015), the standard of public services are inadequate (mentioned by 30%) and the perceived lack of access to public services (24%, also up significantly from 18% in 2015).
Among those without PHI, price considerations are paramount (64% of those who never had PHI cited this, with 63% among those who have relinquished it). Even among those without Private Health Insurance, there is a strong recognition (43%) that PHI is a necessity and not a luxury, suggesting that if they could afford it, they would purchase it.
Switching Behaviour
There is evidence that the incidence of switching providers may have plateaued. Less than one in four (22%) have ever switched; quite similar to 2015 results (24%). In addition, there are few “serial switchers” within this domain. Of those who have ever switched, a sizeable majority (63%) have only done so once.
Among those who have never switched, just ten percent have even considered switching. This has fallen from a high point of 20% in 2013. This is also against a backdrop of a growing perception that the switching process is becoming easier (61% believe the process is “fairly”/“very” easy).
Reflecting this, the average length of time for having a PHI policy remains relatively consistent at 18 years, and the average length of time with their current provider is 15 years.
VHI tends to “leak” customers more, which is unsurprising given its legacy within the marketplace.

Executive Summary
6
Switching Behaviour cont’d
It is important to note that the dynamic behind propensity to switch is changing. Among those who have switched, cost considerations (whilst still important) are not cited to the same degree. 54% of switchers mentioned price as a factor in 2017, a significant drop from 65% in 2015. This change in motivations for switching may be down to improving economic conditions, or arguably that the price of policies on offer are converging.
In tandem with this, cover and service considerations are becoming more important. Also, those with PHI are now more likely to examine benefit gains (33%) if they were to consider switching, vs 32% examining financial gains – the first time this has happened.
Attitudes towards the Cost of Current PHI Policies
The perceived annual cost of a policy has actually decreased slightly compared to 2015. The average price paid now stands at €1,858, down from €1,925. The price paid for health insurance increases with age, suggesting that as people become older, the invest more into their healthcare.
Interestingly, the proportion of those who have downgraded their plan over the past two years has decreased; 11% have downgraded compared to 20% in 2013. Similarly, ten percent have upgraded their plan, vs just five percent in 2013.
Looking to the future, a modest six percent plan to upgrade their policies, although this has increased significantly from just two percent in 2013. The proportion planning to downgrade is just four percent; down from nine percent in 2013.

Executive Summary
7
Satisfaction with Health Insurance companies
Satisfaction with the level and clarity of information given by insurance companies has increased significantly (88% net satisfied compared to 85% previously). It would seem that the drive for greater transparency is paying dividends.
Overall satisfaction with insurance companies has also continued to improve. Specific elements of PHI where policy holders are happiest concern the quality of information/advice received, customer service and the range of products offered.
Satisfaction on all metrics has consistently trended upwards since 2013.
Claims experience
43% have made a claim for an overnight hospital stay at some point, a significant uplift of eight points from 2015. Claims for Day Patient treatment follow suit, with an increase of five points since 2015.
There has been a small rise in the proportion stating to have claimed on their PHI – Overall, 60% have made a claim for something, up slightly from 57% in 2015.
Awareness
One in four spontaneously nominated the HIA as a source of advice if they had a problem with their health insurance provider, up seven points since 2015.
42% of all those surveyed and 57% of those with health insurance said that they were aware of the roles/functions of the Health Insurance Authority. This is a sizeable increase from 36% of the overall population and 47% of policy holders stating the same in 2015.

Sample Profile
8

13
16
21
17
16
17
Demographic Sample Profile: The sample reflects the known population profile of adults aged 18+ in the Republic of Ireland, and is based on the latest CSO data.
Male
Female
18-25
26-34
35-44
45-54
65+
ABC1
C2DE
F
Dublin
Rest of Leinster
Munster
Conn/Ulster
Gender %
Age %
Social Class %
Region %
49
51
41
53
6
29
26
27
18
Base: All Adults Aged 18+, n= 1,891
55-64

Demographic Sample Profile (Cont’d): Family, Marital and working status.
Base: All Adults Aged 18+, n= 1,891
Yes
No
Married Working
Non-Working (homemaker/
Retired/ Student/
Unemployed)
Dependent Children %
Marital Status %
Working Status %
37
63
55
8
26
11
51
49
Living as married
Single
Widowed/ Divorced/
Separated

Some context before we start
11

State of Health: Half the population rate themselves as generally healthy, with few dealings with the Health service. One in four have more intensive interactions with Health Professionals, either via GPs or the Hospital system.
12
51 52 50
24 25 24
14 12 15
11 12 10
Q.58 On this card are a number of ways people have described their health. Which one of these statements would best apply to you personally
Some health problems that sometimes require visits to the hospital
Some health problems and therefore regularly make visits to the doctor
Generally healthy but sometimes make visits to the doctor
Generally healthy and rarely make visits to the doctor
Base: All Adults Aged 18+, n= 1,891
Total Policy Holders (n=819)
%
Total Non-Policy
Holders (n=1,072)
%
All Adults (n=1,891)
%

Slightly/Strongly Agree 2017 Mean score (out of five)
2017 %
2015 %
2013 %
2011 %
2009 %
3.56 59 58 65 62 69
3.52 58 56 56 59 67
3.55 57 56 55 62 69
3.06 44 44 46 43 39
2.96 39 36 34 38 44
3.15 39 34 39 44 46
3.14 36 37 36 43 43
2.72 30 25 22 31 33
2.32 22 23 19 20 26
2.2 18 18 15 15 22
Statements about Health Insurance: there continues to be a strong belief that PHI allows people to skip queues and ensures they receive a better level of service. It is also deemed a necessity, not a luxury by nearly six in ten.
13 Q.54 I am now going to read out a number of statements people have made about health insurance, and I would like you to say to what extent you agree or disagree with each statement…
7
8
7
17
23
11
8
23
35
40
13
15
14
21
15
14
16
21
24
24
21
20
22
18
22
36
39
27
18
18
36
32
32
27
22
27
26
22
16
13
23
26
25
17
18
12
11
8
6
5
Health insurance is a necessity not a luxury
Having health insurance means always getting better level of health care service
Having health insurance means you can skip the queues
There is adequate information to enable me to compare plans on offer from different private health insurers
Consumers are adequately protected in the health insurance market in Ireland
I will always have health insurance
Health insurance is only for the wealthy
Health insurance is good value for money
There is no need for health insurance in Ireland, public services are adequate
Only old people and sick people need health insurance
Disagree Slightly
(2) %
Disagree Strongly
(1) %
Neither (3) %
Agree Slightly
(4) %
Agree Strongly
(5) %
Base: All Adults Aged 18+, n= 1,891
Significant Difference vs 2015

Incidence of Health Insurance
14

Incidence of Health Insurance: the incidence of having PHI cover has increased by two percentage points in 2017 vs 2015, reflecting a more buoyant, if arguably cautious economy. It is still significantly below PHI uptake during the Boom.
15 Q.1 Are you currently covered by Health Insurance? *Prior to 2017 was referred to as “Private Health Insurance”.
43% 57%
Yes No
Incidence of Having PHI Policies
In Previous Years %
2015 41 2013 40 2011 43 2009 48 2007 49 2005 52 2002 47
Base: All Adults Aged 18+, n= 1,891

Profile of people with Health Insurance: those with PHI are more likely to be white collar workers (ABC1s), be aged 35+ and living in Munster.
16
Male (49)
Female (52)
18-25 (13)
26-34 (16)
35-44 (21)
45-54 (17)
65+ (17)
ABC1 (41)
C2DE (53)
F (6)
Dublin (29)
Rest of Leinster (26)
Munster (27)
Conn/ Ulster (18)
Gender Age Social Class Region
52 50 50 51 49
48 50 50 49 51
9 5 7 9 9
12 16 17 17 21
23 21 20 20 21
19 19 20 18 20
18 18 16 16 16
19 21 21 21 15
61 62 58 59 59
31 31 33 32 32
8 7 9 8 8
28 29 36 36
27
24 25 19 21
26
33 31 30 27 32
16 15 15 15 15
55-64 (16)
43% All with PHI
‘17 %
‘15 %
’13 %
‘11 %
‘09 %
‘17 %
‘15 %
’13 %
‘11 %
‘09 %
‘17 %
‘15 %
’13 %
‘11 %
‘09 %
‘17 %
‘15 %
’13 %
‘11 %
‘09 %
Base: All with Health Insurance, n= 819
() = National Profile

Profile of people with Health Insurance: those with dependent children are marginally more likely to have PHI.
17
Yes (37)
No (63)
Married (55) Working (51)
Homemaker
Retired
Student
Adults with Dependent Children Marital Status Working Status
39 39 30 29 35
61 61 70 71 65
68 70 69 67 61
5 3 4 4 6
18 20 22 23 23
9 6 5 6 10
59 62 68 64 61
14 10 4 10 12
18 20 21 15 16
7 4 5 8 6 2 3 2 3 5
Living as married (8)
Single (26)
Widowed/ Divorced/
Separated (11) Unemployed
‘17 %
‘15 %
’13 %
‘11 %
‘09 %
‘17 %
‘15 %
’13 %
‘11 %
‘09 %
‘17 %
‘15 %
’13 %
‘11 %
‘09 %
Base: All with Health Insurance, n= 819
() = National Profile

Demographic Sample Profile – Those who used to have PHI, but have relinquished it: Those aged 55+ are most likely to have dropped their PHI, as have C2DEs and Munster residents.
18
Gender %
Age %
Social Class %
Region %
46
54
3
15
19
16
23
25
30
68
2
25
26
37
13
Q.4 Have you ever been covered by Health Insurance?
14% All with PHI
Male (45)
Female (56)
18-25 (5)
26-34 (23)
35-44 (26)
45-54 (18)
65+ (15)
ABC1 (45)
C2DE (51)
F (4)
Dublin (28)
Rest of Leinster
(26)
Munster (28)
Conn/ Ulster
(18)
55-64 (13)
Base: All who used to have Health Insurance, n= 149
() = 2015 results

Demographic Sample Profile Cont’d (Those who used to have PHI, but have relinquished it).
Adults with Dependent Children %
Marital Status %
Working Status %
34
66
65
8
15
13
Q.4 Have you ever been covered by Health Insurance?
Yes (42)
No (58)
Married (52)
Living as married
(10)
Single (28)
Widowed/ Divorced/
Separated (9)
40
18
25
2 15
Working (59)
Homemaker (12)
Retired (15)
Student (5)
Unemployed (8)
Base: All who used to have Health Insurance, n= 149
() = 2015 results
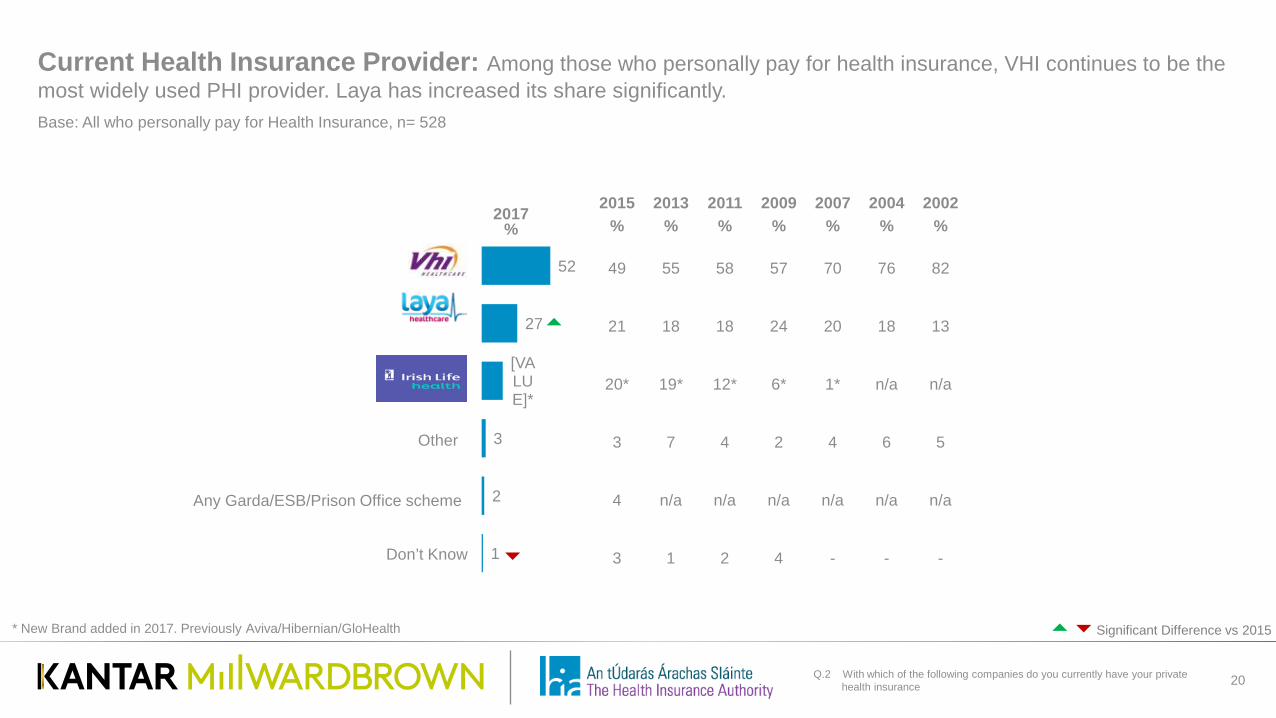
Current Health Insurance Provider: Among those who personally pay for health insurance, VHI continues to be the most widely used PHI provider. Laya has increased its share significantly.
20 Q.2 With which of the following companies do you currently have your private health insurance
2017 %
52
27
[VALUE]*
3
2
1
Other
Don’t Know
2015 %
2013 %
2011 %
2009 %
2007 %
2004 %
2002 %
49 55 58 57 70 76 82
21 18 18 24 20 18 13
20* 19* 12* 6* 1* n/a n/a
3 7 4 2 4 6 5
4 n/a n/a n/a n/a n/a n/a
3 1 2 4 - - -
Any Garda/ESB/Prison Office scheme
* New Brand added in 2017. Previously Aviva/Hibernian/GloHealth
Base: All who personally pay for Health Insurance, n= 528
Significant Difference vs 2015

Current Health Insurance Provider by Age Group: Among those who personally pay for health insurance, VHI’s customer base tends to grow with age, but is balanced in terms of gender and Social Class. Laya attracts the younger cohort, while Irish Life attracts those in the middle age groups.
21
26% Paying
Policy Holders
Q.2 With which of the following companies do you currently have your private health insurance
2017 %
52
27
16
3
2
1
Other
Don’t know
Any Garda/ESB/ Prison Office scheme*
Gender Age Group Social Class Dependent Children
Male (332)
%
Female (196)
%
18-34 (66) %
35-54 (247)
%
55+ (215)
%
ABC1 (294)
%
C2DE (202)
%
Yes (205)
%
No (323)
%
51 53 40 46 60 53 50 42 57
28 25 33 27 24 28 23 35 22
15 18 18 21 11 16 17 16 16
2 1 1 1 2 1 3 2 2
4 3 7 4 2 2 6 5 3
1 * - 1 * 1 * 0 1
Base: All who personally pay for Health Insurance, n= 528

Current Health Insurance Provider by Demographics: An Overview of main providers among those who personally pay for health insurance.
22 Q.2 With which of the following companies do you currently have your private health insurance
Total 27 52 16
GENDER Male 28 51 15
Female 25 53 18
AGE
18-34 33 40 18
35-44 28 44 26
45-54 26 50 20
55-64 31 48 15
65+ 19 69 8
SOCIAL CLASS ABC1 28 53 16
C2DE 23 50 17 Dependent
children U.18 years
Yes 35 42 16
No 22 57 16
Base: All who personally pay for Health Insurance, n= 528

Length of time being covered by Health Insurance: Among those with health insurance, the average number of years for holding PHI policies is 18 years. Policy holders are generally loyal to their current providers, suggesting little appetite for switching.
23 Q.18 For how many years have you held health insurance either
through your policy or the policy of a partner/spouse? Q.19 How long have you been with your current insurer as the policy holder or
partner/spouse of the policy holder?
31 37 38 36 24
13 14 14 12
15
11 11 12
9 10
27 22 24
24 29
18 17 13 19 18
Average 16yrs
21+ years
16-20 years
5-10 years
0-4 years
11-15 years
2009 %
2011 %
18yrs
23 25 29 26 17
17 18 19
19
16
28 24 25
24
28
32 34 26 31
23
0 1 1 0
16
Average 13yrs
21+ years
5-10 years
0-4 years
11-20 years
14yrs
2013 %
19yrs 16yrs
NUMBER OF YEARS HEALTH INSURANCE IS HELD
NUMBER OF YEARS WITH CURRENT HEALTH INSURANCE PROVIDER
2015 %
19yrs 14yrs
2009 %
2011 %
2013 %
2015 %
Don’t know
18yrs
2017 %
15yrs
2017 %
Base: All with Health Insurance, n=819

Frequency of Health Insurance Payments: Similar to recent years, one in four pay their premiums annually, but the preferred method for most is to pay on a monthly basis.
24 Q.3 Do you pay for your health insurance.....?
25 25 24 32 32
8 7 7 5 7
64 63 62 53 52
3 5 - 3
8 -
8 7 1 Don’t know
2009 %
2011 %
2013 %
2015 %
Annually
Quarterly
Monthly
Other
2017 %
Base: All who personally pay for Health Insurance, n= 528
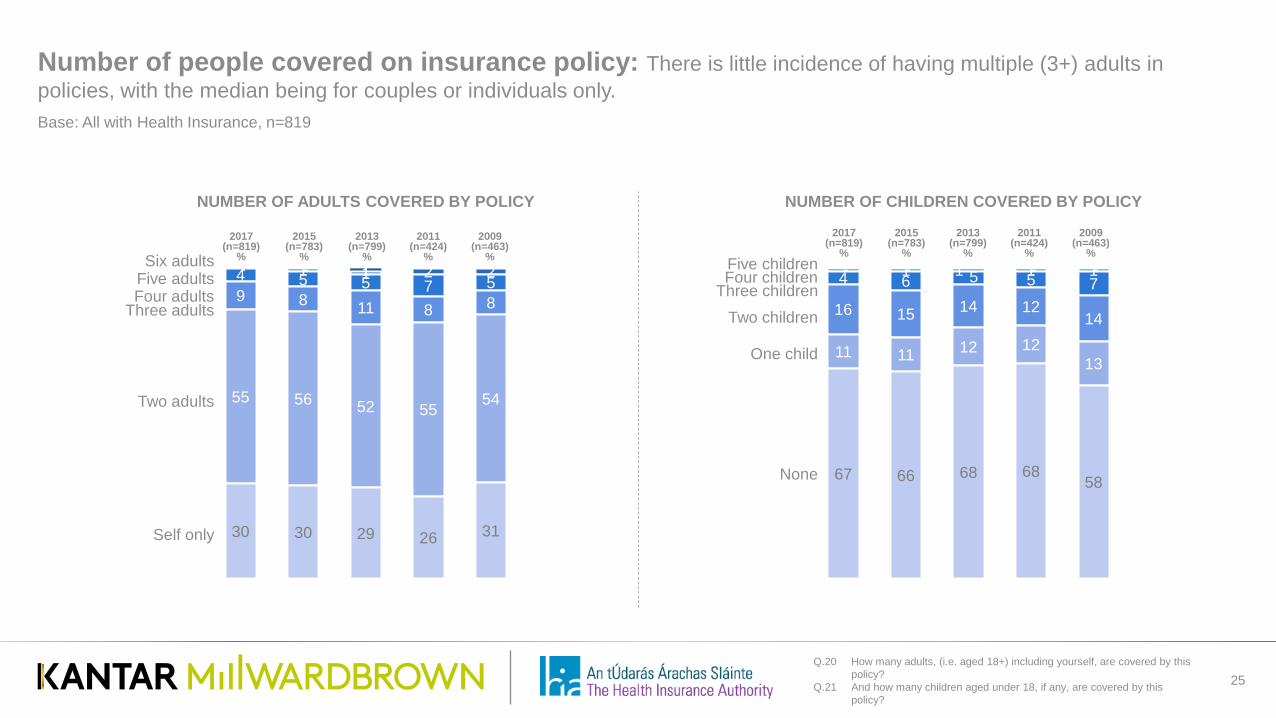
Number of people covered on insurance policy: There is little incidence of having multiple (3+) adults in policies, with the median being for couples or individuals only.
25
2009 (n=463)
% - - 1 - 1 1 2 2 4 5 5 7 5 9 8 11 8 8
55 56 52 55 54
30 30 29 26 31
2011 (n=424)
%
2013 (n=799)
% - - * - - 1 1 1 1 4 6 5 5 7 16 15 14 12
14
11 11 12 12 13
67 66 68 68 58
Five adults Four adults
Self only
Two adults
Three adults
Six adults Four children
Three children
One child
Two children
None
Five children
NUMBER OF ADULTS COVERED BY POLICY NUMBER OF CHILDREN COVERED BY POLICY
2015 (n=783)
%
2009 (n=463)
%
2011 (n=424)
%
2013 (n=799)
%
2015 (n=783)
%
Q.20 How many adults, (i.e. aged 18+) including yourself, are covered by this policy?
Q.21 And how many children aged under 18, if any, are covered by this policy?
2017 (n=819)
%
2017 (n=819)
%
Base: All with Health Insurance, n=819

Drivers and Satisfaction Levels Among those with Health Insurance
26

Key Driver for having Health Insurance: The cost of medical treatments/accommodation continues to be the primary reason for having PHI, and has increased significantly this year. Perceived shortfalls in the standard of, and access to, public services are also key drivers.
27
Main Reason
%
Main reason 2015
%
Main reason 2013
%
Main reason 2011
%
Main reason 2009
%
Main reason 2007
%
20 18 17 22 31 16 18 19 20 14 5 6 8 7 10 8 12 8 5 2 5 6 5 2 4
n/a n/a n/a n/a n/a 15 13 16 11 10 6 3 2 5 4 6 6 7 8 4 4 7 8 7 6 2 n/a n/a n/a n/a 4 n/a n/a n/a n/a 1 n/a n/a n/a n/a 2 2 1 1 0 8 9 6 7 14
26 15
9 7 7
3 11
7 3 3 1 1 1 - 1
* New code added in 2017
Cost of medical treatment/accommodation is very high Inadequate standard of public services
Lack of access to public services I can afford it
My spouse/partner recommended it I am getting older *
Offered with employment (fully/partially paid for by employer) My parents included me on their policy
Have (or plan to have) children Offered with employment (paid for by employee)
I had a health scare Friend recommended it
I became pregnant I took it out because of the Lifetime Community Rating (LCR)
Don’t know
Q.16 For what reason(s) do you have health insurance? Q.17 What is the main reasons why you have health insurance?
Base: All with Health Insurance, n=819
Significant Difference vs 2015

Other Key Drivers for having Health Insurance: Aside from cost/standards of the public service and policies being paid for, other reasons cited are ability to pay for it, getting older and medical reasons (health scare, pregnancy).
28 Q.16 For what reason(s) do you have health insurance? Q.17 What is the main reasons why you have health insurance?
Any reason 2015
%
Any reason 2013
%
Any reason 2011
%
Any reason 2009
%
Any reason 2007
%
31 32 24 45 52
27 29 24 42 38
18 19 13 26 15
12 13 13 20 18
12 10 8 11 11
n/a n/a n/a n/a n/a
17 17 17 15 17
5 8 8 9 14
8 12 9 17 18
7 7 5 5 8
8 n/a n/a n/a n/a
1 3 5 5 4
1 n/a n/a n/a n/a
1 n/a n/a n/a n/a
10 n/a n/a n/a n/a * New code added in 2017
Cost of medical treatment/accommodation is very high
Inadequate standard of public services
Lack of access to public services
I can afford it
My spouse/partner recommended it
I am getting older *
Offered with employment (fully/partially paid for by employer)
My parents included me on their policy
Have (or plan to have) children
Offered with employment (paid for by employee)
I had a health scare
Friend recommended it
I became pregnant
I took it out because of the Lifetime Community Rating (LCR)
Don’t know
26
15
9
7
7
3
11
7
3
3
1
1
-
1
40
30
24
16
14
14
13
8
7
6
7
5
2
1
1
Main Reason
%
Any Reason
%
Base: All with Health Insurance, n=819
Significant Difference vs 2015

Reasons for having Health Insurance by Age: Life stage is critical in determining reasons for having PHI.
29
Any Reason
% 40
30 24
16 14 14 13
8 7 6 7 5
2 1 1
* New code added in 2017
18-34
% 35-54
% 55+ %
22 41 47
16 27 40
15 23 30
9 17 18
5 19 14
1 10 25
12 17 8
35 1 2
10 11 2
7 7 5
1 5 11
3 6 4
3 3 *
1 1 2
1 1 1
Cost of medical treatment/accommodation is very high Inadequate standard of public services
Lack of access to public services I can afford it
My spouse/partner recommended it I am getting older *
Offered with employment (fully/partially paid by employer) My parents included me on their policy
Have (or plan to have) children Offered with employment (paid for by employee)
I had a health scare Friend recommended it
I became pregnant I took it out because of the Lifetime Community Rating (LCR)
Don’t know
Q.16 For what reason(s) do you have health insurance? Q.17 What is the main reasons why you have health insurance?
Base: All with Health Insurance, n=819
2011 %
2013 %
2015 %
24 32 31
24 29 27
13 19 18
13 13 12
8 10 12
n/a n/a n/a
17 17 17
8 8 5
9 12 8
6 7 7
n/a n/a 8
5 3 1
n/a n/a 1
n/a n/a *
n/a 10 7
Any Reason
%

Overall Satisfaction with level of understanding of current health insurance cover: For the third study in a row, satisfaction with how cover is communicated to holders has increased; nearly nine in ten are happy.
30 Q.29 Thinking about your level of understanding of your health insurance
cover, overall how satisfied or dissatisfied are you with your level of understanding of your health insurance cover?
(Note: Wording of scales changed slightly in 2009 and therefore may not be directly comparable Previous scale used – Very Satisfied, Satisfied, Neither, Dissatisfied, Very Dissatisfied)
33 31 25
35 47
40
55 54
51
51 34 45
8 9
13 5
7 8
2 2 7 4 7 4
1 2 2 2 3 1 1 2 2
2 2 2
2007 %
Very satisfied
Fairly satisfied
Neither
Don’t know
Fairly dissatisfied Very dissatisfied
85% 86% 81% 76%
2009 %
2013 %
2011 %
2015 %
2017 %
89%
Base: All with Health Insurance, n=819
Significant Difference vs 2015

Level of satisfaction with aspects of health insurance: Reflecting this, elements of PHI where policy holders are happiest concern the quality of information/advice received, customer service and the range of products offered. Satisfaction on all metrics has consistently trended upwards since 2013.
31
Q.31 On scale of 1 to 10 where 1 means not at all satisfied and 10 means extremely satisfied, how satisfied or dissatisfied are you with the following?
Q.32 Taking everything into consideration, how satisfied or dissatisfied are you overall with your current health insurance provider?.
9
13
11
11
12
16
8
8
12
10
9
11
20
17
18
17
17
17
27
23
21
21
21
18
21
22
23
22
22
23
15
16
15
17
18
15
2017 mean Score
2015 mean score
2013 mean score
2011 mean score
Difference (2017 v 2015)
7.78 7.70 7.27 7.62 +0.08
7.77 7.31 7.11 7.57 +0.46
7.73 7.61 7.32 7.81 +0.12
7.77 7.70 7.38 7.72 +0.07
7.78 7.16 6.94 7.35 +0.62
7.54 7.47 6.96 7.26 +0.07
Not satisfied
1-5 %
Overall Satisfaction
Current range of products and services offered by PHI provider
The level of cover provided by PHI plan
The customer service you receive from your PHI provider
The quality of information & advice you receive from your PHI provider
The level of out patient/non hospital cover on your plan
6 %
7 %
8 %
9 %
Extremely satisfied
10 %
Base: All with Health Insurance, n=819

Level of satisfaction with aspects of health insurance by age: Older Policy holders tend to be marginally more satisfied, although they only rate the information received similarly to other cohorts; suggesting that simplifying communications could be improved.
32 Q.31 On scale of 1 to 10 where 1 means not at all satisfied and 10 means
extremely satisfied, how satisfied or dissatisfied are you with the following?
Current range of products and
services offered by PHI
provider %
The level of cover provided
by PHI plan %
The customer service you receive from
your PHI provider
%
The quality of information &
advice you receive from
your PHI provider
%
The level of out patient/non
hospital cover on your plan
% Total 7.77 7.73 7.77 7.78 7.54
AGE 18-34 7.69 7.70 7.67 7.71 7.51 35-54 7.68 7.64 7.70 7.77 7.42
55+ 7.90 7.85 7.89 7.82 7.69
Base: All with Health Insurance, n=819

Cost
33
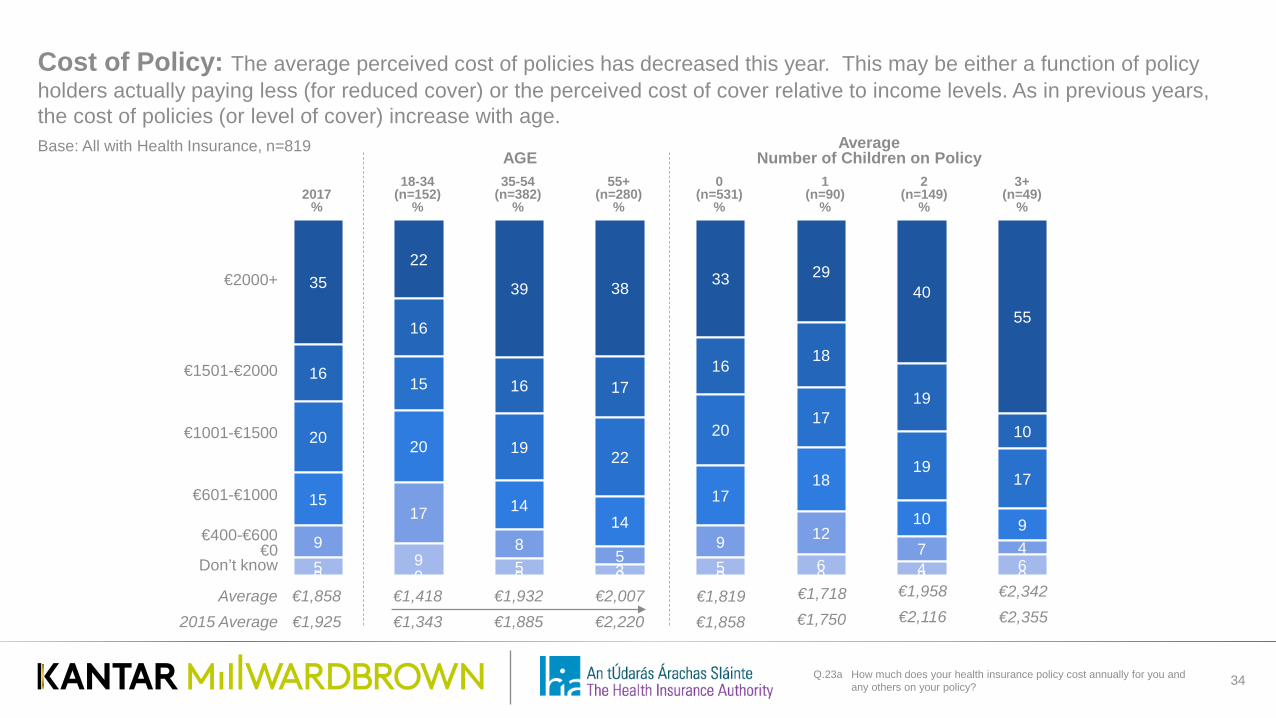
Cost of Policy: The average perceived cost of policies has decreased this year. This may be either a function of policy holders actually paying less (for reduced cover) or the perceived cost of cover relative to income levels. As in previous years, the cost of policies (or level of cover) increase with age.
34 Q.23a How much does your health insurance policy cost annually for you and any others on your policy?
35 22
39 38 33 29 40
55
16
16
16 17 16
18
19
10 20
15
19 22
20 17
19 17
15
20
14 14
17 18
10 9 9
17
8 5
9 12 7 4
5 9 5 3 5 6 4 6 0 0 0 0 0 0 0 0
€1001-€1500
€400-€600
€1501-€2000
€2000+
Don’t know
Average €1,858 €1,418 €1,932 €2,007
€601-€1000
€1,819 €1,718 €1,958 €2,342
€0
2015 Average €1,925 €1,343 €1,885 €2,220 €1,858 €1,750 €2,116 €2,355
2017 %
18-34 (n=152)
%
AGE 35-54
(n=382) %
55+ (n=280)
%
Average Number of Children on Policy
0 (n=531)
%
1 (n=90)
%
2 (n=149)
%
3+ (n=49)
%
Base: All with Health Insurance, n=819
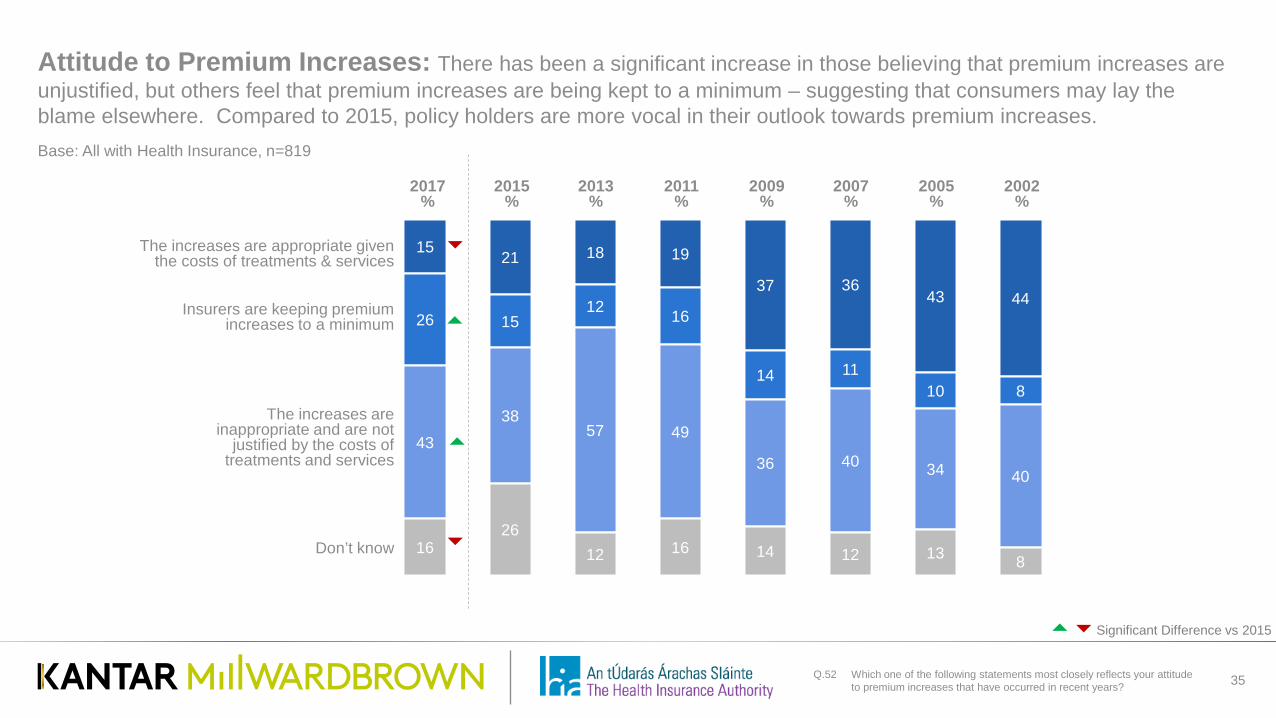
Attitude to Premium Increases: There has been a significant increase in those believing that premium increases are unjustified, but others feel that premium increases are being kept to a minimum – suggesting that consumers may lay the blame elsewhere. Compared to 2015, policy holders are more vocal in their outlook towards premium increases.
35 Q.52 Which one of the following statements most closely reflects your attitude to premium increases that have occurred in recent years?
15 21 18 19
37 36 43 44
26 15 12 16
14 11 10 8
43
38 57 49
36 40 34 40
16 26
12 16 14 12 13 8 Don’t know
2009 %
2007 %
2011 %
2002 %
2005 %
The increases are inappropriate and are not
justified by the costs of treatments and services
Insurers are keeping premium increases to a minimum
The increases are appropriate given the costs of treatments & services
2013 %
2015 %
2017 %
Base: All with Health Insurance, n=819
Significant Difference vs 2015

Switching and Discontinuation
36

Health Insurance: Past Action vs. Future Plans: Reflecting increased consumer confidence in the economy, policy holders are more likely to have upgraded their plans, and the proportion have downgraded has halved since 2013. in general however, most holders are quite reluctant to change, either in the past or looking to the future.
37
Q.22a In relation to your current health insurance plan over the past 2 years which one of the following have you done?
Q.22b And again in relation to your current health insurance plan within the next 12 months which one of the following are you likely to do?
10 8 5 6 5 2
11 15 20 4 5 9
70 70 69
78 80 78
- - - 1 - 3
9 7 6 11 10 8
2015 Previous*
2 years %
Upgrade(d) the level of plan
Downgrade(d) the level of plan
No change
Discontinue(d) health insurance
Don’t know
2015 Next
12 months %
2013 previous 2 years
%
2013 Next
12 months %
What have consumers done in the past two years?
What will consumers do in the next year?
2017 Previous*
2 years %
2017 Next
12 months %
Base: All with Health Insurance, n=819
Significant Difference vs 2015

Likely Action to health insurance policy over next 12 months: A review by age and policy type.
38
Upgrade %
Downgrade %
No change %
Discontinue %
Don’t Know %
Total 6 4 78 1 11
AGE
18-34 3 6 67 1 23
35-54 5 5 79 1 10
55+ 8 2 82 1 7
POLICY TYPE
Pay all themselves 5 3 79 1 11
Employer pays all - - - - -
Employer pays some 1 12 74 - 13
Q.22b And again in relation to your current health insurance plan within the next 12 months which one of the following are you likely to do?
Base: All with Health Insurance, n=819

Actions to health insurance policy over previous 2 years: A review by age and policy type.
39 Q.22a In relation to your current health insurance plan over the past 2 years which one of the following have you done?
Upgrade %
Downgrade %
No change %
Don’t Know %
Total 10 11 70 9
AGE
18-34 6 5 67 22
35-54 10 13 69 9
55+ 12 12 72 3
POLICY TYPE
Pay all themselves 10 10 71 8
Employer pays all - - - -
Employer pays some 5 17 65 13
Base: All with Health Insurance, n=819

Have people been removed from policies? Removing others from policies has decreased in 2017.
40 Q22c Have you removed anybody from your health insurance plan over
the past two years? Q22d Who have you removed from your health insurance plan over the
past two years?
3%
94%
2% Yes (7)
No (91)
Don’t know (2)
Have you removed anybody from your Health Insurance
over the past two years?
Who have you removed from your health insurance
over the past two years? Base: All who have removed somebody from policy (n=28*)
2017 2015 2013
Spouse/ Partner 24% 15% 7%
An Adult child (over 18 years)
58% 82% 68%
A child under the age of 18
6% 9% 16%
Someone else/refused 14% 0% 9%
*Caution – small base
Base: All with Health Insurance, n=819
Significant Difference vs 2015

Incidence of Ever Switching: Less than one in four have ever switched provider, similar to recent years. There is little desire for “serial switching” – nearly two thirds of those who have switched have only done so once. VHI tends to “leak” customers, which is unsurprising given its historical position in the marketplace.
41 Q.34 Have you ever switched from one health insurer in Ireland to another
health insurer in Ireland? Q.35 How many times have you switched private health insurers? Q.36 Which insurance provider did you switch from (most recently)?
22% 73%
5%
Yes No
Don’t know
Ever Switched Providers
Incidence of Switching
% 2015 24 2013 20 2011 23 2009 16 2007 10 2005 10 2002 6
Base: All Switchers, n=181
17
52 20
17 63
22
- 7 2
% %
Number of Times Switched & Insurer Most Recently Switched From
3+
2
1
Mean 1.61 Other Never
Base: All with Health Insurance, n=819

Reasons for Switching Health Insurance Provider: Cost savings have traditionally been the key driver for those who are switching (and this remains to be the case). However, the level of cover/products and services is becoming more important.
42 Q.37 Why did you decide to change insurers?
New insurer was cheaper /Cost savings
Level of cover was better
New insurer had a better product/service range
Dissatisfaction with service provision of previous insurer
Recommendation by friend
Group scheme switched
Level of information and advice better
Recommendation from family member
Had bad experience with previous insurer
Previous insurer announced they were withdrawing from the market
Changed employer
Recommendation from other
No choice/Not my decision
Wanted to switch to an Irish Company
Wanted to support competition
Employer no longer pays for all/some of the cost
54
33
24
11
9
8
8
5
3
3
2
2
2
1
1
1
2015 %
2013 %
2011 %
65 69 62
23 24 17
16 14 8
2 4 5
7 5 6
8 7 7
3 3 1
5 5 7
2 4 2
1 1 3
2 6 3
2 1 *
n/a n/a n/a
1 1 -
n/a 1 -
n/a - - * New code added in 2015
2017 %
Base: All who have switched Heath Insurance Provider, n=181
Significant Difference vs 2015
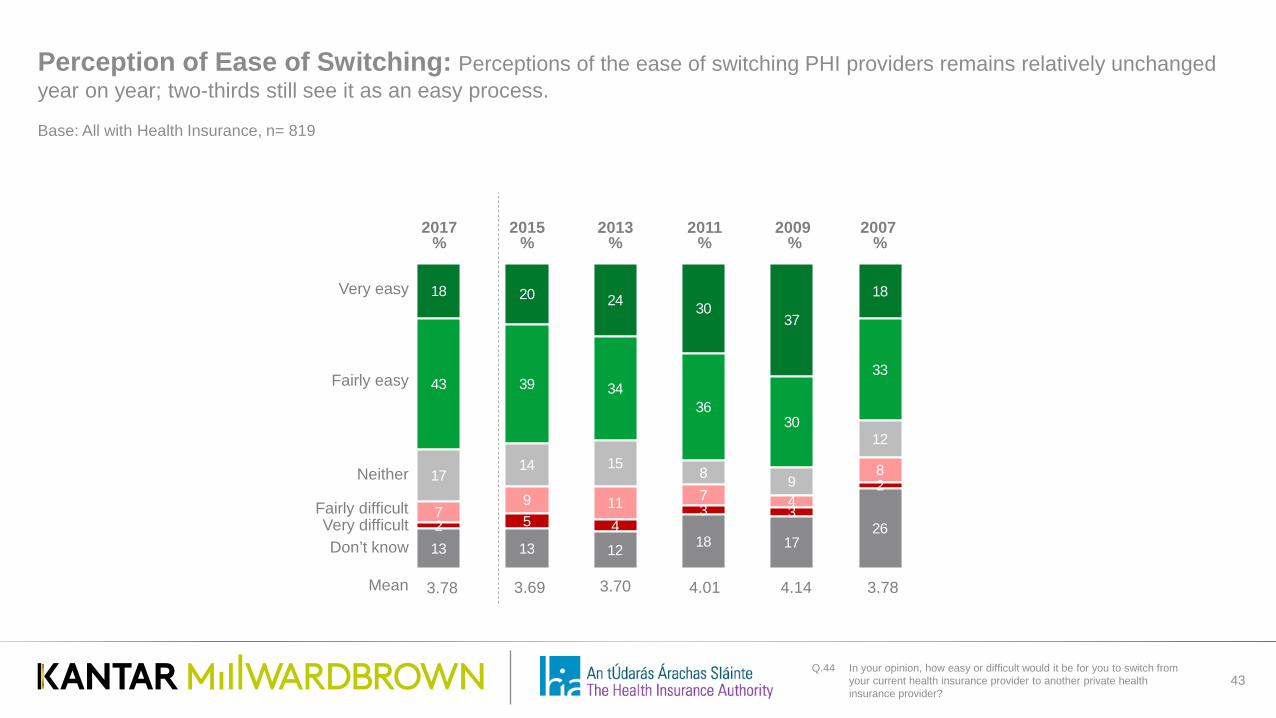
Perception of Ease of Switching: Perceptions of the ease of switching PHI providers remains relatively unchanged year on year; two-thirds still see it as an easy process.
43 Q.44 In your opinion, how easy or difficult would it be for you to switch from
your current health insurance provider to another private health insurance provider?
18 20 24 30 37
18
43 39 34 36
30
33
17 14 15
8 9
12
7 9 11 7 4
8
2 5 4 3 3
2
13 13 12 18 17 26
2009 %
2007 %
2011 %
Very easy
Fairly easy
Neither
Fairly difficult Very difficult Don’t know
Mean
2013 %
3.70 4.01 4.14 3.78
2015 %
3.69 3.78
2017 %
Base: All with Health Insurance, n= 819

Incidence of having considered switching from current PHI provider to another: Customers who have never switched health insurance provider are increasingly sticking with one health insurance provider as consideration for switching from current health insurance provider has reached an all-time low.
44 Q.40 Have you ever considered switching from your current health insurance provider to another?
10%
79%
11%
Yes
No
Don’t know Incidence of having Considered Switching
Yes %
No %
Don’t know %
2015 13 80 7 2013 20 76 4 2011 20 75 4 2009 13 77 10 2007 14 77 8 2005 13 73 13 2002 12 71 17
Base: All who have never switched Heath Insurance Provider, n=638

Reasons for not Switching PHI Provider: Nearly half cite satisfaction with their current provider as the reason for not considering a switch; lack of cost savings also becoming less important in switch consideration.
45 Q.42 Are there any particular reasons why you have never switched companies?
46 17 15 14 13 11 10 8 7 7 7 6 3 3 3 3 2 2 1 1 1 1 1 1
% Satisfied with current provider
No significant cost savings* Not my decision
Level of cover no better Too much hassle/paperwork
Range of products/services no better Couldn’t be bothered
Feel loyal to my current provider Work/employer looks after it
Concerned that coverage would not be the same Been with existing provider for a long time
Too difficult to compare plans Prefer to stay with an Irish company*
Too expensive* Current uncertainty in the market* Concerned about waiting periods*
Other insurer wouldn’t want me/am too high risk* Still considering it/Have not made up my mind*
Wanted to support competition* Didn’t know/Not aware that I could switch*
Lack of information* Just joined the current policy*
I didn’t want to lapse my travel insurance policy* I was persuaded not to switch by my current insurer*
2015 %
2013 %
2011 %
2009 %
2007 %
2005 %
2002 %
40 38 44 41 45 36 27 23 n/a n/a n/a n/a n/a n/a 9 9 6 13 14 9 12
14 15 13 13 16 15 13 15 n/a n/a n/a n/a n/a n/a 7 10 9 10 10 6 7 11 12 8 12 27 13 14 8 10 4 9 9 8 4 6 7 8 10 9 7 11 5 7 n/a n/a n/a n/a n/a 6 8 4 13 14 6 3 8 9 4 7 7 4 4 * n/a n/a n/a n/a n/a n/a 2 n/a n/a n/a n/a n/a n/a - n/a n/a n/a n/a n/a n/a 1 n/a n/a n/a n/a n/a n/a 3 n/a n/a n/a n/a n/a n/a 1 n/a n/a n/a n/a n/a n/a - n/a n/a n/a n/a n/a n/a 1 n/a n/a n/a n/a n/a n/a 1 n/a n/a n/a n/a n/a n/a * n/a n/a n/a n/a n/a n/a - n/a n/a n/a n/a n/a n/a - n/a n/a n/a n/a n/a n/a * New code added in 2015
Base: All who have never switched Heath Insurance Provider, n=638
Significant Difference vs 2015

Savings needed to switch: Savings of around 25% continues to be the average needed to encourage consideration for switching insurance providers.
46 Q.45 How much actual saving, in percentage do you think would be needed to
encourage you to switch, to a comparable plan, with another health insurance provider?
55+ %
1-10%
Average 24%
35-54 %
18-34 %
11-20%
21-30%
31-40% 41-50% 51-60% 61-70% 71-80% 81-90%
91-100%
25% 23% 25%
2017 %
15 16 19 11
30 27 31
31
25 24
22 27
7 8
7 7
9 11 8 9
0 0 0 0 0 0 1 2 0 2
2 2 1 2
Base: All with Health Insurance, n= 819

Incidence of considering switching from current insurer for financial or benefit gains: In-line with decreased overall appetite for switching providers, little year-on-year movement for considering a change for financial or benefit gains as there is a lack of perceived differentiation of policy offerings and cost savings.
47 Q.46 Would you consider switching from your current insurer, if you thought
financial gains could be made? Q.47 Would you consider switching from your current insurer, if you thought
benefit gains could be made for a similar policy fee?
32 33
39 36
22 24
7 7
Yes
Financial Gains
%
Benefit Gains
%
Maybe
No
Don’t Know
(35)
(34)
(22)
(9)
(32)
(36)
(23)
(6)
Base: All with Health Insurance, n= 819
( ) 2015 data

Factors that would encourage discontinuing cover: The perceived importance of having PHI has grown after a dip in 2015 as more say nothing would lead them to discontinue coverage, including job loss. However, a decline in product offering or level of coverage have increased as being drivers for ending coverage.
48 Q.51 Other than premium increases, what factors, if any, would lead you to discontinue cover?
%
26
24
20
20
16
16
15
8
8
3
6
Nothing/would never discontinue cover
If I lost my job
If the level of cover deteriorated
If my salary/wages were reduced
If service levels deteriorated
If the range of products were reduced
If public services improved
If my hours were cut
If my parents no longer paid for it
Other
Don’t Know
2015 %
2013 %
2011 %
2009 %
2007
% 2005
% 2002
%
21 34 36 31 27 24 28
33 18 19 25 17 24 21
16 26 24 19 n/a n/a n/a
17 18 18 23 27 5 18
17 22 17 22 32 25 29
10 14 11 12 14 13 14
15 13 10 15 20 16 10
9 9 8 6 n/a n/a n/a
4 5 6 6 7 5 7
- - 3 3 3 7 3
14 7 5 4 7 0 7
Base: All with Health Insurance, n= 819
Significant Difference vs 2015

Other factors that would encourage discontinuing cover x Age: Financial hardship is the primary reason that would lead workforce-aged consumers to cancel their PHI coverage. The older age cohort, who are more likely to have health concerns, are also more likely to say that nothing would lead them to discontinuing their policy.
49 Q.51 Other than premium increases, what factors, if any, would lead you to discontinue cover?
%
26
24
20
20
16
16
15
8
8
3
6
Nothing/ would never discontinue cover
If I lost my job
If the level of cover deteriorated
If my salary/wages were reduced
If service levels deteriorated
If the range of products was reduced
If public services improved
If my hours where cut
If my parents no longer paid for it
Other
Don’t Know
18-34 %
35-54 %
55+ %
13 17 42
26 35 9
16 18 23
18 30 9
17 17 15
7 18 17
11 14 18
8 11 4
29 3 2
3 3 3
7 7 4
Base: All with Health Insurance, n= 819

Claim Experience
50

Incidence of Ever Claiming on Health Insurance Policy: Overall claims up slightly from 2015 with significantly more claiming for an overnight hospital stay.
51 Q.14 Did you ever make a claim for treatment in a hospital, for yourself only, whether this was as a day patient or for an overnight stay in hospital?
Yes day patient*
Yes overnight stay
No
Don’t know
2011 (n=424)
%
2013 (n=799)
%
57% 61%
2015 (n=739)
%
38
35
40
3
57%
*Day Patient refers to a Hospital Admission Day Patient
40
41
36
2
31
44
41
1
2017 (n=819)
%
43
43
38
1
60%
Base: All with Health Insurance, n= 819
Significant Difference vs 2015

Incidence of Claiming on Health Insurance Policy by demographics: Understandably, overnight stays become more frequent with the older age cohorts; C2DEs are also more likely to have an overnight, rather than day-only, stay. Women are also more likely than men to make any type of claim.
52
*Hospital Admission Day Patient
Q.14 Did you ever make a claim for treatment in a hospital, for yourself only, whether this was as a day patient or for an overnight stay in hospital?
As a Day Patient*
%
Overnight Stay
% Total 40 41
GENDER Male 37 38
Female 42 45
AGE
18-34 (n=176) 22 22
35-44 (n=240) 38 32
45-54 (n=210) 37 42
55-64 (n=181) 38 48
65+ (n=161) 56 63
SOCIAL CLASS ABC1
(n=521) 42 41
C2DE (n=388) 34 41
Dependent children
U.18 years
Yes 37 36 No 41 44
Base: All who have ever had Health Insurance, n= 968

A closer look at those without Health Insurance
53

Incidence of lapsed policies: Incidence of having previously held PHI has declined this year among those who do not currently have coverage; the average length of previous coverage remains fairly consistent.
54 Q.4 Have you ever been covered by Health Insurance? Q.5 For, how many years were you personally covered by Health
insurance?
Incidence of ever being covered by Health Insurance Policy
Incidence of ever being covered
% 2015 17 2013 22 2011 22 2009 15 2007 13 2005 9
Base: All who were previously covered by HI, n=149
14%
86%
Yes
No
15 12 12
25 23 27
28
21
29
32
31
29
0 14
3
2013 %
21+ years
11-20 years
6-10 years
Average
Up to 5 years
NUMBER OF YEARS PREVIOUSLY HELD HEALTH INSURANCE
12 years
2015 %
12 years
Don’t Know
2017 %
13 years
Base: All without Health Insurance, n= 1,072
63 18 17 15 15
8 8 7 4 2 1 1 1
7 1
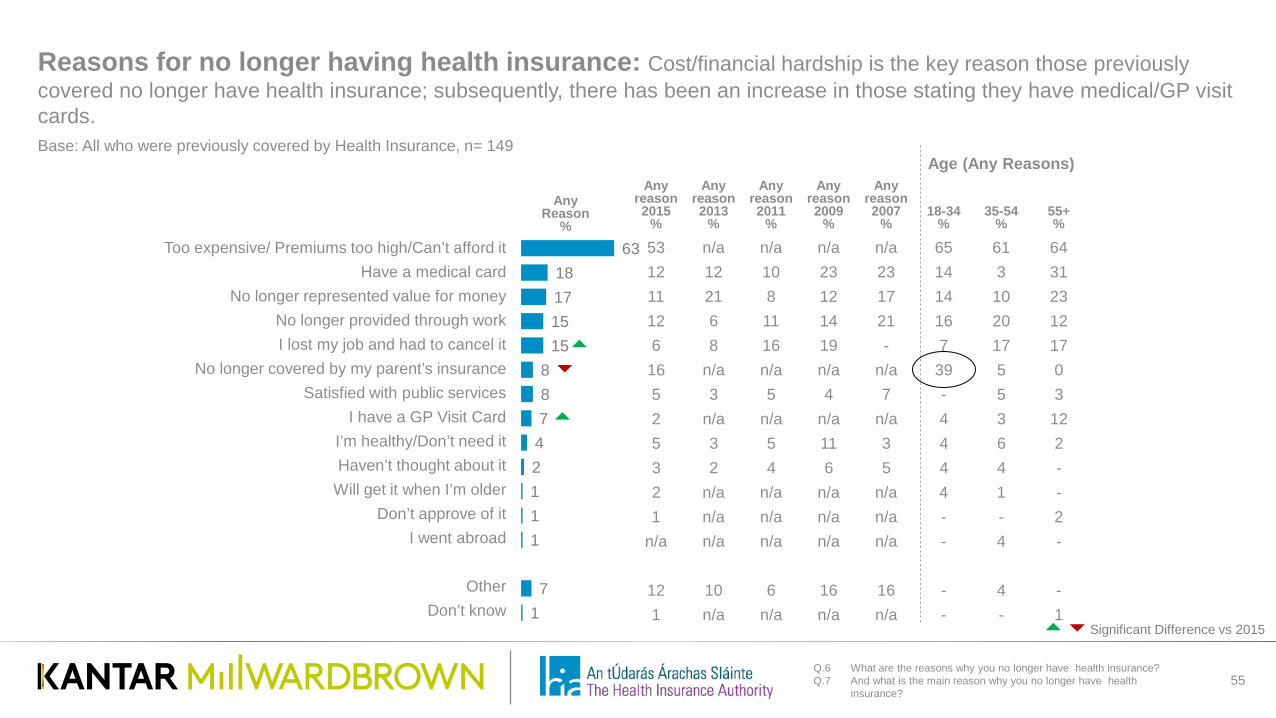
Reasons for no longer having health insurance: Cost/financial hardship is the key reason those previously covered no longer have health insurance; subsequently, there has been an increase in those stating they have medical/GP visit cards.
55 Q.6 What are the reasons why you no longer have health insurance? Q.7 And what is the main reason why you no longer have health insurance?
Too expensive/ Premiums too high/Can’t afford it Have a medical card
No longer represented value for money No longer provided through work I lost my job and had to cancel it
No longer covered by my parent’s insurance Satisfied with public services
I have a GP Visit Card I’m healthy/Don’t need it Haven’t thought about it
Will get it when I’m older Don’t approve of it
I went abroad
Other Don’t know
Any Reason
%
Age (Any Reasons) Any
reason 2015
%
Any reason 2013
%
Any reason 2011
%
Any reason 2009
%
Any reason 2007
%
18-34
% 35-54
% 55+ %
53 n/a n/a n/a n/a 65 61 64 12 12 10 23 23 14 3 31 11 21 8 12 17 14 10 23 12 6 11 14 21 16 20 12 6 8 16 19 - 7 17 17
16 n/a n/a n/a n/a 39 5 0 5 3 5 4 7 - 5 3 2 n/a n/a n/a n/a 4 3 12 5 3 5 11 3 4 6 2 3 2 4 6 5 4 4 - 2 n/a n/a n/a n/a 4 1 - 1 n/a n/a n/a n/a - - 2
n/a n/a n/a n/a n/a - 4 -
12 10 6 16 16 - 4 - 1 n/a n/a n/a n/a - - 1
Base: All who were previously covered by Health Insurance, n= 149
Significant Difference vs 2015

Drivers to take out Health Insurance again: Dovetailing with cost as the main barrier to reinstate coverage, one-third say they would take out PHI again if they had more money while another third say they would if premiums were reduced. One-quarter say they will never get coverage again, up 9 points from 2015.
56 Q.8 What factors, if any, would lead you to take out private health insurance again?
% 39
36
23
14
9
7
7
5
5
4
2
2
2
1
1
If I had more money
If premiums were reduced/if it were cheaper
Nothing/I will never get Private Health Insurance again
If I was offered through my employment
When I get older
If public health services deteriorate
If the level of Private Health Insurance coverage improved
If my spouse/partner takes it out
If I become employed
If higher premiums were introduced for people who join later
If I get married
If I got sick
If a family member got sick
If I have (plan to have) children
Other
2015 %
2013 %
2011 %
2009 %
2007
% 2005
% 2002
% 36 38 36 43 29 27 28 26 40 16 26 17 25 27 14 10 17 17 34 22 30 7 11 9 11 18 n/a n/a 11 9 11 9 18 4 11 5 4 9 17 6 3 4 6 8 4 1 7 7 2 2 1 1 1 3 n/a n/a 2 10 7 14 n/a n/a n/a 4 2 2 0 1 0 n/a 4 3 3 1 9 9 6 4 3 3 7 7 7 9 5 3 2 1 1 7 8 4 4 4 6 3 2 10 5 5 6 7 7 21 9
Base: All who were previously covered by Health Insurance, n= 149
Significant Difference vs 2015

Reasons for never having health insurance: Similarly to those who say Cost is the reason for not reinstating previously held PHI coverage, it is also the primary reason for those who say they have never had Health Insurance. For many, economic considerations are a barrier to uptake.
57 Q.9a Are there any reasons why you do not have health insurance? Q.9b What is the main reason why you do not have health insurance?
52
18
8
9
7
4
-
1
-
64
27
16
16
15
9
1
2
2
Main Reason
%
Any Reason
% Too expensive/ Premiums too high/Can’t afford it
Have a medical card
Haven’t thought about it
Satisfied with public services
I’m healthy/Don’t need it
Will get it when I’m older
Don’t approve of it
Other
Don’t know
Age Any
reason 2015
%
Any reason 2013
%
Any reason 2011
%
18-34
% 35-54
% 55+ %
59 67 54 56 68 68
31 29 25 21 22 43
13 15 16 22 15 8
12 12 11 11 23 16
12 16 10 19 17 7
6 9 7 14 10 1
2 2 n/a * 1 2
n/a n/a n/a 1 2 2
4 2 6 3 1 2
Base: All who have never held Health Insurance, n= 923
Significant Difference vs 2015

Factors that would encourage those who never had PHI to opt for it: As with drivers to re-instating PHI coverage, having more money and cheaper premiums emerge as the top factors that would encourage PHI purchase among those who have never had a policy.
58
% 27 24 23
16 9 9 6 6 4 4 4 3 2 2 2 1
If I had more money
If premiums were reduced/if it were cheaper
Nothing/I will never get Private Health Insurance
When I get older
If public health services deteriorate
If it was offered through my employment and employer going to pay for it
If it was offered through my employment and employer going to part fund it
If I become employed
If I get married
If I got sick
If the level of health insurance coverage improved
If I have (plan to have) children
If a family member got sick
If higher premiums were introduced for people who join later
If my spouse/partner takes it out
Other
2015 %
2013 %
2011 %
2009 %
2007
% 2005
% 2002
% 28 31 27 36 25 24 28 18 22 22 24 16 16 22 19 17 20 17 35 25 32 16 15 17 15 16 14 10 6 8 4 9 5 5 7 3 6 5 12 n/a n/a n/a 3 4 n/a n/a n/a n/a n/a 3 6 n/a n/a n/a n/a n/a 3 5 5 2 5 6 7 7 11 6 12 8 7 7 4 4 3 5 3 3 2 5 5 4 5 5 4 5 4 7 2 8 5 5 5 2 1 1 2 1 1 1 2 2 2 2 3 n/a n/a 2 2 3 4 2 4 6
Q.10 What, if anything, would encourage you to get health insurance?
Base: All who have never held Health Insurance, n= 923

Perception of annual cost of health insurance per adult (among those without PHI): Increased perceptions that PHI is expensive helps to explain why cost is the main barrier in getting insurance for both those who have previously and never held PHI; the perceived average cost has risen by €140 since 2015.
59 Q.13 Approximately how much do you think standard health insurance costs per adult, per year?
31 22 24 19
8
32
30 32 27
14
6
6 8
6
8
16 22
20
25
24
5 8 5
6
17
10 12 11 16 18
2013 (n=1223)
%
€1000+
2011 (n=576)
%
2009 (n=521)
%
€751-€1000
€601-€750
€451-€600
€301-€450 Less than €300
Average €969 €829 €641
2015 (n=1093)
%
€926 €1066
2017 (n=1072)
%
Base: All without Health Insurance, n= 1,072
Significant Difference vs 2015

Future intentions for Health Insurance: Little overall change in future intentions to purchase PHI from 2015.
60 Q.11 When, if ever, are you likely to get health insurance [again]?
1 1 2 2 2 3 3 5 3 3 4 2 5 7 5 9 5 3
8 7 10 7
6 3
25 18 24 18 24
21
19 24 23
30 30
39
22 16
15 22
14
29 18 24 14 16 15
Yes, likely to get it but not within next 5 years Yes, likely to get it within 3-5 years Yes, likely to get it within1-2 years
Yes, likely to get in within next 12 months
Likely to get it but don’t know when
Unlikely to ever get it
No, will never get Private Health Insurance
Don’t know
2009 %
2007 %
2013 %
2011 %
2015 %
38% 44% 39% 41% 32% 42%
2017 %
Base: All without Health Insurance, n= 1,072

Health Insurance Authority
61

Who to approach to seek advice or help if a problem with health insurance occurs: Insurers remain the primary source to turn to when there are problems with health insurance, but the HIA sees a significant increase this year in those who would turn to the organisation for help in resolving their issue(s).
Q.56 If you ever had a problem with your health insurance, who would you approach to seek advice or help?
60 52 58 67 62 66 65
25 19
30 22 18 14 16
5 4
7 2 3 4
6 2
3
2 2 3 7 5 7
6
7 7 3 4
5 5
6
5 4 15
23 14 12
21 19 12
All with HI
2013 %
Don’t know
Financial regulator
Financial services ombudsman Department of health and children
Health Insurance Authority
Health Insurer
18-34 (497)
%
35-54 (815)
%
55+ (286)
%
All with HI 2017
%
2017 All with HI
2011 %
Central Bank
All with HI
2015 %
Base: All with Health Insurance, n=819
Significant Difference vs 2015

Awareness of Ireland’s Health Insurance Authority: Awareness of the HIA has increased significantly from 2015 both among all adults 18+ and those who hold health insurance.
63 Q.57 Which of these statements best describes your awareness of Ireland’s Health Insurance Authority?
11 10 8 12 12 10 4 4
17 14 11 16 19
31 26
21 21 21 22
23 12
40 33
28 26
27
22 23
21 17 21 23 26
20
20
25
21 17 20
36 41 50 50 46 45 47
64
22 28 40 41
34
2009 %
2007 %
2005 %
2002 %
2013 %
2011 %
Have never heard of the Health Insurance Authority
Have heard of the Health Insurance Authority but not sure what they do
Have some awareness of the Health Insurance Authority and its functions
Fully aware of the Health Insurance Authority
2013 %
2009 %
2011 %
All With Health Insurance
(n=819) 2017
% 2015
% 2017
% 2015
%
Base: All Adults Aged 18+, n=1,891
Significant Difference vs 2015

Appendix
64

Incidence of making a complaint to health insurer: The incidence of reporting complaints to health insurers remains stable from 2015.
65 Q.33 Have you, or any policy member, ever made a complaint to your health insurer?
4% 96%
Yes No/
Don’t know
Incidence of Making a Complaint
% 2015 4 2013 6 2011 7 2009 2 2007 1 2005 4 2002 3
Base: All with Health Insurance, n=819
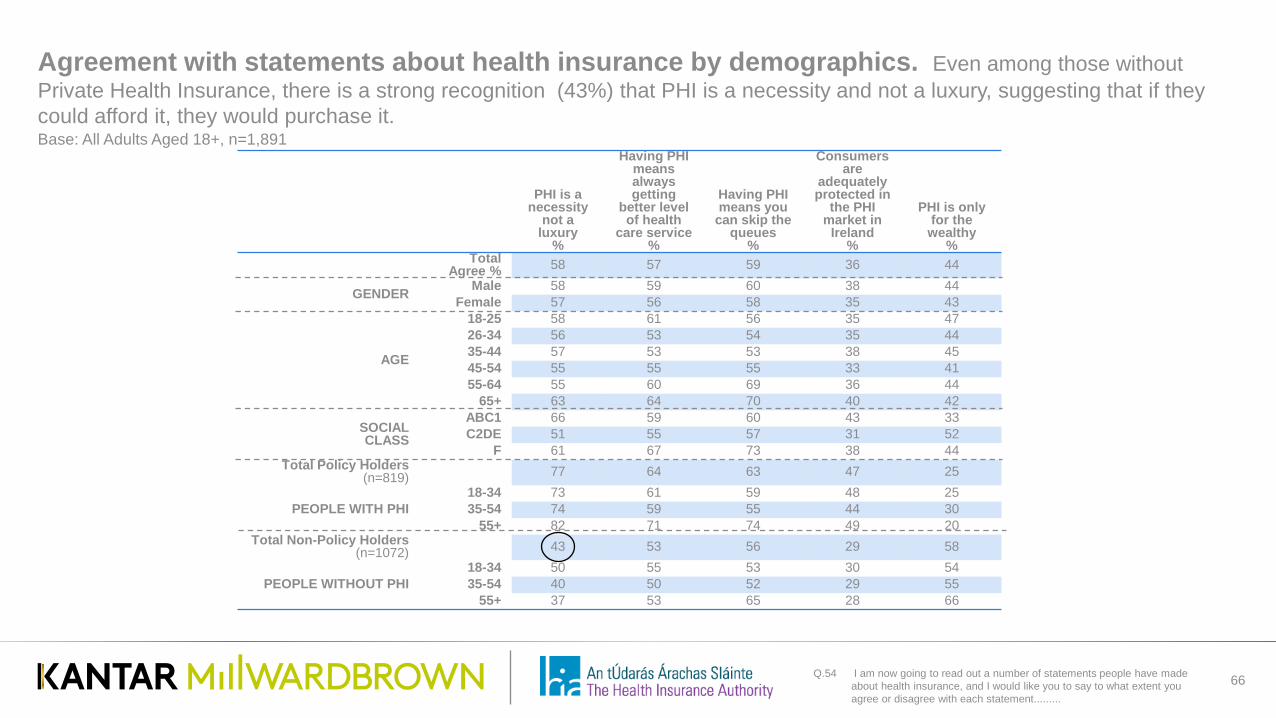
Agreement with statements about health insurance by demographics. Even among those without Private Health Insurance, there is a strong recognition (43%) that PHI is a necessity and not a luxury, suggesting that if they could afford it, they would purchase it.
66 Q.54 I am now going to read out a number of statements people have made about health insurance, and I would like you to say to what extent you agree or disagree with each statement.........
PHI is a necessity
not a luxury
%
Having PHI means always getting
better level of health
care service %
Having PHI means you
can skip the queues
%
Consumers are
adequately protected in
the PHI market in
Ireland %
PHI is only for the wealthy
% Total
Agree % 58 57 59 36 44
GENDER Male 58 59 60 38 44 Female 57 56 58 35 43
AGE
18-25 58 61 56 35 47 26-34 56 53 54 35 44 35-44 57 53 53 38 45 45-54 55 55 55 33 41 55-64 55 60 69 36 44
65+ 63 64 70 40 42
SOCIAL CLASS
ABC1 66 59 60 43 33 C2DE 51 55 57 31 52
F 61 67 73 38 44 Total Policy Holders
(n=819) 77 64 63 47 25
PEOPLE WITH PHI 18-34 73 61 59 48 25 35-54 74 59 55 44 30
55+ 82 71 74 49 20 Total Non-Policy Holders
(n=1072) 43 53 56 29 58
PEOPLE WITHOUT PHI 18-34 50 55 53 30 54 35-54 40 50 52 29 55
55+ 37 53 65 28 66
Base: All Adults Aged 18+, n=1,891

Agreement with statements about health insurance by demographics
67 Q.54 I am now going to read out a number of statements people have made about private health insurance, and I would like you to say to what extent you agree or disagree with each statement.........
There is adequate information to enable me to
compare plans on offer from different
health insurers %
I will always have PHI %
There is no need for PHI in Ireland,
public services are adequate
%
PHI is good value for money
%
Only old people and sick people
need PHI %
Total Agree % 39 39 22 30 18
GENDER Male 41 41 24 32 20 Female 38 39 19 27 17
AGE
18-25 39 29 21 29 25 26-34 40 30 22 28 18 35-44 39 42 27 30 23 45-54 40 43 20 28 16 55-64 36 41 20 31 17
65+ 40 49 19 32 11
SOCIAL CLASS
ABC1 48 56 22 37 18 C2DE 33 27 22 25 19
F 33 42 14 225 10 Total Policy Holders
(n=819) 51 75 16 44 18
PEOPLE WITH PHI 18-34 54 63 18 41 24 35-54 50 72 18 41 19
55+ 50 85 12 48 13 Total Non-Policy Holders
(n=1072) 30 13 26 19 19
PEOPLE WITHOUT PHI 18-34 33 16 23 23 20 35-54 31 16 29 18 21
55+ 26 7 26 16 15
Base: All Adults Aged 18+, n=1,891

For more information, please contact: Paul Moran [email protected] 087 286 0773


![Consumer Credit Insurance [CCI]](https://img.pdfslide.us/doc/110x75/56815de4550346895dcc0bfd/consumer-credit-insurance-cci.jpg)