Embed Size (px)
Citation preview

THIS REPORT CONTAINS ASSESSMENTS OF COMMODITY AND TRADE ISSUES MADE BY
USDA STAFF AND NOT NECESSARILY STATEMENTS OF OFFICIAL U.S. GOVERNMENT
POLICY
-
Date:
GAIN Report Number:
Post:
Report Categories:
Approved By:
Prepared By:
Report Highlights:
The data and analysis shown in this report is derived from focus group discussions and a quantitative
survey comprised of 1,325 consumers in the Eastern China area. The data and analysis are not the
position of the U.S. Department of Agriculture. Rather, the data and analysis are information collected
from in-field research to give the Agricultural Trade Office in Shanghai insight into Chinese consumers’
perceptions of imported food products.
ATO Shanghai
Tyler Babcock
Market Development Reports
Consumer Study on China's Imported Food Products
Shanghai ATO
China - Peoples Republic of
CH178040
3/1/2018
Public Voluntary

Summarized Report on Imported Food Research - China
Research Commissioned by: Agricultural Trade Office in Shanghai Research Conducted by: UnicView Market Research and Consulting Company Reported Drafted by: UnicView Market Research and Consulting Company Date: January, 2018

Disclaimer: The data and analysis shown in this report is derived from focus group discussions and a quantitative survey comprised of 1,325 consumers in the Eastern China area. The data and analysis are not the position of the U.S. Department of Agriculture. Rather, the data and analysis are information collected from in-field research to give the Agricultural Trade Office in Shanghai insight into Chinese consumers’ perceptions of imported food products.
Market Research Executive Summary Strong consumption power The overall market size of target imported food in Shanghai, Wuhan, Nanjing and Ningbo is approximately 10 billion USD, with the U.S. share being 2.3 billion USD. Imported fruit, dairy, wine & beer are top commodity groups in term of market size. (*Target imported foods just include beef, pork, seafood, dairy, fruit, tree nuts, wine & beer, infant formula and pet food)
Tier 1 cities are more mature markets Shanghai consumers are more familiar with imported foods, accounting for 60% of total imported food purchased among the 5 cities included in the study. Eastern coastal cities such as Nanjing and Ningbo have relatively higher penetration rate for imported food compared with Wuhan, a central China emerging market.
Fierce Competition The United States ranked third in the overall market share of imported food. U.S. tree nuts, pet food and pork enjoy both high market share and positive consumer perception. “Advanced in food technology” is the most distinctive characteristic for U.S. imported food, according to the Chinese consumers’ perception.
U.S. product favorability ratings continue to be behind that of major competitors in the market, especially the European Union, which received the best favorability rating among consumers in the 5 cities involved in the study. Oceania countries have higher perceived market share in dairy, beef and infant formula. Southeast Asian countries have perceived advantages in fresh fruit and seafood.
Consumers’ perception on imported foods: tasty, natural & safe, but expensive Favorable taste, safe and high nutrition are the main reasons for consumers to purchase imported food. High prices of imported foods are preventing some consumers from purchasing more frequently.
Imported Food Pioneers: a small percentage of total but large contribution Imported food pioneers are the people with strong purchasing power and more frequent purchasers of imported foods. Their yearly expenditure on imported food is perceived to be more than US $1,500 per person. Imported food pioneers account for just 13 percent of the total interviewees but they contribute to more than one third of imported food purchase by value.
Research Objectives According to requirements of the Agricultural Trade Office (ATO) Shanghai, this study was conducted to meet the following objectives: Calculate the market size of the target imported food in selected research cities Understand consumers’ perception of imported food products Explore the strengths and weaknesses of U.S. imported food products Identify target consumer group
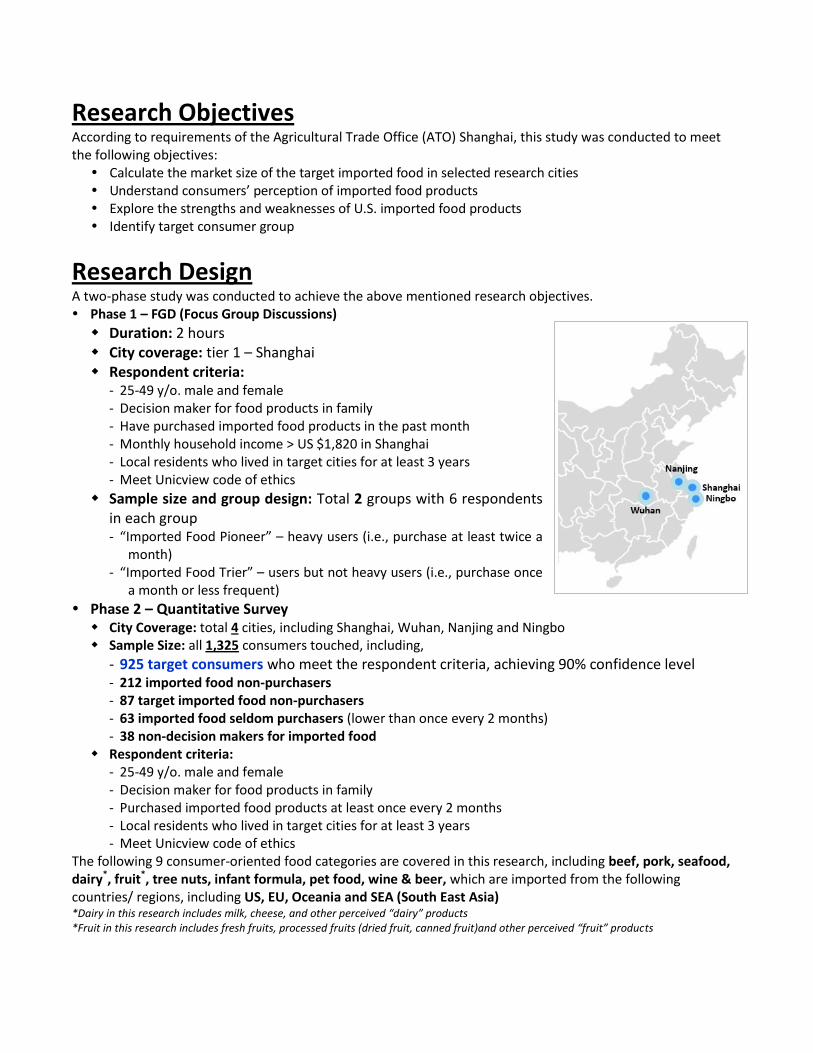
Research Design A two-phase study was conducted to achieve the above mentioned research objectives. Phase 1 – FGD (Focus Group Discussions)
Duration: 2 hours City coverage: tier 1 – Shanghai Respondent criteria:
- 25-49 y/o. male and female - Decision maker for food products in family - Have purchased imported food products in the past month - Monthly household income > US $1,820 in Shanghai - Local residents who lived in target cities for at least 3 years - Meet Unicview code of ethics
Sample size and group design: Total 2 groups with 6 respondents in each group - “Imported Food Pioneer” – heavy users (i.e., purchase at least twice a
month) - “Imported Food Trier” – users but not heavy users (i.e., purchase once
a month or less frequent)
Phase 2 – Quantitative Survey City Coverage: total 4 cities, including Shanghai, Wuhan, Nanjing and Ningbo Sample Size: all 1,325 consumers touched, including,
- 925 target consumers who meet the respondent criteria, achieving 90% confidence level - 212 imported food non-purchasers - 87 target imported food non-purchasers - 63 imported food seldom purchasers (lower than once every 2 months) - 38 non-decision makers for imported food
Respondent criteria: - 25-49 y/o. male and female - Decision maker for food products in family - Purchased imported food products at least once every 2 months - Local residents who lived in target cities for at least 3 years - Meet Unicview code of ethics
The following 9 consumer-oriented food categories are covered in this research, including beef, pork, seafood, dairy*, fruit*, tree nuts, infant formula, pet food, wine & beer, which are imported from the following countries/ regions, including US, EU, Oceania and SEA (South East Asia) *Dairy in this research includes milk, cheese, and other perceived “dairy” products *Fruit in this research includes fresh fruits, processed fruits (dried fruit, canned fruit)and other perceived “fruit” products

Notes of Report Interpretation All the data and analysis shown in this report is derived from the interviews
with pre-mentioned 1325 consumers.
Market size referred to in this report is calculated on the basis of: 925 target consumers in 4 surveyed cities AND 9 target imported food categories AND the target 4 countries/regions including the United States, European Union,
Oceania countries and Southeast Asia
Market share mentioned in this report is a relative market share metric in the above defined universe.
The exchange rate of CNY against USD in this report is 6.6.

Key Findings Market Size – What’s the Status Quo? 84 percent of all interviewed consumers purchased the target imported food at least once in the past 1 year. 70 percent of those consumers purchased the target imported food categories at least once every 2 months in the past 1 year.
Dairy is the most popular imported food category, followed by Wine & beer and Fruit.

The perceived market size in the 4 surveyed cities is approximately 10 billion USD. Dairy, wine & beer and fruit are top categories. EU and Oceania occupy a slightly larger perceived market size. Shanghai accounts for 60 percent of the perceived total imported food purchase among 4 surveyed cities.

In terms of competitiveness, consumers perceived the United States to be a major supplier of tree nuts, pet food and pork compared with the other three regions.
Relative Perceived Market Share by Regions
US EU SEA Oceania
Dairy ($ 1.9 B.) 17% 30% 8% 46%
Wine & beer ($ 1.7 B.) 23% 56% 9% 11%
Fruit ($ 2.2 B.) 19% 15% 52% 13%
Beef ($ 1.0 B.) 26% 22% 3% 47%
Tree nuts ($ 0.7 B.) 46% 17% 24% 13%
Seafood ($ 1.0 B.) 16% 14% 37% 34%
Infant formula ($ 0.9 B.) 23% 32% 11% 33%
Pet food ($ 0.4 B.) 32% 28% 18% 20%
Pork ($ 0.2 B.) 36% 36% 5% 22%

Category Understanding – Why Purchase Imported Food? Good taste, natural and safe, and high nutrition are the top reasons for consumers to purchase imported food. (Respondents were allowed to check multiple options)
Few promotions, limited information on the package, and low availability in market are major reasons consumers do not purchase more imported food products.

Besides high price and local substitutes, frequent out-of-stock and few promotions are main purchase barriers for imported food products.
Internet is the most important channel for consumers to get imported food related information, followed by in-store channels, word of mouth and TV.
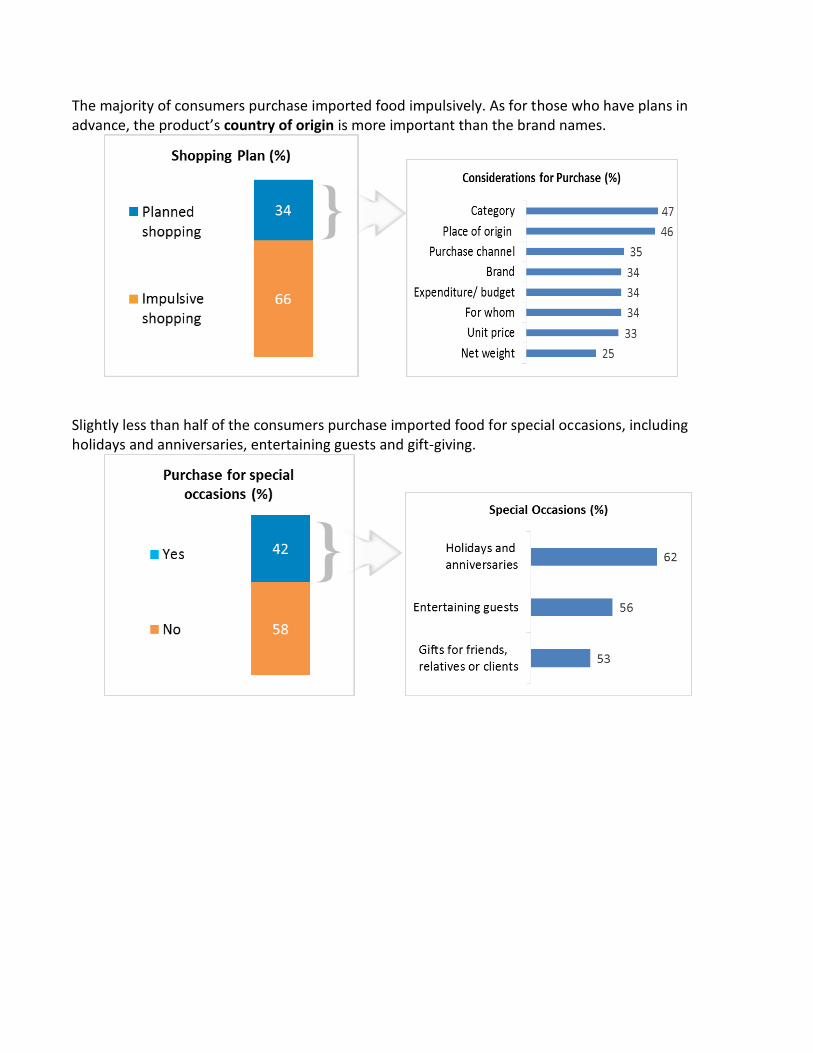
The majority of consumers purchase imported food impulsively. As for those who have plans in advance, the product’s country of origin is more important than the brand names.
Slightly less than half of the consumers purchase imported food for special occasions, including holidays and anniversaries, entertaining guests and gift-giving.
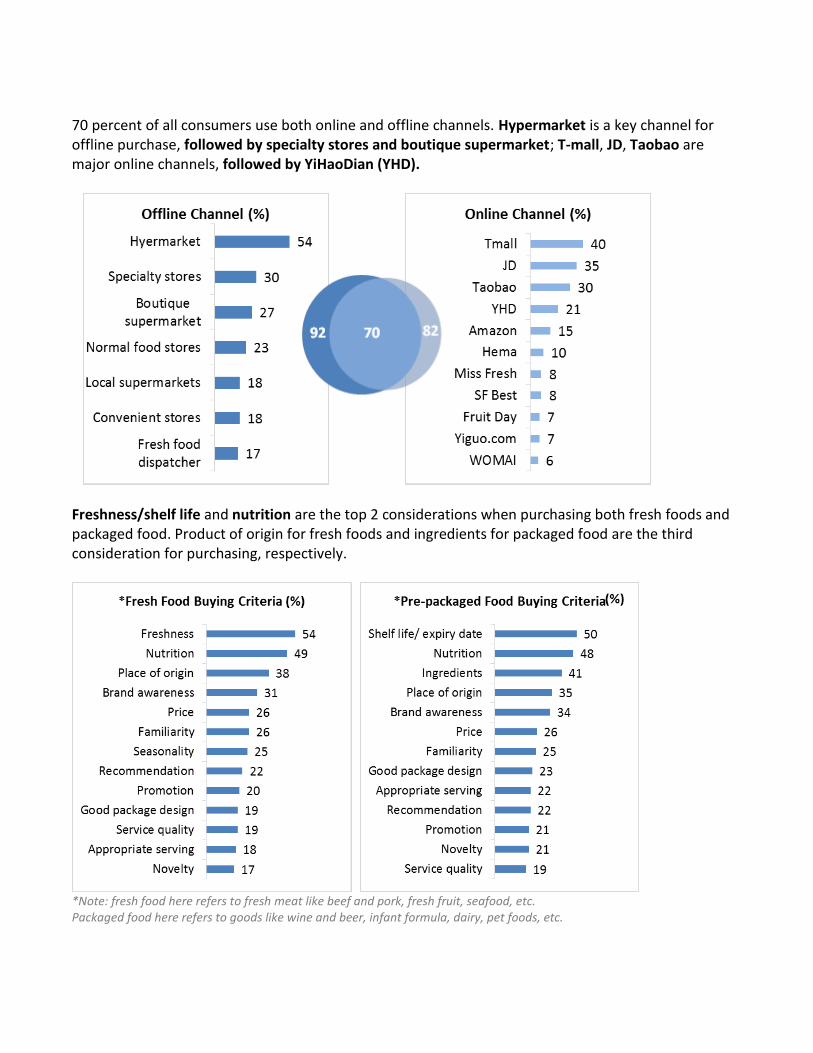
70 percent of all consumers use both online and offline channels. Hypermarket is a key channel for offline purchase, followed by specialty stores and boutique supermarket; T-mall, JD, Taobao are major online channels, followed by YiHaoDian (YHD).
Freshness/shelf life and nutrition are the top 2 considerations when purchasing both fresh foods and packaged food. Product of origin for fresh foods and ingredients for packaged food are the third consideration for purchasing, respectively.
*Note: fresh food here refers to fresh meat like beef and pork, fresh fruit, seafood, etc. Packaged food here refers to goods like wine and beer, infant formula, dairy, pet foods, etc.
82 70

Competitiveness of U.S. Imported Food – What are the strengths and weaknesses? European products received the most positive perception from Chinese consumers, followed by US, Oceania and SEA.
US EU SEA Oceania Average Score:10 points 8.0 8.2 7.8 7.9

U.S. tree nuts, pork and pet food are considered to be the best in category among four regions.
Consumer Perception
US EU SEA Oceania
Dairy 54% 64% 43% 60%
Wine & beer 53% 71% 41% 55%
Fruit 55% 49% 64% 52%
Beef 58% 64% 39% 59%
Tree nuts
63% 58% 53% 46%
Seafood 51% 58% 57% 54%
Infant formula 54% 66% 40% 61%
Pet food
63% 63% 44% 49%
Pork 61% 60% 48% 50%

In general, consumers have better perception of EU. “Advanced food technology” is the most distinctive characteristic for U.S. imported food in Chinese consumers’ perception.
Consumer Perception
US EU SEA Oceania
Good taste and flavor 56% 63% 44% 57%
Freshness 54% 58% 57% 52%
Natural and safe 52% 60% 52% 57%
Strict manufacturing standard 59% 67% 44% 51%
Well-known place of origin 61% 65% 45% 49%
Appropriate package size 58% 62% 51% 48%
Good looking of package 59% 63% 47% 50%
Advanced in technology 70% 62% 43% 46%
Easy to access 58% 61% 54% 48%
Value for money 55% 61% 55% 48%
Popular 56% 61% 53% 48%
No domestic substitute 59% 62% 51% 48%
Represent high social status 58% 65% 46% 50%

Core Target Consumer Identification – Who mostly contribute to the market? Food import pioneers account for just 13 percent of the total interviewees but they
contribute to more than one third of imported food purchase by value.
Above average expenditure
Below average expenditure
nnual e penditure ver ,
nnual e penditure ,
nnual e penditure ess than

Pioneer Profile – Who are these food import pioneers?
• Located in Tier 1 cities (e.g., Shanghai)
• 30-39 years old. • Higher income level AVG MHI (monthly
household income): $ 2,912
• Frequent purchasers - at least once a week
• Overseas experience • Well educated - bachelor
degree or above
• More sophisticated purchasing consideration, both functional and emotional driven
• Willing to pay more for higher quality food products Willing to buy goods with
higher unit price, such as beef, seafood, infant formula
Attitudes
Purchase Behavior
• Besides top online purchasing platforms (Tmall, JD.com), pioneers also used other channels such as Amazon and Miss Fresh
• Pursue healthy lifestyle (e.g., “green”, organic)
• Care about nutrition
• Food safety is very important for them
• Perceive imported foods to be safer, tastier and more nutritious than domestic food in general
Profile
Attitudes

Appendix City difference

A glance of city coverage
*Note: Data source from Bureau of Statistics of each city in 2016