Embed Size (px)
Citation preview
Consumer Satisfaction Survey 2015 Annual Report
October 2015
Connecticut Department of Mental Health and Addiction Services
410 Capitol Avenue Hartford, CT 06134 www.ct.gov/dmhas
ii
Table of Contents
Tables .................................................................................................................................................................................... iv
Figures .................................................................................................................................................................................. iv
Note from the Director .......................................................................................................................................................... v
Acknowledgements ............................................................................................................................................................. vi
Executive Summary ............................................................................................................................................................ vii
Survey Process .................................................................................................................................................................. vii
Quality of Life ..................................................................................................................................................................... vii
Health Outcomes ............................................................................................................................................................... vii
Findings ............................................................................................................................................................................ viii
Survey Demographics ...................................................................................................................................................... viii
Statewide Satisfaction by MHSIP Domains ....................................................................................................................... ix
Demographic Characteristics and Satisfaction on MHSIP Domains .................................................................................. x Gender ............................................................................................................................................................................ x Race ............................................................................................................................................................................... x Ethnicity .......................................................................................................................................................................... x Age Range ..................................................................................................................................................................... xi Level of Care ................................................................................................................................................................. xi Length of Stay ............................................................................................................................................................... xi Region ........................................................................................................................................................................... xii
Survey Limitations.............................................................................................................................................................. xii
Introduction ......................................................................................................................................................................... 13
Purpose ............................................................................................................................................................................. 13
Organization of the Report ................................................................................................................................................ 13
Contact Information........................................................................................................................................................... 13
Methodology ........................................................................................................................................................................ 14
Measures .......................................................................................................................................................................... 14
Administration ................................................................................................................................................................... 15
Sample Selection .............................................................................................................................................................. 15
Data Entry ......................................................................................................................................................................... 16
Analysis ............................................................................................................................................................................. 16
Consumer Survey Results ................................................................................................................................................. 17
Demographics of Statewide Sample................................................................................................................................. 20
Satisfaction with Services ................................................................................................................................................. 21
Trends over Time .............................................................................................................................................................. 22 Statewide Satisfaction Trends by Domain.................................................................................................................... 22
General Satisfaction ........................................................................................................................................................... 29
Access .................................................................................................................................................................................. 32
iii
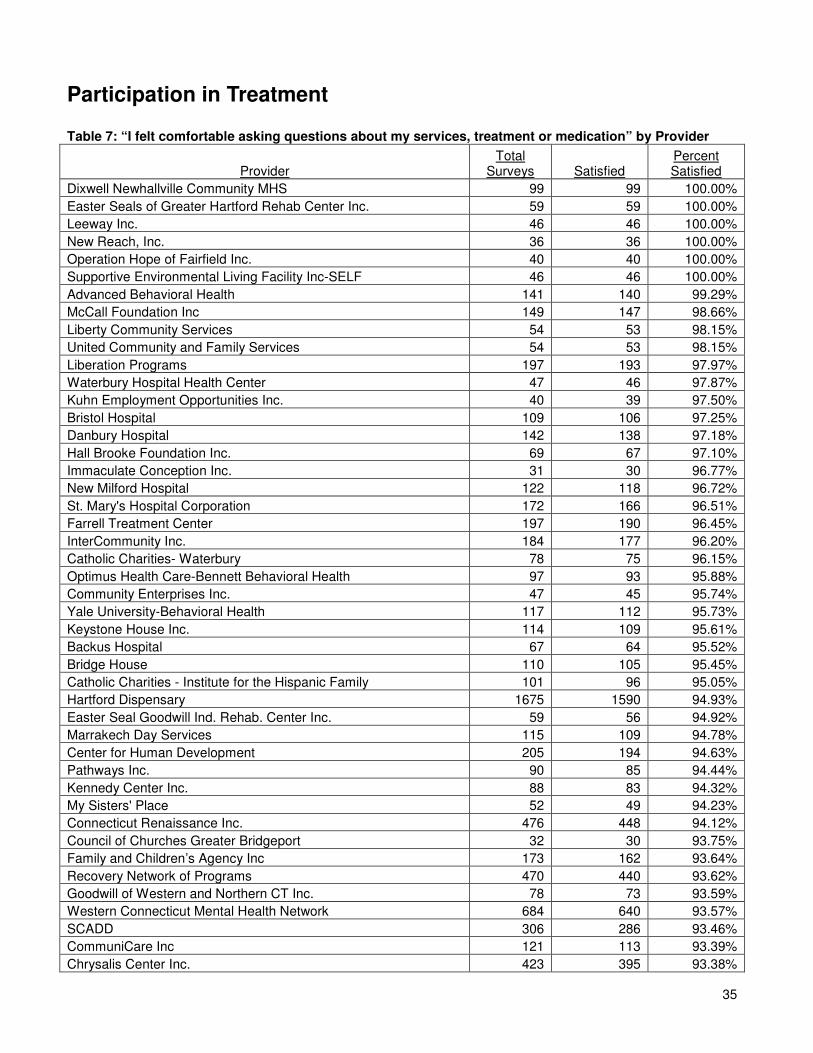
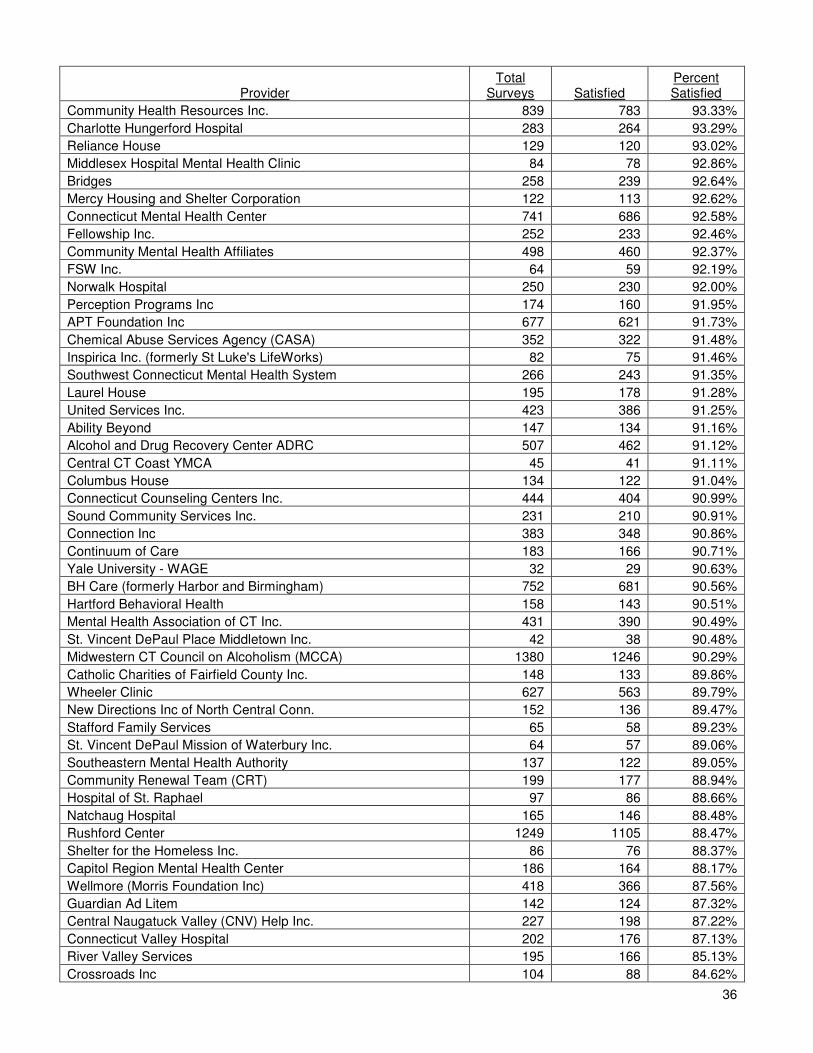
Participation in Treatment .................................................................................................................................................. 35
Quality and Appropriateness ............................................................................................................................................. 38
Respect ................................................................................................................................................................................ 41
Outcome ............................................................................................................................................................................... 44
Recovery .............................................................................................................................................................................. 47
Consumer Survey Differences between Groups ............................................................................................................. 50
Access .......................................................................................................................................................................... 59 Quality and Appropriateness ........................................................................................................................................ 59 General Satisfaction ..................................................................................................................................................... 60 Outcome ....................................................................................................................................................................... 60 Recovery ...................................................................................................................................................................... 61 Participation in Treatment ............................................................................................................................................ 61 Respect ........................................................................................................................................................................ 62
Quality of Life Results ........................................................................................................................................................ 63
Quality of Life Summary by Domains ............................................................................................................................... 71 General Quality of Life .................................................................................................................................................. 71 Physical Health ............................................................................................................................................................. 71 Psychological ................................................................................................................................................................ 72 Social ............................................................................................................................................................................ 72 Environment ................................................................................................................................................................. 72
Health Outcomes Survey Results ..................................................................................................................................... 74
Appendix 1.1: DMHAS Consumer Survey Cover Letter to Providers FY 2015............................................................ 82 Appendix 1.2: DMHAS Consumer Survey Cover Letter to Consumers FY 2015 ........................................................ 83 Appendix 1.3: DMHAS Consumer Survey Instrument FY 2015 ................................................................................... 84 Appendix 1.4: DMHAS Quality of Life Instrument FY 2015 .......................................................................................... 86 Appendix 2: Survey Sample Size and Number of Surveys Submitted by Provider, FY 2014 ...................................... 89
iv
Tables Table 1: Statewide Demographic Trends, SFY 2010 - 2015 ................................................................................................ 18 Table 2: Comparison of Survey Demographics to DMHAS Demographics .......................................................................... 20 Table 3: Statewide Trends (2010-2015) by Domain ............................................................................................................. 23 Table 4: Statewide Trends (2010-2015) by Question ........................................................................................................... 24 Table 5: General Satisfaction Domain by Provider ............................................................................................................... 29 Table 6: Access Domain by Provider .................................................................................................................................... 32 Table 7: “I felt comfortable asking questions about my services, treatment or medication” by Provider .............................. 35 Table 8: Quality and Appropriateness Domain by Provider .................................................................................................. 38 Table 9: “My wishes are respected about the amount of family involvement I want in my treatment” by Provider .............. 41 Table 10: Outcome Domain by Provider ............................................................................................................................... 44 Table 11: Recovery Domain by Provider .............................................................................................................................. 47 Table 12: Providers Participating in Health Outcomes Survey for 2015 .............................................................................. 74 Table 13: Demographic Information for Respondents to Health Outcomes Survey ............................................................. 79 Table 14: Health Outcomes Summary Data ......................................................................................................................... 80 Table 15: Health Outcomes Summary Data by Gender ....................................................................................................... 81 Table 16. Health Outcomes Summary Data by Smoking Status .......................................................................................... 81
Figures Figure 1: Comparison of Connecticut and National Domain Scores .................................................................................... 21 Figure 2: Trends (2010 - 2015) in Consumer Satisfaction .................................................................................................... 22 Figure 3: Body Mass Index for 2655 DMHAS Clients ........................................................................................................... 76 Figure 4: Reported Medical Conditions ................................................................................................................................. 76
v
Note from the Director Over 25,500 consumers responded to this year’s survey, setting a new participation record for the DMHAS Consumer Satisfaction Survey process. We are thankful to everyone who helped make this year a success. In addition to the annual MHSIP consumer satisfaction information, DMHAS also collected and analyzed data from two optional tools: the WHOQOL-BREF Quality of Life instrument, and a Health Outcomes Survey which contains items from the Center for Disease Control’s Behavioral Risk Factor Surveillance System (BRFSS). Together, these instruments provide us with important information about the way our consumers perceive our service system, their well-being, and overall health. These data are particularly important as behavioral and primary health care become increasingly more integrated in this country. DMHAS’ consumers report levels of satisfaction that exceed the U.S. national averages in all Consumer Satisfaction Survey domains. Please see page 21 of this report to view a comparison between state and national averages. Providers should examine these results, in conjunction with information contained in our Provider Quality Dashboard Reports, to help identify specific areas for improvement. Quality improvement targets might include improving access, reducing readmissions, or improving connections to follow-up care. We are grateful to our dedicated providers and their staff- we would not be able to do this data collection and analysis without their help. To our clients: we truly appreciate your feedback. Thank you for taking the time to share your opinion. Jim Siemianowski Director, Evaluation, Quality Management, and Improvement (EQMI) October 2015
vi
Acknowledgements
The Connecticut Department of Mental Health and Addiction Services (DMHAS) thanks everyone who completed the survey and provided their insights regarding the quality of our service system. Additionally, we would also like to recognize the work of the provider community and their continuing assistance with the implementation of this survey project. This year, several Evaluation, Quality Management and Improvement (EQMI) staff assisted with the Survey Report. Karin Haberlin managed the survey process and liaised with providers over the course of the year. Jeffrey Johnson analyzed the data and produced numerous tables and provider level reports. Kristen Miller analyzed the quantitative data and edited most of the narrative.
Cover photo: Kristen Miller © 2014
vii
Executive Summary
Survey Process
The Connecticut Department of Mental Health and Addiction Services (DMHAS) conducts an annual survey in order to better understand people’s experiences with our public state-operated and community-funded service delivery system. The 23-item version of the Consumer Survey developed as the Mental Health Statistics Improvement Program’s (MHSIP) Consumer-Oriented Mental Health Report Card has now been used for eight years. The survey was offered to consumers/individuals in recovery within the context of their mental health and substance abuse treatment.
• The MHSIP consumer survey was designed to measure consumer satisfaction with services in the following domains:
• The General Satisfaction domain contains three items, and measures consumers’ satisfaction with services received.
• The Access domain contains four items, and measures consumers’ perception of service accessibility.
• The Quality and Appropriateness domain contains seven items, and measures consumers’ perception of the quality and appropriateness of services.
• The Outcome domain contains seven items, and measures consumers’ perception of treatment outcomes as a result of receiving services.
• An item on consumers’ perception of participating in treatment.
• An item on consumer experience of being respected by staff.
In 2005, DMHAS added the Recovery domain to the MHSIP survey. The Recovery domain is composed of five questions which assess consumers’ perception of “recovery oriented services.” This addition provides DMHAS with valuable information regarding our success in implementing a recovery-oriented service system.
Quality of Life
Fiscal Year 2015 is the eighth year that DMHAS has encouraged the use of the WHOQOL-BREF Quality of Life (hereafter QOL) instrument, which is a widely used, standardized quality of life tool developed by the World Health Organization. The QOL is a 26 question tool that measures consumer satisfaction with the quality of his/her life in the following domains: physical, psychological, social relationships, and environment. DMHAS received 2,348 QOL responses during Fiscal Year 2015. Results may be found on page 63 of this report.
Health Outcomes
In SFY2011, DMHAS piloted a Health Outcomes survey that contained eight questions taken from the Behavioral Risk Factor Surveillance System (BRFSS). The BRFSS is the world’s largest, on-going telephone health survey system, tracking health conditions and risk behaviors in all fifty states. 1 Since SFY2012, DMHAS has made the Health Outcomes survey available to all providers who wish to administer it. The survey is available in English and Spanish. The questions cover the topics of body mass index (BMI), chronic health conditions, overall health from physical and psychological
1 See http://www.cdc.gov/brfss/ for more information on this instrument.
viii
perspectives, and drinking habits. A total of 3,382 surveys were completed in SFY2015. Results may be found starting on page 74 of this report.
Findings
Most of our consumers were satisfied with the treatment services that were being provided to them through our provider network. Connecticut respondents reported levels of satisfaction higher than the U.S. national averages in all Consumer Satisfaction Survey domains.2
Survey Demographics
Statewide, a total of 25,559 surveys were returned by 106 providers within the DMHAS network of care.
• Slightly more than half (56%) of the respondents were men and 42% were women. Fewer than 3% percent of the respondents did not identify their gender.
• Just over half (57%) of the respondents were White and 18% were African-American/Black. Approximately 12% fell into the “Other” category, which rolled up several less frequent racial categories. Approximately 9% did not identify their race.
• 22% of the respondents identified themselves as Hispanic, and 21% chose not to identify whether or not they were of Latino/a origin (called Ethnicity in the survey).
• The largest number of survey respondents fell between the ages of 35-54 (approximately 44%); as the average age of a DMHAS client is 38 years old, this is not surprising.
• One third (33%) of the survey sample responded to the survey within the outpatient setting; 10% from medication assisted treatment programs; 12% from residential programs; 6% from intensive outpatient programs; 8% from case management services; and 9% in employment or social rehabilitation programs. The remaining 22% of respondents responded to the survey from other levels of care or reported from agencies that did not include program information in the survey data.
• Slightly more surveys were collected from people receiving services from Mental Health programs (44%) than from people receiving services from Substance Use programs (40%). The remaining portion of surveys did not contain enough program information to categorize.
• Additionally, this was the sixth year in which respondents were asked to self-report their length of stay in treatment. Forty-one percent reported a stay of less than a year, and just over 13% reported a stay of more than one, but less than two years. Sixteen percent reported more than two years but less than 5 years and about 24% reported stays of more than five years.
2 2014 CMHS Uniform Reporting System Output Tables. CMHS Uniform Reporting System - 2014 State Mental Health Measures.
Retrieved on October 15, 2015 from <http://wwwdasis.samhsa.gov/dasis2/URS/Connecticut.pdf>.
ix
Statewide Satisfaction by MHSIP Domains
DMHAS measures satisfaction through the MHSIP Consumer Survey domains. The percentage of consumers satisfied with services has remained relatively constant over the past eight years, and in FY 2015, the percentage of clients who reported satisfaction with services in each domain changed by no more than 2% from last year. Over the last eight years, consumers have consistently reported being most satisfied with the level of family participation in treatment, and with quality and appropriateness in care.
• Over 91% of consumers responded positively in the Participation in Treatment and Quality and Appropriateness domains. Additionally, approximately 90% of consumers indicated a positive response in the General Satisfaction domain.
• Approximately 90% agreed with the statement, “My wishes are respected about the amount of family involvement I want in my treatment.” (This question comprises the Respect Domain.)
• In FY 2015, 85% expressed satisfaction with Access to services. Eighty-two percent (82%) of consumers were satisfied with perceived Outcomes.
• The lowest degree of satisfaction was reported in the Recovery domain, where approximately 79% of respondents indicated satisfaction.
x
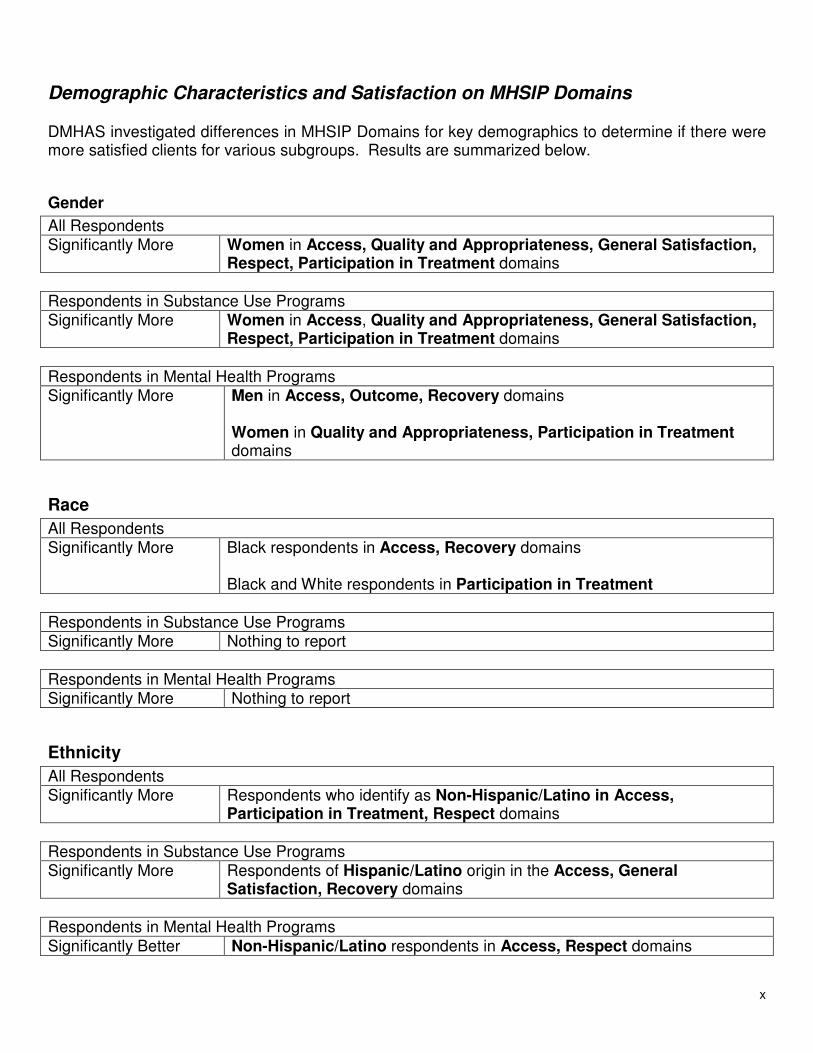
Demographic Characteristics and Satisfaction on MHSIP Domains
DMHAS investigated differences in MHSIP Domains for key demographics to determine if there were more satisfied clients for various subgroups. Results are summarized below.
Gender
All Respondents Significantly More Women in Access, Quality and Appropriateness, General Satisfaction,
Respect, Participation in Treatment domains
Respondents in Substance Use Programs Significantly More Women in Access, Quality and Appropriateness, General Satisfaction,
Respect, Participation in Treatment domains
Respondents in Mental Health Programs Significantly More Men in Access, Outcome, Recovery domains
Women in Quality and Appropriateness, Participation in Treatment domains
Race
All Respondents Significantly More Black respondents in Access, Recovery domains
Black and White respondents in Participation in Treatment
Respondents in Substance Use Programs Significantly More Nothing to report
Respondents in Mental Health Programs Significantly More Nothing to report
Ethnicity
All Respondents Significantly More Respondents who identify as Non-Hispanic/Latino in Access,
Participation in Treatment, Respect domains Respondents in Substance Use Programs Significantly More Respondents of Hispanic/Latino origin in the Access, General
Satisfaction, Recovery domains Respondents in Mental Health Programs
Significantly Better Non-Hispanic/Latino respondents in Access, Respect domains
xi
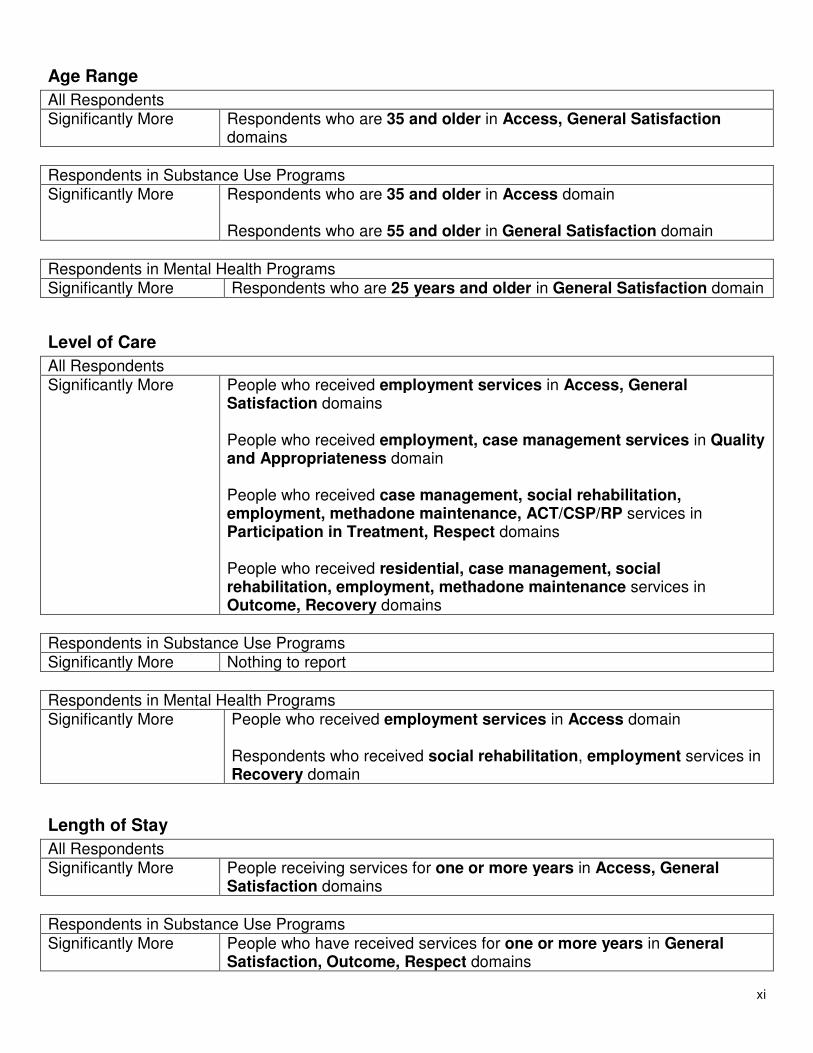
Age Range
All Respondents Significantly More Respondents who are 35 and older in Access, General Satisfaction
domains Respondents in Substance Use Programs Significantly More Respondents who are 35 and older in Access domain
Respondents who are 55 and older in General Satisfaction domain
Respondents in Mental Health Programs Significantly More Respondents who are 25 years and older in General Satisfaction domain
Level of Care
All Respondents Significantly More People who received employment services in Access, General
Satisfaction domains People who received employment, case management services in Quality and Appropriateness domain People who received case management, social rehabilitation, employment, methadone maintenance, ACT/CSP/RP services in Participation in Treatment, Respect domains People who received residential, case management, social rehabilitation, employment, methadone maintenance services in Outcome, Recovery domains
Respondents in Substance Use Programs Significantly More Nothing to report
Respondents in Mental Health Programs Significantly More People who received employment services in Access domain
Respondents who received social rehabilitation, employment services in Recovery domain
Length of Stay
All Respondents Significantly More People receiving services for one or more years in Access, General
Satisfaction domains Respondents in Substance Use Programs Significantly More People who have received services for one or more years in General
Satisfaction, Outcome, Respect domains
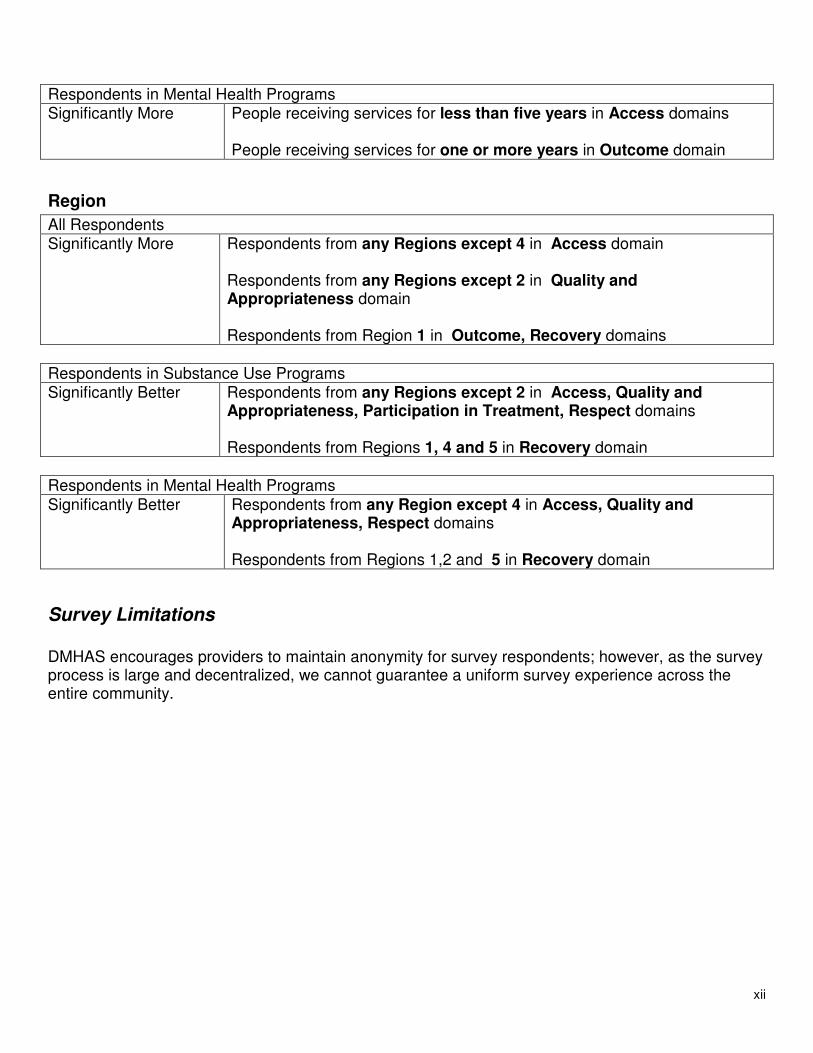
xii
Respondents in Mental Health Programs Significantly More People receiving services for less than five years in Access domains
People receiving services for one or more years in Outcome domain
Region
All Respondents Significantly More Respondents from any Regions except 4 in Access domain
Respondents from any Regions except 2 in Quality and Appropriateness domain Respondents from Region 1 in Outcome, Recovery domains
Respondents in Substance Use Programs Significantly Better Respondents from any Regions except 2 in Access, Quality and
Appropriateness, Participation in Treatment, Respect domains Respondents from Regions 1, 4 and 5 in Recovery domain
Respondents in Mental Health Programs
Significantly Better Respondents from any Region except 4 in Access, Quality and Appropriateness, Respect domains Respondents from Regions 1,2 and 5 in Recovery domain
Survey Limitations
DMHAS encourages providers to maintain anonymity for survey respondents; however, as the survey process is large and decentralized, we cannot guarantee a uniform survey experience across the entire community.
13
Introduction
Consumer Satisfaction Survey SFY 2015 (July 1, 2014– June 30, 2015)
Purpose
The purpose of the consumer satisfaction survey is to assess consumers’ satisfaction with the services being provided in Connecticut’s system of care for people living with Mental Health and Substance Use disorders.
Organization of the Report
In this report, we endeavor to document the views of people served in both Mental Health (MH) and Substance Use (SU) treatment programs within DMHAS’ statewide provider network. Contained within are the customary annual survey results, which include survey demographics and statewide satisfaction by MHSIP domains, as well as additional analyses of the optional Quality of Life data and consumer comments.
Contact Information
If you have any questions, concerns, suggestions, or recommendations, please contact:
Jim Siemianowski Director, Evaluation, Quality Management and Improvement Connecticut Department of Mental Health and Addiction Services 410 Capitol Avenue, 4th Floor, Hartford, CT 06134 (860) 418-6810 [email protected]
14
Methodology
Measures
The 20153 consumer survey consists of 28 items, rated on a 5-point Likert scale. A score of “1” represents strong agreement with an item; “5” strong disagreement; and “3” is a neutral response. The responses are labeled: Strongly Agree, Agree, Neutral, Disagree, Strongly Disagree, and Not Applicable.
• The Mental Health Statistics Improvement Program (MHSIP) consumer satisfaction survey measures consumer satisfaction with services in the following domains:
• The General Satisfaction domain consists of items 1-3, and measures consumers’ satisfaction with services received. A consumer had to complete at least 2 items for the domain score to be calculated.
• The Access domain consists of items 4-7, and measures consumers’ perceptions about how easily accessible services were. A consumer had to complete at least 2 items for the domain score to be calculated.
• The Quality and Appropriateness domain consists of items 8 and 10-15, and measures consumers’ perceptions of the quality and appropriateness of services. A consumer had to complete at least 4 items for the domain score to be calculated.
• The Outcome domain consists of items 17-23, and measures consumers’ perceptions about treatment outcomes as a result of receiving services. A consumer had to complete at least 4 items for the domain score to be calculated.
• One item covering consumers’ perceptions of his/her Participation in Treatment.
• One item covering consumers’ experiences with staff Respect.
In addition to the MHSIP’s 23 items, the Connecticut Department of Mental Health and Addiction Services added the following:
• A Recovery domain consisting of five questions (24-28) that assess consumers’ perceptions of “recovery oriented services”. A consumer had to answer at least 3 items for the domain score to be calculated.
• Demographic questions, where respondents indicate their gender, race, age, and ethnicity. Two new questions were added in FY 2007; they ask respondents to self-report their reason for receiving services (Mental Health only, Substance Use only, both Mental Health and Substance Use), and their length of time in service (less than one year, 12 months to two years, more than two years, and more than five years).
• Space for consumers to add optional additional comments.
3 Similar to previous years, the survey contains 23 items from the MHSIP consumer satisfaction survey. Please refer to
Appendix 1.5 for a copy of the MHSIP survey.
15
Administration
DMHAS provided agencies with guidelines for survey implementation. Generally, provider staff administered the consumer survey, but in some cases, consumers, peers, or other neutral parties assisted with the data collection. Providers administered the survey to people who received either Mental Health or Substance Use treatment services between July 1, 2014 and June 30, 2015. Most of the surveys were collected between January 2015 and June 2015. The survey was administered in the following levels of care:
• Mental Health Case Management, except Homeless Outreach
• Mental Health Outpatient (Clinical)
• Mental Health Partial Hospitalization
• Mental Health Residential, including Group Residential, Supervised Apts., Supported Apts., Supportive Housing, Transitional Residential
• Mental Health Social Rehabilitation
• Mental Health or Substance Abuse Employment Services
• Substance Use Medication Assisted Treatment (Methadone Maintenance and Buprenorphine)
• Substance Abuse Intensive Outpatient
• Substance Abuse Partial Hospitalization
• Substance Abuse Outpatient, including Gambling
• Substance Abuse Residential including Intensive, Intermediate, Long-Term Treatment, Long-Term Care, Transitional Residential/Halfway House
• Substance Abuse Recovery House
• Substance Abuse Case Management
Sample Selection
DMHAS asked providers to calculate survey sample sizes according to the number of unduplicated consumers served by the provider during the first quarter of Fiscal Year 2014 (July 1, 2013 through September 30, 2013).4 The sample size calculation was based on a 95% confidence level and 7% confidence interval.5 The table of expected versus actual surveys
4 The unduplicated counts were obtained from the Unduplicated Clients report in the DDaP Data Warehouse.
5 Explanation taken from http://williamgodden.com/tutorial.pdf and used with permission:
The confidence interval is the plus-or-minus figure usually reported in newspaper or television opinion poll results. For example, if you use a confidence interval of 4 and 47% percent of your sample picks a certain answer you can be "sure" that if you had asked the question of the entire relevant population, between 43% (47-4) and 51% (47+4) would have picked that answer.
The confidence level tells you how sure you can be. It is expressed as a percentage and represents how often the true percentage of the population (those who would pick that certain answer if you asked everyone) would lie within the confidence interval. The 95% confidence level means you can be 95% certain; that is, in 95 out of 100 situations, you would find that the true whole-population percentage fell within the confidence interval. Most researchers use the 95% confidence level. When you put the confidence level and the confidence interval together, you can say that you are 95% sure that the true percentage of the population is between 43% and 51%.
There is a trade-off between confidence interval and confidence level. For a given sample size (number of survey respondents), the wider the confidence interval, the more certain you can be that the whole population’s answers would be within that range. On the other hand the narrower the confidence interval, the less sure you would be of having bracketed the “real” whole-population percentage. For example, if you asked a sample of 1000 people in a city which brand of cola they preferred, and 60% said Brand A, you can be very certain that between 40 and 80% of all the people in the city actually do
16
submitted for SFY2015 can be found in Appendix 2. DMHAS provided agencies with a guide and as-needed technical assistance for determining correct sample sizes.6
Data Entry
SFY2015 is the fourth year that DMHAS used the Consumer Survey application within the DMHAS Data Performance System (DDaP) portal to allow providers to enter their survey data directly into the DDaP system. As the surveys are anonymous, they are not connected to other client data in the system; however, if the agency identifies which program the survey comes from, some program related information (program type, level of care, region, etc.) that is in DDaP can now be connected to each survey. This reduces the data entry burden on the agency, while at the same time increasing the accuracy of identifying this information for each survey.
Analysis
Consumer Survey Demographic and other simple frequency analyses were performed in both VB.NET and SPSS v 22 by two staff, and compared for accuracy. The statistical analyses use the domain score (an average of the response values for the questions that comprise that domain. The domain score is a number between 1 and 5). The domain score then gets converted to a satisfaction score: domain scores that are less than 2.5 fall into the “Satisfied” category, scores between 2.5 – 3.5 fall into the “Neutral” category, and scores greater than 3.5 fall into the “Unsatisfied” category. The value that is the focus of this report is the percentage of clients who fall into the “Satisfied” category.
For example, we report that 86.6% of clients in MH programs were satisfied with Access to services (Access Domain), compared to 82.0% of clients in SU programs. The statistic that indicates that more clients in the MH programs were satisfied is based on a chi-square (χ2) test. The chi-square statistic evaluates whether the distributions of categorical variables differ from each other. In this case, it refers to whether or not the number of satisfied clients in MH programs differ significantly from the number of satisfied clients in SU programs. All analyses of difference were evaluated at alpha = .05 with a correction for multiple comparisons. This means that there is, at most, 5 in 100 chances (1 in 20 chances) that a difference is identified as a significant difference when in fact it is not. SPSS was used for these analyses.
Quality of Life The responses from the QOL survey are also used to calculate domain scores. However, unlike the consumer survey scores, which are nominal level data (satisfied, neutral, not
prefer that brand, but you would be far less sure that the actual Brand-A-preference % for all residents would fall between 59 and 61%. 6 The guide may be found on the DMHAS Consumer Survey web page: http://www.ct.gov/dmhas/consumersurvey
17
satisfied), the calculation of QOL domain scores ultimately produces a scaled score (scale of 1-100). This means that they may be compared using t-tests or analysis of variance (ANOVA) to determine if the scores for different groups are significantly different. These analyses of difference were evaluated at alpha = .01, which is more conservative than the .05 level used in the Consumer Survey analyses, but accounts for potential increases in the family wise error rate due to multiple comparisons. This means that there is a 1 in 100 chance that a difference is identified as a significant difference when in fact it is not. SPSS was used for these analyses. Health Outcomes The Health Outcomes data were analyzed for significant differences using the chi-square statistic described in the Consumer Survey section above.
Consumer Survey Results
This is the second year in which there is a slight change in the wording of the Consumer Survey results. In previous years the results have been presented in terms of which group was “more satisfied”: e.g., women were significantly more satisfied than men in the Access domain. The chi-square analysis identifies differences between the number of clients in different groups, thus the accurate interpretation is that more women than men were in the satisfied category in the Access domain. The presentation of the survey results in the Group Differences section follows this update from last year, to reflect this more accurate description.
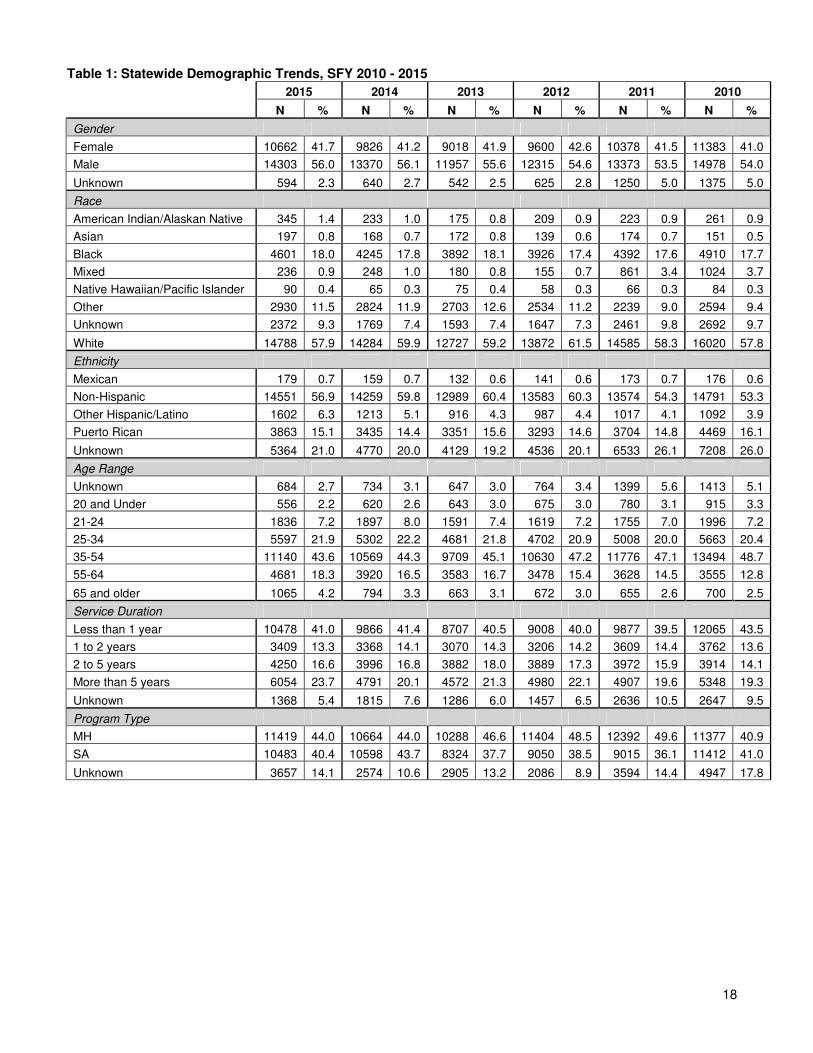
Statewide, a total of 25,559 surveys were returned by 106 providers within the DMHAS network of care; 84% of all surveys were collected at the program level, rather than at the agency level. (In SFY2014, 89% of the surveys were submitted with program information.) DMHAS has historically encouraged this manner of distribution, to ensure the most meaningful and useful information. See Table 1 for a summary of statewide demographic trends over the past five years.
18
Table 1: Statewide Demographic Trends, SFY 2010 - 2015 2015 2014 2013 2012 2011 2010
N % N % N % N % N % N %
Gender
Female 10662 41.7 9826 41.2 9018 41.9 9600 42.6 10378 41.5 11383 41.0
Male 14303 56.0 13370 56.1 11957 55.6 12315 54.6 13373 53.5 14978 54.0
Unknown 594 2.3 640 2.7 542 2.5 625 2.8 1250 5.0 1375 5.0
Race
American Indian/Alaskan Native 345 1.4 233 1.0 175 0.8 209 0.9 223 0.9 261 0.9
Asian 197 0.8 168 0.7 172 0.8 139 0.6 174 0.7 151 0.5
Black 4601 18.0 4245 17.8 3892 18.1 3926 17.4 4392 17.6 4910 17.7
Mixed 236 0.9 248 1.0 180 0.8 155 0.7 861 3.4 1024 3.7
Native Hawaiian/Pacific Islander 90 0.4 65 0.3 75 0.4 58 0.3 66 0.3 84 0.3
Other 2930 11.5 2824 11.9 2703 12.6 2534 11.2 2239 9.0 2594 9.4
Unknown 2372 9.3 1769 7.4 1593 7.4 1647 7.3 2461 9.8 2692 9.7
White 14788 57.9 14284 59.9 12727 59.2 13872 61.5 14585 58.3 16020 57.8
Ethnicity
Mexican 179 0.7 159 0.7 132 0.6 141 0.6 173 0.7 176 0.6
Non-Hispanic 14551 56.9 14259 59.8 12989 60.4 13583 60.3 13574 54.3 14791 53.3
Other Hispanic/Latino 1602 6.3 1213 5.1 916 4.3 987 4.4 1017 4.1 1092 3.9
Puerto Rican 3863 15.1 3435 14.4 3351 15.6 3293 14.6 3704 14.8 4469 16.1
Unknown 5364 21.0 4770 20.0 4129 19.2 4536 20.1 6533 26.1 7208 26.0
Age Range
Unknown 684 2.7 734 3.1 647 3.0 764 3.4 1399 5.6 1413 5.1
20 and Under 556 2.2 620 2.6 643 3.0 675 3.0 780 3.1 915 3.3
21-24 1836 7.2 1897 8.0 1591 7.4 1619 7.2 1755 7.0 1996 7.2
25-34 5597 21.9 5302 22.2 4681 21.8 4702 20.9 5008 20.0 5663 20.4
35-54 11140 43.6 10569 44.3 9709 45.1 10630 47.2 11776 47.1 13494 48.7
55-64 4681 18.3 3920 16.5 3583 16.7 3478 15.4 3628 14.5 3555 12.8
65 and older 1065 4.2 794 3.3 663 3.1 672 3.0 655 2.6 700 2.5
Service Duration
Less than 1 year 10478 41.0 9866 41.4 8707 40.5 9008 40.0 9877 39.5 12065 43.5
1 to 2 years 3409 13.3 3368 14.1 3070 14.3 3206 14.2 3609 14.4 3762 13.6
2 to 5 years 4250 16.6 3996 16.8 3882 18.0 3889 17.3 3972 15.9 3914 14.1
More than 5 years 6054 23.7 4791 20.1 4572 21.3 4980 22.1 4907 19.6 5348 19.3
Unknown 1368 5.4 1815 7.6 1286 6.0 1457 6.5 2636 10.5 2647 9.5
Program Type
MH 11419 44.0 10664 44.0 10288 46.6 11404 48.5 12392 49.6 11377 40.9
SA 10483 40.4 10598 43.7 8324 37.7 9050 38.5 9015 36.1 11412 41.0
Unknown 3657 14.1 2574 10.6 2905 13.2 2086 8.9 3594 14.4 4947 17.8
19
2015 2014 2013 2012 2011 2010
N % N % N % N % N % N %
Level Of Care
MH ACT 261 1.0 349 1.5 217 1.0 206 0.9 165 0.7 191 0.7
MH Case Management 1635 6.3 1371 5.7 1198 5.5 1527 6.6 1597 6.4 2136 7.7
MH Community Support 986 3.8 1107 4.6 1003 4.6 1166 5.0 880 3.5 559 2.0
MH Crisis Services 26 0.1 34 0.1 26 0.1 45 0.2 116 0.5 24 0.1
MH Education Support 87 0.3 105 0.4 110 0.5 83 0.4 68 0.3 39 0.1
MH Employment Services 934 3.6 944 3.9 1046 4.8 1079 4.7 1189 4.8 973 3.5
MH Forensics Community-based 23 0.1 65 0.3 73 0.3 53 0.2 16 0.1 37 0.1
MH Housing Services 1 0.0 3 0.0 2 0.0 4 0.0 3 0.0 88 0.3
MH Inpatient Services 2 0.0 9 0.0 17 0.1 15 0.1 0 0.0 0 0.0
MH IOP 65 0.3 95 0.4 141 0.7 355 1.5 166 0.7 18 0.1
MH Other 77 0.3 47 0.2 18 0.1 15 0.1 16 0.1 20 0.1
MH Outpatient 4928 19.1 3943 16.4 3804 17.5 4473 19.3 5179 20.7 4317 15.5
MH Recovery Support 20 0.1 15 0.1 14 0.1 13 0.1 31 0.1 23 0.1
MH Residential Services 1202 4.7 1251 5.2 1298 6.0 1216 5.3 1258 5.0 1279 4.6
MH Social Rehabilitation 1315 5.1 1489 6.2 1410 6.5 1606 6.9 1707 6.8 1724 6.2
SA Case Management 360 1.4 311 1.3 170 0.8 183 0.8 0 0.0 170 0.6
SA Employment Services 55 0.2 70 0.3 57 0.3 43 0.2 59 0.2 73 0.3
SA Forensics Community-based 34 0.1 36 0.2 2 0.0 0 0.0 1 0.0 38 0.1
SA Inpatient Services 183 0.7 126 0.5 115 0.5 119 0.5 156 0.6 175 0.6
SA IOP 1403 5.4 1312 5.5 805 3.7 1074 4.6 676 2.7 1344 4.8 SA Medication Assisted Treatment 2651 10.3 2973 12.4 2806 12.9 2544 11.0 3236 12.9 3554 12.8
SA Other 1 0.0 9 0.0 16 0.1 13 0.1 0 0.0 35 0.1
SA Outpatient 3647 14.1 3244 13.5 2743 12.6 3116 13.4 2365 9.5 3193 11.5
SA PHP 478 1.9 458 1.9 274 1.3 278 1.2 502 2.0 360 1.3
SA Residential Services 1814 7.0 2104 8.8 1440 6.6 1864 8.0 2020 8.1 2470 8.9
Unknown 3657 14.2 2574 10.7 2905 13.4 2086 9.0 3594 14.4 4947 17.8
20
Demographics of Statewide Sample
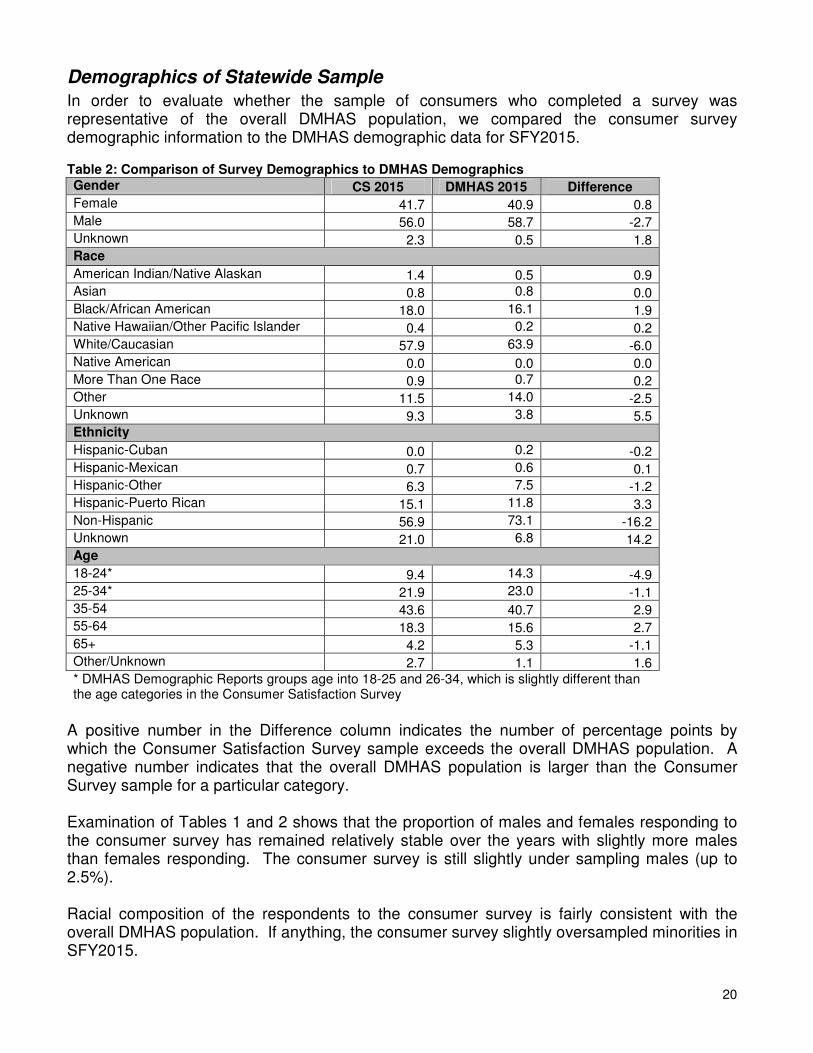
In order to evaluate whether the sample of consumers who completed a survey was representative of the overall DMHAS population, we compared the consumer survey demographic information to the DMHAS demographic data for SFY2015. Table 2: Comparison of Survey Demographics to DMHAS Demographics
Gender CS 2015 DMHAS 2015 Difference
Female 41.7 40.9 0.8
Male 56.0 58.7 -2.7
Unknown 2.3 0.5 1.8 Race
American Indian/Native Alaskan 1.4 0.5 0.9
Asian 0.8 0.8 0.0
Black/African American 18.0 16.1 1.9
Native Hawaiian/Other Pacific Islander 0.4 0.2 0.2
White/Caucasian 57.9 63.9 -6.0
Native American 0.0 0.0 0.0
More Than One Race 0.9 0.7 0.2
Other 11.5 14.0 -2.5
Unknown 9.3 3.8 5.5 Ethnicity
Hispanic-Cuban 0.0 0.2 -0.2
Hispanic-Mexican 0.7 0.6 0.1
Hispanic-Other 6.3 7.5 -1.2
Hispanic-Puerto Rican 15.1 11.8 3.3
Non-Hispanic 56.9 73.1 -16.2
Unknown 21.0 6.8 14.2 Age
18-24* 9.4 14.3 -4.9
25-34* 21.9 23.0 -1.1
35-54 43.6 40.7 2.9
55-64 18.3 15.6 2.7
65+ 4.2 5.3 -1.1
Other/Unknown 2.7 1.1 1.6
* DMHAS Demographic Reports groups age into 18-25 and 26-34, which is slightly different than the age categories in the Consumer Satisfaction Survey
A positive number in the Difference column indicates the number of percentage points by which the Consumer Satisfaction Survey sample exceeds the overall DMHAS population. A negative number indicates that the overall DMHAS population is larger than the Consumer Survey sample for a particular category. Examination of Tables 1 and 2 shows that the proportion of males and females responding to the consumer survey has remained relatively stable over the years with slightly more males than females responding. The consumer survey is still slightly under sampling males (up to 2.5%). Racial composition of the respondents to the consumer survey is fairly consistent with the overall DMHAS population. If anything, the consumer survey slightly oversampled minorities in SFY2015.
21
With regard to ethnicity, at first glance, the consumer survey appears to sample a smaller proportion of non-Hispanic consumers; however, 21% of the survey respondents declined to identify his or her ethnicity so the consumer survey may be closer to the DMHAS population than these data indicate. In the age category, the younger age groups (18-24 & 25-34) and the oldest age group (65+) are under sampled, while the middle (and largest) age group (35-54) is slightly oversampled this year. Increased effort is being made to encourage consumer satisfaction survey participation within the Young Adult Services programs, which saw 35% of clients participate in the survey in SFY15. In conclusion, the demographics of the group of consumers who answered the survey in SFY2015 are generally representative of the larger DMHAS population of clients.
Satisfaction with Services
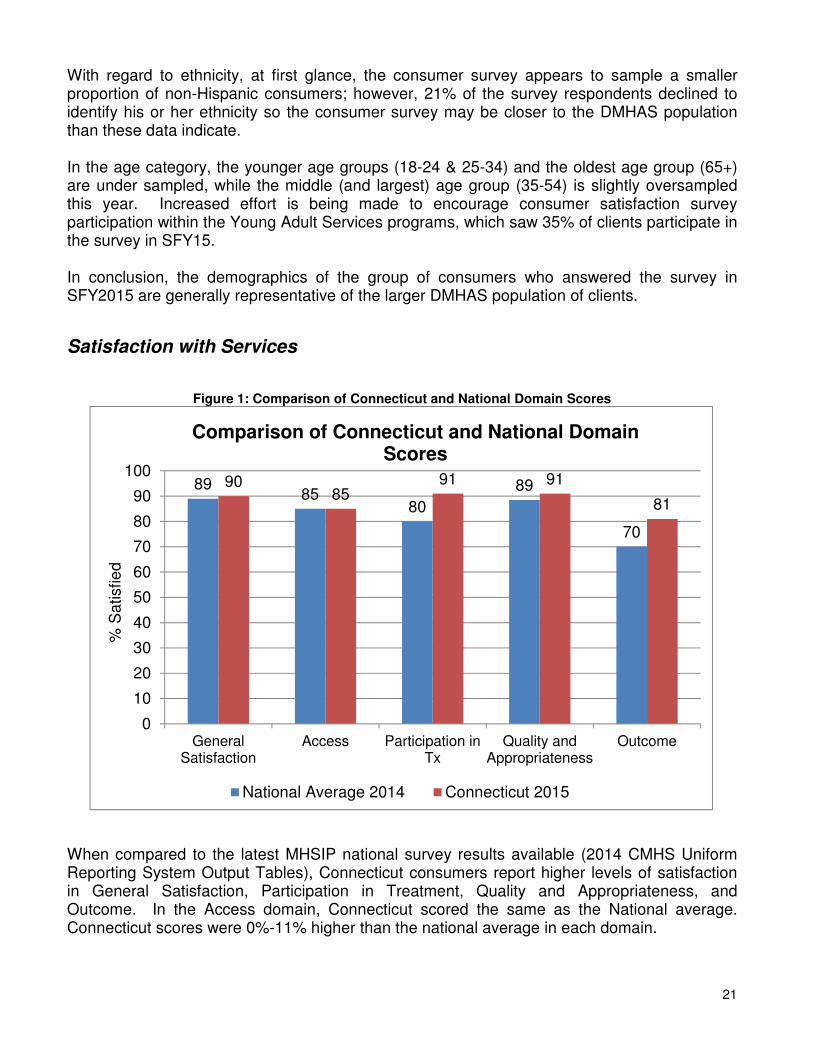
Figure 1: Comparison of Connecticut and National Domain Scores
When compared to the latest MHSIP national survey results available (2014 CMHS Uniform Reporting System Output Tables), Connecticut consumers report higher levels of satisfaction in General Satisfaction, Participation in Treatment, Quality and Appropriateness, and Outcome. In the Access domain, Connecticut scored the same as the National average. Connecticut scores were 0%-11% higher than the national average in each domain.
8985
80
89
70
9085
91 91
81
0
10
20
30
40
50
60
70
80
90
100
GeneralSatisfaction
Access Participation inTx
Quality andAppropriateness
Outcome
% S
atisfie
d
Comparison of Connecticut and National Domain Scores
National Average 2014 Connecticut 2015
22
Trends over Time
Statewide Satisfaction Trends by Domain
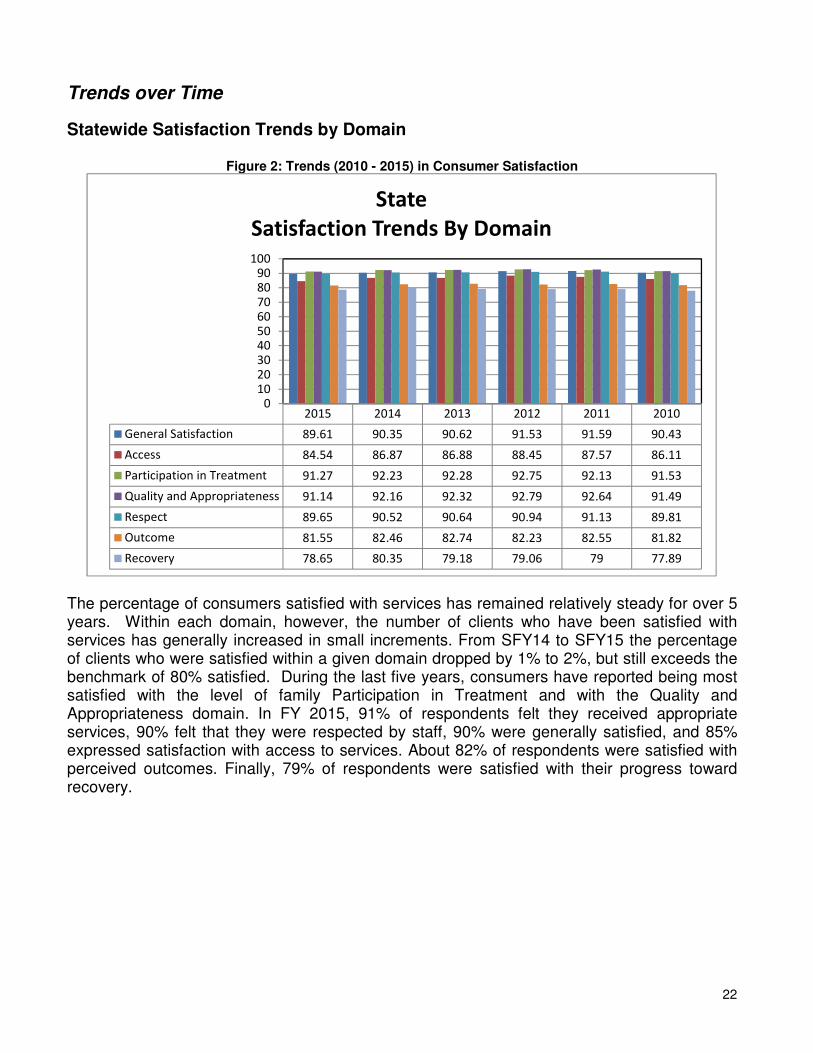
Figure 2: Trends (2010 - 2015) in Consumer Satisfaction
The percentage of consumers satisfied with services has remained relatively steady for over 5 years. Within each domain, however, the number of clients who have been satisfied with services has generally increased in small increments. From SFY14 to SFY15 the percentage of clients who were satisfied within a given domain dropped by 1% to 2%, but still exceeds the benchmark of 80% satisfied. During the last five years, consumers have reported being most satisfied with the level of family Participation in Treatment and with the Quality and Appropriateness domain. In FY 2015, 91% of respondents felt they received appropriate services, 90% felt that they were respected by staff, 90% were generally satisfied, and 85% expressed satisfaction with access to services. About 82% of respondents were satisfied with perceived outcomes. Finally, 79% of respondents were satisfied with their progress toward recovery.
2015 2014 2013 2012 2011 2010
General Satisfaction 89.61 90.35 90.62 91.53 91.59 90.43
Access 84.54 86.87 86.88 88.45 87.57 86.11
Participation in Treatment 91.27 92.23 92.28 92.75 92.13 91.53
Quality and Appropriateness 91.14 92.16 92.32 92.79 92.64 91.49
Respect 89.65 90.52 90.64 90.94 91.13 89.81
Outcome 81.55 82.46 82.74 82.23 82.55 81.82
Recovery 78.65 80.35 79.18 79.06 79 77.89
0
10
20
30
40
50
60
70
80
90
100
State
Satisfaction Trends By Domain
23
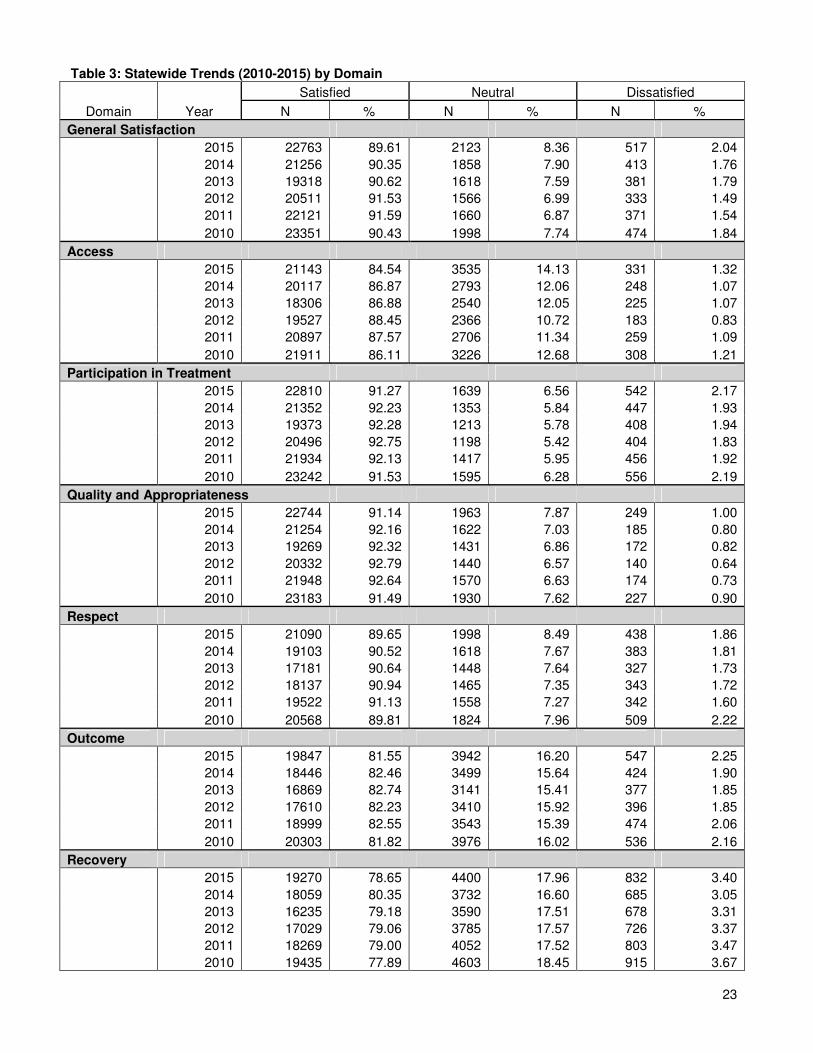
Table 3: Statewide Trends (2010-2015) by Domain
Satisfied Neutral Dissatisfied
Domain Year N % N % N %
General Satisfaction
2015 22763 89.61 2123 8.36 517 2.04
2014 21256 90.35 1858 7.90 413 1.76
2013 19318 90.62 1618 7.59 381 1.79
2012 20511 91.53 1566 6.99 333 1.49
2011 22121 91.59 1660 6.87 371 1.54
2010 23351 90.43 1998 7.74 474 1.84
Access
2015 21143 84.54 3535 14.13 331 1.32
2014 20117 86.87 2793 12.06 248 1.07
2013 18306 86.88 2540 12.05 225 1.07
2012 19527 88.45 2366 10.72 183 0.83
2011 20897 87.57 2706 11.34 259 1.09
2010 21911 86.11 3226 12.68 308 1.21
Participation in Treatment
2015 22810 91.27 1639 6.56 542 2.17
2014 21352 92.23 1353 5.84 447 1.93
2013 19373 92.28 1213 5.78 408 1.94
2012 20496 92.75 1198 5.42 404 1.83
2011 21934 92.13 1417 5.95 456 1.92
2010 23242 91.53 1595 6.28 556 2.19
Quality and Appropriateness
2015 22744 91.14 1963 7.87 249 1.00
2014 21254 92.16 1622 7.03 185 0.80
2013 19269 92.32 1431 6.86 172 0.82
2012 20332 92.79 1440 6.57 140 0.64
2011 21948 92.64 1570 6.63 174 0.73
2010 23183 91.49 1930 7.62 227 0.90
Respect
2015 21090 89.65 1998 8.49 438 1.86
2014 19103 90.52 1618 7.67 383 1.81
2013 17181 90.64 1448 7.64 327 1.73
2012 18137 90.94 1465 7.35 343 1.72
2011 19522 91.13 1558 7.27 342 1.60
2010 20568 89.81 1824 7.96 509 2.22
Outcome
2015 19847 81.55 3942 16.20 547 2.25
2014 18446 82.46 3499 15.64 424 1.90
2013 16869 82.74 3141 15.41 377 1.85
2012 17610 82.23 3410 15.92 396 1.85
2011 18999 82.55 3543 15.39 474 2.06
2010 20303 81.82 3976 16.02 536 2.16
Recovery
2015 19270 78.65 4400 17.96 832 3.40
2014 18059 80.35 3732 16.60 685 3.05
2013 16235 79.18 3590 17.51 678 3.31
2012 17029 79.06 3785 17.57 726 3.37
2011 18269 79.00 4052 17.52 803 3.47
2010 19435 77.89 4603 18.45 915 3.67
24
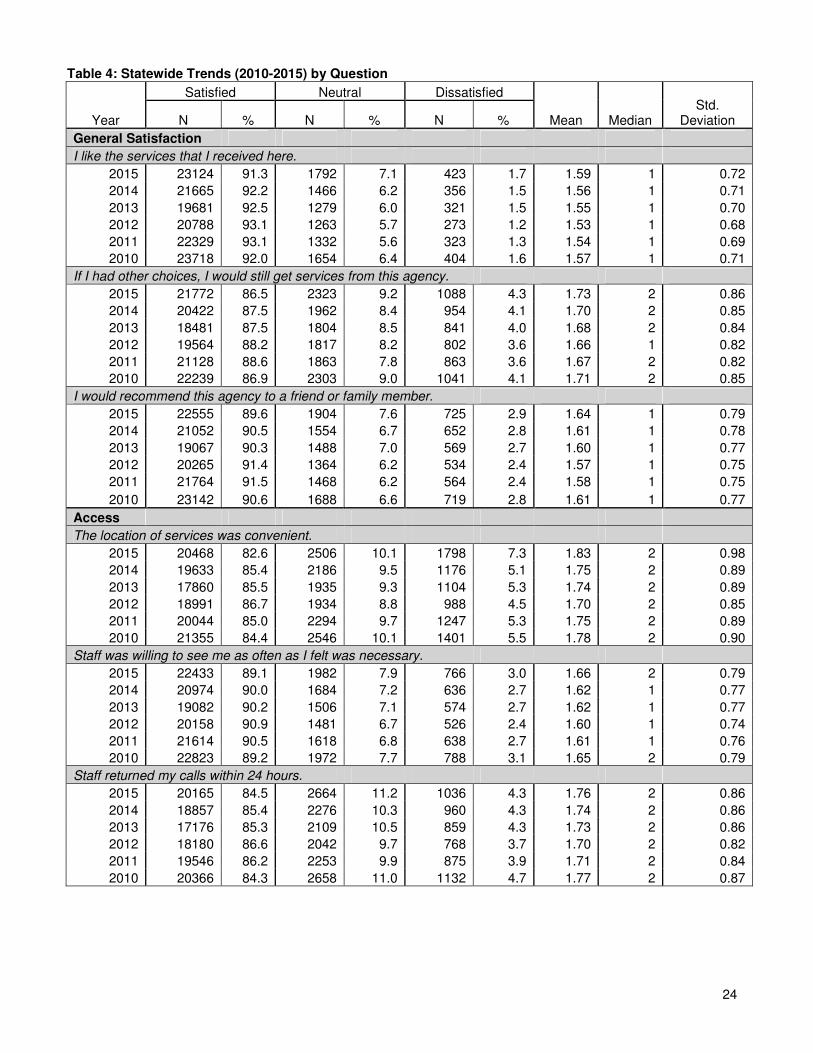
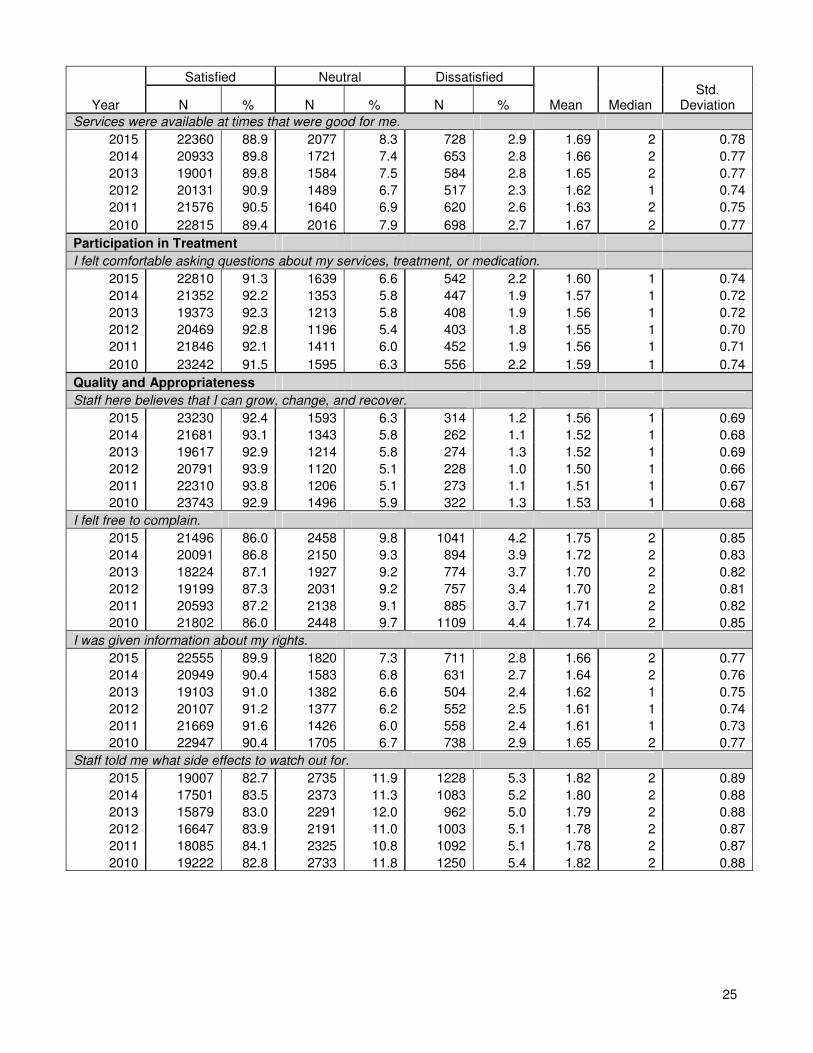
Table 4: Statewide Trends (2010-2015) by Question
Satisfied Neutral Dissatisfied Std.
Deviation Year N % N % N % Mean Median
General Satisfaction
I like the services that I received here.
2015 23124 91.3 1792 7.1 423 1.7 1.59 1 0.72
2014 21665 92.2 1466 6.2 356 1.5 1.56 1 0.71
2013 19681 92.5 1279 6.0 321 1.5 1.55 1 0.70
2012 20788 93.1 1263 5.7 273 1.2 1.53 1 0.68
2011 22329 93.1 1332 5.6 323 1.3 1.54 1 0.69
2010 23718 92.0 1654 6.4 404 1.6 1.57 1 0.71
If I had other choices, I would still get services from this agency.
2015 21772 86.5 2323 9.2 1088 4.3 1.73 2 0.86
2014 20422 87.5 1962 8.4 954 4.1 1.70 2 0.85
2013 18481 87.5 1804 8.5 841 4.0 1.68 2 0.84
2012 19564 88.2 1817 8.2 802 3.6 1.66 1 0.82
2011 21128 88.6 1863 7.8 863 3.6 1.67 2 0.82
2010 22239 86.9 2303 9.0 1041 4.1 1.71 2 0.85
I would recommend this agency to a friend or family member.
2015 22555 89.6 1904 7.6 725 2.9 1.64 1 0.79
2014 21052 90.5 1554 6.7 652 2.8 1.61 1 0.78
2013 19067 90.3 1488 7.0 569 2.7 1.60 1 0.77
2012 20265 91.4 1364 6.2 534 2.4 1.57 1 0.75
2011 21764 91.5 1468 6.2 564 2.4 1.58 1 0.75
2010 23142 90.6 1688 6.6 719 2.8 1.61 1 0.77
Access
The location of services was convenient.
2015 20468 82.6 2506 10.1 1798 7.3 1.83 2 0.98
2014 19633 85.4 2186 9.5 1176 5.1 1.75 2 0.89
2013 17860 85.5 1935 9.3 1104 5.3 1.74 2 0.89
2012 18991 86.7 1934 8.8 988 4.5 1.70 2 0.85
2011 20044 85.0 2294 9.7 1247 5.3 1.75 2 0.89
2010 21355 84.4 2546 10.1 1401 5.5 1.78 2 0.90
Staff was willing to see me as often as I felt was necessary.
2015 22433 89.1 1982 7.9 766 3.0 1.66 2 0.79
2014 20974 90.0 1684 7.2 636 2.7 1.62 1 0.77
2013 19082 90.2 1506 7.1 574 2.7 1.62 1 0.77
2012 20158 90.9 1481 6.7 526 2.4 1.60 1 0.74
2011 21614 90.5 1618 6.8 638 2.7 1.61 1 0.76
2010 22823 89.2 1972 7.7 788 3.1 1.65 2 0.79
Staff returned my calls within 24 hours.
2015 20165 84.5 2664 11.2 1036 4.3 1.76 2 0.86
2014 18857 85.4 2276 10.3 960 4.3 1.74 2 0.86
2013 17176 85.3 2109 10.5 859 4.3 1.73 2 0.86
2012 18180 86.6 2042 9.7 768 3.7 1.70 2 0.82
2011 19546 86.2 2253 9.9 875 3.9 1.71 2 0.84
2010 20366 84.3 2658 11.0 1132 4.7 1.77 2 0.87
25
Satisfied Neutral Dissatisfied Std.
Deviation Year N % N % N % Mean Median
Services were available at times that were good for me.
2015 22360 88.9 2077 8.3 728 2.9 1.69 2 0.78
2014 20933 89.8 1721 7.4 653 2.8 1.66 2 0.77
2013 19001 89.8 1584 7.5 584 2.8 1.65 2 0.77
2012 20131 90.9 1489 6.7 517 2.3 1.62 1 0.74
2011 21576 90.5 1640 6.9 620 2.6 1.63 2 0.75
2010 22815 89.4 2016 7.9 698 2.7 1.67 2 0.77
Participation in Treatment
I felt comfortable asking questions about my services, treatment, or medication.
2015 22810 91.3 1639 6.6 542 2.2 1.60 1 0.74
2014 21352 92.2 1353 5.8 447 1.9 1.57 1 0.72
2013 19373 92.3 1213 5.8 408 1.9 1.56 1 0.72
2012 20469 92.8 1196 5.4 403 1.8 1.55 1 0.70
2011 21846 92.1 1411 6.0 452 1.9 1.56 1 0.71
2010 23242 91.5 1595 6.3 556 2.2 1.59 1 0.74
Quality and Appropriateness
Staff here believes that I can grow, change, and recover.
2015 23230 92.4 1593 6.3 314 1.2 1.56 1 0.69
2014 21681 93.1 1343 5.8 262 1.1 1.52 1 0.68
2013 19617 92.9 1214 5.8 274 1.3 1.52 1 0.69
2012 20791 93.9 1120 5.1 228 1.0 1.50 1 0.66
2011 22310 93.8 1206 5.1 273 1.1 1.51 1 0.67
2010 23743 92.9 1496 5.9 322 1.3 1.53 1 0.68
I felt free to complain.
2015 21496 86.0 2458 9.8 1041 4.2 1.75 2 0.85
2014 20091 86.8 2150 9.3 894 3.9 1.72 2 0.83
2013 18224 87.1 1927 9.2 774 3.7 1.70 2 0.82
2012 19199 87.3 2031 9.2 757 3.4 1.70 2 0.81
2011 20593 87.2 2138 9.1 885 3.7 1.71 2 0.82
2010 21802 86.0 2448 9.7 1109 4.4 1.74 2 0.85
I was given information about my rights.
2015 22555 89.9 1820 7.3 711 2.8 1.66 2 0.77
2014 20949 90.4 1583 6.8 631 2.7 1.64 2 0.76
2013 19103 91.0 1382 6.6 504 2.4 1.62 1 0.75
2012 20107 91.2 1377 6.2 552 2.5 1.61 1 0.74
2011 21669 91.6 1426 6.0 558 2.4 1.61 1 0.73
2010 22947 90.4 1705 6.7 738 2.9 1.65 2 0.77
Staff told me what side effects to watch out for.
2015 19007 82.7 2735 11.9 1228 5.3 1.82 2 0.89
2014 17501 83.5 2373 11.3 1083 5.2 1.80 2 0.88
2013 15879 83.0 2291 12.0 962 5.0 1.79 2 0.88
2012 16647 83.9 2191 11.0 1003 5.1 1.78 2 0.87
2011 18085 84.1 2325 10.8 1092 5.1 1.78 2 0.87
2010 19222 82.8 2733 11.8 1250 5.4 1.82 2 0.88
26
Satisfied Neutral Dissatisfied Std.
Deviation Year N % N % N % Mean Median
Staff respected my wishes about who is, and who is not, to be given information about my treatment and/or services.
2015 22854 91.6 1616 6.5 473 1.9 1.60 1 0.73
2014 21297 92.4 1320 5.7 427 1.9 1.57 1 0.71
2013 19217 92.2 1225 5.9 395 1.9 1.57 1 0.72
2012 20241 92.7 1216 5.6 387 1.8 1.55 1 0.70
2011 21772 92.5 1328 5.6 437 1.9 1.56 1 0.71
2010 23223 91.6 1578 6.2 544 2.1 1.59 1 0.74
Staff was sensitive to my cultural/ethnic background.
2015 21667 89.5 2129 8.8 419 1.7 1.64 2 0.74
2014 20008 89.7 1891 8.5 399 1.8 1.63 1 0.74
2013 18212 90.0 1683 8.3 332 1.6 1.61 1 0.73
2012 19000 90.2 1711 8.1 342 1.6 1.60 1 0.73
2011 20511 90.0 1874 8.2 415 1.8 1.62 1 0.74
2010 21713 89.0 2220 9.1 463 1.9 1.65 2 0.75
Staff helped me to obtain information I needed so that I could take charge of managing my illness.
2015 21507 89.6 1967 8.2 541 2.3 1.66 2 0.75
2014 20147 90.1 1746 7.8 480 2.1 1.64 2 0.75
2013 18441 90.4 1547 7.6 419 2.1 1.62 2 0.74
2012 19503 90.8 1572 7.3 409 1.9 1.61 1 0.73
2011 20854 90.8 1680 7.3 428 1.9 1.61 1 0.73
2010 22184 89.5 2001 8.1 589 2.4 1.65 2 0.76
Respect
My wishes are respected about the amount of family involvement I want in my treatment.
2015 21090 89.6 1998 8.5 438 1.9 1.66 2 0.74
2014 19103 90.5 1618 7.7 383 1.8 1.63 2 0.73
2013 17181 90.6 1448 7.6 327 1.7 1.61 1 0.73
2012 18111 90.9 1464 7.4 342 1.7 1.60 1 0.72
2011 19436 91.1 1549 7.3 341 1.6 1.60 1 0.71
2010 20568 89.8 1824 8.0 509 2.2 1.64 2 0.75
Outcome
As a result of services I have received from this agency, I deal more effectively with daily problems.
2015 20825 85.0 3005 12.3 661 2.7 1.80 2 0.78
2014 19345 85.7 2636 11.7 581 2.6 1.78 2 0.77
2013 17602 85.7 2374 11.6 563 2.7 1.77 2 0.78
2012 18600 86.4 2360 11.0 566 2.6 1.77 2 0.77
2011 19850 86.2 2591 11.2 598 2.6 1.77 2 0.78
2010 21289 85.3 2920 11.7 748 3.0 1.79 2 0.79
As a result of services I have received from this agency, I am better able to control my life.
2015 20626 84.1 3200 13.1 692 2.8 1.81 2 0.79
2014 19146 85.0 2798 12.4 592 2.6 1.79 2 0.78
2013 17449 85.0 2489 12.1 581 2.8 1.78 2 0.79
2012 18286 85.0 2679 12.4 556 2.6 1.78 2 0.78
2011 19629 85.1 2770 12.0 660 2.9 1.78 2 0.79
2010 21016 84.2 3200 12.8 752 3.0 1.81 2 0.80
27
Satisfied Neutral Dissatisfied Std.
Deviation Year N % N % N % Mean Median
As a result of services I have received from this agency, I am better able to deal with crisis.
2015 19945 81.6 3606 14.8 880 3.6 1.86 2 0.83
2014 18566 82.7 3105 13.8 783 3.5 1.84 2 0.82
2013 16902 82.7 2839 13.9 702 3.4 1.83 2 0.82
2012 17713 82.5 3015 14.0 737 3.4 1.84 2 0.82
2011 18918 82.4 3193 13.9 835 3.6 1.84 2 0.82
2010 20352 81.9 3541 14.2 966 3.9 1.86 2 0.83
As a result of services I have received from this agency, I am getting along better with my family.
2015 18859 79.3 3832 16.1 1096 4.6 1.88 2 0.88
2014 17444 80.1 3368 15.5 957 4.4 1.86 2 0.88
2013 15896 79.9 3117 15.7 872 4.4 1.86 2 0.88
2012 16598 79.7 3287 15.8 937 4.5 1.86 2 0.88
2011 17788 79.8 3465 15.5 1041 4.7 1.86 2 0.89
2010 19269 79.6 3770 15.6 1161 4.8 1.87 2 0.90
As a result of services I have received from this agency, I do better in social situations.
2015 18930 78.3 4125 17.1 1115 4.6 1.92 2 0.87
2014 17667 79.4 3607 16.2 973 4.4 1.90 2 0.86
2013 16087 79.4 3269 16.1 910 4.5 1.90 2 0.86
2012 16887 79.4 3482 16.4 899 4.2 1.89 2 0.86
2011 18088 79.4 3692 16.2 1015 4.5 1.90 2 0.87
2010 19426 78.7 4090 16.6 1180 4.8 1.92 2 0.87
As a result of services I have received from this agency, I do better in school and/or work.
2015 14793 75.0 3913 19.8 1012 5.1 1.95 2 0.91
2014 13982 75.7 3637 19.7 840 4.6 1.94 2 0.89
2013 12791 76.2 3256 19.4 749 4.5 1.92 2 0.89
2012 13067 75.3 3507 20.2 778 4.5 1.94 2 0.89
2011 14298 75.8 3657 19.4 917 4.9 1.94 2 0.90
2010 15228 74.4 4231 20.7 1006 4.9 1.97 2 0.91
As a result of services I have received from this agency, My symptoms are not bothering me as much.
2015 18071 75.5 4090 17.1 1781 7.4 2.00 2 0.95
2014 16860 76.6 3524 16.0 1623 7.4 1.98 2 0.95
2013 15336 76.5 3286 16.4 1425 7.1 1.97 2 0.95
2012 15910 75.7 3478 16.5 1639 7.8 2.00 2 0.97
2011 17245 76.9 3551 15.8 1615 7.2 1.97 2 0.95
2010 18436 75.7 4008 16.5 1910 7.8 2.00 2 0.96
Recovery
In general, I am involved in my community.
2015 15766 70.0 4431 19.7 2341 10.4 2.11 2 1.03
2014 14723 71.4 3813 18.5 2084 10.1 2.08 2 1.02
2013 13435 71.1 3489 18.5 1979 10.5 2.08 2 1.03
2012 13938 70.7 3662 18.6 2117 10.7 2.09 2 1.03
2011 14834 70.2 4031 19.1 2271 10.7 2.10 2 1.04
2010 15981 69.9 4409 19.3 2471 10.8 2.11 2 1.04
In general, I am able to pursue my interests.
2015 19347 79.5 3663 15.1 1314 5.4 1.94 2 0.88
2014 18105 80.9 3120 13.9 1144 5.1 1.91 2 0.86
2013 16331 80.3 2907 14.3 1101 5.4 1.91 2 0.88
2012 17075 79.9 3113 14.6 1191 5.6 1.92 2 0.88
2011 18283 80.0 3264 14.3 1320 5.8 1.93 2 0.88
2010 19498 79.1 3678 14.9 1486 6.0 1.95 2 0.89
28
Satisfied Neutral Dissatisfied Std.
Deviation Year N % N % N % Mean Median
In general, I can have the life I want, despite my disease/disorder.
2015 18865 77.9 3675 15.2 1683 6.9 1.96 2 0.94
2014 17661 79.3 3119 14.0 1487 6.7 1.93 2 0.93
2013 15908 78.3 3013 14.8 1383 6.8 1.94 2 0.94
2012 16560 77.7 3153 14.8 1590 7.5 1.96 2 0.95
2011 17730 77.8 3361 14.7 1712 7.5 1.96 2 0.96
2010 19001 76.9 3752 15.2 1945 7.9 1.98 2 0.97
In general, I feel like I am in control of my treatment.
2015 19914 81.6 3312 13.6 1177 4.8 1.88 2 0.86
2014 18371 82.7 2838 12.8 996 4.5 1.86 2 0.85
2013 16735 82.2 2636 12.9 995 4.9 1.86 2 0.87
2012 17540 82.1 2760 12.9 1067 5.0 1.87 2 0.86
2011 18771 81.9 3011 13.1 1131 4.9 1.87 2 0.86
2010 20087 80.8 3409 13.7 1357 5.5 1.90 2 0.88
In general, I give back to my family and/or community.
2015 18727 79.7 3757 16.0 1002 4.3 1.90 2 0.85
2014 17439 81.0 3220 15.0 865 4.0 1.87 2 0.85
2013 15815 80.0 3086 15.6 858 4.3 1.88 2 0.86
2012 16535 80.1 3157 15.3 946 4.6 1.89 2 0.87
2011 17762 79.9 3467 15.6 1013 4.6 1.89 2 0.87
2010 19265 79.7 3784 15.6 1138 4.7 1.90 2 0.87
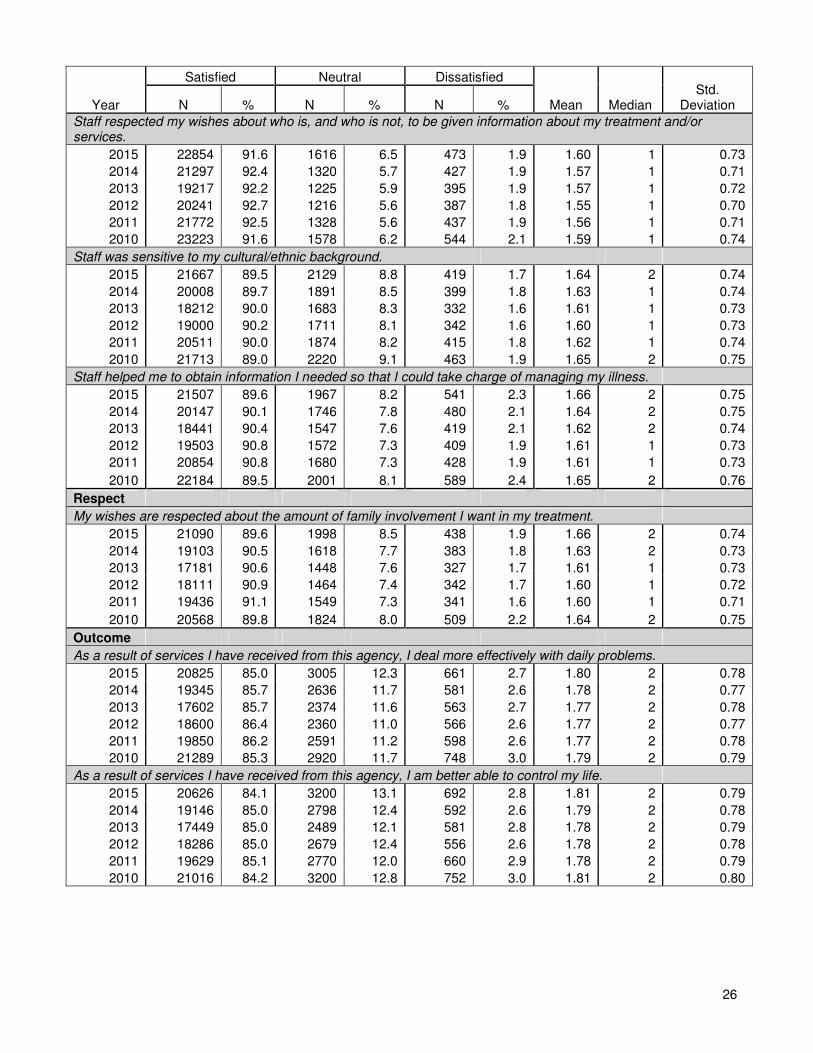
The five questions that received the highest satisfaction ratings (i.e., had lowest average response on the 1-5 scale (1=strongly agree)) are as follows:
(Q8) Staff here believes that I can grow, change, and recover. (Q1) I like the services that I received here. (Q13) Staff respected my wishes about who is, and who is not, to be given information about my treatment and/or services. (Q9) I felt comfortable asking questions about my services, treatment or medication
(Q14) Staff was sensitive to my cultural/ethnic background. These questions had the highest satisfaction ratings with the average ratings in the “Strongly Agree” category (#1 on the scale of 1-5). The percentage of clients who indicated satisfaction in these areas ranged from 89.4% - 92.4%, while the percentage who indicated dissatisfaction ranged from 1.3% - 2.2%. The five questions that received the lowest satisfaction ratings (i.e., had highest average response on the 1-5 scale (5=strongly disagree)) are as follows:
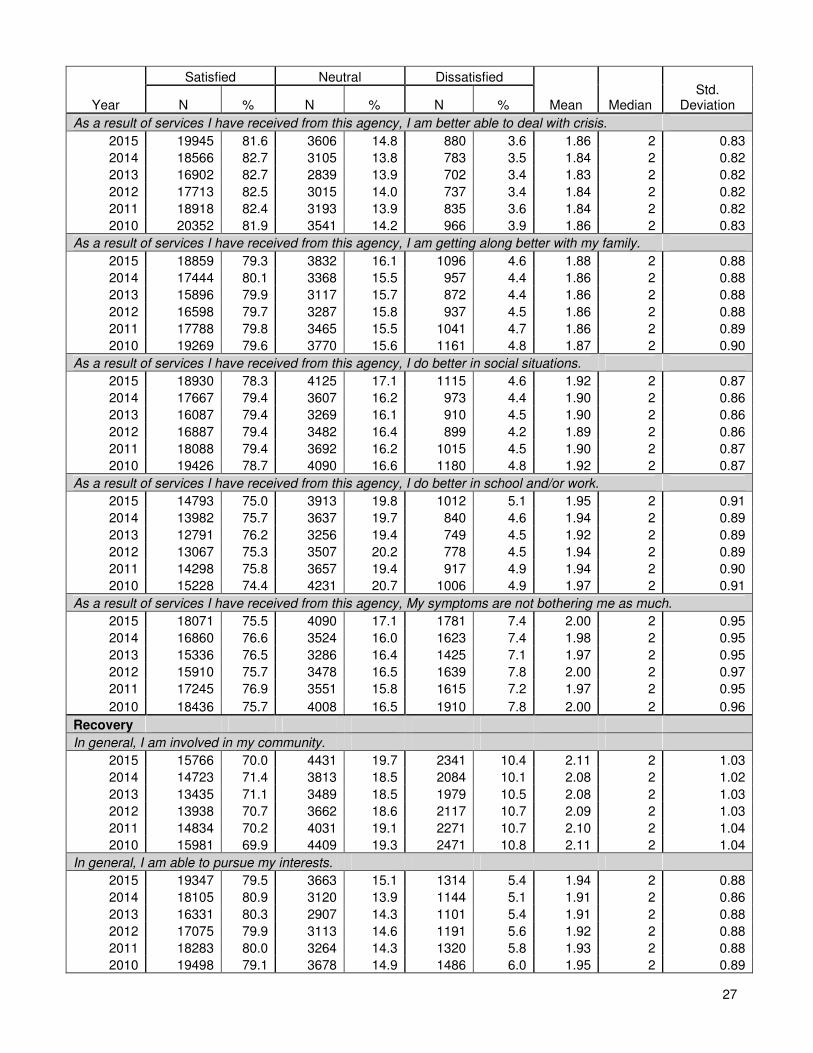
(Q24) I am involved in my community (for example, church, volunteering, sports, support groups, or work). (Lowest rated) (Q23) My symptoms are not bothering me as much. (Q26) I can have the life I want, despite my disease/disorder. (Q22) I do better in school and/or work. (Q25) I am able to pursue my interests.
29
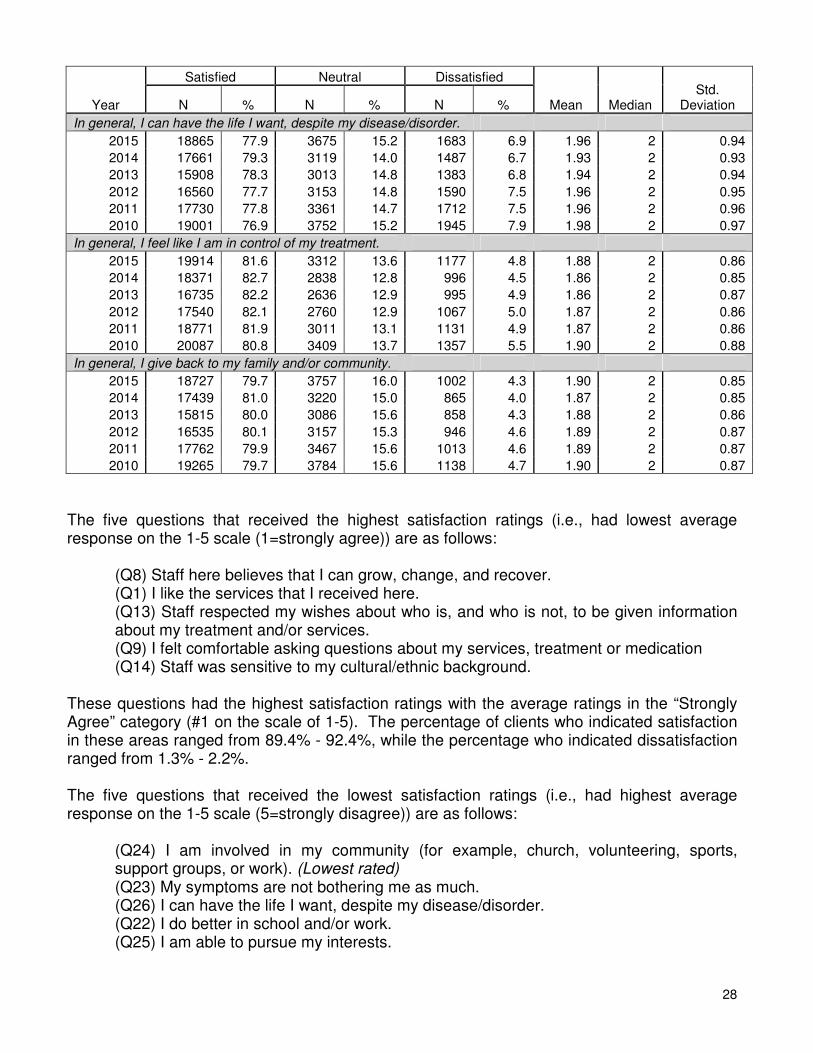
Although these questions had the lowest satisfaction ratings, the average ratings still fell into the “Agree” category (#2 on the scale of 1-5). The percentage of clients who indicated satisfaction in these areas ranged from 69.9% - 79.9%, while the percentage who indicated dissatisfaction ranged from 5.2% - 10.4%. These questions all come from the Outcome or Recovery domains. These highest/lowest questions have remained stable since SFY2012. This year, one new question (Q14) entered the list for highest ratings. The next set of tables document how consumers tended to rate satisfaction with services from DMHAS providers within each of the various survey domains.
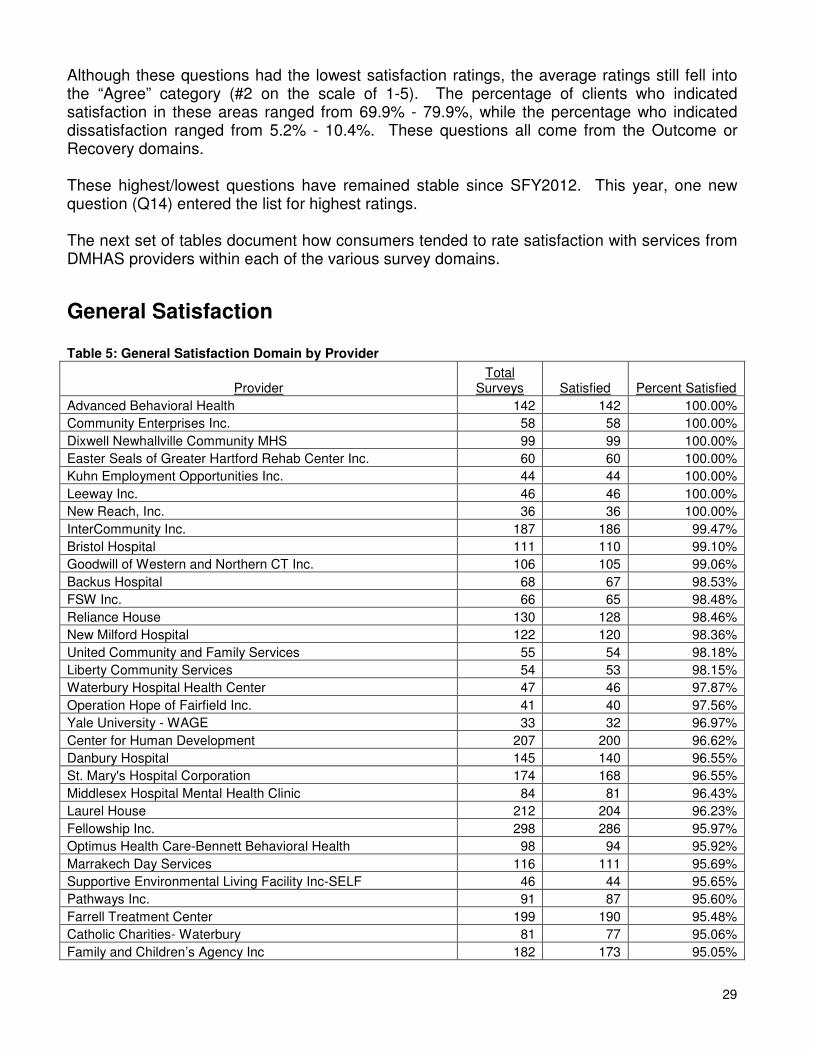
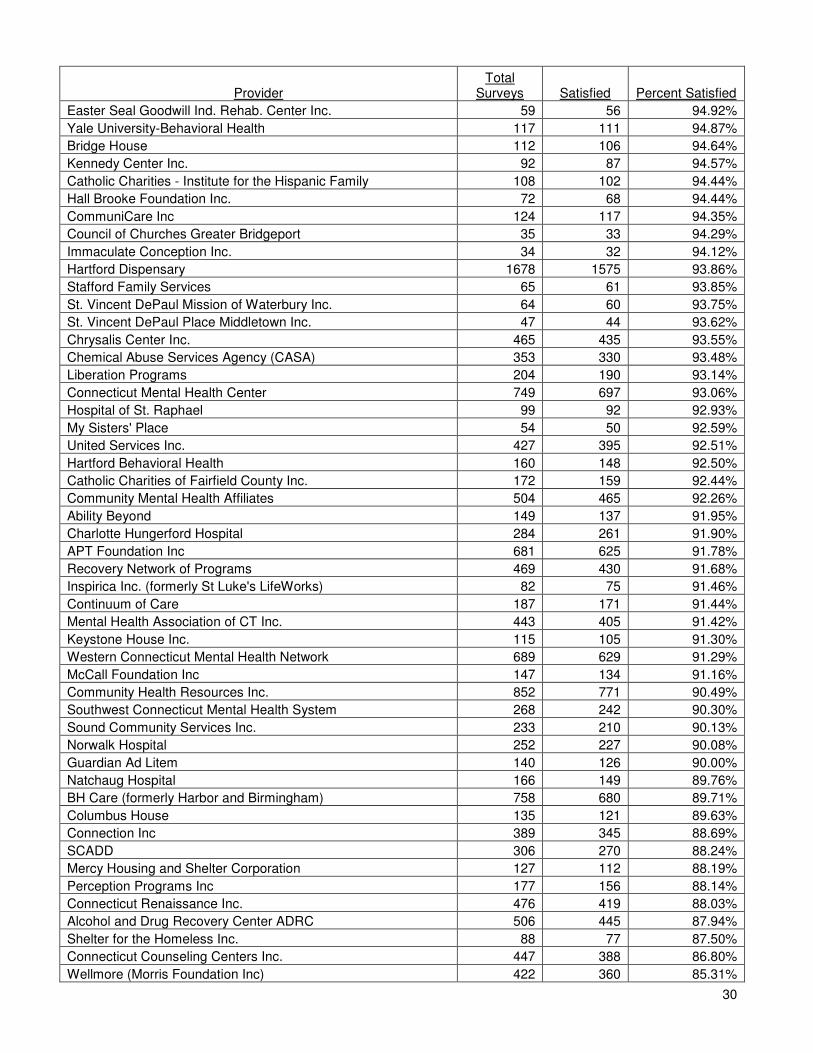
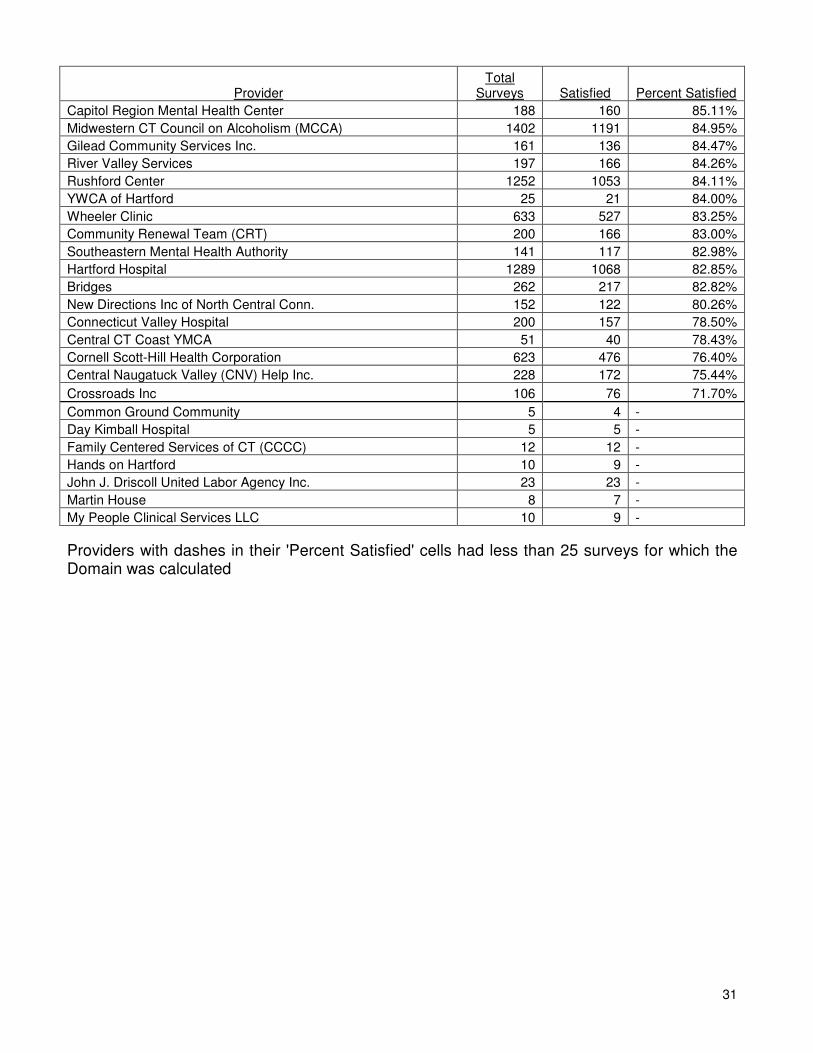
General Satisfaction Table 5: General Satisfaction Domain by Provider
Provider Total
Surveys Satisfied Percent Satisfied
Advanced Behavioral Health 142 142 100.00%
Community Enterprises Inc. 58 58 100.00%
Dixwell Newhallville Community MHS 99 99 100.00%
Easter Seals of Greater Hartford Rehab Center Inc. 60 60 100.00%
Kuhn Employment Opportunities Inc. 44 44 100.00%
Leeway Inc. 46 46 100.00%
New Reach, Inc. 36 36 100.00%
InterCommunity Inc. 187 186 99.47%
Bristol Hospital 111 110 99.10%
Goodwill of Western and Northern CT Inc. 106 105 99.06%
Backus Hospital 68 67 98.53%
FSW Inc. 66 65 98.48%
Reliance House 130 128 98.46%
New Milford Hospital 122 120 98.36%
United Community and Family Services 55 54 98.18%
Liberty Community Services 54 53 98.15%
Waterbury Hospital Health Center 47 46 97.87%
Operation Hope of Fairfield Inc. 41 40 97.56%
Yale University - WAGE 33 32 96.97%
Center for Human Development 207 200 96.62%
Danbury Hospital 145 140 96.55%
St. Mary's Hospital Corporation 174 168 96.55%
Middlesex Hospital Mental Health Clinic 84 81 96.43%
Laurel House 212 204 96.23%
Fellowship Inc. 298 286 95.97%
Optimus Health Care-Bennett Behavioral Health 98 94 95.92%
Marrakech Day Services 116 111 95.69%
Supportive Environmental Living Facility Inc-SELF 46 44 95.65%
Pathways Inc. 91 87 95.60%
Farrell Treatment Center 199 190 95.48%
Catholic Charities- Waterbury 81 77 95.06%
Family and Children’s Agency Inc 182 173 95.05%
30
Provider Total
Surveys Satisfied Percent Satisfied
Easter Seal Goodwill Ind. Rehab. Center Inc. 59 56 94.92%
Yale University-Behavioral Health 117 111 94.87%
Bridge House 112 106 94.64%
Kennedy Center Inc. 92 87 94.57%
Catholic Charities - Institute for the Hispanic Family 108 102 94.44%
Hall Brooke Foundation Inc. 72 68 94.44%
CommuniCare Inc 124 117 94.35%
Council of Churches Greater Bridgeport 35 33 94.29%
Immaculate Conception Inc. 34 32 94.12%
Hartford Dispensary 1678 1575 93.86%
Stafford Family Services 65 61 93.85%
St. Vincent DePaul Mission of Waterbury Inc. 64 60 93.75%
St. Vincent DePaul Place Middletown Inc. 47 44 93.62%
Chrysalis Center Inc. 465 435 93.55%
Chemical Abuse Services Agency (CASA) 353 330 93.48%
Liberation Programs 204 190 93.14%
Connecticut Mental Health Center 749 697 93.06%
Hospital of St. Raphael 99 92 92.93%
My Sisters' Place 54 50 92.59%
United Services Inc. 427 395 92.51%
Hartford Behavioral Health 160 148 92.50%
Catholic Charities of Fairfield County Inc. 172 159 92.44%
Community Mental Health Affiliates 504 465 92.26%
Ability Beyond 149 137 91.95%
Charlotte Hungerford Hospital 284 261 91.90%
APT Foundation Inc 681 625 91.78%
Recovery Network of Programs 469 430 91.68%
Inspirica Inc. (formerly St Luke's LifeWorks) 82 75 91.46%
Continuum of Care 187 171 91.44%
Mental Health Association of CT Inc. 443 405 91.42%
Keystone House Inc. 115 105 91.30%
Western Connecticut Mental Health Network 689 629 91.29%
McCall Foundation Inc 147 134 91.16%
Community Health Resources Inc. 852 771 90.49%
Southwest Connecticut Mental Health System 268 242 90.30%
Sound Community Services Inc. 233 210 90.13%
Norwalk Hospital 252 227 90.08%
Guardian Ad Litem 140 126 90.00%
Natchaug Hospital 166 149 89.76%
BH Care (formerly Harbor and Birmingham) 758 680 89.71%
Columbus House 135 121 89.63%
Connection Inc 389 345 88.69%
SCADD 306 270 88.24%
Mercy Housing and Shelter Corporation 127 112 88.19%
Perception Programs Inc 177 156 88.14%
Connecticut Renaissance Inc. 476 419 88.03%
Alcohol and Drug Recovery Center ADRC 506 445 87.94%
Shelter for the Homeless Inc. 88 77 87.50%
Connecticut Counseling Centers Inc. 447 388 86.80%
Wellmore (Morris Foundation Inc) 422 360 85.31%
31
Provider Total
Surveys Satisfied Percent Satisfied
Capitol Region Mental Health Center 188 160 85.11%
Midwestern CT Council on Alcoholism (MCCA) 1402 1191 84.95%
Gilead Community Services Inc. 161 136 84.47%
River Valley Services 197 166 84.26%
Rushford Center 1252 1053 84.11%
YWCA of Hartford 25 21 84.00%
Wheeler Clinic 633 527 83.25%
Community Renewal Team (CRT) 200 166 83.00%
Southeastern Mental Health Authority 141 117 82.98%
Hartford Hospital 1289 1068 82.85%
Bridges 262 217 82.82%
New Directions Inc of North Central Conn. 152 122 80.26%
Connecticut Valley Hospital 200 157 78.50%
Central CT Coast YMCA 51 40 78.43%
Cornell Scott-Hill Health Corporation 623 476 76.40%
Central Naugatuck Valley (CNV) Help Inc. 228 172 75.44%
Crossroads Inc 106 76 71.70%
Common Ground Community 5 4 -
Day Kimball Hospital 5 5 -
Family Centered Services of CT (CCCC) 12 12 -
Hands on Hartford 10 9 -
John J. Driscoll United Labor Agency Inc. 23 23 -
Martin House 8 7 -
My People Clinical Services LLC 10 9 -
Providers with dashes in their 'Percent Satisfied' cells had less than 25 surveys for which the Domain was calculated
32
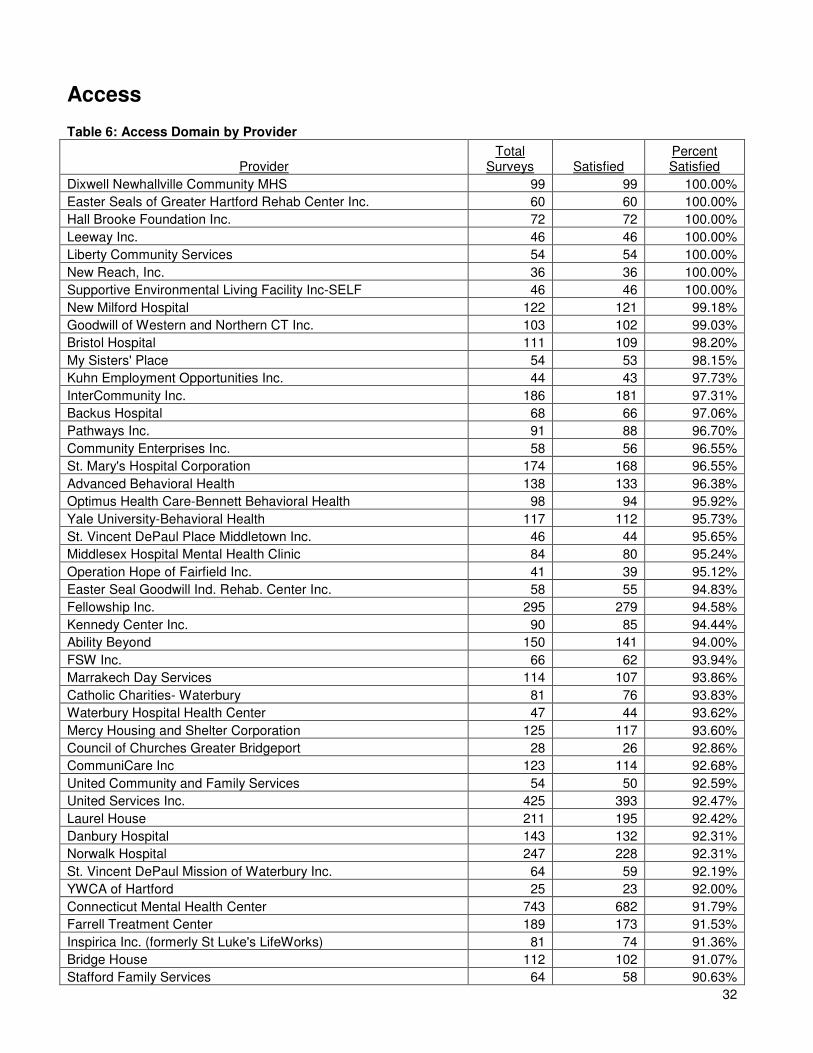
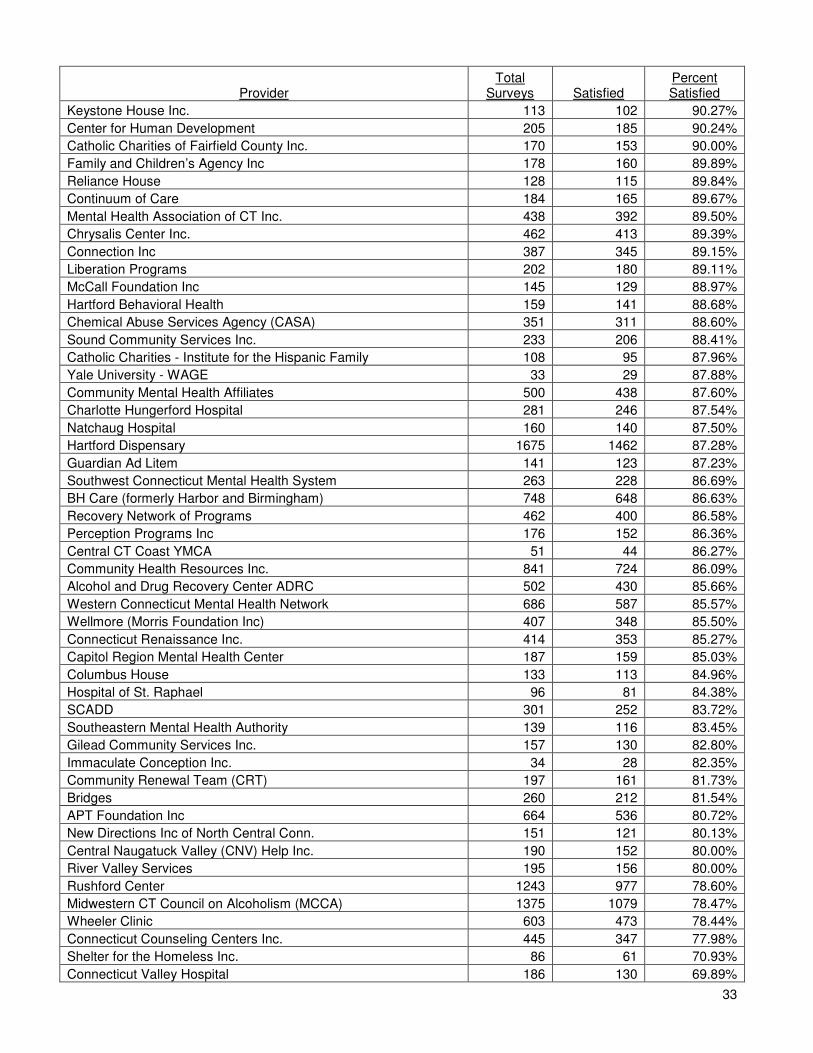
Access
Table 6: Access Domain by Provider
Provider Total
Surveys Satisfied Percent Satisfied
Dixwell Newhallville Community MHS 99 99 100.00%
Easter Seals of Greater Hartford Rehab Center Inc. 60 60 100.00%
Hall Brooke Foundation Inc. 72 72 100.00%
Leeway Inc. 46 46 100.00%
Liberty Community Services 54 54 100.00%
New Reach, Inc. 36 36 100.00%
Supportive Environmental Living Facility Inc-SELF 46 46 100.00%
New Milford Hospital 122 121 99.18%
Goodwill of Western and Northern CT Inc. 103 102 99.03%
Bristol Hospital 111 109 98.20%
My Sisters' Place 54 53 98.15%
Kuhn Employment Opportunities Inc. 44 43 97.73%
InterCommunity Inc. 186 181 97.31%
Backus Hospital 68 66 97.06%
Pathways Inc. 91 88 96.70%
Community Enterprises Inc. 58 56 96.55%
St. Mary's Hospital Corporation 174 168 96.55%
Advanced Behavioral Health 138 133 96.38%
Optimus Health Care-Bennett Behavioral Health 98 94 95.92%
Yale University-Behavioral Health 117 112 95.73%
St. Vincent DePaul Place Middletown Inc. 46 44 95.65%
Middlesex Hospital Mental Health Clinic 84 80 95.24%
Operation Hope of Fairfield Inc. 41 39 95.12%
Easter Seal Goodwill Ind. Rehab. Center Inc. 58 55 94.83%
Fellowship Inc. 295 279 94.58%
Kennedy Center Inc. 90 85 94.44%
Ability Beyond 150 141 94.00%
FSW Inc. 66 62 93.94%
Marrakech Day Services 114 107 93.86%
Catholic Charities- Waterbury 81 76 93.83%
Waterbury Hospital Health Center 47 44 93.62%
Mercy Housing and Shelter Corporation 125 117 93.60%
Council of Churches Greater Bridgeport 28 26 92.86%
CommuniCare Inc 123 114 92.68%
United Community and Family Services 54 50 92.59%
United Services Inc. 425 393 92.47%
Laurel House 211 195 92.42%
Danbury Hospital 143 132 92.31%
Norwalk Hospital 247 228 92.31%
St. Vincent DePaul Mission of Waterbury Inc. 64 59 92.19%
YWCA of Hartford 25 23 92.00%
Connecticut Mental Health Center 743 682 91.79%
Farrell Treatment Center 189 173 91.53%
Inspirica Inc. (formerly St Luke's LifeWorks) 81 74 91.36%
Bridge House 112 102 91.07%
Stafford Family Services 64 58 90.63%
33
Provider Total
Surveys Satisfied Percent Satisfied
Keystone House Inc. 113 102 90.27%
Center for Human Development 205 185 90.24%
Catholic Charities of Fairfield County Inc. 170 153 90.00%
Family and Children’s Agency Inc 178 160 89.89%
Reliance House 128 115 89.84%
Continuum of Care 184 165 89.67%
Mental Health Association of CT Inc. 438 392 89.50%
Chrysalis Center Inc. 462 413 89.39%
Connection Inc 387 345 89.15%
Liberation Programs 202 180 89.11%
McCall Foundation Inc 145 129 88.97%
Hartford Behavioral Health 159 141 88.68%
Chemical Abuse Services Agency (CASA) 351 311 88.60%
Sound Community Services Inc. 233 206 88.41%
Catholic Charities - Institute for the Hispanic Family 108 95 87.96%
Yale University - WAGE 33 29 87.88%
Community Mental Health Affiliates 500 438 87.60%
Charlotte Hungerford Hospital 281 246 87.54%
Natchaug Hospital 160 140 87.50%
Hartford Dispensary 1675 1462 87.28%
Guardian Ad Litem 141 123 87.23%
Southwest Connecticut Mental Health System 263 228 86.69%
BH Care (formerly Harbor and Birmingham) 748 648 86.63%
Recovery Network of Programs 462 400 86.58%
Perception Programs Inc 176 152 86.36%
Central CT Coast YMCA 51 44 86.27%
Community Health Resources Inc. 841 724 86.09%
Alcohol and Drug Recovery Center ADRC 502 430 85.66%
Western Connecticut Mental Health Network 686 587 85.57%
Wellmore (Morris Foundation Inc) 407 348 85.50%
Connecticut Renaissance Inc. 414 353 85.27%
Capitol Region Mental Health Center 187 159 85.03%
Columbus House 133 113 84.96%
Hospital of St. Raphael 96 81 84.38%
SCADD 301 252 83.72%
Southeastern Mental Health Authority 139 116 83.45%
Gilead Community Services Inc. 157 130 82.80%
Immaculate Conception Inc. 34 28 82.35%
Community Renewal Team (CRT) 197 161 81.73%
Bridges 260 212 81.54%
APT Foundation Inc 664 536 80.72%
New Directions Inc of North Central Conn. 151 121 80.13%
Central Naugatuck Valley (CNV) Help Inc. 190 152 80.00%
River Valley Services 195 156 80.00%
Rushford Center 1243 977 78.60%
Midwestern CT Council on Alcoholism (MCCA) 1375 1079 78.47%
Wheeler Clinic 603 473 78.44%
Connecticut Counseling Centers Inc. 445 347 77.98%
Shelter for the Homeless Inc. 86 61 70.93%
Connecticut Valley Hospital 186 130 69.89%
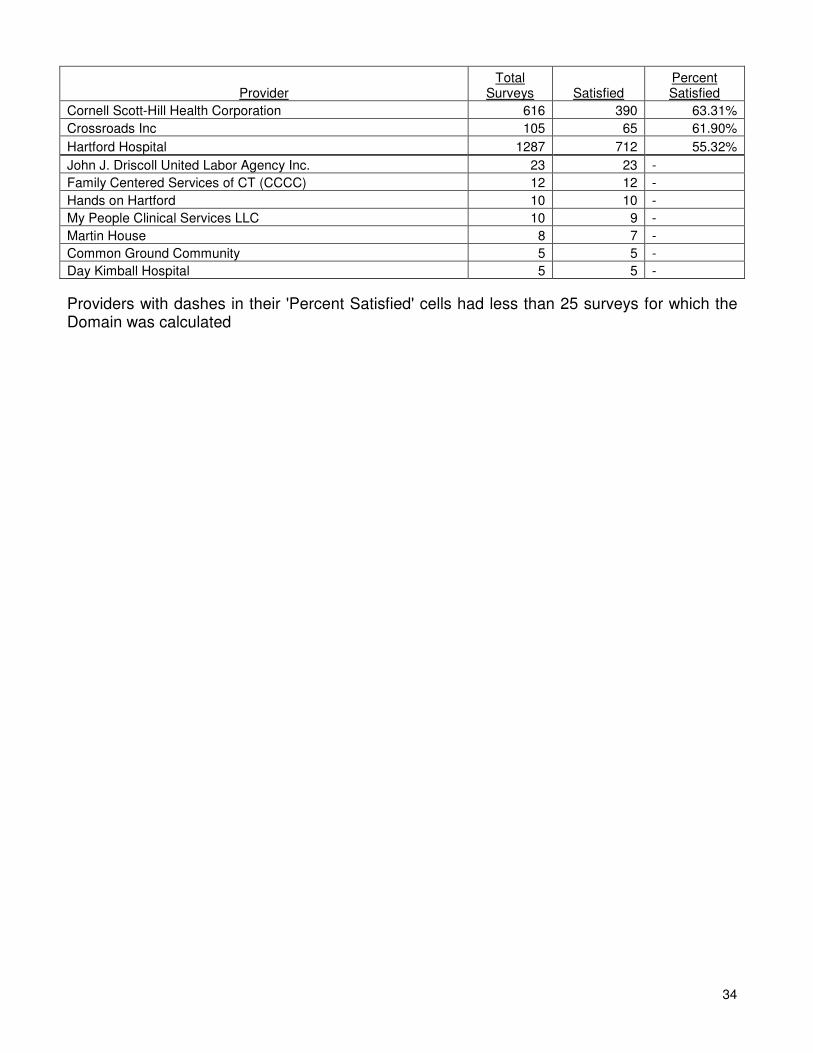
34
Provider Total
Surveys Satisfied Percent Satisfied
Cornell Scott-Hill Health Corporation 616 390 63.31%
Crossroads Inc 105 65 61.90%
Hartford Hospital 1287 712 55.32%
John J. Driscoll United Labor Agency Inc. 23 23 -
Family Centered Services of CT (CCCC) 12 12 -
Hands on Hartford 10 10 -
My People Clinical Services LLC 10 9 -
Martin House 8 7 -
Common Ground Community 5 5 -
Day Kimball Hospital 5 5 -
Providers with dashes in their 'Percent Satisfied' cells had less than 25 surveys for which the Domain was calculated
35
Participation in Treatment Table 7: “I felt comfortable asking questions about my services, treatment or medication” by Provider
Provider Total
Surveys Satisfied Percent Satisfied
Dixwell Newhallville Community MHS 99 99 100.00%
Easter Seals of Greater Hartford Rehab Center Inc. 59 59 100.00%
Leeway Inc. 46 46 100.00%
New Reach, Inc. 36 36 100.00%
Operation Hope of Fairfield Inc. 40 40 100.00%
Supportive Environmental Living Facility Inc-SELF 46 46 100.00%
Advanced Behavioral Health 141 140 99.29%
McCall Foundation Inc 149 147 98.66%
Liberty Community Services 54 53 98.15%
United Community and Family Services 54 53 98.15%
Liberation Programs 197 193 97.97%
Waterbury Hospital Health Center 47 46 97.87%
Kuhn Employment Opportunities Inc. 40 39 97.50%
Bristol Hospital 109 106 97.25%
Danbury Hospital 142 138 97.18%
Hall Brooke Foundation Inc. 69 67 97.10%
Immaculate Conception Inc. 31 30 96.77%
New Milford Hospital 122 118 96.72%
St. Mary's Hospital Corporation 172 166 96.51%
Farrell Treatment Center 197 190 96.45%
InterCommunity Inc. 184 177 96.20%
Catholic Charities- Waterbury 78 75 96.15%
Optimus Health Care-Bennett Behavioral Health 97 93 95.88%
Community Enterprises Inc. 47 45 95.74%
Yale University-Behavioral Health 117 112 95.73%
Keystone House Inc. 114 109 95.61%
Backus Hospital 67 64 95.52%
Bridge House 110 105 95.45%
Catholic Charities - Institute for the Hispanic Family 101 96 95.05%
Hartford Dispensary 1675 1590 94.93%
Easter Seal Goodwill Ind. Rehab. Center Inc. 59 56 94.92%
Marrakech Day Services 115 109 94.78%
Center for Human Development 205 194 94.63%
Pathways Inc. 90 85 94.44%
Kennedy Center Inc. 88 83 94.32%
My Sisters' Place 52 49 94.23%
Connecticut Renaissance Inc. 476 448 94.12%
Council of Churches Greater Bridgeport 32 30 93.75%
Family and Children’s Agency Inc 173 162 93.64%
Recovery Network of Programs 470 440 93.62%
Goodwill of Western and Northern CT Inc. 78 73 93.59%
Western Connecticut Mental Health Network 684 640 93.57%
SCADD 306 286 93.46%
CommuniCare Inc 121 113 93.39%
Chrysalis Center Inc. 423 395 93.38%
36
Provider Total
Surveys Satisfied Percent Satisfied
Community Health Resources Inc. 839 783 93.33%
Charlotte Hungerford Hospital 283 264 93.29%
Reliance House 129 120 93.02%
Middlesex Hospital Mental Health Clinic 84 78 92.86%
Bridges 258 239 92.64%
Mercy Housing and Shelter Corporation 122 113 92.62%
Connecticut Mental Health Center 741 686 92.58%
Fellowship Inc. 252 233 92.46%
Community Mental Health Affiliates 498 460 92.37%
FSW Inc. 64 59 92.19%
Norwalk Hospital 250 230 92.00%
Perception Programs Inc 174 160 91.95%
APT Foundation Inc 677 621 91.73%
Chemical Abuse Services Agency (CASA) 352 322 91.48%
Inspirica Inc. (formerly St Luke's LifeWorks) 82 75 91.46%
Southwest Connecticut Mental Health System 266 243 91.35%
Laurel House 195 178 91.28%
United Services Inc. 423 386 91.25%
Ability Beyond 147 134 91.16%
Alcohol and Drug Recovery Center ADRC 507 462 91.12%
Central CT Coast YMCA 45 41 91.11%
Columbus House 134 122 91.04%
Connecticut Counseling Centers Inc. 444 404 90.99%
Sound Community Services Inc. 231 210 90.91%
Connection Inc 383 348 90.86%
Continuum of Care 183 166 90.71%
Yale University - WAGE 32 29 90.63%
BH Care (formerly Harbor and Birmingham) 752 681 90.56%
Hartford Behavioral Health 158 143 90.51%
Mental Health Association of CT Inc. 431 390 90.49%
St. Vincent DePaul Place Middletown Inc. 42 38 90.48%
Midwestern CT Council on Alcoholism (MCCA) 1380 1246 90.29%
Catholic Charities of Fairfield County Inc. 148 133 89.86%
Wheeler Clinic 627 563 89.79%
New Directions Inc of North Central Conn. 152 136 89.47%
Stafford Family Services 65 58 89.23%
St. Vincent DePaul Mission of Waterbury Inc. 64 57 89.06%
Southeastern Mental Health Authority 137 122 89.05%
Community Renewal Team (CRT) 199 177 88.94%
Hospital of St. Raphael 97 86 88.66%
Natchaug Hospital 165 146 88.48%
Rushford Center 1249 1105 88.47%
Shelter for the Homeless Inc. 86 76 88.37%
Capitol Region Mental Health Center 186 164 88.17%
Wellmore (Morris Foundation Inc) 418 366 87.56%
Guardian Ad Litem 142 124 87.32%
Central Naugatuck Valley (CNV) Help Inc. 227 198 87.22%
Connecticut Valley Hospital 202 176 87.13%
River Valley Services 195 166 85.13%
Crossroads Inc 104 88 84.62%
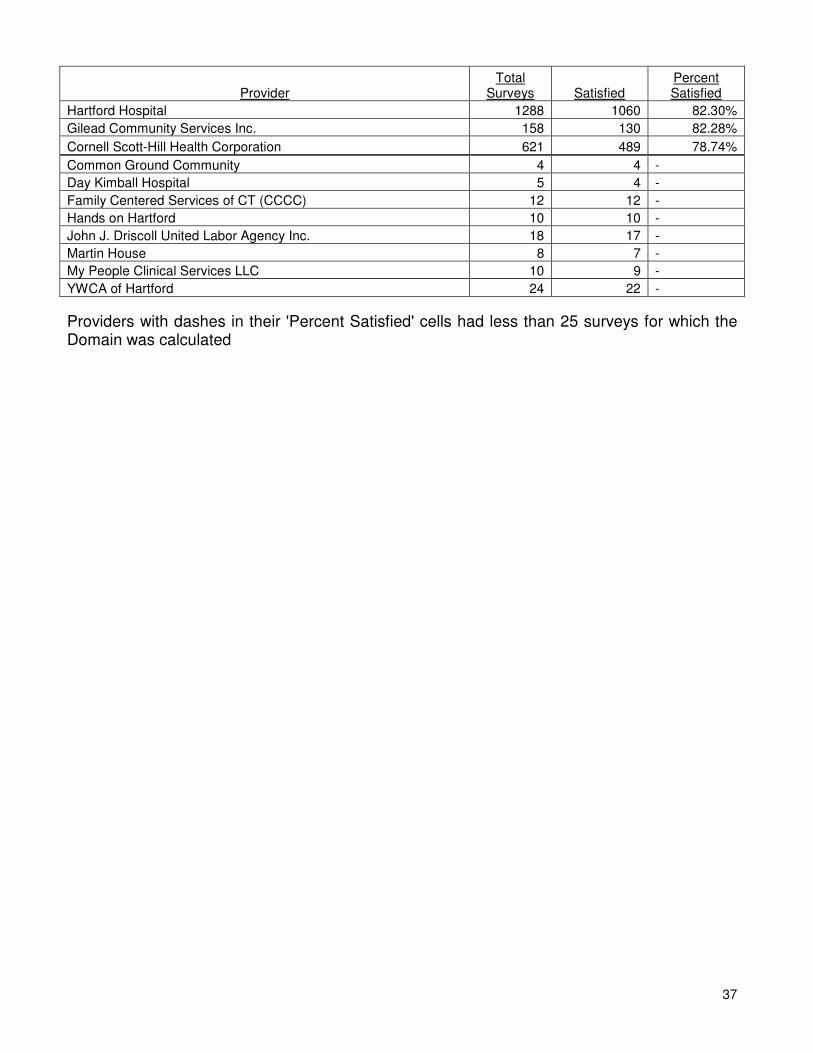
37
Provider Total
Surveys Satisfied Percent Satisfied
Hartford Hospital 1288 1060 82.30%
Gilead Community Services Inc. 158 130 82.28%
Cornell Scott-Hill Health Corporation 621 489 78.74%
Common Ground Community 4 4 -
Day Kimball Hospital 5 4 -
Family Centered Services of CT (CCCC) 12 12 -
Hands on Hartford 10 10 -
John J. Driscoll United Labor Agency Inc. 18 17 -
Martin House 8 7 -
My People Clinical Services LLC 10 9 -
YWCA of Hartford 24 22 -
Providers with dashes in their 'Percent Satisfied' cells had less than 25 surveys for which the Domain was calculated
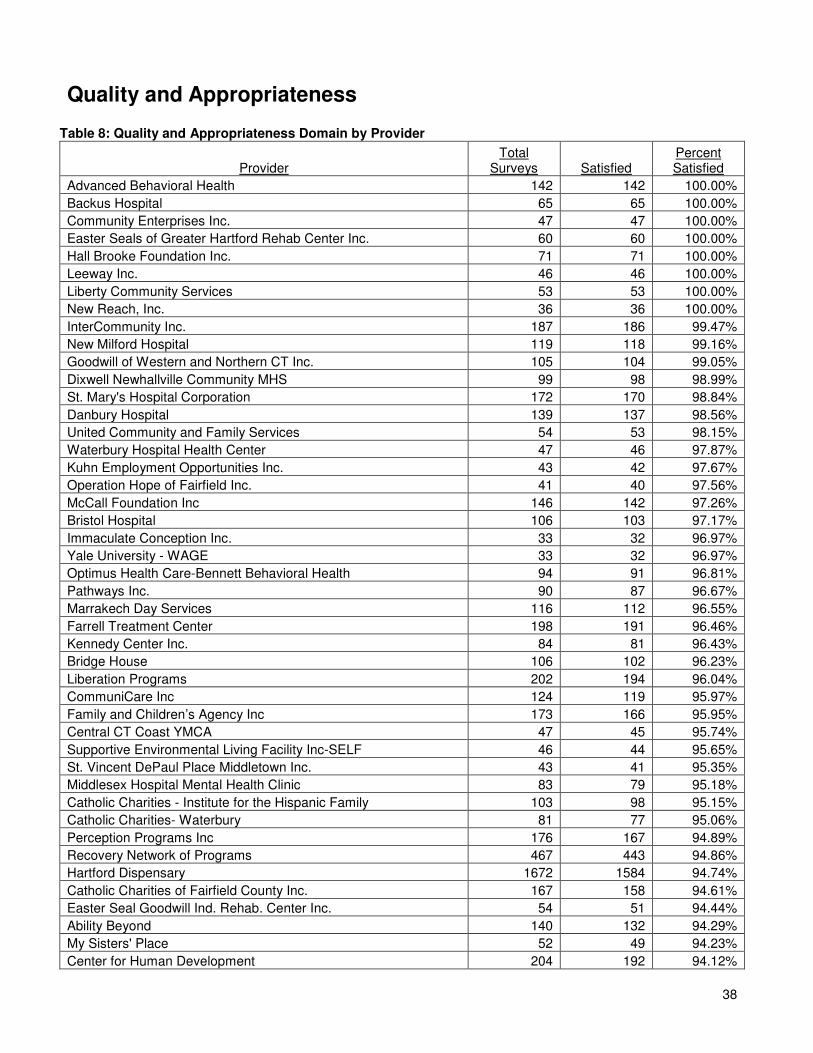
38
Quality and Appropriateness
Table 8: Quality and Appropriateness Domain by Provider
Provider Total
Surveys Satisfied Percent Satisfied
Advanced Behavioral Health 142 142 100.00%
Backus Hospital 65 65 100.00%
Community Enterprises Inc. 47 47 100.00%
Easter Seals of Greater Hartford Rehab Center Inc. 60 60 100.00%
Hall Brooke Foundation Inc. 71 71 100.00%
Leeway Inc. 46 46 100.00%
Liberty Community Services 53 53 100.00%
New Reach, Inc. 36 36 100.00%
InterCommunity Inc. 187 186 99.47%
New Milford Hospital 119 118 99.16%
Goodwill of Western and Northern CT Inc. 105 104 99.05%
Dixwell Newhallville Community MHS 99 98 98.99%
St. Mary's Hospital Corporation 172 170 98.84%
Danbury Hospital 139 137 98.56%
United Community and Family Services 54 53 98.15%
Waterbury Hospital Health Center 47 46 97.87%
Kuhn Employment Opportunities Inc. 43 42 97.67%
Operation Hope of Fairfield Inc. 41 40 97.56%
McCall Foundation Inc 146 142 97.26%
Bristol Hospital 106 103 97.17%
Immaculate Conception Inc. 33 32 96.97%
Yale University - WAGE 33 32 96.97%
Optimus Health Care-Bennett Behavioral Health 94 91 96.81%
Pathways Inc. 90 87 96.67%
Marrakech Day Services 116 112 96.55%
Farrell Treatment Center 198 191 96.46%
Kennedy Center Inc. 84 81 96.43%
Bridge House 106 102 96.23%
Liberation Programs 202 194 96.04%
CommuniCare Inc 124 119 95.97%
Family and Children’s Agency Inc 173 166 95.95%
Central CT Coast YMCA 47 45 95.74%
Supportive Environmental Living Facility Inc-SELF 46 44 95.65%
St. Vincent DePaul Place Middletown Inc. 43 41 95.35%
Middlesex Hospital Mental Health Clinic 83 79 95.18%
Catholic Charities - Institute for the Hispanic Family 103 98 95.15%
Catholic Charities- Waterbury 81 77 95.06%
Perception Programs Inc 176 167 94.89%
Recovery Network of Programs 467 443 94.86%
Hartford Dispensary 1672 1584 94.74%
Catholic Charities of Fairfield County Inc. 167 158 94.61%
Easter Seal Goodwill Ind. Rehab. Center Inc. 54 51 94.44%
Ability Beyond 140 132 94.29%
My Sisters' Place 52 49 94.23%
Center for Human Development 204 192 94.12%
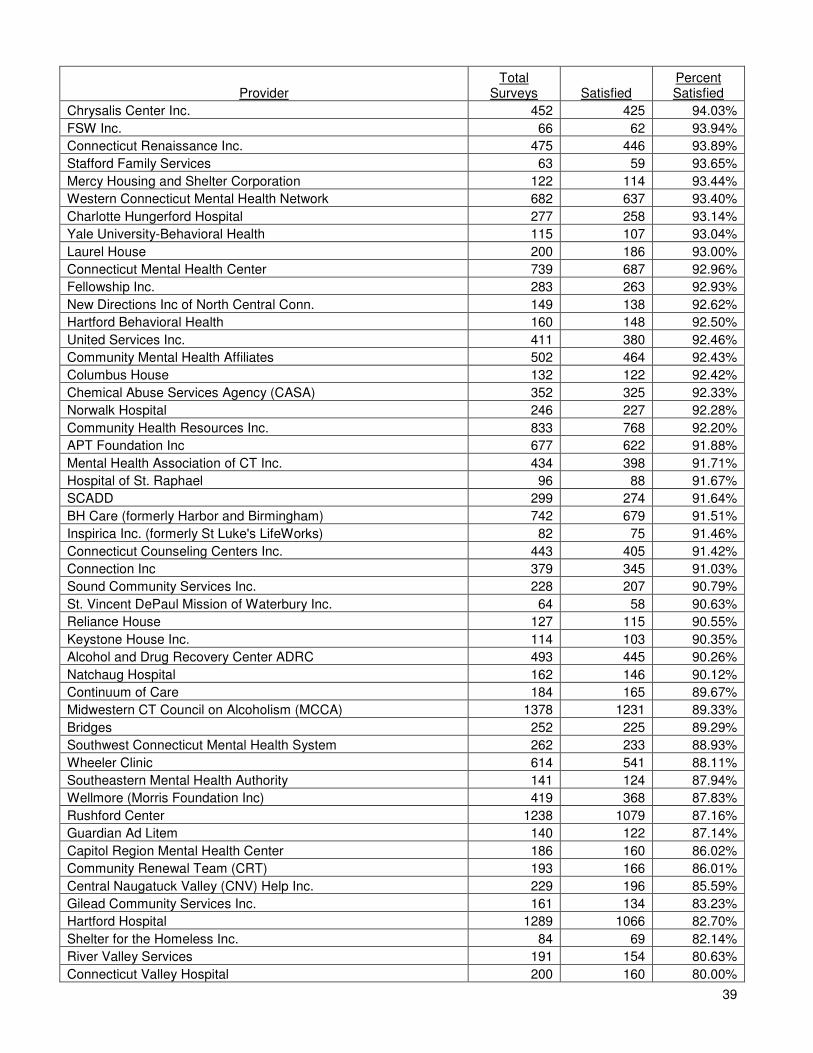
39
Provider Total
Surveys Satisfied Percent Satisfied
Chrysalis Center Inc. 452 425 94.03%
FSW Inc. 66 62 93.94%
Connecticut Renaissance Inc. 475 446 93.89%
Stafford Family Services 63 59 93.65%
Mercy Housing and Shelter Corporation 122 114 93.44%
Western Connecticut Mental Health Network 682 637 93.40%
Charlotte Hungerford Hospital 277 258 93.14%
Yale University-Behavioral Health 115 107 93.04%
Laurel House 200 186 93.00%
Connecticut Mental Health Center 739 687 92.96%
Fellowship Inc. 283 263 92.93%
New Directions Inc of North Central Conn. 149 138 92.62%
Hartford Behavioral Health 160 148 92.50%
United Services Inc. 411 380 92.46%
Community Mental Health Affiliates 502 464 92.43%
Columbus House 132 122 92.42%
Chemical Abuse Services Agency (CASA) 352 325 92.33%
Norwalk Hospital 246 227 92.28%
Community Health Resources Inc. 833 768 92.20%
APT Foundation Inc 677 622 91.88%
Mental Health Association of CT Inc. 434 398 91.71%
Hospital of St. Raphael 96 88 91.67%
SCADD 299 274 91.64%
BH Care (formerly Harbor and Birmingham) 742 679 91.51%
Inspirica Inc. (formerly St Luke's LifeWorks) 82 75 91.46%
Connecticut Counseling Centers Inc. 443 405 91.42%
Connection Inc 379 345 91.03%
Sound Community Services Inc. 228 207 90.79%
St. Vincent DePaul Mission of Waterbury Inc. 64 58 90.63%
Reliance House 127 115 90.55%
Keystone House Inc. 114 103 90.35%
Alcohol and Drug Recovery Center ADRC 493 445 90.26%
Natchaug Hospital 162 146 90.12%
Continuum of Care 184 165 89.67%
Midwestern CT Council on Alcoholism (MCCA) 1378 1231 89.33%
Bridges 252 225 89.29%
Southwest Connecticut Mental Health System 262 233 88.93%
Wheeler Clinic 614 541 88.11%
Southeastern Mental Health Authority 141 124 87.94%
Wellmore (Morris Foundation Inc) 419 368 87.83%
Rushford Center 1238 1079 87.16%
Guardian Ad Litem 140 122 87.14%
Capitol Region Mental Health Center 186 160 86.02%
Community Renewal Team (CRT) 193 166 86.01%
Central Naugatuck Valley (CNV) Help Inc. 229 196 85.59%
Gilead Community Services Inc. 161 134 83.23%
Hartford Hospital 1289 1066 82.70%
Shelter for the Homeless Inc. 84 69 82.14%
River Valley Services 191 154 80.63%
Connecticut Valley Hospital 200 160 80.00%
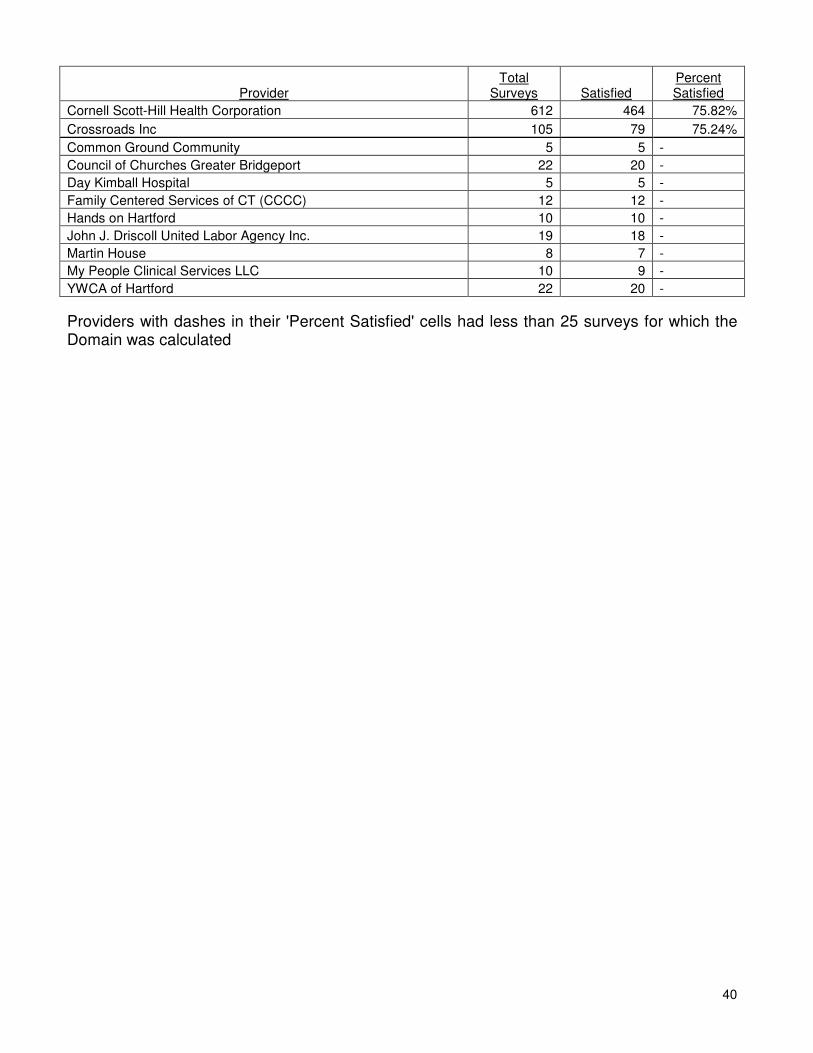
40
Provider Total
Surveys Satisfied Percent Satisfied
Cornell Scott-Hill Health Corporation 612 464 75.82%
Crossroads Inc 105 79 75.24%
Common Ground Community 5 5 -
Council of Churches Greater Bridgeport 22 20 -
Day Kimball Hospital 5 5 -
Family Centered Services of CT (CCCC) 12 12 -
Hands on Hartford 10 10 -
John J. Driscoll United Labor Agency Inc. 19 18 -
Martin House 8 7 -
My People Clinical Services LLC 10 9 -
YWCA of Hartford 22 20 -
Providers with dashes in their 'Percent Satisfied' cells had less than 25 surveys for which the Domain was calculated
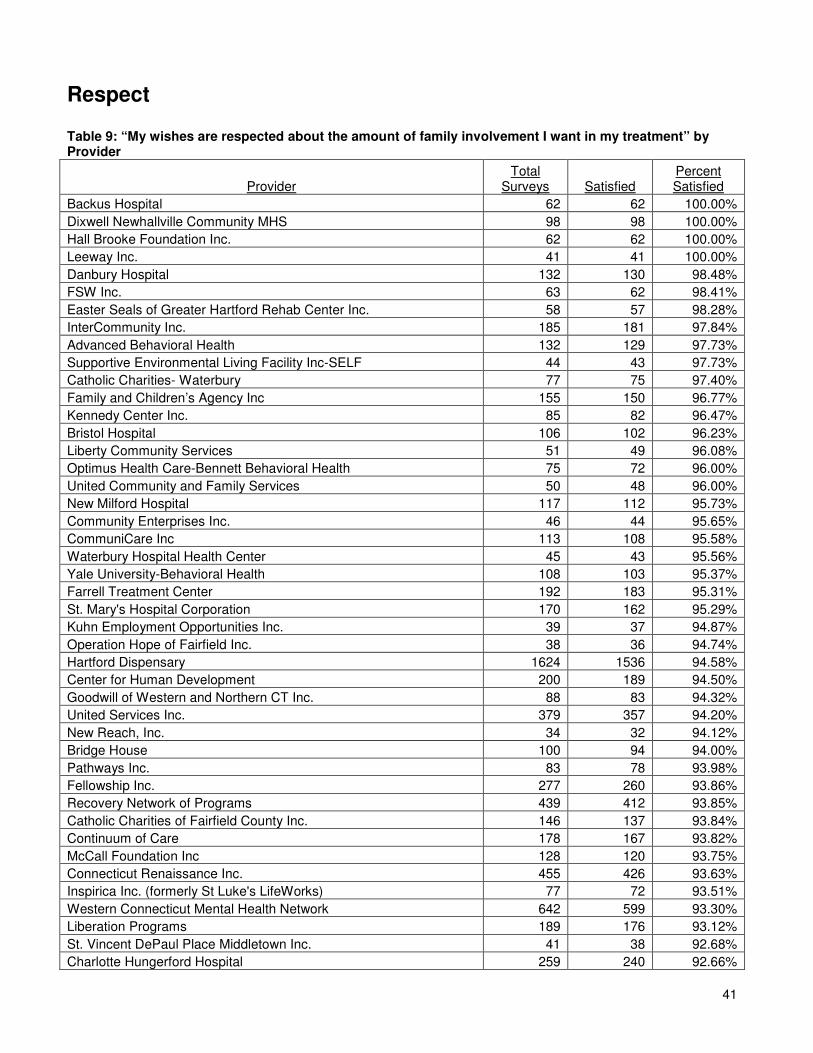
41
Respect Table 9: “My wishes are respected about the amount of family involvement I want in my treatment” by Provider
Provider Total
Surveys Satisfied Percent Satisfied
Backus Hospital 62 62 100.00%
Dixwell Newhallville Community MHS 98 98 100.00%
Hall Brooke Foundation Inc. 62 62 100.00%
Leeway Inc. 41 41 100.00%
Danbury Hospital 132 130 98.48%
FSW Inc. 63 62 98.41%
Easter Seals of Greater Hartford Rehab Center Inc. 58 57 98.28%
InterCommunity Inc. 185 181 97.84%
Advanced Behavioral Health 132 129 97.73%
Supportive Environmental Living Facility Inc-SELF 44 43 97.73%
Catholic Charities- Waterbury 77 75 97.40%
Family and Children’s Agency Inc 155 150 96.77%
Kennedy Center Inc. 85 82 96.47%
Bristol Hospital 106 102 96.23%
Liberty Community Services 51 49 96.08%
Optimus Health Care-Bennett Behavioral Health 75 72 96.00%
United Community and Family Services 50 48 96.00%
New Milford Hospital 117 112 95.73%
Community Enterprises Inc. 46 44 95.65%
CommuniCare Inc 113 108 95.58%
Waterbury Hospital Health Center 45 43 95.56%
Yale University-Behavioral Health 108 103 95.37%
Farrell Treatment Center 192 183 95.31%
St. Mary's Hospital Corporation 170 162 95.29%
Kuhn Employment Opportunities Inc. 39 37 94.87%
Operation Hope of Fairfield Inc. 38 36 94.74%
Hartford Dispensary 1624 1536 94.58%
Center for Human Development 200 189 94.50%
Goodwill of Western and Northern CT Inc. 88 83 94.32%
United Services Inc. 379 357 94.20%
New Reach, Inc. 34 32 94.12%
Bridge House 100 94 94.00%
Pathways Inc. 83 78 93.98%
Fellowship Inc. 277 260 93.86%
Recovery Network of Programs 439 412 93.85%
Catholic Charities of Fairfield County Inc. 146 137 93.84%
Continuum of Care 178 167 93.82%
McCall Foundation Inc 128 120 93.75%
Connecticut Renaissance Inc. 455 426 93.63%
Inspirica Inc. (formerly St Luke's LifeWorks) 77 72 93.51%
Western Connecticut Mental Health Network 642 599 93.30%
Liberation Programs 189 176 93.12%
St. Vincent DePaul Place Middletown Inc. 41 38 92.68%
Charlotte Hungerford Hospital 259 240 92.66%

42
Provider Total
Surveys Satisfied Percent Satisfied
Marrakech Day Services 107 99 92.52%
Norwalk Hospital 231 213 92.21%
Connecticut Mental Health Center 692 638 92.20%
Catholic Charities - Institute for the Hispanic Family 102 94 92.16%
APT Foundation Inc 632 582 92.09%
BH Care (formerly Harbor and Birmingham) 706 650 92.07%
My Sisters' Place 49 45 91.84%
Chrysalis Center Inc. 432 396 91.67%
Keystone House Inc. 108 99 91.67%
Stafford Family Services 60 55 91.67%
Natchaug Hospital 143 131 91.61%
Reliance House 116 106 91.38%
Easter Seal Goodwill Ind. Rehab. Center Inc. 56 51 91.07%
Community Health Resources Inc. 795 724 91.07%
Central CT Coast YMCA 44 40 90.91%
Yale University - WAGE 33 30 90.91%
Community Mental Health Affiliates 455 413 90.77%
Mercy Housing and Shelter Corporation 118 107 90.68%
Connection Inc 361 327 90.58%
Columbus House 124 112 90.32%
St. Vincent DePaul Mission of Waterbury Inc. 61 55 90.16%
Hartford Behavioral Health 149 134 89.93%
Alcohol and Drug Recovery Center ADRC 403 362 89.83%
Connecticut Counseling Centers Inc. 432 386 89.35%
Laurel House 187 167 89.30%
Chemical Abuse Services Agency (CASA) 316 282 89.24%
Bridges 223 198 88.79%
Sound Community Services Inc. 206 182 88.35%
Southwest Connecticut Mental Health System 240 212 88.33%
Mental Health Association of CT Inc. 411 363 88.32%
Capitol Region Mental Health Center 179 158 88.27%
Guardian Ad Litem 136 120 88.24%
Hospital of St. Raphael 85 75 88.24%
Community Renewal Team (CRT) 169 149 88.17%
Middlesex Hospital Mental Health Clinic 72 63 87.50%
Perception Programs Inc 168 147 87.50%
Central Naugatuck Valley (CNV) Help Inc. 220 192 87.27%
Ability Beyond 129 112 86.82%
Wellmore (Morris Foundation Inc) 407 351 86.24%
SCADD 283 243 85.87%
Southeastern Mental Health Authority 131 112 85.50%
Midwestern CT Council on Alcoholism (MCCA) 1301 1108 85.17%
Gilead Community Services Inc. 155 131 84.52%
New Directions Inc of North Central Conn. 135 114 84.44%
Rushford Center 1197 1003 83.79%
Crossroads Inc 104 87 83.65%
Wheeler Clinic 578 471 81.49%
Shelter for the Homeless Inc. 74 60 81.08%
Hartford Hospital 1252 1012 80.83%
River Valley Services 183 147 80.33%
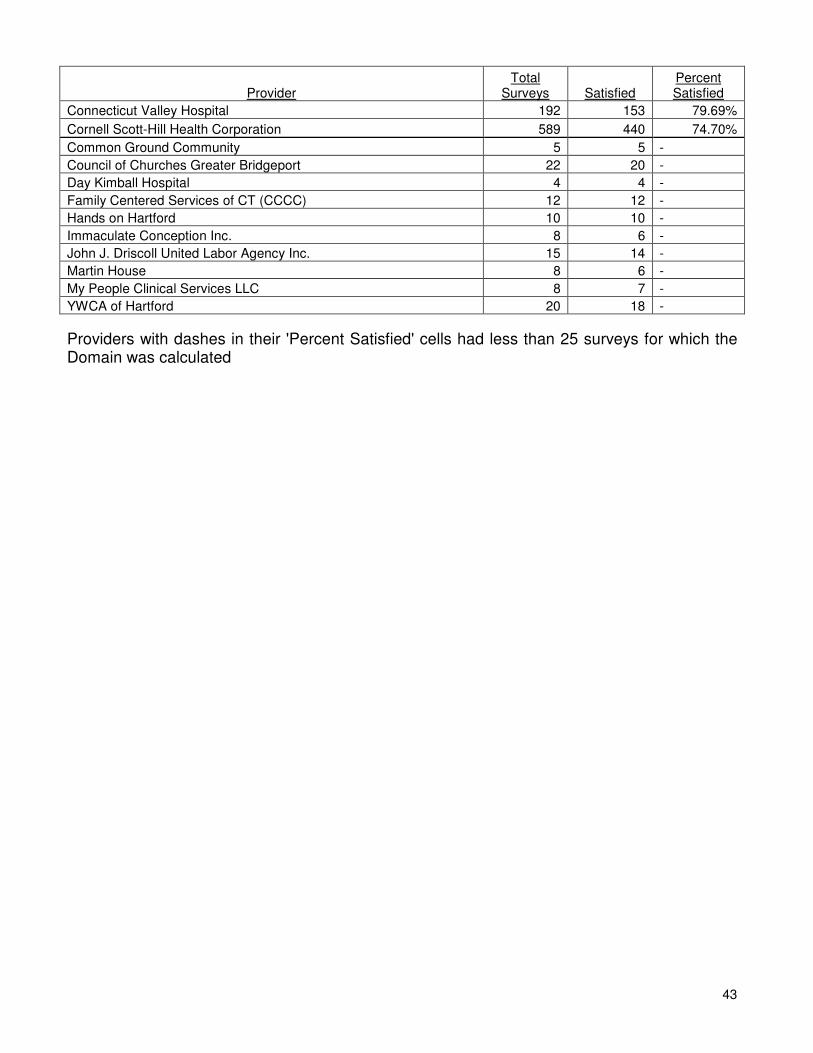
43
Provider Total
Surveys Satisfied Percent Satisfied
Connecticut Valley Hospital 192 153 79.69%
Cornell Scott-Hill Health Corporation 589 440 74.70%
Common Ground Community 5 5 -
Council of Churches Greater Bridgeport 22 20 -
Day Kimball Hospital 4 4 -
Family Centered Services of CT (CCCC) 12 12 -
Hands on Hartford 10 10 -
Immaculate Conception Inc. 8 6 -
John J. Driscoll United Labor Agency Inc. 15 14 -
Martin House 8 6 -
My People Clinical Services LLC 8 7 -
YWCA of Hartford 20 18 -
Providers with dashes in their 'Percent Satisfied' cells had less than 25 surveys for which the Domain was calculated
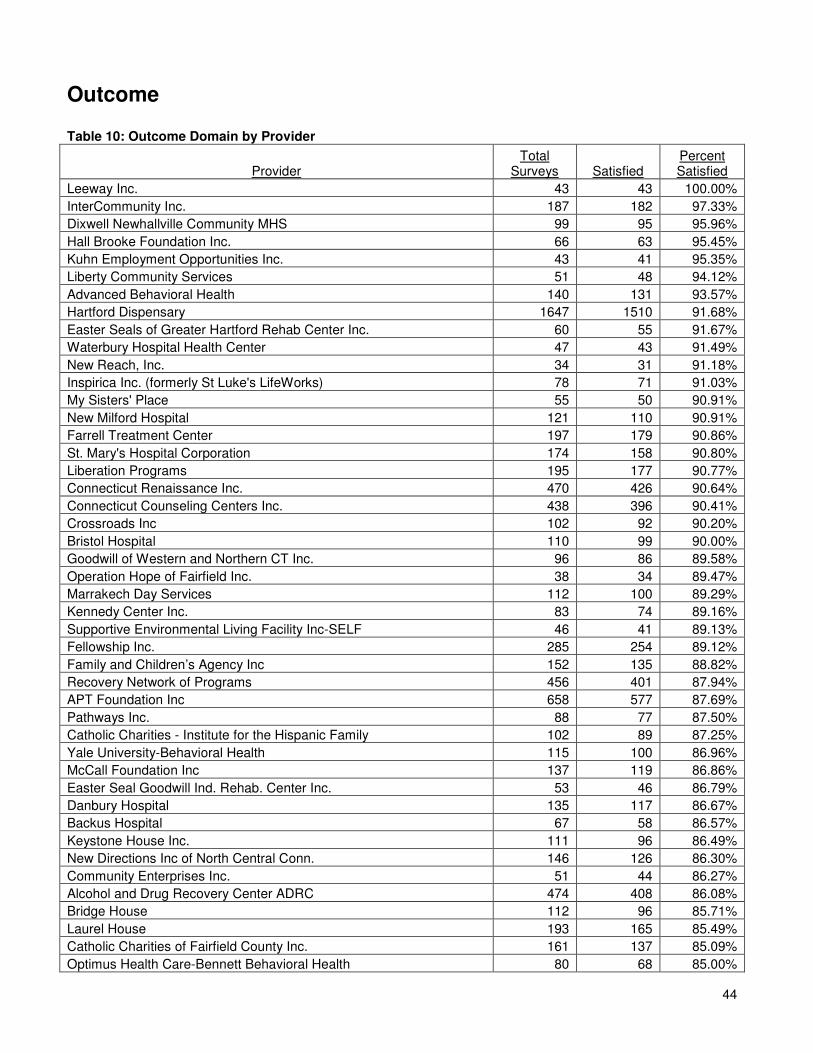
44
Outcome Table 10: Outcome Domain by Provider
Provider Total
Surveys Satisfied Percent Satisfied
Leeway Inc. 43 43 100.00%
InterCommunity Inc. 187 182 97.33%
Dixwell Newhallville Community MHS 99 95 95.96%
Hall Brooke Foundation Inc. 66 63 95.45%
Kuhn Employment Opportunities Inc. 43 41 95.35%
Liberty Community Services 51 48 94.12%
Advanced Behavioral Health 140 131 93.57%
Hartford Dispensary 1647 1510 91.68%
Easter Seals of Greater Hartford Rehab Center Inc. 60 55 91.67%
Waterbury Hospital Health Center 47 43 91.49%
New Reach, Inc. 34 31 91.18%
Inspirica Inc. (formerly St Luke's LifeWorks) 78 71 91.03%
My Sisters' Place 55 50 90.91%
New Milford Hospital 121 110 90.91%
Farrell Treatment Center 197 179 90.86%
St. Mary's Hospital Corporation 174 158 90.80%
Liberation Programs 195 177 90.77%
Connecticut Renaissance Inc. 470 426 90.64%
Connecticut Counseling Centers Inc. 438 396 90.41%
Crossroads Inc 102 92 90.20%
Bristol Hospital 110 99 90.00%
Goodwill of Western and Northern CT Inc. 96 86 89.58%
Operation Hope of Fairfield Inc. 38 34 89.47%
Marrakech Day Services 112 100 89.29%
Kennedy Center Inc. 83 74 89.16%
Supportive Environmental Living Facility Inc-SELF 46 41 89.13%
Fellowship Inc. 285 254 89.12%
Family and Children’s Agency Inc 152 135 88.82%
Recovery Network of Programs 456 401 87.94%
APT Foundation Inc 658 577 87.69%
Pathways Inc. 88 77 87.50%
Catholic Charities - Institute for the Hispanic Family 102 89 87.25%
Yale University-Behavioral Health 115 100 86.96%
McCall Foundation Inc 137 119 86.86%
Easter Seal Goodwill Ind. Rehab. Center Inc. 53 46 86.79%
Danbury Hospital 135 117 86.67%
Backus Hospital 67 58 86.57%
Keystone House Inc. 111 96 86.49%
New Directions Inc of North Central Conn. 146 126 86.30%
Community Enterprises Inc. 51 44 86.27%
Alcohol and Drug Recovery Center ADRC 474 408 86.08%
Bridge House 112 96 85.71%
Laurel House 193 165 85.49%
Catholic Charities of Fairfield County Inc. 161 137 85.09%
Optimus Health Care-Bennett Behavioral Health 80 68 85.00%
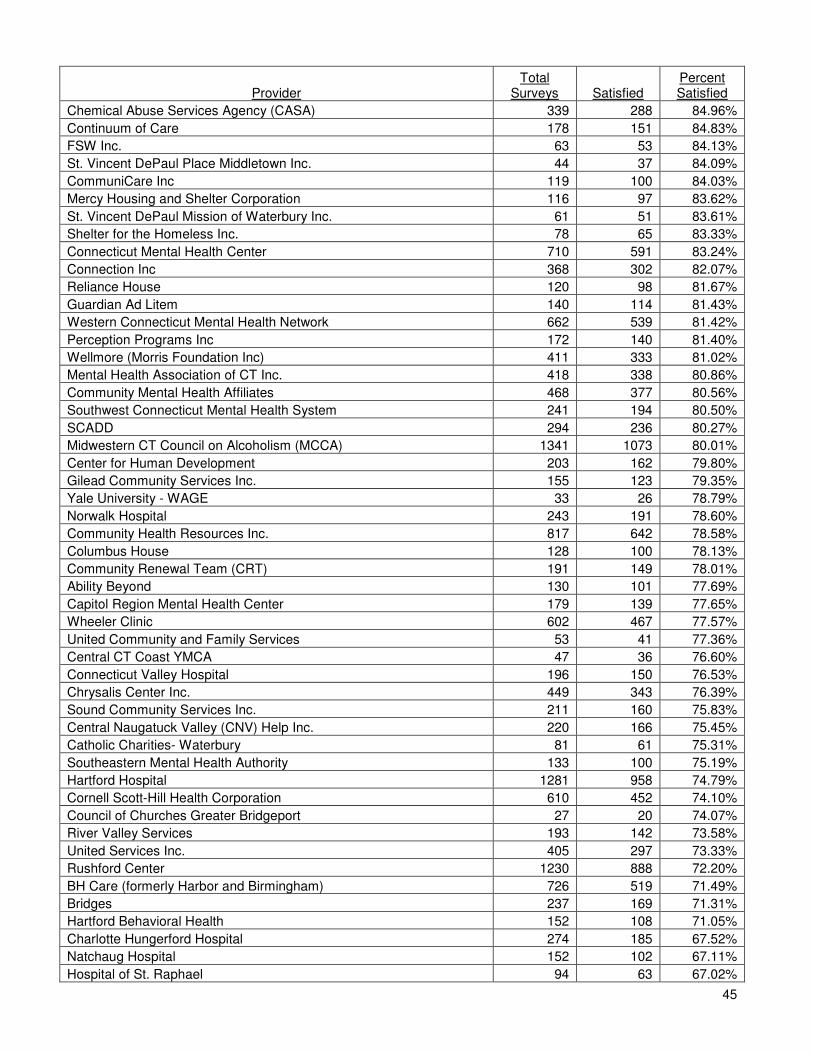
45
Provider Total
Surveys Satisfied Percent Satisfied
Chemical Abuse Services Agency (CASA) 339 288 84.96%
Continuum of Care 178 151 84.83%
FSW Inc. 63 53 84.13%
St. Vincent DePaul Place Middletown Inc. 44 37 84.09%
CommuniCare Inc 119 100 84.03%
Mercy Housing and Shelter Corporation 116 97 83.62%
St. Vincent DePaul Mission of Waterbury Inc. 61 51 83.61%
Shelter for the Homeless Inc. 78 65 83.33%
Connecticut Mental Health Center 710 591 83.24%
Connection Inc 368 302 82.07%
Reliance House 120 98 81.67%
Guardian Ad Litem 140 114 81.43%
Western Connecticut Mental Health Network 662 539 81.42%
Perception Programs Inc 172 140 81.40%
Wellmore (Morris Foundation Inc) 411 333 81.02%
Mental Health Association of CT Inc. 418 338 80.86%
Community Mental Health Affiliates 468 377 80.56%
Southwest Connecticut Mental Health System 241 194 80.50%
SCADD 294 236 80.27%
Midwestern CT Council on Alcoholism (MCCA) 1341 1073 80.01%
Center for Human Development 203 162 79.80%
Gilead Community Services Inc. 155 123 79.35%
Yale University - WAGE 33 26 78.79%
Norwalk Hospital 243 191 78.60%
Community Health Resources Inc. 817 642 78.58%
Columbus House 128 100 78.13%
Community Renewal Team (CRT) 191 149 78.01%
Ability Beyond 130 101 77.69%
Capitol Region Mental Health Center 179 139 77.65%
Wheeler Clinic 602 467 77.57%
United Community and Family Services 53 41 77.36%
Central CT Coast YMCA 47 36 76.60%
Connecticut Valley Hospital 196 150 76.53%
Chrysalis Center Inc. 449 343 76.39%
Sound Community Services Inc. 211 160 75.83%
Central Naugatuck Valley (CNV) Help Inc. 220 166 75.45%
Catholic Charities- Waterbury 81 61 75.31%
Southeastern Mental Health Authority 133 100 75.19%
Hartford Hospital 1281 958 74.79%
Cornell Scott-Hill Health Corporation 610 452 74.10%
Council of Churches Greater Bridgeport 27 20 74.07%
River Valley Services 193 142 73.58%
United Services Inc. 405 297 73.33%
Rushford Center 1230 888 72.20%
BH Care (formerly Harbor and Birmingham) 726 519 71.49%
Bridges 237 169 71.31%
Hartford Behavioral Health 152 108 71.05%
Charlotte Hungerford Hospital 274 185 67.52%
Natchaug Hospital 152 102 67.11%
Hospital of St. Raphael 94 63 67.02%
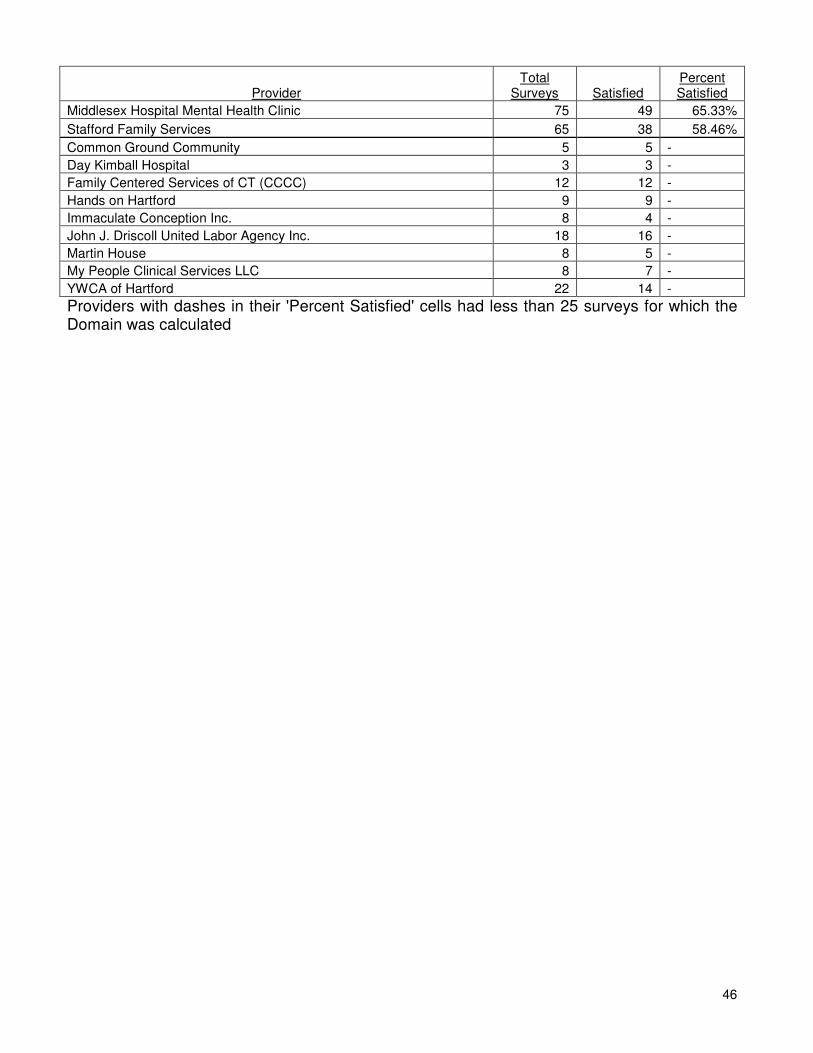
46
Provider Total
Surveys Satisfied Percent Satisfied
Middlesex Hospital Mental Health Clinic 75 49 65.33%
Stafford Family Services 65 38 58.46%
Common Ground Community 5 5 -
Day Kimball Hospital 3 3 -
Family Centered Services of CT (CCCC) 12 12 -
Hands on Hartford 9 9 -
Immaculate Conception Inc. 8 4 -
John J. Driscoll United Labor Agency Inc. 18 16 -
Martin House 8 5 -
My People Clinical Services LLC 8 7 -
YWCA of Hartford 22 14 -
Providers with dashes in their 'Percent Satisfied' cells had less than 25 surveys for which the Domain was calculated
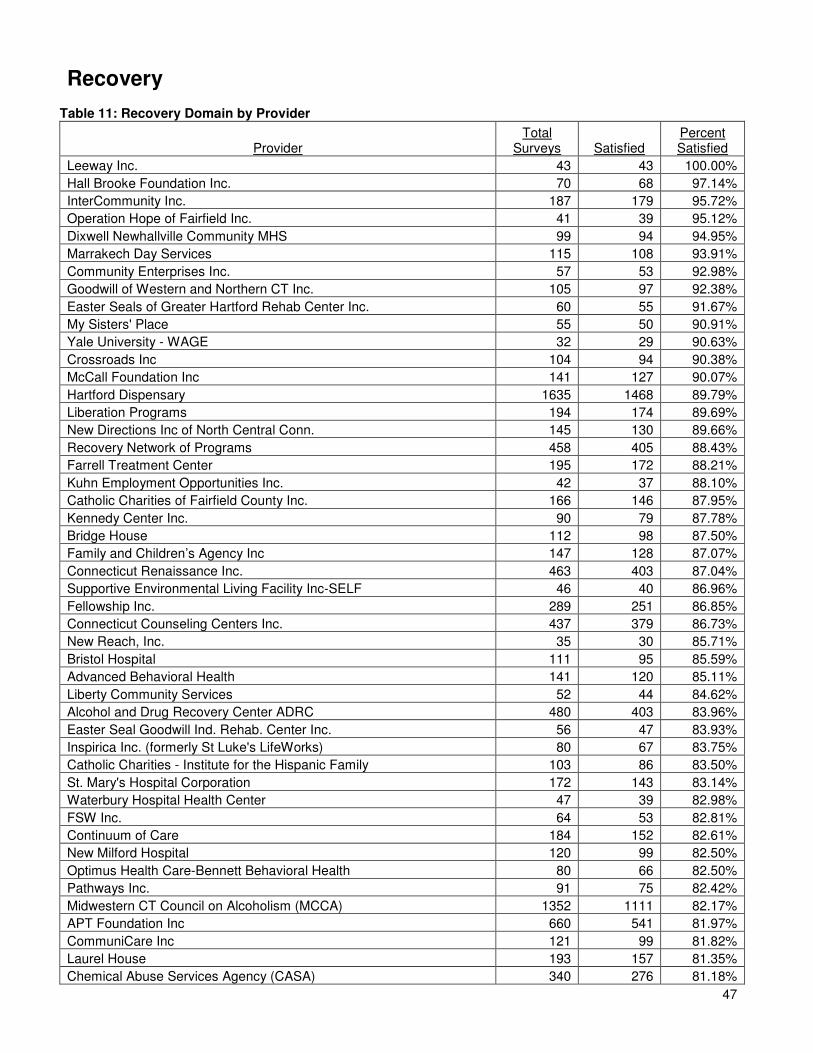
47
Recovery
Table 11: Recovery Domain by Provider
Provider Total
Surveys Satisfied Percent Satisfied
Leeway Inc. 43 43 100.00%
Hall Brooke Foundation Inc. 70 68 97.14%
InterCommunity Inc. 187 179 95.72%
Operation Hope of Fairfield Inc. 41 39 95.12%
Dixwell Newhallville Community MHS 99 94 94.95%
Marrakech Day Services 115 108 93.91%
Community Enterprises Inc. 57 53 92.98%
Goodwill of Western and Northern CT Inc. 105 97 92.38%
Easter Seals of Greater Hartford Rehab Center Inc. 60 55 91.67%
My Sisters' Place 55 50 90.91%
Yale University - WAGE 32 29 90.63%
Crossroads Inc 104 94 90.38%
McCall Foundation Inc 141 127 90.07%
Hartford Dispensary 1635 1468 89.79%
Liberation Programs 194 174 89.69%
New Directions Inc of North Central Conn. 145 130 89.66%
Recovery Network of Programs 458 405 88.43%
Farrell Treatment Center 195 172 88.21%
Kuhn Employment Opportunities Inc. 42 37 88.10%
Catholic Charities of Fairfield County Inc. 166 146 87.95%
Kennedy Center Inc. 90 79 87.78%
Bridge House 112 98 87.50%
Family and Children’s Agency Inc 147 128 87.07%
Connecticut Renaissance Inc. 463 403 87.04%
Supportive Environmental Living Facility Inc-SELF 46 40 86.96%
Fellowship Inc. 289 251 86.85%
Connecticut Counseling Centers Inc. 437 379 86.73%
New Reach, Inc. 35 30 85.71%
Bristol Hospital 111 95 85.59%
Advanced Behavioral Health 141 120 85.11%
Liberty Community Services 52 44 84.62%
Alcohol and Drug Recovery Center ADRC 480 403 83.96%
Easter Seal Goodwill Ind. Rehab. Center Inc. 56 47 83.93%
Inspirica Inc. (formerly St Luke's LifeWorks) 80 67 83.75%
Catholic Charities - Institute for the Hispanic Family 103 86 83.50%
St. Mary's Hospital Corporation 172 143 83.14%
Waterbury Hospital Health Center 47 39 82.98%
FSW Inc. 64 53 82.81%
Continuum of Care 184 152 82.61%
New Milford Hospital 120 99 82.50%
Optimus Health Care-Bennett Behavioral Health 80 66 82.50%
Pathways Inc. 91 75 82.42%
Midwestern CT Council on Alcoholism (MCCA) 1352 1111 82.17%
APT Foundation Inc 660 541 81.97%
CommuniCare Inc 121 99 81.82%
Laurel House 193 157 81.35%
Chemical Abuse Services Agency (CASA) 340 276 81.18%
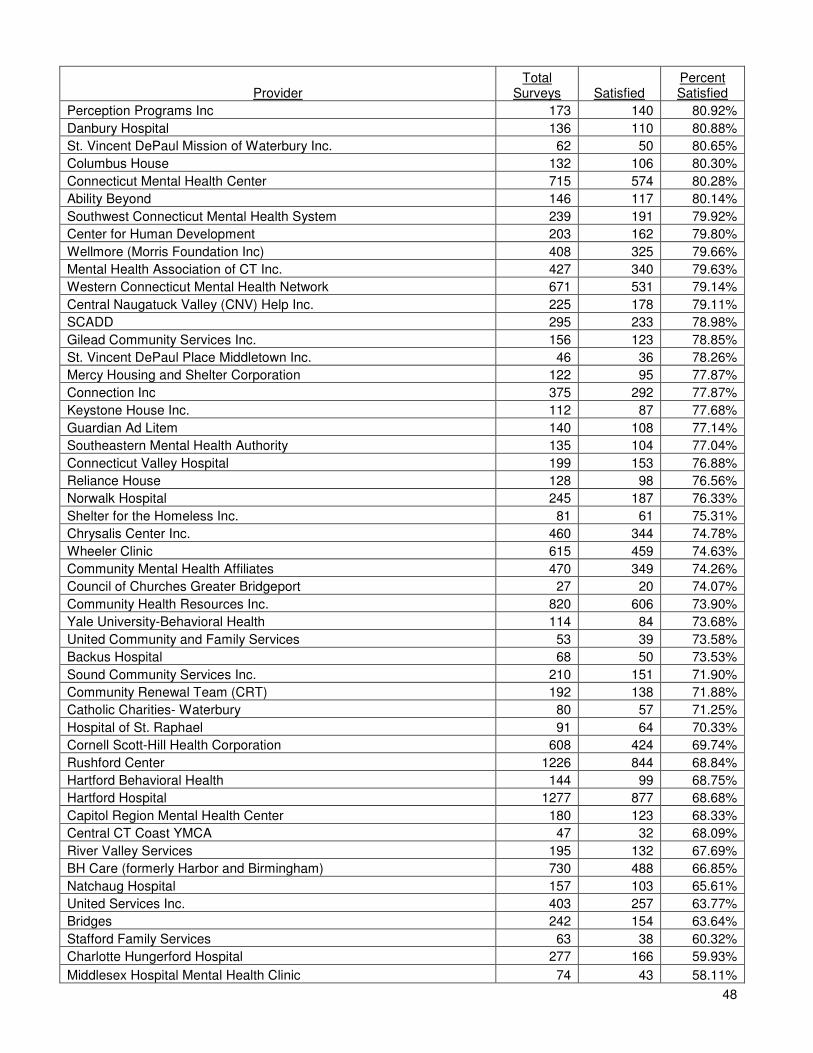
48
Provider Total
Surveys Satisfied Percent Satisfied
Perception Programs Inc 173 140 80.92%
Danbury Hospital 136 110 80.88%
St. Vincent DePaul Mission of Waterbury Inc. 62 50 80.65%
Columbus House 132 106 80.30%
Connecticut Mental Health Center 715 574 80.28%
Ability Beyond 146 117 80.14%
Southwest Connecticut Mental Health System 239 191 79.92%
Center for Human Development 203 162 79.80%
Wellmore (Morris Foundation Inc) 408 325 79.66%
Mental Health Association of CT Inc. 427 340 79.63%
Western Connecticut Mental Health Network 671 531 79.14%
Central Naugatuck Valley (CNV) Help Inc. 225 178 79.11%
SCADD 295 233 78.98%
Gilead Community Services Inc. 156 123 78.85%
St. Vincent DePaul Place Middletown Inc. 46 36 78.26%
Mercy Housing and Shelter Corporation 122 95 77.87%
Connection Inc 375 292 77.87%
Keystone House Inc. 112 87 77.68%
Guardian Ad Litem 140 108 77.14%
Southeastern Mental Health Authority 135 104 77.04%
Connecticut Valley Hospital 199 153 76.88%
Reliance House 128 98 76.56%
Norwalk Hospital 245 187 76.33%
Shelter for the Homeless Inc. 81 61 75.31%
Chrysalis Center Inc. 460 344 74.78%
Wheeler Clinic 615 459 74.63%
Community Mental Health Affiliates 470 349 74.26%
Council of Churches Greater Bridgeport 27 20 74.07%
Community Health Resources Inc. 820 606 73.90%
Yale University-Behavioral Health 114 84 73.68%
United Community and Family Services 53 39 73.58%
Backus Hospital 68 50 73.53%
Sound Community Services Inc. 210 151 71.90%
Community Renewal Team (CRT) 192 138 71.88%
Catholic Charities- Waterbury 80 57 71.25%
Hospital of St. Raphael 91 64 70.33%
Cornell Scott-Hill Health Corporation 608 424 69.74%
Rushford Center 1226 844 68.84%
Hartford Behavioral Health 144 99 68.75%
Hartford Hospital 1277 877 68.68%
Capitol Region Mental Health Center 180 123 68.33%
Central CT Coast YMCA 47 32 68.09%
River Valley Services 195 132 67.69%
BH Care (formerly Harbor and Birmingham) 730 488 66.85%
Natchaug Hospital 157 103 65.61%
United Services Inc. 403 257 63.77%
Bridges 242 154 63.64%
Stafford Family Services 63 38 60.32%
Charlotte Hungerford Hospital 277 166 59.93%
Middlesex Hospital Mental Health Clinic 74 43 58.11%
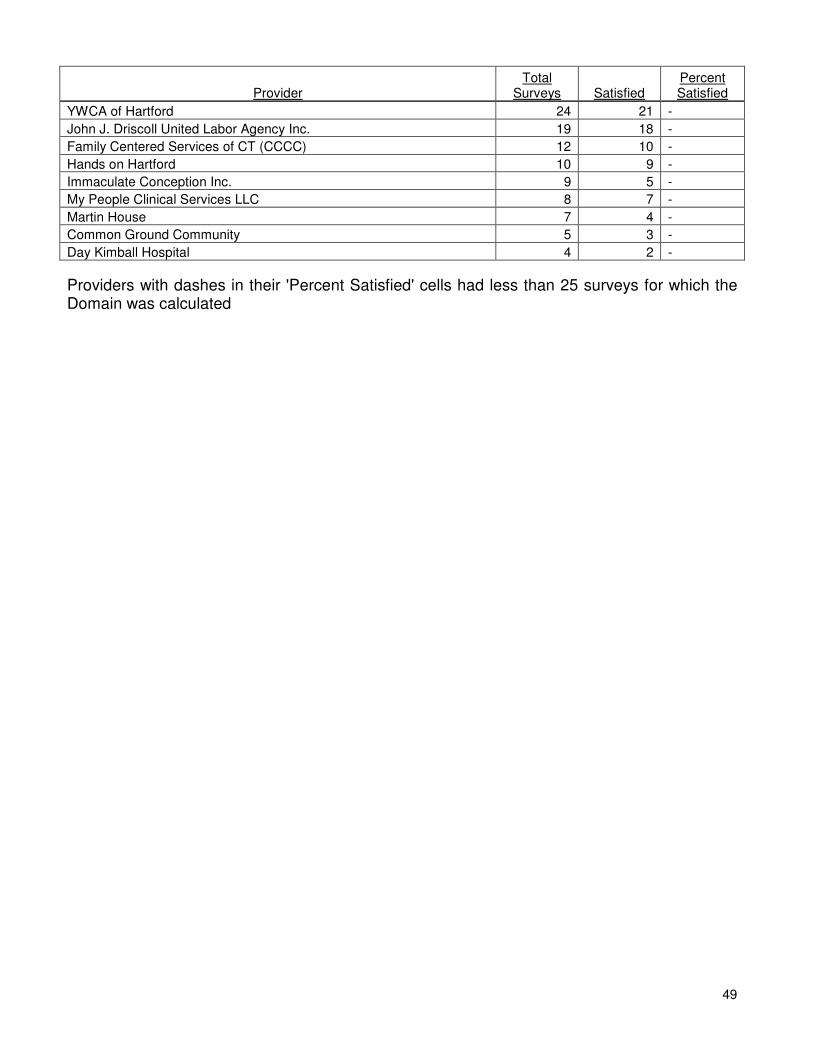
49
Provider Total
Surveys Satisfied Percent Satisfied
YWCA of Hartford 24 21 -
John J. Driscoll United Labor Agency Inc. 19 18 -
Family Centered Services of CT (CCCC) 12 10 -
Hands on Hartford 10 9 -
Immaculate Conception Inc. 9 5 -
My People Clinical Services LLC 8 7 -
Martin House 7 4 -
Common Ground Community 5 3 -
Day Kimball Hospital 4 2 -
Providers with dashes in their 'Percent Satisfied' cells had less than 25 surveys for which the Domain was calculated
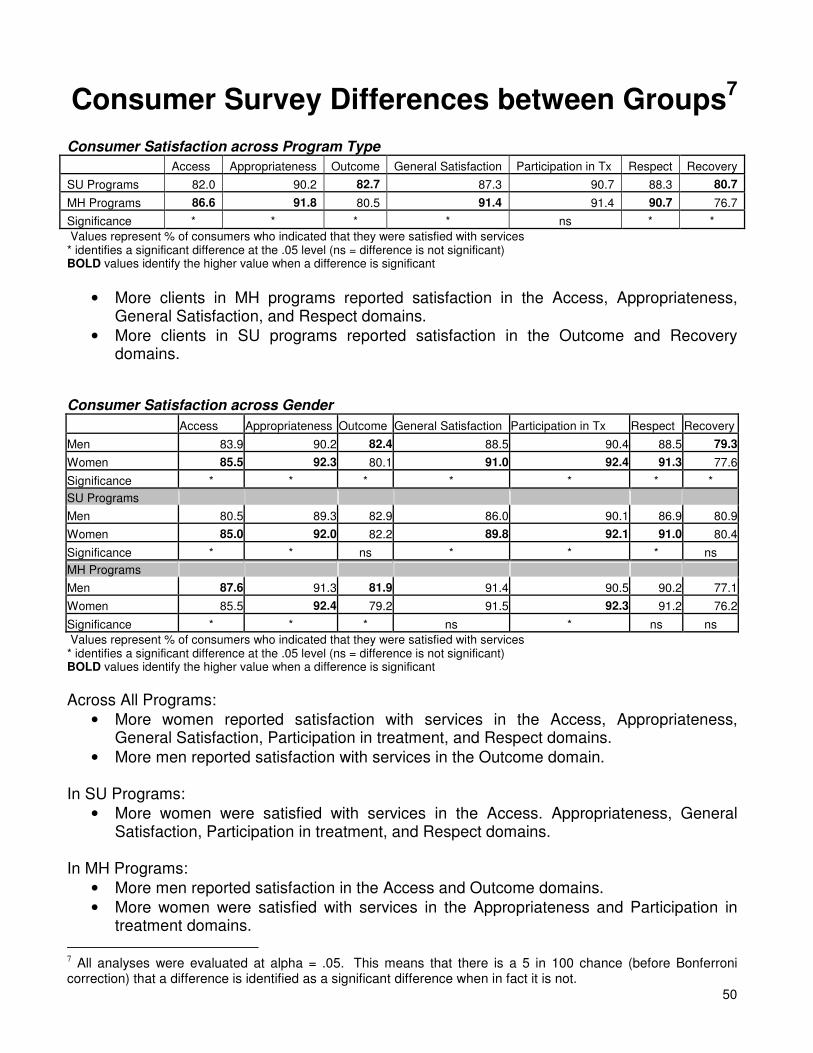
50
Consumer Survey Differences between Groups7
Consumer Satisfaction across Program Type
Access Appropriateness Outcome General Satisfaction Participation in Tx Respect Recovery
SU Programs 82.0 90.2 82.7 87.3 90.7 88.3 80.7
MH Programs 86.6 91.8 80.5 91.4 91.4 90.7 76.7
Significance * * * * ns * *
Values represent % of consumers who indicated that they were satisfied with services * identifies a significant difference at the .05 level (ns = difference is not significant) BOLD values identify the higher value when a difference is significant
• More clients in MH programs reported satisfaction in the Access, Appropriateness, General Satisfaction, and Respect domains.
• More clients in SU programs reported satisfaction in the Outcome and Recovery domains.
Consumer Satisfaction across Gender
Access Appropriateness Outcome General Satisfaction Participation in Tx Respect Recovery
Men 83.9 90.2 82.4 88.5 90.4 88.5 79.3
Women 85.5 92.3 80.1 91.0 92.4 91.3 77.6
Significance * * * * * * *
SU Programs
Men 80.5 89.3 82.9 86.0 90.1 86.9 80.9
Women 85.0 92.0 82.2 89.8 92.1 91.0 80.4
Significance * * ns * * * ns
MH Programs
Men 87.6 91.3 81.9 91.4 90.5 90.2 77.1
Women 85.5 92.4 79.2 91.5 92.3 91.2 76.2
Significance * * * ns * ns ns
Values represent % of consumers who indicated that they were satisfied with services * identifies a significant difference at the .05 level (ns = difference is not significant) BOLD values identify the higher value when a difference is significant
Across All Programs:
• More women reported satisfaction with services in the Access, Appropriateness, General Satisfaction, Participation in treatment, and Respect domains.
• More men reported satisfaction with services in the Outcome domain. In SU Programs:
• More women were satisfied with services in the Access. Appropriateness, General Satisfaction, Participation in treatment, and Respect domains.
In MH Programs:
• More men reported satisfaction in the Access and Outcome domains.
• More women were satisfied with services in the Appropriateness and Participation in treatment domains.
7 All analyses were evaluated at alpha = .05. This means that there is a 5 in 100 chance (before Bonferroni correction) that a difference is identified as a significant difference when in fact it is not.
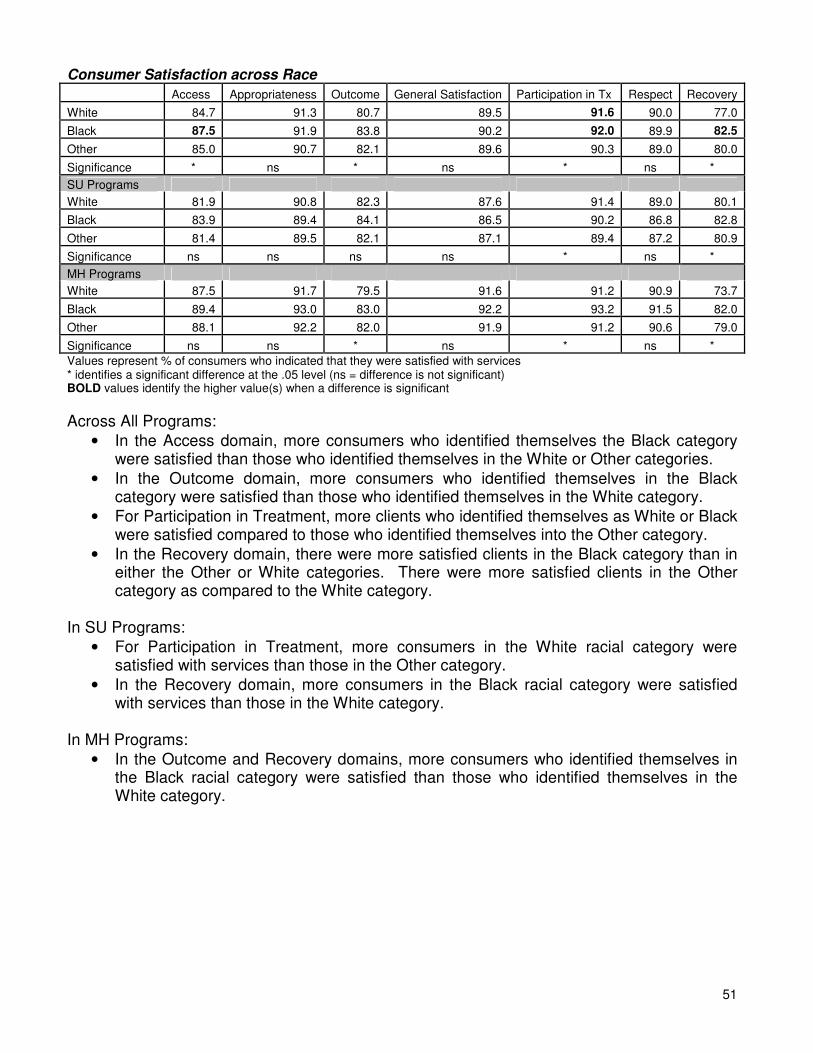
51
Consumer Satisfaction across Race
Access Appropriateness Outcome General Satisfaction Participation in Tx Respect Recovery
White 84.7 91.3 80.7 89.5 91.6 90.0 77.0
Black 87.5 91.9 83.8 90.2 92.0 89.9 82.5
Other 85.0 90.7 82.1 89.6 90.3 89.0 80.0
Significance * ns * ns * ns *
SU Programs
White 81.9 90.8 82.3 87.6 91.4 89.0 80.1
Black 83.9 89.4 84.1 86.5 90.2 86.8 82.8
Other 81.4 89.5 82.1 87.1 89.4 87.2 80.9
Significance ns ns ns ns * ns *
MH Programs
White 87.5 91.7 79.5 91.6 91.2 90.9 73.7
Black 89.4 93.0 83.0 92.2 93.2 91.5 82.0
Other 88.1 92.2 82.0 91.9 91.2 90.6 79.0
Significance ns ns * ns * ns *
Values represent % of consumers who indicated that they were satisfied with services * identifies a significant difference at the .05 level (ns = difference is not significant) BOLD values identify the higher value(s) when a difference is significant
Across All Programs:
• In the Access domain, more consumers who identified themselves the Black category were satisfied than those who identified themselves in the White or Other categories.
• In the Outcome domain, more consumers who identified themselves in the Black category were satisfied than those who identified themselves in the White category.
• For Participation in Treatment, more clients who identified themselves as White or Black were satisfied compared to those who identified themselves into the Other category.
• In the Recovery domain, there were more satisfied clients in the Black category than in either the Other or White categories. There were more satisfied clients in the Other category as compared to the White category.
In SU Programs:
• For Participation in Treatment, more consumers in the White racial category were satisfied with services than those in the Other category.
• In the Recovery domain, more consumers in the Black racial category were satisfied with services than those in the White category.
In MH Programs:
• In the Outcome and Recovery domains, more consumers who identified themselves in the Black racial category were satisfied than those who identified themselves in the White category.
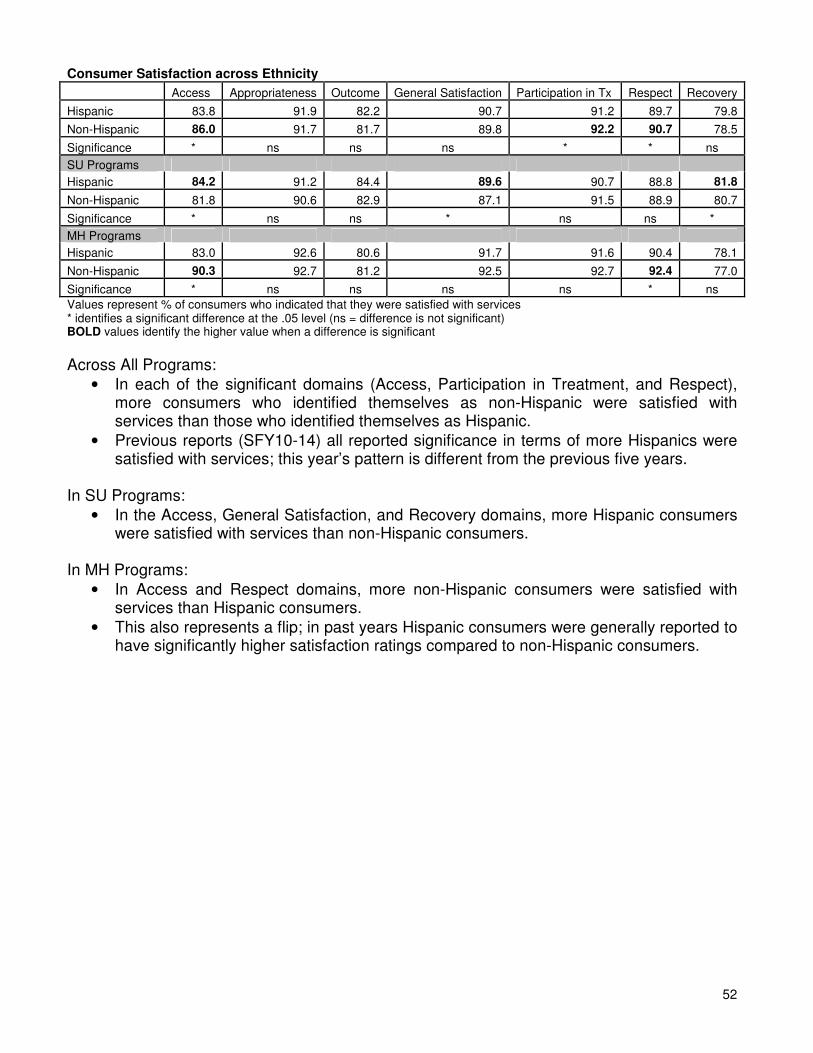
52
Consumer Satisfaction across Ethnicity
Access Appropriateness Outcome General Satisfaction Participation in Tx Respect Recovery
Hispanic 83.8 91.9 82.2 90.7 91.2 89.7 79.8
Non-Hispanic 86.0 91.7 81.7 89.8 92.2 90.7 78.5
Significance * ns ns ns * * ns
SU Programs
Hispanic 84.2 91.2 84.4 89.6 90.7 88.8 81.8
Non-Hispanic 81.8 90.6 82.9 87.1 91.5 88.9 80.7
Significance * ns ns * ns ns *
MH Programs
Hispanic 83.0 92.6 80.6 91.7 91.6 90.4 78.1
Non-Hispanic 90.3 92.7 81.2 92.5 92.7 92.4 77.0
Significance * ns ns ns ns * ns
Values represent % of consumers who indicated that they were satisfied with services * identifies a significant difference at the .05 level (ns = difference is not significant) BOLD values identify the higher value when a difference is significant
Across All Programs:
• In each of the significant domains (Access, Participation in Treatment, and Respect), more consumers who identified themselves as non-Hispanic were satisfied with services than those who identified themselves as Hispanic.
• Previous reports (SFY10-14) all reported significance in terms of more Hispanics were satisfied with services; this year’s pattern is different from the previous five years.
In SU Programs:
• In the Access, General Satisfaction, and Recovery domains, more Hispanic consumers were satisfied with services than non-Hispanic consumers.
In MH Programs:
• In Access and Respect domains, more non-Hispanic consumers were satisfied with services than Hispanic consumers.
• This also represents a flip; in past years Hispanic consumers were generally reported to have significantly higher satisfaction ratings compared to non-Hispanic consumers.
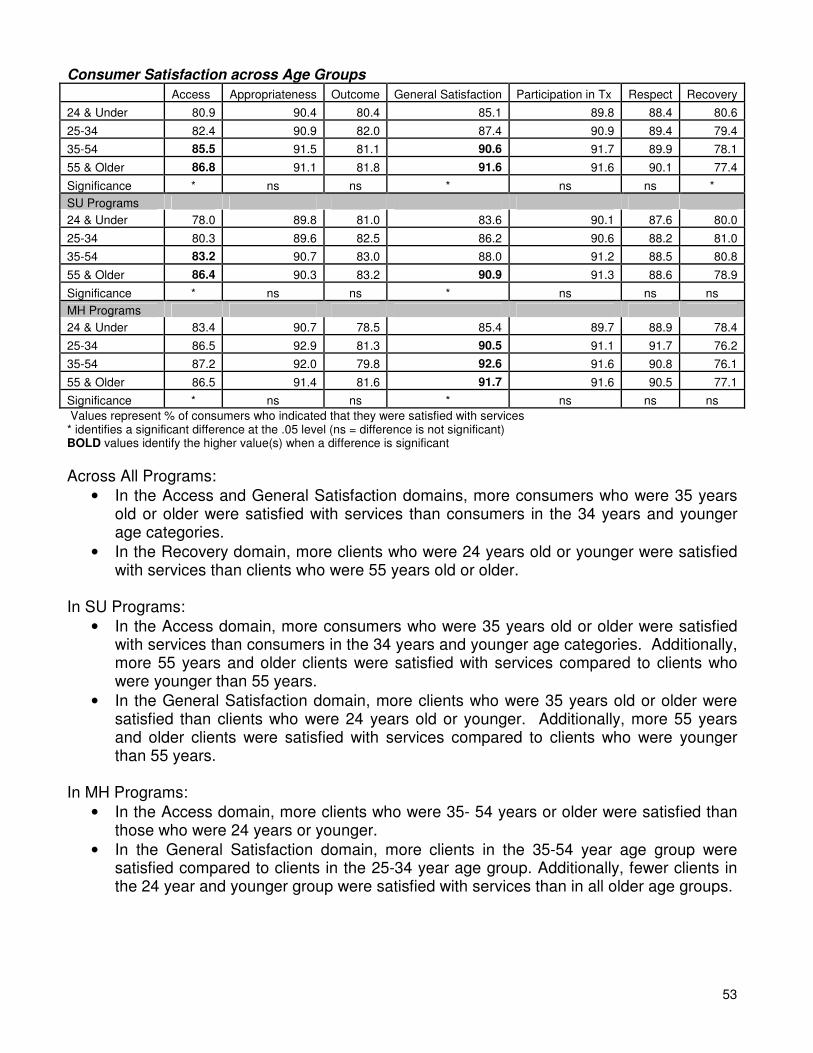
53
Consumer Satisfaction across Age Groups
Access Appropriateness Outcome General Satisfaction Participation in Tx Respect Recovery
24 & Under 80.9 90.4 80.4 85.1 89.8 88.4 80.6
25-34 82.4 90.9 82.0 87.4 90.9 89.4 79.4
35-54 85.5 91.5 81.1 90.6 91.7 89.9 78.1
55 & Older 86.8 91.1 81.8 91.6 91.6 90.1 77.4
Significance * ns ns * ns ns *
SU Programs
24 & Under 78.0 89.8 81.0 83.6 90.1 87.6 80.0
25-34 80.3 89.6 82.5 86.2 90.6 88.2 81.0
35-54 83.2 90.7 83.0 88.0 91.2 88.5 80.8
55 & Older 86.4 90.3 83.2 90.9 91.3 88.6 78.9
Significance * ns ns * ns ns ns
MH Programs
24 & Under 83.4 90.7 78.5 85.4 89.7 88.9 78.4
25-34 86.5 92.9 81.3 90.5 91.1 91.7 76.2
35-54 87.2 92.0 79.8 92.6 91.6 90.8 76.1
55 & Older 86.5 91.4 81.6 91.7 91.6 90.5 77.1
Significance * ns ns * ns ns ns
Values represent % of consumers who indicated that they were satisfied with services * identifies a significant difference at the .05 level (ns = difference is not significant) BOLD values identify the higher value(s) when a difference is significant
Across All Programs:
• In the Access and General Satisfaction domains, more consumers who were 35 years old or older were satisfied with services than consumers in the 34 years and younger age categories.
• In the Recovery domain, more clients who were 24 years old or younger were satisfied with services than clients who were 55 years old or older.
In SU Programs:
• In the Access domain, more consumers who were 35 years old or older were satisfied with services than consumers in the 34 years and younger age categories. Additionally, more 55 years and older clients were satisfied with services compared to clients who were younger than 55 years.
• In the General Satisfaction domain, more clients who were 35 years old or older were satisfied than clients who were 24 years old or younger. Additionally, more 55 years and older clients were satisfied with services compared to clients who were younger than 55 years.
In MH Programs:
• In the Access domain, more clients who were 35- 54 years or older were satisfied than those who were 24 years or younger.
• In the General Satisfaction domain, more clients in the 35-54 year age group were satisfied compared to clients in the 25-34 year age group. Additionally, fewer clients in the 24 year and younger group were satisfied with services than in all older age groups.
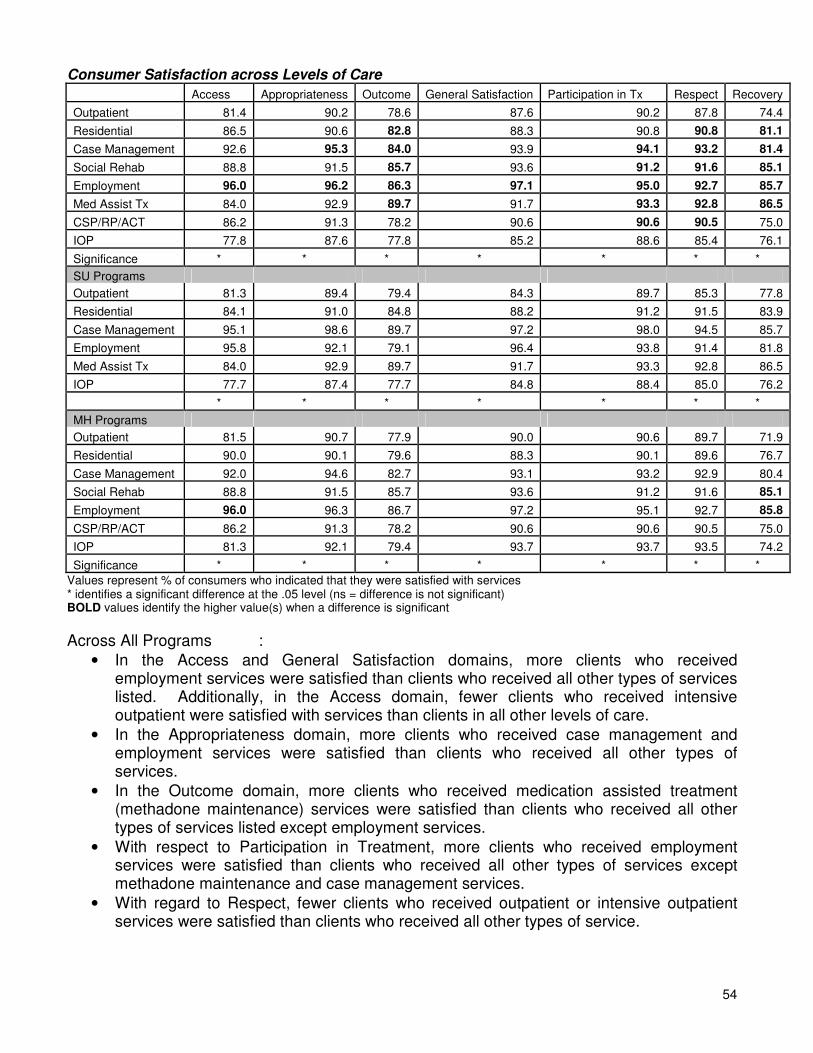
54
Consumer Satisfaction across Levels of Care
Access Appropriateness Outcome General Satisfaction Participation in Tx Respect Recovery
Outpatient 81.4 90.2 78.6 87.6 90.2 87.8 74.4
Residential 86.5 90.6 82.8 88.3 90.8 90.8 81.1
Case Management 92.6 95.3 84.0 93.9 94.1 93.2 81.4
Social Rehab 88.8 91.5 85.7 93.6 91.2 91.6 85.1
Employment 96.0 96.2 86.3 97.1 95.0 92.7 85.7
Med Assist Tx 84.0 92.9 89.7 91.7 93.3 92.8 86.5
CSP/RP/ACT 86.2 91.3 78.2 90.6 90.6 90.5 75.0
IOP 77.8 87.6 77.8 85.2 88.6 85.4 76.1
Significance * * * * * * *
SU Programs
Outpatient 81.3 89.4 79.4 84.3 89.7 85.3 77.8
Residential 84.1 91.0 84.8 88.2 91.2 91.5 83.9
Case Management 95.1 98.6 89.7 97.2 98.0 94.5 85.7
Employment 95.8 92.1 79.1 96.4 93.8 91.4 81.8
Med Assist Tx 84.0 92.9 89.7 91.7 93.3 92.8 86.5
IOP 77.7 87.4 77.7 84.8 88.4 85.0 76.2
* * * * * * *
MH Programs
Outpatient 81.5 90.7 77.9 90.0 90.6 89.7 71.9
Residential 90.0 90.1 79.6 88.3 90.1 89.6 76.7
Case Management 92.0 94.6 82.7 93.1 93.2 92.9 80.4
Social Rehab 88.8 91.5 85.7 93.6 91.2 91.6 85.1
Employment 96.0 96.3 86.7 97.2 95.1 92.7 85.8
CSP/RP/ACT 86.2 91.3 78.2 90.6 90.6 90.5 75.0
IOP 81.3 92.1 79.4 93.7 93.7 93.5 74.2
Significance * * * * * * *
Values represent % of consumers who indicated that they were satisfied with services * identifies a significant difference at the .05 level (ns = difference is not significant) BOLD values identify the higher value(s) when a difference is significant
Across All Programs :
• In the Access and General Satisfaction domains, more clients who received employment services were satisfied than clients who received all other types of services listed. Additionally, in the Access domain, fewer clients who received intensive outpatient were satisfied with services than clients in all other levels of care.
• In the Appropriateness domain, more clients who received case management and employment services were satisfied than clients who received all other types of services.
• In the Outcome domain, more clients who received medication assisted treatment (methadone maintenance) services were satisfied than clients who received all other types of services listed except employment services.
• With respect to Participation in Treatment, more clients who received employment services were satisfied than clients who received all other types of services except methadone maintenance and case management services.
• With regard to Respect, fewer clients who received outpatient or intensive outpatient services were satisfied than clients who received all other types of service.
55
• In the Recovery domain, more clients who received methadone maintenance services were satisfied than clients who received outpatient, residential, case management, CSP/RP/ACT or intensive outpatient services.
In SU Programs:
• In the Access domain, more clients who received case management services were satisfied than clients who received all other types of services except employment services.
• In the Appropriateness domain, more clients who received case management services were satisfied than clients who received all other types of services except employment services. .
• In the Outcome domain, more clients who received methadone maintenance services were satisfied than clients who received all other types of services except case management.
• In the General Satisfaction domain, more clients who received methadone maintenance services were satisfied than clients who received all other services except employment services.
• With respect to Participation in Treatment more clients who received case management services were satisfied than clients who received all other kinds of services except employment services.
• With regard to Respect and the Recovery domain, more clients who received residential, case management or methadone maintenance services were satisfied than clients who received outpatient or intensive outpatient services.
In MH Programs:
• In the Access domain, more clients who received vocational rehabilitation services were satisfied than clients who received all other types of services except intensive outpatient services.
• In the Appropriateness domain, more clients who received case management or vocational rehabilitation services were satisfied than clients who received all other treatment types except intensive outpatient services.
• In the Outcome domain, more clients who received case management, social rehabilitation, or employment services were satisfied than those who received outpatient services.
• In the General Satisfaction domain, more clients who received employment services were more satisfied than clients who received all other types of services except intensive outpatient services.
• With respect to Participation in Treatment more clients who received vocational rehabilitation services were satisfied than clients who received all other kids of services except case management services.
• With regard to Respect, more clients who received case management services were satisfied than clients who received outpatient services.
• In the Recovery domain, more clients who received social or vocational rehabilitation services were satisfied with those services than clients who received outpatient, residential, case management, or CSP/RP/ACT services.
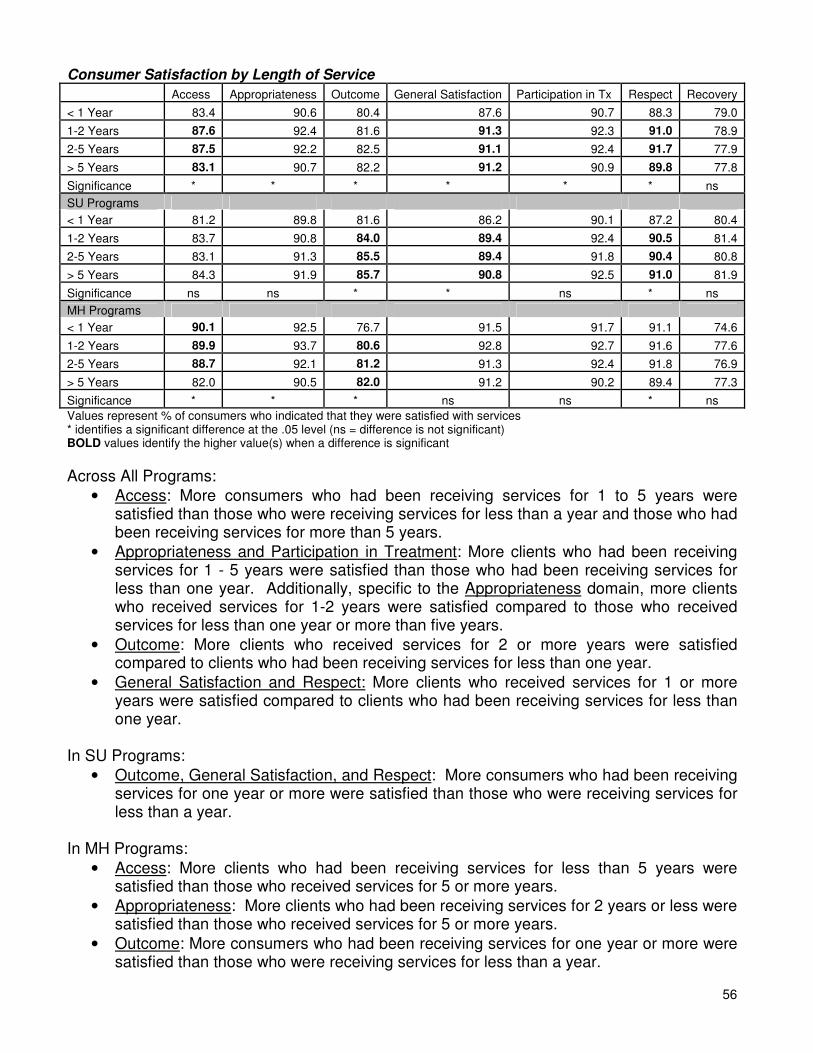
56
Consumer Satisfaction by Length of Service
Access Appropriateness Outcome General Satisfaction Participation in Tx Respect Recovery
< 1 Year 83.4 90.6 80.4 87.6 90.7 88.3 79.0
1-2 Years 87.6 92.4 81.6 91.3 92.3 91.0 78.9
2-5 Years 87.5 92.2 82.5 91.1 92.4 91.7 77.9
> 5 Years 83.1 90.7 82.2 91.2 90.9 89.8 77.8
Significance * * * * * * ns
SU Programs
< 1 Year 81.2 89.8 81.6 86.2 90.1 87.2 80.4
1-2 Years 83.7 90.8 84.0 89.4 92.4 90.5 81.4
2-5 Years 83.1 91.3 85.5 89.4 91.8 90.4 80.8
> 5 Years 84.3 91.9 85.7 90.8 92.5 91.0 81.9
Significance ns ns * * ns * ns
MH Programs
< 1 Year 90.1 92.5 76.7 91.5 91.7 91.1 74.6
1-2 Years 89.9 93.7 80.6 92.8 92.7 91.6 77.6
2-5 Years 88.7 92.1 81.2 91.3 92.4 91.8 76.9
> 5 Years 82.0 90.5 82.0 91.2 90.2 89.4 77.3
Significance * * * ns ns * ns
Values represent % of consumers who indicated that they were satisfied with services * identifies a significant difference at the .05 level (ns = difference is not significant) BOLD values identify the higher value(s) when a difference is significant
Across All Programs:
• Access: More consumers who had been receiving services for 1 to 5 years were satisfied than those who were receiving services for less than a year and those who had been receiving services for more than 5 years.
• Appropriateness and Participation in Treatment: More clients who had been receiving services for 1 - 5 years were satisfied than those who had been receiving services for less than one year. Additionally, specific to the Appropriateness domain, more clients who received services for 1-2 years were satisfied compared to those who received services for less than one year or more than five years.
• Outcome: More clients who received services for 2 or more years were satisfied compared to clients who had been receiving services for less than one year.
• General Satisfaction and Respect: More clients who received services for 1 or more years were satisfied compared to clients who had been receiving services for less than one year.
In SU Programs:
• Outcome, General Satisfaction, and Respect: More consumers who had been receiving services for one year or more were satisfied than those who were receiving services for less than a year.
In MH Programs:
• Access: More clients who had been receiving services for less than 5 years were satisfied than those who received services for 5 or more years.
• Appropriateness: More clients who had been receiving services for 2 years or less were satisfied than those who received services for 5 or more years.
• Outcome: More consumers who had been receiving services for one year or more were satisfied than those who were receiving services for less than a year.
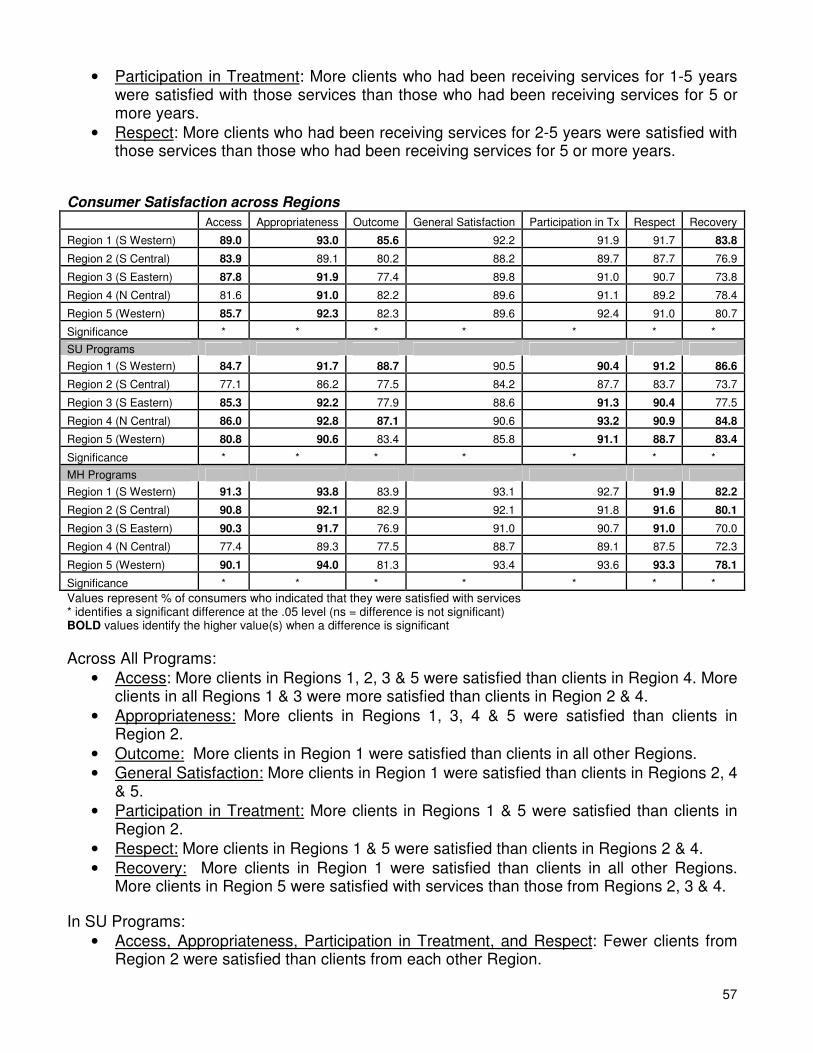
57
• Participation in Treatment: More clients who had been receiving services for 1-5 years were satisfied with those services than those who had been receiving services for 5 or more years.
• Respect: More clients who had been receiving services for 2-5 years were satisfied with those services than those who had been receiving services for 5 or more years.
Consumer Satisfaction across Regions
Access Appropriateness Outcome General Satisfaction Participation in Tx Respect Recovery
Region 1 (S Western) 89.0 93.0 85.6 92.2 91.9 91.7 83.8
Region 2 (S Central) 83.9 89.1 80.2 88.2 89.7 87.7 76.9
Region 3 (S Eastern) 87.8 91.9 77.4 89.8 91.0 90.7 73.8
Region 4 (N Central) 81.6 91.0 82.2 89.6 91.1 89.2 78.4
Region 5 (Western) 85.7 92.3 82.3 89.6 92.4 91.0 80.7
Significance * * * * * * *
SU Programs
Region 1 (S Western) 84.7 91.7 88.7 90.5 90.4 91.2 86.6
Region 2 (S Central) 77.1 86.2 77.5 84.2 87.7 83.7 73.7
Region 3 (S Eastern) 85.3 92.2 77.9 88.6 91.3 90.4 77.5
Region 4 (N Central) 86.0 92.8 87.1 90.6 93.2 90.9 84.8
Region 5 (Western) 80.8 90.6 83.4 85.8 91.1 88.7 83.4
Significance * * * * * * *
MH Programs
Region 1 (S Western) 91.3 93.8 83.9 93.1 92.7 91.9 82.2
Region 2 (S Central) 90.8 92.1 82.9 92.1 91.8 91.6 80.1
Region 3 (S Eastern) 90.3 91.7 76.9 91.0 90.7 91.0 70.0
Region 4 (N Central) 77.4 89.3 77.5 88.7 89.1 87.5 72.3
Region 5 (Western) 90.1 94.0 81.3 93.4 93.6 93.3 78.1
Significance * * * * * * *
Values represent % of consumers who indicated that they were satisfied with services * identifies a significant difference at the .05 level (ns = difference is not significant) BOLD values identify the higher value(s) when a difference is significant
Across All Programs:
• Access: More clients in Regions 1, 2, 3 & 5 were satisfied than clients in Region 4. More clients in all Regions 1 & 3 were more satisfied than clients in Region 2 & 4.
• Appropriateness: More clients in Regions 1, 3, 4 & 5 were satisfied than clients in Region 2.
• Outcome: More clients in Region 1 were satisfied than clients in all other Regions.
• General Satisfaction: More clients in Region 1 were satisfied than clients in Regions 2, 4 & 5.
• Participation in Treatment: More clients in Regions 1 & 5 were satisfied than clients in Region 2.
• Respect: More clients in Regions 1 & 5 were satisfied than clients in Regions 2 & 4.
• Recovery: More clients in Region 1 were satisfied than clients in all other Regions. More clients in Region 5 were satisfied with services than those from Regions 2, 3 & 4.
In SU Programs:
• Access, Appropriateness, Participation in Treatment, and Respect: Fewer clients from Region 2 were satisfied than clients from each other Region.
58
• Outcome and Recovery: Fewer clients from Regions 2 & 3 were satisfied than clients from each other Region.
• General Satisfaction: More clients in Region 1 were satisfied than clients from Regions 2 & 5.
In MH Programs:
• Access, Appropriateness, Respect: Fewer clients in Region 4 were satisfied than clients from all other Regions.
• Outcome: More clients from Regions 1 & 2 were satisfied than clients from Regions 3 & 4.
• General Satisfaction: Clients in Regions 1, 2, & 5 were more satisfied than clients from Region 4.
• Participation in Treatment: More clients from Region 5 were satisfied than clients from Region 4.
• Respect: More clients in Region 5 were satisfied with services than those from Regions 1, 2 & 4.
• Recovery: Fewer clients from Regions 3 & 4 were satisfied than clients from each other Region. More clients from Region 1 were satisfied with services than clients from Regions 3, 4 & 5.
59
Summary by Domains Access
Eighty-five percent (85%) of respondents reported satisfaction on the Access domain. Significantly more clients in each of the following groups reported satisfaction in this domain:
• Respondents who were receiving treatment for Mental Health disorders • Women • Respondents in the African-American (Black) racial category • Respondents of Non-Hispanic/Latino origin • Respondents aged 35 years or older • Respondents receiving employment services • Respondents from any Planning Region except Region 4 (North Central)
For respondents receiving services for Substance Use treatment, significantly more respondents in each of the following groups reported satisfaction in the Access domain:
• Women • Respondents of Hispanic/Latino origin • Respondents aged 35 years or older • Respondents from any Planning Region except Region 2 (South Central)
For respondents receiving services in Mental Health treatment programs, significantly more respondents in each of the following groups reported satisfaction in the Access domain:
• Men • Respondents of Non-Hispanic/Latino origin • Respondents receiving less than five years of services • Respondents from any Planning Region except Region 4 (North Central)
Quality and Appropriateness
Ninety-one percent (91%) of respondents reported satisfaction on the Quality and Appropriateness domain. Significantly more clients in each of the following groups reported satisfaction in this domain:
• Respondents who were receiving treatment for Mental Health disorders • Women • Respondents receiving employment services
For respondents receiving services in Substance Use treatment programs, significantly more respondents in each of the following groups reported satisfaction in the Quality and Appropriateness domain:
• Women • Respondents from any Planning Region except Region 2 (South Central)
60
For respondents receiving services in Mental Health treatment programs, significantly more respondents in each of the following groups reported satisfaction in the Quality and Appropriateness domain:
• Women • Respondents aged 25 - 34 years • Respondents from any Planning Region except Region 4 (North Central)
General Satisfaction
Ninety percent (90%) of respondents reported satisfaction on the General Satisfaction domain. Significantly more clients in each of the following groups reported satisfaction in this domain:
• Respondents receiving treatment from Mental Health programs • Women • Respondents aged 35 years and older • Respondents receiving employment services • Respondents receiving services for 2 or more years
For respondents receiving services in Substance Use treatment programs, significantly more respondents in each of the following groups reported satisfaction in the General Satisfaction domain:
• Women • Respondents of Hispanic/Latino origin • Respondents aged 55 years and older • Respondents receiving services for 2 or more years
For respondents receiving services in Mental Health treatment programs, significantly more respondents in each of the following groups reported satisfaction in the General Satisfaction domain:
• Respondents aged 25 years and older
Outcome
Eighty-two percent (82%) of respondents reported satisfaction on the Outcome domain. Significantly more clients in each of the following groups reported satisfaction in this domain:
• Respondents receiving treatment for Substance Use disorders • Men • Respondents in employment, residential, case management, social rehabilitation
or methadone maintenance programs • Respondents from Planning Region 1 (South Western)
For respondents receiving services in Substance Use treatment programs, significantly more respondents in each of the following groups reported satisfaction in the Outcomes domain:
• Respondents who have been receiving services for more 1 or more years • Respondents from Planning Regions 1 (South Western) & 4 (North Central)
61
For respondents receiving services in Mental Health treatment programs, significantly more respondents in each of the following groups reported satisfaction in the Outcomes domain:
• Men • Respondents who have been receiving services for more 1 or more years
Recovery
Seventy-nine percent (79%) of respondents reported satisfaction in the Recovery domain. Significantly more clients in each of the following groups reported satisfaction in this domain:
• Respondents receiving treatment for Substance Use disorders • Men • Respondents in the African-American (Black) racial category • Respondents in employment, residential, case management, or methadone
maintenance programs • Respondents from Planning Region 1 (South Western)
For respondents receiving services in Substance Use treatment programs, significantly more respondents in each of the following groups reported satisfaction in the Recovery domain:
• Respondents of Hispanic/Latino origin • Respondents from Planning Regions 1 (South Western), 4 (North Central) or 5
(Western) For respondents receiving services in Mental Health treatment programs, significantly more respondents in each of the following groups reported satisfaction in the Recovery domain:
• Respondents in the African-American (Black) racial category • Respondents in social rehabilitation or employment programs • Respondents from Planning Regions 1 (South Western), 2 (South Central) or 5
(Western)
Participation in Treatment
Ninety-one percent (91%) of respondents agreed with the statement, “I felt comfortable asking questions about my services, treatment or medication.” Significantly more clients in each of the following groups reported satisfaction in this domain:
• Women • Respondents in the African-American (Black) or Caucasian (White) racial
categories • Respondents of Non-Hispanic/Latino origin • Respondents in employment, case management, Social rehabilitation,
ACT/CSP/RP, or methadone maintenance programs For respondents receiving services in Substance Use treatment programs, significantly more respondents in each of the following groups reported satisfaction with this item:
• Women • Respondents from any Planning Region except Region 2 (South Central)
62
For respondents receiving services in Mental Health treatment programs, significantly more respondents in each of the following groups reported satisfaction with this item:
• Women
Respect
Ninety percent (90%) of respondents agreed with the statement, “My wishes are respected about the amount of family involvement I want in my treatment.” Significantly more clients in each of the following groups reported satisfaction in this domain:
• Respondents receiving treatment for Mental Health disorders • Women • Respondents of Non-Hispanic/Latino origin • Respondents in employment, case management, or social rehabilitation
programs • Respondents who have been receiving services for more 1 or more years
For respondents receiving services in Substance Use treatment programs, significantly more respondents in each of the following groups reported satisfaction with this item:
• Women • Respondents who have been receiving services for more 1 or more years • Respondents from any Planning Region except Region 2 (South Central)
For respondents receiving services in Mental Health treatment programs, significantly more respondents in each of the following groups reported satisfaction with this item:
• Respondents of Non-Hispanic/Latino origin • Respondents from any Planning Region except Region 4 (North Central)
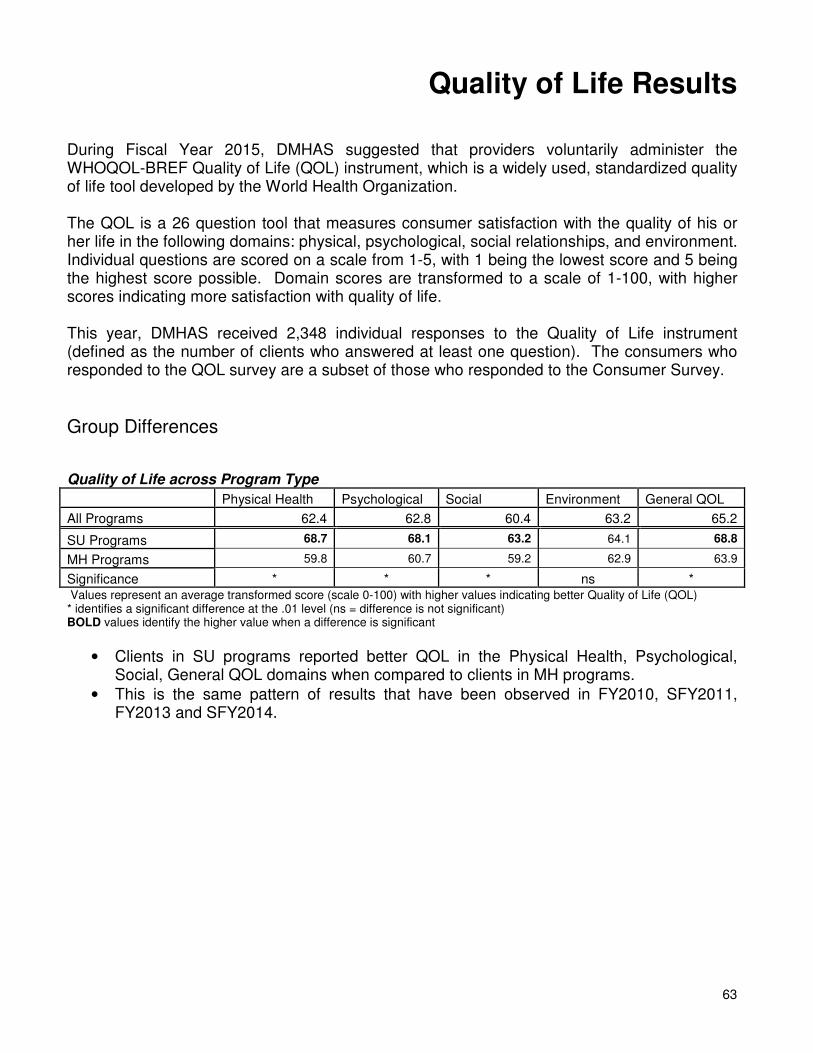
63
Quality of Life Results During Fiscal Year 2015, DMHAS suggested that providers voluntarily administer the WHOQOL-BREF Quality of Life (QOL) instrument, which is a widely used, standardized quality of life tool developed by the World Health Organization. The QOL is a 26 question tool that measures consumer satisfaction with the quality of his or her life in the following domains: physical, psychological, social relationships, and environment. Individual questions are scored on a scale from 1-5, with 1 being the lowest score and 5 being the highest score possible. Domain scores are transformed to a scale of 1-100, with higher scores indicating more satisfaction with quality of life. This year, DMHAS received 2,348 individual responses to the Quality of Life instrument (defined as the number of clients who answered at least one question). The consumers who responded to the QOL survey are a subset of those who responded to the Consumer Survey.
Group Differences Quality of Life across Program Type
Physical Health Psychological Social Environment General QOL
All Programs 62.4 62.8 60.4 63.2 65.2
SU Programs 68.7 68.1 63.2 64.1 68.8
MH Programs 59.8 60.7 59.2 62.9 63.9
Significance * * * ns * Values represent an average transformed score (scale 0-100) with higher values indicating better Quality of Life (QOL) * identifies a significant difference at the .01 level (ns = difference is not significant) BOLD values identify the higher value when a difference is significant
• Clients in SU programs reported better QOL in the Physical Health, Psychological, Social, General QOL domains when compared to clients in MH programs.
• This is the same pattern of results that have been observed in FY2010, SFY2011, FY2013 and SFY2014.
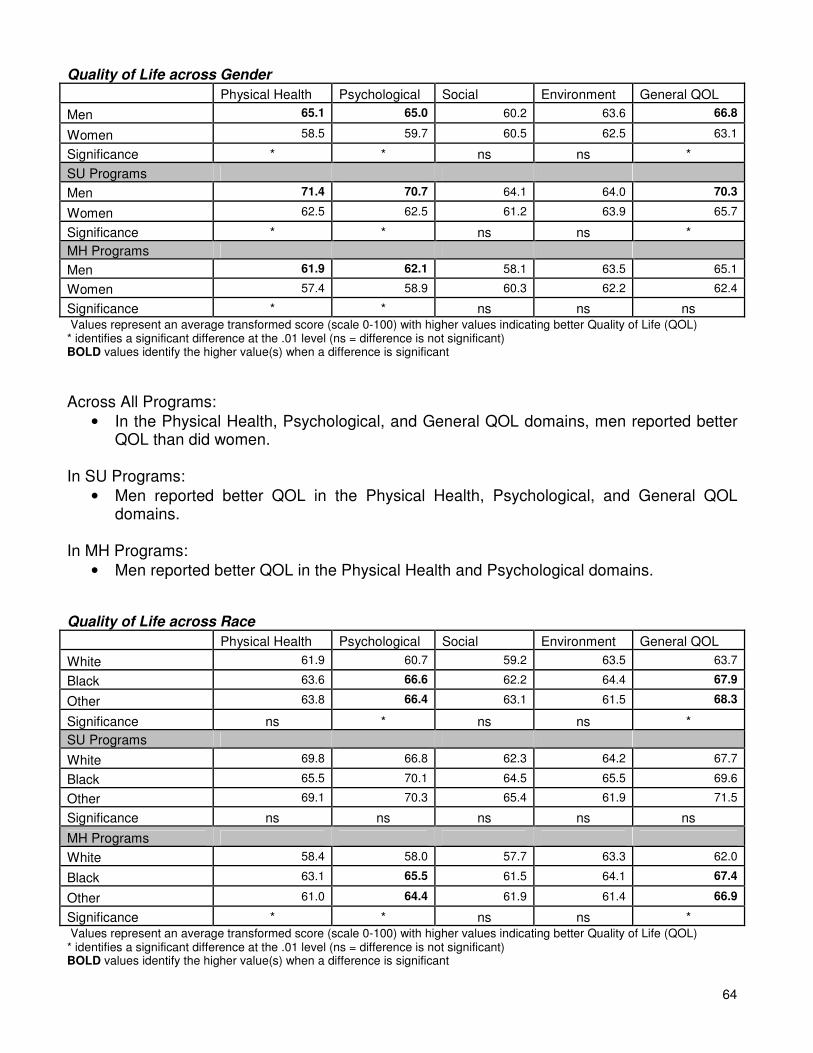
64
Quality of Life across Gender
Physical Health Psychological Social Environment General QOL
Men 65.1 65.0 60.2 63.6 66.8
Women 58.5 59.7 60.5 62.5 63.1
Significance * * ns ns *
SU Programs
Men 71.4 70.7 64.1 64.0 70.3
Women 62.5 62.5 61.2 63.9 65.7
Significance * * ns ns *
MH Programs
Men 61.9 62.1 58.1 63.5 65.1
Women 57.4 58.9 60.3 62.2 62.4
Significance * * ns ns ns Values represent an average transformed score (scale 0-100) with higher values indicating better Quality of Life (QOL) * identifies a significant difference at the .01 level (ns = difference is not significant) BOLD values identify the higher value(s) when a difference is significant
Across All Programs:
• In the Physical Health, Psychological, and General QOL domains, men reported better QOL than did women.
In SU Programs:
• Men reported better QOL in the Physical Health, Psychological, and General QOL domains.
In MH Programs:
• Men reported better QOL in the Physical Health and Psychological domains. Quality of Life across Race
Physical Health Psychological Social Environment General QOL
White 61.9 60.7 59.2 63.5 63.7
Black 63.6 66.6 62.2 64.4 67.9
Other 63.8 66.4 63.1 61.5 68.3
Significance ns * ns ns *
SU Programs
White 69.8 66.8 62.3 64.2 67.7
Black 65.5 70.1 64.5 65.5 69.6
Other 69.1 70.3 65.4 61.9 71.5
Significance ns ns ns ns ns
MH Programs
White 58.4 58.0 57.7 63.3 62.0
Black 63.1 65.5 61.5 64.1 67.4
Other 61.0 64.4 61.9 61.4 66.9
Significance * * ns ns * Values represent an average transformed score (scale 0-100) with higher values indicating better Quality of Life (QOL) * identifies a significant difference at the .01 level (ns = difference is not significant) BOLD values identify the higher value(s) when a difference is significant
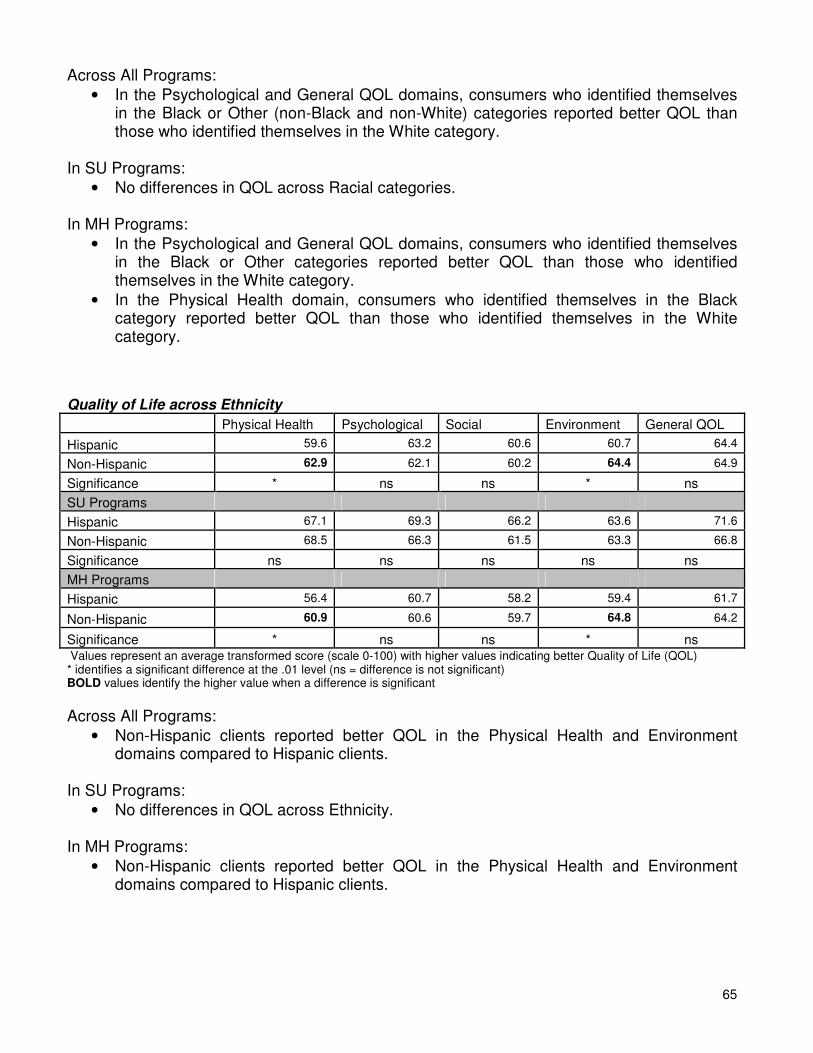
65
Across All Programs:
• In the Psychological and General QOL domains, consumers who identified themselves in the Black or Other (non-Black and non-White) categories reported better QOL than those who identified themselves in the White category.
In SU Programs:
• No differences in QOL across Racial categories. In MH Programs:
• In the Psychological and General QOL domains, consumers who identified themselves in the Black or Other categories reported better QOL than those who identified themselves in the White category.
• In the Physical Health domain, consumers who identified themselves in the Black category reported better QOL than those who identified themselves in the White category.
Quality of Life across Ethnicity
Physical Health Psychological Social Environment General QOL
Hispanic 59.6 63.2 60.6 60.7 64.4
Non-Hispanic 62.9 62.1 60.2 64.4 64.9
Significance * ns ns * ns
SU Programs
Hispanic 67.1 69.3 66.2 63.6 71.6
Non-Hispanic 68.5 66.3 61.5 63.3 66.8
Significance ns ns ns ns ns
MH Programs
Hispanic 56.4 60.7 58.2 59.4 61.7
Non-Hispanic 60.9 60.6 59.7 64.8 64.2
Significance * ns ns * ns Values represent an average transformed score (scale 0-100) with higher values indicating better Quality of Life (QOL) * identifies a significant difference at the .01 level (ns = difference is not significant) BOLD values identify the higher value when a difference is significant
Across All Programs:
• Non-Hispanic clients reported better QOL in the Physical Health and Environment domains compared to Hispanic clients.
In SU Programs:
• No differences in QOL across Ethnicity.
In MH Programs:
• Non-Hispanic clients reported better QOL in the Physical Health and Environment domains compared to Hispanic clients.
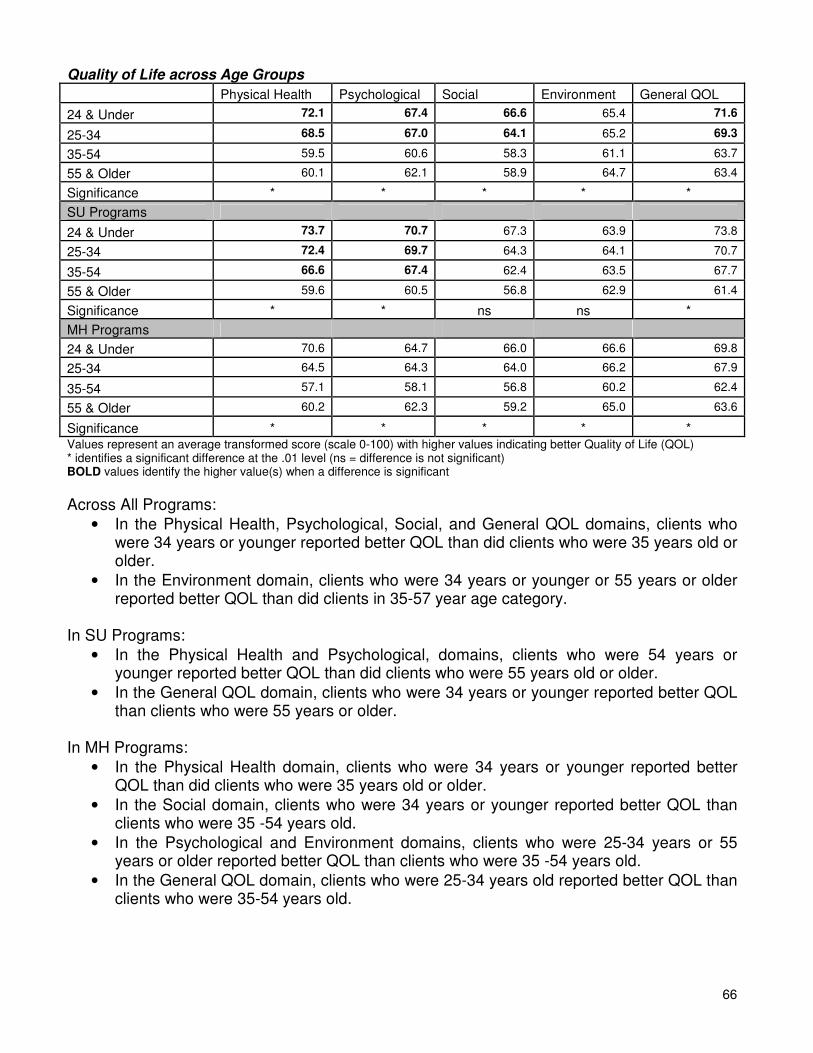
66
Quality of Life across Age Groups
Physical Health Psychological Social Environment General QOL
24 & Under 72.1 67.4 66.6 65.4 71.6
25-34 68.5 67.0 64.1 65.2 69.3
35-54 59.5 60.6 58.3 61.1 63.7
55 & Older 60.1 62.1 58.9 64.7 63.4
Significance * * * * *
SU Programs
24 & Under 73.7 70.7 67.3 63.9 73.8
25-34 72.4 69.7 64.3 64.1 70.7
35-54 66.6 67.4 62.4 63.5 67.7
55 & Older 59.6 60.5 56.8 62.9 61.4
Significance * * ns ns *
MH Programs
24 & Under 70.6 64.7 66.0 66.6 69.8
25-34 64.5 64.3 64.0 66.2 67.9
35-54 57.1 58.1 56.8 60.2 62.4
55 & Older 60.2 62.3 59.2 65.0 63.6
Significance * * * * * Values represent an average transformed score (scale 0-100) with higher values indicating better Quality of Life (QOL) * identifies a significant difference at the .01 level (ns = difference is not significant) BOLD values identify the higher value(s) when a difference is significant
Across All Programs:
• In the Physical Health, Psychological, Social, and General QOL domains, clients who were 34 years or younger reported better QOL than did clients who were 35 years old or older.
• In the Environment domain, clients who were 34 years or younger or 55 years or older reported better QOL than did clients in 35-57 year age category.
In SU Programs:
• In the Physical Health and Psychological, domains, clients who were 54 years or younger reported better QOL than did clients who were 55 years old or older.
• In the General QOL domain, clients who were 34 years or younger reported better QOL than clients who were 55 years or older.
In MH Programs:
• In the Physical Health domain, clients who were 34 years or younger reported better QOL than did clients who were 35 years old or older.
• In the Social domain, clients who were 34 years or younger reported better QOL than clients who were 35 -54 years old.
• In the Psychological and Environment domains, clients who were 25-34 years or 55 years or older reported better QOL than clients who were 35 -54 years old.
• In the General QOL domain, clients who were 25-34 years old reported better QOL than clients who were 35-54 years old.
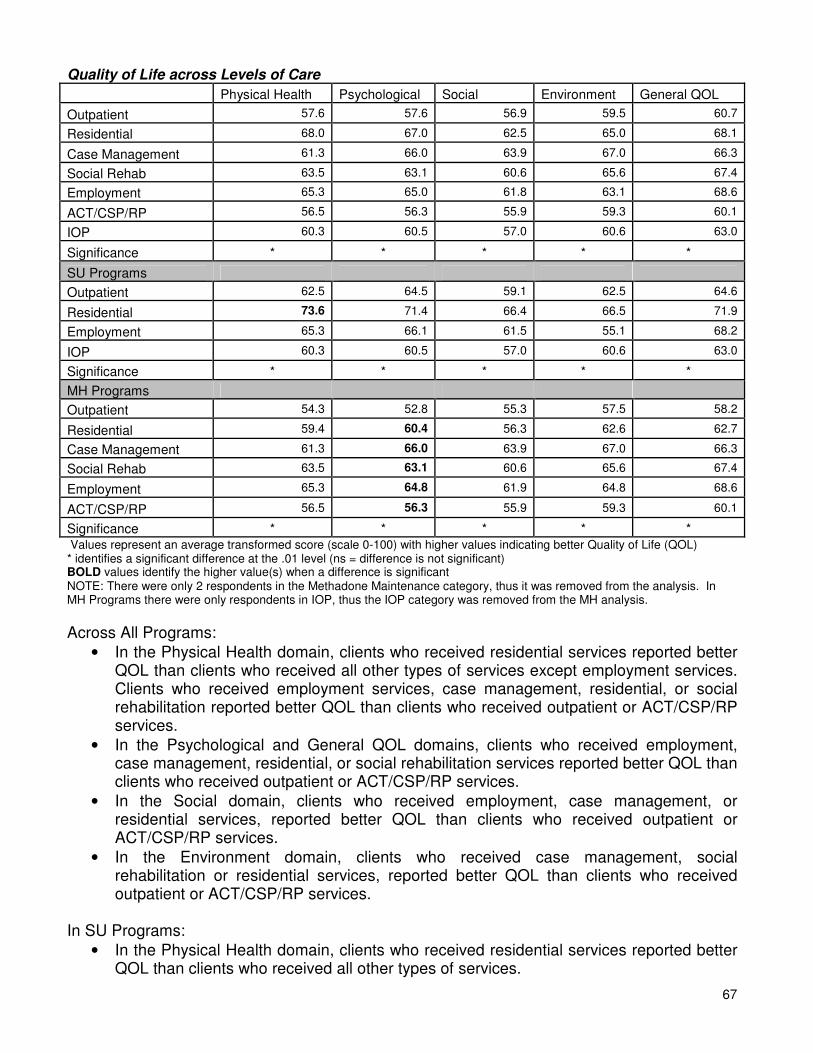
67
Quality of Life across Levels of Care
Physical Health Psychological Social Environment General QOL
Outpatient 57.6 57.6 56.9 59.5 60.7
Residential 68.0 67.0 62.5 65.0 68.1
Case Management 61.3 66.0 63.9 67.0 66.3
Social Rehab 63.5 63.1 60.6 65.6 67.4
Employment 65.3 65.0 61.8 63.1 68.6
ACT/CSP/RP 56.5 56.3 55.9 59.3 60.1
IOP 60.3 60.5 57.0 60.6 63.0
Significance * * * * *
SU Programs
Outpatient 62.5 64.5 59.1 62.5 64.6
Residential 73.6 71.4 66.4 66.5 71.9
Employment 65.3 66.1 61.5 55.1 68.2
IOP 60.3 60.5 57.0 60.6 63.0
Significance * * * * *
MH Programs
Outpatient 54.3 52.8 55.3 57.5 58.2
Residential 59.4 60.4 56.3 62.6 62.7
Case Management 61.3 66.0 63.9 67.0 66.3
Social Rehab 63.5 63.1 60.6 65.6 67.4
Employment 65.3 64.8 61.9 64.8 68.6
ACT/CSP/RP 56.5 56.3 55.9 59.3 60.1
Significance * * * * * Values represent an average transformed score (scale 0-100) with higher values indicating better Quality of Life (QOL) * identifies a significant difference at the .01 level (ns = difference is not significant) BOLD values identify the higher value(s) when a difference is significant NOTE: There were only 2 respondents in the Methadone Maintenance category, thus it was removed from the analysis. In MH Programs there were only respondents in IOP, thus the IOP category was removed from the MH analysis.
Across All Programs:
• In the Physical Health domain, clients who received residential services reported better QOL than clients who received all other types of services except employment services. Clients who received employment services, case management, residential, or social rehabilitation reported better QOL than clients who received outpatient or ACT/CSP/RP services.
• In the Psychological and General QOL domains, clients who received employment, case management, residential, or social rehabilitation services reported better QOL than clients who received outpatient or ACT/CSP/RP services.
• In the Social domain, clients who received employment, case management, or residential services, reported better QOL than clients who received outpatient or ACT/CSP/RP services.
• In the Environment domain, clients who received case management, social rehabilitation or residential services, reported better QOL than clients who received outpatient or ACT/CSP/RP services.
In SU Programs:
• In the Physical Health domain, clients who received residential services reported better QOL than clients who received all other types of services.
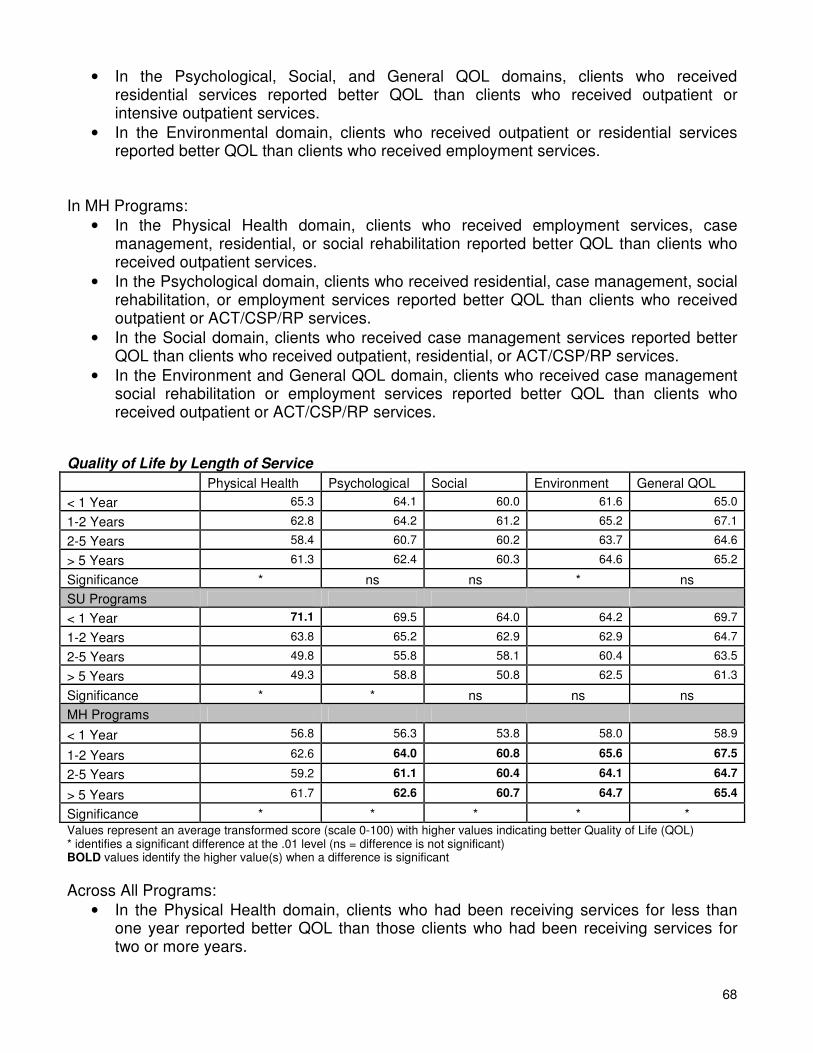
68
• In the Psychological, Social, and General QOL domains, clients who received residential services reported better QOL than clients who received outpatient or intensive outpatient services.
• In the Environmental domain, clients who received outpatient or residential services reported better QOL than clients who received employment services.
In MH Programs:
• In the Physical Health domain, clients who received employment services, case management, residential, or social rehabilitation reported better QOL than clients who received outpatient services.
• In the Psychological domain, clients who received residential, case management, social rehabilitation, or employment services reported better QOL than clients who received outpatient or ACT/CSP/RP services.
• In the Social domain, clients who received case management services reported better QOL than clients who received outpatient, residential, or ACT/CSP/RP services.
• In the Environment and General QOL domain, clients who received case management social rehabilitation or employment services reported better QOL than clients who received outpatient or ACT/CSP/RP services.
Quality of Life by Length of Service
Physical Health Psychological Social Environment General QOL
< 1 Year 65.3 64.1 60.0 61.6 65.0
1-2 Years 62.8 64.2 61.2 65.2 67.1
2-5 Years 58.4 60.7 60.2 63.7 64.6
> 5 Years 61.3 62.4 60.3 64.6 65.2
Significance * ns ns * ns
SU Programs
< 1 Year 71.1 69.5 64.0 64.2 69.7
1-2 Years 63.8 65.2 62.9 62.9 64.7
2-5 Years 49.8 55.8 58.1 60.4 63.5
> 5 Years 49.3 58.8 50.8 62.5 61.3
Significance * * ns ns ns
MH Programs
< 1 Year 56.8 56.3 53.8 58.0 58.9
1-2 Years 62.6 64.0 60.8 65.6 67.5
2-5 Years 59.2 61.1 60.4 64.1 64.7
> 5 Years 61.7 62.6 60.7 64.7 65.4
Significance * * * * * Values represent an average transformed score (scale 0-100) with higher values indicating better Quality of Life (QOL) * identifies a significant difference at the .01 level (ns = difference is not significant) BOLD values identify the higher value(s) when a difference is significant
Across All Programs:
• In the Physical Health domain, clients who had been receiving services for less than one year reported better QOL than those clients who had been receiving services for two or more years.
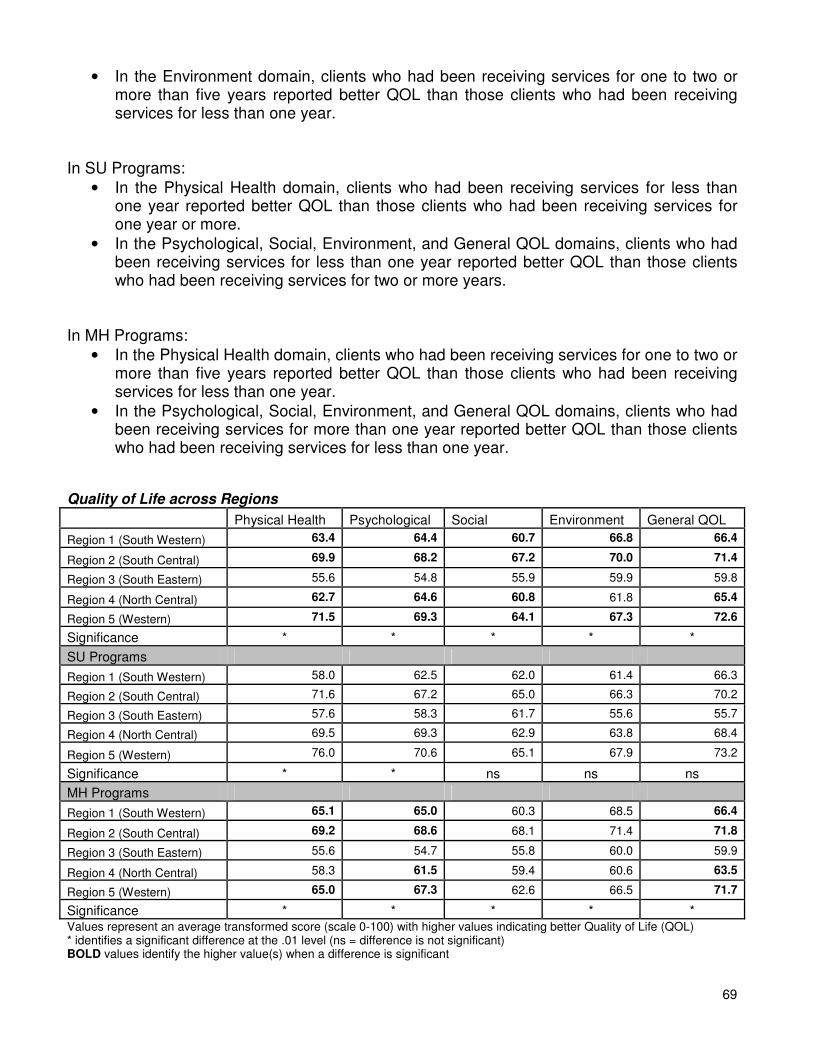
69
• In the Environment domain, clients who had been receiving services for one to two or more than five years reported better QOL than those clients who had been receiving services for less than one year.
In SU Programs:
• In the Physical Health domain, clients who had been receiving services for less than one year reported better QOL than those clients who had been receiving services for one year or more.
• In the Psychological, Social, Environment, and General QOL domains, clients who had been receiving services for less than one year reported better QOL than those clients who had been receiving services for two or more years.
In MH Programs:
• In the Physical Health domain, clients who had been receiving services for one to two or more than five years reported better QOL than those clients who had been receiving services for less than one year.
• In the Psychological, Social, Environment, and General QOL domains, clients who had been receiving services for more than one year reported better QOL than those clients who had been receiving services for less than one year.
Quality of Life across Regions
Physical Health Psychological Social Environment General QOL
Region 1 (South Western) 63.4 64.4 60.7 66.8 66.4
Region 2 (South Central) 69.9 68.2 67.2 70.0 71.4
Region 3 (South Eastern) 55.6 54.8 55.9 59.9 59.8
Region 4 (North Central) 62.7 64.6 60.8 61.8 65.4
Region 5 (Western) 71.5 69.3 64.1 67.3 72.6
Significance * * * * *
SU Programs
Region 1 (South Western) 58.0 62.5 62.0 61.4 66.3
Region 2 (South Central) 71.6 67.2 65.0 66.3 70.2
Region 3 (South Eastern) 57.6 58.3 61.7 55.6 55.7
Region 4 (North Central) 69.5 69.3 62.9 63.8 68.4
Region 5 (Western) 76.0 70.6 65.1 67.9 73.2
Significance * * ns ns ns
MH Programs
Region 1 (South Western) 65.1 65.0 60.3 68.5 66.4
Region 2 (South Central) 69.2 68.6 68.1 71.4 71.8
Region 3 (South Eastern) 55.6 54.7 55.8 60.0 59.9
Region 4 (North Central) 58.3 61.5 59.4 60.6 63.5
Region 5 (Western) 65.0 67.3 62.6 66.5 71.7
Significance * * * * * Values represent an average transformed score (scale 0-100) with higher values indicating better Quality of Life (QOL) * identifies a significant difference at the .01 level (ns = difference is not significant) BOLD values identify the higher value(s) when a difference is significant
70
Across All Programs:
• In the Physical Health, Psychological, Social, and General QOL domains, clients from Regions 1, 2, 4 & 5 reported better QOL than clients from Region 3.
• In the Environment domain, clients from Regions 1, 2 & 5 reported better QOL than did clients from Regions 3 & 4.
In SU Programs:
• In the Physical Health domain, clients from Region 5 reported better QOL than clients from Regions 1, 3 & 4.
• In the Psychological domain clients from Regions 4 & 5 reported better QOL than clients from Region 1.
In MH Programs:
• In the Physical Health domain, clients from Regions 1, 2 & 5 reported better QOL than clients from Regions 3 & 4.
• In the Psychological and General QOL domains, clients from Regions 1, 2, 4 & 5 reported better QOL than clients from Region 3.
• In the Social domain, clients from Region 2 reported better QOL than clients from Regions 1, 3 & 4.
• In the Environment domain, clients from Regions 1 & 2 reported better QOL than clients in Regions 3 & 4.
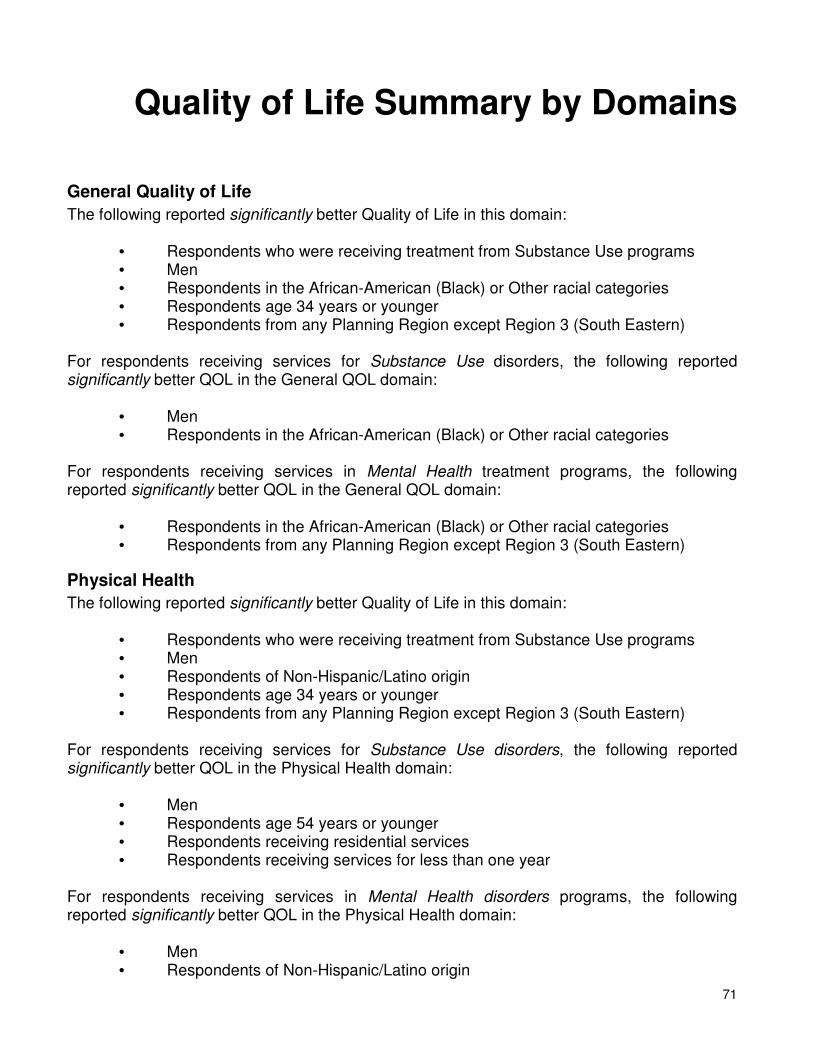
71
Quality of Life Summary by Domains
General Quality of Life
The following reported significantly better Quality of Life in this domain: • Respondents who were receiving treatment from Substance Use programs • Men • Respondents in the African-American (Black) or Other racial categories • Respondents age 34 years or younger • Respondents from any Planning Region except Region 3 (South Eastern)
For respondents receiving services for Substance Use disorders, the following reported significantly better QOL in the General QOL domain:
• Men • Respondents in the African-American (Black) or Other racial categories
For respondents receiving services in Mental Health treatment programs, the following reported significantly better QOL in the General QOL domain:
• Respondents in the African-American (Black) or Other racial categories • Respondents from any Planning Region except Region 3 (South Eastern)
Physical Health
The following reported significantly better Quality of Life in this domain: • Respondents who were receiving treatment from Substance Use programs • Men • Respondents of Non-Hispanic/Latino origin • Respondents age 34 years or younger • Respondents from any Planning Region except Region 3 (South Eastern)
For respondents receiving services for Substance Use disorders, the following reported significantly better QOL in the Physical Health domain:
• Men • Respondents age 54 years or younger • Respondents receiving residential services • Respondents receiving services for less than one year
For respondents receiving services in Mental Health disorders programs, the following reported significantly better QOL in the Physical Health domain:
• Men • Respondents of Non-Hispanic/Latino origin
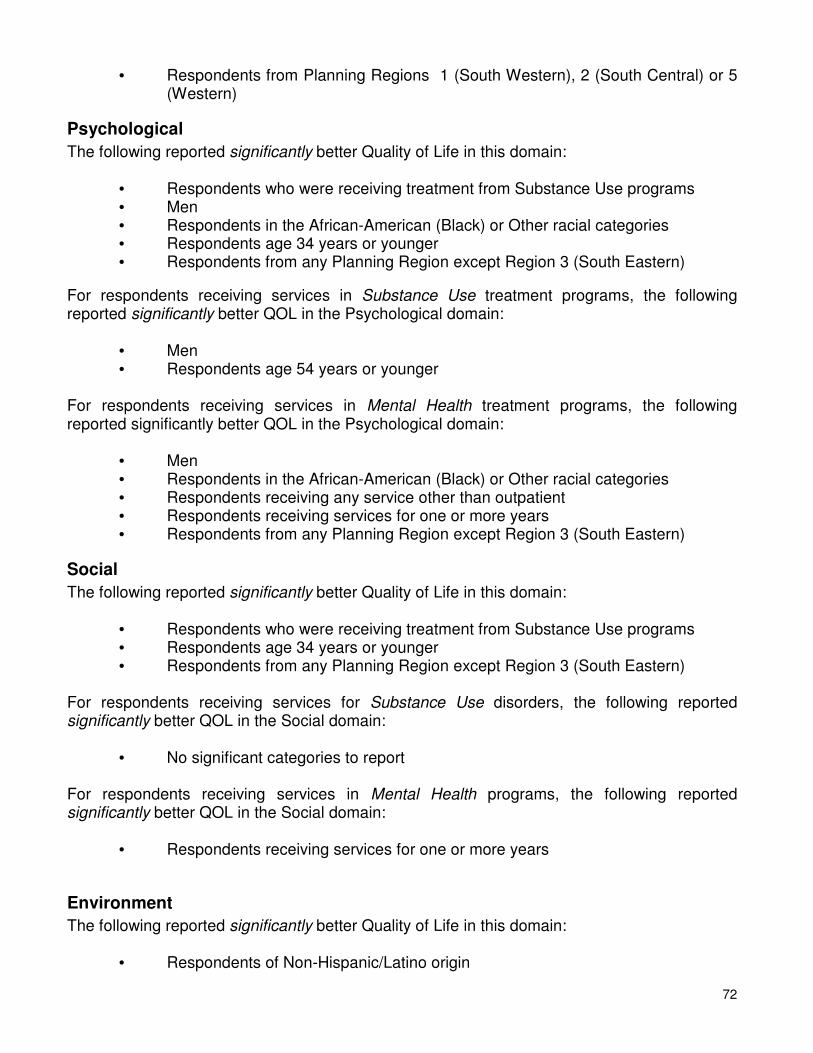
72
• Respondents from Planning Regions 1 (South Western), 2 (South Central) or 5 (Western)
Psychological
The following reported significantly better Quality of Life in this domain:
• Respondents who were receiving treatment from Substance Use programs • Men • Respondents in the African-American (Black) or Other racial categories • Respondents age 34 years or younger • Respondents from any Planning Region except Region 3 (South Eastern)
For respondents receiving services in Substance Use treatment programs, the following reported significantly better QOL in the Psychological domain:
• Men • Respondents age 54 years or younger
For respondents receiving services in Mental Health treatment programs, the following reported significantly better QOL in the Psychological domain:
• Men • Respondents in the African-American (Black) or Other racial categories • Respondents receiving any service other than outpatient • Respondents receiving services for one or more years • Respondents from any Planning Region except Region 3 (South Eastern)
Social
The following reported significantly better Quality of Life in this domain:
• Respondents who were receiving treatment from Substance Use programs • Respondents age 34 years or younger • Respondents from any Planning Region except Region 3 (South Eastern)
For respondents receiving services for Substance Use disorders, the following reported significantly better QOL in the Social domain:
• No significant categories to report
For respondents receiving services in Mental Health programs, the following reported significantly better QOL in the Social domain:
• Respondents receiving services for one or more years
Environment
The following reported significantly better Quality of Life in this domain: • Respondents of Non-Hispanic/Latino origin
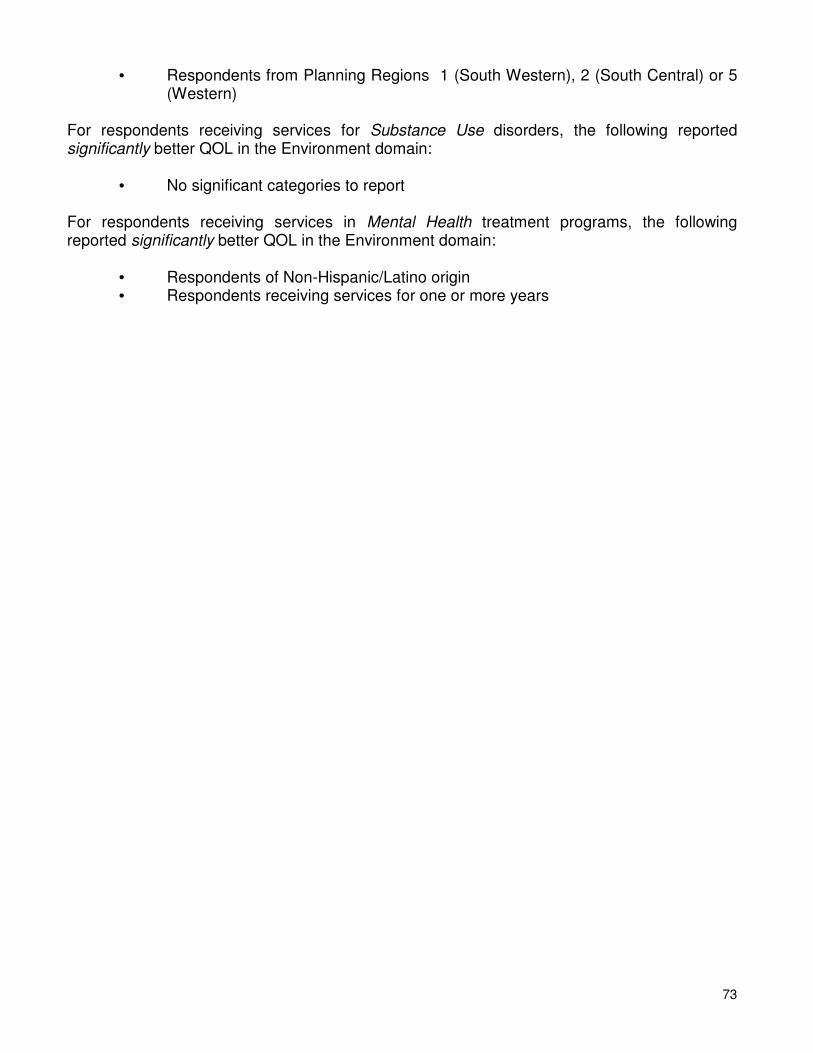
73
• Respondents from Planning Regions 1 (South Western), 2 (South Central) or 5 (Western)
For respondents receiving services for Substance Use disorders, the following reported significantly better QOL in the Environment domain:
• No significant categories to report For respondents receiving services in Mental Health treatment programs, the following reported significantly better QOL in the Environment domain:
• Respondents of Non-Hispanic/Latino origin • Respondents receiving services for one or more years
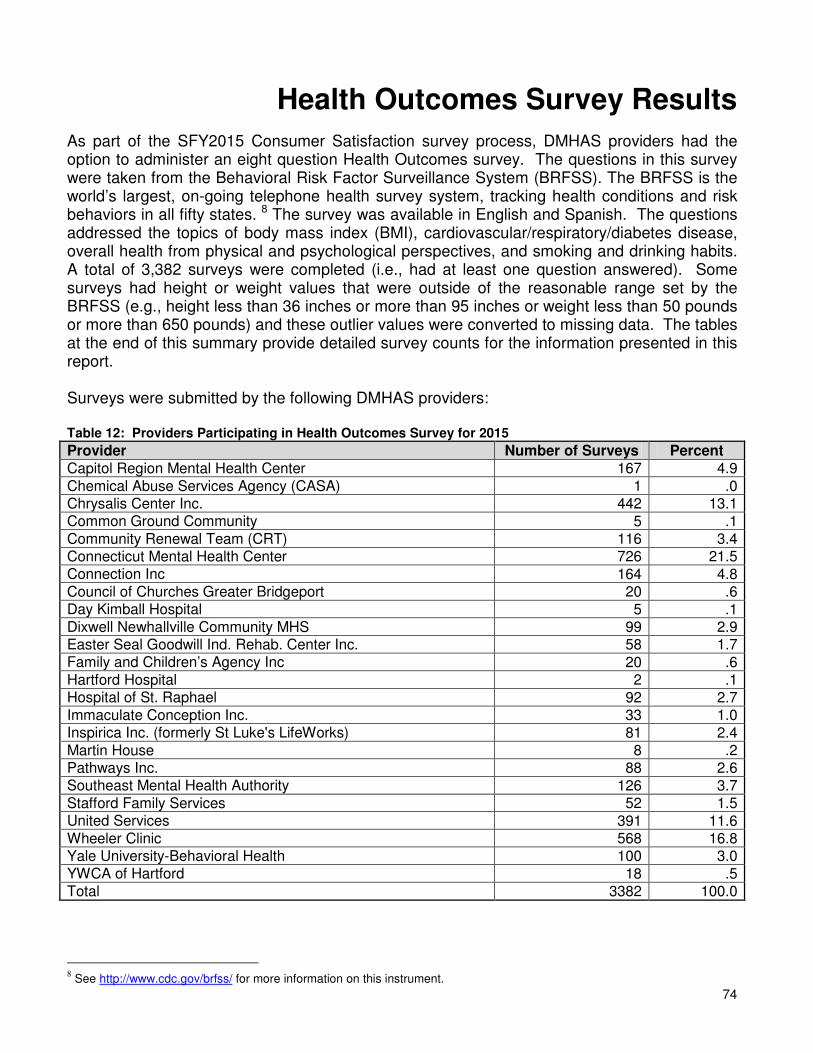
74
Health Outcomes Survey Results
As part of the SFY2015 Consumer Satisfaction survey process, DMHAS providers had the option to administer an eight question Health Outcomes survey. The questions in this survey were taken from the Behavioral Risk Factor Surveillance System (BRFSS). The BRFSS is the world’s largest, on-going telephone health survey system, tracking health conditions and risk behaviors in all fifty states. 8 The survey was available in English and Spanish. The questions addressed the topics of body mass index (BMI), cardiovascular/respiratory/diabetes disease, overall health from physical and psychological perspectives, and smoking and drinking habits. A total of 3,382 surveys were completed (i.e., had at least one question answered). Some surveys had height or weight values that were outside of the reasonable range set by the BRFSS (e.g., height less than 36 inches or more than 95 inches or weight less than 50 pounds or more than 650 pounds) and these outlier values were converted to missing data. The tables at the end of this summary provide detailed survey counts for the information presented in this report. Surveys were submitted by the following DMHAS providers: Table 12: Providers Participating in Health Outcomes Survey for 2015
Provider Number of Surveys Percent
Capitol Region Mental Health Center 167 4.9
Chemical Abuse Services Agency (CASA) 1 .0 Chrysalis Center Inc. 442 13.1 Common Ground Community 5 .1 Community Renewal Team (CRT) 116 3.4 Connecticut Mental Health Center 726 21.5 Connection Inc 164 4.8 Council of Churches Greater Bridgeport 20 .6 Day Kimball Hospital 5 .1 Dixwell Newhallville Community MHS 99 2.9 Easter Seal Goodwill Ind. Rehab. Center Inc. 58 1.7 Family and Children’s Agency Inc 20 .6 Hartford Hospital 2 .1 Hospital of St. Raphael 92 2.7 Immaculate Conception Inc. 33 1.0 Inspirica Inc. (formerly St Luke's LifeWorks) 81 2.4 Martin House 8 .2 Pathways Inc. 88 2.6 Southeast Mental Health Authority 126 3.7 Stafford Family Services 52 1.5 United Services 391 11.6 Wheeler Clinic 568 16.8 Yale University-Behavioral Health 100 3.0 YWCA of Hartford 18 .5 Total 3382 100.0
8 See http://www.cdc.gov/brfss/ for more information on this instrument.
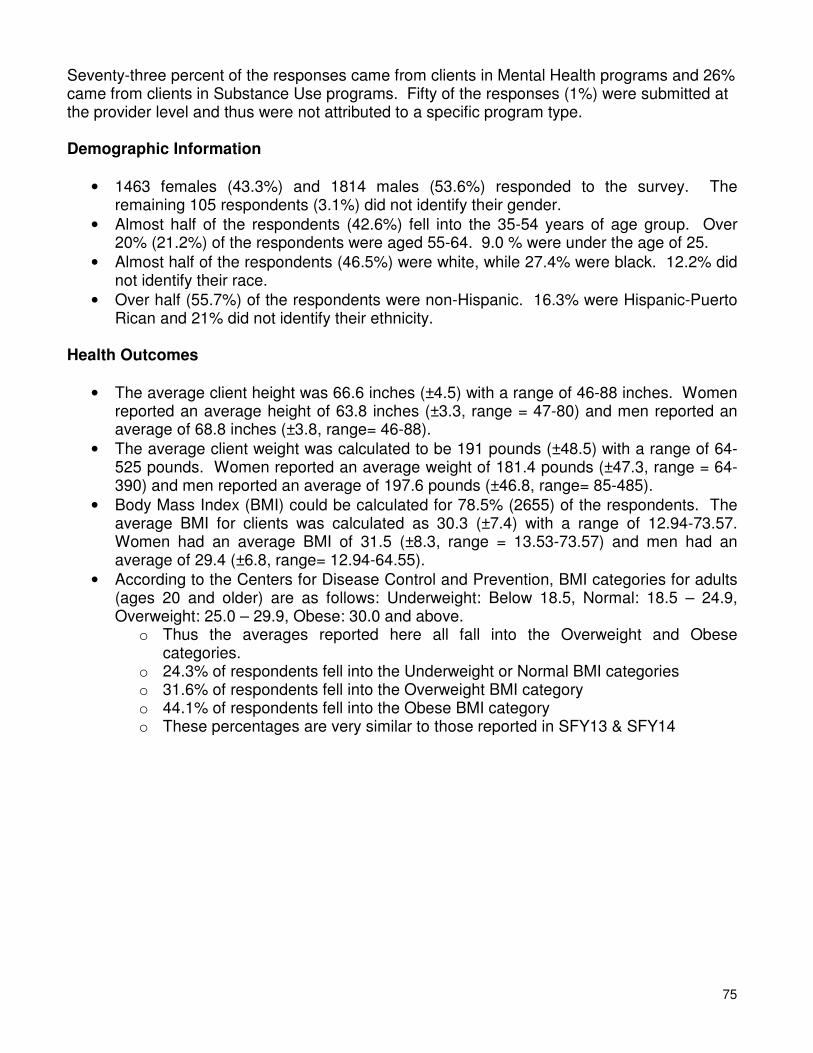
75
Seventy-three percent of the responses came from clients in Mental Health programs and 26% came from clients in Substance Use programs. Fifty of the responses (1%) were submitted at the provider level and thus were not attributed to a specific program type. Demographic Information
• 1463 females (43.3%) and 1814 males (53.6%) responded to the survey. The remaining 105 respondents (3.1%) did not identify their gender.
• Almost half of the respondents (42.6%) fell into the 35-54 years of age group. Over 20% (21.2%) of the respondents were aged 55-64. 9.0 % were under the age of 25.
• Almost half of the respondents (46.5%) were white, while 27.4% were black. 12.2% did not identify their race.
• Over half (55.7%) of the respondents were non-Hispanic. 16.3% were Hispanic-Puerto Rican and 21% did not identify their ethnicity.
Health Outcomes
• The average client height was 66.6 inches (±4.5) with a range of 46-88 inches. Women reported an average height of 63.8 inches (±3.3, range = 47-80) and men reported an average of 68.8 inches (±3.8, range= 46-88).
• The average client weight was calculated to be 191 pounds (±48.5) with a range of 64-525 pounds. Women reported an average weight of 181.4 pounds (±47.3, range = 64-390) and men reported an average of 197.6 pounds (±46.8, range= 85-485).
• Body Mass Index (BMI) could be calculated for 78.5% (2655) of the respondents. The average BMI for clients was calculated as 30.3 (±7.4) with a range of 12.94-73.57. Women had an average BMI of 31.5 (±8.3, range = 13.53-73.57) and men had an average of 29.4 (±6.8, range= 12.94-64.55).
• According to the Centers for Disease Control and Prevention, BMI categories for adults (ages 20 and older) are as follows: Underweight: Below 18.5, Normal: 18.5 – 24.9, Overweight: 25.0 – 29.9, Obese: 30.0 and above.
o Thus the averages reported here all fall into the Overweight and Obese categories.
o 24.3% of respondents fell into the Underweight or Normal BMI categories o 31.6% of respondents fell into the Overweight BMI category o 44.1% of respondents fell into the Obese BMI category o These percentages are very similar to those reported in SFY13 & SFY14
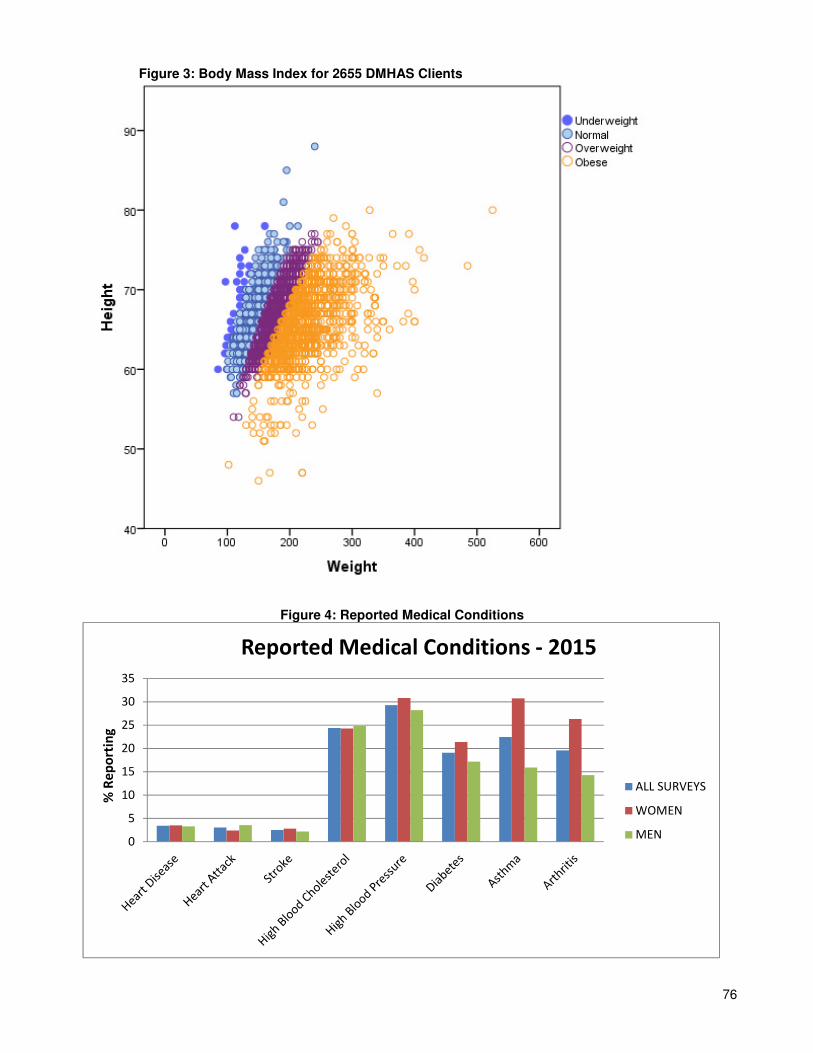
76
Figure 3: Body Mass Index for 2655 DMHAS Clients
Figure 4: Reported Medical Conditions
0
5
10
15
20
25
30
35
% R
ep
ort
ing
Reported Medical Conditions - 2015
ALL SURVEYS
WOMEN
MEN
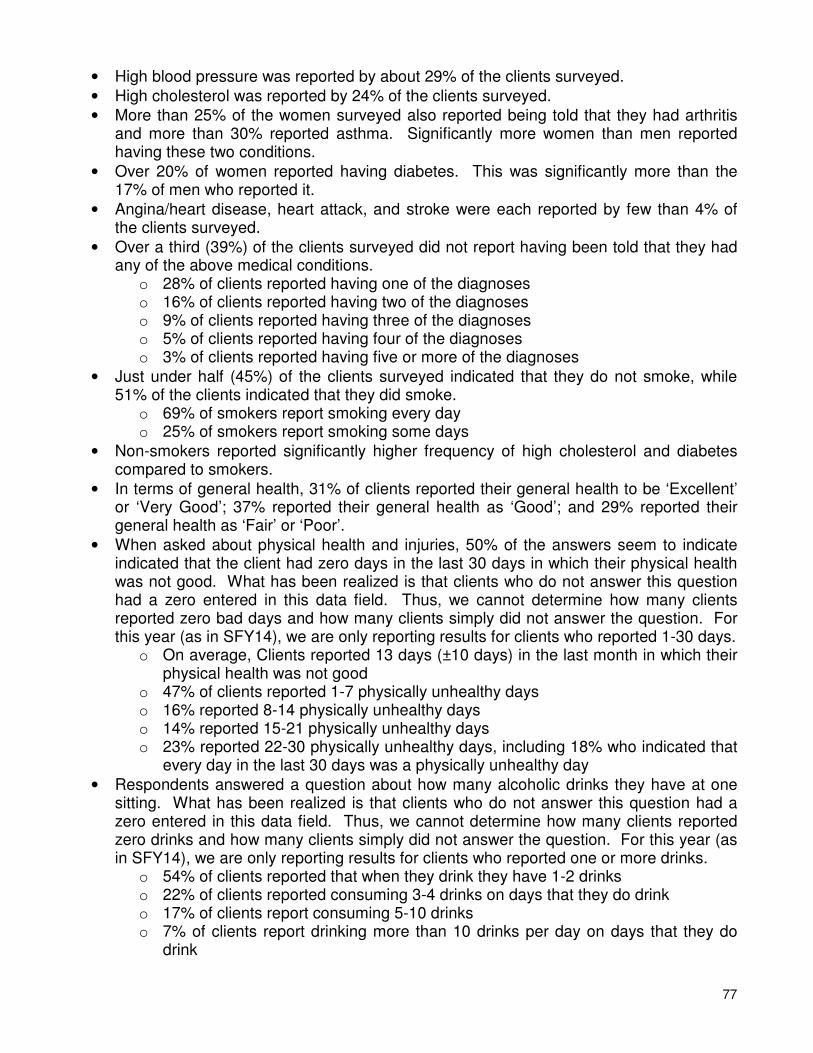
77
• High blood pressure was reported by about 29% of the clients surveyed.
• High cholesterol was reported by 24% of the clients surveyed.
• More than 25% of the women surveyed also reported being told that they had arthritis and more than 30% reported asthma. Significantly more women than men reported having these two conditions.
• Over 20% of women reported having diabetes. This was significantly more than the 17% of men who reported it.
• Angina/heart disease, heart attack, and stroke were each reported by few than 4% of the clients surveyed.
• Over a third (39%) of the clients surveyed did not report having been told that they had any of the above medical conditions.
o 28% of clients reported having one of the diagnoses o 16% of clients reported having two of the diagnoses o 9% of clients reported having three of the diagnoses o 5% of clients reported having four of the diagnoses o 3% of clients reported having five or more of the diagnoses
• Just under half (45%) of the clients surveyed indicated that they do not smoke, while 51% of the clients indicated that they did smoke.
o 69% of smokers report smoking every day o 25% of smokers report smoking some days
• Non-smokers reported significantly higher frequency of high cholesterol and diabetes compared to smokers.
• In terms of general health, 31% of clients reported their general health to be ‘Excellent’ or ‘Very Good’; 37% reported their general health as ‘Good’; and 29% reported their general health as ‘Fair’ or ‘Poor’.
• When asked about physical health and injuries, 50% of the answers seem to indicate indicated that the client had zero days in the last 30 days in which their physical health was not good. What has been realized is that clients who do not answer this question had a zero entered in this data field. Thus, we cannot determine how many clients reported zero bad days and how many clients simply did not answer the question. For this year (as in SFY14), we are only reporting results for clients who reported 1-30 days.
o On average, Clients reported 13 days (±10 days) in the last month in which their physical health was not good
o 47% of clients reported 1-7 physically unhealthy days o 16% reported 8-14 physically unhealthy days o 14% reported 15-21 physically unhealthy days o 23% reported 22-30 physically unhealthy days, including 18% who indicated that
every day in the last 30 days was a physically unhealthy day
• Respondents answered a question about how many alcoholic drinks they have at one sitting. What has been realized is that clients who do not answer this question had a zero entered in this data field. Thus, we cannot determine how many clients reported zero drinks and how many clients simply did not answer the question. For this year (as in SFY14), we are only reporting results for clients who reported one or more drinks.
o 54% of clients reported that when they drink they have 1-2 drinks o 22% of clients reported consuming 3-4 drinks on days that they do drink o 17% of clients report consuming 5-10 drinks o 7% of clients report drinking more than 10 drinks per day on days that they do
drink
78
Mental Health
• When asked about mental health, including stress, depression, and problems with emotions, 38% of the answers seem to indicate indicated that the client had zero days in the last 30 days in which their mental health was not good. What has been realized is that clients who do not answer this question had a zero entered in this data field. Thus, we cannot determine how many clients reported zero bad days and how many clients simply did not answer the question. For this year (as in SFY14), we are only reporting results for clients who reported 1-30 days.
o On average, clients reported 14 days (±10 days) in the last month in which their mental health was not good
o 42% of clients reported 1-7 mentally unhealthy days o 14% reported 8-14 mentally unhealthy days o 20% reported 15-21 mentally unhealthy days o 24% reported 22-30 mentally unhealthy days, including 19% who indicated that
every day in the last 30 days was a mentally unhealthy day
• When asked about the impact of poor mental and/or physical health on performing usual activities, 52% of the answers seem to indicate indicated that the client had zero days in the last 30 days in which their mental or physical health limited activities. What has been realized is that clients who do not answer this question had a zero entered in this data field. Thus, we cannot determine how many clients reported zero bad days and how many clients simply did not answer the question. For this year (as in SFY14), we are only reporting results for clients who reported 1-30 days.
o On average, clients reported that 13 days (±10 days) in the last month were impacted by mental and/or physical health problems.
o 45% of clients reported 1-7 days in which activities were impacted o 15% reported 8-14 days in which activities were impacted o 18% reported 15-21 days in which activities were impacted o 22% reported 22-30 days in which activities were impacted, including 16% who
indicated that every day in the last 30 days was impacted by mental and/or physical health problems.
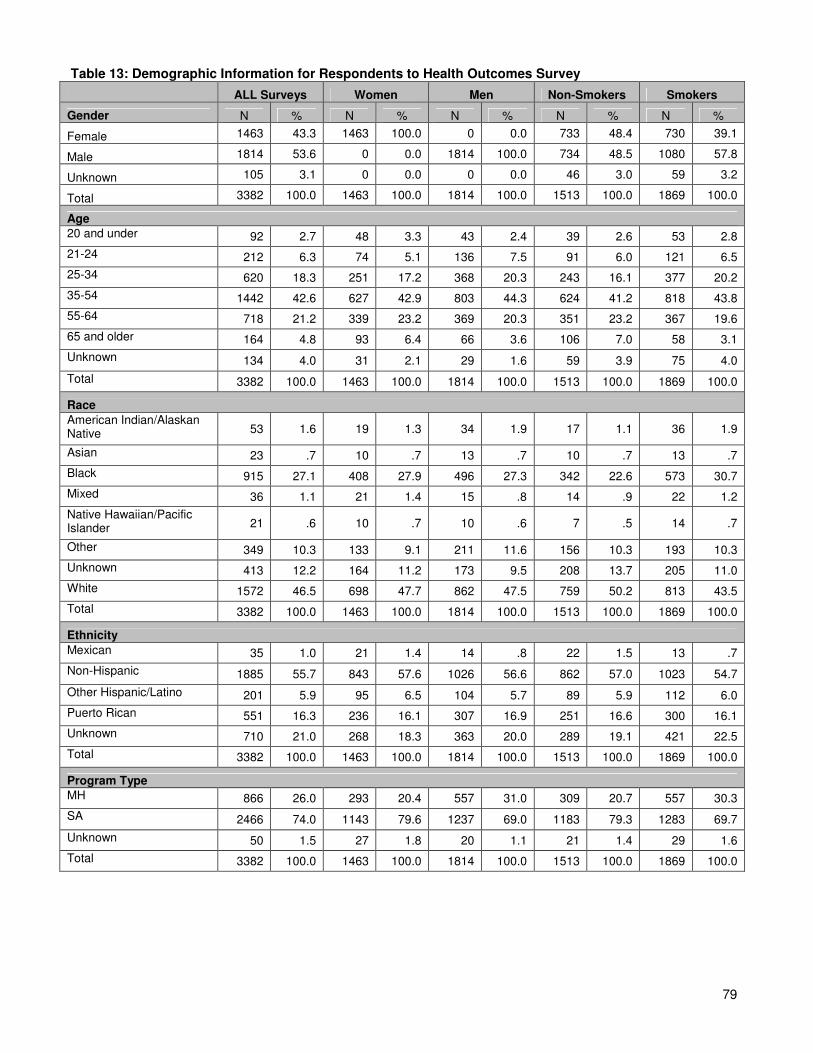
79
Table 13: Demographic Information for Respondents to Health Outcomes Survey
ALL Surveys Women Men Non-Smokers Smokers
Gender N % N % N % N % N %
Female 1463 43.3 1463 100.0 0 0.0 733 48.4 730 39.1
Male 1814 53.6 0 0.0 1814 100.0 734 48.5 1080 57.8
Unknown 105 3.1 0 0.0 0 0.0 46 3.0 59 3.2
Total 3382 100.0 1463 100.0 1814 100.0 1513 100.0 1869 100.0
Age
20 and under 92 2.7 48 3.3 43 2.4 39 2.6 53 2.8
21-24 212 6.3 74 5.1 136 7.5 91 6.0 121 6.5
25-34 620 18.3 251 17.2 368 20.3 243 16.1 377 20.2
35-54 1442 42.6 627 42.9 803 44.3 624 41.2 818 43.8
55-64 718 21.2 339 23.2 369 20.3 351 23.2 367 19.6
65 and older 164 4.8 93 6.4 66 3.6 106 7.0 58 3.1
Unknown 134 4.0 31 2.1 29 1.6 59 3.9 75 4.0
Total 3382 100.0 1463 100.0 1814 100.0 1513 100.0 1869 100.0
Race
American Indian/Alaskan Native 53 1.6 19 1.3 34 1.9 17 1.1 36 1.9
Asian 23 .7 10 .7 13 .7 10 .7 13 .7
Black 915 27.1 408 27.9 496 27.3 342 22.6 573 30.7
Mixed 36 1.1 21 1.4 15 .8 14 .9 22 1.2
Native Hawaiian/Pacific Islander 21 .6 10 .7 10 .6 7 .5 14 .7
Other 349 10.3 133 9.1 211 11.6 156 10.3 193 10.3
Unknown 413 12.2 164 11.2 173 9.5 208 13.7 205 11.0
White 1572 46.5 698 47.7 862 47.5 759 50.2 813 43.5
Total 3382 100.0 1463 100.0 1814 100.0 1513 100.0 1869 100.0
Ethnicity
Mexican 35 1.0 21 1.4 14 .8 22 1.5 13 .7
Non-Hispanic 1885 55.7 843 57.6 1026 56.6 862 57.0 1023 54.7
Other Hispanic/Latino 201 5.9 95 6.5 104 5.7 89 5.9 112 6.0
Puerto Rican 551 16.3 236 16.1 307 16.9 251 16.6 300 16.1
Unknown 710 21.0 268 18.3 363 20.0 289 19.1 421 22.5
Total 3382 100.0 1463 100.0 1814 100.0 1513 100.0 1869 100.0
Program Type
MH 866 26.0 293 20.4 557 31.0 309 20.7 557 30.3
SA 2466 74.0 1143 79.6 1237 69.0 1183 79.3 1283 69.7
Unknown 50 1.5 27 1.8 20 1.1 21 1.4 29 1.6
Total 3382 100.0 1463 100.0 1814 100.0 1513 100.0 1869 100.0
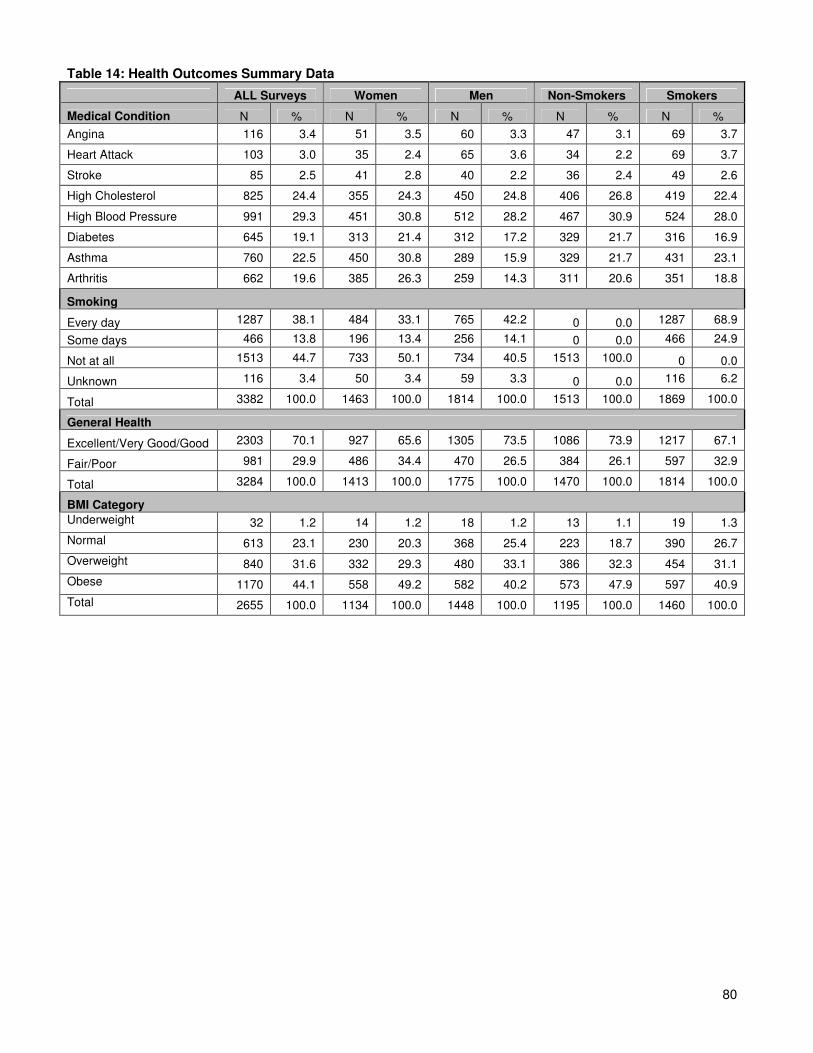
80
Table 14: Health Outcomes Summary Data
ALL Surveys Women Men Non-Smokers Smokers
Medical Condition N % N % N % N % N %
Angina 116 3.4 51 3.5 60 3.3 47 3.1 69 3.7
Heart Attack 103 3.0 35 2.4 65 3.6 34 2.2 69 3.7
Stroke 85 2.5 41 2.8 40 2.2 36 2.4 49 2.6
High Cholesterol 825 24.4 355 24.3 450 24.8 406 26.8 419 22.4
High Blood Pressure 991 29.3 451 30.8 512 28.2 467 30.9 524 28.0
Diabetes 645 19.1 313 21.4 312 17.2 329 21.7 316 16.9
Asthma 760 22.5 450 30.8 289 15.9 329 21.7 431 23.1
Arthritis 662 19.6 385 26.3 259 14.3 311 20.6 351 18.8
Smoking
Every day 1287 38.1 484 33.1 765 42.2 0 0.0 1287 68.9
Some days 466 13.8 196 13.4 256 14.1 0 0.0 466 24.9
Not at all 1513 44.7 733 50.1 734 40.5 1513 100.0 0 0.0
Unknown 116 3.4 50 3.4 59 3.3 0 0.0 116 6.2
Total 3382 100.0 1463 100.0 1814 100.0 1513 100.0 1869 100.0
General Health
Excellent/Very Good/Good 2303 70.1 927 65.6 1305 73.5 1086 73.9 1217 67.1
Fair/Poor 981 29.9 486 34.4 470 26.5 384 26.1 597 32.9
Total 3284 100.0 1413 100.0 1775 100.0 1470 100.0 1814 100.0
BMI Category
Underweight 32 1.2 14 1.2 18 1.2 13 1.1 19 1.3
Normal 613 23.1 230 20.3 368 25.4 223 18.7 390 26.7
Overweight 840 31.6 332 29.3 480 33.1 386 32.3 454 31.1
Obese 1170 44.1 558 49.2 582 40.2 573 47.9 597 40.9
Total 2655 100.0 1134 100.0 1448 100.0 1195 100.0 1460 100.0
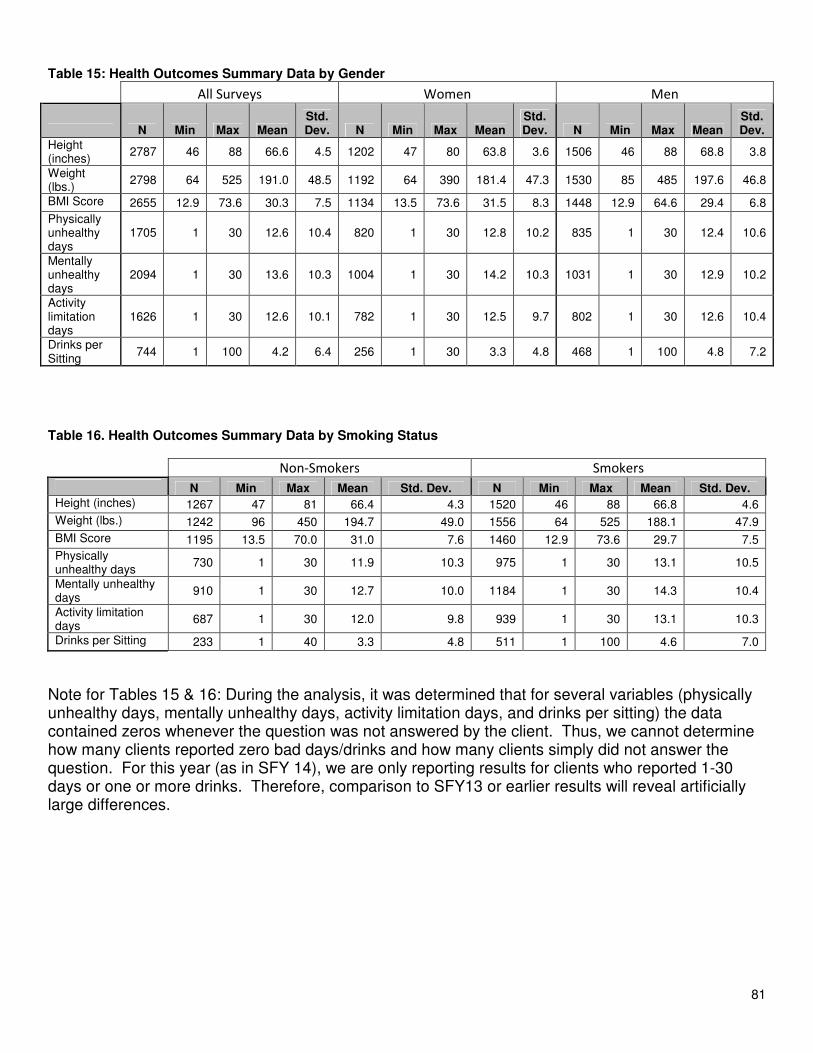
81
Table 15: Health Outcomes Summary Data by Gender
All Surveys Women Men
N Min Max Mean Std. Dev. N Min Max Mean
Std. Dev. N Min Max Mean
Std. Dev.
Height (inches)
2787 46 88 66.6 4.5 1202 47 80 63.8 3.6 1506 46 88 68.8 3.8
Weight (lbs.)
2798 64 525 191.0 48.5 1192 64 390 181.4 47.3 1530 85 485 197.6 46.8
BMI Score 2655 12.9 73.6 30.3 7.5 1134 13.5 73.6 31.5 8.3 1448 12.9 64.6 29.4 6.8
Physically unhealthy days
1705 1 30 12.6 10.4 820 1 30 12.8 10.2 835 1 30 12.4 10.6
Mentally unhealthy days
2094 1 30 13.6 10.3 1004 1 30 14.2 10.3 1031 1 30 12.9 10.2
Activity limitation days
1626 1 30 12.6 10.1 782 1 30 12.5 9.7 802 1 30 12.6 10.4
Drinks per Sitting
744 1 100 4.2 6.4 256 1 30 3.3 4.8 468 1 100 4.8 7.2
Table 16. Health Outcomes Summary Data by Smoking Status
Non-Smokers Smokers
N Min Max Mean Std. Dev. N Min Max Mean Std. Dev.
Height (inches) 1267 47 81 66.4 4.3 1520 46 88 66.8 4.6
Weight (lbs.) 1242 96 450 194.7 49.0 1556 64 525 188.1 47.9
BMI Score 1195 13.5 70.0 31.0 7.6 1460 12.9 73.6 29.7 7.5
Physically unhealthy days
730 1 30 11.9 10.3 975 1 30 13.1 10.5
Mentally unhealthy days
910 1 30 12.7 10.0 1184 1 30 14.3 10.4
Activity limitation days
687 1 30 12.0 9.8 939 1 30 13.1 10.3
Drinks per Sitting 233 1 40 3.3 4.8 511 1 100 4.6 7.0
Note for Tables 15 & 16: During the analysis, it was determined that for several variables (physically unhealthy days, mentally unhealthy days, activity limitation days, and drinks per sitting) the data contained zeros whenever the question was not answered by the client. Thus, we cannot determine how many clients reported zero bad days/drinks and how many clients simply did not answer the question. For this year (as in SFY 14), we are only reporting results for clients who reported 1-30 days or one or more drinks. Therefore, comparison to SFY13 or earlier results will reveal artificially large differences.
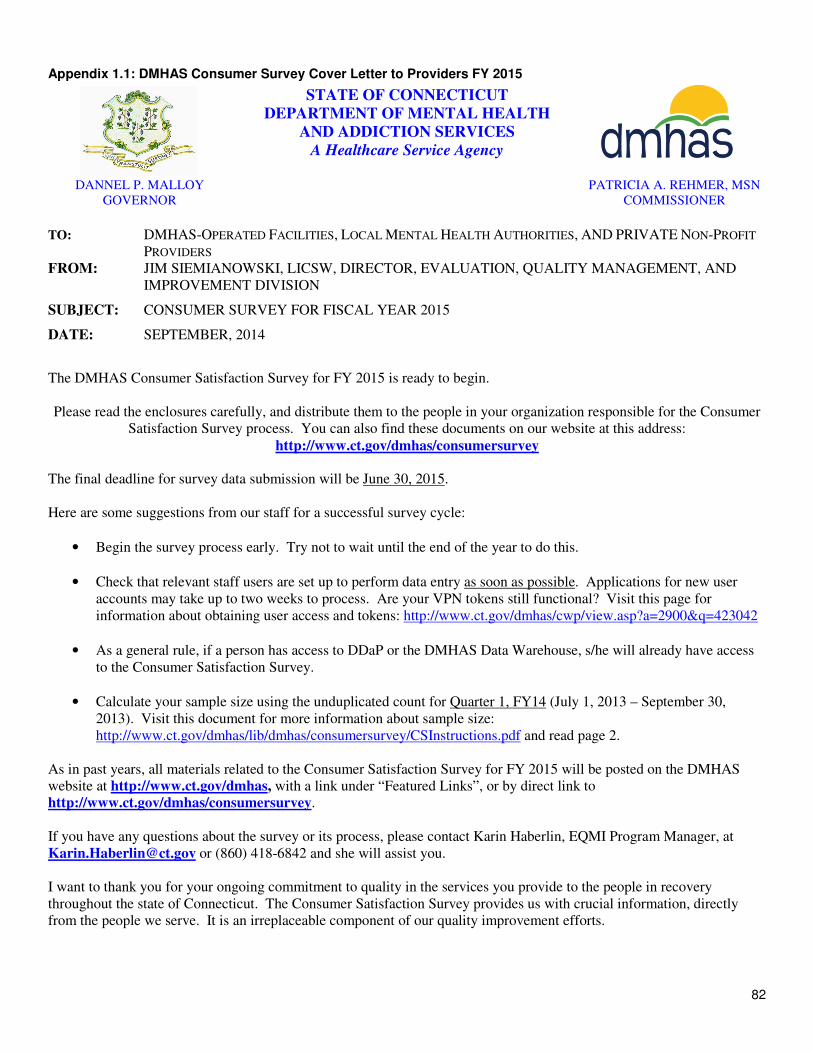
82
Appendix 1.1: DMHAS Consumer Survey Cover Letter to Providers FY 2015
STATE OF CONNECTICUT
DEPARTMENT OF MENTAL HEALTH
AND ADDICTION SERVICES
A Healthcare Service Agency
DANNEL P. MALLOY
GOVERNOR
PATRICIA A. REHMER, MSN
COMMISSIONER
TO: DMHAS-OPERATED FACILITIES, LOCAL MENTAL HEALTH AUTHORITIES, AND PRIVATE NON-PROFIT
PROVIDERS
FROM: JIM SIEMIANOWSKI, LICSW, DIRECTOR, EVALUATION, QUALITY MANAGEMENT, AND
IMPROVEMENT DIVISION
SUBJECT: CONSUMER SURVEY FOR FISCAL YEAR 2015
DATE: SEPTEMBER, 2014
The DMHAS Consumer Satisfaction Survey for FY 2015 is ready to begin.
Please read the enclosures carefully, and distribute them to the people in your organization responsible for the Consumer
Satisfaction Survey process. You can also find these documents on our website at this address:
http://www.ct.gov/dmhas/consumersurvey
The final deadline for survey data submission will be June 30, 2015.
Here are some suggestions from our staff for a successful survey cycle:
• Begin the survey process early. Try not to wait until the end of the year to do this.
• Check that relevant staff users are set up to perform data entry as soon as possible. Applications for new user
accounts may take up to two weeks to process. Are your VPN tokens still functional? Visit this page for
information about obtaining user access and tokens: http://www.ct.gov/dmhas/cwp/view.asp?a=2900&q=423042
• As a general rule, if a person has access to DDaP or the DMHAS Data Warehouse, s/he will already have access
to the Consumer Satisfaction Survey.
• Calculate your sample size using the unduplicated count for Quarter 1, FY14 (July 1, 2013 – September 30,
2013). Visit this document for more information about sample size:
http://www.ct.gov/dmhas/lib/dmhas/consumersurvey/CSInstructions.pdf and read page 2.
As in past years, all materials related to the Consumer Satisfaction Survey for FY 2015 will be posted on the DMHAS
website at http://www.ct.gov/dmhas, with a link under “Featured Links”, or by direct link to
http://www.ct.gov/dmhas/consumersurvey.
If you have any questions about the survey or its process, please contact Karin Haberlin, EQMI Program Manager, at
[email protected] or (860) 418-6842 and she will assist you.
I want to thank you for your ongoing commitment to quality in the services you provide to the people in recovery
throughout the state of Connecticut. The Consumer Satisfaction Survey provides us with crucial information, directly
from the people we serve. It is an irreplaceable component of our quality improvement efforts.
83
Appendix 1.2: DMHAS Consumer Survey Cover Letter to Consumers FY 2015
STATE OF CONNECTICUT
DEPARTMENT OF MENTAL HEALTH
AND ADDICTION SERVICES
A Healthcare Service Agency
DANNEL P. MALLOY
GOVERNOR PATRICIA A. REHMER, MSN
COMMISSIONER
September, 2014
Dear Program Participant:
We invite you to join our annual consumer satisfaction survey. You decide if you want to take part, and
which questions to answer. The survey is anonymous. You will not be asked for your name or anything else
that identifies you. Your agency will do its best to keep your answers private.
Please give your honest opinion of services. We appreciate your time and effort, and look forward to using the
information to improve services for you.
Thank you!
Jim Siemianowski, LCSW
Director, Evaluation, Quality Management, and Improvement Division
Department of Mental Health and Addiction Services
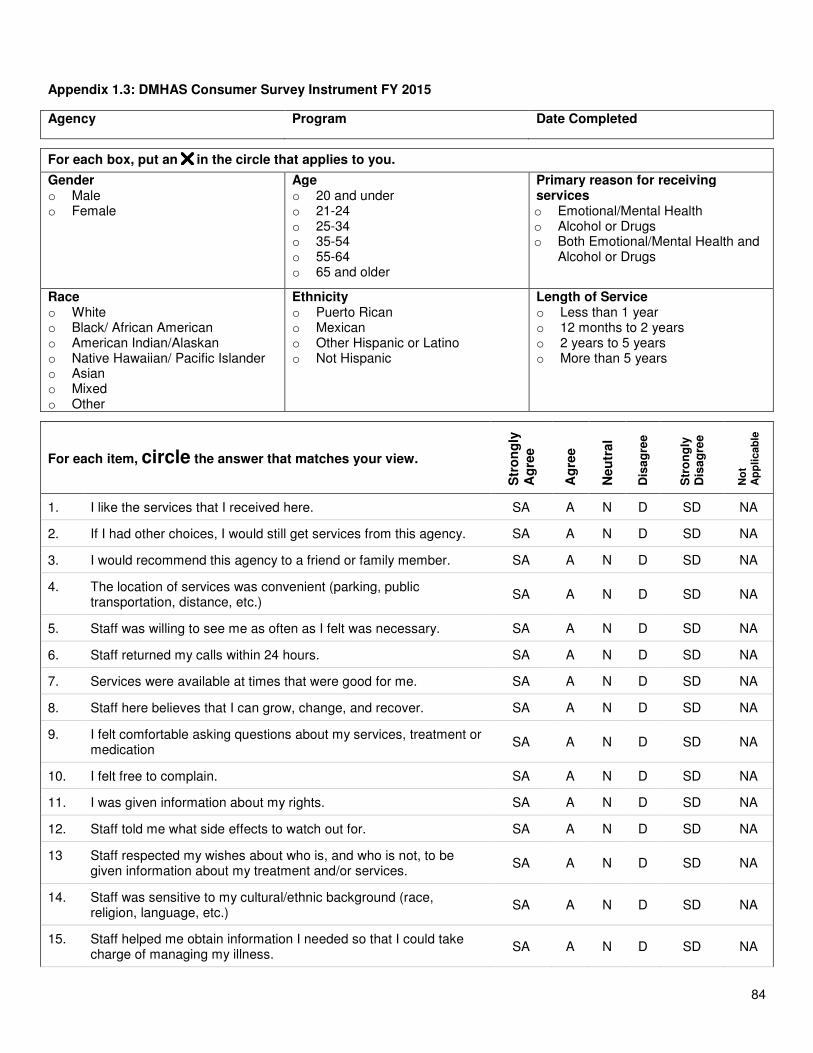
84
Appendix 1.3: DMHAS Consumer Survey Instrument FY 2015
Agency Program Date Completed
For each box, put an����in the circle that applies to you.
Gender o Male o Female
Age o 20 and under o 21-24 o 25-34 o 35-54 o 55-64 o 65 and older
Primary reason for receiving services o Emotional/Mental Health o Alcohol or Drugs o Both Emotional/Mental Health and
Alcohol or Drugs
Race o White o Black/ African American o American Indian/Alaskan o Native Hawaiian/ Pacific Islander o Asian o Mixed o Other
Ethnicity o Puerto Rican o Mexican o Other Hispanic or Latino o Not Hispanic
Length of Service o Less than 1 year o 12 months to 2 years o 2 years to 5 years o More than 5 years
For each item, circle the answer that matches your view.
Str
on
gly
A
gre
e
Ag
ree
Neu
tral
Dis
ag
ree
Str
on
gly
D
isa
gre
e
No
t
Ap
pli
cab
le
1. I like the services that I received here. SA A N D SD NA
2. If I had other choices, I would still get services from this agency. SA A N D SD NA
3. I would recommend this agency to a friend or family member. SA A N D SD NA
4. The location of services was convenient (parking, public transportation, distance, etc.)
SA A N D SD NA
5. Staff was willing to see me as often as I felt was necessary. SA A N D SD NA
6. Staff returned my calls within 24 hours. SA A N D SD NA
7. Services were available at times that were good for me. SA A N D SD NA
8. Staff here believes that I can grow, change, and recover. SA A N D SD NA
9. I felt comfortable asking questions about my services, treatment or medication
SA A N D SD NA
10. I felt free to complain. SA A N D SD NA
11. I was given information about my rights. SA A N D SD NA
12. Staff told me what side effects to watch out for. SA A N D SD NA
13 Staff respected my wishes about who is, and who is not, to be given information about my treatment and/or services.
SA A N D SD NA
14. Staff was sensitive to my cultural/ethnic background (race, religion, language, etc.)
SA A N D SD NA
15. Staff helped me obtain information I needed so that I could take charge of managing my illness.
SA A N D SD NA
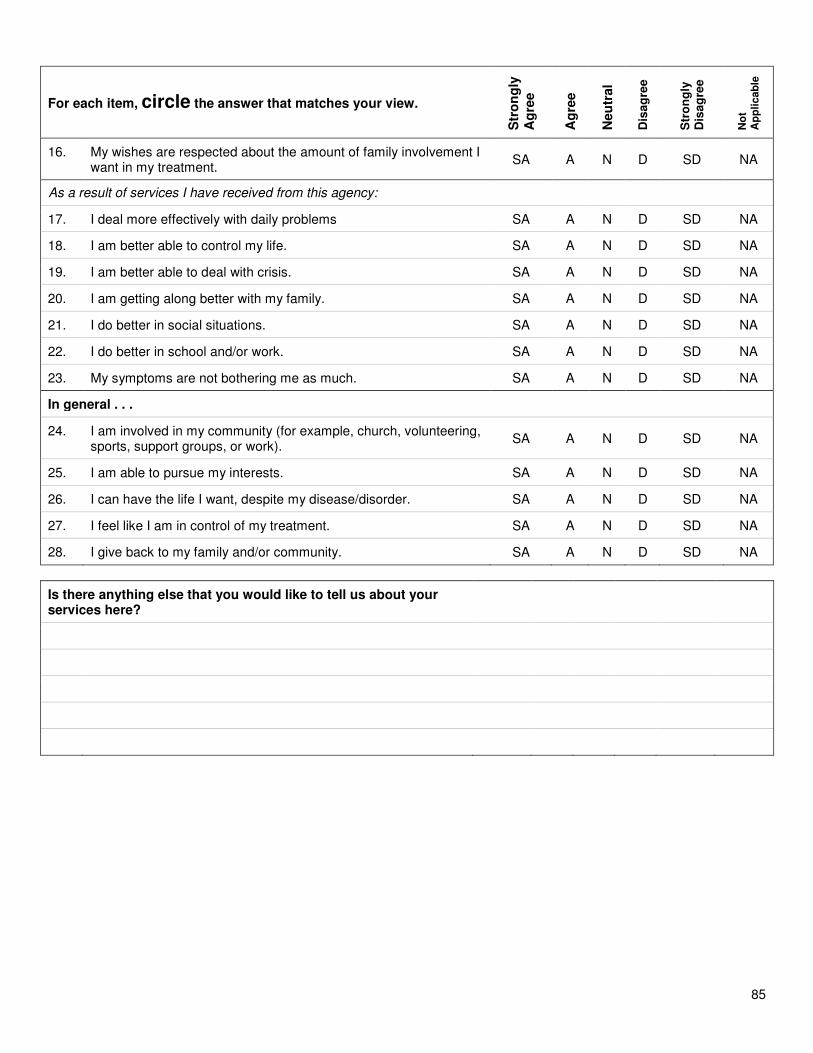
85
For each item, circle the answer that matches your view.
Str
on
gly
A
gre
e
Ag
ree
Neu
tral
Dis
ag
ree
Str
on
gly
D
isa
gre
e
No
t
Ap
pli
cab
le
16. My wishes are respected about the amount of family involvement I want in my treatment.
SA A N D SD NA
As a result of services I have received from this agency:
17. I deal more effectively with daily problems SA A N D SD NA
18. I am better able to control my life. SA A N D SD NA
19. I am better able to deal with crisis. SA A N D SD NA
20. I am getting along better with my family. SA A N D SD NA
21. I do better in social situations. SA A N D SD NA
22. I do better in school and/or work. SA A N D SD NA
23. My symptoms are not bothering me as much. SA A N D SD NA
In general . . .
24. I am involved in my community (for example, church, volunteering, sports, support groups, or work).
SA A N D SD NA
25. I am able to pursue my interests. SA A N D SD NA
26. I can have the life I want, despite my disease/disorder. SA A N D SD NA
27. I feel like I am in control of my treatment. SA A N D SD NA
28. I give back to my family and/or community. SA A N D SD NA
Is there anything else that you would like to tell us about your services here?
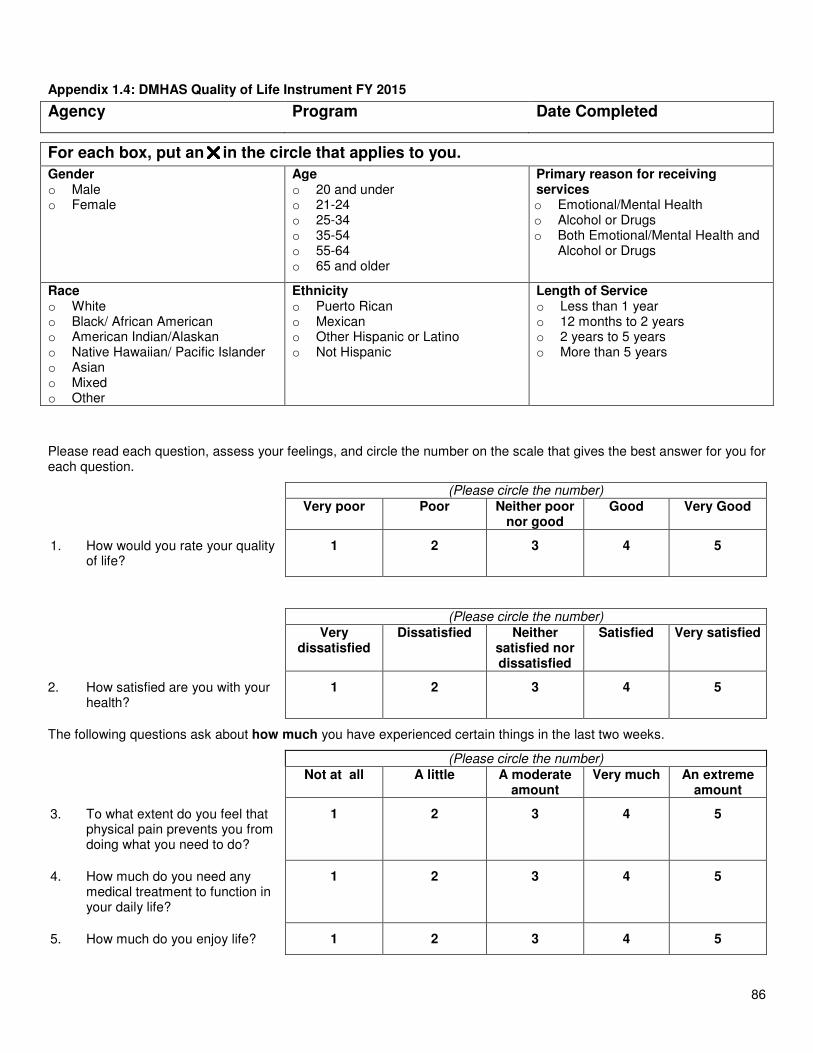
86
Appendix 1.4: DMHAS Quality of Life Instrument FY 2015
Agency Program Date Completed
For each box, put an����in the circle that applies to you.
Gender o Male o Female
Age o 20 and under o 21-24 o 25-34 o 35-54 o 55-64 o 65 and older
Primary reason for receiving services o Emotional/Mental Health o Alcohol or Drugs o Both Emotional/Mental Health and
Alcohol or Drugs
Race o White o Black/ African American o American Indian/Alaskan o Native Hawaiian/ Pacific Islander o Asian o Mixed o Other
Ethnicity o Puerto Rican o Mexican o Other Hispanic or Latino o Not Hispanic
Length of Service o Less than 1 year o 12 months to 2 years o 2 years to 5 years o More than 5 years
Please read each question, assess your feelings, and circle the number on the scale that gives the best answer for you for each question.
(Please circle the number)
Very poor Poor Neither poor nor good
Good Very Good
1. How would you rate your quality of life?
1 2 3 4 5
(Please circle the number)
Very dissatisfied
Dissatisfied Neither satisfied nor dissatisfied
Satisfied Very satisfied
2. How satisfied are you with your health?
1 2 3 4 5
The following questions ask about how much you have experienced certain things in the last two weeks.
(Please circle the number)
Not at all A little A moderate amount
Very much An extreme amount
3. To what extent do you feel that physical pain prevents you from doing what you need to do?
1 2 3 4 5
4. How much do you need any medical treatment to function in your daily life?
1 2 3 4 5
5. How much do you enjoy life? 1 2 3 4 5
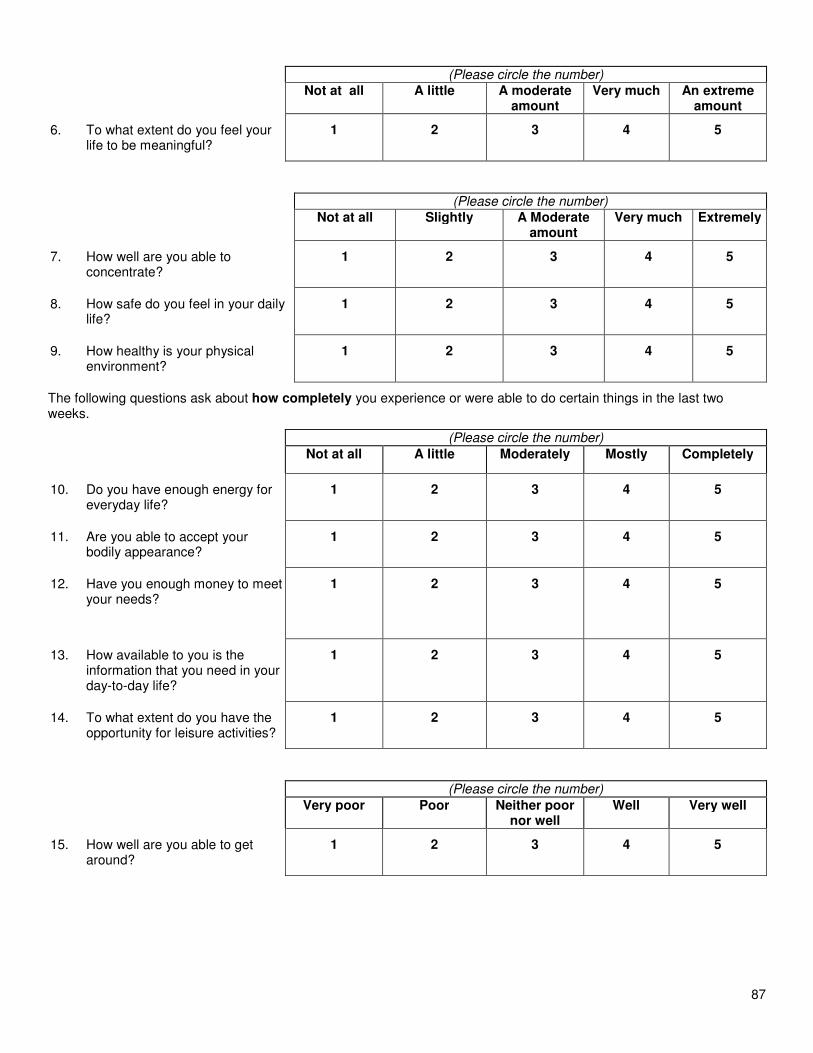
87
(Please circle the number)
Not at all A little A moderate amount
Very much An extreme amount
6. To what extent do you feel your life to be meaningful?
1 2 3 4 5
(Please circle the number)
Not at all Slightly A Moderate amount
Very much Extremely
7. How well are you able to concentrate?
1 2 3 4 5
8. How safe do you feel in your daily life?
1 2 3 4 5
9. How healthy is your physical environment?
1 2 3 4 5
The following questions ask about how completely you experience or were able to do certain things in the last two weeks.
(Please circle the number)
Not at all A little Moderately Mostly Completely
10. Do you have enough energy for everyday life?
1 2 3 4 5
11. Are you able to accept your bodily appearance?
1 2 3 4 5
12. Have you enough money to meet your needs?
1 2 3 4 5
13. How available to you is the information that you need in your day-to-day life?
1 2 3 4 5
14. To what extent do you have the opportunity for leisure activities?
1 2 3 4 5
(Please circle the number)
Very poor Poor Neither poor nor well
Well Very well
15. How well are you able to get around?
1 2 3 4 5
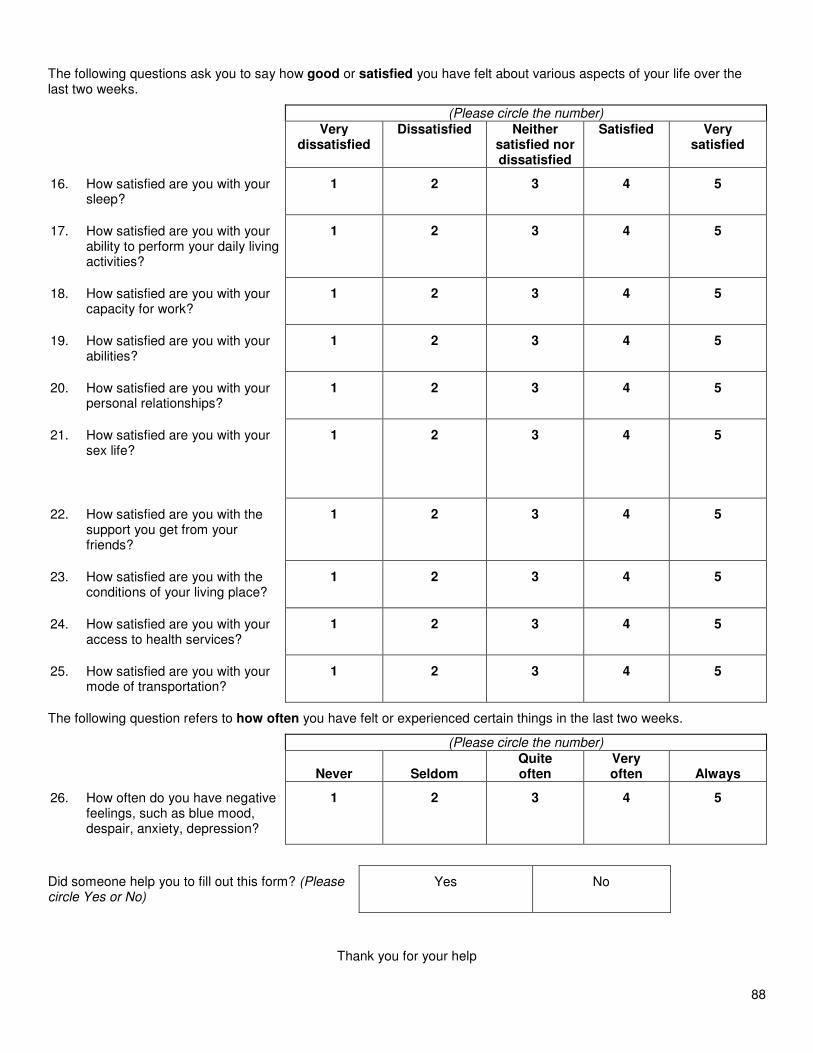
88
The following questions ask you to say how good or satisfied you have felt about various aspects of your life over the last two weeks.
(Please circle the number)
Very dissatisfied
Dissatisfied Neither satisfied nor dissatisfied
Satisfied Very satisfied
16. How satisfied are you with your sleep?
1 2 3 4 5
17. How satisfied are you with your ability to perform your daily living activities?
1 2 3 4 5
18. How satisfied are you with your capacity for work?
1 2 3 4 5
19. How satisfied are you with your abilities?
1 2 3 4 5
20. How satisfied are you with your personal relationships?
1 2 3 4 5
21. How satisfied are you with your sex life?
1 2 3 4 5
22. How satisfied are you with the support you get from your friends?
1 2 3 4 5
23. How satisfied are you with the conditions of your living place?
1 2 3 4 5
24. How satisfied are you with your access to health services?
1 2 3 4 5
25. How satisfied are you with your mode of transportation?
1 2 3 4 5
The following question refers to how often you have felt or experienced certain things in the last two weeks.
(Please circle the number)
Never
Seldom
Quite often
Very often
Always
26. How often do you have negative feelings, such as blue mood, despair, anxiety, depression?
1 2 3 4 5
Did someone help you to fill out this form? (Please circle Yes or No)
Yes No
Thank you for your help
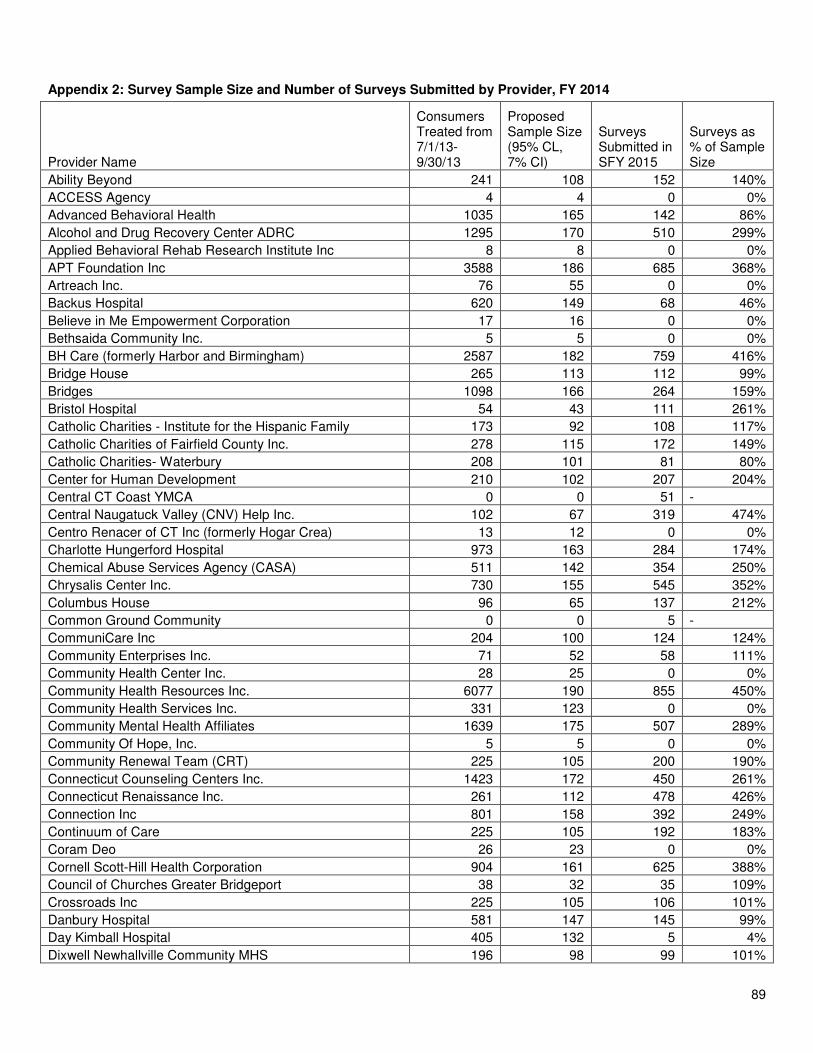
89
Appendix 2: Survey Sample Size and Number of Surveys Submitted by Provider, FY 2014
Provider Name
Consumers Treated from 7/1/13-9/30/13
Proposed Sample Size (95% CL, 7% CI)
Surveys Submitted in SFY 2015
Surveys as % of Sample Size
Ability Beyond 241 108 152 140%
ACCESS Agency 4 4 0 0%
Advanced Behavioral Health 1035 165 142 86%
Alcohol and Drug Recovery Center ADRC 1295 170 510 299%
Applied Behavioral Rehab Research Institute Inc 8 8 0 0%
APT Foundation Inc 3588 186 685 368%
Artreach Inc. 76 55 0 0%
Backus Hospital 620 149 68 46%
Believe in Me Empowerment Corporation 17 16 0 0%
Bethsaida Community Inc. 5 5 0 0%
BH Care (formerly Harbor and Birmingham) 2587 182 759 416%
Bridge House 265 113 112 99%
Bridges 1098 166 264 159%
Bristol Hospital 54 43 111 261%
Catholic Charities - Institute for the Hispanic Family 173 92 108 117%
Catholic Charities of Fairfield County Inc. 278 115 172 149%
Catholic Charities- Waterbury 208 101 81 80%
Center for Human Development 210 102 207 204%
Central CT Coast YMCA 0 0 51 -
Central Naugatuck Valley (CNV) Help Inc. 102 67 319 474%
Centro Renacer of CT Inc (formerly Hogar Crea) 13 12 0 0%
Charlotte Hungerford Hospital 973 163 284 174%
Chemical Abuse Services Agency (CASA) 511 142 354 250%
Chrysalis Center Inc. 730 155 545 352%
Columbus House 96 65 137 212%
Common Ground Community 0 0 5 -
CommuniCare Inc 204 100 124 124%
Community Enterprises Inc. 71 52 58 111%
Community Health Center Inc. 28 25 0 0%
Community Health Resources Inc. 6077 190 855 450%
Community Health Services Inc. 331 123 0 0%
Community Mental Health Affiliates 1639 175 507 289%
Community Of Hope, Inc. 5 5 0 0%
Community Renewal Team (CRT) 225 105 200 190%
Connecticut Counseling Centers Inc. 1423 172 450 261%
Connecticut Renaissance Inc. 261 112 478 426%
Connection Inc 801 158 392 249%
Continuum of Care 225 105 192 183%
Coram Deo 26 23 0 0%
Cornell Scott-Hill Health Corporation 904 161 625 388%
Council of Churches Greater Bridgeport 38 32 35 109%
Crossroads Inc 225 105 106 101%
Danbury Hospital 581 147 145 99%
Day Kimball Hospital 405 132 5 4%
Dixwell Newhallville Community MHS 196 98 99 101%
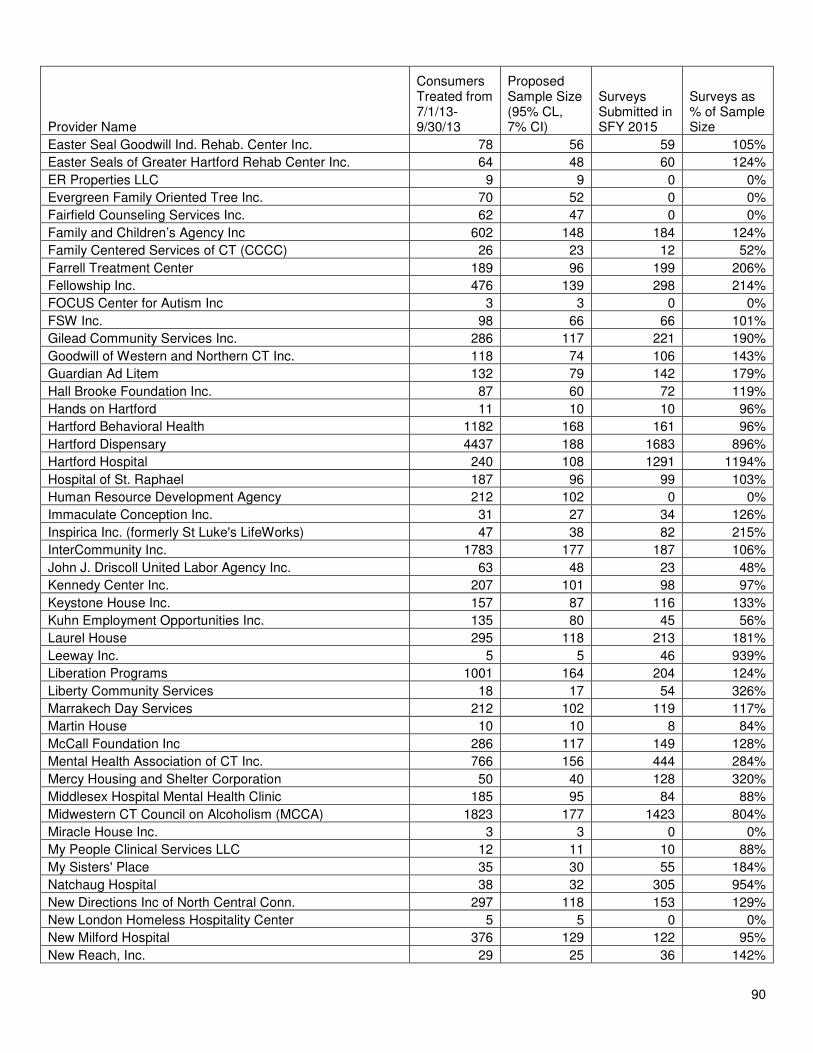
90
Provider Name
Consumers Treated from 7/1/13-9/30/13
Proposed Sample Size (95% CL, 7% CI)
Surveys Submitted in SFY 2015
Surveys as % of Sample Size
Easter Seal Goodwill Ind. Rehab. Center Inc. 78 56 59 105%
Easter Seals of Greater Hartford Rehab Center Inc. 64 48 60 124%
ER Properties LLC 9 9 0 0%
Evergreen Family Oriented Tree Inc. 70 52 0 0%
Fairfield Counseling Services Inc. 62 47 0 0%
Family and Children’s Agency Inc 602 148 184 124%
Family Centered Services of CT (CCCC) 26 23 12 52%
Farrell Treatment Center 189 96 199 206%
Fellowship Inc. 476 139 298 214%
FOCUS Center for Autism Inc 3 3 0 0%
FSW Inc. 98 66 66 101%
Gilead Community Services Inc. 286 117 221 190%
Goodwill of Western and Northern CT Inc. 118 74 106 143%
Guardian Ad Litem 132 79 142 179%
Hall Brooke Foundation Inc. 87 60 72 119%
Hands on Hartford 11 10 10 96%
Hartford Behavioral Health 1182 168 161 96%
Hartford Dispensary 4437 188 1683 896%
Hartford Hospital 240 108 1291 1194%
Hospital of St. Raphael 187 96 99 103%
Human Resource Development Agency 212 102 0 0%
Immaculate Conception Inc. 31 27 34 126%
Inspirica Inc. (formerly St Luke's LifeWorks) 47 38 82 215%
InterCommunity Inc. 1783 177 187 106%
John J. Driscoll United Labor Agency Inc. 63 48 23 48%
Kennedy Center Inc. 207 101 98 97%
Keystone House Inc. 157 87 116 133%
Kuhn Employment Opportunities Inc. 135 80 45 56%
Laurel House 295 118 213 181%
Leeway Inc. 5 5 46 939%
Liberation Programs 1001 164 204 124%
Liberty Community Services 18 17 54 326%
Marrakech Day Services 212 102 119 117%
Martin House 10 10 8 84%
McCall Foundation Inc 286 117 149 128%
Mental Health Association of CT Inc. 766 156 444 284%
Mercy Housing and Shelter Corporation 50 40 128 320%
Middlesex Hospital Mental Health Clinic 185 95 84 88%
Midwestern CT Council on Alcoholism (MCCA) 1823 177 1423 804%
Miracle House Inc. 3 3 0 0%
My People Clinical Services LLC 12 11 10 88%
My Sisters' Place 35 30 55 184%
Natchaug Hospital 38 32 305 954%
New Directions Inc of North Central Conn. 297 118 153 129%
New London Homeless Hospitality Center 5 5 0 0%
New Milford Hospital 376 129 122 95%
New Reach, Inc. 29 25 36 142%
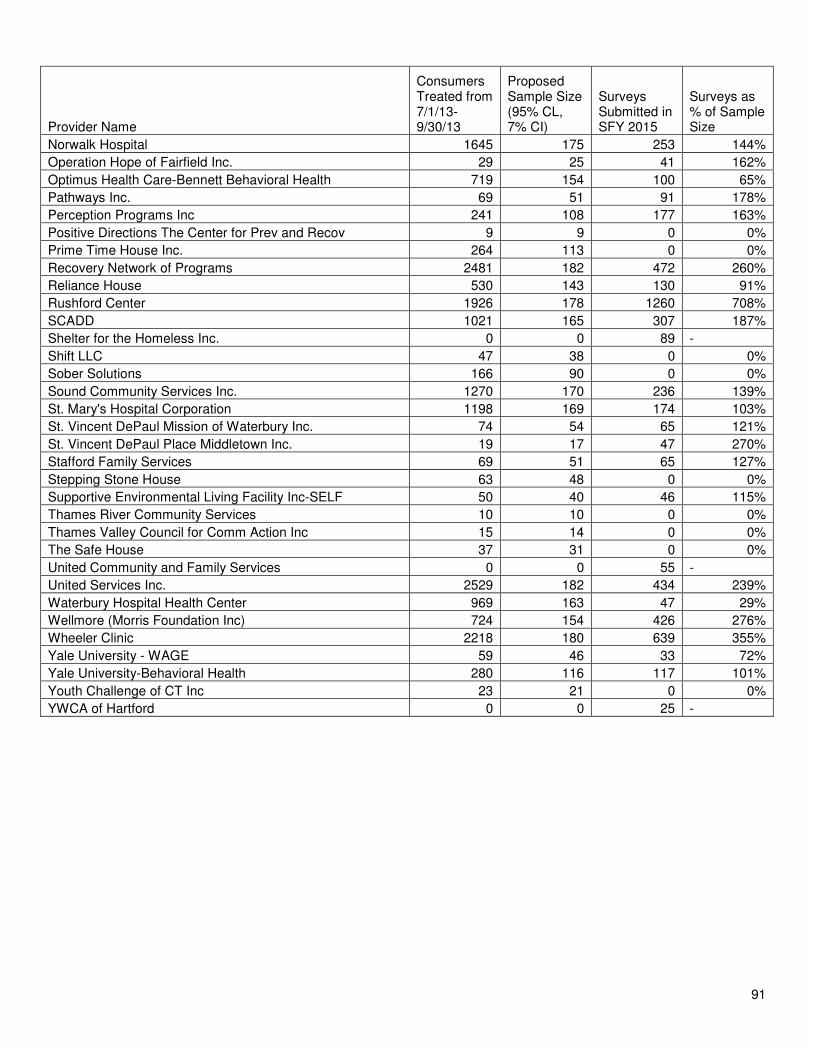
91
Provider Name
Consumers Treated from 7/1/13-9/30/13
Proposed Sample Size (95% CL, 7% CI)
Surveys Submitted in SFY 2015
Surveys as % of Sample Size
Norwalk Hospital 1645 175 253 144%
Operation Hope of Fairfield Inc. 29 25 41 162%
Optimus Health Care-Bennett Behavioral Health 719 154 100 65%
Pathways Inc. 69 51 91 178%
Perception Programs Inc 241 108 177 163%
Positive Directions The Center for Prev and Recov 9 9 0 0%
Prime Time House Inc. 264 113 0 0%
Recovery Network of Programs 2481 182 472 260%
Reliance House 530 143 130 91%
Rushford Center 1926 178 1260 708%
SCADD 1021 165 307 187%
Shelter for the Homeless Inc. 0 0 89 -
Shift LLC 47 38 0 0%
Sober Solutions 166 90 0 0%
Sound Community Services Inc. 1270 170 236 139%
St. Mary's Hospital Corporation 1198 169 174 103%
St. Vincent DePaul Mission of Waterbury Inc. 74 54 65 121%
St. Vincent DePaul Place Middletown Inc. 19 17 47 270%
Stafford Family Services 69 51 65 127%
Stepping Stone House 63 48 0 0%
Supportive Environmental Living Facility Inc-SELF 50 40 46 115%
Thames River Community Services 10 10 0 0%
Thames Valley Council for Comm Action Inc 15 14 0 0%
The Safe House 37 31 0 0%
United Community and Family Services 0 0 55 -
United Services Inc. 2529 182 434 239%
Waterbury Hospital Health Center 969 163 47 29%
Wellmore (Morris Foundation Inc) 724 154 426 276%
Wheeler Clinic 2218 180 639 355%
Yale University - WAGE 59 46 33 72%
Yale University-Behavioral Health 280 116 117 101%
Youth Challenge of CT Inc 23 21 0 0%
YWCA of Hartford 0 0 25 -