Embed Size (px)
Citation preview
1
Consumer-resource dynamics is an eco-evolutionary process 1
in a natural plankton community 2 3
Lindsay R. Schaffner1,7, Lynn Govaert2,3,4,7, Luc De Meester2, Stephen P. Ellner1, Eliza Fairchild1, 4
Brooks E. Miner5, Lars G. Rudstam6, Piet Spaak3 and Nelson G. Hairston, Jr1,3* 5
6 1 Department of Ecology and Evolutionary Biology, Cornell University, Ithaca, NY, USA. 7 2 Laboratory of Aquatic Ecology, Evolution and Conservation, Katholieke Universiteit Leuven, Leuven, 8
Belgium. 3Swiss Federal Institute of Aquatic Science and Technology, Eawag, Dübendorf, Switzerland. 9 4Department of Evolutionary Biology and Environmental Studies, University of Zurich, Zürich, 10
Switzerland. 5Department of Biology, Ithaca College, Ithaca, NY, USA. 6Department of Natural Resources 11
& Cornell Biological Field Station, Cornell University, Ithaca NY, USA. 7LRS and LG contributed equally to 12
this research and publication. *e-mail: [email protected] 13
14 15 16
When traits affecting species interactions evolve rapidly, ecological dynamics can be altered 17
while they occur. These eco-evolutionary dynamics have been documented repeatedly in 18
laboratory and mesocosm experiments. We show here that they are also important for 19
understanding community functioning in a natural ecosystem. Daphnia is a major planktonic 20
consumer influencing seasonal plankton dynamics in many lakes. It is also sensitive to 21
succession in its phytoplankton food, from edible algae in spring to relatively inedible 22
cyanobacteria in summer. We show for Daphnia mendotae in Oneida Lake, USA, that within-23
year ecological change in phytoplankton (from spring diatoms, cryptophytes and greens to 24
summer cyanobacteria) resulted in consumers evolving increasing tolerance to cyanobacteria 25
over time. This evolution fed back on ecological seasonal changes in population abundance 26
of this major phytoplankton consumer. Oneida Lake is typical of mesotrophic lakes broadly, 27
suggesting that eco-evolutionary consumer-resource dynamics is likely common. 28
29
30
This document is the accepted manuscript version of the following article: Schaffner, L. R., Govaert, L., De Meester, L., Ellner, S. P., Fairchild, E., Miner, B. E., … Hairston, N. G. (2019). Consumer-resource dynamics is an eco-evolutionary process in a natural plankton community. Nature Ecology & Evolution. https://doi.org/10.1038/s41559-019-0960-9
2
Temporal eco-evolutionary dynamics1-3 have been documented in laboratory microcosms4-6 and 31
field mesocosms7-9, but there have been very few studies in unconfined natural systems. Eco-32
evolutionary dynamics will have the greatest ecological importance if the evolving organism 33
plays a central role in the functioning of its ecosystem. Daphnia is a good candidate for 34
exploring the importance of eco-evolutionary dynamics in nature10,11 because it is a significant 35
consumer of phytoplankton with effects on phytoplankton community composition12, nutrient 36
availability and stoichiometry13, and food for zooplanktivorous predators14, hence playing a 37
central role in the trophic cascade in lakes15. 38
In many lakes Daphnia faces the challenge that the summer phytoplankton community is 39
dominated by cyanobacteria, which are poor food nutritionally, often contain toxins, and can 40
have colony shapes difficult to capture and ingest16. Because Daphnia is poor at discriminating 41
among particles when feeding, cyanobacteria dominance typically results in low Daphnia growth 42
rate17-20. When this occurs, natural selection should strongly favor Daphnia genotypes that are 43
relatively insensitive to dietary cyanobacteria. Consistent with this expectation, clonal lineages 44
of Daphnia, hatched from dormant eggs laid before and after the appearance of summer 45
cyanobacterial blooms in Lake Constance, Europe, showed evolution of increased tolerance over 46
the course of a decade18. Similarly, Daphnia clones from lakes with cyanobacteria have been 47
found to be more tolerant than clones from lakes without cyanobacteria19. Furthermore, feedback 48
from evolution to ecology has been documented in the lab: tolerant clones suppressed the growth 49
of cyanobacteria in nutrient-enriched mesocosms, while those sensitive to cyanobacteria did 50
not20. 51
To investigate whether this adaptive evolution occurs rapidly enough to affect seasonal 52
consumer-resource dynamics in a natural system, we studied evolutionary changes in Daphnia 53
mendotae in Oneida Lake, New York, USA, through a single season during which the 54
phytoplankton community underwent typical succession, including a summer cyanobacterial 55
bloom. Of the three species of Daphnia present in Oneida Lake over the past four decades, D. 56
mendotae (hereafter, Daphnia) has been dominant since 200636, including in 2015, the year of 57
this study, when it comprised >70% of the daphniid biomass. Because these Daphnia only 58
reproduce parthenogenetically in summer21, with a generation time of approximately one week, 59
we documented evolution as changes in frequency of clones identified using microsatellite DNA 60
genotyping. We then assayed in the laboratory the performance of seven representative clones 61
3
with peak abundances at different times of year, by measuring their juvenile growth rate (JGR; a 62
fitness correlate)10,24 when fed 1 mg C L-1 (i.e., ad libitum) of either spring phytoplankton 63
(diatoms, cryptophytes and chlorophytes) or summer phytoplankton (cyanobacteria and 64
chlorophytes). From this we calculated how mean Daphnia growth rate and population 65
dynamics changed seasonally, affected both by succession in phytoplankton quality as food as 66
well as by evolution of Daphnia sensitivity to that changing diet. 67
68
Results and Discussion 69
Ecological plankton dynamics in Oneida Lake. Seasonal phytoplankton-zooplankton 70
dynamics in Oneida Lake in 2015 were consistent with the generally accepted pattern in 71
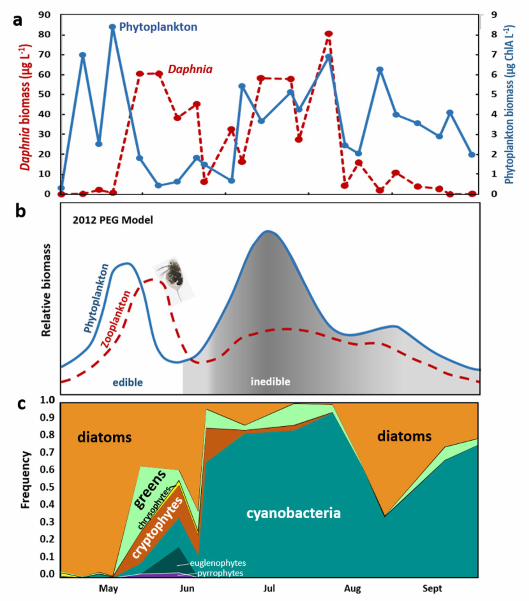
eutrophic lakes depicted in the plankton ecology group “PEG” model10.22,23 (Fig. 1). Specifically, 72
a spring diatom bloom ended in late May, as grazing by Daphnia caused a spring clear-water 73
phase (CWP) dominated by small edible cryptophytes, euglenophytes, diatoms, and chlorophytes 74
that comprised 85–100% of the biomass. The CWP was followed by a crash and then resurgence 75
of the Daphnia population, accompanied by an increase in cyanobacteria abundance (75–90% of 76
biomass). Filamentous forms dominated first (Dolichospermum then Aphanizomenon), followed 77
by colonial Microcystis and a late August return of diatoms. 78
79
Ecology affecting evolution. We identified 124 unique D. mendotae clones which varied 80
seasonally in frequency (Fig. 2a). We chose seven clones with peak abundance at different times 81
during the study period (Fig. 2b; see Methods). These represented on average 48% of the D. 82
mendotae isolated on each date (range: 22-84%). Whereas all seven clones had lower JGR on the 83
summer diet containing cyanobacteria than on the spring diet (Fig. 3a; ANOVA food effect, df = 84
1, F = 174.1, p<<0.001, Supplementary Table 1), they differed in their overall performance 85
(clone effect, df = 7, F = 4.86, p<0.001) and in their sensitivity to diet (food×clone effect, df = 7, 86
F = 11.51, p<<0.001). In pairwise comparisons of reaction norm slopes, we found that Clones 2, 87
8 and 11, which all have relatively shallow reaction-norm slopes, did not differ significantly 88
from each other (Supplementary Table 2), so we designate them “resistant” clones (Fig. 3a). 89
Similarly, Clones 1, 19, 38 and 169, which all have relatively steep slopes, did not differ from 90
each other, and we call them “non-resistant” clones. The reaction norm slopes of clones from 91
resistant and non-resistant categories differed significantly in 13 of 16 pairwise comparisons, and 92

4
we use these two groupings to simplify discussion of our results. Clone19 is intermediate but 93
closer to the non-resistant clones, so we include it in that group. 94
All resistant clonal lineages, with shallow reaction norms (Fig. 3a), had higher JGR on 95
summer cyanobacteria diet than all except one of the non-resistant clones, but also lower JGR on 96
spring algal diet. This apparent tradeoff in performance on the two diets suggests there is a cost 97
to tolerance of cyanobacteria, although we have not identified it. The two independent isolates 98
of Clone 11 performed very similarly (no difference in ANOVA post-hoc comparison; 99
Supplementary Table 2) indicating that the dietary-performance phenotype was consistent with 100
microsatellite-clone identity. The seven clones had seasonal patterns of frequency change 101
consistent with their performance on summer (cyanobacteria) diet: there is a positive relationship 102
between date of maximum rate of frequency increase and clone growth rate on summer 103
phytoplankton (Fig. 3b; r2 = 0.64, p = 0.034). Clones that were more resistant to cyanobacteria 104
generally increased in frequency later in the season as cyanobacteria became dominant, and vice 105
versa. The effect of evolution is reflected in the seasonal change in clonal diversity (Simpson’s 106
Index, see Methods) which dropped from 0.88–0.98 in May to mid-August to between 0.58–0.77 107
in late-August and September driven primarily by the increasing dominance of Clone 11, which 108
went from < 10% of the population to over 60% during this period (Fig. 2a; Supplementary Fig. 109
1). 110
The Daphnia population evolved by clonal succession within a single season (Fig. 2), and 111
our results suggest that this was due to natural selection imposed by change in food quality (Fig. 112
3b). To evaluate further the action of natural selection on each of the seven clones, we estimated 113
how each clone’s juvenile growth rate would have changed over the course of the season as 114
phytoplankton composition changed (Fig. 1c). We know the JGR of each clone when fed either 115
0% cyanobacteria (spring food) or 50% cyanobacteria (summer food), and using this information 116
we projected JGR at other frequencies of cyanobacteria in the lake assuming a monotonic 117
relationship given by the reaction norms in Fig. 3a (see Methods and Supplementary Fig. 2). 118
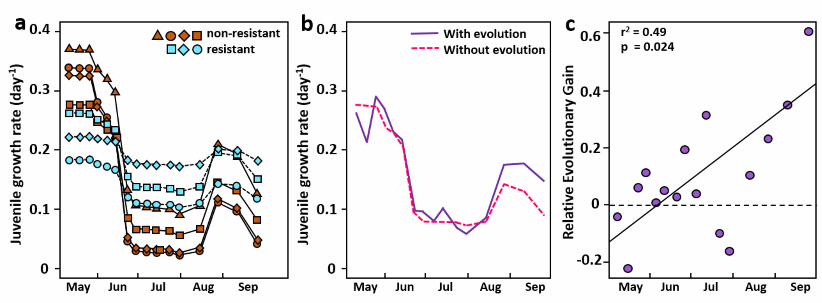
During the spring diatom bloom and the flagellate-dominated CWP, the JGR of the resistant 119
clones was below the JGR of the non-resistant clones (Fig. 4a) showing selection generally 120
against resistant clones at the start of the season, whereas in summer the JGRs of the resistant-121
clones were above those of the non-resistant-clones showing a selective advantage when 122
cyanobacteria dominated. The opposite is true for the non-resistant clones. The actual mean JGR 123
5
for the evolving frequencies of the seven clones on each date was often, but not always, greater 124
than that for a calculated (see Methods) hypothetical no-evolution case of clone frequencies 125
staying constant from the start of the season (Fig. 4b). Through the season, the observed, 126
evolving, mean JGR became significantly progressively better than the no-evolution case so that 127
there was a 60% gain in performance by the end of the season (Fig. 4c). 128
129
Evolution affecting ecology. To demonstrate eco-evolutionary dynamics, we must “close the 130
loop” by showing that the rapid evolution of resistance to cyanobacteria in Oneida Lake 131
Daphnia, driven by seasonal phytoplankton succession, had an important effect on ecological 132
dynamics. First, through regression analysis we found that the ecological process of per capita 133
Daphnia population rate of change in the lake, r (day-1), is best predicted by a combination of 134
changing total phytoplankton biomass (chlA, an ecological consumer-resource interaction) and 135
the rapidly evolving mean adaptation of Daphnia clones to the presence of dietary cyanobacteria 136
(frequency-weighted mean logeJGR; hereafter “mean JGR”) (Table 1). This model explains 71% 137
of the variation in Daphnia population r, while chlA alone and Daphnia mean JGR only account 138
for 38% and 21% of the variation respectively. The importance of the combination of both 139
factors for Daphnia population dynamics in the lake is confirmed by AIC analysis 140
(Supplementary Table 3) with a ΔAIC of 8.85 comparing the combined model with the next best 141
model of chlA alone or with the model of mean JGR alone (ΔAIC = 12.13). We chose the 4-day 142
JGR measurement as the quantitative measure of clonal differences in sensitivity to dietary 143
cyanobacteria based on the original study24 showing that it is highly correlated with laboratory 144
life-table measurements of r in another Daphnia species (D. magna) when food concentration 145
was varied (r2= 0.88). Its relevance in our study is confirmed by its importance as a predictor of 146
changes in realized r in the lake population. 147
Second, we used the regression model to calculate the impact of Daphnia evolution (clone-148
frequency change) on consumer population dynamics in the lake, by comparing observed 149
temporal changes in Daphnia population size with projections of what those changes would have 150
been in the absence of evolution. The mean JGR variable in the regression model (Table 1) 151
combines ecology (cyanobacteria abundance) and evolution (clone frequencies). To isolate the 152
contribution of evolution, we used our regression model and the clone-specific responses to 153
dietary cyanobacteria (Fig. S2) to project how much Daphnia r would have differed on each day 154

6
if the Daphnia clonal frequencies had not evolved since the early samples when cyanobacteria 155
were absent. These projected daily r values then let us contrast observed Daphnia seasonal 156
dynamics with the hypothetical no-evolution dynamics that would have resulted if clone 157
frequencies had not changed since the start of the season (see Methods). 158
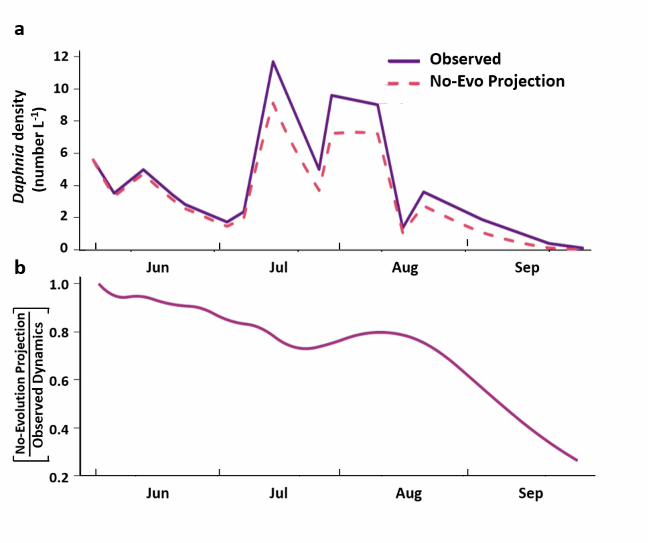
The result shows a consistently lower projected population size of Daphnia throughout the 159
season in the absence of adaptive evolution, compared with the abundance actually observed 160
(Fig. 5a). The effect of this loss of fitness can be seen in the ratio of the projected population 161
size without evolution relative to that observed in the lake (i.e., with evolution). By the end of 162
summer, the loss of fitness that would have accrued over four months of not evolving in response 163
to changing food quality would have resulted in a population of about a quarter the size of that 164
actually observed (Fig. 5b). We thus project, from the observed short-term effects of clone-165
frequency change, that evolution markedly affected the ecological dynamics of a major 166
consumer. 167
168
Conclusion. We have shown that while plankton dynamics in Oneida Lake are typical of those 169
seen in moderately productive lakes as described by the "PEG model"10,22,23, the patterns of 170
abundance observed in 2015 were underlain by rapid evolution of the dominant consumer 171
population while quality of the phytoplankton taxonomic composition as food for Daphnia 172
underwent typical seasonal succession. This result suggests that although the authors of the PEG 173
model did not invoke Daphnia evolution as a component of the typical seasonal pattern they 174
described for moderately productive lakes22,23; evolution may nevertheless have been present in 175
the lake communities upon which they based their description. 176
The seasonal phytoplankton succession depicted in the PEG model has been documented for 177
the past 40 years in Oneida Lake25, so the cycle of evolution that we have shown for a single 178
season is very likely to have been an annual occurrence. The genetic variation required for the 179
Daphnia population to evolve was present in spring 2015 after what was surely four decades of 180
seasonally fluctuating selection. It is likely that this genetic variation has been maintained year 181
after year through a combination of (i) selection fluctuating in direction and intensity in all or 182
most years (Fig. 4), (ii) the tradeoff we observed among clones in performance (JGR) on spring 183
versus summer phytoplankton (Fig. 3a), and (iii) generation overlap created by annual 184
production of diapausing eggs and their hatching, spread out over multiple years, from the 185

7
sediment egg bank26 which D. mendotae has in Oneida Lake21. These combined processes can be 186
a potent force maintaining genetic variation in nature27-31. 187
The net result is rapid evolution – on the time scale of weeks – of Daphnia’s performance on 188
the dominant phytoplankton assemblage, while the annual reversals in food quality mean that 189
there is very likely no long-term directional evolution as long as phytoplankton succession is 190
repeated every year. This is an example of a more general pattern of how natural selection in 191
nature often fluctuates in direction and intensity, with evolutionary change rapid in the short 192
term, but slow on average over longer periods3,32,33. Our demonstration of a feedback between 193
ecological change, rapid adaptive evolution, and genetic change affecting the nature and strength 194
of ecological interactions, shows that eco-evolutionary dynamics can have important 195
consequences for ecological processes, even when there is no long-term net evolutionary change. 196
197
Methods 198
Study system. We studied Daphnia clonal evolution and its effect on planktonic consumer-199
resource dynamics in 2015 at Oneida Lake, New York State (43° 13' 3'' N, 75° 55' 22'' W), a 200
large (surface area: 206.7 km2), relatively shallow (maximum depth 16.8 m, mean depth 6.8 m) 201
lake that freezes in winter and has multiple brief periods of thermal stratification in summer (i.e., 202
it is cold polymictic). Oneida Lake has been the subject of long-term monitoring by the staff of 203
the Cornell Biological Field Station (CBFS), with sampling typically having occurred weekly 204
from spring to autumn, for zooplankton starting in 1964, and for phytoplankton and nutrients 205
starting in 1975 with additional data available from the 1960s34. These data show that at the start 206
of this record, total phosphorus (TP) concentrations exceeded 100 µgP/L but decreased steadily 207
following watershed nutrient management starting in the 1970s. By 2015, the year of our study, 208
summer phosphorus was 20-30 µg TP/L and phytoplankton was < 8 µg Chla/L25,35. The 209
phytoplankton community is largely comprised of the five major taxonomic groups typical of 210
North Temperate Zone lakes including Bacillariophyta, Cryptophyta, Chrysophyta, Chlorophyta, 211
and Cyanobacteria. In most years, diatoms are the dominant taxon in early spring and fall, small 212
flagellated cryptophytes and chlorophytes dominate the assemblage (though at low densities) 213
during the clear water phase, and cyanobacterial blooms taking place between July and October, 214
including in 2015 (Fig. 1c). 215
8
The Oneida Lake zooplankton community is comprised mainly of seasonally abundant 216
Daphnia species36, several calanoid and cyclopoid copepod species37,38 and a diversity of 217
rotifers39. While three daphniid species, D. pulicaria, D. mendotae and D. retrocurva, have 218
dominated in different years, with at least the first two being present in the sediment record21, the 219
latter two have been the seasonally dominant Daphnia in the water column since 2006, likely due 220
to a disproportionate increase in predation on D. pulicaria by planktivorous fish14,36. For this 221
study, we focused on D. mendotae because it dominated the Daphnia assemblage in summer 222
2015, and because published microsatellite markers are available for closely related D. galeata40 223
for clonal identification and tracking evolutionary changes in population genetic composition. 224
Cyanobacteria typically dominate the phytoplankton in most years from late July through 225
October25, and the blooms that have occurred since 2000 have been dominated by taxa capable of 226
producing toxins, including Dolichospermum (formerly Anabaena), Aphanizomenon, and 227
Microcystis41. During 2015, sampling for zooplankton abundance was carried out weekly at a 12 228
m deep central lake site (CBFS “Shackelton Point”) as a part of the field station’s long-term 229
monitoring program34. Zooplankton were collected by a vertically towed 153 µm mesh plankton 230
net with flow meter, and phytoplankton by 10 m integrated tube sampler25,34. Zooplankton, 231
including D. mendotae, were identified, counted and biomass estimated by CBFS staff. From 232
Samples for phytoplankton were collected weekly May through October. The data use here are 233
averages over four stations along the mid-line of the lake (CBFS Shackelton Point, Three Mile 234
Bay, Buoy 109 and Buoy 125). Phytoplankton were identified, measured, and counted, and 235
biovolumes calculated by PhycoTech Inc. Chlorophyll-a was measured using a calibrated Turner 236
fluorometer in the laboratory. Detailed methods and data are available on the Knowledge 237
Network for Biocomplexity and in eCommons of Cornell University’s Mann Library in the 238
Cornell Biological Field Station collection34. 239
240
Identifying seasonal clonal frequencies of Daphnia mendotae. In 2015 live Daphnia were 241
collected weekly between May 10 and August 31, and biweekly during September. Animals 242
were obtained by vertical plankton tow at a 7 m deep site (mean lake depth) near the “Shackelton 243
Point” standard station. Live plankton samples were held at ca. 15 °C and processed within 2 h. 244
On each date, the first 40-48 female D. mendotae encountered under a dissecting microscope 245
were used to establish parthenogenetic isofemale (clonal) lines in culture. By the end of 246
9
September 2015, 768 clonal isolates had been established, though some isolates did not survive, 247
and genotyping did not yield usable results for others. In some instances we were nevertheless 248
able to extract usable DNA for genotyping females isolated from the field that died without 249
reproducing. In the end we genotyped animals from 546 isofemale lines with 20-40 (median 37) 250
clonal isolates per date. DNA was extracted from individuals using the HotSHOT protocol42, 251
and genotyped using seven microsatellite loci (SwiD4, SwiD5, SwiD10, SwiD14, SwiD15, 252
Dp512 and DaB10/14) described for European Daphnia40, closely related to our North American 253
D. mendotae. Three additional loci (SwiD2, SwiD12, and SwiD1)40 were unusable for our 254
animals due to poor peak amplification. 255
We refer here to each Daphnia isofemale line that shared common alleles for all seven loci as 256
a “clone.” In a few instances, for which one of the variable loci did not amplify successfully, if 257
the other six loci matched a lineage for which all seven amplified, these two lines were 258
considered to be a single clone. However, any lineage for which two or more of the seven loci 259
failed to amplify was removed from further analysis. We assigned allele identities for the 546 260
clonal isolates using GenoDive (version 2.0b23)43. Each locus was visually inspected to ensure 261
proper peak identification by the software. We reassigned peaks that were misidentified by the 262
software, and then used a distribution code in R version 3.5.144 to determine what round number 263
allele values were present in the population. It is, of course, possible that any “clone” identified 264
by our procedure may actually represent several clones. We note, however, that two of the loci 265
we used had highly variable allele frequencies and so provide strong differentiation among our 266
clonal isolates. Clone numbers were assigned in the order that we encountered unique genotypes 267
but have no other meaning. A list of sizes of the two alleles are each of the seven microsatellite 268
loci for each individual genotyped on each date is provided in Table S5 of the on-line data45 (see 269
Data Availability). 270
Using these protocols, we identified 124 unique D. mendotae clones in Oneida Lake between 271
May and September 2015. Of these, 16 clones made up at least 10% of the population on at least 272
one date (Supplementary Fig. 3); the rest were rarer, many represented by only a single female 273
on a single date. For each of those 16 clones, temporal changes in frequency (Supplementary Fig. 274
3) were fitted with a spline generalized additive model (function gam() from the mgcv package 275
in R, using method=REML and family=binomial)44. From among the 16 clones, we chose seven 276
with different seasonal maximum frequencies (Supplementary Fig. 3) on which to measure 277
10
Daphnia performance when fed either spring “good” food or summer “poor” food. For one clone 278
(Clone 11), which came to dominate the Daphnia population in late summer (frequency > 60%), 279
we measured performance on two separately isolated isofemale lines to evaluate the consistency 280
of the phenotypic response among clonal replicates identified via matching microsatellite 281
multilocus genotypes. The seven clones chosen made up an average of 48% of the animals 282
sampled on each date, with a range across all dates of 22–84%. 283
284
Simpson’s Diversity Index applied to Daphnia clones. Clonal diversity was calculated using 285
Simpson’s Index (1-D) corrected for sampling without replacement46, 286
D = � [𝑛𝑛𝑖𝑖 (𝑛𝑛𝑖𝑖 − 1)/(𝑁𝑁(𝑁𝑁 − 1)]𝑅𝑅𝑖𝑖=1 , where ni is number of individuals of Clone i for a total of R 287
clones, and N is the total number of individuals sampled. The seasonal pattern of clonal diversity 288
is presented in Supplementary Fig. 1. Our ability to identify rare clones was quite limited, given 289
that we genotyped a maximum of 40 individuals on any given date out of a population size lake-290
wide on the order of 1012 individuals. This population size approximation is based on the 291
product of the mean Daphnia density in Oneida May-Sept 2015 of 3,700 m-3 (Cornell Biological 292
Field Station data archive) and a lake volume47 of 1.40 ×10⁹ m3 so mean total D. mendotae 293
population size in Oneida Lake in 2015 was 5.2 ×10¹² individuals. 294
295
Measuring Daphnia performance on spring and summer phytoplankton. Juvenile growth 296
rate, JGR, the specific rate of mass increase of individual Daphnia, has been shown to be a 297
reliable measure of performance highly correlated with per capita rate of population increase, r 298
(day-1), under controlled laboratory conditions of varying food concentration24. It has been used 299
as an effective bioassay of performance in a variety of food environments10,12,17-19. We used a 300
four-day measure which in a study with another Daphnia species was found to be well correlated 301
with r (r2 = 0.88)24. The eight Daphnia isofemale lines (seven clones with one duplicated) were 302
cultured clonally at 20°C for at least 10 generations, fed on good food (chlorophyte alga, 303
Scenedesmus obliquus) before the start of the experiment. Clonal performances were determined 304
using two different food conditions: phytoplankton typical of Oneida Lake either in spring or late 305
summer. 306
We measured JGR over a four-day period starting with neonates (< 24 h since hatching)34. 307
Neonates were placed in triplicate 250-mL flow-through chambers maintained in a water bath at 308
11
20 ± 0.5°C with dim incandescent illumination. Each chamber was initiated with 8-12 neonates 309
of the same isofemale line and was continuously supplied the test phytoplankton food suspension 310
using a peristaltic pump at a rate of 750 mL/day. The food concentration used, 1 mg C/L, 311
assured that food density was not limiting to Daphnia growth and that only food quality was a 312
factor. The two diets were created using laboratory-cultured phytoplankton meant to simulate 313
spring and fall phytoplankton community compositions commonly found in Oneida Lake. The 314
spring diet consisted of three algal taxa each comprising 1/3 of the food mixture by carbon 315
content: the unicellular centric diatom Cyclotella meneghiniana, the green alga Scenedesmus 316
obliquus, and the cryptophyte Cryptomonas ozolini (see Supplementary Table 4 for culture 317
information). The late-summer diet consisted of a 50:50 mixture of the cyanobacterium 318
Microcystis aeruginosa known to produce the toxin microcystin and the green alga Scenedesmus 319
obliquus. Although cyanobacteria made >50% of Oneida Lake phytoplankton biovolume on 320
some dates in 2015 (Fig. 1c), our late-summer 50:50 diet was chosen because only two diets 321
were possible in our experimental set up, and that mixture was sufficient to distinguish effects of 322
diet among the clones we used. The two phytoplankton food mixtures were prepared daily in 323
0.45 µm filtered Oneida Lake water, and maintained in suspension in aluminum-covered 10 L 324
carboys on stir-plates. 325
The experimental setup consisted of 48 flow-through chambers allowing all eight isofemale 326
lines to be tested at the same time (2 food treatments×8 lines×3 replicates). The flow-through 327
experimental set-up was similar to established methods18,24, but the chambers were made of a 328
clear Plexiglas rather than glass. Each chamber was a tube 4.5 cm diameter, 30 cm long with a 329
75 µm mesh in the bottom to retain the Daphnia but to permit phytoplankton suspension to pass 330
through. All chambers were suspended in a large water bath containing 0.45 µm filtered Oneida 331
Lake water. The test food suspension was dripped into chambers continuously, and flowed out 332
continuously at a rate of three replacement volumes per day, providing the Daphnia with a 333
steady food supply. 334
Initial Daphnia dry weights were determined for 10–12 neonates per clonal lineage. At the 335
end of the four-day experiment, we collected, dried, and weighed all remaining animals from 336
each chamber; any animals that died during the experiment were excluded because they had 337
stopped feeding before the experiment was complete. All animals were placed in aluminum 338
tins, dried at 60°C for >24 h and weighted on a microbalance (Sartorius model SE2). Juvenile 339
12
growth rate (day-1) was calculated as: JGR = [lnWt – lnW0]/t, where W0 and Wt are the initial and 340
final weights per individual and t is the duration of the experiment (actual start and end times for 341
each chamber were recorded). Because individuals within a chamber were pooled for weighing, 342
“chamber” is the unit of replication (N = 3). 343
344
Quantifying the magnitude of Daphnia evolution and its effect on consumer dynamics. We 345
estimated how the JGR of each clone would have changed seasonally as a function of the 346
proportion of the phytoplankton comprised of cyanobacteria (Fig. 1c) by fitting a loge-347
transformed reaction norm through JGR when fed either 0% cyanobacteria or 50% cyanobacteria 348
(Supplementary Fig. 2). We use an exponential fit because a linear projection leads to 349
nonsensical negative JGR values for some clones at high % cyanobacteria. The relationship in 350
Supplementary Fig. 2 for each clone was used to infer JGR at other cyanobacterial proportions of 351
the phytoplankton throughout the season (Fig. 4). Note that other plausible functions must all 352
continue to decline as cyanobacteria fraction increases above 50%, or at the very least simply 353
level off. Inspection of Supplementary Fig. 2 shows that any alternative monotonically 354
decreasing function will give the same qualitative result in terms of the relative positions of the 355
projected clonal JGRs. The only exception would be non-resistant clone 169 which would lie 356
above only resistant clone 2 if JGRs did remained constant beyond 50% cyanobacteria, and even 357
this would not substantively affect our analysis. For each date, the Daphnia population’s mean 358
JGR was estimated as the sum of the inferred JGR for each clone multiplied by its frequency, 359
which gave us a picture of how JGR evolved as clonal frequencies changed over the season. We 360
compared this evolving population JGR with the projected population JGR if evolution had not 361
occurred and clonal frequencies had remained unchanged over the course of the season. For this 362
non-evolving population, we used the average frequencies of the seven clones on the four 363
sampling dates before the advent of the clear water phase (Fig. 1a); i.e., before the first major 364
transition in phytoplankton quantity and quality (Fig. 1c). Since all clones had to be present at 365
the start of the season (because all clones in the lake are established by hatching from diapausing 366
eggs earlier in spring21), the frequencies of those from among the seven we studied that were not 367
detected during the first four sampling dates were taken to be half the limit of detection (0.5 × 368
1/40 = 1/80). The effect of evolution on Daphnia population performance over the course of the 369
season was taken as the fractional increase in the clone-frequency-weighted JGR, EVOJGR, 370
13
relative to the no-evolution projected JGR, NOEVOJGR, i.e., (EVOJGR–NOEVOJGR)/NOEVOJGR) 371
(see Fig. 4c). 372
Finally, we projected the effect of evolution on the ecological process of seasonal change in 373
consumer (Daphnia) population size by calculating a cost of not-evolving. For this, we 374
calculated a “no-evo” mean JGR for each date using the same “baseline” we used above to 375
construct Fig. 4c (i.e., constant clone frequencies set at the average of the frequencies on the first 376
four sampling dates leading up to the start of the clear water phase). We then used these daily 377
“no-evo” mean JGR values in the regression model for r to predict how much this substitution 378
would change the value of r. Specifically, our calculated regression model for r is 379
380
so the predicted effect on Daphnia r of holding clone frequencies at their “no-evo” baseline 381
values is 382
383
We projected what this change in r would have done to Daphnia population dynamics 384
as follows. Let N(t) be the observed Daphnia population as a function of time. The last of the 385
four baseline clone-frequency samples was taken on day 151 (i.e., 31 May), so we project a “no-386
evo” Daphnia abundance N*(t) forward from that date as 387
388
The result is plotted in Fig. 5. Note that we use the regression model only to estimate how much 389
r(t) would change, if mean JGR on day t were the result of baseline clone frequencies rather than 390
the estimated actual clone frequencies for day t. We do not use the regression model to project 391
r(t) values based on food quantity and no-evo mean JGR because there are many additional 392
factors (e.g., temperature, predators, pathogens, etc.) in the Oneida Lake environment that can 393
affect the Daphnia population’s r(t). 394
395
14
Statistical analyses. All data analyzed are available on line45. Statistical analysis were carried 396
out using R version 3.5.144. Differences between clones and food treatment were assessed via 397
ANOVA (Supplementary Table 1; Fig. 3a), followed by post-hoc tests for pairwise clone 398
differences in their reaction norm slopes corrected for multiple comparisons48 using package 399
phia, with the function testInteractions()(Supplementary Table 2). 400
The regression model exploring the effects of chlA and mean JGR on Daphnia population 401
per capita growth rate (Table 1; Fig. 5) was a simple linear regression without random effects, 402
fitted using the lm()function in R. Model assumptions were validated using standard regression 403
diagnostics. A plot of residuals versus fitted values showed no signs of nonconstant variance or 404
unmodeled nonlinear trends, and additions of interaction and quadratic terms were all non-405
significant (p>0.1 in the summary of the fitted models). Residuals were Gaussian (Gaussian 406
quantile-quantile plot using function qqPlot()in the car package; p = 0.67 in Shapiro-Wilk 407
normality test using function shapiro.test()and had no significant autocorrelations, using 408
function acf()). The Akaike Information Criterion, R function AIC()44 (Supplementary Table 409
3) was used to compare linear regression models estimating Daphnia r as a function of 410
chlorophyll-a alone or chlorophyll-a and mean Daphnia population resistance to dietary 411
cyanobacteria. 412
The temporal change in evolutionary gains was assessed using a linear regression correcting 413
for autocorrelation using the gls() function from the nlme R package. The regression 414
coefficient was calculated using the rsquared()function from the piecewiseSEM R package. 415
The Akaike Information Criterion, R function AIC()44 (Supplementary Table 3) was used to 416
compare linear regression models estimating Daphnia r as a function of chlorophyll-a alone or 417
chlorophyll-a and mean Daphnia population resistance to dietary cyanobacteria. 418
419
Reporting Summary. Further information on research design is available in the Nature 420
Research Reporting Summary linked to this article. 421
422
423
424
425

15
Data and code availability 426
The data underlying each of the figures and statistical analyses, as well as R scripts for R-427
generated statistical analyses and figures, are freely available online at eCommons: Cornell 428
University’s digital repository45 https://doi.org/10.7298/pgzv-2736.2. 429
430
431
References 432
1. Hendry, A. P. Eco-Evolutionary Dynamics (Princeton Univ. Press, Princeton, NJ, 2017). 433
2. Schoener, T. W. The newest synthesis: understanding the interplay of evolutionary and 434
ecological dynamics. Science 331, 426-429 (2011). 435
3. Hairston, N. G. Jr, Ellner, S. P., Geber, M. A., Yoshida, T. & Fox, J. A. Rapid evolution 436
and the convergence of ecological and evolutionary time. Ecol. Lett. 8,1114-1127 (2005). 437
4. Yoshida, T., Jones, L. E., Ellner, S. P., Fussmann, G. F. & Hairston, N. G. Jr. Rapid 438
evolution drives ecological dynamics in a predator-prey system. Nature 424: 303-306 439
(2003). 440
5. Turcotte, M. M., Reznick, D. N. & Hare, J. D. Experimental assessment of the impact of 441
rapid evolution on population dynamics. Evol. Ecol. Res. 13, 113–131 (2011). 442
6. Hiltunen, T., Hairston, N. G. Jr., Hooker, G., Jones, L. E. & Ellner, S. P. A newly 443
discovered role of evolution in previously published consumer-resource dynamics. Ecol. 444
Lett. 17, 915-923 (2014). 445
7. Bassar, R. D. et al. Local adaptation in Trinidadian guppies alters ecosystem processes. 446
Proc. Natl. Acad. Sci. USA 107, 3616-3621 (2010). 447
8. Agrawal, A. A., Johnson, M. T. J., Hastings, A. & Maron, J. L. A field experiment 448
demonstrating plant life-history evolution and its eco-evolutionary feedback to seed 449
predator populations. Am. Nat. 181, S35-S45 (2013). 450
9. Pantel, J. H., Duvivier, C. & De Meester, L. Rapid local adaptation mediates zooplankton 451
community assembly in experimental mesocosms. Ecol. Lett. 18, 992–1000 (2015). 452
10. Lampert, W. Daphnia: Development of a Model Organism in Ecology and Evolution. Book 453
21 (International Ecology Institute, Oldendorf/Luhe, 2011). Excellence in Ecology 454
16
11. Miner, B. E., De Meester, L., Pfrender, M. E., Lampert, W. & Hairston N. G. Jr, Linking 455
genes to communities and ecosystems: Daphnia as an ecogenomic model. P. Roy. Soc. B-456
Biol. Sci. 279, 1873–1882 (2012). 457
12. Tessier, A. J. & Woodruff, P. Cryptic trophic cascade along a gradient of lake size. Ecology 458
83, 1263–1270 (2002). 459
13. Sterner, R. W. & Elser, J. J. Ecological Stoichiometry: The Biology of Elements from 460
Molecules to the Biosphere. (Princeton Univ. Press, Princeton, 2002). 461
14. Rudstam, L. G., Lathrop, R. C. & Carpenter, S. R. The rise and fall of a dominant 462
planktivore: direct and indirect effects on zooplankton. Ecology 74, 303-319 (1993). 463
15. Carpenter, S. R. et al. Regulation of lake primary productivity by food web structure. 464
Ecology 68, 1863-1876 (1987). 465
16. Lampert, W. Laboratory studies on zooplankton-cyanobacteria interactions. New Zealand 466
J. Mar. Freshwat. Res. 21, 483-490 (1987). 467
17. Martin-Creuzburg, D., von Elert, E. & Hoffmann, K.H. Nutritional constraints at the 468
cyanobacteria–Daphnia magna interface: the role of sterols. Limnol. Oceanogr. 53, 456–469
468 (2008). 470
18. Hairston N. G. Jr. et al. Rapid evolution revealed by dormant eggs. Nature 401, 446 471
(1999). 472
19. Sarnelle, O. & Wilson, A.E. Local adaptation of Daphnia pulicaria to toxic cyanobacteria. 473
Limnol. Oceanogr. 50, 1565–1570 (2005). 474
20. Chislock, M.F., Sarnelle, O., Olsen, B.K., Doster, E. & Wilson, A.E. Large effects of 475
consumer offense on ecosystem structure and function. Ecology 94, 2375-2380 (2013). 476
21. Cáceres, C.E. Interspecific variation in the abundance, production, and emergence of 477
Daphnia diapausing eggs. Ecology 79, 1699-1710 (1998). 478
22. Sommer, U., Gliwicz, M., Lampert, W. & Duncan, A. The PEG-model of seasonal 479
succession of planktonic events in fresh waters. Arch. Hydrobiol. 106, 433-471 (1986). 480
23. Sommer, U. et al. Beyond the Plankton Ecology Group (PEG) model: mechanisms driving 481
plankton succession. Annu. Rev. Ecol. Ecol. Syst. 43, 429-448 (2012). 482
24. Lampert, W. & Trubetskova, I. Juvenile growth rate as a measure of fitness in Daphnia. 483
Funct. Ecol. 10, 631-635 (1996). 484
17
25. Idrisi, N., Mills, E.L. & Rudstam, L.G. Long-term phytoplankton community dynamics: 485
Oneida Lake (1975-2011), in Oneida Lake: long-term dynamics of a managed ecosystem 486
and its fishery (American Fisheries Society, Bethesda, 2016), pp. 139-159. 487
26. Hairston, N. G. Jr. Zooplankton egg banks as biotic reservoirs in changing environments. 488
Limnol. Oceanogr. 41, 1087-1092. 489
27. Chesson, P. Multispecies competition in variable environments. Theor. Popul. Biol. 45, 490
227–276 (1994). 491
28. Ellner, S. P., Snyder, R. E. & Adler, P. B. How to quantify the temporal storage effect 492
using simulations instead of math. Ecol. Lett. 19, 1333–1342 (2016). 493
29. Ellner, S. P. & Hairston, N. G. Jr. Role of overlapping generations in maintaining genetic 494
variation in a fluctuating environment. Am. Nat. 143, 403-417 (1994). 495
30. Hedrick, P. W. Genetic polymorphism in a temporally varying environment: effect of 496
delayed germination or diapause. Heredity 75, 164-170 (1995). 497
31. Turelli M, Schemske D. W. & Bierzychudek P. Stable two-allele polymorphisms 498
maintained by fluctuating fitnesses and seed banks: protecting the blues in Linanthus 499
parryae. Evolution 55, 1283–1298 (2001). 500
32. Hendry, A. P. & Kinnison, M. T. Perspective: the pace of modern life: measuring rates of 501
contemporary evolution. Evolution 53, 1637-1653 (1999). 502
33. Messer, P.W., Ellner, S.P. & Hairston, N.G. Jr. Can population genetics adapt to rapid 503
evolution? Trends in Genetics 32, 408-418 (2016). 504
34. Rudstam, L. G., Mills, E. L., Jackson, J. R. & Stewart, D. J. An introduction to the Oneida 505
Lake research program and data sets, in Oneida Lake: long-term dynamics of a managed 506
ecosystem and its fishery (American Fisheries Society, Bethesda, 2016), pp. 3-11. 507
35. Cuhel, R. L &, Aguilar, C. Nutrient dynamics and biogeochemical cycling in Oneida Lake, 508
in Oneida Lake: long-term dynamics of a managed ecosystem and its fishery (American 509
Fisheries Society, Bethesda, 2016), pp. 111-137. 510
36. Cáceres, C. E. et al. Zooplankton in Oneida Lake: population dynamics, trophic 511
interactions, and dormant egg bank, in Oneida Lake: long-term dynamics of a managed 512
ecosystem and its fishery (American Fisheries Society, Bethesda, 2016), pp. 201-226. 513
37. Hairston, N. G. Jr. & Van Brunt, R. A. Diapause dynamics of two diaptomid copepod 514
species in a large lake. Hydrobiologia 292/293, 209-218 (1994). 515
18
38. Hansen, A.-M. & Hairston, N. G. Jr. Food limitation in a wild cyclopoid copepod 516
population: Direct and indirect life history responses. Oecologia 115, 320-330 (1998). 517
39. Hairston, N. G. Jr., Hansen, A.-M. & Schaffner, W. R. The effect of diapause emergence 518
on the seasonal dynamics of a zooplankton assemblage. Freshwater Biol. 45, 133-145 519
(2000). 520
40. Brede, N. et al. Microsatellite markers for European Daphnia. Mol. Ecol. Notes 6, 536-539 521
(2006). 522
41. Hotto, A. M., Satchwell, M. F., Berry, D. L., Gobler, C. J. & Boyer, G. L. Spatial and 523
temporal diversity of microcystins and microcystin-producing genotypes in Oneida Lake, 524
NY. Harmful Algae 7, 671-681 (2008). 525
42. Montero-Pau, J., Gómez, A. & Munoz, J. Application of an inexpensive and high-526
throughput genomic DNA extraction method for the molecular ecology of zooplanktonic 527
diapausing eggs. Limnol. Oceanogr: Methods 6, 218-222. 528
43. Meirmans, P. C. & Van Tienderen, P. H. GENOTYPE and GENODIVE: two programs for 529
the analysis of genetic diversity of asexual organisms. Mol. Ecol. Notes 4, 792-794 (2004). 530
44. R Core Team. 2017. R: A Language and Environment for Statistical Computing. R 531
Foundation for Statistical Computing, Vienna, Austria. www.R-project.org. 532
45. Schaffner, L. R. et al. (2019). Data from: Consumer-resource dynamics is an eco-533
evolutionary process in a natural plankton community. eCommons: Cornell University’s 534
digital repository https://doi.org/10.7298/pgzv-2736). 535
46. Pielou, E. C. An Introduction to Mathematical Ecology (John Wiley & Sons, New York, 536
NY, 1969). 537
47. Greeson, P. E. Limnology of Oneida Lake with emphasis on factors contributing to algal 538
blooms. U. S. Geological Survey Open File Report (1971). 539
48. Holm, S. A simple sequentially rejective multiple test procedure. Scand. J. Stat. 6, 65-70 540
(1979). 541
542 Acknowledgements 543
Sample preparation for microsatellite DNA sequencing was carried out by E. Keller, and S. 544
Bogdanowicz advised on interpretation of genotype data. J. Geyer, D. Oden, and A. Wong 545
helped in the lab and field. W. Lampert contributed insights to the JGR measure. P. McIntyre, R. 546
19
Wilkins, K. Sirianni, L. Zarri, E. Larson and members of the Hairston-Flecker lab groups 547
provided helpful comments on the manuscript. The research was supported by US National 548
Science Foundation grant DEB-1256719 to N.G.H., S.P.E. and B.E.M., KU Leuven Research 549
Fund grant C16/2017/02 to L.D.M., a Research Foundation – Flanders travel grant and Agency 550
for Innovation by Science and Technology PhD fellowship to L.G., and by Doris Duke 551
Foundation internship funding to E.F. The Cornell Biological Field Station and New York State 552
Department of Environmental Conservation supported field sampling and processing. 553
554
Author contributions 555
B.E.M., S.P.E. and N.G.H. conceived the study. L.R.S., B.E.M. and N.G.H. designed the field 556
sampling; E.F., L.R.S., and L.G.R. and his lab carried it out. L.R.S. and N.G.H. designed the lab 557
experiment, and L.R.S. carried it out. P.S. and his lab did the microsatellite DNA sequencing. 558
B.E.M. and L.R.S. analyzed the microsatellite data to calculate genotype frequencies. N.G.H., 559
L.R.S., L.G., L.D.M and S.P.E. analyzed the experimental results. The first draft was written by 560
L.R.S. and N.G.H. All authors contributed to revisions of the manuscript. 561
562
Competing interests 563
The authors declare no competing interests. 564
565
Additional information 566
Supplementary information is available for this paper at https://doi.org/10.7298/pgzv-2736.2. 567
Reprints and permissions information is available at __________________. 568
Correspondence and requests for materials should be addressed to N.G.H. 569
570
571
572
20
Figure Legends and Table 573
574
Fig. 1 | Seasonal dynamics of Oneida Lake plankton in 2015 compared with stereotypical PEG 575
model. a, Biomass density of phytoplankton (blue; chlorophyll a, chlA) and the dominant 576
zooplankton grazer, Daphnia mendotae (red) is similar to the Plankton Ecology Group (PEG) 577
model in b, redrawn from Sommer et al.23. Daphnia mendotae photo courtesy of K. David 578
Hambright. Phytoplankton phyla in c underwent succession from a spring bloom dominated by 579
edible diatoms, followed by a clear water phase, caused by Daphnia grazing, dominated by 580
diatoms and small flagellated green algae and cryptophytes, and then a summer bloom of 581
relatively inedible cyanobacteria. 582
583
Fig. 2 | Frequencies of Daphnia mendotae clones in Oneida Lake 2015. a, Each color 584
represents a different clone. Granular area at the top is the sum of clones only occurring in 585
plankton samples as a single individual on a single date. b, Seasonal frequencies of the seven 586
clones on which JGR was measured (numbered in a). Shown in b are the data and a fitted spline 587
curve with the p-value testing against the null hypothesis of no temporal trend (Methods). Top 588
row: clones 1, 19, 38 and 169 are non-resistant to cyanobacteria in juvenile growth rate 589
experiments (Fig. 3a). Bottom row: clones 2, 8 and 11 are resistant to cyanobacteria. Summed 590
sample size across all dates: n = 546. 591
592 593 Fig. 3 | Performance of Oneida Lake Daphnia mendotae clones on spring and summer 594
food. a, Juvenile growth rate, JGR, reaction norms of seven clones that peaked in frequency 595
at different times during 2015, when fed phytoplankton typical of spring or summer. Clone 596
11 is represented by two independent clonal isolates. Resistant (unfilled symbols, dashed 597
lines) and non-resistant (filled symbols, solid lines) clones are defined by their reaction norm 598
slope (see text). Error bars: +1 sd. b, Relationship between date on which each clone had its 599
maximum rate of increase in frequency and its JGR on cyanobacteria-rich summer diet 600
(linear regression: r2 = 0.64, df = 5, p = 0.034). 601
602

21
Fig. 4 | Evolution of Daphnia population mean juvenile growth rate based on clone-specific 603
JGR values and seasonal phytoplankton composition. a, Projected clone-specific JGR for 604
resistant and non-resistant clones based on Fig. 3a and Supplementary Fig. 2 combined with 605
seasonal cyanobacteria frequency data (Fig. 1c). Clones favored by selection (JGR generally 606
above the others) varies seasonally. b, Comparison of evolving mean JGR (solid line = JGR 607
weighted by observed clone frequencies on each date) with projected non-evolving JGR 608
(dashed line = JGR if clone frequencies remained constant at start-of-season values) (see 609
Methods). c, Relative evolutionary gain (fractional increase in performance due to evolution = 610
[solid-line in b – dashed-line in b]/[dashed-line in b]) increases over the season (linear 611
regression: r2 = 0.49, df = 14, p = 0.024). 612
613
614
Fig. 5 | The projected effect on Daphnia population dynamics of its evolution in response to 615
changing edibility of the phytoplankton food resource. a, The observed density of evolving 616
Daphnia population in Oneida Lake between 7 June (first sample date after CWP) and 25 617
September (last sample date) is greater than the density projected if clonal frequencies had not 618
evolved over this period (i.e., remained fixed at start-of-season frequencies). b, The projected 619
effect of not evolving on Daphnia population size illustrated by the fractional decline in 620
projected no-evolution Daphnia density relative to observed (i.e., with-evolution) Daphnia 621
density. 622
623
22
624
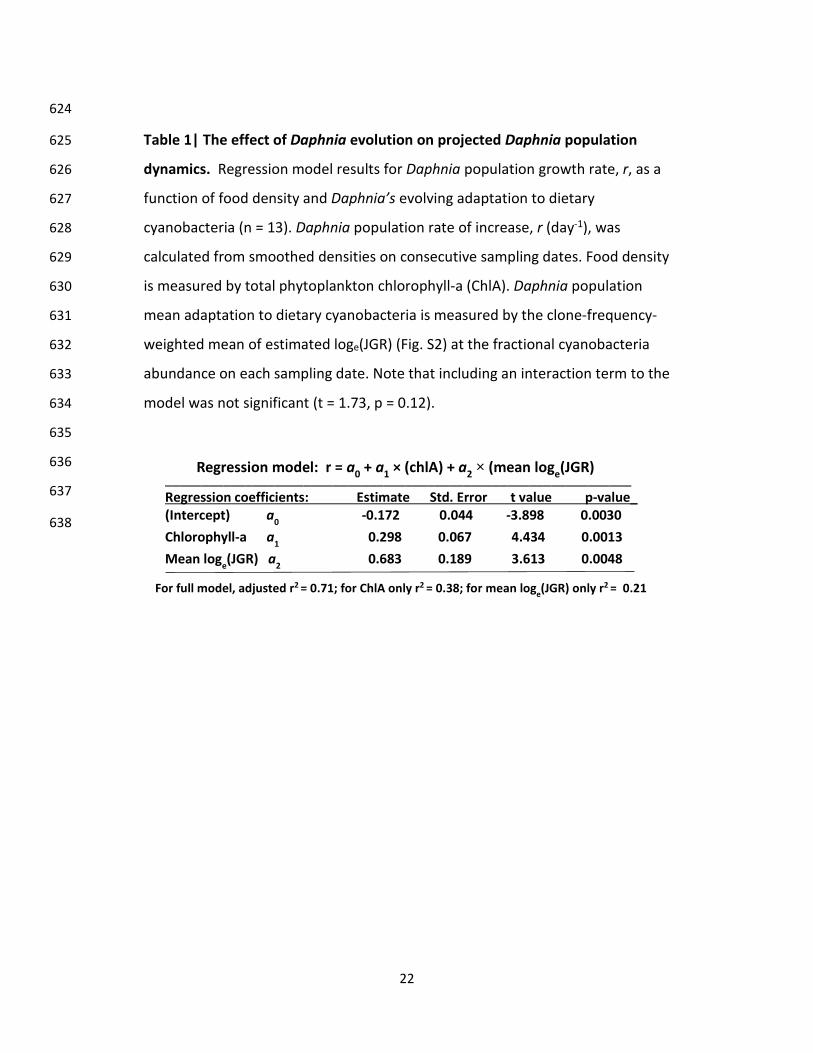
Table 1| The effect of Daphnia evolution on projected Daphnia population 625
dynamics. Regression model results for Daphnia population growth rate, r, as a 626
function of food density and Daphnia’s evolving adaptation to dietary 627
cyanobacteria (n = 13). Daphnia population rate of increase, r (day-1), was 628
calculated from smoothed densities on consecutive sampling dates. Food density 629
is measured by total phytoplankton chlorophyll-a (ChlA). Daphnia population 630
mean adaptation to dietary cyanobacteria is measured by the clone-frequency-631
weighted mean of estimated loge(JGR) (Fig. S2) at the fractional cyanobacteria 632
abundance on each sampling date. Note that including an interaction term to the 633
model was not significant (t = 1.73, p = 0.12). 634
635
636
637
638
________________________________________________________________ Regression coefficients: Estimate Std. Error t value p-value_ (Intercept) a0 -0.172 0.044 -3.898 0.0030 Chlorophyll-a a1 0.298 0.067 4.434 0.0013 Mean loge(JGR) a2 0.683 0.189 3.613 0.0048
Regression model: r = a0 + a1 × (chlA) + a2 × (mean loge(JGR)
For full model, adjusted r2 = 0.71; for ChlA only r2 = 0.38; for mean loge(JGR) only r2
= 0.21