Embed Size (px)
Citation preview

Consumer Purchasing Based on Packaging Structural Design/Product Visual Display in a Retail Environment
Katie ThackstonClemson UniversityClemson, SC, USA
Andy PhamClemson UniversityClemson, SC, USA
Josh GalvarinoClemson UniversityClemson, SC, USA
Andrew OuztsClemson UniversityClemson, SC, USA
ABSTRACT This eye-tracking study was designed to determine what effect the amount of product visibility based on packaging structure has on how consumers make purchases in a retail environment. The experiment was conducted at Pack Expo Las Vegas 2011, a national packaging conference, in Clemson University’s CUshop™ consumer retail experience laboratory (see Figure #2). Participants were fully immersed in a controlled shopping atmosphere. A selection of three different grilling tools were used in the study to determine what influence product visibility related to structure has on consumer purchasing habits. Consumers are drawn to products on shelves with innovative packaging structures [10]. Does the structure products are packaged in and the amount of the product that is visible truly influence a consumers purchase decision? Package structure and product visibility were studied in this experiment to support these assumptions.
INTRODUCTION Consumer products companies are constantly looking for a way to make their product have a stronger presence on the shelf. Schoormans and Robben (1997) found that a package’s ability to command a consumer’s attention directly correlates to a positive opinion of the product [8]. Package color, typography, and graphics are no longer the only methods used to capture consumer’s attention. Package structures are now being modified to attract consumers in retail environments. When considering a new or different package structure companies look at several areas including price, sustainability, protection for the product, and distribution issues. They are also concerned with the features on the package structure, its size, and shape. Shelf presence is the driving factor for most companies when they are looking to alter their package structure. Eye tracking glasses can be used to test a packages shelf presence and quantify data gathered from the testing. We will be testing three different products packaged four different ways (see Figure #1) and displayed on a shelf in a retail environment. The graphics on the package will be identical the only variable will be the amount of packaging used around the product. The graphics incorporated into the packaging are modest, so as not to distract from the structure which is our focus in this study. Each distinct structure will be analyzed using scan paths and heat maps. The ultimate data we will be looking at is the buying decision made by our participants and the affect package structure had on their decision. Package structure is becoming an important part of consumer product packaging, and as more unique structures
are developed, the market will become significantly more competitive. Companies today actually spend more on package development than on advertising [8]. In this paper we will show how the amount of packaging used to conceal or reveal a product can directly affect consumers buying decisions. Understanding this information and knowing what types of structures are going to be most effective will be beneficial for the consumer product industry. The eye tracking technology used to gather the data is an advanced technology that has not been a part of any packaging structure design before [13].
BACKGROUND It is apparent that the role of packaging has become an integral part of a product’s success. Rettie and Brewer (2000) state that the significance of packaging design and its role in marketing and communication is increasing [7]. While the product itself is ultimately what a consumer aims to evalutate, the package has proven to be a powerful way of conveying its products attributes. “Quality judgments are largely influenced by product characteristics reflected by packaging, and these play a role in the formation of brand preferences” [9]. Every product with a package uses text and images to provide information about the product. In the case of a fully enclosed product, the consumer must make a purchase decision purely based on graphical representations and descriptions to determine if it matches their expectations. The significance of this determination is outlined in Albert Lai’s (1991) article in the European Journal of Marketing. In it he states that buying decisions are based on the degree to which a products attributes contribute to its ultimate usefulness [5]. It has been
Figure #1: Four distinct packaging structures designed and constructed specifically for this experiment. From
left to right the structures are as follows: Fully Exposed, Mostly Exposed, Mostly Enclosed, Fully Enclosed.

found that consumers prefer packaging to include realistic images of the product and that in-store buying decisions are most influenced by the assumed quality that is derived from these images [11]. The inherent problem is that the graphic depiction of an item may not accurately represent its true quality or features. So it is known that consumers like to see what they are buying. The question then becomes what is the consumer’s preference between seeing the actual product versus a graphical representation. In the past, researchers have focused more on graphics and text when trying to determine the relationship between a consumer’s focus points on a package or AOI’s (areas of interest) and how they may be used to predict buying decisions. Other studies have been done that question consumer preferences on packaging structure as it relates to different materials, for example paper cartons versus glass or plastic bottles, or stand up pouches versus traditional bag in a box packages. Material advantages and disadvantages must be taken into consideration during every packaging design process [4].However, there is little to be found on structure as it relates to product exposure. The amount of packaging companies decide to use is largely influenced by the cost of materials and manufacturing efficiency. In some cases societal pressure and public policy has moved companies to minimize their impact on the environment. Packaging contributes a great deal in producing solid waste and in the past few decades this has brought about a change in the industry’s view on environmental accountability [3]. Recent trends have pushed some companies to try and minimize their impact on the environment so engineers have created ways to find the perfect balance between minimizing the use of packaging materials while still properly protecting their products. Some engineers have decided that one way to decrease the amount of materials used is to leave more of the product exposed. Many designers on the other hand have taken the minimalist approach to devise ways to appeal to consumers in a different way. With the numerous advantages companies have found in optimizing their package protection methods many have devoted large amounts of resources into package design. As shown before, companies are reallocating large amounts of resources from marketing to packaging [8]. The design of packaging structure requires control of the physical packaging elements, such as materials, dimensions, weights, and manufacturing steps [6]. In lieu of new packaging trends there is much to be said about how consumers perceive these new approaches to marketing products. In this study the experimenters will look at how products are perceived according to the amount of packing used and how much of
the actual product is visible through the external packaging. This information about packaging structure will be valuable to consumer product companies and packaging engineers alike as they seek to develop packaging with strong shelf presence. Even though the development of new packaging structures can require a substantial investment in time and money, it offers an extraordinary potential for long range benefits. Successfully marketed products in unique packaging structures show that investments in these packaging structures can lead to a great payoff for companies in the long run [6]. Improving on packaging for a product can be an extrememly profitable investment, especially when looking at the prices for developing new brands of products [1]. This new area of eye tracking research is made possible by the advancements in technology, specifically in the eye tracking and visual data processing regions. The retail environment used for the experiment, CUshop™, can be referred to as a full-scale test market. Which is defined as the “most ideal method of confirming the effectiveness of a new package design program, the cost connected with such test markets is, of course, considerably higher than those previously described” [6]. By using a full-scale test market, we are able to immerse shoppers in a realistic environment testing preferences, habits, and shopping processes through eye tracking. Through this test, the goal is to obtain quantitative data regarding package structure including search times, gaze durations, and ultimately the consumer’s purchase decision.
HYPOTHESIS The following hypothesis was developed for the structure study prior to the testing in Las Vegas. Each participant knew what grill tool they were searching for and the brand was not an issue. They are left to subjectively choose one of four distinct packages for their assigned grill tool. The four individual package categories used were:
• Fully Enclosed- All of product was enclosed in box, there is a photo of the product on the outside.
• Mostly Enclosed- A small (2.75"x7") window was cut into front box exposing a small portion of the product. Equal to approximately 40% of product.
• Mostly Exposed- A large amount of the product is exposed. Equal to approximately 90% of product.
• Fully Exposed- The entire product is exposed, there is no box surrounding it. The package is a piece of flat corrugated and product is attached using ties.
Figure #2: Photographs of CUshop™ consumer experience laboratory an immersive retail environment set up at PackEXPO 2011 in Las Vegas, Nevada. (September 2011)

During the study conducted using the grill tools as stimuli, pricing remained static for each product of the three products, fork, spatula, and the tongs.
Hypothesis: The package that visually displays the most product will be selected more frequently. This package/product will have the highest dwell and number of fixations time compared to the other package styles.
METHODOLOGY This experiment took place in Las Vegas, Nevada where the realistic shopping environment called CUshop™ was set up. In this immersive atmosphere, shoppers will look at packages in a setting comparable to an actual retail environment. The Pack Expo packaging conference in Las Vegas offered a unique opportunity to host a large audience in a short period of time. A team consisting of 10 students from Clemson University shipped the shelving units and products from Clemson, SC to the show. The show, which occurred over a three-day period was very successful and generated nearly 150 participants. Seven different eye tracking studies were conducted concurrently by the Clemson students. These studies were independent of each other and had no influence on our structure study.. The space for the CUshop™ booth in the Las Vegas Convention Center was generously donated by PMMI, a packaging industry not-for-profit. They also funded the temporary relocation of CUshop™ as well as the supporting materials and technology. This enabled the eye tracking experiment to be successful and gain a large number of participants over the three day conference. Tobii a company out of Sweden that specializes in eye-tracking research donated an extra pair of eye tracking glasses and sixty additional IR markers for use at the show in Las Vegas. Due to the large number of participants and the time constraints faced, all seven experiments were combined into one large eye-tracking study.
This simplified the tasks for participants and allowed all of the students to run the same experiment, which turned out to be an efficient method. The data from each participant was filtered and organized into each specific study. The structure study involving grill tools will be the topic of this report, with data taken from the eye tracking research done at PackEXPO.The impact of varying product visibility was measured on the participants’ initial fixation (related packaging style), amount of fixations per package style, total amount of dwell time for each package style, and actual product selection.
Participants Participants in this study were registered attendees at Pack Expo 2011 held at the Las Vegas Convention Center in Las Vegas, Nevada. PMMI provided advertisements in newspapers and on television prior to the convention. Clemson University graduate students in Packging Science developed signs and advertisements stationed throughout the convention center. The only incentive given was a print out showing the participants results including a fixation heat map, scan path map, and a bar chart showing their brand preferences in regards to private vs. public brands. There was detailed information explaining the charts to help participants understand the study and how the eye tracking technology works to monitor consumer preferences.
Figure #4: Grill ware arranged on shelf in CUshop™ at PackEXPO 2011 in Las Vegas.
Figure #3: Shopping list given to participant.
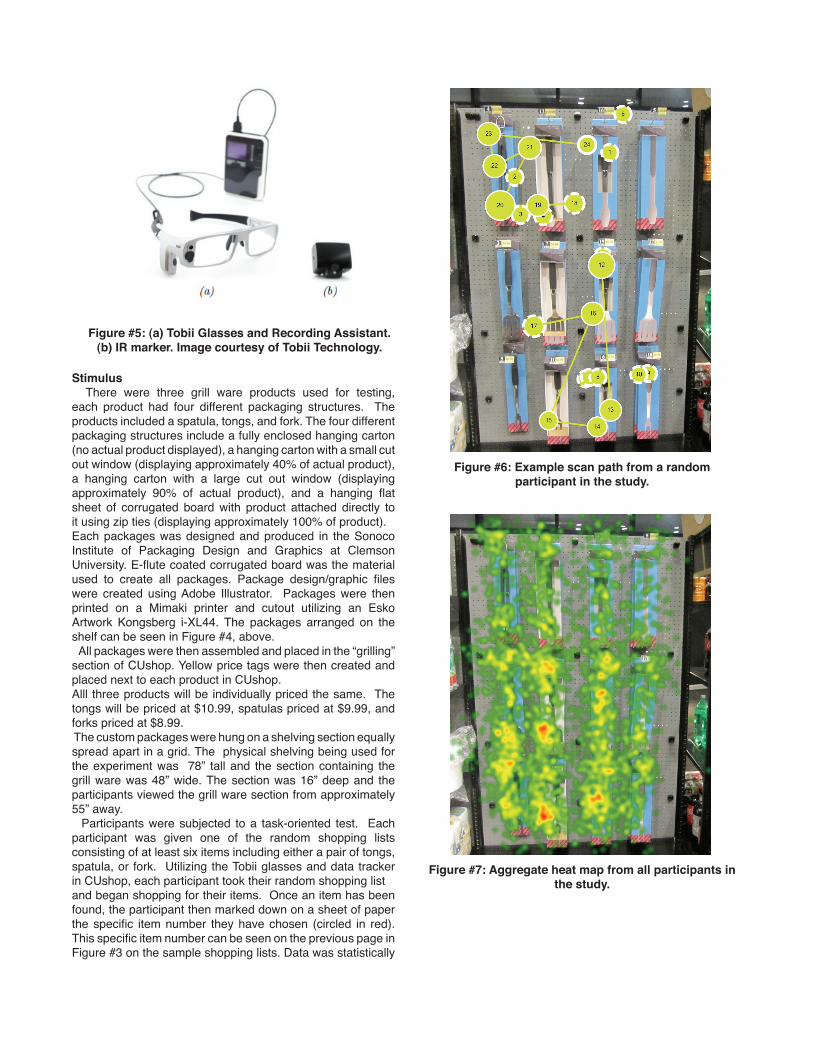
Stimulus There were three grill ware products used for testing, each product had four different packaging structures. The products included a spatula, tongs, and fork. The four different packaging structures include a fully enclosed hanging carton (no actual product displayed), a hanging carton with a small cut out window (displaying approximately 40% of actual product), a hanging carton with a large cut out window (displaying approximately 90% of actual product), and a hanging flat sheet of corrugated board with product attached directly to it using zip ties (displaying approximately 100% of product). Each packages was designed and produced in the Sonoco Institute of Packaging Design and Graphics at Clemson University. E-flute coated corrugated board was the material used to create all packages. Package design/graphic files were created using Adobe Illustrator. Packages were then printed on a Mimaki printer and cutout utilizing an Esko Artwork Kongsberg i-XL44. The packages arranged on the shelf can be seen in Figure #4, above. All packages were then assembled and placed in the “grilling” section of CUshop. Yellow price tags were then created and placed next to each product in CUshop.Alll three products will be individually priced the same. The tongs will be priced at $10.99, spatulas priced at $9.99, and forks priced at $8.99. The custom packages were hung on a shelving section equally spread apart in a grid. The physical shelving being used for the experiment was 78” tall and the section containing the grill ware was 48” wide. The section was 16” deep and the participants viewed the grill ware section from approximately 55” away. Participants were subjected to a task-oriented test. Each participant was given one of the random shopping lists consisting of at least six items including either a pair of tongs, spatula, or fork. Utilizing the Tobii glasses and data tracker in CUshop, each participant took their random shopping listand began shopping for their items. Once an item has been found, the participant then marked down on a sheet of paper the specific item number they have chosen (circled in red). This specific item number can be seen on the previous page in Figure #3 on the sample shopping lists. Data was statistically
Figure #6: Example scan path from a random participant in the study.
Figure #7: Aggregate heat map from all participants in the study.
Figure #5: (a) Tobii Glasses and Recording Assistant. (b) IR marker. Image courtesy of Tobii Technology.
analyzed once the experiment was completed.
Apparatus Eye movements were tracked with Tobii Glasses in conjunction with a Recording Assistant and IR markers. The Tobii Glasses are monocular and track the movement of the right eye based on pupil location. The Recording Assistant attaches to the Tobii Glasses and records eye movement data as well as video of what the participant is actually looking at onto a standard SD card. IR markers are used to define a particular Area of Analysis (AOA) that is required for data collection while using the Tobii Glasses. A minimum of four markers must be used to create this AOA. IR markers can be used to create this AOA only when they are in IR marker holders. If a marker is not in its holder, it can only be used to help calibrate participants. Figure #5 above shows the glasses with the recording assistant and an IR marker.
Experimental Design The environment used for testing was the CUshop™ Consumer Retail Experience at PackExpo Las Vegas 2011. The shelf placement of the grilling packages can be seen in Figure #4. Each row consisted of only one product with all packaging styles. Packages were displayed on their rows (from left to right) by least amount of packaging to most. This Latin square was then permuted every two hours during experimentation by placing the bottom row to the top row and shifting the top and middle rows down one row. Each participant in the study performed only one trial.
Procedure Participants who volunteered were asked to participate in a 10-15 minute research process. This process involved three main steps: calibration, shopping, and then a ten-question demographic survey. The time taken for the three steps varied with each participant throughout the study.
Step 1: Calibration (1-2 minutes)At the beginning of each participant’s experience, the researcher calibrated the Tobii eye-tracking glasses to the participant’s eyes. Calibration utilizes a single IR marker.
Step 2: Shopping (3-8 minutes)After calibration was complete, the participant was given a random shopping list with six items and asked to enter the retail environment and “shop as you would normally shop, selecting one of each of the items on the shopping list. Select each item by placing the purchasing number in the blank square.”
Step 3: Survey (3-5 minutes)Finally after shopping in the retail environment the participants were asked to complete a short survey including background information and study related questions.
While the survey was taking place, data was collected from the glasses and loaded into the computer to generate a print out showing the participant their eye movements for certain areas while shopping. The test took place over the course of the three day convention.
DEPENDENT MEASURESEye Tracking Metrics. The primary metric of study was fixation count followed by average total fix duration. This metric effectively measures which structure participants preffered based on eye movement data. Additionally we measured time to first fixation and average fixation count.
Post-experiment Survey. A ten question survey was issued after participants had completed the study. This survey included demographic questions and pertaining to the participants subjective impression of the retail environment presented in CUshop™.
RESULTS Recorded eye movement data was exported from Tobii Studio and statistically analyzed with Microsoft Excel. Metrics for analysis included time to first fixation, total fixation duration, and fixation count per specified AOA. A two-factor repeated-measures ANOVA on time to first fixation (TTFF) revealed strong significance in package type (F(3,270)=24.92, p < 0.01). Pair-wise T-tests were then done based on p-values and all types of packages (see Figure #8). A two-factor repeated-measures ANOVA on total fixation duration (TFD) revealed a strong significance in package type (F(3,270)=9.97, p < 0.01). Pair-wise T-tests were then done based on p-values and all types of packages. (see Figure #10). A two-factor repeated-measures ANOVA on average fixation count (AFC) revealed a strong significance in package type (F(3,270)=11.93, p < 0.01). Pair-wise T-tests were then done based on p-values and all types of packages. (see Figure #9).
DISCUSSION Our results indicate that the mostly exposed package style had a significantly faster time to first fixation average than the other three packaging styles (seen in Figure #8). The results also show that the fully enclosed package style had a significantly slower time to first fixation than the other three styles. We assume participants were mainly interested in seeing the actual product, as the fully enclosed packages generally did not catch the participant’s eye first. Participants also showed a significant difference in total fixation duration from the fully enclosed package style (seen in Figure #10). The eye movement data clearly shows that the fully enclosed package style was fixated on significantly less than the other three package styles. Eye movement data for average fixation count also shows the fully enclosed package received significantly less fixations than any other package style (seen in Figure #9). An aggregate heat map of all participants’ fixations (seen in Figure #7) shows generally that fully enclosed packages (seen in right column of heat map image) received less attention than the other styles. [12] A random participant’s scan path (seen in Figure #6) shows the fully enclosed packages were not fixated on as much. We conclude that participants preferred package styles with at least some product exposure, as there is no significant difference between the other three styles for total fixation duration or average fixation count. Results from actual product selection (seen in Figures #11 and 12) show a significant amount of participants ultimately

T-TEST TTFF
Fully Exposed
Fully Enclosed
Mostly Enclosed
Mostly Exposed
Fully Exposed
- - - -
Fully Enclosed
3.34E-06 - - -
Mostly Enclosed
0.883923 1.50E-06 - -
Mostly Exposed
0.010875 3.44E-10 0.011604 -
T-TEST AFC
Fully Exposed
Fully Enclosed
Mostly Enclosed
Mostly Exposed
Fully Exposed
- - - -
Fully Enclosed
3.82E-05 - - -
Mostly Enclosed
0.969499 0.00012 - -
Mostly Exposed
0.559209 0.003234 0.596 -
T-TEST TFD
Fully Exposed
Fully Enclosed
Mostly Enclosed
Mostly Exposed
Fully Exposed
- - - -
Fully Enclosed
0.000666 - - -
Mostly Enclosed
0.900226 0.000482 - -
Mostly Exposed
0.740128 0.009381 0.659008 -
Figure #11: Bar chart showing product selection based on structure style of package.
Figure #12: Bar chart showing product slection averages based on structure style of package.
Figure #8: (Left) Bar chart showing results for time to first fixation (TTFF) including SE. (Right) T-Test table for time to first fixation (TTFF).
Figure #9: (Left) Bar chart showing results for average fixation count (AFC) including SE. (Right) T-Test table for average fixation count (AFC).
Figure #10: (Left) Bar chart showing results for average total fixation duration (TFD) including SE. (Right) T-Test table for average total fixation duration (TFD).

preferred the fully exposed package style to all others. This concurs with our hypothesis and backs our assumption that people generally like to see as much of a product as possible before purchasing. Maximum product exposure ensures the consumer will get exactly what he/she sees with no surprises. Since pricing was constant for each package style, a consumer also may have opted for the fully exposed package because it was more sustainable (less material to be discarded).
CONCLUSION The results presented in this report show comparison of three different products packaged in four different structures with varying product visibility. Eye movement results indicate that the fully enclosed package had a significantly longer time to first fixation, lower total fixation duration, and lower fixation count compared to the other three styles. These statistical conclusions show participanats preferred a package that had at least some product visibility. We conclude that consumers in a retail environment want to know exactly what they are buying. Seeing more of the product allows the customer to feel more confident about their purchase decision. Eye movement data however did not show much of a significant difference for the stated metrics in the other three package styles except for the mostly exposed package style. This style showed that it caught participants eyes significantly faster than the other styles. Analysis of actual product selection (shopping lists) however showed that consumers ultimately preferred the fully exposed package style, even though the mostly exposed package had a faster time to first fixation.Overall evidence from this study suggests that consumers are more inclined to buy a product they can actually see (at least in grill tools).
REFERENCES1. Barnes C., Southee, C., and Henson, B. 2003.
The impact of affective design of product packag-ing upon consumer purchase decisions. In Pro-ceedings of the 2003 international conference on Designing pleasurable products and interfaces (DPPI ‘03). ACM, New York, NY, USA, 134-135. DOI=10.1145/782896.782930 http://doi.acm.org/10.1145/782896.782930
2. Barrack, R. (2011, May 11). Five Lessons for Building Great Packaging. Shelf Impact. Summit Media Group, Inc., Retrieved from http://www.shelfimpact.com/archives/2011/05/ five_lessons_for_building_grea.php.
3. Connell, R. (1991), “Regulatory trends in envi-ronmental responsibility: Manufacturer liability for product impact”, Environmental Claims Journal, Vol. 4 No. 2, pp. 201-219.
4. Klimchuk, M. R., & Krasovec, S. A. (2006). Packaging design, successful product branding from concept to shelf. Hoboken, New Jersey: Wiley.
5. Lai, A. (1991), “Consumption situation and product knowledge in the adoption of a new product”, Euro-pean Journal of Marketing, Vol. 25 No. 10, pp. 55-67.
6. Meyers, H. M., and Lubliner, M.J. The Marketer’s Guide to Successful Package Design. Chicago: NTC Business, 1998.
7. Rettie, R. and Brewer, C. (2000), “The verbal and visual components of package design”, Journal of Product & Brand Management, Vol. 9 No. 1, pp.56-70.
8. Schoormans, J. P. L. and Robben H. S. J. (1997), “The effect of new package design on product at-tention, categorization and evaluation”, Journal of Economic Psychology, Vol. 18, pp. 271-287.
9. Silayoi, P. and Speece, M. (2007), “The importance of packaging attributes: a conjoint analysis ap-proach”, European Journal of Marketing, Vol. 41 No. 11/12, pp. 1495-1517.
10. Survey: Innovation remains key to packages that generate sales. (2010, December 08). URL: http://www.shelfimpact.com/archives/2010/12/survey_ innova t ion_remains_key.php?utm_source=eClip&utm_medium=newsletter
11. Underwood, R., Klein, N. and Burke, R. Packaging communication: Attentional effects of product imagery. Journal of Product and Brand Packaging, 10(7):403–422(20), 2001.
12. Wooding, D.S. Fixation Maps: Quantifying Eye-Movement Traces. In ETRA ‘02: Proceedings of the 2002 Symposium on Eye Tracking Research & Applications, pages 31-36, New York, NY, 2002. ACM.
13. Wedel, M. & Pieters, R. A review of eye-tracking research in marketing. In Review of Marketing Research. Emerald Group, Bingley, UK, 2008.
14. Zeitoun, E. (2011, May 11). Survey: Great graphics and structure critical, but not always enough. Survey: Great graphics and structure critical, but not always enough, Retrieved from http://www.shelfimpact.com/archives/2011/05/survey_great_graphics_and_stru.php