Embed Size (px)
Citation preview

Consumer Fine Dining Choices:
Marketing Research Report
PREPARED BY:
Andrew Throckmorton
Tim Routzahn
Scott Monterastelli
Benjamin Turner
May 1, 2009

1
CONTENTS
Executive Summary ....................................................................................................................................... 3
Background ................................................................................................................................................... 4
Secondary Research ...................................................................................................................................... 4
The top 10 topics to consider when opening a restaurant: ...................................................................... 4
Research Objectives ...................................................................................................................................... 5
Limitations .................................................................................................................................................... 5
Method ......................................................................................................................................................... 6
Sample Definition ...................................................................................................................................... 6
Sample Plan ............................................................................................................................................... 6
Questionnaire Development ..................................................................................................................... 6
Data Collection .......................................................................................................................................... 6
Non-Sampling Error Reduction ............................................................................................................. 6
Response Rate ....................................................................................................................................... 6
Findings and Questionnaire Analysis ............................................................................................................ 7
Screening Questions ................................................................................................................................. 7
Conclusions & Recommendations .............................................................................................................. 32
Appendices .................................................................................................................................................. 34
Research Proposal ................................................................................................................................... 34
Schedules ................................................................................................................................................ 36
Weekly Status Reports ............................................................................................................................ 38
Sample Cover Letter ................................................................................................................................ 41
Sample Survey ......................................................................................................................................... 42
Invoices ................................................................................................................................................... 45
Receipts ................................................................................................................................................... 46
Budget ..................................................................................................................................................... 46
Invitation to Presentation ....................................................................................................................... 47
Thank-you Letter ..................................................................................................................................... 48
Returned Questionnaires ........................................................................................................................ 49
PowerPoint Presentation ............................................................................................................................ 49

2
LIST OF FIGURES
Figure 1 Dining Frequency ...................................................................................................................... 7
Figure 2 Typical Dining Expense (Per Head) ............................................................................................ 8
Figure 3 Distance Preference .................................................................................................................. 9
Figure 4 Current Dining Preference ...................................................................................................... 11
Figure 5 Dining Companions ................................................................................................................. 13
Figure 6 Preferred Day .......................................................................................................................... 14
Figure 7 Time Preference ...................................................................................................................... 15
Figure 8 Dining Duration ....................................................................................................................... 16
Figure 9 Interest in French Restaurant ................................................................................................. 17
Figure 10 Dining Choice Satisfaction ....................................................................................................... 18
Figure 11 Dining Preferences .................................................................................................................. 19
Figure 12 Alcohol Preference .................................................................................................................. 21
Figure 13 Alcohol Pricing Tolerance (Glass) ............................................................................................ 22
Figure 14 Alcohol Pricing Preference (Bottle) ......................................................................................... 23
Figure 15 Alcohol Selection Preference .................................................................................................. 24
Figure 16 Gender .................................................................................................................................... 25
Figure 17 Residence Location ................................................................................................................. 26
Figure 18 Distance from Hillsdale ........................................................................................................... 27
Figure 19 Age .......................................................................................................................................... 28
Figure 20 Employment Status ................................................................................................................. 29
Figure 21 Annual Income ........................................................................................................................ 30

3
Executive Summary The Naatjes family desires to establish a French Bistro in Hillsdale, MI. Mrs. Naatjes has
worked in the restaurant industry for much of her life, and she has significant experience as a
restaurant manager and Chef. The family’s goal is to determine the viability of opening a French
Bistro in Hillsdale Michigan, and this study will provide significant feedback from the
community regarding their fine dining preferences. With this objective in mind, the marketing
research that we have conducted has been focused on exploring the four research objectives that
were agreed upon with the client. Those objectives are cost sensitivity, cuisine preferences,
dining habits and alcohol preferences.
The Bistro survey sampled a group of 1,772 community members from Hillsdale and
Jonesville. Over 395 survey responses were received and 278 of those responses were selected
for inclusion and analysis in this report. Those not included were eliminated through the
utilization of income as a screening question. Specifically, surveys that listed income as less
than $49,999 were screened from this report and analysis. As a result, our gross response rate
was 22.29% and net response rate was 15.65%.
Survey respondents appear generally dissatisfied with their current dining choices with an
average satisfaction with existing Hillsdale and Jonesville fine dining option falling to 2.8 points
on a 7 point synthetic metric scale. At the same time, those same respondents expressed some
interest in exploring a new French Bistro with an average interest in trying the new bistro of 4.7.
on a 7 point scale. Respondents appear to be indifferent regarding alcohol with an average score
of 4.2 on a 7 point scale for interest in drinking alcohol during dinner.
Personalized service, short wait times and value based pricing appear very important to
Hillsdale and Jonesville residents. Respondents were very interested in learning more about the
Bistro, and respondents offered comments ranging from business-to-business advice, a job
application and several long commentaries on the general health of the local economy.
Community members appeared generally interested in trying the new restaurant, but they are
concerned about their ability to afford fine dining. Some respondents went as far as suggesting
in their comments that the Bistro would likely struggle in Hillsdale county. Other respondents
stated that they would likely become regular customers, and they expressed their excitement
about the idea of a new fine dining restaurant moving into their community.
A section of demographic questions was included at the end of the survey, and it
provided valuable demographic data regarding their age, income, occupational status and gender.
Those questions helped screen responses, and they were helpful in further analyzing responses.
This was especially true when our team sought to identify correlations between gender, income
and dining choices. This demographic data will also be helpful in classifying the likely
customers of the French Bistro.

4
Background Before residing in Grand Rapids, Michigan, Susan Naatjes was a restaurant owner and a
gourmet chef at a successful French Bistro in Australia for three years. After sending her son to
Hillsdale College in Hillsdale, Michigan, Susan decided that a French Bistro restaurant would be
an elegant touch to the small town. In order to initiate the institution of the restaurant, she sought
out the assistance of the Hillsdale Marketing Research department. With the help of the research
department, Susan hopes to utilize the project findings to seek potential funding from banks and
augment her interactions with the Hillsdale City Council.
Secondary Research
Our research focused on providing insights into the steps that restaurants are taking to
succeed in the current economic conditions. Those insights include suggestions on establishing
the right ambiance, attracting customers through special promotions and understanding the
alcohol preferences of consumers. The ultimate goal of this report is to provide a relevant
decision making data regarding the selection and establishment of an alcohol menu, attraction of
customers and the creation of an attractive dinning space for customers.
Although there is little empirical data regarding restaurants in Hillsdale Michigan, we were able
to develop an understanding of existing consumer preferences through utilizing the findings of a
2008 Gallup Poll on consumer drinking habits and through consulting the findings of a 2008
report from the National Restaurant Association regarding consumer preference and culinary
trend projections for 2009. Our research also examined the techniques that current restaurants
are using to design their dining spaces and menus for maximum ambiance and profitability.
Although these findings do not speak directly to the Hillsdale market, we believe that they
provide an accurate indication of the current environment for new and established restaurants.
The results of the secondary research have been condensed into 10 key topics that should be
reviewed.
The top 10 topics to consider when opening a restaurant:
The most successful restaurants are intimate ones.
Use different glasses for red and white wine, and serve dessert in unusual bowls.
Seasonal decorations are essential.
Put menu items where the customer’s eye goes first, the upper right-hand side of the
menu.
Consumers are drinking less in restaurants due to recession and healthier lifestyles
Price is a key profit driver with restaurants turning to high margin menu offerings to
remain profitable in the current economy.
Beer and wine tied for popularity in 2005, but beer has
returned to its former status as the drink of choice in America.
Food-alcohol pairings, craft beer, specialty beer, organic cocktails, muddled cocktails and
wine or beer flights are currently very popular with fine restaurants.

5
The shift from wine has occurred mostly in Americans between the ages of 30 and 49
Women are less influenced by the price of alcohol than men.
Research Objectives The four research objectives outlined in our first and second meetings were discovering
cost sensitivity, cuisine preferences, dining habits and alcohol preferences. Each of these
objectives was built into specific questions that were designed to gain the maximum relevant
data. Questions related to cost sensitivity were asked through categorical multiple-choice
question that sought to discover three things. First, the range for per person consumer spending
at a fine restaurant. Second, the price range that local consumers are willing to pay for wine by
the bottle and glass. Third, the income range of local consumers. Cuisine preference questions
were asked through a Likert scale. These questions sought to discover two things. First, the
community’s interest in local and organic foods. Second, the interest level for beef, poultry and
seafood. Dining habit questions were asked through multiple choice questions and the Likert
scale. Multiple choice questions inquired into preferred dining times and days. Likert scale
questions examined issues like dress code and ambiance. Alcohol related questions were also
asked through Likert and categorical multiple choice questions. Beer, wine and liquor
preferences were examined through the Likert scale. Alcohol price questions were asked
through categorical multiple choice questions.
Limitations Throughout our study, there were many limitations that arose while we were comparing
and analyzing our data. When purchasing our mailing list, we received numerous participants
with annual salaries less than that of our salary cut-off point. Because of these lower salaries, we
did not use their data in our analysis. Another limitation we encountered was that many of the
respondents completely ignored the alcohol section of the questionnaire due to their lack of
interest. This caused some of our analysis of the alcoholic questions to be less accurate than the
rest of our research. These limitations did not prohibit us from analyzing those question, but
they did limit the size of the analysis pool and lead to the disqualification of certain surveys..

6
Method
Sample Definition
The Bistro marketing team purchased a list from USAData.com which consisted of 1,772
citizens that reside in the Hillsdale/Jonesville area who receives an annual income of $100K+.
Once receiving the list it was discovered most responses were actually in the $50K to $99K
range and over 25% of our responses were filtered out due to the fact they made below $50K.
Sample Plan
Bistro team estimated a 4%-8% return rate on all questioners mailed which would give
approximately 100 responses which would give the required amount so statistical analysis could
successfully determine, demographics, habits, and preferences. However after all responses were
returned Bistro team received a little over 400 responses.
Questionnaire Development
The research questioner was developed to correlate with the research objectives as best as
possible. Every question served to either filter out unwanted responses or to answer research
objectives. The questioner encompassed, categorical(dual and multiple choice), metric(natural
and synthetic), and open-ended(un-aided); categorical questions that were both dual and
multiple-choice. The metric questions were synthetic
Data Collection
The questioners were sent out Thursday March 12, 2009 with a due date of Tuesday March 31,
2009
Non-Sampling Error Reduction
There were a mixture of questions that were skipped for different reasons, the questions that
were skipped most often were the questions pertaining to alcohol. Those questioners that were
missing input on the alcohol section were still included. The only surveys that were dismissed
were ones that were obviously skewed or missing 50% of required data.
Response Rate
Of the 1772 surveys mailed to Hillsdale and Jonesville residents, 395 surveys were received. Of
those responses, 278 were included in the final report. The 117, 29.6% that were not included
were disqualified through the screening process. Income and completeness were the two
screening variables.

7
Findings and Questionnaire Analysis
Screening Questions
Question One: In a month, how often do you dine at fine dining restaurants? (Please select
one)
(0-2) (3-4) (5-6) (7+)
Figure 1 Dining Frequency
Question 1 was chosen in-order to determine the monthly frequency of dining among Hillsdale
and Jonesville residents. This is a categorical, multiple-choice question. Analysis showed that
Hillsdale and Jonesville residents generally eat 0-2 times per month at 71% followed by 3 to 4
times per month at 22%. The question will be useful in order to determine possible customer
inflow and turnover rates.

8
Question Two: How much per person, does your family generally spend at a fine restaurant
ex. (steak or seafood)?
(Please select one) (Less than $15) ($15-20) ($21-25) ($26-30) ($31+)
Figure 2 Typical Dining Expense (Per Head)
Question 2 was chosen in-order to determine how much money residents generally spend at a
fine dining restaurant. This is another categorical, multiple choice question. Analysis showed
that the top amount of money that residents generally spend is between $15 and $20 at 40%
followed by between $21 and $25 at 20%. This question is useful to develop a target price range
for the menu. It also demonstrates a potential price ceiling for meal prices.
13%
40%
20%
11%
16%
less than $15
$15-20
$21-25
$26-30
$31+

9
Question Three: What distance are you willing to travel to eat at a fine restaurant? (Please
select one)
(0-10 miles) (10-20 miles) (20-30 miles)
(30+ miles)
Figure 3 Distance Preference
This question was chosen with the intention of discovering the distance that residents are willing
to travel in order to dine at a fine restaurant. This is a categorical, multiple choice question.
Analysis showed that the top distance residents are willing to travel is a split between 20 to 30
miles and more than 30 miles. Each segment was roughly 36% of total respondents. This
question was useful to show that residents are willing to travel longer distances in order to dine
at fine restaurants.

10
Question Four: What new fine dining options would you like to see in Hillsdale and
Jonesville?
__________________________________________________________________
Restaurants
Italian
Seafood
Steak
Red Lobster
Outback
Applebees
Atmosphere
Casual Dining
Family Style Restaurants
Smoke Free
Restaurant with Seasonal Menu
No new options
This open-ended aided response option to question 4 allowed respondents to specify what type of
new fine dining options they would like to see in Hillsdale or Jonesville that currently do not
exist. The most common response was a casual seafood or steak restaurant. In general, the
respondents stated they want quality, less expensive food and good service.

11
Question Five: What fine dining restaurants do you enjoy eating at in Hillsdale and Jonesville?
(Select all that apply)
Chicago Water Grill
Savarino's Restaurant
Hillsdale Golf and Country Club Dining Room
Other___________________
Figure 4 Current Dining Preference
This question was chosen in-order to determine what restaurants in Hillsdale and Jonesville
residents prefer to dine at. This is a categorical multiple choice question. Analysis showed that
83% of the residents preferred to dine at the Chicago Water Grill followed by Savarino’s
Restaurant at 36%. This question was useful to show that residents do enjoy finer more
expensive dining in Hillsdale and Jonesville. Also, this question shows that the primary
competition for the bistro will be Chicago Water Grill.

12
Question Six: What is your favorite restaurant in Hillsdale and Jonesville?
__________________________________________________________________
This open-ended response option to question 6 allowed respondents to specify the types of
restaurants they prefer to eat at in Hillsdale and Jonesville. The top response was the Chicago
Watergrill at 118 followed by Saucy Dogs at 17 and Savirinos at 16. This also allows the
determination of what types of menus customers typically enjoy.

13
Question Seven: When dining at a fine restaurant, do you generally eat (__) alone, (__) as a
couple or (__) in groups? (Please select one)
Figure 5 Dining Companions
Question 7 is a categorical multiple choice that was designed to ask Hillsdale and Jonesville
patrons how they prefer to eat, either as a couple in groups or alone. 62% prefer to eat as couples
followed by 38% who prefer in groups. There was one response that indicated a habit of fine
dining alone. This response was included in the analysis, but it does not represent a significant
statistic.
14
Question Eight: When are you likely to eat at a fine dining restaurant? (Select all that apply)
(Monday-Thursday) (Friday) (Saturday) (Sunday)
Figure 6 Preferred Day
Question 8 is also a categorical multiple choice that was constructed to see what days Hillsdale
and Jonesville patrons prefer to eat out. As can be seen from the slide, 83% prefer to eat out on
Saturday and 69.4% prefer to eat out on Friday. This indicates that Friday and Saturday are the
nights that will likely be the busiest.

15
Question Nine: What time do you prefer to eat dinner out? (Please select one)
Before 5 pm 5-7 pm 7-9 pm 9-11 pm
Figure 7 Time Preference
This is a categorical multiple choice question that was devised to answer question 9. It asks what
time do you prefer to eat dinner out? 5-7P.M had a response of 73.1%. This means that the hours
of 5-7P.M will be the busiest time for local restaurants.

16
Question Ten: When you eat out, how long do you generally eat dinner? (Please select one)
(Less than 1 hour) (1-1.5 hours) (1.5-2 hours) (2+ hours)
Figure 8 Dining Duration
Question 10 is another categorical multiple choice that asks how long patrons generally take to
eat out. 66% responded that they take between 1-1.5 hours to eat dinner. This question can be
used to figure table turnover times, staffing, and reservation limits.

17
Question Eleven: On a scale from 1 to 7, where 1 is “strongly unlikely” and 7 is “strongly
likely,”; how likely would you be to eat at a French restaurant, if one opened in the
Hillsdale/Jonesville area? (Please circle only one number)
Variable Average
Standard
Deviation Minimum Maximum Sample
How likely would
you be to eat at a
French restaurant if
one opened in
Hillsdale/ Jonesville
area?
4.7 1.9 1 7 273
Figure 9 Interest in French Restaurant
Question 11 is one of the most important questions on the questionnaire. It is a continuum
synthetic metric that asks, “How likely are you to try a French Restaurant if one opened in the
Hillsdale/Jonesville area?”. Where one is very unlikely, and 7 being very likely. The average
response was 4.7. This means just over half of accepted responses would be willing to try a new
French restaurant. After running a confidence interval it was discovered that there is a 95%
confidence that the average falls between 4.5-5.

18
Question Twelve: On a scale from 1 to 7, where 1 is “strongly dissatisfied” and 7 is “strongly
satisfied,”; are you satisfied with the current fine dining options in Hillsdale and Jonesville?
(Please circle only one number)
Variable Average
Standard
Deviation Minimum Maximum Sample
Are you satisfied with
the current fine dining
options in Hillsdale and
Jonesville?
2.8 1.5 1 7 274
Figure 10 Dining Choice Satisfaction
Question 12 is a continuum synthetic metric that asks, “Are you satisfied with the current fine
dining options in Hillsdale/Jonesville?” With one being very unsatisfied, and 7 being very
satisfied. The average response was 2.8, which means the average respondent was dissatisfied
with the current restaurant choices in the Hillsdale and Jonesville are.

19
Question Thirteen: Next, we would like to ask about your fine dining preferences. On a scale
from 1 to 7, where 1 is “strongly disagree” and 7 is “strongly agree,” please rate your
response to the following statements. (Please circle one number per question)
Variable Average
Standard
Deviation Minimum Maximum Sample
I enjoy eating seafood. 5.8 1.6 1 7 273
I enjoy eating beef. 5.7 1.5 1 7 276
I enjoy eating poultry. 5.7 1.2 1 7 260
Personalized service is important
to me. 5.6 1.2 2 7 269
The ambiance of a fine restaurant
is important. 5.3 1.4 1 7 263
A wide selection of menu
choices is important to me. 5.1 1.3 1 7 276
The use of local food and
produce in my food is important
to me.
4.7 1.5 1 7 270
I like to dress well when I eat at
fine restaurants. 4.6 1.4 1 7 274
I like to drink alcohol when
dining out. 4.5 2.1 1 7 266
I would Sunday brunch at a
French restaurant. 4.3 1.8 1 7 272
I would eat lunch at a French
restaurant. 4.3 1.6 1 7 257
I like to drink wine with dinner. 3.9 2.3 1 7 274
I am familiar with French food. 3.7 1.8 1 7 268
I would attend wine tastings
offered by a French restaurant. 3.7 2.2 1 7 274
I like to drink mixed drinks with
dinner. 3.6 2.1 1 7 271
I like to drink beer with dinner. 3.5 2.1 1 7 266
Eating organic is important to
me. 3.4 1.7 1 7 276
I order alcoholic after dinner
drinks. 2.8 1.8 1 7 270
Figure 11 Dining Preferences
Question 13 is a Synthetic Metric Likert Scale. It was designed to gain an understanding of the
relative importance of specific atmospheric, food and alcohol items to Hillsdale and Jonesville
patrons. Each question asked respondents to rate their opinion from strongly disagree to strongly
agree on a 7 point scale. Several responses are worth noting. Beef and poultry received an
average score of 5.8 and 5.7 respectively. Dressing well received an average score of 5.7. Wide

20
menu selection had an average score of 5.6. The other average scores on this slide are worth
noting, but they represent a neutral or slightly negative score. I like to drink alcohol and I would
eat lunch at a French restaurant indicate only a slight preference. 4 is the neutral number, and
they only deviate from that by .5 and .3 respectively. Sunday Brunch had an average score of 4.3
which indicates a general ambivalence towards to idea of a Brunch. Seafood had a low score of
3.4 which indicates a slight lack of preference for seafood. The question I am familiar with
French Food received the lowest score of 2.8 which indicates a noteworthy lack of familiarity
among residents regarding French Food These findings are important as they can be used to
determine menu selection and offerings. They also provide insight into the market that you will
be competing in.

21
Question Fourteen: How many alcoholic drinks do you have during dinner at a fine
restaurant? (Please select one)
(0) (1-2) (2-3) (3-4) (4+)
Figure 12 Alcohol Preference
This is a categorical multiple choice question, and it was designed determine the level of alcohol
consumption that can be expected from customers. Responses indicate that 1-2 drinks is the
likely number. 62% of respondents indicated that they drink 1-2 times during their meal. This
information is useful as it allows us to determine likely alcohol consumption

22
Question Fifteen: When at a fine restaurant, what is the price range that you are willing to
pay for a glass of premium wine? (Please select one)
(Less than $3) ($3-5) ($6-10) ($10-12) ($13+)
Figure 13 Alcohol Pricing Tolerance (Glass)
Question 15 is also a categorical multiple-choice question. This question was designed to
determine the price for a glass of wine that Consumers in Hillsdale and Jonesville are willing to
pay. $3-5 and $6-10 were the highest rated with 39% and 33% respectively. Totaling 72% of all
respondents. This question is very important as it provides a price range of $3-10 for a glass of
wine.

23
Question Sixteen: When dining out, what is the price range that you are you willing to pay for
a bottle of premium wine? (Please select one)
(Less than $15) ($15-20) ($21-30) ($31-40) ($41+)
Figure 14 Alcohol Pricing Preference (Bottle)
Question 16 is a categorical multiple-choice question. This question is like question fifteen, but
it focused on the price of a bottle of wine rather than a glass of wine. Responses indicate that the
price many residents are willing to pay is $31 with 85% indicating that they would like to pay
less than $31 per bottle. Responses were mixed with $21-30, $15-20 and less than $15 receiving
31%, 26% and 28% respectively. These results are important as they indicate the majority of
residents seek value prices for their wine while a minority are willing to pay higher prices for
premium wines.

24
Question Seventeen: Do you prefer a broader, more expensive selection of alcohols, or a
more concentrated, less expensive selection of alcohols? (Please select one)
(Broader, more expensive) (Concentrates, less expensive)
Figure 15 Alcohol Selection Preference
This is a categorical dual-choice question. It asked respondents to rate their desire for broader
expensive alcohols and concentrated less expensive alcohols. 73% of survey participants
selected concentrated less expensive. This is valuable because it indicates that most residents
desire value and specialization.

25
Question Eighteen: What is your gender?
(Male) (Female)
Figure 16 Gender
Question eighteen asked respondents about their gender. This question is a dual choice question.
The analysis shows that roughly 45% of the respondents are male, and roughly 55% of the
respondents are female.

26
Question Nineteen: Where do you live?
(Hillsdale) (Jonesville) (Other)___________
Figure 17 Residence Location
Question nineteen asked respondents where they lived. This question is a categorical, multiple
choice question. The data analysis shows that 73.8% of the potential customers live in Hillsdale.
21.5% live in Jonesville. 4.7% live outside of these towns. Some of the towns that were
mentioned were:
Allen
North Adams Jerome
Cambria
Moscow
Lake BawBeese
This data shows that the bulk of your potential customers will be coming from Hillsdale and
Jonesville. Marketing efforts should be concentrated in those two areas. The other areas will
most likely be attracted through word of mouth.

27
Question Twenty: How far do you live from downtown Hillsdale?
(0-10 miles) (11-20 miles) (21-30 miles) (30+ miles)
Figure 18 Distance from Hillsdale
Question twenty asked respondents how far do they lived from downtown Hillsdale. This
question is a categorical, multiple choice question. The analysis shows that 87% of the
respondents live within 10 miles of downtown Hillsdale, and 12% live 11-20 miles away.

28
Question Twenty One: What is your age range?
(Less than 18) (18-34) (35-49) (50-64) (65+)
Figure 19 Age
Question twenty one asked our respondents what is your age range? This question is a
categorical, multiple choice question. The analysis shows that 52% of the respondents are 50-64
years of age, 29.1% are 25-49 years of age, and 13.5% are 65 and higher.

29
Question Twenty Two: What is your employment Status?
Working Retired Other____________________
Figure 20 Employment Status
Question twenty-two asked our respondents what is your employment status? This is a
categorical, multiple choice question. The analysis shows that 70% of the potential customers
are currently employed. 24% are retired, and 6% fall in another category. Some of the
categories that were mentioned were:
Unemployed
Self-employed
Wife
Mother
Homemaker
Part-time
Small Business
70%
24%
6%
Working
Retired
Other
30
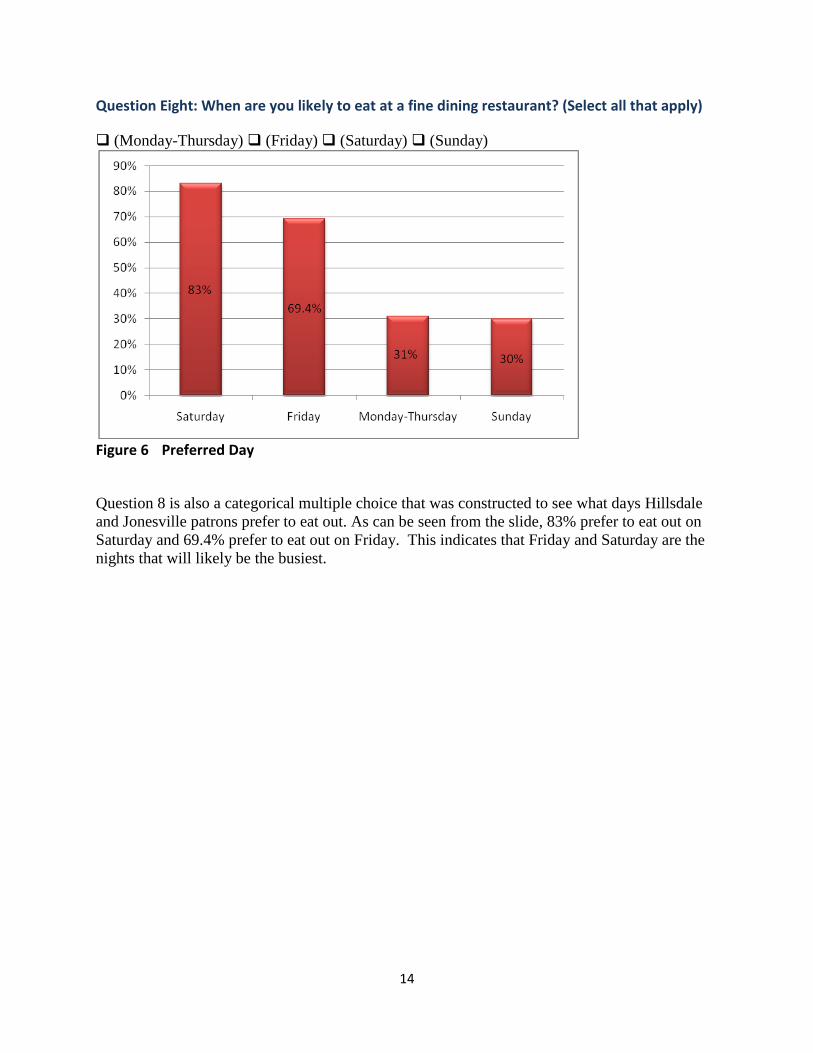
Question Twenty Three: What is your annual income?
$49,999 or less $50,000-99,999 $100,000-149,999 $150,000-$199,999 $200,000
or more
Figure 21 Annual Income
Question twenty-three asked our respondents what is your annual income? This is a categorical,
multiple choice question. The analysis shows that 67% of the respondents make $50,000 to
$99,999 annually, while 19% make $100,000 to $149,999 per year, and only 5% have a
$200,000+ annual salary.

31
Question Twenty Four: Is there anything else that you would like to tell us that would help a
new restaurant opening in the Hillsdale and Jonesville area?
Question twenty-four allowed respondents to make suggestions on what they believe will make
the restaurant succeed or if they believe it will fail. This question is an open-ended unaided
question. Some of the most prominent responses were:
• Price is very important due to bad economy
• Must have a nice atmosphere
• Lots of menu options, wide variety of food
• Non-smoking is a must
• Locally produced meat and veggies (organic if possible)
• Good quality food and quality personal service
• Healthy dining is desirable
There are a plethora of other responses that were received which can be found amongst the
questionnaires that are in the binder you have received.

32
Conclusions & Recommendations Survey responses indicate that residents are unaware of French Food. Also, many Likert
scale responses were neutral or slightly positive, but there were a few that received responses
that indicated a medium level of interest. Those responses included beef and poultry. Due to the
neutral nature of many responses, the Likert scale questions were of some value, but little
meaningful analysis could be performed of those with scores close to the neutral value of four. If
responses had contained more variation, additional analysis could have been performed.
The Bistro can capitalize on the Likert responses with larger variations through
developing menu items that cater to those responses. An example of this would be to offer more
beef and poultry items than seafood. In addition, the Bistro can increase its customer base
through educating residents about French Food. Residents indicated a significant lack of
knowledge regarding French Food in their responses. Their interest level will likely increase as
they understand the Bistro’s food offerings. Increased awareness of French Food will potentially
result in an increased rate of patronage.
Open-ended responses also indicated that Hillsdale and Jonesville residents placed
importance on knowing the restaurant’s owner through table visits and personal greetings. This
emphasis on relationship building appeared to be another way that the Bistro could develop
customer loyalty and improve its customer turnover rate. The score for resident willingness to
visit a French Restaurant was 4.7, but knowledge of French Food and satisfaction with existing
fine dining options only received a score of 2.8. If knowledge of French food through education
and satisfaction through owner client interactions are combined, there is potential for more
residents to decided to try the new restaurant.
The general lack of satisfaction that many residents indicated regarding existing fine
dining options presents an opportunity for the Bistro. Since residents are already dissatisfied
with local restaurants, they will likely demonstrate a lower level of loyalty to restaurants like the
Water Grill. In addition, they may be more willing to try the Bistro with the hope of discovering
a restaurant that meets their standards.
Income and discretionary spending were two important statistics that the survey
discovered. 40% of respondents spend $15-20 per person at a fine restaurant, and 67% of
residents have an income that is between $50,000 and $99,000. Both of these statistics are
valuable because they provide insight into the spending habits and spending ability of residents.
These findings relate to the wine glass and bottle pricing data from questions fourteen and
fifteen. Together, they can be used to price food and beverage offerings with a degree of
certainty.
Age is another issue that the impacts the Bistro. 52% of survey respondents indicated
that they were between the ages of 50 and 62. This does not mean that they necessarily represent
the majority of your future clients, but it does provide an indication of the general age of many
residents who responded to the survey. This information can be useful as it can be used to target
specific members of the community with special offers and incentives that are designed to
encourage them to try the Bistro.
Overall, the data indicates that there is a high request for consistency of the quality of
food and service. Many residents indicated that they were dissatisfied with the existing quality
of local restaurants. Based upon Likert scale responses, Hillsdale residents appear to have a low
demand for alcoholic beverages while dining at a restaurant. A non-smoking establishment was

33
of major concern among many respondents. Easily accessible parking was another frequent
concern for many of the respondents. Of all the respondents, only 24% make above $100,000,
which was our initial target market. Thirty percent of the respondents are currently unemployed
or retired. Another interesting fact is that even though seafood scored an average of 3.5 on the
Likert scales, many respondents noted in the suggestions section that they would be interested in
a restaurant with quality seafood on the menu.
In light of this data, it is our recommendation that you proceed with extreme caution.
This is because of the limited resources in Hillsdale and the neutral responses to many of the
survey questions. If, in fact, you do choose to proceed, focus primarily on a small, intimate
setting with exceptional food and service with competitive prices ranging no more than $15- $20
per plate. In addition, we recommend utilizing the competitive advantage of remaining open on
Sunday for dinner.

34
Appendices
Research Proposal
Client Proposal Problem Statement:
The Naatjes family desires to establish a French Bistro in Hillsdale, MI. Mrs. Naatjes is a French Chef
who has background in the restaurant industry with significant experience as a restaurant manager.
Through primary research, the owner would like to determine the feasibility of this proposed business
endeavor.
Research Objectives:
Develop a questionnaire to survey current Hillsdale residents age 18 and older targeting four key areas:
1. Cost Sensitivity:
Maximum price willing to pay
2. Cuisine Preferences:
Steak, Seafood, Poultry etc…
3. Dining Habits:
Dining frequency
Restaurants of choice
4. Alcohol Preferences:
Beer or Wine and Brand and variety of choice
Application
The results of this study will be used to provide feedback to the Naatjes family to determine viability of
operations.
Research Design:
The research team will create a direct mail survey based on the research objectives. The direct mail
survey will be administered through a mailing to a random sample of Hillsdale country residents age 18
and older. The Hillsdale College Research team will utilize Hillsdale College mailroom services to print,
prepare and send the surveys.
Financial Responsibilities:
The client (the Naatjes family) is responsible for covering the following expenses: the mailing list,
envelopes, printing/folding, postage and presentation materials. Total client expenses are likely to be less
than $500; the exact expense will vary depending upon the survey response rate.
Financial Responsibilities:

35
This study will commence with the client’s approval of the research objectives and statements contained
within the document. Survey mailings and result analysis will occur between February and March 2009.
Finally, the oral and written reports will be presented to the client before May 1st, 2009.
Team Approval:
_________________________ _________________________ Date: __________________
Client Approval:
_________________________ _________________________ Date: __________________

36
Schedules
Gantt Chart

37
Pert Chart

38
Weekly Status Reports
January 27-February 3, 2009
Our team met with our client on 2/1/2009 between 8 and 9:30 PM. We discussed our client’s information
needs, and we discussed the community segments that our research initiative will cover. We generated a
list of client information needs that will be utilized to generate a list of potential questions.
February 3, 2009-February 10, 2009
Our team did not meet in person this week, but we have conversed through e-mail and phone. We
arranged to meet with our client on Wednesday the 11th of February. We also finalized our client
proposal. All four team members are actively working on questions, and we will meet in a week in-order
to discuss those questions. We have also agreed to finalize the purchase of a marketing research list with
our client on Wednesday.
February 11, 2009-February 17, 2009
1. Our team met with the client on Wednesday, and the marketing proposal and data list were
discussed. The client has several questions about the data list regarding its scope and coverage.
We have been actively working on our Pert/Gantt charts and secondary research reports. Our
team will meet the night of the 18th to finalize both documents.
2. Tim, Scott, Ben and Andy have all worked on collecting articles for the secondary research
report. We have chosen to focus our efforts on collecting data regarding the strategies that
restaurants are employing to succeed in the current economic climate as well as information
regarding current drinking and dining choice of American consumers. The client is particularly
interested in understanding the importance of a wine and beer selection. Also our research will
focus on understanding ways that the client can differentiate their bistro through unique product
offerings.
3. We have reviewed the upcoming PERT/Gantt chart assignment, and Andy is responsible for
editing our PERT/Gantt charts.
4. Andy is also responsible for editing the secondary research report. All four team members have
contributed articles to the secondary research report. Andy has agreed to laminate and print both
charts. He will bring them to class.
5. Our next team meeting has not been scheduled, but Tim will schedule a meeting over the
weekend to discuss our questionnaires and cover letter.
6. No client meeting is currently established.
February 24, 2009-March 3, 2009
1. Our team met through phone and e-mail this week. Ben and Scott were in Florida, and Andy and
Tim were both very busy. We completed our survey, and Andy was responsible for compiling
and editing the questions that Andy, Tim, Ben and Scott created during the past several weeks.
The draft was tentatively approved by professor King over the weekend, and we plan to send the
document to our client on Wednesday for approval. Our cover letter is ready to send to professor
King for her approval, and we will then send it to our client. It is the least important element of
our survey package as it does not delay any of our other endeavors.
39
2. Our team has acquired a research list from USAData.com, and we plan to order a list on
Wednesday. This will likely be the duty of Ben or Scott. Ben paid $138.14 for the list, and the
client will give him a check when we next meet.
3. Our next team meeting is scheduled for this coming Wednesday, and we will prepare for our
meeting with professor King on Thursday.
4. We still need to order envelopes and fold our surveys and cover letters. We would like to mail
our survey early next week.
5. Tim, our team leader remains the primary client contact, and he continues to keep the client
updated regarding our team activities. The client appears satisfied, but she has trouble meeting
with us face to face since she has rarely been in Hillsdale.
6. No client meeting is currently established, but we remain in contact via phone and e-mail
March 3, 2009-March 10, 2009
1. The client meeting that was projected in the previous report for Wednesday occurred on Friday as
the client was unable to commit to an earlier time. This delayed our ordering surveys and the
cover letter until Monday.
2. Ben and Scott ordered envelopes for the initial mailing and for responses, and they will bring the
envelopes to our Wednesday meeting.
3. Our team met with our client this past Friday at 2:15 PM. The client examined and approved the
cover letter and questionnaire. The client expressed her satisfaction with the groups work, and
she agreed to look at her calendar to select a time to meet for the final presentation. During the
meeting, Tim talked to the client about the $500 estimated project budget and the possibility that
the mailings might run over budget, and she stated that she was willing to be flexible with the
budget, as she trusted the college to treat her fairly. The additional cost is a result of the
mandatory inclusion of request service on all envelopes.
4. We currently project a mailing date of March 11, 2009. If there are any delays with the orders,
Tim will be in town during break, and he will take care of them.
5. Our next team meeting is tentatively scheduled for Wednesday, March 11, 2009. At that time, we
plan to fill our envelopes and mail surveys in the afternoon.
6. No client meeting is currently established, but we remain in contact via phone and e-mail
March 10, 2009-March 23, 2009
1. Ben, Andy and Tim filled envelopes and sorted by zip code.
2. The mailroom shipped our mailings on Thursday March 12. Ben took care of taking the mailings
to the mailroom.
3. Tim agreed to check mailing results on March 17th before returning home.
4. Our entire team had a wonderful break!
5. As of Tuesday morning, our team has over 200 survey responses.
6. Our team plans to meet Tuesday March 23 to open and number mailing responses.
March 23, 2009-March 30, 2009
1. Our entire team had a wonderful break, and we are glad to be back at school.
2. As of March 30th, we have received over 300 survey responses. This response rate is significantly
higher than our projected rate of responses. We are happy to have such a large level of interest in
our survey, but the response rate has further pushed our project over budget.

40
3. Our team met on Wednesday the 25th to number surveys and tabulate results. We sorted survey
responses by income and other screening questions. Income appears to be our most reliable
screening question, and it is our plan to exclude incomes that are below $49,999.
4. Ben Turner took responsibility for creating our survey excel sheet. He completed the sheet on the
night of the 25th.
5. Ben, Scott, Andy and Tim have agreed to each add a quarter of the survey results into the
spreadsheet.
6. Tim is currently working with our client to arrange a time to present our findings from the survey.
March 30, 2009-April 7, 2009
1. Our team is in the process of compiling survey responses and performing analysis on our survey
responses. We have received a little less than 400 responses, and we are thinning response
through utilizing our screening questions to narrow down response.
2. This past week, we defined the statistical analysis that we will perform on each of our questions
and the type of data outputs that we would like to achieve.
3. Ben was responsible for compiling our statistical analysis procedure into a unified document.
Ben and Andy met and defined a format and discussed the manner in which research would be
conducted.
4. Andy took the responsibility of ensuring that ArrowSwift was paid back for BRE envelopes. On
Tuesday, he contacted the client and arranged for her to send a check to him in order to pay the
ArrowSwift bill.

41
Sample Cover Letter
March 10, 2009
Dear Respondent,
As students of Hillsdale College’s marketing research class, we are conducting a survey on
behalf of a French restaurant. The restaurant is interested in gaining a better understanding of
your satisfaction with the existing dining offerings of the community and your dining
preferences.
Enclosed is a short questionnaire asking various questions about fine dining. Please review the
questionnaire, respond to the questions and return it using the enclosed postage paid envelope by
Tuesday, March 31, 2009.
You were selected to be part of this study based on a sampling of community members.
Participation is important since your responses will be used to guide decisions of the restaurant.
Please be assured all information provided will remain anonymous.
If you have any questions or concerns about completing the questionnaire or participating in this
study, you may contact our project coordinator, Professor Susan King, at 517-607-2416.
Thank you in advance for your cooperation and assistance.
Sincerely,
Hillsdale College
Marketing Research Team

42
Sample Survey
QUESTIONNAIRE FOR NEW RESTAURANT
1. In a month, how often do you dine at fine dining restaurants? (Please select one)
(0-2) (3-4) (5-6) (7+)
2. How much per person, does your family generally spend at a fine restaurant ex. (steak or seafood)? (Please
select one)
(Less than $15) ($15-20) ($21-25) ($26-30) ($31+)
3. What distance are you willing to travel to eat at a fine restaurant? (Please select one)
(0-10 miles) (10-20 miles) (20-30 miles) (30+ miles)
4. What new fine dining options would you like to see in Hillsdale and Jonesville?
__________________________________________________________________
5. What fine dining restaurants do you enjoy eating at in Hillsdale and Jonesville? (Select all that apply)
Chicago Water Grill
Savarino's Restaurant
Hillsdale Golf and Country Club Dining Room
Other___________________
6. What is your favorite restaurant in Hillsdale and Jonesville?
__________________________________________________________________
7. When dining at a fine restaurant, do you generally eat (__) alone, (__) as a couple or (__) in groups?
(Please select one)
8. When are you likely to eat at a fine dining restaurant? (Select all that apply)
(Monday-Thursday) (Friday) (Saturday) (Sunday)
9. What time do you prefer to eat dinner out? (Please select one)
(Before 5 pm) 5-7 pm 7-9 pm 9-11 pm
10. When you eat out, how long do you generally eat dinner? (Please select one)
(Less than 1 hour) (1-1.5 hours) (1.5-2 hours) (2+ hours)
11. On a scale from 1 to 7, where 1 is “strongly unlikely” and 7 is “strongly likely,”; how likely would you be
to eat at a French restaurant, if one opened in the Hillsdale/Jonesville area? (Please circle only one number)
Strongly unlikely Neutral Strongly likely
1 2 3 4 5 6 7
12. On a scale from 1 to 7, where 1 is “strongly dissatisfied” and 7 is “strongly satisfied,”; are you satisfied
with the current fine dining options in Hillsdale and Jonesville? (Please circle only one number)
Strongly dissatisfied Neutral Strongly satisfied
1 2 3 4 5 6 7
13. Next, we would like to ask about your fine dining preferences. On a scale from 1 to 7, where 1 is “strongly
disagree” and 7 is “strongly agree,” please rate your response to the following statements. (Please circle one
number per question)

43
Strongly disagree Neutral
Strongly agree
Personalized service is important to me. 1 2 3 4
5 6 7
A wide selection of menu choices is important to me. 1 2 3 4
5 6 7
The use of local food and produce in my food is important to me. 1 2 3 4
5 6 7
Eating organic food is important to me. 1 2 3 4
5 6 7
I enjoy eating seafood. 1 2 3 4 5
6 7
I enjoy eating beef. 1 2 3 4
5 6 7
Please turn the page over →
I enjoy eating poultry 1 2 3 4
5 6 7
I like to dress well when I eat at fine restaurants 1 2 3 4
5 6 7
I would eat lunch at a French restaurant. 1 2 3 4
5 6 7
I would eat Sunday Brunch at a French restaurant. 1 2 3 4 5
6 7
I like to drink alcohol when dining out 1 2 3 4
5 6 7
I like to drink wine with dinner 1 2 3 4
5 6 7
I like to drink beer with dinner 1 2 3 4
5 6 7
I like to drink mixed drinks with dinner 1 2 3 4
5 6 7
The ambiance of a fine restaurant is important 1 2 3 4
5 6 7
I order alcoholic after dinner drinks. 1 2 3 4
5 6 7
I am familiar with French food. 1 2 3 4 5
6 7
I would attend wine tastings offered by a French restaurant 1 2 3 4 5
6 7

44
14. How many alcoholic drinks do you have during dinner at a fine restaurant? (Please select one)
(0) (1-2) (2-3) (3-4) (4+)
15. When at a fine restaurant, what is the price range that you are willing to pay for a glass of premium wine?
(Please select one) (Less than $3) ($3-5) ($6-10) ($10-12) ($13+)
16. When dining out, what is the price range that you are you willing to pay for a bottle of premium wine?
(Please select one) (Less than $15) ($15-20) ($21-30) ($31-40) ($41+)
17. Do you prefer a broader, more expensive selection of alcohols, or a more concentrated, less expensive
selection of alcohols? (Please select one)
(Broader, more expensive) (Concentrates, less expensive)
Now, we would like to ask a few demographic questions that will aid in the classification of your results. Please
keep in mind that your answers are anonymous, and that they will greatly assist this new restaurant as it
endeavors to succeed.
18. What is your gender?
(Male) (Female)
19. Where do you live?
(Hillsdale) (Jonesville)
(Other)___________
20. How far do you live from downtown
Hillsdale?
(0-10 miles) (11-20 miles) (21-30 miles)
(30+ miles)
21. What is your age range?
(Less than 18) (18-34) (35-49) (50-
64) (65+)
22. What is your employment Status?
Working Retired
Other____________________
23. What is your annual income?
$49,999 or less $50,000-99,999 $100,000-
149,999 $150,000-$199,999 $200,000 or
more
24. Is there anything else that you would like to tell us that would help a new restaurant opening in the
Hillsdale and Jonesville area?

45
Invoices

46
Receipts
Please see receipt copies contained in your companion survey binders.
Budget
Bistro Marketing Study Budget Item Cost Amount
Item Amount Total
Cost
BRE With Laser 1800 $210.820
Subtotal $210.820
Item Amount Total
Cost
Mailing List 1772 $138.640
Subtotal $138.640
Item Amount Total
Cost
Presentation
Materials N/A $28.500
Subtotal $28.500
Total Material Cost $377.960
Item Amount Total
Cost
Mailing Costs 1772 $122.040
Subtotal $122.040
Project Cost Billed $500.000
Budget $500.000

47
Invitation to Presentation
Tim Routzahn
Sent: Wednesday, April 30, 2009
To: [email protected];[email protected]
Dear Dr. Basterfield/Dr. Paas,
We are pleased to invite you to the presentation of our marketing research project regarding the restaurant patron’s
habits and possibility of the entry of a new French Bistro Restaurant in Hillsdale County. The presentation will be
held at 3 P.M on Friday, May 01, 2009 in room 335 on the third floor of Lane Hall at Hillsdale College. All other
Foundation staff and members of the Board of Trustees are welcome to attend. We look forward to seeing you on
Thursday.
Also, please let us know approximately how many people will be attending so we can be sure to have enough copies
of our report prepared.
If anyone needs directions, please let us know. We will have someone at the door of Lane Hall to direct everyone
upstairs to our presentation room.
Sincerely,
Hillsdale College
Marketing Research Team
Tim Routzahn
Andrew Throckmorton
Ben Turner
Scott Monterastelli

48
Thank-you Letter
May 1, 2009
Dear Mr. and Mrs. Naatjes,
We would like to thank you for allowing us to assist in doing research to see the possibility of
bringing a French Bistro into Hillsdale in its efforts to better understand the perceptions of the
likelihood to succeed. The ability for us to administer a survey on behalf of the Restaurant was
an excellent learning process giving us real-world experience that can be applied to our future
endeavors.
We hope that our research was insightful and that you will be able to use the new information to
continue on your business endeavor. By considering our recommendations and forming stronger
relationships with Hillsdale and Jonesville citizens, we hope the Bistro the best and success for
you and your family.
It was our pleasure to work with you and your husband this semester. Thank you again for
granting us the opportunity to learn and enrich our education by working closely with such an
important organization in Hillsdale County.
Sincerely,
Hillsdale College
Marketing Research Team
Tim Routzahn Andrew Throckmorton Ben Turner Scott Monterastelli

49
Returned Questionnaires
Please see companion binders that are included with your presentation.
PowerPoint Presentation Please see slide printouts that are included at the end of this document.


![Etiquettes on Fine Dining[1]](https://img.pdfslide.us/doc/110x75/577d257f1a28ab4e1e9ef05b/etiquettes-on-fine-dining1.jpg)