Embed Size (px)
Citation preview
CONSUMER FINANCIAL VULNERABILITY
CONSUMER FINANCIAL
VULNERABILITY:
TECHNICAL REPORT
European Credit Research Institute
and
Personal Finance Research Centre
Supported by Genworth Financial
June 2008
Understanding credit markets for Europe
EECC
RRII
uropean
redit
esearch
nstitute
EECC
RRII
uropean
redit
esearch
nstitute

The EUROPEAN CREDIT RESEARCH INSTITUTE (ECRI) is an independent research institution in Brussels,
which was established in 1999 for the study of banking and credit. ECRI focuses on institutional, economic and
political aspects related to retail finance and consumer protection in Europe, but also in non-European countries.
The institute provides expert analysis and academic research for a better understanding of the economic and
social impact of credit. We monitor markets and regulatory changes as well as their impact nationally and
internationally. The institute is a legal entity of the CENTRE FOR EUROPEAN POLICY STUDIES (CEPS). The
team at ECRI consisted of Nicola Jentzsch, Marc Rothemund, Filipa Figueira and Wolf Müller.
The PERSONAL FINANCE RESEARCH CENTRE (PFRC) at the UNIVERSITY OF BRISTOL was established in 1998
by Professor Elaine Kempson and has since gained a national and international reputation for policy-focused
research encompassing all areas of personal finance. PFRC has considerable expertise in designing, undertaking
and analysing both large-scale quantitative and in-depth qualitative research. It has conducted research for
government departments, trade associations, regulatory bodies, charities and the private sector. The work of the
centre has been influential in shaping policy, and several members of the centre act as technical and policy
advisers to government departments. The research team at PFRC included Professor Elaine Kempson, Adele
Atkinson and Andrea Finney.
GENWORTH FINANCIAL is a leading financial security company meeting the retirement, lifestyle protection,
investment and mortgage insurance needs of more than 15 million customers across 25 countries. In Europe,
Genworth Financial partners with banks, brokers, advisers and other financial institutions to develop mortgage
insurance, payment protection insurance and other products to suit local markets.
ACKNOWLEDGEMENTS
This research would not have been possible without the independent research grant committed by GENWORTH
FINANCIAL to conduct this work. The authors are grateful that GENWORTH FINANCIAL actively supports
independent research in the new area of consumer financial vulnerability.
The authors gratefully acknowledge the contributions of the country experts: for Denmark, the University of
Copenhagen; for Ireland, the National Institute for Regional and Spatial Analysis; for Italy and Spain, the
University of Milan; for Norway, the National Institute of Consumer Research; for Sweden, the MidSweden
University. The list of country experts is given in Appendix 1.
EUROPEAN CREDIT
RESEARCH INSTITUTE (ECRI) Place du Congrés 1
B-1000 Brussels, Belgium
Tel.: +32-2-2293911
Fax: +32-2-2194151
Email: [email protected]
Web: www.ecri.eu
© Copyright 2008, European Credit Research Institute
All rights reserved. No part of this publication may be reproduced, stored in a retrieval system or transmitted in any form or
by any means – electronic, mechanical, photocopying, recording or otherwise – without the prior permission of the European
Credit Research Institute. This report does not reflect the opinion of any institution or member associated with ECRI.
CONSUMER FINANCIAL VULNERABILITY
CONTENTS
I. INTRODUCTION ________________________________________________________ 1
II. LITERATURE REVIEW ___________________________________________________ 1
2.1 ECONOMIC THEORY OF HOUSEHOLD INDEBTEDNESS________________________ 2
2.2 BEHAVIOURAL ECONOMICS AND CONSUMER PSYCHOLOGY __________________ 3
2.3 RESEARCH ON CONSUMER FINANCE AND REPAYMENT PROBLEMS _____________ 5
2.4 RESEARCH ON CREDITWORTHINESS_____________________________________ 8
III. EXISTING INDICES: AN OVERVIEW _______________________________________ 10
3.1 EUROPEAN INDICES ________________________________________________ 10
3.1.1 EU STATISTICS ON INCOME AND LIVING CONDITIONS________________ 10
3.1.2 EUROPEAN SYSTEM OF CENTRAL BANKS__________________________ 11
3.2 RESEARCH AND INDICES IN INDIVIDUAL COUNTRIES _______________________ 12
IV. INITIAL DATA EXPLORATION AND DESCRIPTION ____________________________ 14
4.1 INTRODUCTION TO DATA EXPLORATION ________________________________ 14
4.2 SAMPLE CONSIDERATIONS AND NON-RESPONSES _________________________ 15
V. RESULTS AND CONCLUSIONS ____________________________________________ 34
REFERENCES______________________________________________________________ 38
APPENDIX 1. LIST OF COUNTRY EXPERTS ______________________________________ 41
APPENDIX 2. MODULE FOR IPSOS MORI ________________________________________ 42
APPENDIX 3. TABLES _______________________________________________________ 47
CONSUMER FINANCIAL VULNERABILITY
List of Abbreviations
AT Austria
BE Belgium
DK Denmark
ECRI European Credit Research Institute
ECHP European Community Household Panel
EE Estonia
EL Greece
ES Spain
ESS European Statistical System
EU-SILC EU Statistics on Income and Living Conditions
FI Finland
FR France
GW Genworth Financial
HRP Household Reference Person
IE Ireland
IS Iceland
IT Italy
KMO Kaiser-Meyer-Olkin statistic
LU Luxembourg
NO Norway
PCA Principal components analysis
PDI Personal disposable income
PT Portugal
PFRC Personal Finance Research Centre
RO Romania
SE Sweden
TR Turkey

1
I. INTRODUCTION
Consumer financial vulnerability – the personal feeling of being in a financially unstable
situation – is one of the early indicators of financial stress in households. A number of factors
can lead to perceptions of vulnerability, such as a darkening economic outlook, expected
wage cuts or an increasing risk of unemployment. This topic has been the focus of greater
interest in Europe over the past few years, leading to efforts by the European Commission to
find a common definition of over-indebtedness.
The European Credit Research Institute (ECRI) and the Personal Finance Research Centre
(PFRC) have conducted research on the development and construction of a Consumer
Financial Vulnerability Index, supported through a grant by Genworth Financial. In addition,
we have worked together with expert institutions (listed in appendix 1) in each of the 10
European countries covered by the survey. The countries selected for the survey were chosen
by Genworth Financial, primarily as a reflection of their market activities.
In this report, we provide an in-depth description of the research methodology and approach
taken to developing the index. The report also discusses the technical matters behind the new
index. The companion report, European Trends in Consumer Financial Vulnerability
(European Credit Research Institue and Personal Finance Research Centre, 2008) discusses
the survey results and puts them into the context of general economic developments in the
countries covered. We begin with a review of the literature (section II) that forms the general
background for the Index. This section additionally includes a discussion of the latest research
on household indebtedness, behavioural economics and consumer psychology as well as
consumer finance and repayment problems. These research areas overlap, and the Index is
located at the intersection of these topics.
Section III presents an overview of existing indices, with a view to verifying that we have
avoided duplicating information that might already exist at the European level. The overview
confirms that so far, an index similar to the Index has not been calculated based on
representative polling in the countries covered in this study. There is, however, academic
research for some individual countries, where comparable questions have been used to map
out financial problems. We discuss this research where it is relevant.
Section IV discusses the initial exploratory analysis of the survey data, which has informed
the development of the Index. The aim of this discussion is to provide the greatest
transparency possible for those parties interested in the technical aspects of how the index has
been constructed (and for replication). We then present the final index construction
methodology and the initial results of the index in section V.
II. LITERATURE REVIEW
The main purpose of the Index is to identify those households in financially fragile situations.
The theoretical background is provided by the literature on economic psychology. This
section seeks to highlight the concepts that already exist and how the different economic or
psychological factors relate to each other. The literature discussion takes into account
research in the field of consumer finance, consumer psychology and perceptions about
personal finances. Furthermore, the review covers the latest research on economic psychology
as well as papers about creditworthiness analysis (scoring) as far as they are relevant for
understanding consumer financial vulnerabilities.
CONSUMER FINANCIAL VULNERABILITY
2
2.1 ECONOMIC THEORY OF HOUSEHOLD INDEBTEDNESS
Borrowing decisions are made by consumers individually or jointly within households. In
microeconomic theory, such decisions are modelled along with saving or consumption. There
are two theories that explain individual or household behaviour, the life-cycle hypothesis and
the permanent income hypothesis. According to the former, households maximise utility by
conducting consumption smoothing, that is by maintaining approximately the same level of
consumption throughout their lives.
Life-cycle and Permanent Income Hypothesis
Saving and borrowing are consumption-smoothing mechanisms: households borrow when
their income is lower and save when their income is higher (Modigliani & Brumberg, 1954).
Credit is used as a mechanism to transfer consumption intertemporally from periods of higher
income to those with lower income, with the household borrowing in the latter (Ando &
Modigliani, 1963). The behavioural life-cycle hypothesis maintains that individuals
psychologically sort their assets into categories such as belonging to current or future income
or current or future wealth (Shefrin & Thaler, 1988). Such accounting influences consumer
behaviour significantly and affects credit or insurance decisions.1
Another concept related to the life-cycle theory is the permanent income hypothesis. The
household financial situation is reflected in the household balance sheet – that is, the balance
of income and expenditure. Friedman (1957) suggests that individuals base their consumption
on what they perceive as “permanent income”: the income that they expect to earn on average
throughout their lives. The hypothesis holds that consumption expenditure is not determined
by current income but rather by the long-term income expectations (permanent income) of
households. Consumers are willing to maintain a level of consumption related to permanent
income and less inclined to do so based on fluctuations in their current income stream.
One of the concerns of this study is how households manage to balance their inflows and
outflows of money by saving or by taking credit. These decisions are made intertemporally
and are sometimes subject to unexpected shocks (sudden increases or decreases in flows).
Such shocks can provoke a sense of financial vulnerability, such that a household becomes
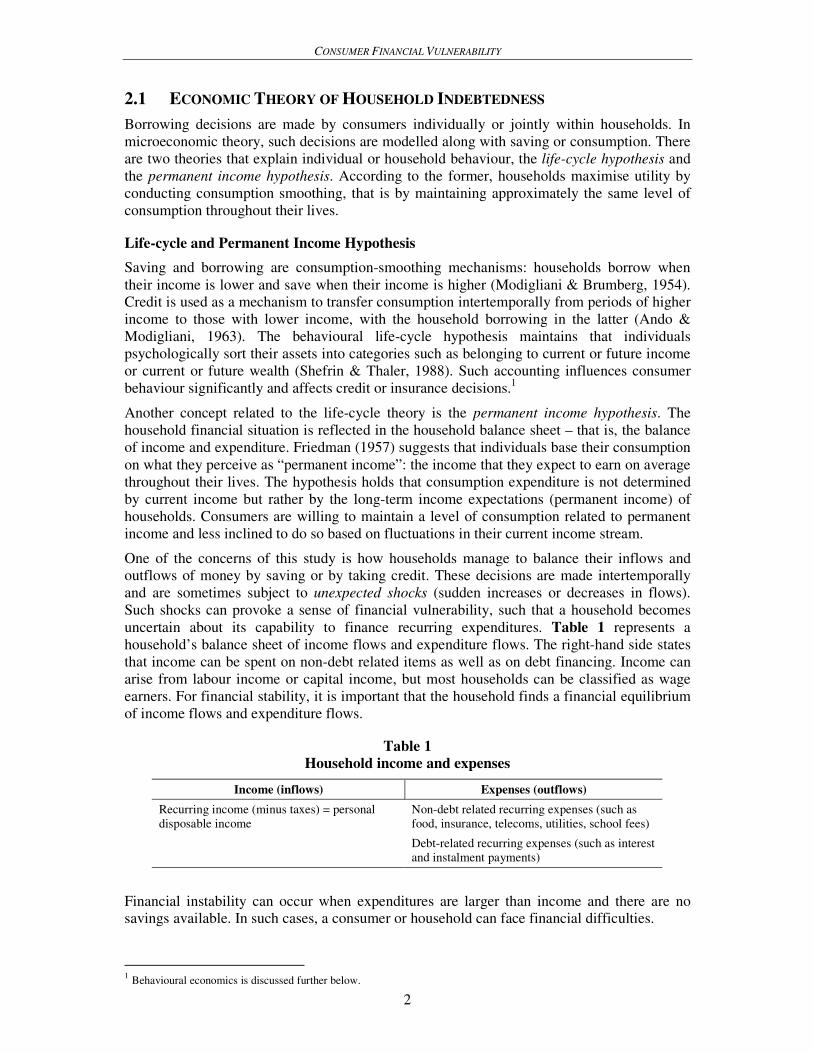
uncertain about its capability to finance recurring expenditures. Table 1 represents a
household’s balance sheet of income flows and expenditure flows. The right-hand side states
that income can be spent on non-debt related items as well as on debt financing. Income can
arise from labour income or capital income, but most households can be classified as wage
earners. For financial stability, it is important that the household finds a financial equilibrium
of income flows and expenditure flows.
Table 1
Household income and expenses
Income (inflows) Expenses (outflows)
Recurring income (minus taxes) = personal
disposable income Non-debt related recurring expenses (such as
food, insurance, telecoms, utilities, school fees)
Debt-related recurring expenses (such as interest
and instalment payments)
Financial instability can occur when expenditures are larger than income and there are no
savings available. In such cases, a consumer or household can face financial difficulties.
1 Behavioural economics is discussed further below.
CONSUMER FINANCIAL VULNERABILITY
3
The next subsection gives an overview of intertemporal decision theory. Consumer choices
are in many cases intertemporal: consumers take the future into account and have
expectations about income and expenditures. In economic theory, however, welfare can be
maximised by smoothing across time periods if there are possibilities of savings and credit.
Intertemporal Consumption Choices
Decisions to save or to take credit are in fact decisions on how to manage money over several
time periods (days, months and years). When households take credit for the purchase of
goods, they decide to consume immediately and to spend future income, as credit has to be
paid back in future. Conversely, when a household saves, the decision is to postpone
consumption to some future period and that consumption will be financed out of money
earned today. This is briefly set out below in a formal way. Typically, a rational consumer is
expected to maximise utility given some budget constraint. Based on this, consumers decide
on spending and saving or ‘dissaving’ (obtaining credit). The utility U of consumers depends
on their current consumption C0 and on future consumption C1 (we disregard savings here).
Individuals need to decide how to spend their income Y : either on current or on future
consumption. The funds set aside for future consumption are not spent immediately, and
therefore can be invested to earn interest. The ‘present value’ of the income (which is the
‘intertemporal budget constraint’), is
Y = C0 +1
1+ r
C1 (1)
In equation (1), 1
1+ r
is a discount factor, which accounts for the present value of some future
amount of money (so-called ‘net present value’), where r is the discount rate. By discounting,
one reduces an expected future sum to its present value. If the possibility to take credit is
introduced, the equation becomes
Y = C0 +1
1+ r
C1 + C0
b−
1
1+ r
C1
b (2)
In equation (2), C0
b represents the amount borrowed in the current period and C1
b in the future
period. The amount C0
b increases consumption now, but it decreases future consumption by
the same amount plus a discount rate. By borrowing, the person can consume more now, but
less in the future. This shows that consumers can use the possibilities to save and to borrow to
make the most of their budget. But as with all models, theory sometimes fails, especially
when it is based on the rationality axiom, therefore we also consider behavioural economics
as discussed below.
2.2 BEHAVIOURAL ECONOMICS AND CONSUMER PSYCHOLOGY
This section reviews literature on consumer psychology and behavioural economics. As
described above, there is a body of theory with standard assumptions, but there are also new
theoretical works that shed some light on possible sources of financial instability. In the
standard microeconomic theory, consumers rationally maximise utility under budget
constraints. These stylised assumptions are often breached in reality. These breaches might
stem from psychological patterns inherent in consumers. This aspect is important for the
construction of the Index (as consumers are asked for their perceptions). Thus, in this
discussion the consumer is the centre of focus
CONSUMER FINANCIAL VULNERABILITY
4
There are a number of explanations that help to illuminate consumers’ decisions on financial
matters and the potential for becoming over-committed. There can be biases in the choices
made about credit or repayment insurance. Of course, there might also be misinformation by
lenders or abusive business practices.
Behavioural economics holds that judgment is the process whereby individuals estimate
probabilities for occurrences of events (Camerer & Loewenstein, 2002). Assumptions about
the future influence present behaviour, for instance, the expectation of a drop in income will
have an influence on whether a consumer is inclined to become indebted.2 The prospect
theory of Kahneman & Tversky (1979) is seen as an important landmark of behavioural
economics. It is considered the alternative assumption to the expected utility hypothesis. In
the latter, the consumer assigns objective mathematical probabilities to events. Kahneman &
Tversky state that people value gains and losses. “Utility depends on a reference point that
partitions outcomes into gains and losses” (Pesendorfer, 2006, p. 714). For utility, the overall
level of achievable welfare is less important compared with whether it is perceived as a gain
or loss.
At the same time, the theory also explains loss aversion: “The disutility of a loss of x is worse
than the utility of an equal-sized gain of x” (Camerer & Loewenstein, 2002, p. 23). In theory,
the value function is a replacement for the expected utility function.3 There is an asymmetry
between decisions to acquire or to keep resources. Loss aversion is stronger when emotions
play a role. For instance, a loan might bear the risk of losing the purchased house in case of
repayment difficulties; therefore, the consumer will be more inclined to obtain payment
protection.
Subjective beliefs are especially important when analysing demand for credit or insurance.
Consumers will estimate the probability of an event that negatively impinges on their
repayment ability. If a negative impact is considered likely, the propensity to purchase
repayment insurance will increase.
Cognitive economics explains that adding information up to a critical point increases human
performance, but further additions decrease it, because information overload results (Davis &
Olson, 1985; Paredes, 2003). In insurance or credit transactions, consumers might not read
the policy or contractual terms, or lenders may bury important clauses in loads of text in small
print. This lack of information can lead to repayment problems later on. Consumers’
decisions may also be blurred by remembering certain things that influence their thinking
about how likely certain events are to occur (Raynard, 2006). For instance, if a consumer has
been in arrears on a loan before, there might be an overestimation of the probability that this
will happen again in the near future, because this is what the consumer remembers.
A lack of information also exists on the side of creditors/insurers, which can lead to
distortions in the market: typically, a creditor has less information than the consumer does
about that consumer’s repayment capabilities. Although there are a number of remedies
against information asymmetries such as guarantees, screening and monitoring, the lender
will have to make decisions based on incomplete information. Creditors cannot predict
unexpected life events that negatively affect the repayment ability of consumers. For instance,
unemployment, divorce or illness can represent sudden income drops or expenditure rises.
Asymmetric information in credit markets leads to credit rationing or pooling, among other
problems. Literature on this subject, however, is not discussed in greater detail here, as
psychological biases in credit decisions are of primary interest (for a detailed discussion of
credit rationing literature, see Jentzsch, 2007).
2 The classical assumption in economics is that consumers act like so-called ‘Bayesian updaters’, meaning that they are
assumed to revise/update beliefs based on probability theory. This point is important for economic modelling. 3 In this function, the value of the outcome of an event is multiplied by the probability of its occurrence.
CONSUMER FINANCIAL VULNERABILITY
5
Insights from experimental economics help to clarify why biases exist if choices are made
under uncertainty. Standard intertemporal choice assumes that it does not matter at which
point in time a decision is made, if the outcome is the same, the utility derived will be the
same. Dynamic decision theory modifies this simple assumption, stating that future utilities
derived from the outcome are discounted with an exponentially declining factor. This means
that some individuals tend to be impatient and choose earlier, smaller rewards that can be
consumed immediately over later, larger rewards (the so-called ‘immediacy effect’). This
preference is called hyperbolic discounting. Some credit products (such as credit cards)
support and facilitate impulse purchases. The impatience behind sudden consumption choices
(unplanned expenditures) can later lead to over-indebtedness.
To cope with risk/complexity in uncertain situations, individuals employ heuristics: simple
rules of thumb rather than assumptions about the true statistical distribution of occurrences.
For instance, whether a consumer purchases repayment insurance depends on his/her
perceptions of the likelihood of repayment difficulties. Heuristics are mental shortcuts for
deriving quick decisions in complex situations.
2.3 RESEARCH ON CONSUMER FINANCE AND REPAYMENT PROBLEMS
The studies presented below examine problems related to consumer credit, mortgages, rent
and utility bills, as well as indebtedness and financial difficulties. There is no general
applicable definition of terms such as over-indebtedness, repayment problems, financial
vulnerability or fragility. For instance, some authors use the term ‘over-indebtedness’ in
relation to those who have large amounts of secured or unsecured credit relative to income
(Betti et al., 2001). Others use the term not only concerning individuals who face payment
difficulties on their secured and unsecured credit, but also on other recurring expenses such as
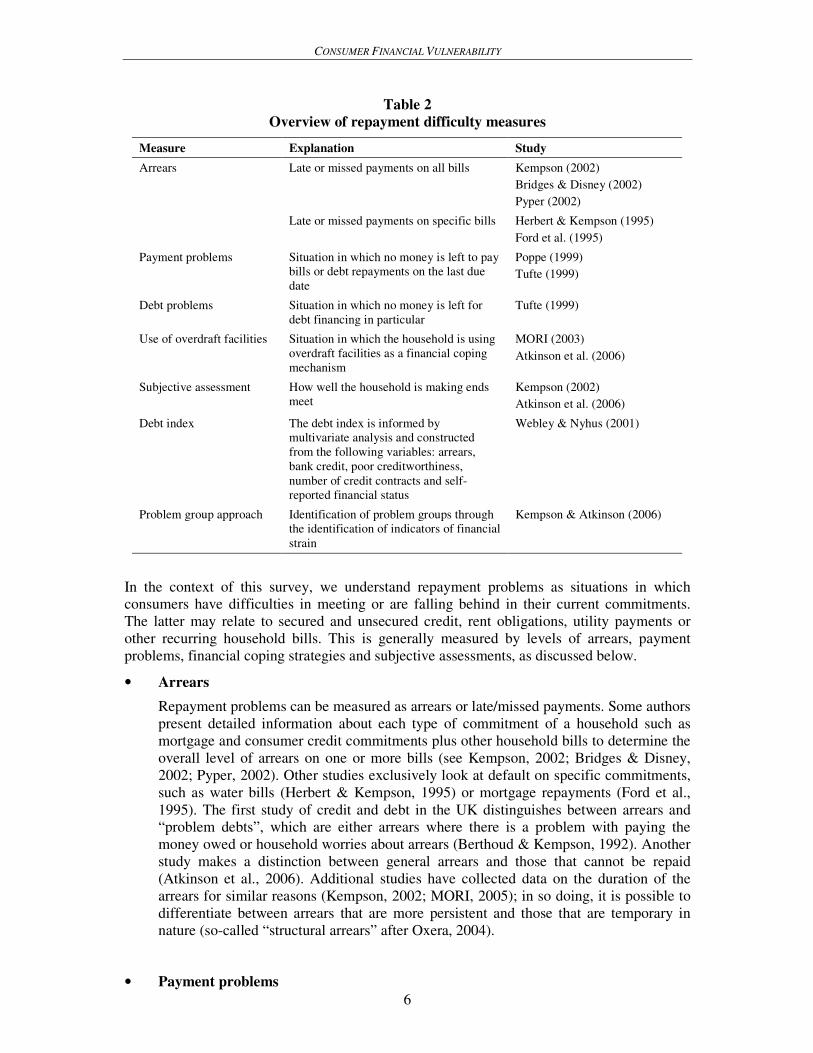
household bills (Gloukoviezoff, 2006; Kempson, 2002; Poppe, 1999). An overview of
measures is represented in Table 2.
CONSUMER FINANCIAL VULNERABILITY
6
Table 2
Overview of repayment difficulty measures
Measure Explanation Study
Arrears Late or missed payments on all bills Kempson (2002)
Bridges & Disney (2002)
Pyper (2002)
Late or missed payments on specific bills Herbert & Kempson (1995)
Ford et al. (1995)
Payment problems Situation in which no money is left to pay
bills or debt repayments on the last due
date
Poppe (1999)
Tufte (1999)
Debt problems Situation in which no money is left for
debt financing in particular
Tufte (1999)
Use of overdraft facilities Situation in which the household is using
overdraft facilities as a financial coping
mechanism
MORI (2003)
Atkinson et al. (2006)
Subjective assessment How well the household is making ends
meet
Kempson (2002)
Atkinson et al. (2006)
Debt index The debt index is informed by
multivariate analysis and constructed
from the following variables: arrears,
bank credit, poor creditworthiness,
number of credit contracts and self-
reported financial status
Webley & Nyhus (2001)
Problem group approach Identification of problem groups through
the identification of indicators of financial
strain
Kempson & Atkinson (2006)
In the context of this survey, we understand repayment problems as situations in which
consumers have difficulties in meeting or are falling behind in their current commitments.
The latter may relate to secured and unsecured credit, rent obligations, utility payments or
other recurring household bills. This is generally measured by levels of arrears, payment
problems, financial coping strategies and subjective assessments, as discussed below.
• Arrears
Repayment problems can be measured as arrears or late/missed payments. Some authors
present detailed information about each type of commitment of a household such as
mortgage and consumer credit commitments plus other household bills to determine the
overall level of arrears on one or more bills (see Kempson, 2002; Bridges & Disney,
2002; Pyper, 2002). Other studies exclusively look at default on specific commitments,
such as water bills (Herbert & Kempson, 1995) or mortgage repayments (Ford et al.,
1995). The first study of credit and debt in the UK distinguishes between arrears and
“problem debts”, which are either arrears where there is a problem with paying the
money owed or household worries about arrears (Berthoud & Kempson, 1992). Another
study makes a distinction between general arrears and those that cannot be repaid
(Atkinson et al., 2006). Additional studies have collected data on the duration of the
arrears for similar reasons (Kempson, 2002; MORI, 2005); in so doing, it is possible to
differentiate between arrears that are more persistent and those that are temporary in
nature (so-called “structural arrears” after Oxera, 2004).
• Payment problems
CONSUMER FINANCIAL VULNERABILITY
7
Studies in Norway have used the term ‘payment problems’ to refer to situations in
which a household often or very often has no money left to pay bills or debt repayments
on the last due date (e.g. Poppe, 1999; Tufte, 1999). Under this heading, ‘debt
problems’ are further distinguished by examining just those payment difficulties that
relate to servicing and repaying credit (Tufte, 1999). This definition is closely related to
that for ‘arrears’, because individuals with payment problems fall into arrears.
Nevertheless, this description of arrears is not based on detailed interrogation into the
status of individual bills as described in relation to the arrears measures above, and is
consequently more subjective and less quantifiable in nature.
• Financial coping strategies
Some studies have referred to the use of overdraft facilities as a coping mechanism for
households under financial stress which are constantly in overdraft as an objective
measure (for instance, MORI, 2003; Atkinson et al., 2006). In general, households can
use different strategies to cope with financial strain. In Atkinson et al. (2006), the
measure is the use of the extended facilities on credit cards to pay for everyday living
expenses and for drawing cash. Others have looked at the need to take out additional
credit in order to pay off debts (e.g. Kempson, 2002).
• Subjective judgments
Several studies ask respondents how well the household is making “ends meet” (e.g.
Kempson, 2002; Atkinson et al., 2006), meaning to manage expenses such that they do
not surpass budget constraints. Other subjective measures include a self-assessment of
financial difficulties, such as comparing the current situation with that 12 months ago
and the extent to which the household runs short of money before the next payday
(Kempson, 2002) along with how well households can cover bills and other
commitments without difficulties (Atkinson et al., 2006).
• Combined measures
Some studies employ a mix of objective and subjective measures to examine the
problem of over-indebtedness (e.g. Kempson, 2002). Others have used batteries of
measures examined in multivariate analysis to identify distinct groups that are defined
by the combined answers to the various measures. One study in the Netherlands uses a
debt index informed by multivariate analysis (non-metric multidimensional scaling)
constructed from being in arrears, having bank credit, poor creditworthiness, the number
of credit arrangements and self-reported financial status (Webley & Nyhus, 2001). A
recent UK study uses cluster analysis to identify different groups of persons based on
their responses to three indicators of financial strain. These indicators are respondents’
own assessments of how well they are managing to make ends meet, the frequency of
being overdrawn on a current account and the frequency of using the extended facilities
on credit cards to meet daily living expenses (Kempson & Atkinson, 2006).
Still other surveys explore a variety of questions. For instance, Livingstone & Lunt
(1992) investigate which consumers fall into debt, why some borrow more than others
and the determinants of how far they slide into debt. We only briefly review the results
of the first two questions. The authors use discriminant analysis, a statistical technique
to identify those variables that best differentiate groups of borrowers. The sample is
made up of 279 residents in the Oxford area. The amount of a person’s debt is
significantly associated with disposable income, the number of loans, his/her social
class and psychological variables such as a belief that credit is useful. Individuals who
CONSUMER FINANCIAL VULNERABILITY
8
borrow more also display a greater external locus of control (that is, the attitude that
events in life depend on outside circumstances).4
• Financial expectations
Brown et al. (2003) explore expectation-based determinants of debt and growth in debt.
Theory holds that there is a positive association between debt amount and optimism:
optimistic households will take up more debt. The authors use the 1995 and 2000 waves
of the British Household Panel Survey, which is a random sample of more than 5,000
private households interviewed in successive waves. The survey contains information
about unsecured and secured credit and about individual’s expectations concerning their
financial future. The determinants of debt are estimated using a random effects Tobin
model and by including a vector of personal characteristics.5 Significant effects with
varying impact can be found for marital status, income, second job and promotion
opportunities in the future. For individuals, the authors also find a positive effect of
optimism on the amount of debt.
Optimistic individuals with otherwise average features incur double the amount of debt.
The authors state that debt is primarily determined through individual decisions rather
than household-level decisions. Also, when heads of households are considered,
optimism has a positive impact. Indebtedness grows with optimism.
The study additionally assesses the impact of optimism and pessimism on debt amount
and growth. The authors construct a measure of expectations by counting how often
individuals note optimism over a period of six months. The analysis shows that the more
optimistic a person is, the more indebted s/he becomes.
2.4 RESEARCH ON CREDITWORTHINESS
Creditworthiness analysis (scoring) is the name given to statistical procedures used to
estimate the risk of default or delinquencies of consumers (not households). In this section,
we draw upon Jentzsch (2007) among others. Scoring models take several predictors of credit
risk (payment history, number and types of accounts, late payments and collections, etc.) and
relate them to variables that define credit risk. The purpose is to predict the likelihood of a
default or delinquency by a consumer. If being in financial difficulty or stress is defined as
delinquency (being late on paying bills), then the model predicts difficulty. To derive a credit
score, the system awards points for each factor to predict the likelihood of delinquencies.
These points are added to gain a score, with higher scores representing lower risk.
There are different methods available for the estimation of credit risk such as regression
analysis, recursive partitioning algorithms (classification trees) and neural networks. These
are not discussed here as they have been elaborated upon elsewhere (Crook, Edelman &
Thomas, 2002; Fair Isaac, 2003; Thomas, 2000). Credit scoring models are proprietary and
are not disclosed by banks, finance companies, scoring companies or credit reporting agencies
that build or use such models.
The industry typically uses three different types of classifications: good credit risks (never in
arrears), indeterminate risks (late one to two months) and bad credit risks (missed payments
for three or more months). Hand & Henley (1997, p. 527) describe the typical characteristics
that are included in a scoring model (presented in a shortened, modified version in Table 3).
Models vary in the range of variables they use. For instance, far more information will be
requested from an applicant seeking a €500,000 mortgage compared with someone who
4 The problem with this survey is that the sample size is very small. The analytical model includes a high number of variables
considering the sample size, such that estimates of the regression could be unstable. 5 The Tobin model is used because debt is a censored variable.
CONSUMER FINANCIAL VULNERABILITY
9
wants to finance a car. Although commercial models are not available and researchers usually
have problems obtaining commercial data, some companies explain which of the variables are
most important. The US firm Fair Isaac explains that its score is driven by the following five
factors (contributions in percentages):
� Amounts owed (30%)
� Length of credit history (15%)
� New credit (10%)
� Types of credit used (10%) and
� Payment history (35%)
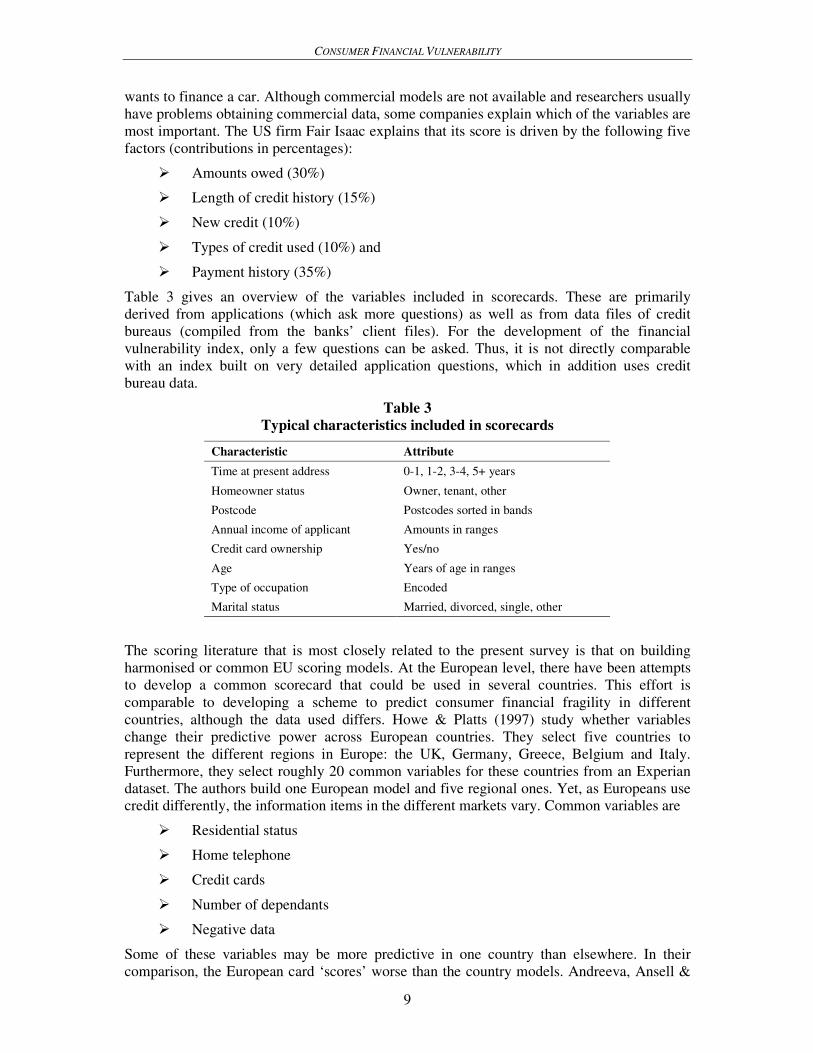
Table 3 gives an overview of the variables included in scorecards. These are primarily
derived from applications (which ask more questions) as well as from data files of credit
bureaus (compiled from the banks’ client files). For the development of the financial
vulnerability index, only a few questions can be asked. Thus, it is not directly comparable
with an index built on very detailed application questions, which in addition uses credit
bureau data.
Table 3
Typical characteristics included in scorecards
Characteristic Attribute
Time at present address 0-1, 1-2, 3-4, 5+ years
Homeowner status Owner, tenant, other
Postcode Postcodes sorted in bands
Annual income of applicant Amounts in ranges
Credit card ownership Yes/no
Age Years of age in ranges
Type of occupation Encoded
Marital status Married, divorced, single, other
The scoring literature that is most closely related to the present survey is that on building
harmonised or common EU scoring models. At the European level, there have been attempts
to develop a common scorecard that could be used in several countries. This effort is
comparable to developing a scheme to predict consumer financial fragility in different
countries, although the data used differs. Howe & Platts (1997) study whether variables
change their predictive power across European countries. They select five countries to
represent the different regions in Europe: the UK, Germany, Greece, Belgium and Italy.
Furthermore, they select roughly 20 common variables for these countries from an Experian
dataset. The authors build one European model and five regional ones. Yet, as Europeans use
credit differently, the information items in the different markets vary. Common variables are
� Residential status
� Home telephone
� Credit cards
� Number of dependants
� Negative data
Some of these variables may be more predictive in one country than elsewhere. In their
comparison, the European card ‘scores’ worse than the country models. Andreeva, Ansell &
CONSUMER FINANCIAL VULNERABILITY
10
Crook (2003, p. 7) use 16 common variables to predict the credit risk of consumers in three
countries: Belgium, Germany and the Netherlands. They show that there is only a minor loss
of prediction quality compared with national models. Note that these authors are able to use
more variables than are possible for the consumer financial vulnerability index. The authors
conclude that generic scoring is a viable option if the data are harmonised among the
countries.
One problem is that such choices are intertemporal and consumers might not accurately
predict the future. Therefore, to measure consumer financial vulnerability, an index should
possibly combine questions related to the present situation as well as the future.
III. EXISTING INDICES: AN OVERVIEW
3.1 EUROPEAN INDICES
This section provides a brief summary of indices that exist at the international and national
levels in Europe, to verify that the index developed as part of this research does not duplicate
existing indicators. From this review, it can be ascertained that there are indices that identify
consumer confidence and household financial situations (in terms of earnings), but there are
no indices that directly map consumer financial vulnerability, with national research
excluded. In some of the surveys, there are questions about the current financial situations of
consumers and whether they can make ends meet (i.e. some of the questions used in our
survey).
3.1.1 EU Statistics on Income and Living Conditions
There are intensified efforts at the European level to develop social indicators that track
poverty, deprivation and over-indebtedness. These initiatives are described below as they are
closely related to our research. In 1999, the European Directors of Social Statistics decided to
replace the European Community Household Panel (ECHP) with a new collection of
modules.
At a summit in 2001, the heads of state of European countries decided to collect indicators for
measuring social exclusion and poverty. These indicators involve micro data on income,
poverty, social exclusion and living conditions. They play a major role in the measurement
and design of policies to reduce poverty in the EU member states. The EU Statistics on
Income and Living Conditions (EU-SILC) was launched in 2003–04 with some countries
having longer implementation periods.6 EU-SILC is embedded in the European Statistical
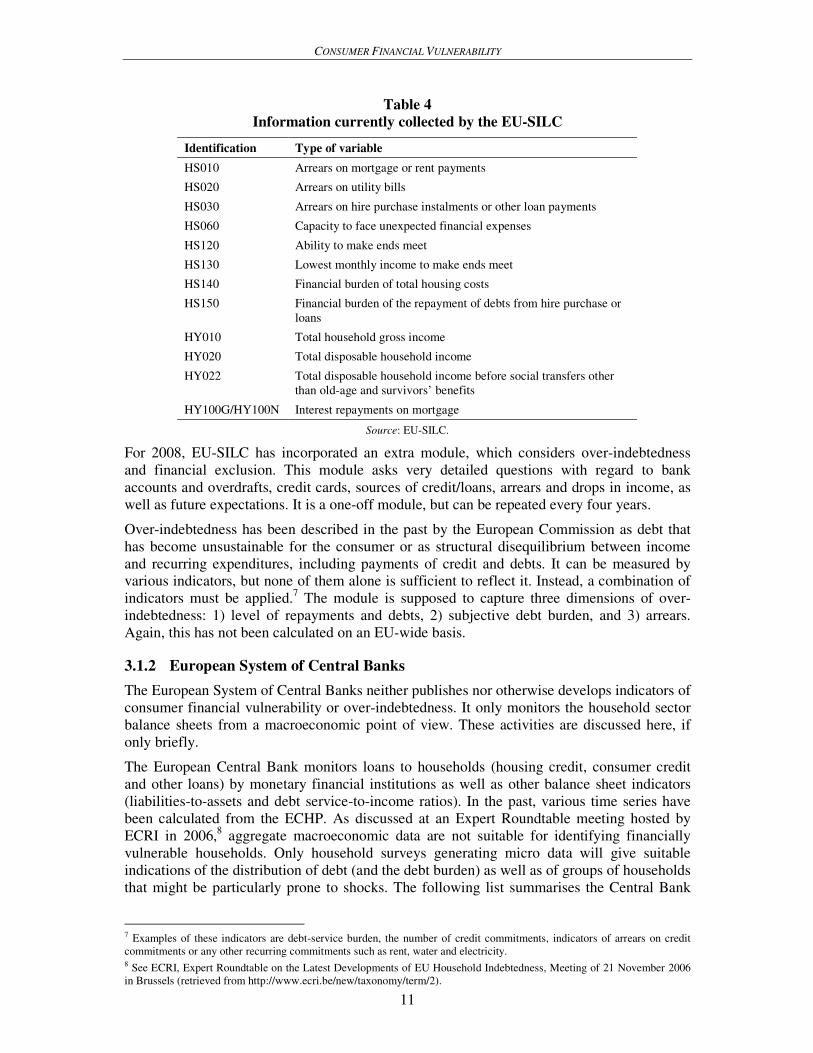
System (ESS) and is a representative annual panel survey. Table 4 gives an indication of the
core areas covered.
Some of the questions can be classified as factual questions, such as HS010 (whether the
household has been in arrears over the past 12 months), whereas others are founded more on
perceptions (such as the ability to make ends meet). Different researchers have taken replies
to these questions as indications of over-indebtedness in individual countries (as discussed in
the section on national indicators).
6 EU-SILC was launched in 2004 in 13 EU member states (BE, DK, EE, EL, ES, FR, IE, IT, LU, AT, PT, FI and SE) and in
NO and IS. EU-SILC reached its full-scale extension in the 25 member states plus NO and IS in 2005. Later it will include
TR and RO, among others.
CONSUMER FINANCIAL VULNERABILITY
11
Table 4
Information currently collected by the EU-SILC
Identification Type of variable
HS010 Arrears on mortgage or rent payments
HS020 Arrears on utility bills
HS030 Arrears on hire purchase instalments or other loan payments
HS060 Capacity to face unexpected financial expenses
HS120 Ability to make ends meet
HS130 Lowest monthly income to make ends meet
HS140 Financial burden of total housing costs
HS150 Financial burden of the repayment of debts from hire purchase or
loans
HY010 Total household gross income
HY020 Total disposable household income
HY022 Total disposable household income before social transfers other
than old-age and survivors’ benefits
HY100G/HY100N Interest repayments on mortgage
Source: EU-SILC.
For 2008, EU-SILC has incorporated an extra module, which considers over-indebtedness
and financial exclusion. This module asks very detailed questions with regard to bank
accounts and overdrafts, credit cards, sources of credit/loans, arrears and drops in income, as
well as future expectations. It is a one-off module, but can be repeated every four years.
Over-indebtedness has been described in the past by the European Commission as debt that
has become unsustainable for the consumer or as structural disequilibrium between income
and recurring expenditures, including payments of credit and debts. It can be measured by
various indicators, but none of them alone is sufficient to reflect it. Instead, a combination of
indicators must be applied.7 The module is supposed to capture three dimensions of over-
indebtedness: 1) level of repayments and debts, 2) subjective debt burden, and 3) arrears.
Again, this has not been calculated on an EU-wide basis.
3.1.2 European System of Central Banks
The European System of Central Banks neither publishes nor otherwise develops indicators of
consumer financial vulnerability or over-indebtedness. It only monitors the household sector
balance sheets from a macroeconomic point of view. These activities are discussed here, if
only briefly.
The European Central Bank monitors loans to households (housing credit, consumer credit
and other loans) by monetary financial institutions as well as other balance sheet indicators
(liabilities-to-assets and debt service-to-income ratios). In the past, various time series have
been calculated from the ECHP. As discussed at an Expert Roundtable meeting hosted by
ECRI in 2006,8 aggregate macroeconomic data are not suitable for identifying financially
vulnerable households. Only household surveys generating micro data will give suitable
indications of the distribution of debt (and the debt burden) as well as of groups of households
that might be particularly prone to shocks. The following list summarises the Central Bank
7 Examples of these indicators are debt-service burden, the number of credit commitments, indicators of arrears on credit
commitments or any other recurring commitments such as rent, water and electricity. 8 See ECRI, Expert Roundtable on the Latest Developments of EU Household Indebtedness, Meeting of 21 November 2006
in Brussels (retrieved from http://www.ecri.be/new/taxonomy/term/2).
CONSUMER FINANCIAL VULNERABILITY
12
indicators used for the analysis of financial fragility of the household sector (not of individual
households). There are four main indicator groups (Kask, 2003, p. 36):
1) Indebtedness indicators
2) Capital gearing
3) Income gearing, also called the ‘debt-service burden’
4) Wealth indicators
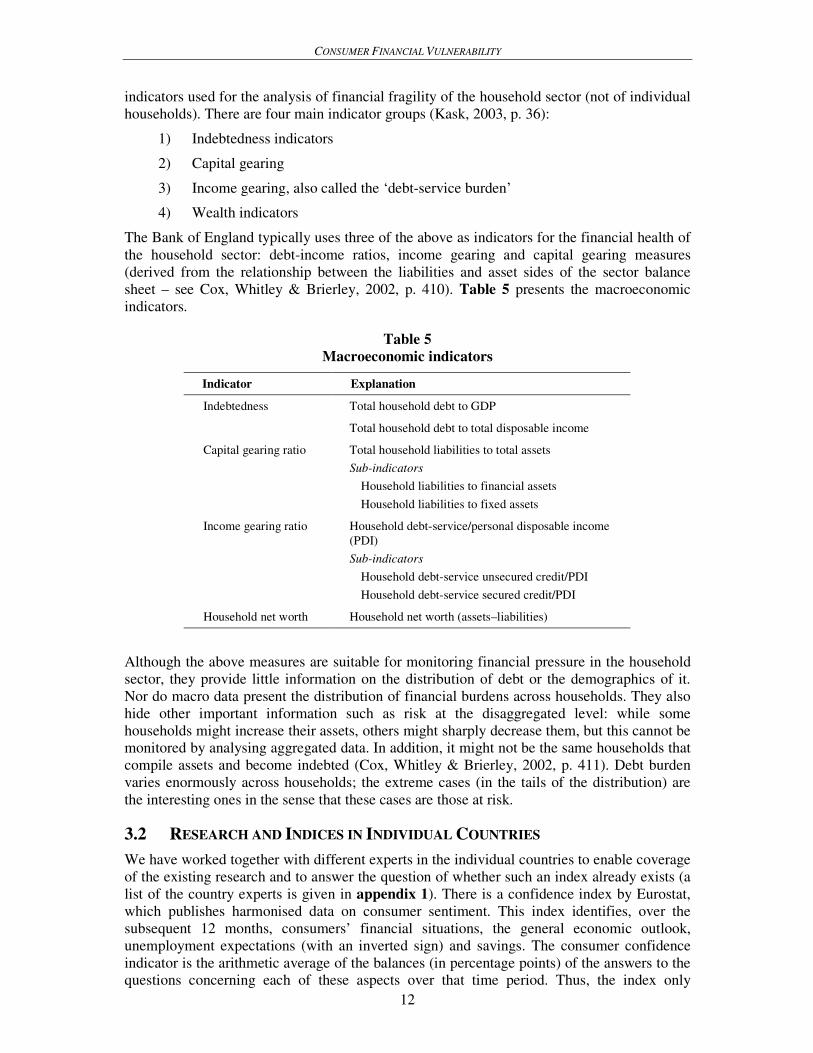
The Bank of England typically uses three of the above as indicators for the financial health of
the household sector: debt-income ratios, income gearing and capital gearing measures
(derived from the relationship between the liabilities and asset sides of the sector balance
sheet – see Cox, Whitley & Brierley, 2002, p. 410). Table 5 presents the macroeconomic
indicators.
Table 5
Macroeconomic indicators
Indicator Explanation
Indebtedness Total household debt to GDP
Total household debt to total disposable income
Capital gearing ratio Total household liabilities to total assets
Sub-indicators
Household liabilities to financial assets
Household liabilities to fixed assets
Income gearing ratio Household debt-service/personal disposable income
(PDI)
Sub-indicators
Household debt-service unsecured credit/PDI
Household debt-service secured credit/PDI
Household net worth Household net worth (assets–liabilities)
Although the above measures are suitable for monitoring financial pressure in the household
sector, they provide little information on the distribution of debt or the demographics of it.
Nor do macro data present the distribution of financial burdens across households. They also
hide other important information such as risk at the disaggregated level: while some
households might increase their assets, others might sharply decrease them, but this cannot be
monitored by analysing aggregated data. In addition, it might not be the same households that
compile assets and become indebted (Cox, Whitley & Brierley, 2002, p. 411). Debt burden
varies enormously across households; the extreme cases (in the tails of the distribution) are
the interesting ones in the sense that these cases are those at risk.
3.2 RESEARCH AND INDICES IN INDIVIDUAL COUNTRIES
We have worked together with different experts in the individual countries to enable coverage
of the existing research and to answer the question of whether such an index already exists (a
list of the country experts is given in appendix 1). There is a confidence index by Eurostat,
which publishes harmonised data on consumer sentiment. This index identifies, over the
subsequent 12 months, consumers’ financial situations, the general economic outlook,
unemployment expectations (with an inverted sign) and savings. The consumer confidence
indicator is the arithmetic average of the balances (in percentage points) of the answers to the
questions concerning each of these aspects over that time period. Thus, the index only
CONSUMER FINANCIAL VULNERABILITY
13
aggregates expectations. To aggregate and come up with EU results, different weights are
given to different countries. The weights reflect the contribution of the EU member state to
overall, private final consumption expenditure in the EU.9 The consumer index seems to
indicate changes in consumer spending with a lead-time of perhaps one to two quarters. The
index has been implemented in the individual countries in Europe, and thus results can be
obtained in a disaggregated way.
There have been works with indicators that include measurements of financial difficulties.
For instance, Rebiere (2007) describes different possibilities for how over-indebtedness (a
closely related concept, although not the same) can be measured taking national surveys into
account: 1) arrears on accommodation, utility bills or loans; 2) subjective perception (self-
assessment of being in financial difficulties); 3) a debt-service ratio exceeding 30%; and 4)
the inability to pay debts without endangering subsistence. According to this methodology, in
France 10.5% of households are in arrears, 16.4% have difficulties, 9.5% have a debt-to-
income ratio of >30% and 9.8% cannot pay debts without endangering subsistence. He
suggests that arrears and the impossibility of paying debts should be used for measurement.
Carpentier & Van den Bosch (forthcoming) study problematic debts in Belgium, with the
main focus on situations in which debt pushes people into poverty – a very important concept
reflected (but slightly modified) below. The main purpose of their research is to find reliable
indicators using the Belgian SILC 2004 data (as commissioned by the Belgian Federal Public
Service Social Security). The authors also make suggestions for revisions to the questions.
The Belgian SILC survey has some additional questions compared with the EU-SILC.10
We
would like to suggest the inclusion of similar questions in the revision of the EU-SILC. The
authors suggest nine indicators for ‘problematic debt situations’. Among these is the
percentage of the population that becomes poorer owing to consumer credit payments, the
increase in the poverty gap because of credit payments, a debt-service ratio above 20%, two
or more arrears on household bills and the cut-off or limited use of water, electricity or gas.
Of these, two are selected as the main indicators.11
According to these indicators, 5-6% of the
population has a problematic level of debt. They also state that only 1% of the population
combines problematic arrears and poverty, and that the indicators would point to very distinct
groups.
In Finland, Muttilainen & Reijo (2007) measure repayment difficulties based on national and
EU-SILC data for Finland. Among their indicators is the predicament of falling behind in
paying bills (either once or for extended periods). Other indicators used in their research are
debt settlements with creditors or loans falling behind schedule (or both). The study shows
that 7% of Finnish households have repayment problems, but overall the numbers have fallen
for all the indicators from 2002 to 2005. Other research in this area is conducted by the
University of Antwerp as well as by the Portuguese University of Coimbra. Altogether, there
is already a large body of research, but the measurements of financial difficulties differ across
countries and studies.
9 This is a two-year moving average (from the AMECO database of the Directorate-General for Economic and Financial
Affairs, European Commission). 10
These questions include the monthly amount of payment for consumption credit and the number of arrears individuals
have faced for several kinds of expenses in the last 12 months (once, twice or more than twice). The question on arrears has
also been broadened to other kinds of expenses (such as healthcare). 11
These two indicators are the percentage of the population becoming poor or poorer owing to consumer credit payments and
the percentage of persons in the household with at least two arrears for electricity, water or gas bills, or for healthcare, rent or
mortgage payments.
CONSUMER FINANCIAL VULNERABILITY
14
IV. INITIAL DATA EXPLORATION AND DESCRIPTION
4.1 INTRODUCTION TO DATA EXPLORATION
This section reports the results of exploratory analysis of the survey data used to inform the
development of an index of financial vulnerability. A number of questions assumed to relate
to financial difficulties, circumstances and vulnerabilities are included in the survey and form
the baseline of the Index. It is not expected that all the questions will be used in the Index, nor
would it seem efficient to ask more questions than required to ‘capture’ financial
vulnerabilities on an ongoing basis. The relationship of these questions to each other and the
distribution of responses to them are examined through largely multivariate statistical
methods. The module of questions included in the Ipsos Mori omnibus survey contains eight
questions that are of potential interest when building an index of financial vulnerability.
These comprise three measures of current financial difficulties and up to five other measures
and predictors of financial vulnerability, listed below.
Financial difficulties
• How often the household has experienced financial difficulties within the past 12
months (question GW08 in the questionnaire – see appendix 2)
• How often the household has been unable to pay bills at the last reminder (GW09)
• How well the household is currently keeping up with bills and credit commitments
(GW14)
Measures of future financial vulnerability
• Perception of whether the household can afford more borrowing (GW13)
• Whether the household has savings equivalent to one month’s income (GW10)
• Expectations of the future financial position of the household (financial
expectations) (GW15)
The following additional financial measures are best considered as factors that might help
explain (or ‘predict’) current financial difficulties or future financial vulnerabilities:
• the number of credit commitments in the household (derived from GW11 and
GW12), and
• a fall in income in the past 12 months (derived from GW07).
The propensity to experience financial difficulties or vulnerability is expected to vary
according to a range of socio-demographic and attitudinal dimensions. As such, these
characteristics may also be helpful for predicting financial difficulties. A selection of these is
also covered in the questionnaire:
• Age (available in the standard Ipsos Mori omnibus questions)
• Family type (derived from GW02)
• Occupational status of the household reference person (GW06)12
(this, in
combination with the number of earners in the household, is used principally as a
12 The household reference person is typically defined in social surveys as the householder with the highest earnings, and this
approach has been adopted here.
CONSUMER FINANCIAL VULNERABILITY
15
proxy for income, which is too complicated to measure in a comparable way
across different countries in a short questionnaire)
• Number of earners/whether there is a full-time earner in the household (derived
from GW04 and GW05)
• Housing tenure (GW17)
• Attitudes towards saving, spending and borrowing (GW16)
4.2 SAMPLE CONSIDERATIONS AND NON-RESPONSES
Financial difficulties are considered at the household rather than the individual level. It is
essential that the respondent is able to report on the situation of the household finances.
Consequently, we are solely interested in the subset of the sample of respondents who are
householders (defined as a person in whose name the accommodation is owned or rented, or
his/her partner). We are also interested in drawing on a comparable subset of adults across all
countries. As 18 is the minimum age for access to credit in at least some countries, we have
therefore selected 18 as the minimum age for inclusion in the sample for analysis. Before
undertaking any substantive analysis of survey data, it is necessary to examine key measures
of interest for levels and distributions of item non-response, that is, instances in which a
‘don’t know’ or ‘refusal’ has been given to an individual survey question by a respondent
who has completed the module of questions. Non-response is expressed as a percentage of the
total possible number of valid responses.
We are interested in examining
• individual countries in which there is a relatively high level of non-response across
the individual questions;
• individual questions for which there is a highly variable rate of item non-response
in different countries;
• individual questions for which there is a high level of item non-response overall
(across all countries); and
• the kinds of individuals with high levels of non-response.
Together, these analyses inform the decisions around whether specific questions can be
utilised in further analysis and if so, how the missing values should be treated. As we are
interested in the raw data, this analysis has been undertaken without the application of the
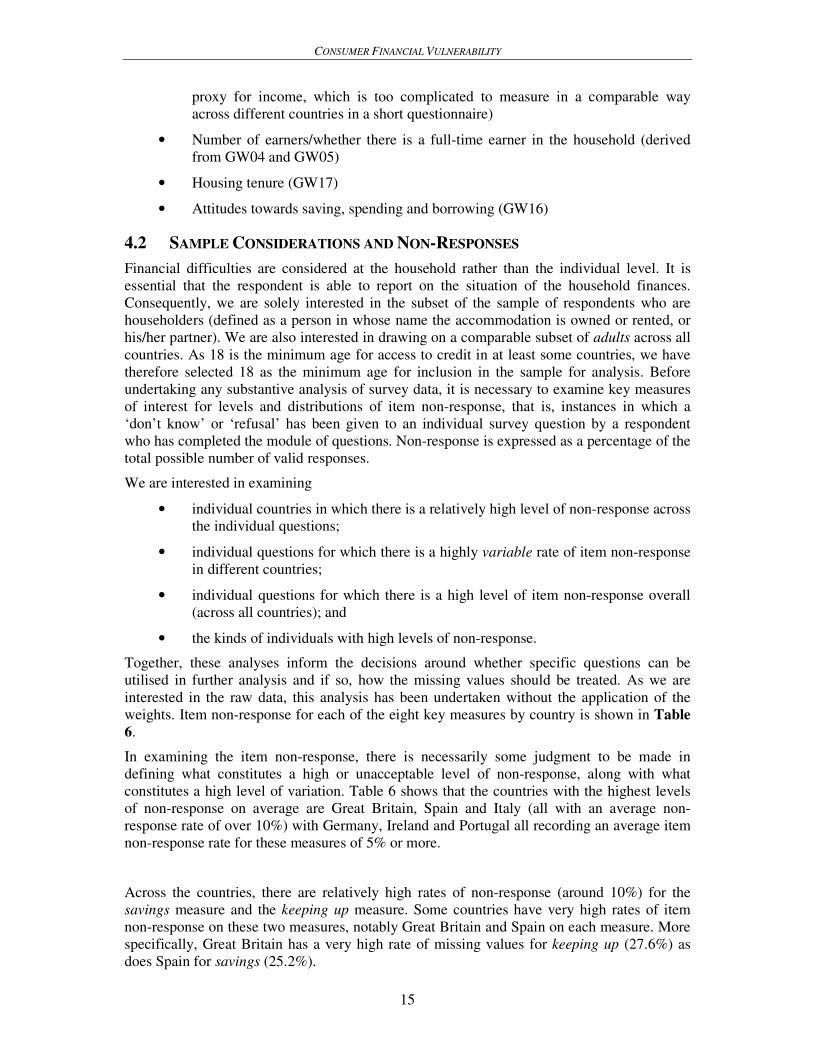
weights. Item non-response for each of the eight key measures by country is shown in Table
6.
In examining the item non-response, there is necessarily some judgment to be made in
defining what constitutes a high or unacceptable level of non-response, along with what
constitutes a high level of variation. Table 6 shows that the countries with the highest levels
of non-response on average are Great Britain, Spain and Italy (all with an average non-
response rate of over 10%) with Germany, Ireland and Portugal all recording an average item
non-response rate for these measures of 5% or more.
Across the countries, there are relatively high rates of non-response (around 10%) for the
savings measure and the keeping up measure. Some countries have very high rates of item
non-response on these two measures, notably Great Britain and Spain on each measure. More
specifically, Great Britain has a very high rate of missing values for keeping up (27.6%) as
does Spain for savings (25.2%).
CONSUMER FINANCIAL VULNERABILITY
16
Table 6
Percentage of missing values (item non-response) by measure and country
Denmark France Germany
Great
Britain Ireland Italy Norway Portugal Spain Sweden Average
Financial
difficulties 0.7 2.7 6.4 10.1 2.3 8.6 0.3 1.9 6.7 1.2 3.8
Unable to pay
bills 0.7 2.1 7.4 10.6 2.7 9.7 0.6 1.8 8.3 1.1 4.1
Keeping up 0.9 5.0 15.0 27.6 3.4 17.9 1.6 5.4 20.7 1.4 9.2
Borrowing 2.7 4.9 8.6 15.7 8.0 12.0 2.6 6.3 12.0 1.8 7.1
Savings 6.8 7.7 14.9 22.0 19.9 15.5 3.8 11.6 25.2 4.7 12.7
Financial
expectations 2.1 7.2 6.6 14.4 10.9 14.8 2.8 7.0 10.9 3.3 7.1
Credit
commitments 1.8 3.4 8.4 13.6 8.0 8.6 1.4 3.9 10.4 1.6 5.8
Fall in income 2.0 3.0 4.9 12.3 3.0 19.5 2.5 2.6 16.5 2.5 6.2
Average across
measures 2.2 4.5 9.0 15.8 7.3 13.3 1.9 5.1 13.9 2.2
Notes: Cells shaded in dark grey indicate non-response rates of 20% or higher. Cells shaded in light grey indicate non-
response rates of 10% or higher (but not greater than 20%); unweighted cell percentages.
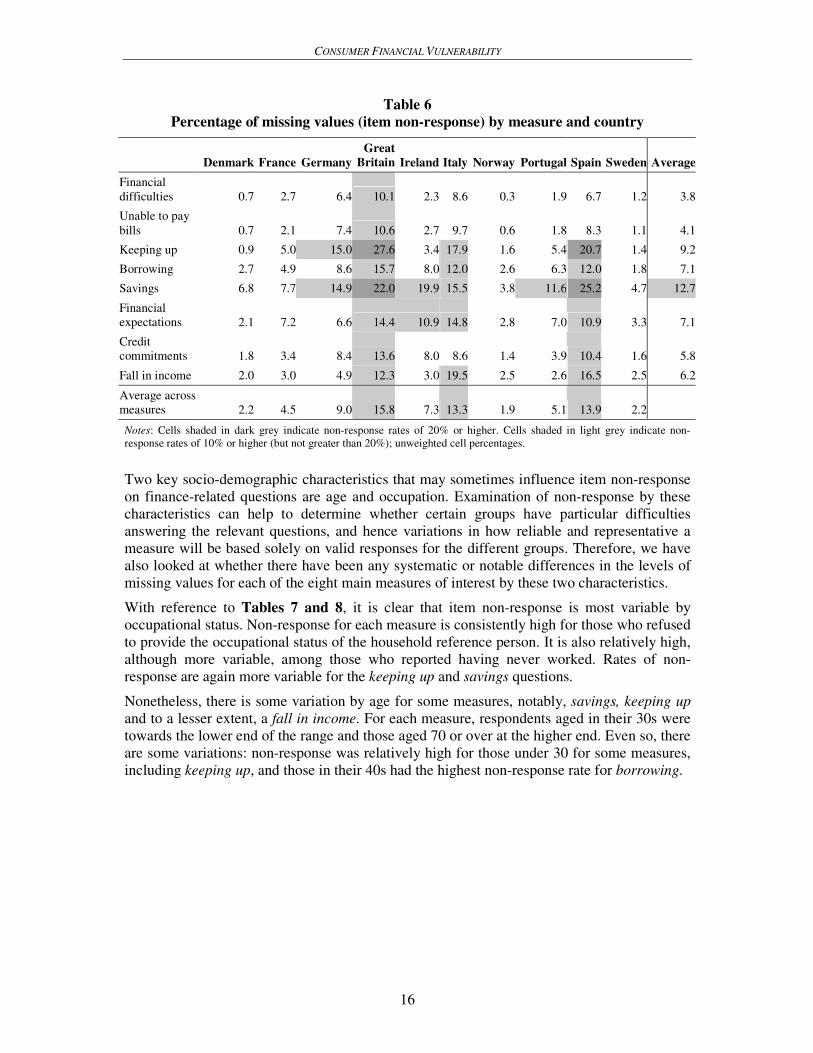
Two key socio-demographic characteristics that may sometimes influence item non-response
on finance-related questions are age and occupation. Examination of non-response by these
characteristics can help to determine whether certain groups have particular difficulties
answering the relevant questions, and hence variations in how reliable and representative a
measure will be based solely on valid responses for the different groups. Therefore, we have
also looked at whether there have been any systematic or notable differences in the levels of
missing values for each of the eight main measures of interest by these two characteristics.
With reference to Tables 7 and 8, it is clear that item non-response is most variable by
occupational status. Non-response for each measure is consistently high for those who refused
to provide the occupational status of the household reference person. It is also relatively high,
although more variable, among those who reported having never worked. Rates of non-
response are again more variable for the keeping up and savings questions.
Nonetheless, there is some variation by age for some measures, notably, savings, keeping up
and to a lesser extent, a fall in income. For each measure, respondents aged in their 30s were
towards the lower end of the range and those aged 70 or over at the higher end. Even so, there
are some variations: non-response was relatively high for those under 30 for some measures,
including keeping up, and those in their 40s had the highest non-response rate for borrowing.
CONSUMER FINANCIAL VULNERABILITY
17
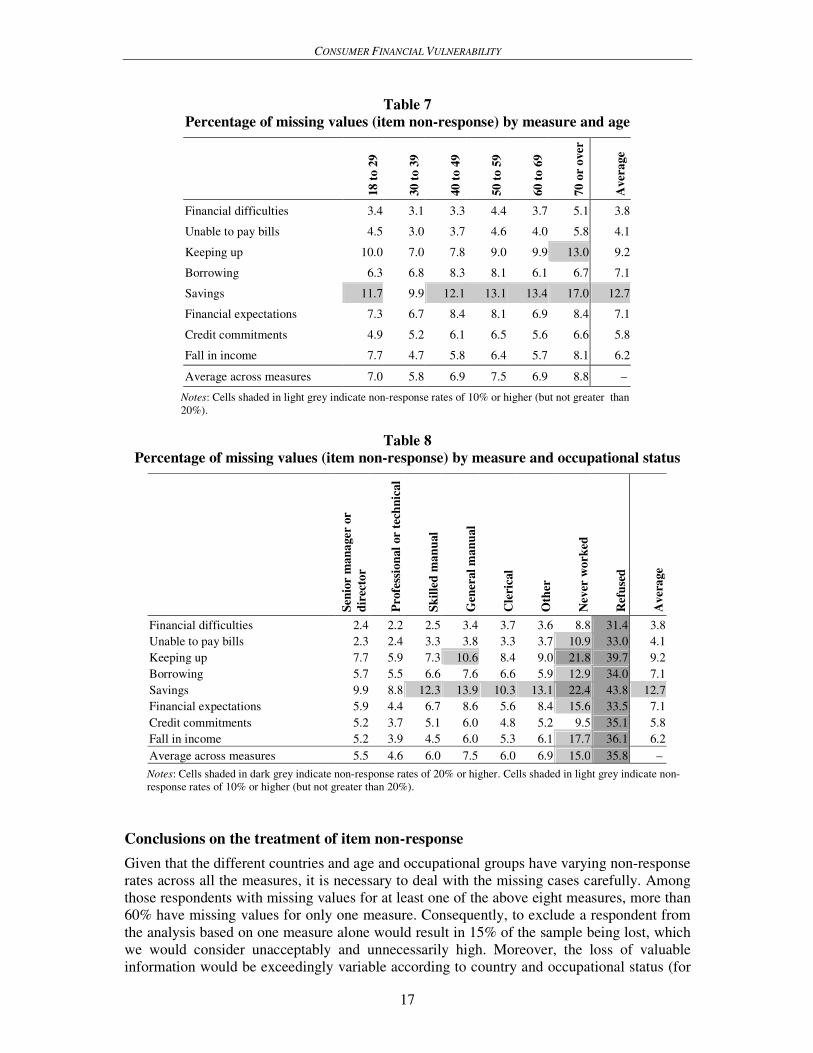
Table 7
Percentage of missing values (item non-response) by measure and age
18 t
o 2
9
30 t
o 3
9
40 t
o 4
9
50 t
o 5
9
60 t
o 6
9
70 o
r o
ver
Aver
age
Financial difficulties 3.4 3.1 3.3 4.4 3.7 5.1 3.8
Unable to pay bills 4.5 3.0 3.7 4.6 4.0 5.8 4.1
Keeping up 10.0 7.0 7.8 9.0 9.9 13.0 9.2
Borrowing 6.3 6.8 8.3 8.1 6.1 6.7 7.1
Savings 11.7 9.9 12.1 13.1 13.4 17.0 12.7
Financial expectations 7.3 6.7 8.4 8.1 6.9 8.4 7.1
Credit commitments 4.9 5.2 6.1 6.5 5.6 6.6 5.8
Fall in income 7.7 4.7 5.8 6.4 5.7 8.1 6.2
Average across measures 7.0 5.8 6.9 7.5 6.9 8.8 –
Notes: Cells shaded in light grey indicate non-response rates of 10% or higher (but not greater than
20%).
Table 8
Percentage of missing values (item non-response) by measure and occupational status
Sen
ior
man
ager
or
dir
ecto
r
Pro
fess
ion
al
or
tech
nic
al
Sk
ille
d m
an
ual
Gen
eral
man
ual
Cle
rica
l
Oth
er
Nev
er w
ork
ed
Ref
use
d
Aver
age
Financial difficulties 2.4 2.2 2.5 3.4 3.7 3.6 8.8 31.4 3.8
Unable to pay bills 2.3 2.4 3.3 3.8 3.3 3.7 10.9 33.0 4.1
Keeping up 7.7 5.9 7.3 10.6 8.4 9.0 21.8 39.7 9.2
Borrowing 5.7 5.5 6.6 7.6 6.6 5.9 12.9 34.0 7.1
Savings 9.9 8.8 12.3 13.9 10.3 13.1 22.4 43.8 12.7
Financial expectations 5.9 4.4 6.7 8.6 5.6 8.4 15.6 33.5 7.1
Credit commitments 5.2 3.7 5.1 6.0 4.8 5.2 9.5 35.1 5.8
Fall in income 5.2 3.9 4.5 6.0 5.3 6.1 17.7 36.1 6.2
Average across measures 5.5 4.6 6.0 7.5 6.0 6.9 15.0 35.8 –
Notes: Cells shaded in dark grey indicate non-response rates of 20% or higher. Cells shaded in light grey indicate non-
response rates of 10% or higher (but not greater than 20%).
Conclusions on the treatment of item non-response
Given that the different countries and age and occupational groups have varying non-response
rates across all the measures, it is necessary to deal with the missing cases carefully. Among
those respondents with missing values for at least one of the above eight measures, more than
60% have missing values for only one measure. Consequently, to exclude a respondent from
the analysis based on one measure alone would result in 15% of the sample being lost, which
we would consider unacceptably and unnecessarily high. Moreover, the loss of valuable
information would be exceedingly variable according to country and occupational status (for
CONSUMER FINANCIAL VULNERABILITY
18
example, in the UK more than 43% of respondents would have to be omitted from the
analysis, compared with 11% in Sweden), thus potentially introducing bias into the findings.
For the remaining exploratory analysis, we have therefore retained missing responses as the
average or middle scores for each respective question so as not to lose the richness of the
information from the other questions.
We have refined this slightly for the three measures of financial difficulty. By taking a binary
version of each of the three measures – defined as ‘under strain’ (assigned a value of 1) and
‘not under strain’ (assigned a value of 2) and excluding missing values – we have calculated
an average strain value from the valid responses to questions on financial difficulties, unable
to pay bills and keeping up for respondents who did not provide a valid answer to each of
these questions. The analysis shows that for each variable, the mean is closer to 2 than it is to
1. In other words, consistently across the three measures, respondents who did not provide a
valid answer to the financial difficulties query were more likely to say they do not have
difficulties than the opposite, based on their answers to the other measures. Of course, some
individuals evaded all the questions (231 persons in this sample), but we cannot control for
this. A cautious approach would be to reassign the missing answers to these questions to the
category just off-centre in the direction of not being under strain.
The recoding of missing values for the remaining exploratory analysis is therefore as follows:
• Financial difficulties – off-middle value (‘hardly ever’)
• Unable to pay bills – off-middle value (‘hardly ever’)
• Keeping up – off-middle value (‘struggle to do so from time to time’)
• Borrowing – neutral value (‘level of borrowing is about right’)
• Savings – most common value (‘has savings’)
• Financial expectations – middle value (‘stay the same’)
• Credit commitments – one commitment (the arithmetic mean)13
• A fall in income – most common value (‘no fall in income’)
Exploring underlying relationships: What do the ‘measures’ measure?
Earlier in this section, we outlined six measures that in some way relate to financial
vulnerability, with three of these relating more directly to current financial difficulties. We
want to gain a better understanding of the way in which these measures relate to one another
before we can properly consider how to build an index of financial vulnerability. In particular,
we want to know whether and to what extent any two questions in fact measure the same
underlying dimension (or factors). The inclusion of duplicate questions in an index would be
wasteful (in terms of repeat data collection) and would artificially inflate the importance of
that factor in the index.
Principal components analysis (PCA) is a multivariate analysis technique that enables the
relationship between a set of measures to be examined more closely.14
It looks at the multiple
13 As this is a derived variable, it has been possible to impute some values for respondents for whom we know the kinds of
borrowing they have undertaken, but who did not report their total number of commitments. For these respondents, we have
assumed two commitments for each kind of commitment they did report. Some additional data-cleaning has been conducted
to correct for double-typing and outliers (details are available in the syntax file). 14
PCA is a form of exploratory factor analysis. We have used direct oblimin as the method of rotation in the initial model as
it allows factors to be correlated, which we would expect from the nature of the measures entered.
CONSUMER FINANCIAL VULNERABILITY
19
correlations between the measures to determine how many underlying dimensions the various
measures tap into and how strongly they do so.
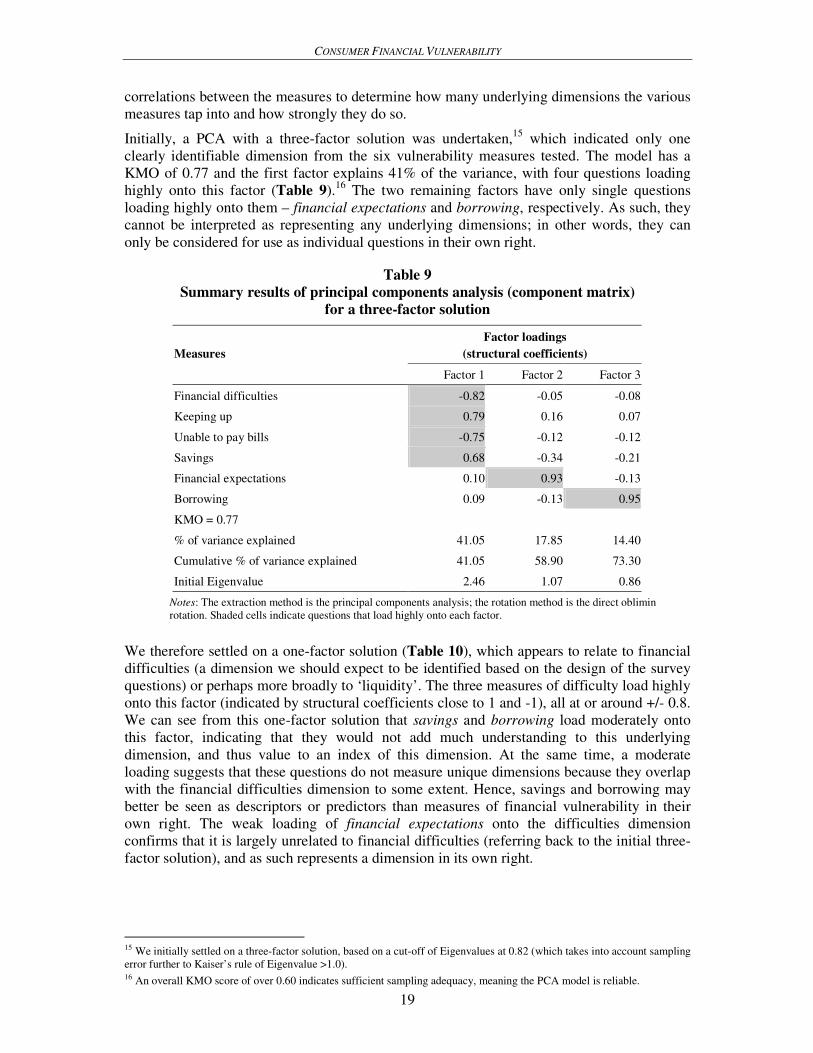
Initially, a PCA with a three-factor solution was undertaken,15
which indicated only one
clearly identifiable dimension from the six vulnerability measures tested. The model has a
KMO of 0.77 and the first factor explains 41% of the variance, with four questions loading
highly onto this factor (Table 9).16
The two remaining factors have only single questions
loading highly onto them – financial expectations and borrowing, respectively. As such, they
cannot be interpreted as representing any underlying dimensions; in other words, they can
only be considered for use as individual questions in their own right.
Table 9
Summary results of principal components analysis (component matrix)
for a three-factor solution
Measures
Factor loadings
(structural coefficients)
Factor 1 Factor 2 Factor 3
Financial difficulties -0.82 -0.05 -0.08
Keeping up 0.79 0.16 0.07
Unable to pay bills -0.75 -0.12 -0.12
Savings 0.68 -0.34 -0.21
Financial expectations 0.10 0.93 -0.13
Borrowing 0.09 -0.13 0.95
KMO = 0.77
% of variance explained 41.05 17.85 14.40
Cumulative % of variance explained 41.05 58.90 73.30
Initial Eigenvalue 2.46 1.07 0.86
Notes: The extraction method is the principal components analysis; the rotation method is the direct oblimin
rotation. Shaded cells indicate questions that load highly onto each factor.
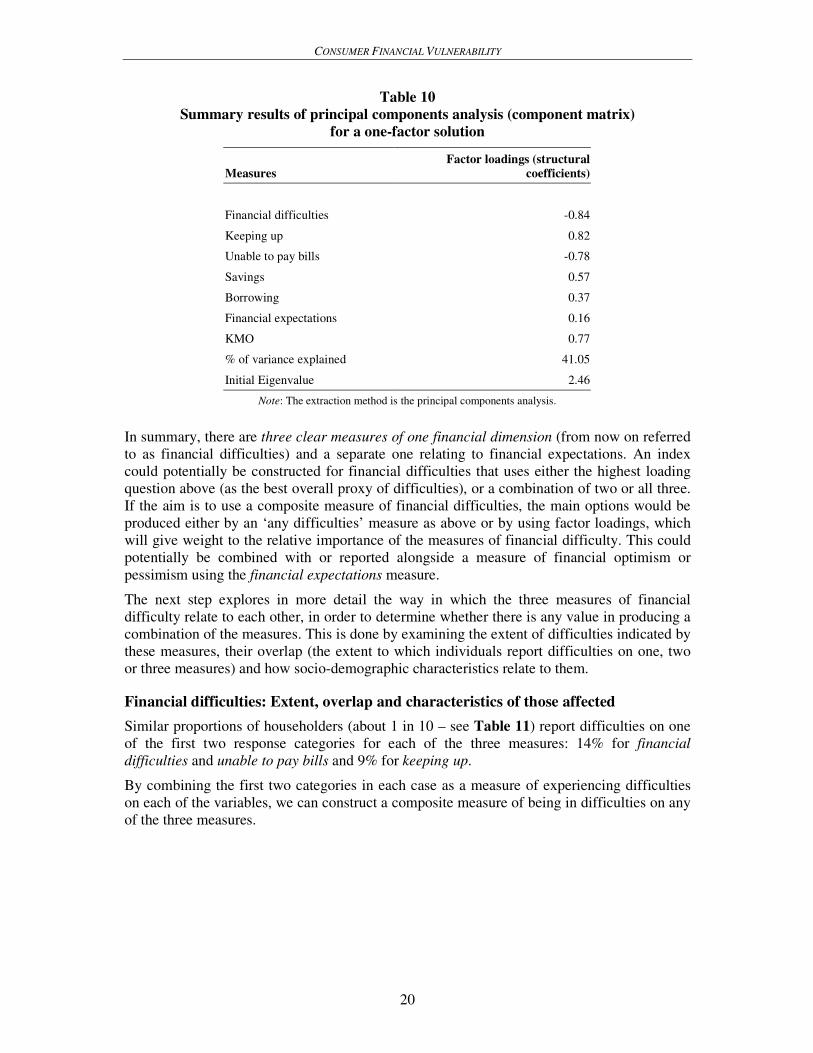
We therefore settled on a one-factor solution (Table 10), which appears to relate to financial
difficulties (a dimension we should expect to be identified based on the design of the survey
questions) or perhaps more broadly to ‘liquidity’. The three measures of difficulty load highly
onto this factor (indicated by structural coefficients close to 1 and -1), all at or around +/- 0.8.
We can see from this one-factor solution that savings and borrowing load moderately onto
this factor, indicating that they would not add much understanding to this underlying
dimension, and thus value to an index of this dimension. At the same time, a moderate
loading suggests that these questions do not measure unique dimensions because they overlap
with the financial difficulties dimension to some extent. Hence, savings and borrowing may
better be seen as descriptors or predictors than measures of financial vulnerability in their
own right. The weak loading of financial expectations onto the difficulties dimension
confirms that it is largely unrelated to financial difficulties (referring back to the initial three-
factor solution), and as such represents a dimension in its own right.
15 We initially settled on a three-factor solution, based on a cut-off of Eigenvalues at 0.82 (which takes into account sampling
error further to Kaiser’s rule of Eigenvalue >1.0). 16 An overall KMO score of over 0.60 indicates sufficient sampling adequacy, meaning the PCA model is reliable.
CONSUMER FINANCIAL VULNERABILITY
20
Table 10
Summary results of principal components analysis (component matrix)
for a one-factor solution
Measures
Factor loadings (structural
coefficients)
Financial difficulties -0.84
Keeping up 0.82
Unable to pay bills -0.78
Savings 0.57
Borrowing 0.37
Financial expectations 0.16
KMO 0.77
% of variance explained 41.05
Initial Eigenvalue 2.46
Note: The extraction method is the principal components analysis.
In summary, there are three clear measures of one financial dimension (from now on referred
to as financial difficulties) and a separate one relating to financial expectations. An index
could potentially be constructed for financial difficulties that uses either the highest loading
question above (as the best overall proxy of difficulties), or a combination of two or all three.
If the aim is to use a composite measure of financial difficulties, the main options would be
produced either by an ‘any difficulties’ measure as above or by using factor loadings, which
will give weight to the relative importance of the measures of financial difficulty. This could
potentially be combined with or reported alongside a measure of financial optimism or
pessimism using the financial expectations measure.
The next step explores in more detail the way in which the three measures of financial
difficulty relate to each other, in order to determine whether there is any value in producing a
combination of the measures. This is done by examining the extent of difficulties indicated by
these measures, their overlap (the extent to which individuals report difficulties on one, two
or three measures) and how socio-demographic characteristics relate to them.
Financial difficulties: Extent, overlap and characteristics of those affected
Similar proportions of householders (about 1 in 10 – see Table 11) report difficulties on one
of the first two response categories for each of the three measures: 14% for financial
difficulties and unable to pay bills and 9% for keeping up.
By combining the first two categories in each case as a measure of experiencing difficulties
on each of the variables, we can construct a composite measure of being in difficulties on any
of the three measures.
CONSUMER FINANCIAL VULNERABILITY
21
Table 11
Distribution of responses to the three measures of financial difficulty
Valid percentage Cumulative percentage
Financial difficulties
All the time 5 5
More often than not 9 14
Sometimes 26 40
Hardly ever 30 69
Never 31 100
Unable to pay bills
More often than not 3 3
Sometimes 10 14
Hardly ever 20 34
Never 66 100
Keeping up
Falling behind 2 2
Constant struggle 7 9
Struggle from time to time 40 49
Keeping up without difficulties 51 100
Unweighted base 7,534 –
Note: Weighted column percentages
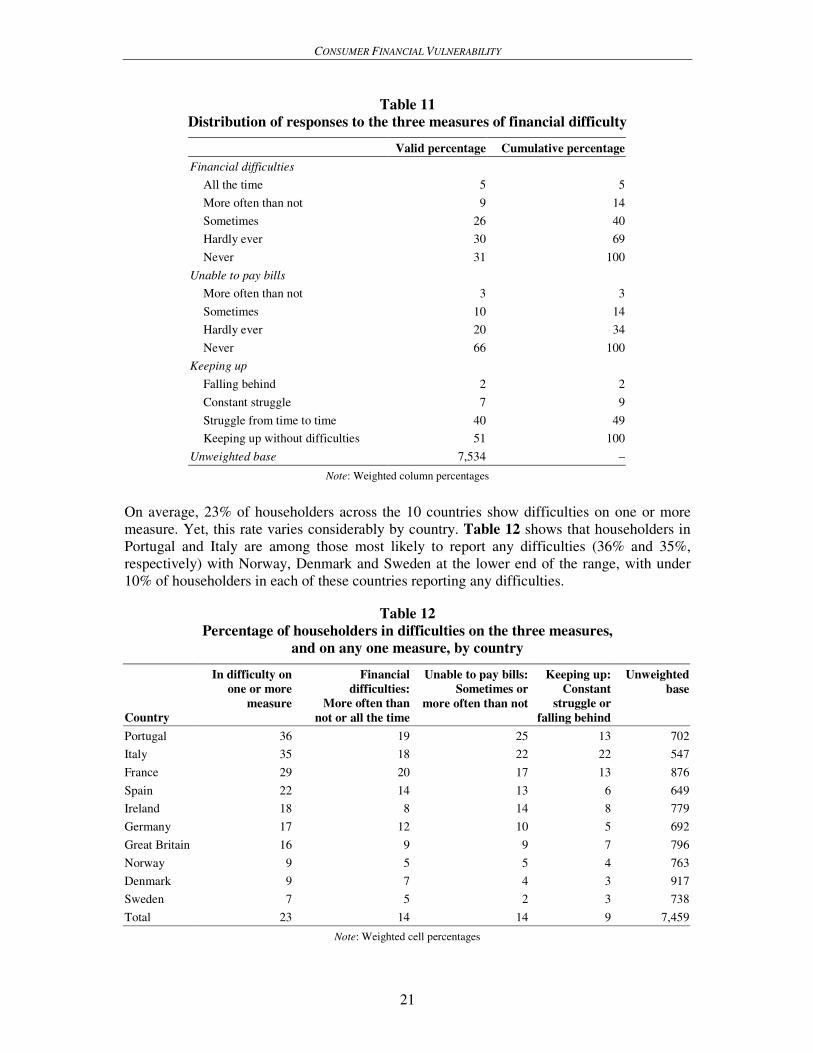
On average, 23% of householders across the 10 countries show difficulties on one or more
measure. Yet, this rate varies considerably by country. Table 12 shows that householders in
Portugal and Italy are among those most likely to report any difficulties (36% and 35%,
respectively) with Norway, Denmark and Sweden at the lower end of the range, with under
10% of householders in each of these countries reporting any difficulties.
Table 12
Percentage of householders in difficulties on the three measures,
and on any one measure, by country
Country
In difficulty on
one or more
measure
Financial
difficulties:
More often than
not or all the time
Unable to pay bills:
Sometimes or
more often than not
Keeping up:
Constant
struggle or
falling behind
Unweighted
base
Portugal 36 19 25 13 702
Italy 35 18 22 22 547
France 29 20 17 13 876
Spain 22 14 13 6 649
Ireland 18 8 14 8 779
Germany 17 12 10 5 692
Great Britain 16 9 9 7 796
Norway 9 5 5 4 763
Denmark 9 7 4 3 917
Sweden 7 5 2 3 738
Total 23 14 14 9 7,459
Note: Weighted cell percentages
CONSUMER FINANCIAL VULNERABILITY
22
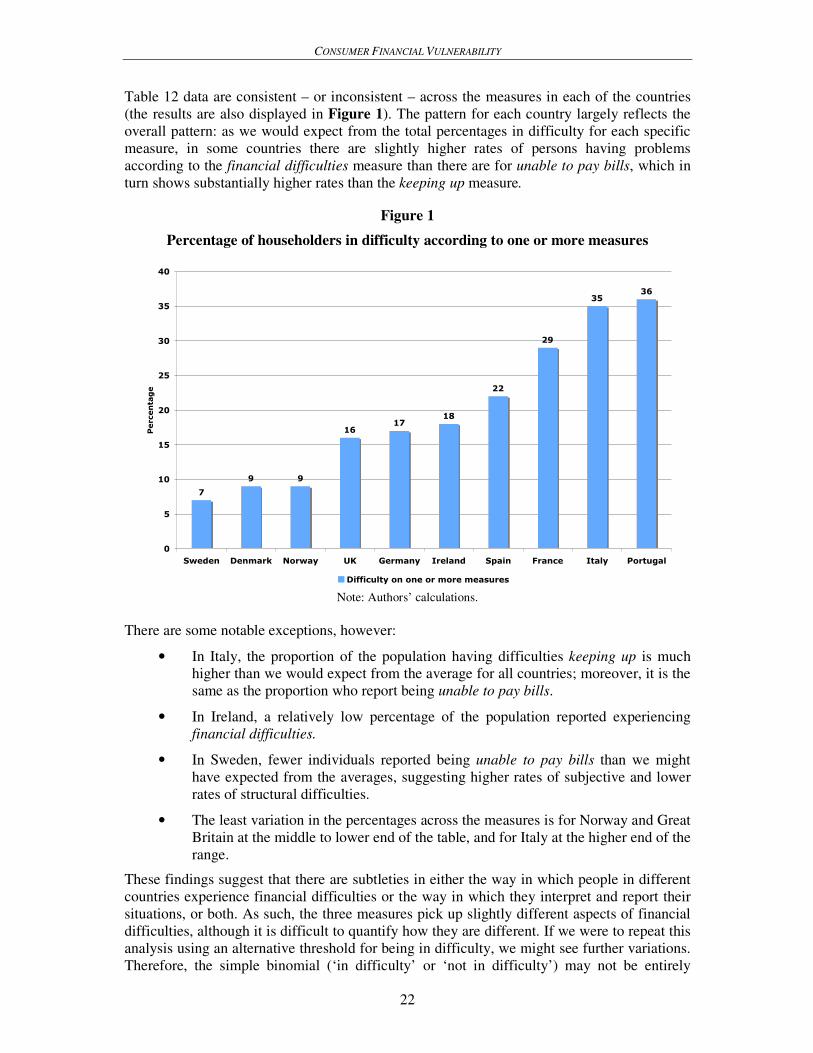
Table 12 data are consistent – or inconsistent – across the measures in each of the countries
(the results are also displayed in Figure 1). The pattern for each country largely reflects the
overall pattern: as we would expect from the total percentages in difficulty for each specific
measure, in some countries there are slightly higher rates of persons having problems
according to the financial difficulties measure than there are for unable to pay bills, which in
turn shows substantially higher rates than the keeping up measure.
Figure 1
Percentage of householders in difficulty according to one or more measures
7
9 9
1617
18
22
29
3536
0
5
10
15
20
25
30
35
40
Sweden Denmark Norway UK Germany Ireland Spain France Italy Portugal
Percentage
Difficulty on one or more measures
Note: Authors’ calculations.
There are some notable exceptions, however:
• In Italy, the proportion of the population having difficulties keeping up is much
higher than we would expect from the average for all countries; moreover, it is the
same as the proportion who report being unable to pay bills.
• In Ireland, a relatively low percentage of the population reported experiencing
financial difficulties.
• In Sweden, fewer individuals reported being unable to pay bills than we might
have expected from the averages, suggesting higher rates of subjective and lower
rates of structural difficulties.
• The least variation in the percentages across the measures is for Norway and Great
Britain at the middle to lower end of the table, and for Italy at the higher end of the
range.
These findings suggest that there are subtleties in either the way in which people in different
countries experience financial difficulties or the way in which they interpret and report their
situations, or both. As such, the three measures pick up slightly different aspects of financial
difficulties, although it is difficult to quantify how they are different. If we were to repeat this
analysis using an alternative threshold for being in difficulty, we might see further variations.
Therefore, the simple binomial (‘in difficulty’ or ‘not in difficulty’) may not be entirely
CONSUMER FINANCIAL VULNERABILITY
23
appropriate, at least not without further examination, as it may mask these differences.
Categories that are more detailed or a different way of collapsing the measures may be a more
suitable approach. We return to this point later in the report (under the heading of
“Segmenting the population”).
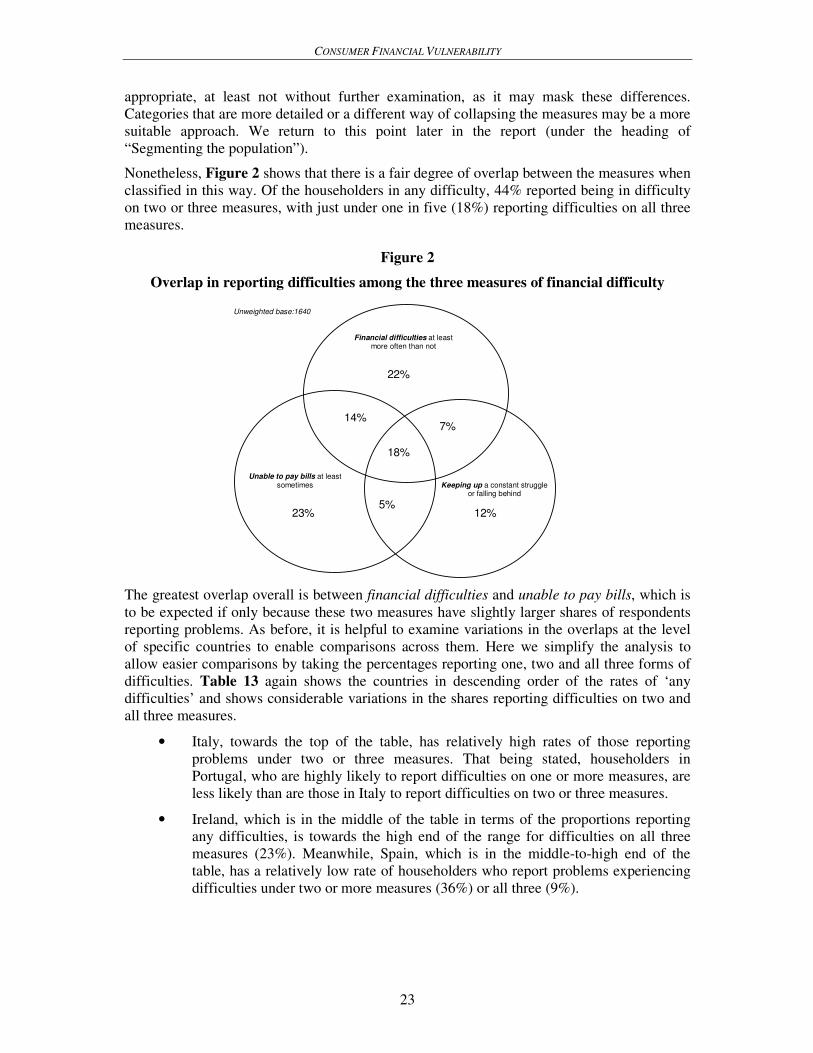
Nonetheless, Figure 2 shows that there is a fair degree of overlap between the measures when
classified in this way. Of the householders in any difficulty, 44% reported being in difficulty
on two or three measures, with just under one in five (18%) reporting difficulties on all three
measures.
Figure 2
Overlap in reporting difficulties among the three measures of financial difficulty
The greatest overlap overall is between financial difficulties and unable to pay bills, which is
to be expected if only because these two measures have slightly larger shares of respondents
reporting problems. As before, it is helpful to examine variations in the overlaps at the level
of specific countries to enable comparisons across them. Here we simplify the analysis to
allow easier comparisons by taking the percentages reporting one, two and all three forms of
difficulties. Table 13 again shows the countries in descending order of the rates of ‘any
difficulties’ and shows considerable variations in the shares reporting difficulties on two and
all three measures.
• Italy, towards the top of the table, has relatively high rates of those reporting
problems under two or three measures. That being stated, householders in
Portugal, who are highly likely to report difficulties on one or more measures, are
less likely than are those in Italy to report difficulties on two or three measures.
• Ireland, which is in the middle of the table in terms of the proportions reporting
any difficulties, is towards the high end of the range for difficulties on all three
measures (23%). Meanwhile, Spain, which is in the middle-to-high end of the
table, has a relatively low rate of householders who report problems experiencing
difficulties under two or more measures (36%) or all three (9%).
Unable to pay bills at least sometimes
Financial difficulties at least more often than not
12%
22%
23% 5%
18%
14% 7%
Keeping up a constant struggle or falling behind
Unweighted base:1640
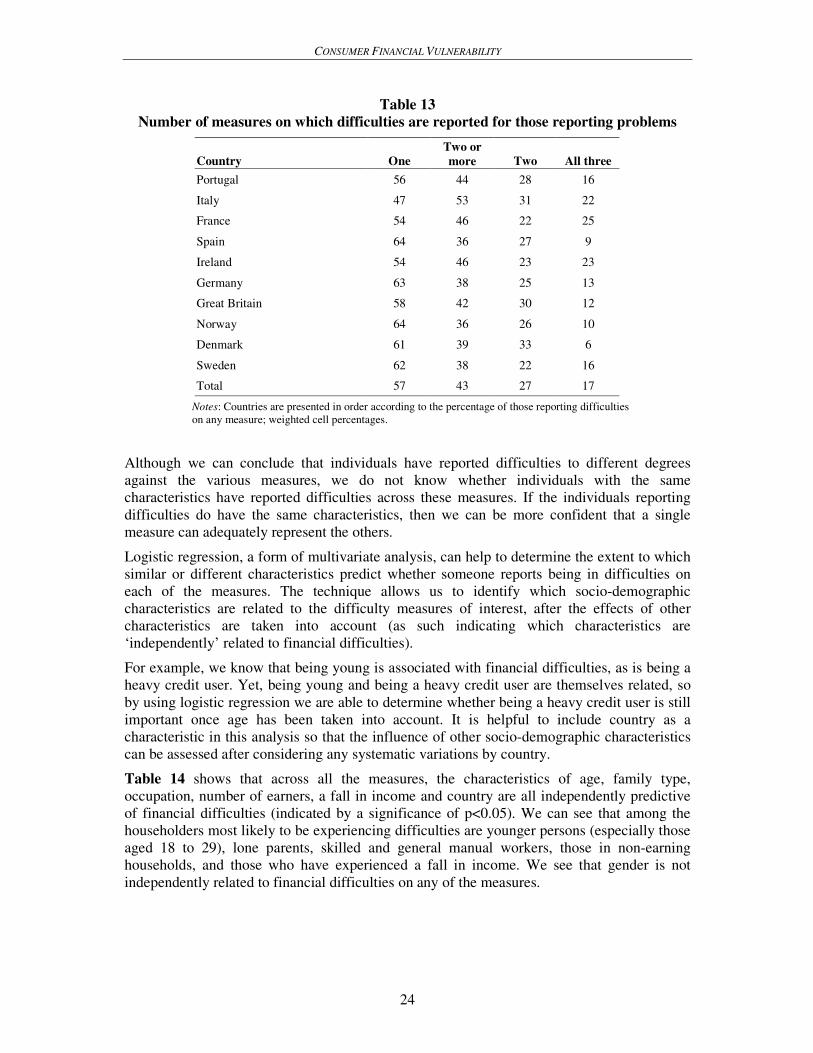
CONSUMER FINANCIAL VULNERABILITY
24
Table 13
Number of measures on which difficulties are reported for those reporting problems
Country One
Two or
more Two All three
Portugal 56 44 28 16
Italy 47 53 31 22
France 54 46 22 25
Spain 64 36 27 9
Ireland 54 46 23 23
Germany 63 38 25 13
Great Britain 58 42 30 12
Norway 64 36 26 10
Denmark 61 39 33 6
Sweden 62 38 22 16
Total 57 43 27 17
Notes: Countries are presented in order according to the percentage of those reporting difficulties
on any measure; weighted cell percentages.
Although we can conclude that individuals have reported difficulties to different degrees
against the various measures, we do not know whether individuals with the same
characteristics have reported difficulties across these measures. If the individuals reporting
difficulties do have the same characteristics, then we can be more confident that a single
measure can adequately represent the others.
Logistic regression, a form of multivariate analysis, can help to determine the extent to which
similar or different characteristics predict whether someone reports being in difficulties on
each of the measures. The technique allows us to identify which socio-demographic
characteristics are related to the difficulty measures of interest, after the effects of other
characteristics are taken into account (as such indicating which characteristics are
‘independently’ related to financial difficulties).
For example, we know that being young is associated with financial difficulties, as is being a
heavy credit user. Yet, being young and being a heavy credit user are themselves related, so
by using logistic regression we are able to determine whether being a heavy credit user is still
important once age has been taken into account. It is helpful to include country as a
characteristic in this analysis so that the influence of other socio-demographic characteristics
can be assessed after considering any systematic variations by country.
Table 14 shows that across all the measures, the characteristics of age, family type,
occupation, number of earners, a fall in income and country are all independently predictive
of financial difficulties (indicated by a significance of p<0.05). We can see that among the
householders most likely to be experiencing difficulties are younger persons (especially those
aged 18 to 29), lone parents, skilled and general manual workers, those in non-earning
households, and those who have experienced a fall in income. We see that gender is not
independently related to financial difficulties on any of the measures.
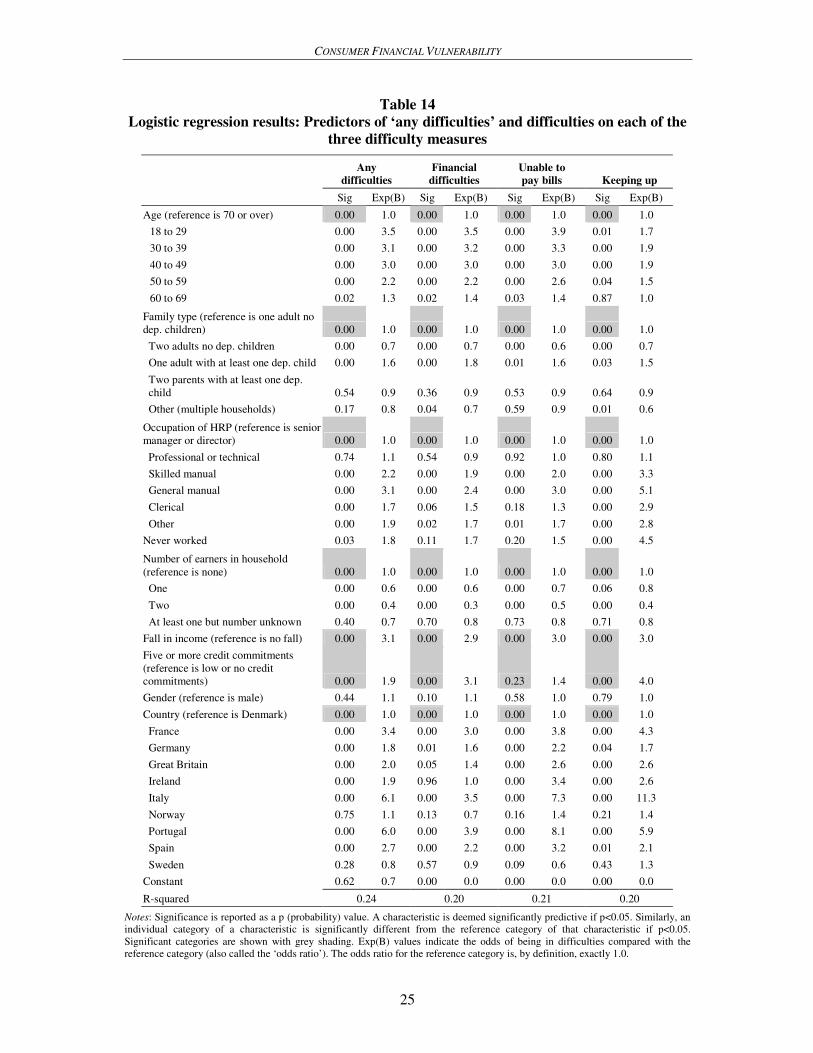
CONSUMER FINANCIAL VULNERABILITY
25
Table 14
Logistic regression results: Predictors of ‘any difficulties’ and difficulties on each of the
three difficulty measures
Any
difficulties
Financial
difficulties
Unable to
pay bills Keeping up
Sig Exp(B) Sig Exp(B) Sig Exp(B) Sig Exp(B)
Age (reference is 70 or over) 0.00 1.0 0.00 1.0 0.00 1.0 0.00 1.0
18 to 29 0.00 3.5 0.00 3.5 0.00 3.9 0.01 1.7
30 to 39 0.00 3.1 0.00 3.2 0.00 3.3 0.00 1.9
40 to 49 0.00 3.0 0.00 3.0 0.00 3.0 0.00 1.9
50 to 59 0.00 2.2 0.00 2.2 0.00 2.6 0.04 1.5
60 to 69 0.02 1.3 0.02 1.4 0.03 1.4 0.87 1.0
Family type (reference is one adult no
dep. children) 0.00 1.0 0.00 1.0 0.00 1.0 0.00 1.0
Two adults no dep. children 0.00 0.7 0.00 0.7 0.00 0.6 0.00 0.7
One adult with at least one dep. child 0.00 1.6 0.00 1.8 0.01 1.6 0.03 1.5
Two parents with at least one dep.
child 0.54 0.9 0.36 0.9 0.53 0.9 0.64 0.9
Other (multiple households) 0.17 0.8 0.04 0.7 0.59 0.9 0.01 0.6
Occupation of HRP (reference is senior
manager or director) 0.00 1.0 0.00 1.0 0.00 1.0 0.00 1.0
Professional or technical 0.74 1.1 0.54 0.9 0.92 1.0 0.80 1.1
Skilled manual 0.00 2.2 0.00 1.9 0.00 2.0 0.00 3.3
General manual 0.00 3.1 0.00 2.4 0.00 3.0 0.00 5.1
Clerical 0.00 1.7 0.06 1.5 0.18 1.3 0.00 2.9
Other 0.00 1.9 0.02 1.7 0.01 1.7 0.00 2.8
Never worked 0.03 1.8 0.11 1.7 0.20 1.5 0.00 4.5
Number of earners in household
(reference is none) 0.00 1.0 0.00 1.0 0.00 1.0 0.00 1.0
One 0.00 0.6 0.00 0.6 0.00 0.7 0.06 0.8
Two 0.00 0.4 0.00 0.3 0.00 0.5 0.00 0.4
At least one but number unknown 0.40 0.7 0.70 0.8 0.73 0.8 0.71 0.8
Fall in income (reference is no fall) 0.00 3.1 0.00 2.9 0.00 3.0 0.00 3.0
Five or more credit commitments
(reference is low or no credit
commitments) 0.00 1.9 0.00 3.1 0.23 1.4 0.00 4.0
Gender (reference is male) 0.44 1.1 0.10 1.1 0.58 1.0 0.79 1.0
Country (reference is Denmark) 0.00 1.0 0.00 1.0 0.00 1.0 0.00 1.0
France 0.00 3.4 0.00 3.0 0.00 3.8 0.00 4.3
Germany 0.00 1.8 0.01 1.6 0.00 2.2 0.04 1.7
Great Britain 0.00 2.0 0.05 1.4 0.00 2.6 0.00 2.6
Ireland 0.00 1.9 0.96 1.0 0.00 3.4 0.00 2.6
Italy 0.00 6.1 0.00 3.5 0.00 7.3 0.00 11.3
Norway 0.75 1.1 0.13 0.7 0.16 1.4 0.21 1.4
Portugal 0.00 6.0 0.00 3.9 0.00 8.1 0.00 5.9
Spain 0.00 2.7 0.00 2.2 0.00 3.2 0.01 2.1
Sweden 0.28 0.8 0.57 0.9 0.09 0.6 0.43 1.3
Constant 0.62 0.7 0.00 0.0 0.00 0.0 0.00 0.0
R-squared 0.24 0.20 0.21 0.20
Notes: Significance is reported as a p (probability) value. A characteristic is deemed significantly predictive if p<0.05. Similarly, an
individual category of a characteristic is significantly different from the reference category of that characteristic if p<0.05.
Significant categories are shown with grey shading. Exp(B) values indicate the odds of being in difficulties compared with the
reference category (also called the ‘odds ratio’). The odds ratio for the reference category is, by definition, exactly 1.0.
CONSUMER FINANCIAL VULNERABILITY
26
Notably, being a heavy credit user (defined as having five or more credit commitments) is
independently related to financial difficulties on all of the measures except for unable to pay
bills. One possible explanation for this finding is that while heavy credit users subjectively
feel that they are experiencing financial difficulties, they are still in a position to pay bills,
presumably because the credit available to them provides the cash flow they need.
The odds ratios given in Table 14 (see Exp(B) values) indicate that, overall, there is little
variation in the relative likelihood of specific aspects of a characteristic in predicting
difficulties across the measures. Where there is considerable variation, it often relates to the
country (for example, the relative likelihood of financial difficulties by measure in Italy varies
from 3.5 in relation to financial difficulties to 11.3 for keeping up). In relation to keeping up
we also see little variation in likelihood by age, at least when compared with the other
financial difficulty measures.
In contrast, there is a fair amount of variation in the odds of being in difficulties across the
measures for householders describing their occupation as general manual: the odds compared
with being a senior manager or director range from 2.4 for financial difficulties to 5.1 for
keeping up.
In other words, similar – although not the same – kinds of individuals are in difficulties on the
different measures. This means that multiple measures of financial difficulty should ideally be
considered. Finally, the R-squared in Table 14 indicates that the significant independent
predictors explain a similar proportion of the variation in financial difficulties, at around 0.20
(which explains 20% of the variance). Nonetheless, the ‘any difficulties’ measure is better
explained by the characteristics (0.24) than by the individual measures, reinforcing the notion
that the use of a combination of measures for difficulties is the best approach.
Segmenting the population
To explore further how the financial difficulty measures operate, we have used cluster
analysis, another multivariate analysis technique.17
This technique permits us to segment the
population based on their responses to these measures, which in turn allows us to see the
extent to which identifiable groups of persons emerge, and how these groups may be defined.
The method has the advantage of enabling us to use the full response breakdown of each
measure, rather than collapsing this into a binary ‘in difficulties’ or ‘not in difficulties’
categorisation.18
In the analysis, we specify models for three, four, five and six clusters and examine the
results.19
A four-cluster solution provides the clearest and most meaningful breakdown of the
population of the 10 countries studied. Just over a half of the population might be described
as largely doing fine (cluster 1); a quarter is sometimes in difficulty (cluster 2); one in five is
sometimes in difficulty, but is never unable to pay their bills (cluster 3); while a small
proportion (7%) is experiencing real difficulty (cluster 4) (Table 15).
17
The K-means or ‘quick cluster’ approach is the method we have used. 18 As we see later, however, the collapsing of categories can be helpful. It is how a suitable cut-off point is identified that is
crucial. 19 Examination of the within and between cluster variance has shown this to be an efficient model.
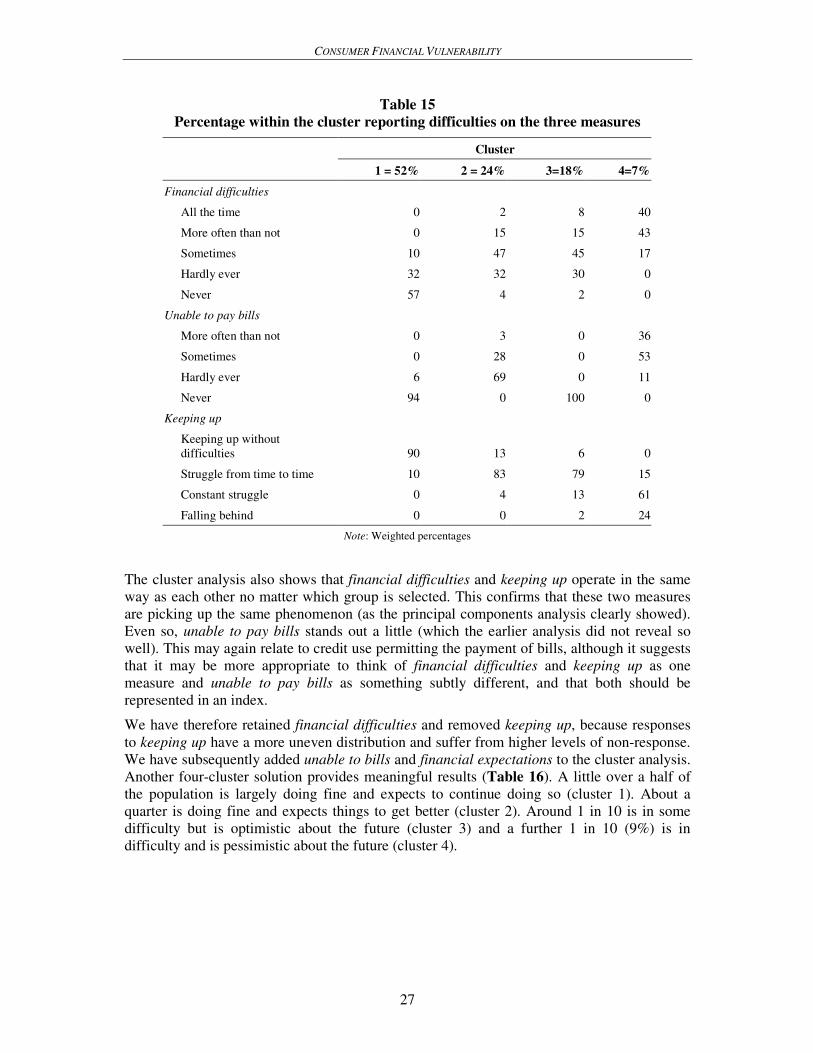
CONSUMER FINANCIAL VULNERABILITY
27
Table 15
Percentage within the cluster reporting difficulties on the three measures
Cluster
1 = 52% 2 = 24% 3=18% 4=7%
Financial difficulties
All the time 0 2 8 40
More often than not 0 15 15 43
Sometimes 10 47 45 17
Hardly ever 32 32 30 0
Never 57 4 2 0
Unable to pay bills
More often than not 0 3 0 36
Sometimes 0 28 0 53
Hardly ever 6 69 0 11
Never 94 0 100 0
Keeping up
Keeping up without
difficulties 90 13 6 0
Struggle from time to time 10 83 79 15
Constant struggle 0 4 13 61
Falling behind 0 0 2 24
Note: Weighted percentages
The cluster analysis also shows that financial difficulties and keeping up operate in the same
way as each other no matter which group is selected. This confirms that these two measures
are picking up the same phenomenon (as the principal components analysis clearly showed).
Even so, unable to pay bills stands out a little (which the earlier analysis did not reveal so
well). This may again relate to credit use permitting the payment of bills, although it suggests
that it may be more appropriate to think of financial difficulties and keeping up as one
measure and unable to pay bills as something subtly different, and that both should be
represented in an index.
We have therefore retained financial difficulties and removed keeping up, because responses
to keeping up have a more uneven distribution and suffer from higher levels of non-response.
We have subsequently added unable to bills and financial expectations to the cluster analysis.
Another four-cluster solution provides meaningful results (Table 16). A little over a half of
the population is largely doing fine and expects to continue doing so (cluster 1). About a
quarter is doing fine and expects things to get better (cluster 2). Around 1 in 10 is in some
difficulty but is optimistic about the future (cluster 3) and a further 1 in 10 (9%) is in
difficulty and is pessimistic about the future (cluster 4).
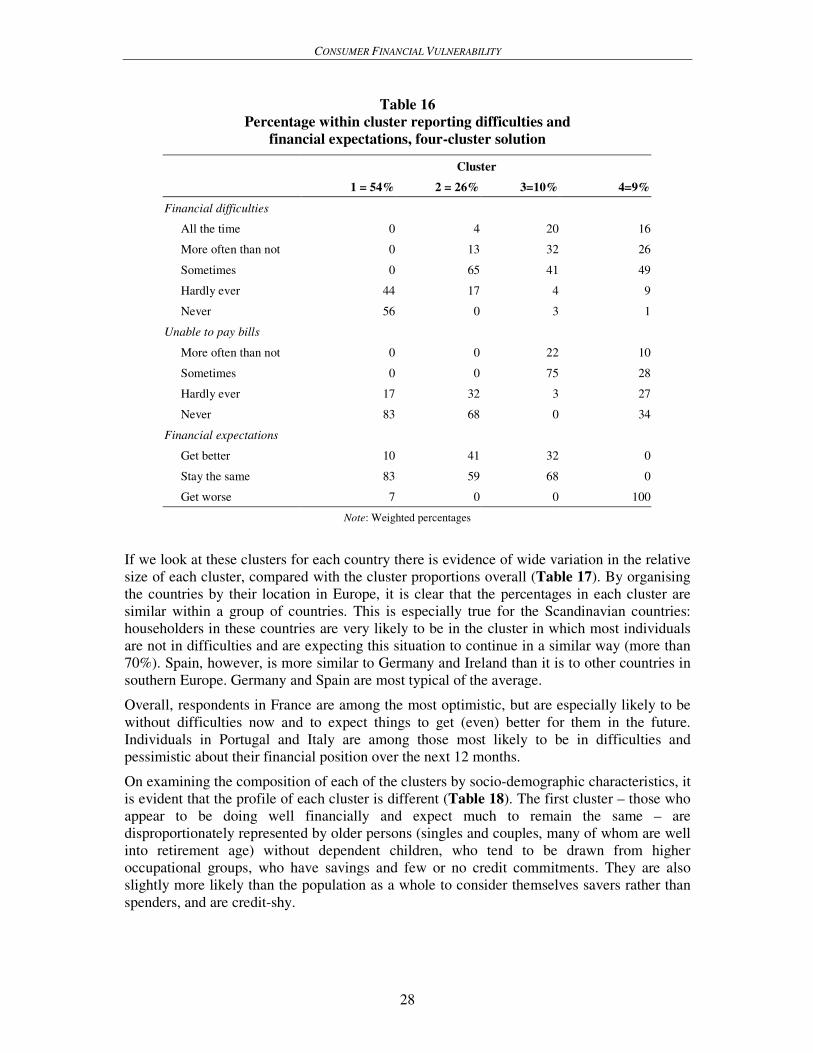
CONSUMER FINANCIAL VULNERABILITY
28
Table 16
Percentage within cluster reporting difficulties and
financial expectations, four-cluster solution
Cluster
1 = 54% 2 = 26% 3=10% 4=9%
Financial difficulties
All the time 0 4 20 16
More often than not 0 13 32 26
Sometimes 0 65 41 49
Hardly ever 44 17 4 9
Never 56 0 3 1
Unable to pay bills
More often than not 0 0 22 10
Sometimes 0 0 75 28
Hardly ever 17 32 3 27
Never 83 68 0 34
Financial expectations
Get better 10 41 32 0
Stay the same 83 59 68 0
Get worse 7 0 0 100
Note: Weighted percentages
If we look at these clusters for each country there is evidence of wide variation in the relative
size of each cluster, compared with the cluster proportions overall (Table 17). By organising
the countries by their location in Europe, it is clear that the percentages in each cluster are
similar within a group of countries. This is especially true for the Scandinavian countries:
householders in these countries are very likely to be in the cluster in which most individuals
are not in difficulties and are expecting this situation to continue in a similar way (more than
70%). Spain, however, is more similar to Germany and Ireland than it is to other countries in
southern Europe. Germany and Spain are most typical of the average.
Overall, respondents in France are among the most optimistic, but are especially likely to be
without difficulties now and to expect things to get (even) better for them in the future.
Individuals in Portugal and Italy are among those most likely to be in difficulties and
pessimistic about their financial position over the next 12 months.
On examining the composition of each of the clusters by socio-demographic characteristics, it
is evident that the profile of each cluster is different (Table 18). The first cluster – those who
appear to be doing well financially and expect much to remain the same – are
disproportionately represented by older persons (singles and couples, many of whom are well
into retirement age) without dependent children, who tend to be drawn from higher
occupational groups, who have savings and few or no credit commitments. They are also
slightly more likely than the population as a whole to consider themselves savers rather than
spenders, and are credit-shy.
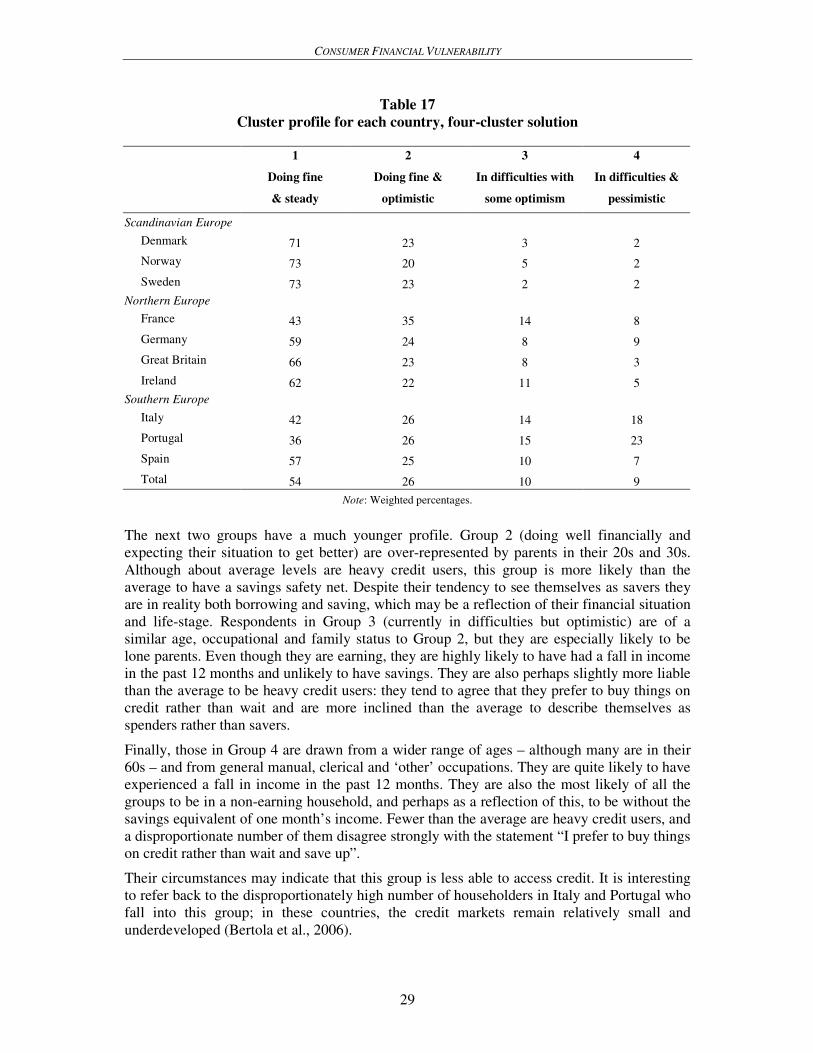
CONSUMER FINANCIAL VULNERABILITY
29
Table 17
Cluster profile for each country, four-cluster solution
1
Doing fine
& steady
2
Doing fine &
optimistic
3
In difficulties with
some optimism
4
In difficulties &
pessimistic
Scandinavian Europe
Denmark 71 23 3 2
Norway 73 20 5 2
Sweden 73 23 2 2
Northern Europe
France 43 35 14 8
Germany 59 24 8 9
Great Britain 66 23 8 3
Ireland 62 22 11 5
Southern Europe
Italy 42 26 14 18
Portugal 36 26 15 23
Spain 57 25 10 7
Total 54 26 10 9
Note: Weighted percentages.
The next two groups have a much younger profile. Group 2 (doing well financially and
expecting their situation to get better) are over-represented by parents in their 20s and 30s.
Although about average levels are heavy credit users, this group is more likely than the
average to have a savings safety net. Despite their tendency to see themselves as savers they
are in reality both borrowing and saving, which may be a reflection of their financial situation
and life-stage. Respondents in Group 3 (currently in difficulties but optimistic) are of a
similar age, occupational and family status to Group 2, but they are especially likely to be
lone parents. Even though they are earning, they are highly likely to have had a fall in income
in the past 12 months and unlikely to have savings. They are also perhaps slightly more liable
than the average to be heavy credit users: they tend to agree that they prefer to buy things on
credit rather than wait and are more inclined than the average to describe themselves as
spenders rather than savers.
Finally, those in Group 4 are drawn from a wider range of ages – although many are in their
60s – and from general manual, clerical and ‘other’ occupations. They are quite likely to have
experienced a fall in income in the past 12 months. They are also the most likely of all the
groups to be in a non-earning household, and perhaps as a reflection of this, to be without the
savings equivalent of one month’s income. Fewer than the average are heavy credit users, and
a disproportionate number of them disagree strongly with the statement “I prefer to buy things
on credit rather than wait and save up”.
Their circumstances may indicate that this group is less able to access credit. It is interesting
to refer back to the disproportionately high number of householders in Italy and Portugal who
fall into this group; in these countries, the credit markets remain relatively small and
underdeveloped (Bertola et al., 2006).
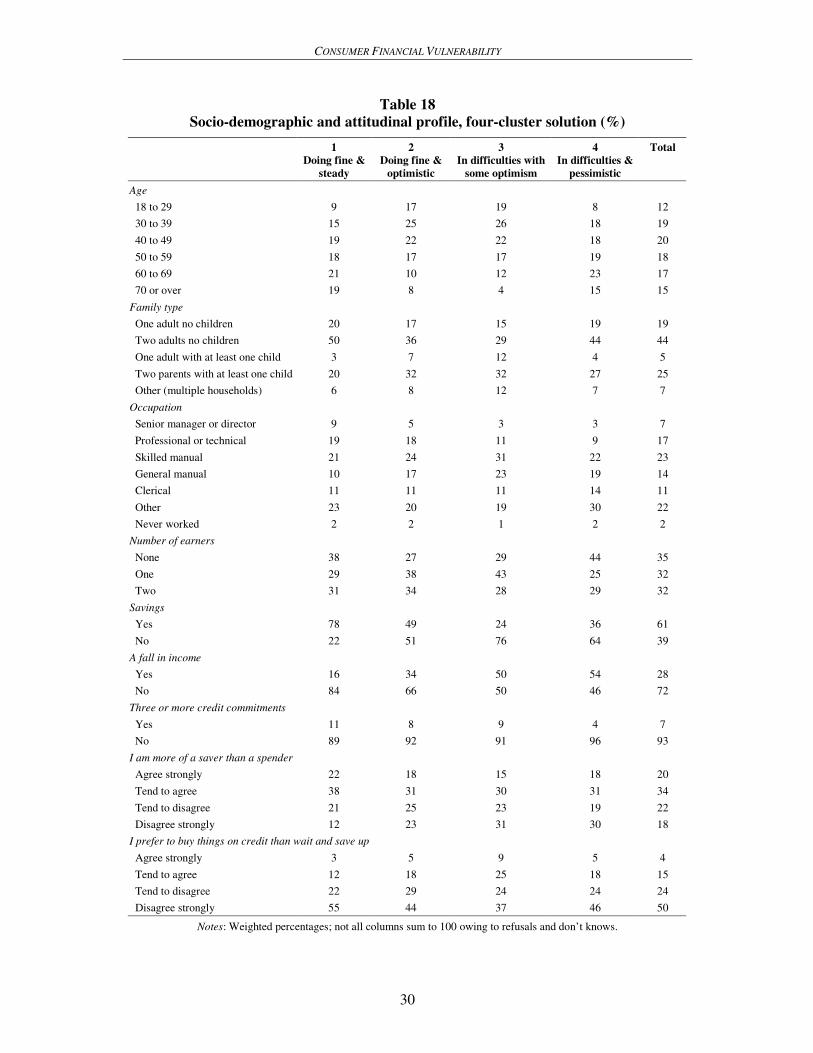
CONSUMER FINANCIAL VULNERABILITY
30
Table 18
Socio-demographic and attitudinal profile, four-cluster solution (%)
1
Doing fine &
steady
2
Doing fine &
optimistic
3
In difficulties with
some optimism
4
In difficulties &
pessimistic
Total
Age
18 to 29 9 17 19 8 12
30 to 39 15 25 26 18 19
40 to 49 19 22 22 18 20
50 to 59 18 17 17 19 18
60 to 69 21 10 12 23 17
70 or over 19 8 4 15 15
Family type
One adult no children 20 17 15 19 19
Two adults no children 50 36 29 44 44
One adult with at least one child 3 7 12 4 5
Two parents with at least one child 20 32 32 27 25
Other (multiple households) 6 8 12 7 7
Occupation
Senior manager or director 9 5 3 3 7
Professional or technical 19 18 11 9 17
Skilled manual 21 24 31 22 23
General manual 10 17 23 19 14
Clerical 11 11 11 14 11
Other 23 20 19 30 22
Never worked 2 2 1 2 2
Number of earners
None 38 27 29 44 35
One 29 38 43 25 32
Two 31 34 28 29 32
Savings
Yes 78 49 24 36 61
No 22 51 76 64 39
A fall in income
Yes 16 34 50 54 28
No 84 66 50 46 72
Three or more credit commitments
Yes 11 8 9 4 7
No 89 92 91 96 93
I am more of a saver than a spender
Agree strongly 22 18 15 18 20
Tend to agree 38 31 30 31 34
Tend to disagree 21 25 23 19 22
Disagree strongly 12 23 31 30 18
I prefer to buy things on credit than wait and save up
Agree strongly 3 5 9 5 4
Tend to agree 12 18 25 18 15
Tend to disagree 22 29 24 24 24
Disagree strongly 55 44 37 46 50
Notes: Weighted percentages; not all columns sum to 100 owing to refusals and don’t knows.
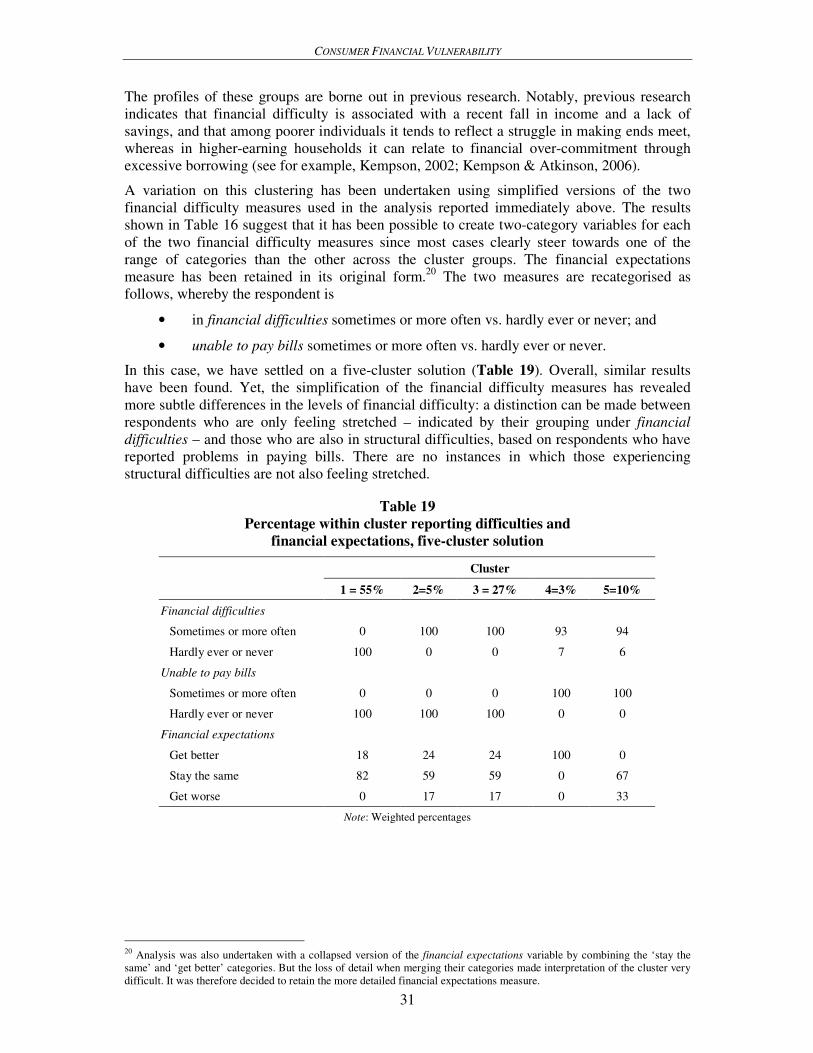
CONSUMER FINANCIAL VULNERABILITY
31
The profiles of these groups are borne out in previous research. Notably, previous research
indicates that financial difficulty is associated with a recent fall in income and a lack of
savings, and that among poorer individuals it tends to reflect a struggle in making ends meet,
whereas in higher-earning households it can relate to financial over-commitment through
excessive borrowing (see for example, Kempson, 2002; Kempson & Atkinson, 2006).
A variation on this clustering has been undertaken using simplified versions of the two
financial difficulty measures used in the analysis reported immediately above. The results
shown in Table 16 suggest that it has been possible to create two-category variables for each
of the two financial difficulty measures since most cases clearly steer towards one of the
range of categories than the other across the cluster groups. The financial expectations
measure has been retained in its original form.20
The two measures are recategorised as
follows, whereby the respondent is
• in financial difficulties sometimes or more often vs. hardly ever or never; and
• unable to pay bills sometimes or more often vs. hardly ever or never.
In this case, we have settled on a five-cluster solution (Table 19). Overall, similar results
have been found. Yet, the simplification of the financial difficulty measures has revealed
more subtle differences in the levels of financial difficulty: a distinction can be made between
respondents who are only feeling stretched – indicated by their grouping under financial
difficulties – and those who are also in structural difficulties, based on respondents who have
reported problems in paying bills. There are no instances in which those experiencing
structural difficulties are not also feeling stretched.
Table 19
Percentage within cluster reporting difficulties and
financial expectations, five-cluster solution
Cluster
1 = 55% 2=5% 3 = 27% 4=3% 5=10%
Financial difficulties
Sometimes or more often 0 100 100 93 94
Hardly ever or never 100 0 0 7 6
Unable to pay bills
Sometimes or more often 0 0 0 100 100
Hardly ever or never 100 100 100 0 0
Financial expectations
Get better 18 24 24 100 0
Stay the same 82 59 59 0 67
Get worse 0 17 17 0 33
Note: Weighted percentages
20
Analysis was also undertaken with a collapsed version of the financial expectations variable by combining the ‘stay the
same’ and ‘get better’ categories. But the loss of detail when merging their categories made interpretation of the cluster very
difficult. It was therefore decided to retain the more detailed financial expectations measure.
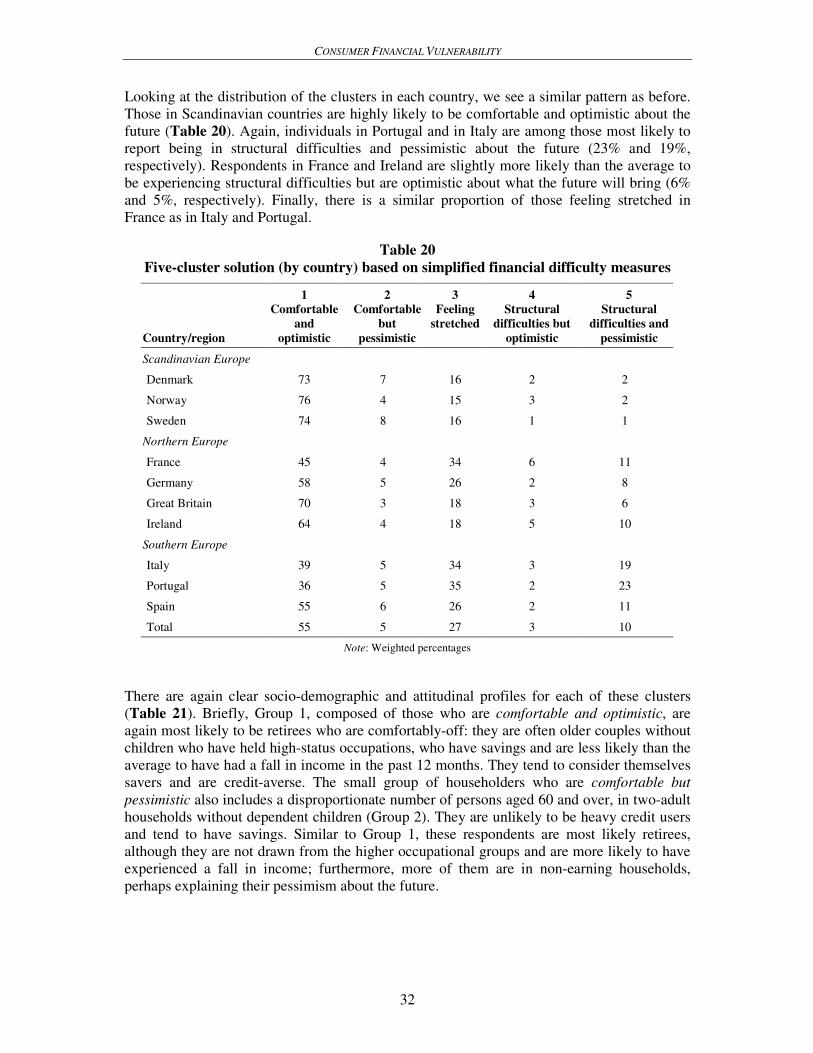
CONSUMER FINANCIAL VULNERABILITY
32
Looking at the distribution of the clusters in each country, we see a similar pattern as before.
Those in Scandinavian countries are highly likely to be comfortable and optimistic about the
future (Table 20). Again, individuals in Portugal and in Italy are among those most likely to
report being in structural difficulties and pessimistic about the future (23% and 19%,
respectively). Respondents in France and Ireland are slightly more likely than the average to
be experiencing structural difficulties but are optimistic about what the future will bring (6%
and 5%, respectively). Finally, there is a similar proportion of those feeling stretched in
France as in Italy and Portugal.
Table 20
Five-cluster solution (by country) based on simplified financial difficulty measures
Country/region
1
Comfortable
and
optimistic
2
Comfortable
but
pessimistic
3
Feeling
stretched
4
Structural
difficulties but
optimistic
5
Structural
difficulties and
pessimistic
Scandinavian Europe
Denmark 73 7 16 2 2
Norway 76 4 15 3 2
Sweden 74 8 16 1 1
Northern Europe
France 45 4 34 6 11
Germany 58 5 26 2 8
Great Britain 70 3 18 3 6
Ireland 64 4 18 5 10
Southern Europe
Italy 39 5 34 3 19
Portugal 36 5 35 2 23
Spain 55 6 26 2 11
Total 55 5 27 3 10
Note: Weighted percentages
There are again clear socio-demographic and attitudinal profiles for each of these clusters
(Table 21). Briefly, Group 1, composed of those who are comfortable and optimistic, are
again most likely to be retirees who are comfortably-off: they are often older couples without
children who have held high-status occupations, who have savings and are less likely than the
average to have had a fall in income in the past 12 months. They tend to consider themselves
savers and are credit-averse. The small group of householders who are comfortable but
pessimistic also includes a disproportionate number of persons aged 60 and over, in two-adult
households without dependent children (Group 2). They are unlikely to be heavy credit users
and tend to have savings. Similar to Group 1, these respondents are most likely retirees,
although they are not drawn from the higher occupational groups and are more likely to have
experienced a fall in income; furthermore, more of them are in non-earning households,
perhaps explaining their pessimism about the future.
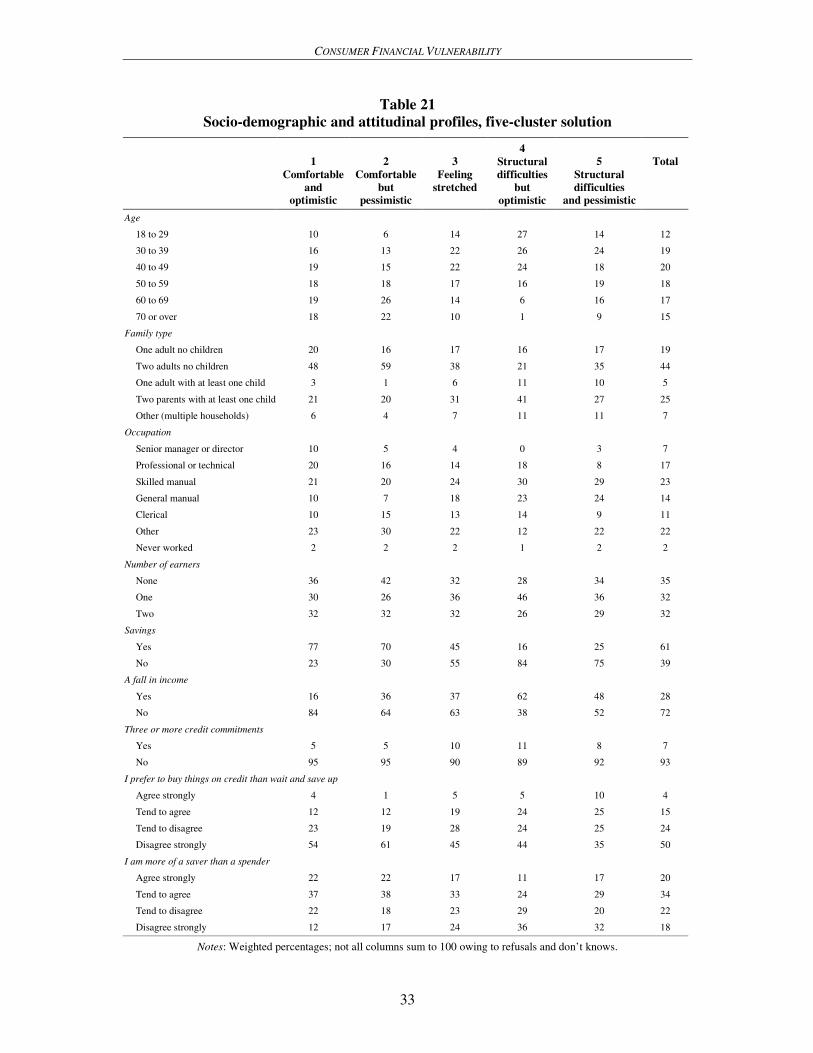
CONSUMER FINANCIAL VULNERABILITY
33
Table 21
Socio-demographic and attitudinal profiles, five-cluster solution
1
Comfortable
and
optimistic
2
Comfortable
but
pessimistic
3
Feeling
stretched
4
Structural
difficulties
but
optimistic
5
Structural
difficulties
and pessimistic
Total
Age
18 to 29 10 6 14 27 14 12
30 to 39 16 13 22 26 24 19
40 to 49 19 15 22 24 18 20
50 to 59 18 18 17 16 19 18
60 to 69 19 26 14 6 16 17
70 or over 18 22 10 1 9 15
Family type
One adult no children 20 16 17 16 17 19
Two adults no children 48 59 38 21 35 44
One adult with at least one child 3 1 6 11 10 5
Two parents with at least one child 21 20 31 41 27 25
Other (multiple households) 6 4 7 11 11 7
Occupation
Senior manager or director 10 5 4 0 3 7
Professional or technical 20 16 14 18 8 17
Skilled manual 21 20 24 30 29 23
General manual 10 7 18 23 24 14
Clerical 10 15 13 14 9 11
Other 23 30 22 12 22 22
Never worked 2 2 2 1 2 2
Number of earners
None 36 42 32 28 34 35
One 30 26 36 46 36 32
Two 32 32 32 26 29 32
Savings
Yes 77 70 45 16 25 61
No 23 30 55 84 75 39
A fall in income
Yes 16 36 37 62 48 28
No 84 64 63 38 52 72
Three or more credit commitments
Yes 5 5 10 11 8 7
No 95 95 90 89 92 93
I prefer to buy things on credit than wait and save up
Agree strongly 4 1 5 5 10 4
Tend to agree 12 12 19 24 25 15
Tend to disagree 23 19 28 24 25 24
Disagree strongly 54 61 45 44 35 50
I am more of a saver than a spender
Agree strongly 22 22 17 11 17 20
Tend to agree 37 38 33 24 29 34
Tend to disagree 22 18 23 29 20 22
Disagree strongly 12 17 24 36 32 18
Notes: Weighted percentages; not all columns sum to 100 owing to refusals and don’t knows.
CONSUMER FINANCIAL VULNERABILITY
34
The next largest group, who are merely feeling stretched rather than having actual difficulties
paying bills (and who have very mixed views about the future), are much younger couple
parents with dependent children (Group 3). They are less likely than the average to have
savings and are slightly more likely to have experienced a fall in income in the previous 12
months. This group also consists of a disproportionately high number of heavy credit users
and are less likely to have savings than the average, reflected in attitudes that are more
favourable towards credit and spending, over saving.
Group 4, made up of those who have structural difficulties but are optimistic, are also young,
but are over-represented by couple parents with children. They are more likely than the
average to be in an earning household, yet they are nevertheless the group least likely to have
savings and they are at the higher end of the range in terms of heavy credit users. These
findings may be explained by the high proportions in this group who report having had a fall
in income in the past 12 months, although their attitudes reflect their saving and borrowing
behaviour. It is possible that these are primarily householders who have just started or are
expanding their families – typically a period during which demands on the budget are highest.
The final cluster of Group 5, representing those who have structural difficulties and are
pessimistic, are disproportionately in their 30s and are more likely than average to be lone
parents or in multiple households. They are over-represented by general manual workers.
Three-quarters have no savings, although they are no more probable than average to be heavy
credit users. Notably, they are much more likely than average to have had a fall in income in
the past 12 months. Members of this group are more likely to see themselves as spenders and
to prefer buying things on credit (Table 21).
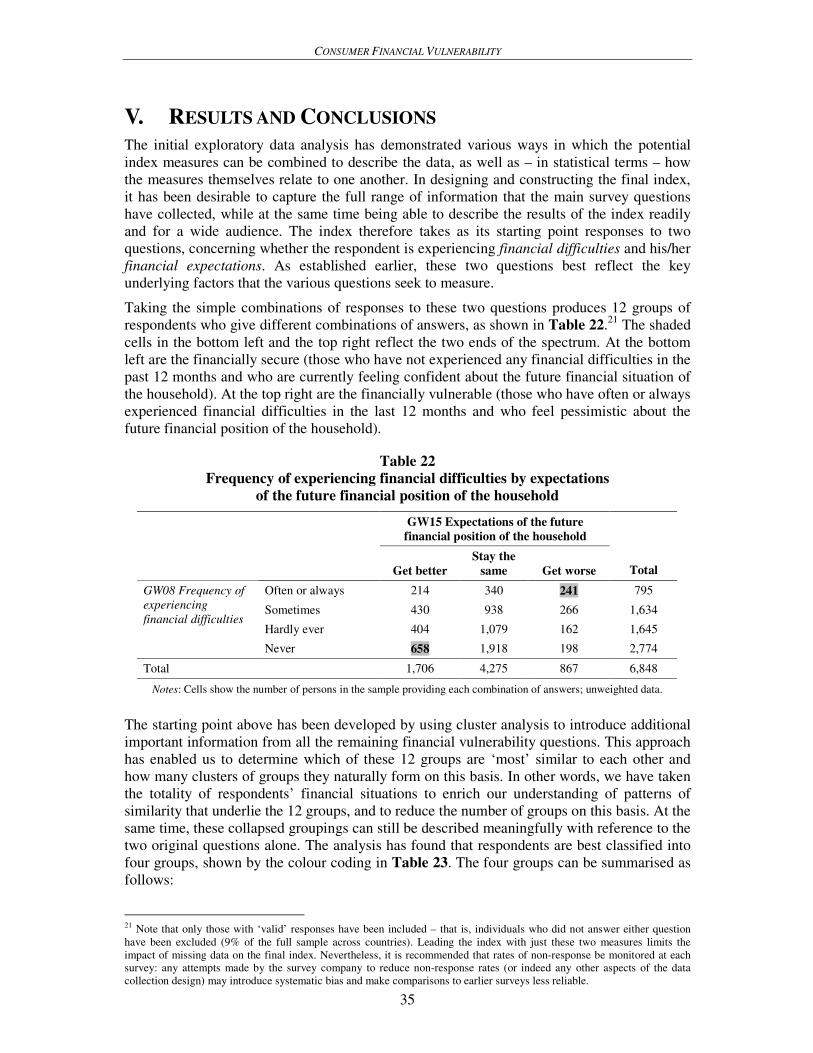
CONSUMER FINANCIAL VULNERABILITY
35
V. RESULTS AND CONCLUSIONS
The initial exploratory data analysis has demonstrated various ways in which the potential
index measures can be combined to describe the data, as well as – in statistical terms – how
the measures themselves relate to one another. In designing and constructing the final index,
it has been desirable to capture the full range of information that the main survey questions
have collected, while at the same time being able to describe the results of the index readily
and for a wide audience. The index therefore takes as its starting point responses to two
questions, concerning whether the respondent is experiencing financial difficulties and his/her
financial expectations. As established earlier, these two questions best reflect the key
underlying factors that the various questions seek to measure.
Taking the simple combinations of responses to these two questions produces 12 groups of
respondents who give different combinations of answers, as shown in Table 22.21
The shaded
cells in the bottom left and the top right reflect the two ends of the spectrum. At the bottom
left are the financially secure (those who have not experienced any financial difficulties in the
past 12 months and who are currently feeling confident about the future financial situation of
the household). At the top right are the financially vulnerable (those who have often or always
experienced financial difficulties in the last 12 months and who feel pessimistic about the
future financial position of the household).
Table 22
Frequency of experiencing financial difficulties by expectations
of the future financial position of the household
GW15 Expectations of the future
financial position of the household
Get better Stay the
same Get worse Total
Often or always 214 340 241 795
Sometimes 430 938 266 1,634
Hardly ever 404 1,079 162 1,645
GW08 Frequency of
experiencing
financial difficulties
Never 658 1,918 198 2,774
Total 1,706 4,275 867 6,848
Notes: Cells show the number of persons in the sample providing each combination of answers; unweighted data.
The starting point above has been developed by using cluster analysis to introduce additional
important information from all the remaining financial vulnerability questions. This approach
has enabled us to determine which of these 12 groups are ‘most’ similar to each other and
how many clusters of groups they naturally form on this basis. In other words, we have taken
the totality of respondents’ financial situations to enrich our understanding of patterns of
similarity that underlie the 12 groups, and to reduce the number of groups on this basis. At the
same time, these collapsed groupings can still be described meaningfully with reference to the
two original questions alone. The analysis has found that respondents are best classified into
four groups, shown by the colour coding in Table 23. The four groups can be summarised as
follows:
21 Note that only those with ‘valid’ responses have been included – that is, individuals who did not answer either question
have been excluded (9% of the full sample across countries). Leading the index with just these two measures limits the
impact of missing data on the final index. Nevertheless, it is recommended that rates of non-response be monitored at each
survey: any attempts made by the survey company to reduce non-response rates (or indeed any other aspects of the data
collection design) may introduce systematic bias and make comparisons to earlier surveys less reliable.
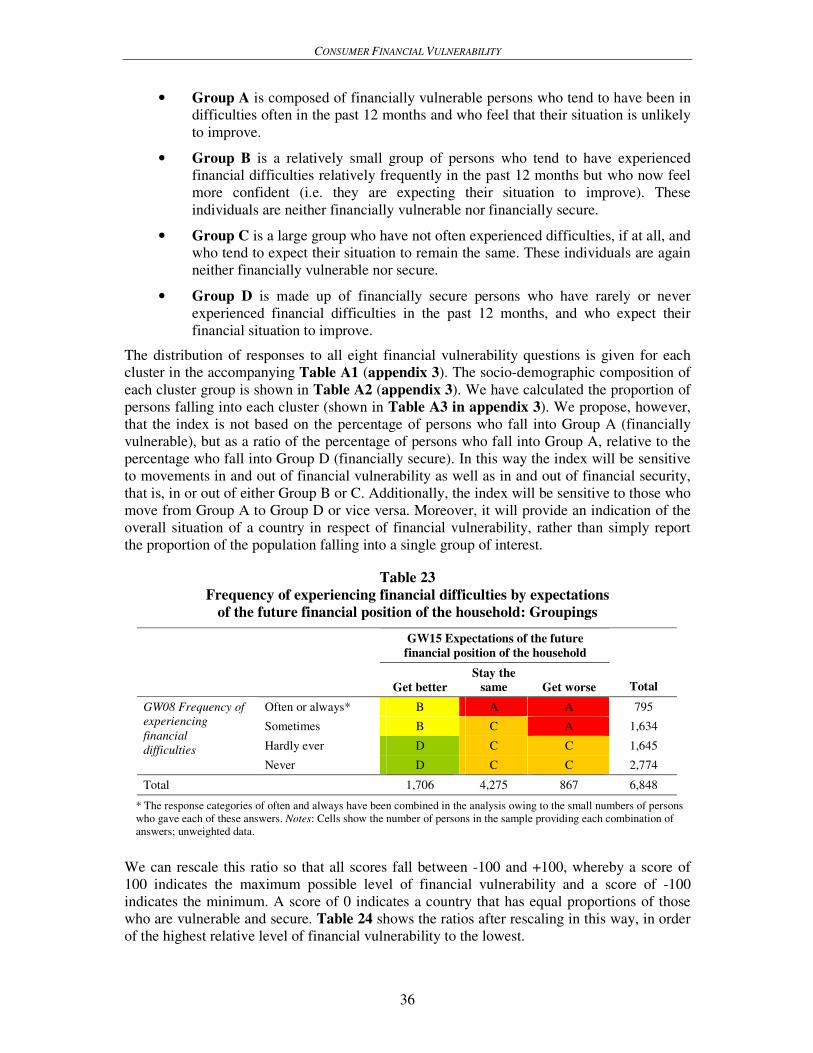
CONSUMER FINANCIAL VULNERABILITY
36
• Group A is composed of financially vulnerable persons who tend to have been in
difficulties often in the past 12 months and who feel that their situation is unlikely
to improve.
• Group B is a relatively small group of persons who tend to have experienced
financial difficulties relatively frequently in the past 12 months but who now feel
more confident (i.e. they are expecting their situation to improve). These
individuals are neither financially vulnerable nor financially secure.
• Group C is a large group who have not often experienced difficulties, if at all, and
who tend to expect their situation to remain the same. These individuals are again
neither financially vulnerable nor secure.
• Group D is made up of financially secure persons who have rarely or never
experienced financial difficulties in the past 12 months, and who expect their
financial situation to improve.
The distribution of responses to all eight financial vulnerability questions is given for each
cluster in the accompanying Table A1 (appendix 3). The socio-demographic composition of
each cluster group is shown in Table A2 (appendix 3). We have calculated the proportion of
persons falling into each cluster (shown in Table A3 in appendix 3). We propose, however,
that the index is not based on the percentage of persons who fall into Group A (financially
vulnerable), but as a ratio of the percentage of persons who fall into Group A, relative to the
percentage who fall into Group D (financially secure). In this way the index will be sensitive
to movements in and out of financial vulnerability as well as in and out of financial security,
that is, in or out of either Group B or C. Additionally, the index will be sensitive to those who
move from Group A to Group D or vice versa. Moreover, it will provide an indication of the
overall situation of a country in respect of financial vulnerability, rather than simply report
the proportion of the population falling into a single group of interest.
Table 23
Frequency of experiencing financial difficulties by expectations
of the future financial position of the household: Groupings
GW15 Expectations of the future
financial position of the household
Get better Stay the
same Get worse Total
Often or always* B A A 795
Sometimes B C A 1,634
Hardly ever D C C 1,645
GW08 Frequency of
experiencing
financial
difficulties
Never D C C 2,774
Total 1,706 4,275 867 6,848
* The response categories of often and always have been combined in the analysis owing to the small numbers of persons
who gave each of these answers. Notes: Cells show the number of persons in the sample providing each combination of
answers; unweighted data.
We can rescale this ratio so that all scores fall between -100 and +100, whereby a score of
100 indicates the maximum possible level of financial vulnerability and a score of -100
indicates the minimum. A score of 0 indicates a country that has equal proportions of those
who are vulnerable and secure. Table 24 shows the ratios after rescaling in this way, in order
of the highest relative level of financial vulnerability to the lowest.
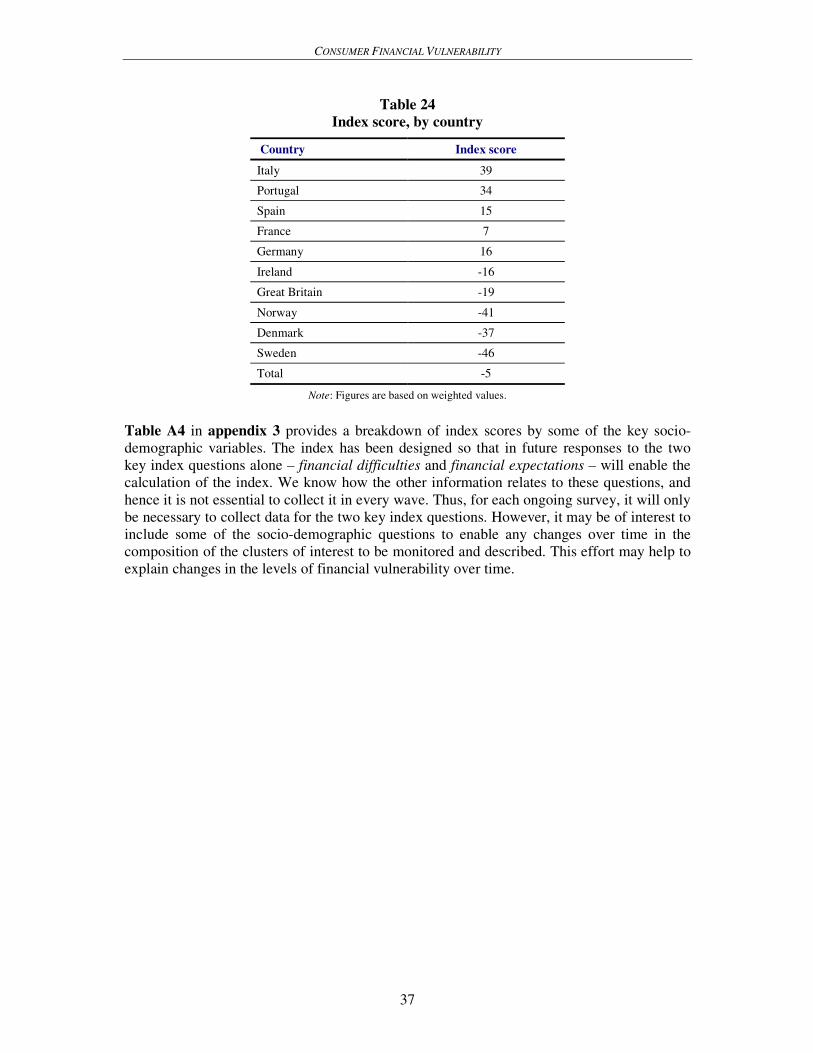
CONSUMER FINANCIAL VULNERABILITY
37
Table 24
Index score, by country
Country Index score
Italy 39
Portugal 34
Spain 15
France 7
Germany 16
Ireland -16
Great Britain -19
Norway -41
Denmark -37
Sweden -46
Total -5
Note: Figures are based on weighted values.
Table A4 in appendix 3 provides a breakdown of index scores by some of the key socio-
demographic variables. The index has been designed so that in future responses to the two
key index questions alone – financial difficulties and financial expectations – will enable the
calculation of the index. We know how the other information relates to these questions, and
hence it is not essential to collect it in every wave. Thus, for each ongoing survey, it will only
be necessary to collect data for the two key index questions. However, it may be of interest to
include some of the socio-demographic questions to enable any changes over time in the
composition of the clusters of interest to be monitored and described. This effort may help to
explain changes in the levels of financial vulnerability over time.
CONSUMER FINANCIAL VULNERABILITY
38
REFERENCES
Ando, A. and F. Modigliani (1963), “The life-cycle hypothesis of saving: Aggregate implications and
tests”, American Economic Review, Vol. 53, No. 1, pp. 55–84.
Andreeva, G., J. Ansell and J.N. Crook (2003), Credit scoring in the context of the European
integration: Assessing the performance of the generic models, Management School and
Economics, University of Edinburgh.
Atkinson, A., S. McKay, E. Kempson and S. Collard (2006), Levels of financial capability in the UK:
Results of a baseline survey, Financial Services Authority, London.
Berthoud, R. and E. Kempson (1992), Credit and debt: The PSI report, Policy Studies Institute,
London.
Bertola, G., R. Disney and C. Grant (2006), The economics of consumer credit, London: MIT Press.
Betti, G., N. Dourmashkin, M.C. Rossi, V. Verma and Y. Yin (2001), Study of the problem of
consumer indebtedness: Statistical aspects, Report for the Directorate-General for Health and
Consumer Protection, ORC Macro, London.
Bridges, S. and R. Disney (2002), “Access to credit, and debt, among low income families in the UK”,
mimeo, University of Nottingham.
Brown, S., G. Garino, K. Taylor and S.W. Price (2003), Debt and financial expectations: An
individual and household level analysis, Working Paper, University of Leicester.
Camerer, C.F. and G. Loewenstein (2002), “Behavioural economics: Past, present, future”, mimeo,
Carnegie-Mellon University.
Carpentier, S. and K. Van den Bosch, Problematic debts in Belgium: Indicators based on Belgian
SILC 2004 and profile of the population with (problematic) indebtedness, Working Paper Social
Security No. 7 (forthcoming).
Crook, J.N., D.B. Edelman and L.C. Thomas (2002), Credit scoring and its applications, Philadelphia:
SIAM.
Cox, P., J. Whitley and P. Brierley (2002), “Financial pressures in the UK household sector: Evidence
from the British Household Panel Survey”, Bank of England Quarterly Bulletin, Winter, pp.
410–19.
Davis, G. and M. Olson (1985), Management information systems: Conceptual foundations, structure
and development, New York, NY: McGraw-Hill.
DeJoy, D.M. (1989), “The optimism bias and traffic accident risk perception”, Accident Analysis and
Prevention, Vol. 21, No. 4, pp. 333–40.
Epstein, R.A. (2006), “Behavioural economics: Human errors and market”, mimeo, University of
Chicago (retrieved from http://lawreview.uchicago.edu/issues/archive/v73/winter/
07.Epstein.pdf).
European Credit Research Institue and Personal Finance Research Centre (2008), European Trends in
Consumer Financial Vulnerability, Research Report, European Credit Research Institute,
Brussels.
Evans, G.W. and S. Honkapohja (2001), “Economics of expectations”, in International Encyclopaedia
of the Social and Behavioural Sciences, Amsterdam: Elsevier, pp. 5060–66.
Fair Isaac (2003), A discussion of data analysis, prediction and decision techniques, White Paper, Fair
Isaac, Minneapolis, MN, May.
Ford, L., E. Kempson and M. Wilson (1995), Mortgage arrears and possessions: Perspectives from
borrowers, lenders and the courts, Department of the Environment, London.
Friedman, M. (1957), A theory of the consumption function, Princeton University Press: Princeton, NJ.
CONSUMER FINANCIAL VULNERABILITY
39
Gloukoviezoff, G. (2006), Surendettement des particuliers en France, Report, International Labour
Office, Geneva.
Hand, D.J. and W.E. Henley (1997), “Statistical classification methods in consumer credit scoring: A
review”, Journal of the Royal Statistical Society, Vol. 160, No. 3, pp 523–41.
Herbert, A. and E. Kempson (1995), Water debt and disconnection, Policy Studies Institute, London.
Howe, I. and G. Platts (1997), “A single European scorecard”, in Credit Scoring and Credit Control
V, Conference Proceedings, Management School, Edinburgh.
Jentzsch, N. (2007), Financial Privacy – An International Comparison of Credit Reporting Systems,
Heidelberg: Springer.
Kahneman, D. (1999), “Objective happiness”, in D. Kahneman, E. Diener and N. Schwarz, Well-
being: The foundations of hedonic psychology, New York, NY: Russell Sage Foundation.
Kahneman, D. and A. Tversy (1979), “Prospect theory: An analysis of decision under risk”,
Econometrica, Vol. 47, No. 2, pp. 263–91.
Kask, J. (2003), “Household debt and financial stability”, Kroon & Economy, No. 4, pp. 35–42.
Kempson, E. (2002), Over-indebtedness in Britain, Department of Trade and Industry, London.
Kempson, E. and A. Atkinson (2006), Overstretched: People at risk of financial difficulties, Personal
Finance Research Centre, Bristol.
Livingstone, S.M. and P.K. Lunt (1992), “Predicting personal debt and debt repayment:
Psychological, social and economic determinants”, Journal of Economic Psychology, Vol. 13,
No. 1, pp. 111–34.
Modigliani, F. and R. Brumberg (1954), “Utility analysis and the consumption function: An
interpretation of cross section data”, in K. Kurihara (ed.), Post-Keynesian Economics: New
Brunswick, NJ: Rutgers University Press.
MORI (2003), Financial over-commitment survey, Citizen’s Advice, London.
––––––––– (2005), Over-indebtedness in Britain: A DTI report on the MORI Financial Services
survey 2004, Department for Trade and Industry, London.
Muttilainen, V. and M. Reijo (2007), Households’ Payment Problems 2002-2005, Research
Communication No. 81, National Research Institute of Legal Policy, Helsinki (retrieved from
http://www.optula.om.fi/uploads/5pl9ufx4.pdf).
Oxera (2004), Are UK households over-indebted?, Report prepared for Payment Clearing Services,
the British Bankers Association, the Consumer Credit Association, and the Finance & Leasing
Association, Oxford Economic Research Associates, Oxford.
Paredes, T.A., “Blinded by the light: Information overload and its consequences for securities
regulation”, Washington University Law Quarterly (forthcoming).
Pesendorfer, W. (2006), “Behavioural economics comes of age: A review essay on advances in
behavioural economics”, Journal of Economic Literature, XLIV (September), pp. 712–21.
Poppe, C. (1999), “Risk exposure to payment problems: Payment problems among Norwegians in the
Nineties”, in “Consumer Strategies in a Changing Financial Market, 60th Anniversary Seminar
October 1999”, National Institute for Consumer Research (SIFO), Oslo.
Pyper, W. (2002), “Falling behind”, Statistics Canada: Perspectives on Labour and Income, Vol. 3,
No. 7, pp. 17–23.
Raynard, R. (2006), Annex C – The psychology of consumer credit risk management: The case of
payment protection insurance in the UK, Office of Fair Trading, London, October.
Ranyard, R., L. Hinkley, J. Williamson and S. McHugha (2006), “The Role of Mental Accounting in
Consumer Credit Decision Processes”, Journal of Economic Psychology, Vol. 27, No. 4, pp.
571–88.
CONSUMER FINANCIAL VULNERABILITY
40
Rebiere, N. (2007), “Community Statistics on Income and Living Conditions (EU-SILC) and Over-
indebtedness: The example of France”, Meeting of the Working Group of SRCV users (French
module of the EU-SILC), INSEE, Paris, 23.10.2007.
Savage, L.J. (1954), The Foundations of Statistics, New York, NY: Wiley Publishers.
Shefrin, H.M. and R. Thaler (1988), “The behavioural life-cycle hypothesis”, Economic Inquiry, Vol.
26, No. 4, pp. 609–43.
Thomas, L.C. (2000), “A Survey of Credit and Behavioural Scoring: Forecasting Financial Risk of
Lending to Consumers”, International Journal for Forecasting, Vol. 16, No. 2, pp. 149–72.
Tokunaga, H. (1993), “The use and abuse of consumer credit: Application of psychological theory and
research”, Journal of Economic Psychology, Vol. 14, No. 2, pp. 285–316.
Tufte, P.A. (1999), Vulnerable consumers in the financial market, National Institute for Consumer
Research (SIFO), Oslo.
Webley, P. and E.K. Nyhus (2001), “Life-cycle and dispositional routes into problem debt”, British
Journal of Psychology, Vol. 92, pp. 423–46.
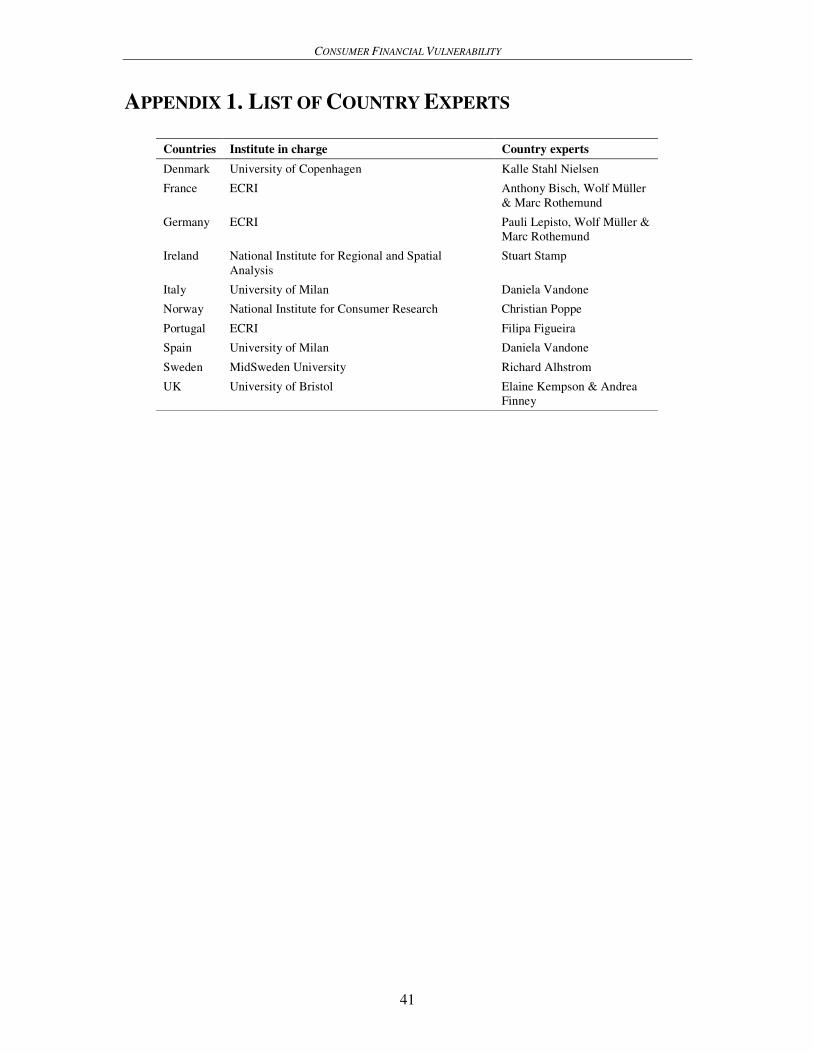
CONSUMER FINANCIAL VULNERABILITY
41
APPENDIX 1. LIST OF COUNTRY EXPERTS
Countries Institute in charge Country experts
Denmark University of Copenhagen Kalle Stahl Nielsen
France ECRI Anthony Bisch, Wolf Müller
& Marc Rothemund
Germany ECRI Pauli Lepisto, Wolf Müller &
Marc Rothemund
Ireland National Institute for Regional and Spatial
Analysis
Stuart Stamp
Italy University of Milan Daniela Vandone
Norway National Institute for Consumer Research Christian Poppe
Portugal ECRI Filipa Figueira
Spain University of Milan Daniela Vandone
Sweden MidSweden University Richard Alhstrom
UK University of Bristol Elaine Kempson & Andrea
Finney

CONSUMER FINANCIAL VULNERABILITY
42
APPENDIX 2. MODULE FOR IPSOS MORI
GENWORTH DRAFT QUESTIONNAIRE
Introduction:
I’d now like to talk to you about managing your finances. There are some questions here that some people might
regard as asking about sensitive information. Please be assured that any answer you give will be treated in the
strictest confidence, will only be used for research purposes, and will not under any circumstances be used for
sales or direct marketing purposes.
ASK ALL.
GW01. Are you (or is your partner), the person in whose name this home is rented/owned?
(SP)
1. Yes
2. No
ASK ALL WHO CODED 1 @ GW01 (E.G. ALL HEADS OF HOUSEHOLD)
GW02. SHOWCARD GW02. Who normally shares your accommodation with you?
(MP but code 1 should be SP only, allow REF)
1. No one else
2. Wife, husband or partner you live with as a couple
3. Children aged under 16
4. Children aged 16-18 who are at school or college
5. Other children aged 16 or over
6. Other adults who share meals or the living room with you
ASK ALL WHO CODED 1 @ GW01 (E.G. ALL HEADS OF HOUSEHOLD)
GW03. And how many people in your household, including yourself, are aged 15 or over (please substitute ’15
or over’ for ’14 or over’ in Germany)
(Numeric 1-20, allow REF)
ASK ALL WHO CODED 1 @ GW01 (E.G. ALL HEADS OF HOUSEHOLD)
GW04. SHOWCARD GW04. Starting from the top of this card, please can you tell me which of these best
describes your current employment situation?
(SP, allow DK & REF)
1. Working full time (30+ hours), even if you are temporarily off work
2. Working part time (up to 29 hours), even if you are temporarily off work
3. Looking after the home or family
4. Retired from paid work
5. Unemployed
6. On a government work or training scheme
7. Permanently sick or disabled
8. In full-time education
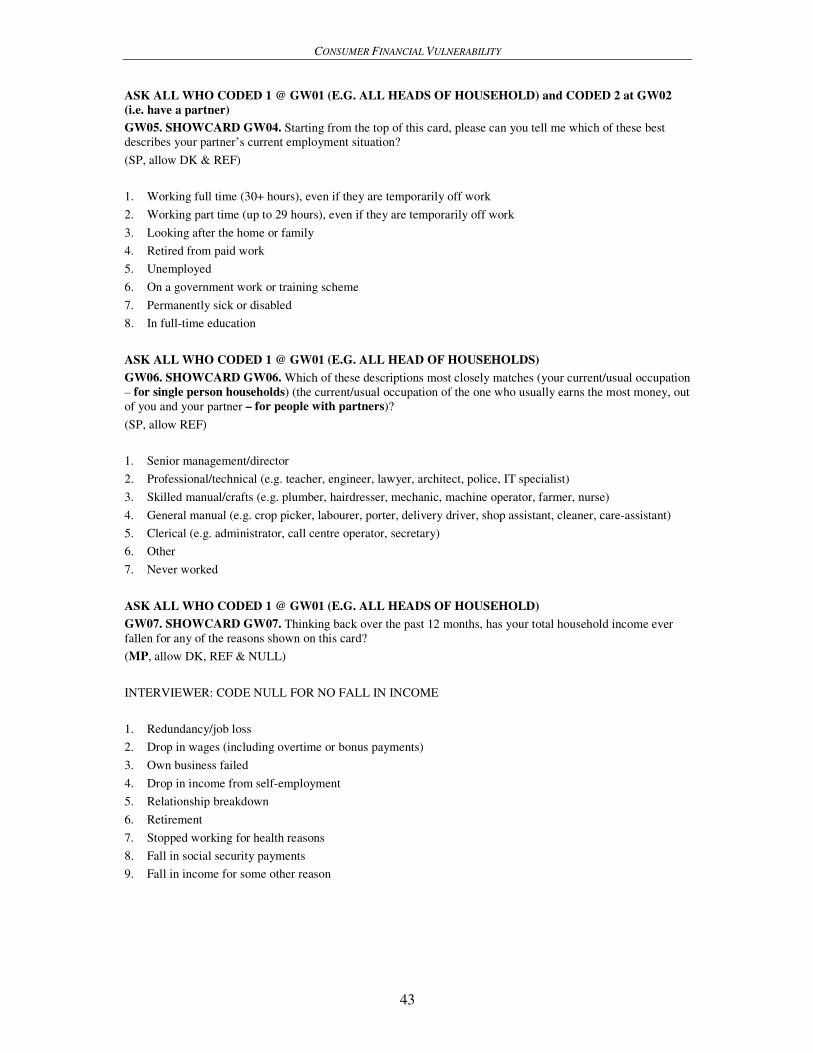
CONSUMER FINANCIAL VULNERABILITY
43
ASK ALL WHO CODED 1 @ GW01 (E.G. ALL HEADS OF HOUSEHOLD) and CODED 2 at GW02
(i.e. have a partner)
GW05. SHOWCARD GW04. Starting from the top of this card, please can you tell me which of these best
describes your partner’s current employment situation?
(SP, allow DK & REF)
1. Working full time (30+ hours), even if they are temporarily off work
2. Working part time (up to 29 hours), even if they are temporarily off work
3. Looking after the home or family
4. Retired from paid work
5. Unemployed
6. On a government work or training scheme
7. Permanently sick or disabled
8. In full-time education
ASK ALL WHO CODED 1 @ GW01 (E.G. ALL HEAD OF HOUSEHOLDS)
GW06. SHOWCARD GW06. Which of these descriptions most closely matches (your current/usual occupation
– for single person households) (the current/usual occupation of the one who usually earns the most money, out
of you and your partner – for people with partners)?
(SP, allow REF)
1. Senior management/director
2. Professional/technical (e.g. teacher, engineer, lawyer, architect, police, IT specialist)
3. Skilled manual/crafts (e.g. plumber, hairdresser, mechanic, machine operator, farmer, nurse)
4. General manual (e.g. crop picker, labourer, porter, delivery driver, shop assistant, cleaner, care-assistant)
5. Clerical (e.g. administrator, call centre operator, secretary)
6. Other
7. Never worked
ASK ALL WHO CODED 1 @ GW01 (E.G. ALL HEADS OF HOUSEHOLD)
GW07. SHOWCARD GW07. Thinking back over the past 12 months, has your total household income ever
fallen for any of the reasons shown on this card?
(MP, allow DK, REF & NULL)
INTERVIEWER: CODE NULL FOR NO FALL IN INCOME
1. Redundancy/job loss
2. Drop in wages (including overtime or bonus payments)
3. Own business failed
4. Drop in income from self-employment
5. Relationship breakdown
6. Retirement
7. Stopped working for health reasons
8. Fall in social security payments
9. Fall in income for some other reason

CONSUMER FINANCIAL VULNERABILITY
44
ASK ALL WHO CODED 1 @ GW01 (E.G. ALL HEAD OF HOUSEHOLDS)
GW08. Thinking about the general financial position of your household now, how often do you experience
financial difficulties?
(SP, allow DK & REF); READ OUT
1. All the time
2. More often than not
3. Sometimes
4. Hardly ever
5. Never
ASK ALL WHO CODED 1 @ GW01 (E.G. ALL HEAD OF HOUSEHOLDS)
GW09. In the last 12 months, how often was your household unable to pay bills or financial commitments at the
very last reminder due to lack of money?
(SP, allow DK & REF); READ OUT
1. More often than not
2. Sometimes
3. Hardly ever
4. Never
ASK ALL WHO CODED 1 @ GW01 (E.G. ALL HEADS OF HOUSEHOLD)
GW10. And do you (and your partner) currently have as much money in savings as you get in income each
month?
INTERVIEWER: IF THE RESPONDENT’S SAVINGS ARE EQUAL TO OR ARE MORE THAN ONE
MONTH’S INCOME THEY SHOULD BE CODED AS YES.
(SP, allow DK and REF)
1. Yes
2. No
ASK ALL WHO CODED 1 @ GW01 (E.G. ALL HEADS OF HOUSEHOLD)
GW11. SHOWCARD GW11. Looking at this card, can you tell me which, if any, of the following types of
credit you or your partner has used in the last 12 months?
(MP, allow DK, REF and NULL)
INTERVIEWER: CODE NULL FOR NONE OF THESE
1. Loan from bank, building society (excluding mortgage)
2. Loan from company that collects payments from your home
3. Loan from a financial company
4. Goods bought in instalments from a mail order catalogue
5. Goods bought on hire purchase or on credit
6. Social Fund Budgeting Loan and/or equivalent government loan for benefit recipients and/or low income
households
7. Loan from a student loan company or equivalent
8. A credit card that you do not pay off in full each month
9. An overdraft you have used
10. Any other type of loan

CONSUMER FINANCIAL VULNERABILITY
45
ASK ALL WHO CODED 1 @ GW01 AND GW11 NOT EQUAL TO 0 (E.G. ALL HEADS OF
HOUSEHOLD)
GW12. SHOWCARD GW11 AGAIN. And still looking at this card, how many separate credit commitments
do you or your partner currently have of any type listed? For example, if you have one loan and two credit cards,
this would be three credit commitments in total.
INTERVIEWER: PLEASE COUNT ALL COMMITMENTS AND NOT JUST THE NUMBER OF TYPES OF
COMMITMENT.
(Numeric, 0-99, allow REF)
ASK ALL WHO CODED 1 @ GW01 AND GW11 NOT EQUAL TO 0 (E.G. ALL HEADS OF
HOUSEHOLD)
GW13. SHOWCARD GW13. Thinking about all the money you or your partner owe on credit commitments at
the moment, which of the statements on this card is closest to your current position?
(SP, allow DK & REF)
1. I could afford to borrow more if I wanted or needed to
2. My level of borrowing is about right, I would not want to borrow more
3. I have borrowed more than I can really afford
ASK ALL WHO CODED 1 @ GW01 (E.G. ALL HEADS OF HOUSEHOLD)
GW14. SHOWCARD GW14. Looking at this card, which of the following best describes how your household
is managing financially at present? Please just read out the letter that applies.
(SP, allow DK & REF)
A. I am/we are keeping up with all of our bills and credit commitments WITHOUT ANY DIFFICULTIES
B. I am/we are keeping up with all of our bills and credit commitments, but STRUGGLE TO DO SO FROM
TIME TO TIME
C. I am/we are keeping up with all of our bills and credit commitments, but IT IS A CONSTANT STRUGGLE
D. I am/we are FALLING BEHIND WITH SOME OF OUR BILLS OR CREDIT COMMITMENTS
ASK ALL WHO CODED 1 @ GW01 (E.G. ALL HEADS OF HOUSEHOLD)
GW15. Looking ahead over the next 12 months, do you think the financial position of your household will
improve, stay the same or get worse?
(SP, allow DK & REF); READ OUT
1. Improve
2. Stay the same
3. Get worse
ASK ALL WHO CODED 1 @ GW01 (E.G. ALL HEADS OF HOUSEHOLD)
GW16. SHOWCARD GW16. On this card are two statements that other people have made. Please can you tell
me how much you agree or disagree with them?
(SP, allow DK & REF)
STATEMENTS:
1. I am more of a saver than a spender
2. I prefer to buy things on credit than wait and save up
SCALE:
1. Agree strongly
2. Tend to agree
3. Tend to disagree
4. Disagree strongly
CONSUMER FINANCIAL VULNERABILITY
46
ASK ALL WHO CODED 1 @ GW01 (E.G. ALL HEADS OF HOUSEHOLD)
GW17. In which of these ways do you (and your partner) occupy your home?
(SP, allow DK & REF); READ OUT
1. Own your home outright
2. Own your home with a mortgage
3. Rent your home from a private landlord
4. Rent your home from a local authority or housing association
5. Have some other arrangement
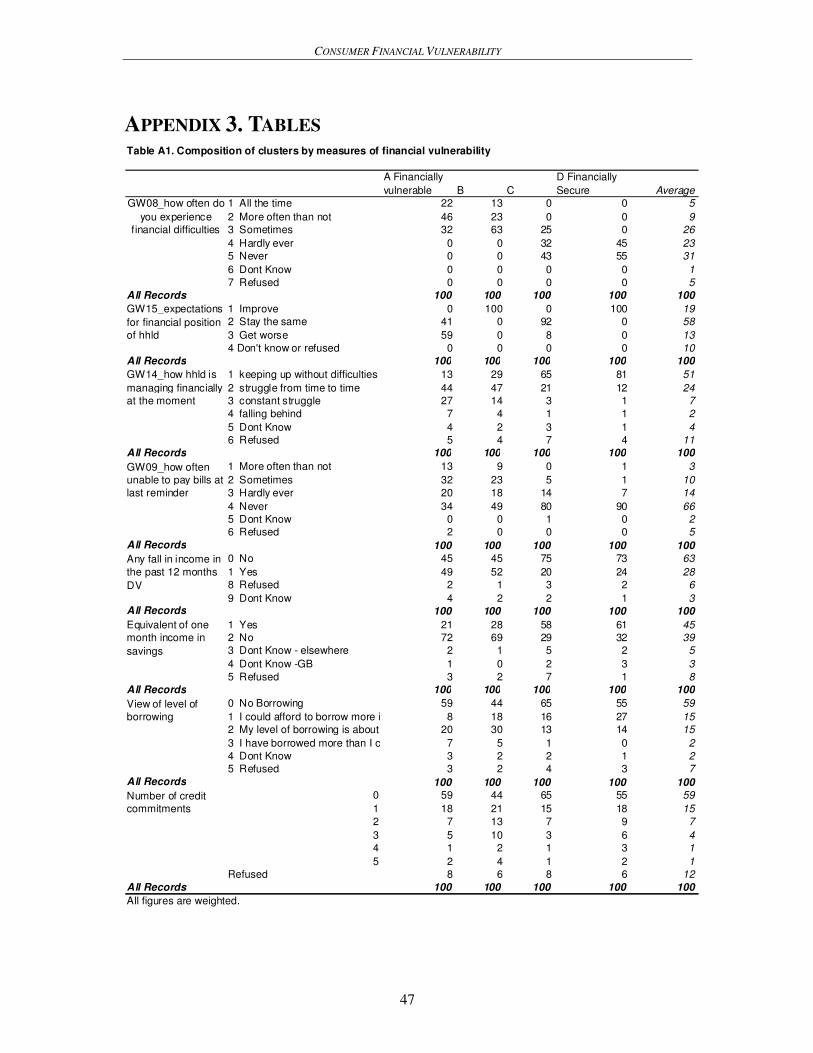
CONSUMER FINANCIAL VULNERABILITY
47
APPENDIX 3. TABLES
A Financially
vulnerable B C
D Financially
Secure Average
1 All the time 22 13 0 0 5
2 More often than not 46 23 0 0 9
3 Sometimes 32 63 25 0 26
4 Hardly ever 0 0 32 45 23
5 Never 0 0 43 55 31
6 Dont Know 0 0 0 0 1
7 Refused 0 0 0 0 5
All Records 100 100 100 100 100
1 Improve 0 100 0 100 19
2 Stay the same 41 0 92 0 58
3 Get worse 59 0 8 0 13
4 Don't know or refused 0 0 0 0 10
All Records 100 100 100 100 100
1 keeping up without difficulties 13 29 65 81 51
2 struggle from time to time 44 47 21 12 24
3 constant struggle 27 14 3 1 7
4 falling behind 7 4 1 1 2
5 Dont Know 4 2 3 1 4
6 Refused 5 4 7 4 11
All Records 100 100 100 100 100
1 More often than not 13 9 0 1 3
2 Sometimes 32 23 5 1 10
3 Hardly ever 20 18 14 7 14
4 Never 34 49 80 90 66
5 Dont Know 0 0 1 0 2
6 Refused 2 0 0 0 5
All Records 100 100 100 100 100
0 No 45 45 75 73 63
1 Yes 49 52 20 24 28
8 Refused 2 1 3 2 6
9 Dont Know 4 2 2 1 3All Records 100 100 100 100 100
1 Yes 21 28 58 61 45
2 No 72 69 29 32 39
3 Dont Know - elsewhere 2 1 5 2 5
4 Dont Know -GB 1 0 2 3 3
5 Refused 3 2 7 1 8
All Records 100 100 100 100 100
0 No Borrowing 59 44 65 55 59
1 I could afford to borrow more if I wanted to 8 18 16 27 15
2 My level of borrowing is about right 20 30 13 14 15
3 I have borrowed more than I can really afford7 5 1 0 2
4 Dont Know 3 2 2 1 2
5 Refused 3 2 4 3 7
All Records 100 100 100 100 100
0 59 44 65 55 59
1 18 21 15 18 15
2 7 13 7 9 7
3 5 10 3 6 4
4 1 2 1 3 1
5 2 4 1 2 1
Refused 8 6 8 6 12
All Records 100 100 100 100 100
Table A1. Composition of clusters by measures of financial vulnerability
All figures are weighted.
GW08_how often do
you experience
financial difficulties
GW15_expectations
for financial position
of hhld
GW14_how hhld is
managing financially
at the moment
Number of credit
commitments
GW09_how often
unable to pay bills at
last reminder
Any fall in income in
the past 12 months
DV
Equivalent of one
month income in
savings
View of level of
borrowing
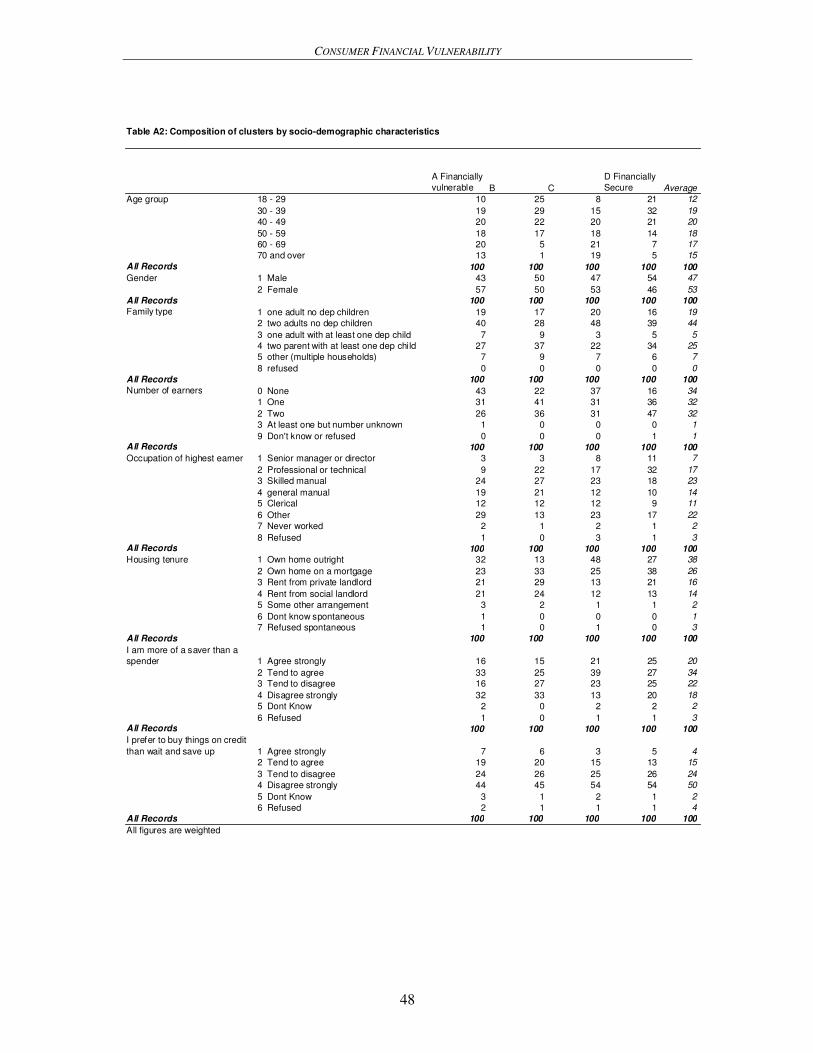
CONSUMER FINANCIAL VULNERABILITY
48
A Financially
vulnerable B C
D Financially
Secure Average
Age group 18 - 29 10 25 8 21 12
30 - 39 19 29 15 32 19
40 - 49 20 22 20 21 20
50 - 59 18 17 18 14 18
60 - 69 20 5 21 7 17
70 and over 13 1 19 5 15
All Records 100 100 100 100 100
Gender 1 Male 43 50 47 54 47
2 Female 57 50 53 46 53
All Records 100 100 100 100 100
Family type 1 one adult no dep children 19 17 20 16 19
2 two adults no dep children 40 28 48 39 44
3 one adult with at least one dep child 7 9 3 5 5
4 two parent with at least one dep child 27 37 22 34 25
5 other (multiple households) 7 9 7 6 7
8 refused 0 0 0 0 0
All Records 100 100 100 100 100
Number of earners 0 None 43 22 37 16 34
1 One 31 41 31 36 32
2 Two 26 36 31 47 32
3 At least one but number unknown 1 0 0 0 1
9 Don't know or refused 0 0 0 1 1All Records 100 100 100 100 100
Occupation of highest earner 1 Senior manager or director 3 3 8 11 7
2 Professional or technical 9 22 17 32 17
3 Skilled manual 24 27 23 18 23
4 general manual 19 21 12 10 14
5 Clerical 12 12 12 9 11
6 Other 29 13 23 17 22
7 Never worked 2 1 2 1 2
8 Refused 1 0 3 1 3All Records 100 100 100 100 100
Housing tenure 1 Own home outright 32 13 48 27 38
2 Own home on a mortgage 23 33 25 38 26
3 Rent from private landlord 21 29 13 21 16
4 Rent from social landlord 21 24 12 13 14
5 Some other arrangement 3 2 1 1 2
6 Dont know spontaneous 1 0 0 0 1
7 Refused spontaneous 1 0 1 0 3
All Records 100 100 100 100 100
I am more of a saver than a
spender 1 Agree strongly 16 15 21 25 20
2 Tend to agree 33 25 39 27 34
3 Tend to disagree 16 27 23 25 22
4 Disagree strongly 32 33 13 20 18
5 Dont Know 2 0 2 2 2
6 Refused 1 0 1 1 3All Records 100 100 100 100 100
I prefer to buy things on credit
than wait and save up 1 Agree strongly 7 6 3 5 4
2 Tend to agree 19 20 15 13 15
3 Tend to disagree 24 26 25 26 24
4 Disagree strongly 44 45 54 54 50
5 Dont Know 3 1 2 1 2
6 Refused 2 1 1 1 4
All Records 100 100 100 100 100
All figures are weighted
Table A2: Composition of clusters by socio-demographic characteristics
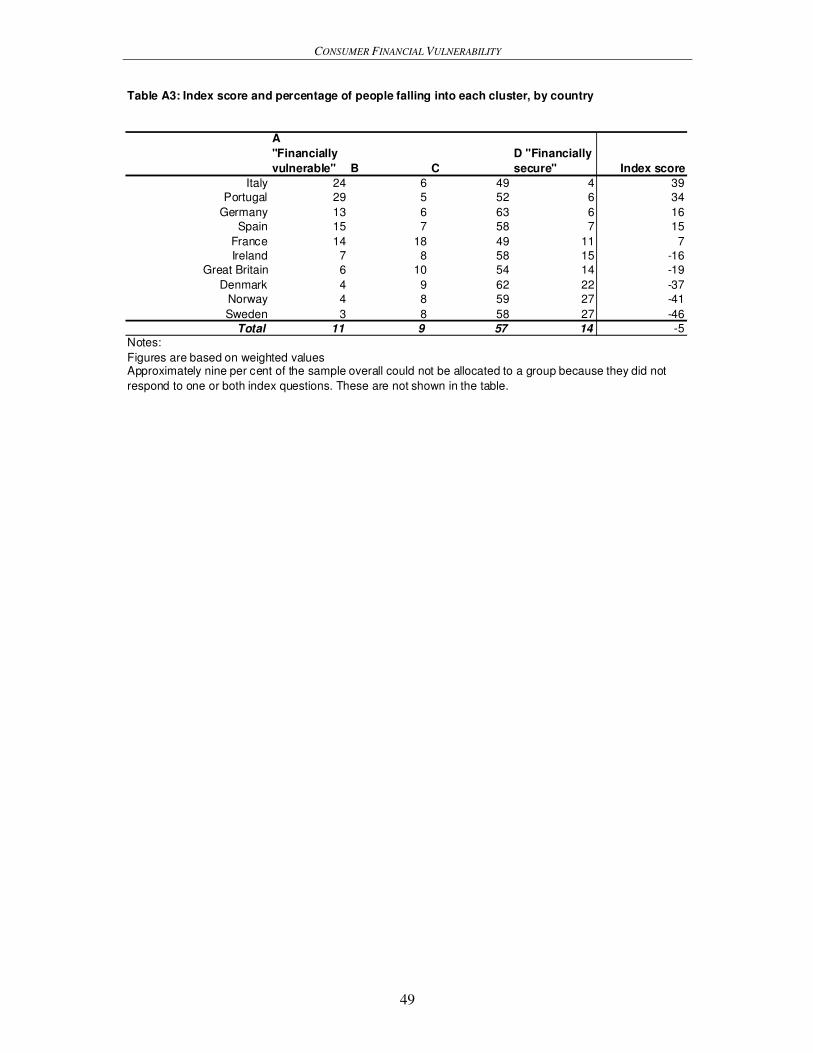
CONSUMER FINANCIAL VULNERABILITY
49
Table A3: Index score and percentage of people falling into each cluster, by country
A
"Financially
vulnerable" B C
D "Financially
secure" Index score
Italy 24 6 49 4 39
Portugal 29 5 52 6 34
Germany 13 6 63 6 16
Spain 15 7 58 7 15
France 14 18 49 11 7
Ireland 7 8 58 15 -16
Great Britain 6 10 54 14 -19
Denmark 4 9 62 22 -37
Norway 4 8 59 27 -41
Sweden 3 8 58 27 -46
Total 11 9 57 14 -5
Notes:
Figures are based on weighted valuesApproximately nine per cent of the sample overall could not be allocated to a group because they did not
respond to one or both index questions. These are not shown in the table.
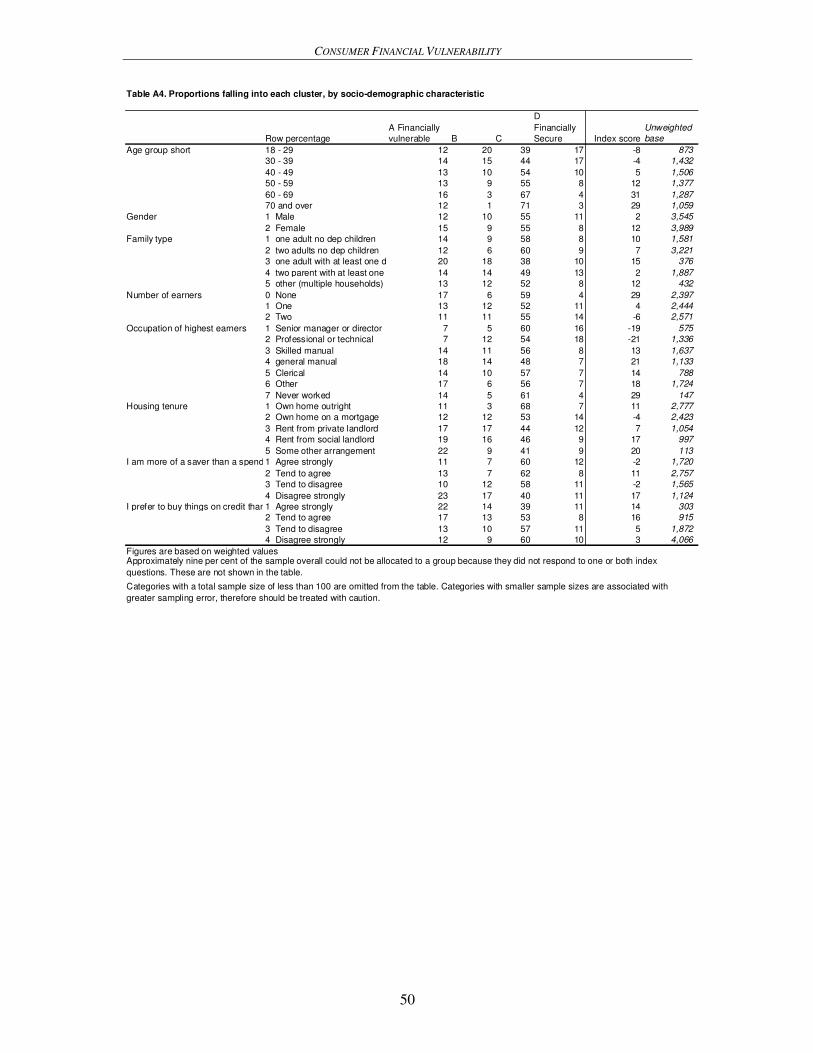
CONSUMER FINANCIAL VULNERABILITY
50
Table A4. Proportions falling into each cluster, by socio-demographic characteristic
Row percentage
A Financially
vulnerable B C
D
Financially
Secure Index score
Unweighted
base
Age group short 18 - 29 12 20 39 17 -8 873
30 - 39 14 15 44 17 -4 1,432
40 - 49 13 10 54 10 5 1,506
50 - 59 13 9 55 8 12 1,377
60 - 69 16 3 67 4 31 1,287
70 and over 12 1 71 3 29 1,059
Gender 1 Male 12 10 55 11 2 3,545
2 Female 15 9 55 8 12 3,989
Family type 1 one adult no dep children 14 9 58 8 10 1,581
2 two adults no dep children 12 6 60 9 7 3,221
3 one adult with at least one dep child 20 18 38 10 15 376
4 two parent with at least one dep child 14 14 49 13 2 1,887
5 other (multiple households) 13 12 52 8 12 432
Number of earners 0 None 17 6 59 4 29 2,397
1 One 13 12 52 11 4 2,444
2 Two 11 11 55 14 -6 2,571
Occupation of highest earners 1 Senior manager or director 7 5 60 16 -19 575
2 Professional or technical 7 12 54 18 -21 1,336
3 Skilled manual 14 11 56 8 13 1,637
4 general manual 18 14 48 7 21 1,133
5 Clerical 14 10 57 7 14 788
6 Other 17 6 56 7 18 1,724
7 Never worked 14 5 61 4 29 147
Housing tenure 1 Own home outright 11 3 68 7 11 2,777
2 Own home on a mortgage 12 12 53 14 -4 2,423
3 Rent from private landlord 17 17 44 12 7 1,054
4 Rent from social landlord 19 16 46 9 17 997
5 Some other arrangement 22 9 41 9 20 113
I am more of a saver than a spender1 Agree strongly 11 7 60 12 -2 1,720
2 Tend to agree 13 7 62 8 11 2,757
3 Tend to disagree 10 12 58 11 -2 1,565
4 Disagree strongly 23 17 40 11 17 1,124
I prefer to buy things on credit than wait and save up1 Agree strongly 22 14 39 11 14 303
2 Tend to agree 17 13 53 8 16 915
3 Tend to disagree 13 10 57 11 5 1,872
4 Disagree strongly 12 9 60 10 3 4,066
Figures are based on weighted values
Categories with a total sample size of less than 100 are omitted from the table. Categories with smaller sample sizes are associated with
greater sampling error, therefore should be treated with caution.
Approximately nine per cent of the sample overall could not be allocated to a group because they did not respond to one or both index
questions. These are not shown in the table.
EECC
RRII
EECC
RRII
European Credit
Research Institute
Place du Congrès 1
B-1000 Brussels
Tel.: +32 2 229 39 16
Fax: +32 2 219 41 51
E-mail: [email protected]
www.ecri.eu
The EUROPEAN CREDIT RESEARCH INSTITUTE (ECRI) is an
independent research institution devoted to the study of banking
and credit. It focuses on institutional, economic and political
aspects related to retail finance and credit reporting in Europe but
also in non-European countries. ECRI provides expert analysis
and academic research for a better understanding of the economic
and social impact of credit. We monitor markets and regulatory
changes as well as their impact on the national and international
level. ECRI was founded in 1999. The institute is a legal entity of
the CENTRE FOR EUROPEAN POLICY STUDIES (CEPS).
The PERSONAL FINANCE RESEARCH CENTRE (PFRC) at the
UNIVERSITY OF BRISTOL was established in 1998 by Professor
Elaine Kempson and has since gained a national and international
reputation for policy-focused research encompassing all areas of
personal finance. PFRC has considerable expertise in designing,
undertaking and analysing both large-scale quantitative and in-
depth qualitative research. It has conducted research for
government departments, trade associations, regulatory bodies,
charities and the private sector.