Embed Size (px)
Citation preview

Consumer Connection Beverage Market Insight To Taiwan Beverage Industries Association
Paul Wu, Joy Lin
Kantar Worldpanel Taiwan, Dec-10
1

FAST FACTS
WHO WE ARE
Our status TNS Worldpanel Our previous name
Kantar Group WPP’s Information, Insight & Consultancy group
2

EXPERT IN FMCG ACROSS ASIA AND THE WORLD
OUR COVERAGE IN ASIA
Japan (Marketing collaboration with
INTAGE)
Taiwan
Thailand
Malaysia
South Korea
China
Philippines
* including partners
Indonesia
Vietnam
India (IMRB)
3

Methodology Introduction
WHAT WE DO
4

DEFINITION A UNIQUE PORTFOLIO
CONSUMER PANEL INTRODUCTION KANTAR WORLDPANEL
*An average 20% annual replacement allows panel to
accurately reflect actual population changes.
** i.e. Actual real consumer’s purchases
5

KANTAR WORLDPANEL BEVERAGE PANEL
˃ Since 2006
˃ Sample size: 5,000 individuals
˃ From age 15-55 years old
˃ Universe: 14,000,000 Taiwan consumers
˃ Gender
˃ Age
˃ Region
˃ HH income
˃ Habitat size & People in the HH
˃ Data collection: Every week by diary or on-line
˃ Category: Dairy, Beverage ( package and takeaway)
6

YOU WILL KNOW…..
HOW DOES TAKEAWAY DRINKS IMPACT PACKAGE BAVERAGE?
WHAT MAKES A BRND GROW?
SHOULD I INVEST IN COSTCO OR eCOMMERCE?
DYNAMICS OF BEVERAGE CATEGORIES, WIN OR LOSE & WHY?
HOW IS TAIWAN 14Q1 FMCG FORECAST?
8

TAIWAN FMCG MARKET
OVERVIEW
9

L Low Inflation/Unemployment/GDP Growth
Food Safety incidents cause short term decline
Food market keeps growing
Taiwan Macro Economy Status
Relatively stable in long term
10

08
Q4
09
Q1
09
Q2
09
Q3
09
Q4
10
Q1
10
Q2
10
Q3
10
Q4
11
Q1
11
Q2
11
Q3
11
Q4
12
Q1
12
Q2
12
Q3
12
Q4
13
Q1
13
Q2
13
Q3
GDP Foods $ growth
2011 Plasticizer Incidence (DEPH) 2008 Sep.
Melamine (Milk scandal)
2013 May 毒澱粉
2013 Sep Cooking Oil
FOOD SAFETY INCIDENCE WAS THE MAIN CAUSE TO SLOW DOWN THE FOOD
MARKET GROWTH, OR EVEN LED DECLINE FOR THE VOLUME DEMAND.
11

TAIWAN FOOD CATEGORY (W/O CIGARETTE & ALCOHOL) GETTING FLAT
RECENTLY DUE TO UNCERTAINTY
0
500,000
1,000,000
1,500,000
2,000,000
2,500,000
3,000,000
3,500,000
4,000,000
4,500,000
5,000,000
52 w
/e 2
008/0
9/0
752 w
/e 2
008/1
0/0
552 w
/e 2
008/1
1/0
252 w
/e 2
008/1
1/3
052 w
/e 2
008/1
2/2
852 w
/e 2
009/0
1/2
552 w
/e 2
009/0
2/2
252 w
/e 2
009/0
3/2
252 w
/e 2
009/0
4/1
952 w
/e 2
009/0
5/1
752 w
/e 2
009/0
6/1
452 w
/e 2
009/0
7/1
252 w
/e 2
009/0
8/1
652 w
/e 2
009/0
9/1
352 w
/e 2
009/1
0/1
152 w
/e 2
009/1
1/0
852 w
/e 2
009/1
2/0
652 w
/e 2
010/0
1/0
352 w
/e 2
010/0
1/3
152 w
/e 2
010/0
2/2
852 w
/e 2
010/0
3/2
852 w
/e 2
010/0
4/2
552 w
/e 2
010/0
5/2
352 w
/e 2
010/0
6/2
052 w
/e 2
010/0
7/1
852 w
/e 2
010/0
8/1
552 w
/e 2
010/0
9/1
252 w
/e 2
010/1
0/1
052 w
/e 2
010/1
1/0
752 w
/e 2
010/1
2/0
552 w
/e 2
011/0
1/0
252 w
/e 2
011/0
1/3
052 w
/e 2
011/0
2/2
752 w
/e 2
011/0
3/2
752 w
/e 2
011/0
4/2
452 w
/e 2
011/0
5/2
252 w
/e 2
011/0
6/1
952 w
/e 2
011/0
7/1
752 w
/e 2
011/0
8/1
452 w
/e 2
011/0
9/1
152 w
/e 2
011/1
0/0
952 w
/e 2
011/1
1/0
652 w
/e 2
011/1
2/0
452 w
/e 2
012/0
1/0
152 w
/e 2
012/0
1/2
952 w
/e 2
012/0
2/2
652 w
/e 2
012/0
3/2
552 w
/e 2
012/0
4/2
252 w
/e 2
012/0
5/2
052 w
/e 2
012/0
6/1
752 w
/e 2
012/0
7/1
552 w
/e 2
012/0
8/1
252 w
/e 2
012/0
9/0
952 w
/e 2
012/1
0/0
752 w
/e 2
012/1
1/0
452 w
/e 2
012/1
2/0
252 w
/e 2
012/1
2/3
052 w
/e 2
013/0
1/2
752 w
/e 2
013/0
2/2
452 w
/e 2
013/0
3/2
452 w
/e 2
013/0
4/2
152 w
/e 2
013/0
5/1
952 w
/e 2
013/0
6/1
652 w
/e 2
013/0
7/1
452 w
/e 2
013/0
8/1
152 w
/e 2
013/0
9/0
8
0
20,000
40,000
60,000
80,000
100,000
120,000
140,000
160,000
180,000
200,000
Sales Volume(Unit)
Sales Value (NT$M)
NT$M
2008 Sep.
Financial
Crisis
2009 Jan.
Consumer
Voucher
2009 July
Sign of bounce
back
Recovery Grow Stable Recovery Stable
Tainted
Starch
M13Q2 vs M13Q3
Val +1%
Vol +0%
52 WEEKS COMPARISON M12Q3 vs M13Q3
Val +9%
Vol +4%
Cooking
Oil
DEHP
Incidence
Melamine
12

Growth Rate ≤ -0.5% -0.5% <Growth Rate≤ 5% Growth Rate> 5%
Food Category Focus
Non Food Category Focus
Biscuit\snack Health Food RTD Tea Instant Coffee Fresh Milk
Liquid
Detergent
Oral Care Skin Care
(35+)
Toilet Paper
M12Q3 VS M13Q3
FMCG MARKET
13

ANNUAL COMPARISON , VALUE%
TAIWAN FMCG KEY ACCOUNT IMPORTANCE
14 14 14 14 15 15 12
9 8 89
6 6 6
7 6 58 6 6
5 4 4
5 6 7
6 7 8
3 3 3
4 5 5
7 7 7
0 0 0
3 2 2
3 3 3
2 2 2
2 2 2
0 0 0
5 5 5
2 2 2
3 3 3
0 0 0
1 1 1
2 1 1
0 0 0
1 1 1
0 0 0
2 2 2
12 12
910
0
10
20
30
40
50
60
MAT
11Q3
MAT
12Q3
MAT
13Q3
MAT
11Q3
MAT
12Q3
MAT
13Q3
MAT
11Q3
MAT
12Q3
MAT
13Q3
PX Carrefour RT Costco 7 Eleven
A Mart Watson's Family Wellcome Poya
TTL FMCG FOOD CATEGORY NON FOOD CATEGORY
14

0
100
200
300
400
500
600
700
800
900
-10 10 30 50 70 90 110 130
Traffic (in million, Occasions)
Ba
ske
t V
alu
e (
NT
$)
PX Mart 7-ELEVEN
Carrefour
Costco
RT Group
A Mart
Wellcome
Family Mart
Watson’s
S. Mart
Matsusei
Cosmed
Poya
ANNUAL COMPARISON, M11Q3~M13Q3
RETAIL HEALTH-TRAFFIC VS BASKET VALUE
M11Q3
M12Q3
M13Q3
15

AVERAGE PACKAGED FMCG SALES PER STORE. (MAT BASE / STORE NUMBER)
REFLECTS IN THEIR SINGLE STORE EFFICIENCY.
IT BECOMES FLATTER RECENTLY
2.0
2.5
3.0
3.5
4.0
08Q3 08Q4 09Q1 09Q2 09Q3 09Q4 10Q1 10Q2 10Q3 10Q4 11Q1 11Q2 11Q3 11Q4 12Q1 12Q2 12Q3 12Q4 13Q1 13Q2
60
65
70
75
08Q3 08Q4 09Q1 09Q2 09Q3 09Q4 10Q1 10Q2 10Q3 10Q4 11Q1 11Q2 11Q3 11Q4 12Q1 12Q2 12Q3 12Q4 13Q1 13Q2
Remodeling
16

POTENTIAL ISSUE WITH SHELF ARRANGMENT
17

WHERE IS THE ? WHICH ONE DO I WANT?
58%
31%
11%
CRUISING STOPPING CLOSING
18
IT’S YOUR BENEFIT/RESPONSIBILITY TO PUSH THEM CHANGE

© Kantar Worldpanel
14 15 15 8 9 11 9 9 11
10 9 9
5 5 5 9 8 9
8 6 6
4 4 4
6 5 5
6 7 8
1 1 1
4 5 5
7 7 7
35 37 35 25 27
29 3 3 3
1 1 2 2 3
3
3 3 3
15 13 12 10 10
9
0
10
20
30
40
50
60
70
80
MAT11Q3
MAT12Q3
MAT13Q3
MAT11Q3
MAT12Q3
MAT13Q3
MAT11Q3
MAT12Q3
MAT13Q3
PX C4 RT Costco 7 Eleven A Mart Family Wellcome On-line
TTL Food TTL Beverage Juice
ANNUAL COMPARISON , VALUE%
COSTCO IS LESS IMPORTANT IN YOUR CATEGORIES EXCEPT IN JUICE
19

0
200
400
600
800
1000
1200
1400
1600
0 100 200 300 400 500 600
Ba
sket V
alu
e (
NT
$)
Traffic (in million, Occasions)
PX-Mart
OK Mart
Carrefour
RT
Wellcome
A-Mart
Costco
ANNUAL COMPARISON, M11Q3~M13Q3
RETAIL HEALTH-TRAFFIC VS AVG SPENDING IN PACKAGE BEVERAGE
FAMILY-Mart
7-11
M11Q3
M12Q3
M13Q3
20
TAIWAN BEVERAGE MARKET
DYNAMIC
21

TOTAL BEVERAGE MARKET SIZE
TOTAL MARKET +5%
+21% +14% +3%
-5% -2% -1%
22

PENETRATION% FREQUENCY/YR BASKET BY L
71
66
57
88
54
63
89
54
63
58
69
57
68
71
91
55
70
70
13
11
22
50
9
11
49
9
11
9
11
20
11
12
48
19
9
12
1.1
1.5
0.6
1.1
3.0
1.6
1.1
3.1
1.6
3.3
1.6
0.6
1.6
1.0
1.1
0.7
1.7
1.0
M13Q3
M12Q3
M11Q3
HOW DID THEY GROW?
+21%
+14%
+3%
-5%
-2%
-1%
23

24
Grow sales
24

THE PATH TO PURCHASE
Awareness
Consideration
Purchase
Repeat
Loyalty
$
25

26

27
TAIWAN Percentage of changing brand at next purchase
Cookies 77%
Instant Noodle 74%
Homecare Cleanser 72%
Shampoo 69%
Carbon Soft Drink 64%
Instant Coffee 63%
Fabric Detergent 63%
RTD Tea 60%
Adult Milk Powder 35%
Herbal Instant Cereal 35%
Liquid Yogurt 35%
Fresh Milk 34%
Facial Moisturizer 34%
GUMP 23%
27

Repeat buying rates
# of people buying the brand
Bra
nd R
epeat
As the # of people
buying the brand
increased, the
repeat rate didn’t’.
28

HOW TO GROW PENETRATION ?
29

INNOVATION/
NEW PRODUCT LAUNCHES
30


One household
will try 6 new SKU
in an year
43,768 FMCG
SKUs available
in 2012 ~ now
(~ 442 SKUs per
category
16,929+ new
SKUs
launched in 2012~
now
Out of 9% value
growth FMCG
2012, 3% made
by new SKUs
In the duration of
our session today,
there will be a new
SKU born! Every 1 hour there’s a new
SKU! 32

After the first year,
a typical launch will have attracted
1 in 25 Households
Of whom,
19% have re-purchased
Source: Kantar Worldpanel Innovation tracker– Taiwan - Total Food & Beverage • Based on 97 new Brand & variant launches from 2012 Jan.
How many you could expect on the 1ST year launch…
INNOVATION TARGET | BENCHMARKS
(~ 306K HHs in total Taiwan)
33

Instant Soup Quick Soup
Canned Dessert
Frz. Dumpling Dim sun
Frz. HMR
Cheese
Cereal Drink
Cookies
Snacks
Yogurt
Instant Cereal Drink
Cooking Oil
Water
Juice CSD
Sports Drink
RTD Tea
Fermanted Drink
Health Food
Soy Sauce
RTD Coffee
Dairy
0.0
5.0
10.0
15.0
20.0
25.0
30.0
35.0
0.0 1.0 2.0 3.0 4.0 5.0 6.0 7.0 8.0 9.0
Ave
rage
Re
pe
at%
in 5
2 w
/e
Average Trial Rate% in 52 w/e
Differs by purchase frequency, category size, existing brand numbers;
but generally more Trial = more Repeat !!
INNOVATION TARGET | BENCHMARKS
Source: Kantar Worldpanel Innovation tracker– Taiwan - Total Food & Beverage • Based on 97 new Brand & variant launches from 2012 Jan.
34

4 wks 8 wks 12 wks 16 wks 20 wks 24 wks 28 wks 32 wks 36 wks 40 wks 44 wks 48 wks 52 wks
Ne
w B
uyer
rec
ruit
men
t S
pee
d
TOTAL F&B
COOKIES
SNAKCS
JUICE
CSD
RTD TEA
FERMANTEDDRINK
RTD COFFEE
DAIRY
INNOVATION TARGET | TRACKING & MONITORING
Recruitment speed dropped dramatically after 2 months
You have 60~90 days of window to
best target the early adopters, or you
need a further campaign after that
This window is smaller than some other countries, indicates TW
consumers’ personality, and even so for Quick Beverage categories
Source: Kantar Worldpanel Innovation tracker– Taiwan - Total Food & Beverage • Based on 97 new Brand & variant launches from 2012 Jan.
36

… After this critical period, the launch’s performance can be fairly
predictable
0
2
4
6
8
10
12
14
0 1 2 3 4 5 6 7
pe
ne
tra
tio
n a
fte
r 5
2 w
ee
ks
Penetration after 12 weeks
INNOVATION TARGET | TRACKING & MONITORING
Source: Kantar Worldpanel Innovation tracker– Taiwan - Total Food & Beverage • Based on 97 new Brand & variant launches from 2012 Jan.
37

NEW PRODUCTS ARE SUBSTANTIAL
TO MARKET GROWTH
Yet, continuous support is
also highly important.
New product survival rate in 2nd -yr
Below
30%?
New product survival rate in 3rd -yr
42%
38

DOES ON-LINE SHOPPING HELP ME
TO GROW PENETRATION??
39
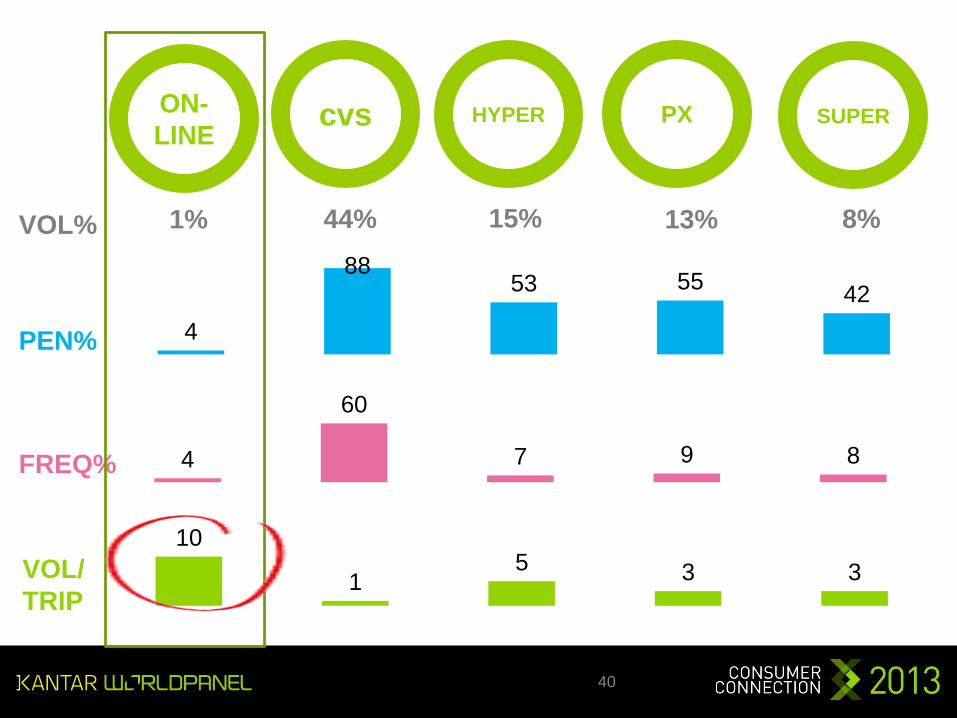
cvs ON-
LINE HYPER SUPER PX
1% 44% 15% 13% 8% VOL%
4
88 53 55
42
4
60
7 9 8
10
1 5 3 3
PEN%
FREQ%
VOL/
TRIP
40

IT CAN HELP YOU LOAD-UP THE SHOPPERS, BUT NOT BUYER BASE
DO IT AFTER YOU HAVE A SIZABLE PENETRATION%!!
41

PENETRATION:58 (+12%)
CUSTOMIZATION
FRESHNESS
INNOVATIVE
42

63 54
89
57 68 71 69
58
91
55 70 70
11 9
49
20 11 12 11 9
48
19 9 12
PEN%
FREQ
M12Q3 M13Q3
M12Q3 M13Q3
43

SALES VOLUME
+10% = 27,000 (KL)
5%
60%
FROM
11%
FROM
5%
44

PENETRATION OF DIFFERENT TYPE OF TEA
ONLY
TAKE-AWAY
TEA 5.7
ONLY
PACKAGE
TEA 40.4
BOTH
48.6
+15% -9%
PEN%
GR% OF PEN -2%
45

PENETRATION OF DIFFERENT TYPE OF COFFEE
ONLY
TAKE-AWAY
COFFEE
21.4
ONLY
PACKAGE
COFFEE
29.5
BOTH
20.6
+1% -6%
PEN%
GR% OF PEN +13%
46

cvs HYPER SUPER PX
49 47
4 4 5
48 45
4 5 5 FREQ%
M12Q3 M13Q3
CVS TAKES THE MOST HIT!!
47

KEY TAKE OUTS
48

4 KEY TAKE AWAY TODAY & 1 QUESTION FOR YOU……
TAKEAWAY CUP: YOU CAN’T FIGHT IT, BUT CAN YOU COEXIST WITH IT?
PENETRATION% IS THE KING!!
COSTCO IS SMALL EXCEPT IN JUICE
eCOMMERCE IS NOT IMPORTANT W/O BIG BUYER BASE
FMCG: CONSERVATIVE BUT POSITIVE
49

For further information please contact:
Contact Us!
Paul Wu, Joy Lin
Telephone: 02-2570 0556 # 306,278
http://www.kantarworldpanel.com/tw