Embed Size (px)
Citation preview
City of ChandlerPublic Works & UtilitiesMail Stop 803PO Box 4008Chandler, Arizona 85244-4008
Este informe contiene información muy importante sobre su agua beber. Tradúzcalo ó hable con alguien que lo entienda bien.
viduals can overcome the disease within a few weeks. However, immuno-compromised people are at greater risk of developing life-threatening illness. We encourage immuno-compromised individuals to consult their doctor regarding appropriate precautions to take to avoid infec-tion. Cryptosporidium must be ingested to cause disease, and it may be spread through means other than drinking water.The City of Chandler sampled its water for the pres-ence of the protozoans Cryptosporidium and Giardia in 2017. Though rare, Cryptosporidium and/or Giardia have been identified in the source water Chandler receives from the Consolidated Canal. The filtration system in the City’s SWTP exceeds EPA requirements for removal of Cryptosporidium and Giardia. Cryptosporidium was not detected in any of the City’s samples.Lead and Copper TestingFederal regulations require all cities test for lead and cop-per at selected customer’s taps at least once every three years. The City of Chandler conducted lead and copper tap sampling in the summer of 2016, with the concentra-
tions of lead and copper well below regulatory limits. The next round of lead and copper sampling will be in 2019. If present, elevated levels of lead can cause serious health problems, especially for pregnant women and young children. Lead in drinking water is primarily from materials and components associated with service lines and home plumbing. The City of Chandler is respon-sible for providing high quality drinking water, but can-not control the variety of materials used in household plumbing components. When your water has been sitting for several hours, you can minimize the potential for lead exposure by flush-ing your tap for 30 seconds to 2 minutes before using water for drinking or cooking. If you are concerned about lead in your water, you may wish to have your water tested by a commercial laboratory. Information on lead in drinking water, testing methods, and steps you can take to minimize exposure is available from the EPA’s Safe Drinking Water Hotline (1-800-426-4791) or at www.epa.gov/safewater/lead.
EPA Revised Total Coliform RuleEffective April 1, 2016, the U.S. EPA revised the 1989 Total Coliform Rule, to augment public health protection by ensuring the integrity of the drinking water distribution system and monitoring for the presence of microbials (i.e . total coliform and E.coli bacteria). The EPA anticipates stronger public health protection under the new rule, as it requires water systems that are vulnerable to microbial contamination to identify and fix problems. As a result, under the new rule there is no longer a monthly maxi-mum contaminant level violation for multiple total coli-form detections. Instead the new rule requires water sys-tems that exceed a specified frequency of total coliform occurrences to conduct an assessment to determine if any sanitary defects exist, if found, these must be cor-
rected by the water system. Chandler was not required to conduct any assessments in 2018.Disinfection ByproductsTotal Trihalomethanes (TTHMs)Some people who drink water containing trihalometh-anes in excess of the MCL over many years may expe-rience problems with their liver, kidneys, or central nervous systems, and may have an increased risk of getting cancer.Haloacetic Acids (HAA5)Some people who drink water containing haloacetic acids in excess of the MCL over many years may have an increased risk of getting cancer.
Distribution System Detections 2018:Contaminant Units Maximum Contaminant Level MCLG Results MCL Violation Sources in Drinking water
Total Coliform Bacteria P/A Level 1 or Level 2 Assessment Required NA No Assessment
Required No Naturally present in the environment
Chlorine (Distribution System) ppm Maximum = 4.0 ppm / Minimum = Trace Amount
(MRDL = Annual Moving Average)MRDLG4.0
1.04 annual avg.0.20 minimum No Water additive used to control
microbes
Turbidity NTU TT = 1.0 NTU MAXTT = < or = 0.3 NTU 95% of the time N/A 0
100% No Soil runoff
Total Organic Carbon Removal Ratio ppm TT= must be ≥ 1.0 N/A 1.41 Running
Annual Ave No Naturally present in the environment
(TTHMs) Total Trihalomethanes ppb Locational Running Annual Average must be <80
Range all samples (low to high) N/A 706.7 - 140 No By-product of drinking water
disinfectionHaloacetic Acids (HAA5) ppb Locational Running Annual Average must be <60
Range all samples (low to high) N/A 251.6 - 60 No By-product of drinking water
disinfection
Lead and Copper Study 2016:Contaminant (units) Maximum Contaminant Level MCLG Results Sources in Drinking waterLead (ppb) Action level =15 ppb
90th percentileNumber of sites exceeding action level
0 ppb
3.0 0
Corrosion of household plumbing systems;Erosion of natural deposits
Copper (ppm) Action level = 1.3 ppm90th percentileNumber of sites exceeding action level
1.3 ppm
0.25 0
Corrosion of household plumbing systems;Erosion of natural deposits
City of Chandler 2018 DRINKING WATER QUALITY
CONSUMER CONFIDENCE REPORTPublic W
ater System AZ04-07-090
The City of Chandler Public Works & Utilities Department is committed to providing a safe supply of drinking water to our customers. As a result of this strong commitment, the City of Chandler routinely performs more tests on the water residents receive than is required by law. We issue this annual report describing the quality of your drink-ing water to comply with State and U.S. Environmental Protection Agency (EPA) regulations. Much of the language used is mandated by these regulations. The purpose of this report is to raise your understanding of drinking water and awareness of the need to protect your drinking water sources. We are proud to report Chandler’s water meets, or exceeds, all health and safety standards set by the County, State, and Federal government regulatory agencies for 2018. This brochure provides valuable infor-mation about your drinking water, including information about its source and quality. About your Water Supply The drinking water distributed by the City of Chandler to its customers comes from three sources: • The Chandler Surface Water Treatment Plant (SWTP)
treats and disinfects water from the Salt River, Verde River, Central Arizona Project (Colorado River), and Salt River Project (SRP) wells whose water is transported to Chandler via the Consolidated Canal.
• 31 active wells supply groundwater from aquifers underlying Chandler. Groundwater is disinfected with chlorine prior to being introduced into the City’s water distribution system.
• The City of Chandler and the Town of Gilbert jointly own the Santan Vista Water Treatment Plant (SVWTP) located in the Town of Gilbert. This facility currently treats and distributes up to 12 million gallons per day of Colorado River water from the Central Arizona Project to each city. We have included compliance information supplied by the SVWTP. The Town of Gilbert’s annual Water Quality Report can also be accessed at www.gil-bertaz.gov/departments/public-works/water/reports.
City of Chandler Water Supply Statistics• 20.97 billion gallons of drinking water was supplied to
Chandler water users in 2018. (A daily average of 57.5 million gallons.)
• Chandler’s SWTP produced 10.4 billion gallons, or 49.6% of the City’s total drinking water.
• Groundwater wells produced 5.4 billion gallons, or 25.8% of the City’s total drinking water.
• The SVWTP supplied 5.2 billion gallons, or 24.6% of the City’s total drinking water.
Drinking Water and your HealthDrinking water, including bottled water, may reasonably be expected to contain at least small amounts of some contaminants. The presence of contaminants does not necessarily indicate that water poses a health risk. Some people may be more vulnerable to contaminants in drink-ing water than the general population. Immuno-compromised persons such as persons with cancer undergoing chemotherapy, persons who have undergone organ transplants, people with HIV-AIDS or
other immune system disorders, some elderly, and infants can be particularly at risk from infections. These people should seek advice about drinking water from their health care providers.For more information about contaminants and potential health effects, or to receive a copy of the U.S. Environmental Protection Agency (EPA) and the U.S. Centers for Disease Control (CDC) guidelines on appropriate means to lessen the risk of infection by Cryptosporidium and microbiologi-cal contaminants call the EPA Safe Drinking Water Hotline at 1-800-426-4791.The sources of drinking water (both tap and bottled water) include rivers, lakes, streams, ponds, reservoirs, springs, and wells. As water travels over the surface of the land or through the ground, it dissolves naturally-occurring minerals, and in some cases, radioactive material, and can pick up substances resulting from the presence of animals or from human activity.Contaminants that may be present in source water include:• Microbial Contaminants: Such as viruses and bacteria
that may come from sewage treatment plants, septic systems, agricultural livestock operations, and wildlife
• Inorganic Contaminants: Such as salts and metals that can be naturally-occurring or result from urban storm water runoff, industrial or domestic wastewater dis-charges, oil and gas production, mining, or farming
• Pesticides and Herbicides: Such as agriculture, urban storm water runoff, and residential uses that may come from a variety of sources
• Organic chemical contaminants: Such as synthetic and volatile organic chemicals, which are by-products of industrial processes and petroleum production, and also may come from gas stations, urban storm water runoff, and septic systems.
• Radioactive contaminants: That can be naturally occur-ring or be the result of oil and gas production and min-ing activities.
In order to ensure tap water is safe to drink, the EPA prescribes regulations limiting the amount of certain contaminants in water provided by public water systems. The United States Food and Drug Administration (FDA) regulations establish limits for contaminants in bottled water providing the same level of protection for public health. Information on these regulations may be obtained by calling 1-888-INFO FDA (463-6332).Contaminants of concern for drinking water are subject to regulatory requirements for analysis on three-year cycles. The City of Chandler sampled all of its water sources for applicable contaminants in 2018.
Unregulated Contaminant Monitoring RegulationThe 1996 amendments to the Safe Drinking Water Act required the EPA to establish criteria for a program to monitor unregulated contaminants and publish a list of up to 30 contaminants to be monitored every five years. The intent of this rule is to provide baseline occurrence data that the EPA can combine with the toxicological research to make decisions about potential future drink-ing water regulations. The EPA published the final rule for the Fourth Unregulated Contaminant Monitoring Regulation Cycle (UCMR4) to meet this requirement in the Federal Register on December 20, 2016, Chandler’s assigned sampling period began in July 2018 and will con-tinue into 2019. As of the end of 2018, nineteen of the 30 compounds were not detected in our water system. All the detections were in the parts per billion or parts per trillion range, which is equivalent to one gallon in one bil-lion or one trillion gallonsCryptosporidium and GiardiaCryptosporidium is a microbial pathogen found in surface water throughout the United States. Ingestion of cryp-tosporidium may cause cryptosporidiosis, an abdomi-nal infection. Symptoms of infection include nausea, diarrhea, and abdominal cramps. Most healthy indi-
49.6% Chandler WPT25.8% Wells24.6% Santan WTP
Detected Unregulated Contaminant (UCMR4):
Contaminant Detected(Y/N) Average
Range of All Samples (Low-High
MRL Likely Source of Contamination
Germanium (ppt) Y 0.34 <0.3 – 0.74 300Naturally-occurring element; commercially available in combination with other elements and minerals; a byproduct of zinc ore processing; used in infrared optics, fiber-optic systems, electronics and solar applications
Manganese (ppt) Y 1.33 <0.4 – 5.0 400Naturally-occurring element; commercially available in combination with other elements and minerals; used in steel production, fertilizer, batteries and fireworks; drinking water and wastewater treatment chemical; essential nutrient
Haloacetic Acids (HAA9) (ppb) Y 51.67 24 - 100 .2 By-product of drinking water disinfection
ArsenicArsenic is a mineral known to cause cancer in humans at high concentration and is linked to other health effects, such as skin damage and circulatory problems. If arse-nic is less than or equal to the MCL, your drinking water meets EPA’s standards. EPA’s standard balances the cur-rent understanding of arsenic’s possible health effects against the costs of removing arsenic from drinking water, and continues to research the health effects of low levels of arsenic.NitrateNitrate in drinking water at levels above 10 ppm is a health risk for infants of less than six months of age. High nitrate levels in drinking water can cause “blue baby syndrome.” Nitrate levels may rise quickly for short periods of time because of rainfall or agricultural activity. If you are caring for an infant, and detected nitrate levels are above 5 ppm, you should ask advice from your health care provider.Organic Chemical ContaminantsThis category includes synthetic organic chemicals (SOC) and volatile organic chemicals (VOC), which are by-prod-ucts of industrial processes and petroleum production. They can also come from gas stations, urban storm water runoff, and septic systems.
* Chandler Detected Regulated Contaminants 2018:
Contaminant (units)MCL ViolationY or N
Running Annual Average (RAA) OR Highest Level Detected
Range of All Samples(Low-High)
MCL MCLGSample Month & Year
Likely Source of Contamination
Alpha Emitters (pCi/L) N 2.8 < 1.0 – 2.8 15 0 10/2018 Erosion of natural depositsCombined Radium-226 & -228 (pCi/L) N 0.8 < 0.6 – 0.8 5 0 10/2018 Erosion of natural deposits
Uranium (ug/L) N 5.6 < 0.8 - 5.6 30 0 10/2018 Erosion of natural deposits
Arsenic (ppb) N 8.5 1.8-8.5 10 0 10/2018 Erosion of natural deposits, runoff from orchards, runoff from glass and electronics production wastes
Barium (ppm) N 0.14 0.016-0.14 2 2 3/2018 Discharge of drilling wastes; discharge from metal refineries; Erosion of natural deposits
Chromium (ppb) N 24 1.3-24 100 100 3/2018 Discharge from steel and pulp mills; Erosion of natural deposits
Fluoride (ppm) N 1.5 < 0.4-1.5 4 4 3/2018 Erosion of natural deposits; water additive which promotes strong teeth; discharge from fertilizer and aluminum factories
Nitrate (ppm) N 6.8 < 0.1 – 6.8 10 10 10/2018 Runoff from fertilizer use; leaching from septic tanks, sewage; erosion of natural deposits
Selenium (ppb) N 4.5 <0.5 – 4.5 50 50 3/2018 Discharge from petroleum and metal refineries; erosion of natural deposits; discharge from mines
Sodium (ppm) N 280 77 – 280 N/A N/A 3/2018 Erosion of natural deposits2,4-D (ppb) N 0.26 < 0.092 – 0.26 70 70 10/2018 Runoff from herbicide used on row cropsDalapon (ppb) N 1.3 <0.92 – 1.3 200 200 10/2018 Runoff from herbicide used on rights of wayDi (2-ethylhexyl) phthalate (ppb) N 1.4 < 0.58 – 1.4 6 0 10/2018 Discharge from rubber and chemical factories
Protecting Chandler’s Water SupplyBackflow Prevention The City of Chandler has a backflow prevention program ensuring proper installation and maintenance of thousands of backflow prevention devices throughout the City. These devices ensure hazards originating on customer’s property and from temporary connections do not impair or alter the water in the City’s water distribution system. Return of any water to the City’s water distribution system after the water has been used for any purpose on the customer’s premises or within the customer’s piping system is unacceptable. Backflow prevention devices range from vacuum breakers on household hose bibs to large commercial reduced-pressure principal devices found throughout the City. Source Water Assessment and Protection Program (SWAP)The Arizona Department of Environmental Quality (ADEQ) completed a source water assessment for drinking water wells and surface water sources for Chandler’s public water system in 2005. The assessment reviewed adjacent land uses that may pose a potential risk to water sources. These risks include, but are not limited to, gas stations, landfills, dry cleaners, agriculture fields, wastewater treatment plants, and mining activities. Once ADEQ identified the adjacent land uses, they were ranked on their potential to affect the water source. All surface water sources are considered high risk due to their exposure to open air. The overall risk posed to surface water is addressed by EPA through its increased monitoring requirements for surface water sources. Two of Chandler’s drinking water wells were considered high risk based on adjacent land use criteria. The Chandler public water system conducts regular monitoring of drinking water entering the water distribution system from all wells to ensure land uses have not impacted the source water. Based on the information currently available on the hydrogeologic settings and the adjacent land uses that are in the specified proximity of the drinking water source(s) of this public water system, the Arizona Department of Environmental Quality (ADEQ) has given a high risk designation for the degree to which this public water system drinking water source(s) are protected. A designation of high risk indicates there may be additional source water protection measures which can be implemented on the local level. This does not imply that the source water is contaminated nor does it mean that contamination is imminent. Rather, it simply states that land use activities or hydrogeologic conditions exist that make the source water susceptible to possible future contamination.Further source water assessment documentation can be obtained by contacting or visiting ADEQ at 1110 W. Washington, Phoenix, Arizona 85007, between the hours of 8:00 a.m. and 5:00 p.m. or visit website at www.azdeq.gov/source-water-protection.
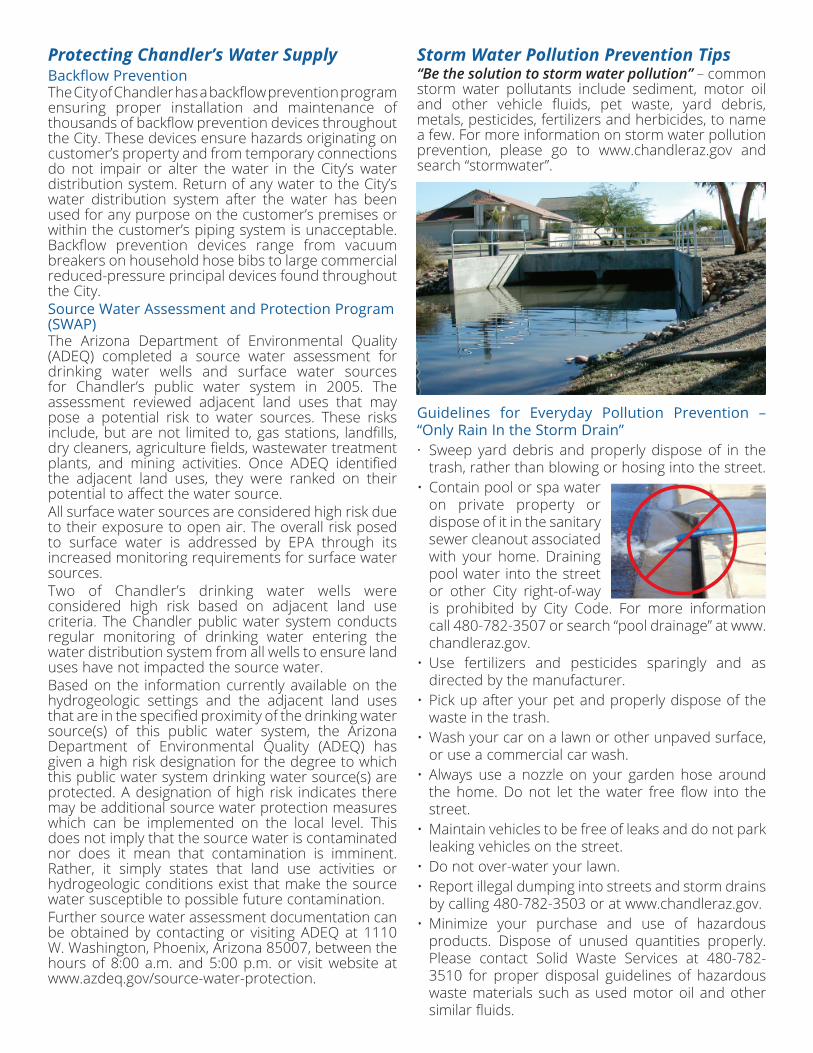
Storm Water Pollution Prevention Tips“Be the solution to storm water pollution” – common storm water pollutants include sediment, motor oil and other vehicle fluids, pet waste, yard debris, metals, pesticides, fertilizers and herbicides, to name a few. For more information on storm water pollution prevention, please go to www.chandleraz.gov and search “stormwater”.
Guidelines for Everyday Pollution Prevention – “Only Rain In the Storm Drain”• Sweep yard debris and properly dispose of in the
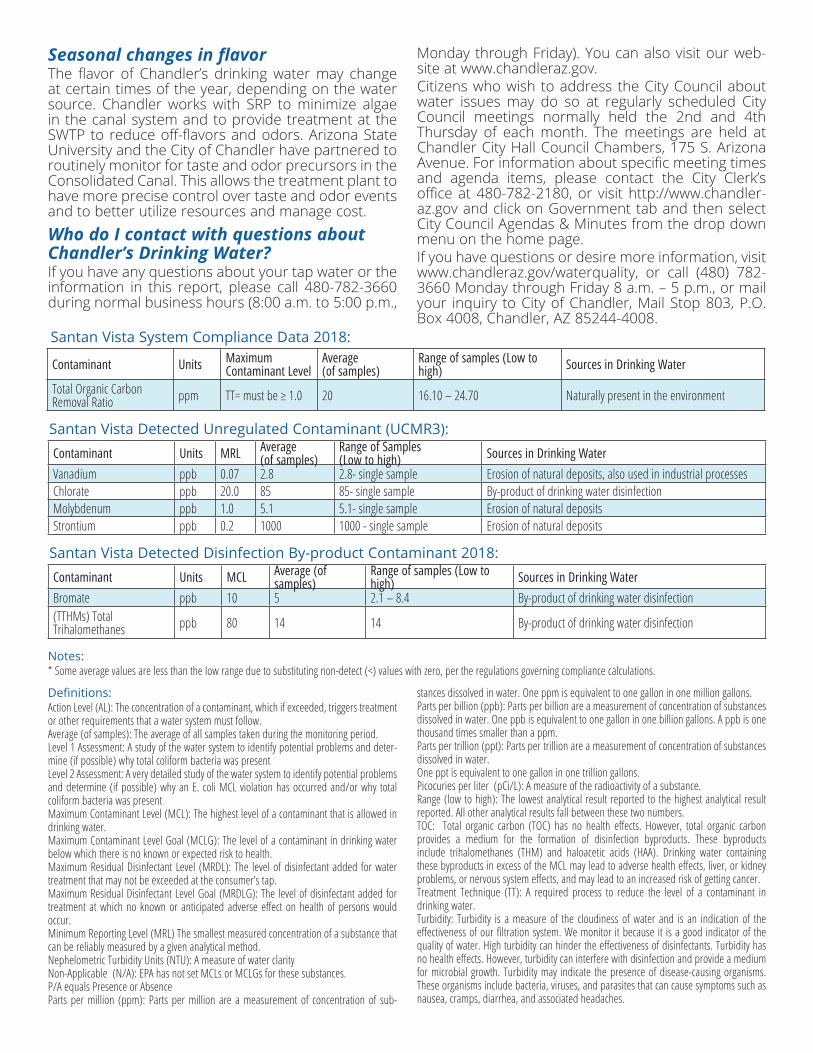
trash, rather than blowing or hosing into the street.• Contain pool or spa water
on private property or dispose of it in the sanitary sewer cleanout associated with your home. Draining pool water into the street or other City right-of-way is prohibited by City Code. For more information call 480-782-3507 or search “pool drainage” at www.chandleraz.gov.
• Use fertilizers and pesticides sparingly and as directed by the manufacturer.
• Pick up after your pet and properly dispose of the waste in the trash.
• Wash your car on a lawn or other unpaved surface, or use a commercial car wash.
• Always use a nozzle on your garden hose around the home. Do not let the water free flow into the street.
• Maintain vehicles to be free of leaks and do not park leaking vehicles on the street.
• Do not over-water your lawn.• Report illegal dumping into streets and storm drains
by calling 480-782-3503 or at www.chandleraz.gov.• Minimize your purchase and use of hazardous
products. Dispose of unused quantities properly. Please contact Solid Waste Services at 480-782-3510 for proper disposal guidelines of hazardous waste materials such as used motor oil and other similar fluids.
Seasonal changes in flavor The flavor of Chandler’s drinking water may change at certain times of the year, depending on the water source. Chandler works with SRP to minimize algae in the canal system and to provide treatment at the SWTP to reduce off-flavors and odors. Arizona State University and the City of Chandler have partnered to routinely monitor for taste and odor precursors in the Consolidated Canal. This allows the treatment plant to have more precise control over taste and odor events and to better utilize resources and manage cost.Who do I contact with questions about Chandler’s Drinking Water?If you have any questions about your tap water or the information in this report, please call 480-782-3660 during normal business hours (8:00 a.m. to 5:00 p.m.,
Monday through Friday). You can also visit our web-site at www.chandleraz.gov. Citizens who wish to address the City Council about water issues may do so at regularly scheduled City Council meetings normally held the 2nd and 4th Thursday of each month. The meetings are held at Chandler City Hall Council Chambers, 175 S. Arizona Avenue. For information about specific meeting times and agenda items, please contact the City Clerk’s office at 480-782-2180, or visit http://www.chandler-az.gov and click on Government tab and then select City Council Agendas & Minutes from the drop down menu on the home page.If you have questions or desire more information, visit www.chandleraz.gov/waterquality, or call (480) 782-3660 Monday through Friday 8 a.m. – 5 p.m., or mail your inquiry to City of Chandler, Mail Stop 803, P.O. Box 4008, Chandler, AZ 85244-4008.
Definitions:Action Level (AL): The concentration of a contaminant, which if exceeded, triggers treatment or other requirements that a water system must follow. Average (of samples): The average of all samples taken during the monitoring period.Level 1 Assessment: A study of the water system to identify potential problems and deter-mine (if possible) why total coliform bacteria was presentLevel 2 Assessment: A very detailed study of the water system to identify potential problems and determine (if possible) why an E. coli MCL violation has occurred and/or why total coliform bacteria was presentMaximum Contaminant Level (MCL): The highest level of a contaminant that is allowed in drinking water. Maximum Contaminant Level Goal (MCLG): The level of a contaminant in drinking water below which there is no known or expected risk to health. Maximum Residual Disinfectant Level (MRDL): The level of disinfectant added for water treatment that may not be exceeded at the consumer’s tap.Maximum Residual Disinfectant Level Goal (MRDLG): The level of disinfectant added for treatment at which no known or anticipated adverse effect on health of persons would occur.Minimum Reporting Level (MRL) The smallest measured concentration of a substance that can be reliably measured by a given analytical method.Nephelometric Turbidity Units (NTU): A measure of water clarityNon-Applicable (N/A): EPA has not set MCLs or MCLGs for these substances.P/A equals Presence or AbsenceParts per million (ppm): Parts per million are a measurement of concentration of sub-
stances dissolved in water. One ppm is equivalent to one gallon in one million gallons.Parts per billion (ppb): Parts per billion are a measurement of concentration of substances dissolved in water. One ppb is equivalent to one gallon in one billion gallons. A ppb is one thousand times smaller than a ppm.Parts per trillion (ppt): Parts per trillion are a measurement of concentration of substances dissolved in water.One ppt is equivalent to one gallon in one trillion gallons.Picocuries per liter (pCi/L): A measure of the radioactivity of a substance.Range (low to high): The lowest analytical result reported to the highest analytical result reported. All other analytical results fall between these two numbers.TOC: Total organic carbon (TOC) has no health effects. However, total organic carbon provides a medium for the formation of disinfection byproducts. These byproducts include trihalomethanes (THM) and haloacetic acids (HAA). Drinking water containing these byproducts in excess of the MCL may lead to adverse health effects, liver, or kidney problems, or nervous system effects, and may lead to an increased risk of getting cancer.Treatment Technique (TT): A required process to reduce the level of a contaminant in drinking water. Turbidity: Turbidity is a measure of the cloudiness of water and is an indication of the effectiveness of our filtration system. We monitor it because it is a good indicator of the quality of water. High turbidity can hinder the effectiveness of disinfectants. Turbidity has no health effects. However, turbidity can interfere with disinfection and provide a medium for microbial growth. Turbidity may indicate the presence of disease-causing organisms. These organisms include bacteria, viruses, and parasites that can cause symptoms such as nausea, cramps, diarrhea, and associated headaches.
Notes:* Some average values are less than the low range due to substituting non-detect (<) values with zero, per the regulations governing compliance calculations.
Santan Vista System Compliance Data 2018:
Santan Vista Detected Unregulated Contaminant (UCMR3):
Santan Vista Detected Disinfection By-product Contaminant 2018:
Contaminant Units MRL Average (of samples)
Range of Samples (Low to high) Sources in Drinking Water
Vanadium ppb 0.07 2.8 2.8- single sample Erosion of natural deposits, also used in industrial processesChlorate ppb 20.0 85 85- single sample By-product of drinking water disinfectionMolybdenum ppb 1.0 5.1 5.1- single sample Erosion of natural depositsStrontium ppb 0.2 1000 1000 - single sample Erosion of natural deposits
Contaminant Units MCL Average (of samples)
Range of samples (Low to high) Sources in Drinking Water
Bromate ppb 10 5 2.1 – 8.4 By-product of drinking water disinfection(TTHMs) Total Trihalomethanes ppb 80 14 14 By-product of drinking water disinfection
Contaminant Units Maximum Contaminant Level
Average (of samples)
Range of samples (Low to high) Sources in Drinking Water
Total Organic Carbon Removal Ratio ppm TT= must be ≥ 1.0 20 16.10 – 24.70 Naturally present in the environment


![Dimensions: [mm] Recommended Land Pattern: [mm] Absolute ... · ZAn 002.003 2019-08-13 DIN ISO 2768-1m DESCRIPTION WL-SWTP SMT White Top view PLCC ORDER CODE 158302240 SIZE/TYPE BUSINESS](https://img.pdfslide.us/doc/110x75/5e322c70039b1f37167fa9e4/dimensions-mm-recommended-land-pattern-mm-absolute-zan-002003-2019-08-13.jpg)


![APPENDIX H SITE WIDE TRAVEL PLAN - West Midlands Interchange · 2020-04-28 · West Midlands Interchange | [Site Wide Travel Plan] 7 1.1.17 This SWTP also recognises the potential](https://img.pdfslide.us/doc/110x75/5f2bf230ed9da4457808217c/appendix-h-site-wide-travel-plan-west-midlands-2020-04-28-west-midlands-interchange.jpg)


![Final FldMan8-18-08 rvsd3-19-09a - cdhc.noaa.gov TM NOS-NCCOS 80 and CRCP 6 [2008].pdffrom NOAA through the Coral Reef Conservation Program. Layout and design were provided by Cheryl](https://img.pdfslide.us/doc/110x75/5f5f8e577a7bab7fee22a8af/final-fldman8-18-08-rvsd3-19-09a-cdhcnoaagov-tm-nos-nccos-80-and-crcp-6-2008pdf.jpg)