Embed Size (px)
Citation preview
HAL Id: tel-01577841https://tel.archives-ouvertes.fr/tel-01577841
Submitted on 28 Aug 2017
HAL is a multi-disciplinary open accessarchive for the deposit and dissemination of sci-entific research documents, whether they are pub-lished or not. The documents may come fromteaching and research institutions in France orabroad, or from public or private research centers.
L’archive ouverte pluridisciplinaire HAL, estdestinée au dépôt et à la diffusion de documentsscientifiques de niveau recherche, publiés ou non,émanant des établissements d’enseignement et derecherche français ou étrangers, des laboratoirespublics ou privés.
Consumer behavior towards innovative products : whichmethodologies for which values?
Valeriia Lobasenko
To cite this version:Valeriia Lobasenko. Consumer behavior towards innovative products : which methodologies for whichvalues?. Economics and Finance. Université Grenoble Alpes, 2017. English. �NNT : 2017GREAE002�.�tel-01577841�
THÈSE
Pour obtenir le grade de
DOCTEUR DE LA COMMUNAUTÉ UNIVERSITÉ GRENOBLE ALPES
Spécialité : Sciences économiques
Arrêté ministériel : 25 mai 2016
Présentée par
Valeriia LOBASENKO Thèse dirigée par Daniel LLERENA, Professeur, Université Grenoble Alpes, et codirigée par Gilles ROEHRICH, Professeur, Université Grenoble Alpes préparée au sein du Laboratoire Grenoble Applied Economics Lab dans l'École Doctorale Sciences Economiques
Consumer behavior towards innovative products: which methodologies for which values? Thèse soutenue publiquement le 3 Mars 2017, devant le jury composé de :
Monsieur Jean Marc FERRANDI Professeur en Marketing à ONIRIS, Université de Nantes, Rapporteur
Madame Anne ROZAN Professeure en Sciences Economiques à l'ENGEES, Université de Strasbourg, Rapporteur Monsieur Stéphane ROBIN Chargé de Recherche CNRS, GAEL, Université de Grenoble Alpes, Examinateur
Monsieur Alexis GARAPIN Professeur en Sciences Economiques, Université de Grenoble Alpes, Président

2
3
Remerciements
Mes remerciements s’adressent en premier lieu à l'ARC8 et à la Région Rhône Alpes,
qui ont financé ma thèse et donc permis d’accomplir tout ce travail.
J’adresse toute ma gratitude à Monsieur le Professeur Daniel LLERENA, directeur
de ma thèse, qui m’a accordé sa confiance. Pendant ces quatre années, j’ai grandement
apprécié vos conseils et votre soutien.
Je remercie également Monsieur le Professeur Gilles ROEHRICH, mon co-directeur
de thèse, pour ses conseils précieux.
Je remercie Anne ROZAN, Jean Marc FERRANDI, Alexis GARAPIN et Stéphane
ROBIN d’avoir accepté de faire partie du jury.
Je tiens également à exprimer mes sincères remerciements à tous mes collègues du
GAEL et en particulier, à Béatrice ROUSSILLON et à Iragaël JOLY pour leurs
contributions et discussions par rapport aux aspects divers de ma thèse. Un grand merci à
Céline MICHAUD qui m’a soutenue et guidée dès le 1er jour au laboratoire. Merci à mes
collègues et camarades pour la bonne humeur et le climat chaleureux pendant le temps
passé au bureau, bien que rare.
Mes remerciements sincères s’adressent aussi à toute personne ayant contribué
directement ou non à l’aboutissement de ce travail de recherche.
Je remercie de tout mon cœur mon chéri pour son amour, sa présence et sa patience.
Merci à ma petite princesse Julie pour avoir donné du sens à ma vie, m’avoir beaucoup
aidé à trouver ma motivation chaque jour pendant le travail sur cette thèse et d’être ma
meilleure amie. Mon amour, ma tendresse et ma gratitude envers vous deux ne connaissent
aucune limite. Mes remerciements s’adressent aussi à toute ma famille en France et en
Ukraine. Merci à ma mère, mon père et mes grands-parents pour leur amour, leurs
motivations et contributions. Merci à mon petit frère pour être tout simplement mon petit

4
frère, toujours là pour moi. Un énorme merci à ma belle-mère pour ses encouragements,
son aide précieuse de relecture et de critique et son aide au quotidien. Merci également à
ma belle-sœur Anne pour ses conseils et ses encouragements.
Merci à mes amis aux quatre coins du monde. Sis, je te remercie pour ton soutien et
ton amitié sans bornes, malgré la distance, ces dix dernières années. Merci à Bogdanis pour
son amitié incomparable et sa bonne humeur. Je te remercie pour ta contribution à la
relecture de ma thèse, et pour le fait que le temps de correction soit devenu plus joyeux.
Merci à Anna, ma soulmate et la grand copine de ma fille, pour nos conversations à propos
de tout et de rien, pour les moments de joie et de tristesse ensemble, pour la chaleur et
optimisme que tu transmets aux autres. Merci à Victoriia Horbenko, ma copine et ma
collègue, d’avoir relu ma thèse si nombreuses fois. Je pense fort à tous mes amis et je les
remercie vivement. Nous nous verrons davantage à l’avenir, c’est promis.

5
6
Table of contents
General introduction ....................................................................................................... 10
Chapter 1
Consumers’ values and their relationship with individual consumption of innovative
products ............................................................................................................................ 25
1. Behavior and its connection with preferences .............................................................. 25
1.1. Preferences and their changing nature ................................................................... 27
1.2. Preferences, as a parameter of the economic decision-making process ................ 30
2. The concept of value, systems of value and their classification ................................... 32
2.1. Personal values ...................................................................................................... 35
Cultural values ....................................................................................................... 38
2.2. Values in the consumption decision-making ......................................................... 40
Customer value ...................................................................................................... 43
Consumer value ..................................................................................................... 49
2.3. Product value ......................................................................................................... 54
2.4. Satisfaction as a response on value ....................................................................... 58
3. Environmental values, as a part of individual’s value system ...................................... 59
3.1. Personal and consumption values and their transformation into pro-environmental
behavior ............................................................................................................................. 61
4. Innovation and innovation values in the consumption decision-making ..................... 65
4.1. Product innovation................................................................................................. 67
New Products......................................................................................................... 69
7
New Product Development.................................................................................... 71
4.2. Consumer innovativeness and the diffusion of innovations .................................. 74
4.3. Eco-innovation, sustainable development and consumption................................. 77
Conclusion ......................................................................................................................... 82
Chapter 2
Preference and value elicitation for innovative products. Methodological side of the
problem ............................................................................................................................ 86
1. Traditional methods of value elicitation .................................................................... 88
1.1. Conjoint analysis ................................................................................................ 94
1.2. Contingent valuation .......................................................................................... 96
1.3. Discrete choice analysis ...................................................................................... 98
Referencing or pivot design of discrete choice analysis ................................... 106
2. Designing stated preference value elicitation method ............................................. 108
2.1. Experimental view on the estimation of willingness to pay ............................. 109
WTP and WTA disparity .................................................................................. 110
2.2. Practical issues of the elicitation mechanism design ........................................ 111
3. Auction as a value elicitation method ...................................................................... 120
4. Combined methods of value elicitation ................................................................... 126
5. Inferred valuation method ........................................................................................ 128
Conclusion ....................................................................................................................... 132
Chapter 3
Elicitation of willingness to pay for upgradeable products with calibrated auction-
conjoint method ............................................................................................................. 136
1. Presentation of the “IDCyclUM” project and the goal of research ......................... 138
1.1. Sustainable development and upgradeability principle .................................... 140
1.2. Presentation of the method of willingness to pay elicitation ............................ 144
2. The experiment on upright and wired vacuum cleaners .......................................... 150
2.1. General information on the method and the experimental design .................... 150
2.2. Experiment outlines .......................................................................................... 152
8
3. Main findings ........................................................................................................... 155
3.1. Analysis of the structure and importance distribution of attributes .................. 155
3.2. Bids distribution and WTP for both types of vacuum cleaners ........................ 160
Conclusion ....................................................................................................................... 166
Chapter 4
French households’ willingness to pay for electricity contracts using Smart Meters
169
1. Smart meters and smart grids technologies ............................................................. 171
1.1. Demand-side management and its consequences on consumer energy saving
behavior ........................................................................................................................... 175
1.2. Insights into consumer acceptance of smart grids and smart meters ................ 177
2. Methodology ............................................................................................................ 184
2.1. Discrete choice analysis and pivot discrete choice experiment ........................ 184
2.2. Estimation models seeking to account for the heterogeneity of consumers’
preferences ...................................................................................................................... 185
IIA property and its consequences on discrete choices ..................................... 187
2.3. Mixed logit models and the heterogeneity of consumers’ preferences............. 188
WTP issues for mixed logit models ................................................................. 190
2.4. Generalized MNL - a new method, which accounts for preference and scale
heterogeneity ................................................................................................................... 191
3. Experiment and the hypotheses ............................................................................... 195
3.1. Experimental design ......................................................................................... 200
4. Main findings ........................................................................................................... 201
4.1. Estimation with the inferred valuation method ................................................. 114
Conclusion ....................................................................................................................... 217
General conclusion ........................................................................................................ 220
References ...................................................................................................................... 226

9
10
General Introduction
“There is often, if not always, a consumer appetite for innovation.” (Nielsen
Breakthrough Innovation Report, 2014, p.8)
The main characteristics of the 21st century economy are high competition pressure,
high level of production and natural resources use, high level of consumption, short life-
span of products with the high rate of technological change and the emerging sustainability
awareness. At the same time, consumers respond to such economic conditions by searching
to satisfy their needs and desires by more and more sophisticated products/services and
personalized solutions. These are as many challenges firms need to cope with to preserve
their competitive advantage.
It is not rare that a producer offers a new product comprising the latest technological
advances, which happens to be not successful on the market. The Nielsen Breakthrough
Innovation Report for Europe (2014) concluded that among 12 thousands of fast-moving
consumer goods launched between 2011 and 2013 only two thirds of these products have
reached the 10,000 sales units and 76% of these new goods have never survived beyond
the first year of their life cycle. The overall rate of failure of new products is about 85%.
This failure rate can be observed if the value proposition of producers does not meet
consumers’ expectations and requirements
The analysis of consumer expectations is very important in order to converge the
values of both parties to a new product with the optimal level of value to the biggest
satisfaction of consumers. The economic challenges of this analysis are of considerable
importance to companies because of the important expenses dedicated to R&D and new
product development (NPD) processes, as well as the necessity of being a step ahead of
competitors. As any changes made during NPD stages may be very costly for a company,
the new product should account for consumers’ values and preferences from the first stage
of NPD. Therefore, these values and preferences have a direct influence on the acceptance
of new products, on its speed and duration of the life cycle of a product.
11
The recent stagnation on consumption markets due to the economy crisis, forces
companies to search for ways to differentiate their products. One of these ways is to
innovate and to propose new products, taking into account consumers’ values and
preferences from the early stages of new product development process. In addition,
products are increasingly sold not alone but bundled with services, creating “Product-
Service Systems” (PSS). PSS guarantee a good functioning of the product and expand its
lifetime, thus, create an added value and environmental benefits for both a producer and a
consumer.
Economic preferences are of a complex and changing nature, especially for
innovative products and are found to be based on a more stable mindset of consumers called
values.
The general purpose of this thesis is to analyze the different types of values that
determine and explain the choices and behavior of consumers with a particular focus
on innovative products. Specifically, we want to know whether consumers are willing to
pay for innovative products with sustainable features and how consumer preferences and
characteristics of the product are involved in the process of decision making.
Chapter 1
Chapter 1 provides a detailed analysis of different theories related to consumers’
behavior and their motivations when they make a decision to purchase and to consume
innovative and sustainable products. The literature review shows that the behavior of
individuals is influenced by their personality, their environment, their preferences, beliefs
and attitudes, as well as other intrinsic and extrinsic factors, including values.
Attitudes are considered to be an affective valuation which is automatic, not objective
and not comparative. In contrast preferences, discussed in economics, are the decision rules
which are applied for each product in each choice situation (Hauser et al., 2014). The more
sophisticated consumer preferences, the larger variety of offerings, i.e. products and
services, should be proposed.
In this thesis, we agree with the previous literature that preferences are specific for
each particular situation and each particular product. They become more complex with
learning and experience and are modified through this process. A new product introduced
on a market, changes the choice environment and adds a new alternative for choice,
therefore preferences for innovative products are formed at the moment of the first contact
(purchase, consumption, etc.) with it.
12
Values represent the beliefs of a person about life and acceptable behavior, thus
expressing both the goals that motivate people and appropriate means to achieve these
goals. They are not connected to situations or particular choice decisions, unlike
preferences. Value concept explains individual choices in a more global way, claiming that
consumers’ preferences are formed on the basis of systems of values, which are stable for
individual. This means that an action is rarely activated by only one value. Usually several
relevant values motivate individual actions, and these values may work together or be in a
compromise or in a conflict.
Innovative products, which are unfamiliar to consumers, are subject to poorly-present
and defined preferences, therefore value analysis may provide more significant and reliable
results about consumer acceptance and WTP for such products.
In this thesis, we claim that consumer behavior is influenced by values, both personal
and consumption-related. Therefore, a careful analysis of different value classifications
should be made in order to understand the relationships between different values and
preferences.
Personal values are those values, which are constant, e.g. stable, attributes for a
person. As it was previously mentioned, they are consistent in time and within situations,
and some value changes may however occur as a reaction to significant changes in personal
circumstances and societal environment (Knafo et al., 2011). These values are based on
cultural, social and familial environments of an individual (Lai, 1995) and are used by the
individual to select actions and to evaluate oneself, others and events, actions, etc.
(Schwartz, 1992).
Different values are first distinguished in the work of Rokeach (1973) and then this
research direction is studied by other researchers (Kahle 1977; Kahle et al, 1986; Schwartz
and Bilsky, 1987; Schwartz, 1992, 1994). The most popular classification of personal
values is made by Schwartz (1992, 1994). This classification distinguishes between 11
values: power, achievement, hedonism, stimulation, self-direction, universalism,
benevolence, tradition, conformity, security and spirituality.
The further research on personal values (Knafo et al., 2011) has also identified
cultural values. They include beliefs, motives and ideas about what is desirable for
particular social and cultural groups of people (Overby et al., 2005; Allen and Ng, 1999).
An individual who belongs to a particular culture and society accepts its values and,
therefore, incorporates them in his personal value system.
Personal values are, thus, the most profound and intimate values of the individual
and which can be traced in all his actions and his behavior.
13
Therefore, if the value is attached to an individual as a personality, we consider this
value as personal value; if the value relates to an individual as an economic agent, we call
this value a consumer or customer value. However, if the value is applied to a product or a
service we call such value as product value.
In marketing research, customer value usually means a tangible reimbursement one
receives in exchange for the payment for the product, the benefits obtained from its
purchase and use/possession. It also represents the value of the relationship between a
producer and a customer. Thereby the producer derives benefits from this relationship in
the form of profits, customer loyalty and, therefore, the expectation of future purchases,
while the customer benefits from satisfaction of his values that the product can provide.
The identification of customer values can help companies to distinguish the priorities
for the product development, in order gain a competitive advantage (Lindgreen and
Wynstra, 2005) and a greater market share (Ulaga and Chacour, 2001). This task is very
important and even more difficult when it concerns innovative products and services.
Contrary to marketing studies, behavioral and consumption studies generally discuss
"values" and not "value". In the definition of Holbrook (1999) the latter is a preferential
statement and the former includes the reasons why this preferential statement or judgment
looks like this.
Therefore, in consumer studies, consumer values denote a set of worldviews and
stable motivations that guide and explain the practices and the choices of consumers. The
classification of consumer values distinguishes such values: efficiency, excellence, status,
esteem, play, aesthetics, ethics and spirituality. These values are stable for each individual,
but included in different value systems in different consumption situations.
Another value also distinguished in the literature is product value, which assumes
that the product itself has an intrinsic value. Due to the high number of products on the
market, the product itself must have a competitive advantage, called added value, which is
perceived by the consumer (Lindgreen and Wystra, 2005).
All the characteristics of the product, including its price and quality, are taken into
account during the process of decision-making. Therefore, the product value is calculated
as the sum of utilities of each attribute, according to Lancaster (1966) consumer theory.
Willingness to pay (WTP) reflects the difference between the product price and product
value for the consumer.
14
Values, as already stated above are stable across choice situations and products/
services, whereas individual value systems are recreated every time a consumer makes a
decision. Hence, the further research will discuss values, which may are activated
specifically depending on the environment of the choice situation and the product of choice.
Our empirical studies, presented in Chapters 3 and 4, discuss innovative products and
services or, more particularly, eco-innovative products and services.
Previous research results find that the sustainable dimension of a product is important
for consumers and may be even determinant. Therefore, next we discuss environmental
values. Environmental values are defined as positive stable positions towards
environmental protection (environmental concern) and sustainability. They are found to
play an important role in the decision making. Whereas most studies address environmental
values in the perspective of an individual or of a citizen, it is important to account for
environmental values applied to consumer choices (Turner, 1999; Brosch and Sander,
2015).
Research evidence shows that even with positive environmental attitudes and values,
and declaring a high environmental concern, consumers do not automatically transform
them into a pro-environmental purchasing behavior (Nordlund and Garvill 2002, Clark et
al., 2003). It may occur when personal and consumer values of an individual conflict with
individual’s environmental values. For example, environmental values are generally linked
to the future, while personal and consumption values may have more influence in present.
In addition, personal or consumer values generated by the needs and desires of an
individual may be more stable and stronger than his/her environmental values.
As this thesis aims to analyze values and preferences of consumers in a context of
innovation and innovative products, innovative values are also considered.
Product innovation or "possession of novelty" (Roehrich, 2004) is defined by the
degree of novelty of the product. Hoeffler (2003), following Robertson (1971), class
innovations into three categories: continuous innovations, dynamically continuous
innovations and discontinuous or disruptive innovations. So in terms of innovation, new
products are those which have a new function or an innovative attribute, or offer a better
version of a function or an existing attribute.
According to the type of innovation employed and consumers’ knowledge about the
product, all new products are divided into really new products (genuine or radical) and
incrementally new products (Hoeffler, 2003; Lukas and Ferrell, 2000; Dewar and Dutton,
1986). A really new product has no existing comparisons on the market and consumer is
not familiar with it. Therefore, the formation of preferences for such products is happening
at the moment of first “contact” with the product and preferences are not pre-formed on the
basis of previous experience and knowledge.
15
According to Sheth (1981) and Rogers (1995) acceptance of innovations depends on
the personal habits and the risks associated with innovations. The strength of the individual
attachment to habitual practices can cause resistance to the installation of the new behavior.
In other words, consumer innovativeness or innovative values may either encourage or
constrain consumers’ perception and acceptance of innovative products/services. In
addition, personal and consumer values affect the ability and desire of the individual to
change his/her behavior.
Recently, the principle of sustainability and environmental/ecological issues in the
process of production and consumption have been discussed in most countries. The topics
of resource use efficiency, waste management and emissions reduction were discussed, as
well as improved environmental performance and, therefore, reduced environmental
impact (Pujari, 2004). Sustainable consumption is both a lever for sustainable production
and the result of it. The use of more environmentally friendly technologies is already
creating a healthier environment for consumption and consumer decisions, and then
sustainable consumption and post-consumption (conservation, reuse, recycling, etc.)
activities take over, creating a sustainable consumption cycle (Jansson et al., 2010).
Responding to these concerns, another type of new products/services has appeared.
Eco-innovative are those innovative products, which are supposed to have a lower impact
on the environment starting from their raw materials use and production practices to final
consumption and waste management issues. It is a sustainable product, which
simultaneously incorporates the latest technological advances. Hence, the difference
between eco-innovations and regular innovations is in their lower level of intentional
environmental damage.
These products appeal to personal and consumer values of an individual, as well as
environmental and innovative values in the process of decision making.
Based on our literature review, Chapter 3 of this thesis will present an empirical study
on innovative products with a sustainable upgrade option. Upgradeability is a new
sustainable strategy used by industries with a high level of technological change and,
hence, proposition of new products.
In addition, Chapter 4 will present an original research study on consumer
preferences for eco-innovative services. In this study, consumers, on one hand, have the
opportunity to choose an innovative and sustainable service and, on the other hand, change
their consumption habits and use of services.
Therefore, we are exploring the possibilities offered by this framework to represent
consumer behavior towards products and services with innovative and sustainable features.
16
Chapter 2
Chapter 2 presents different empirical methodologies used to estimate values and
preferences of consumers. The accuracy of WTP estimates, which reflect the intensity of
preferences, depends on the choice of the method used by the researcher. Specifically,
Chapter 2 discusses different preference elicitation approaches of experimental economics.
The main unit of preference measurement is utility. The choice of a rational consumer
will fall on the product which has the highest utility for him, among all the other alternatives
available for the choice. In monetary terms, preferences and the valuation of a
product/service are reflected in consumer's willingness to pay for the product/service.
Traditional methods of value elicitation consist of revealed preference methods (real
choices) and stated preference methods (hypothetical choices). The data from these two
types of methods can be used for the analysis of consumers’ choices with the help of
appropriate econometric models.
In case of evaluation of "non-market" products - the products, which are not available
on the market as in case of innovative products, revealed preference methods are not
applicable, and only stated preference methods are.
Three major classes of stated preference methods discussed in this research are:
• conjoint analysis;
• contingent valuation;
• discrete choice analysis with its derivatives.
In conjoint analysis, each choice situation consists of several products, where each
product has different characteristics or attribute levels (Batsell and Louviere, 1991). A
respondent is asked to choose between or, more commonly, rank/rate these different
product alternatives, according to his/her preferences. In such representation of products,
researcher may get overall preferences and distinguish each attribute’s contribution to
utility. However, both ranking and rating procedures have a high level of difficulty for
respondents. In addition, such situation is rather uncommon for real choice situations,
which decreases their reliability.
Contingent valuation methods represent another large class of stated preference
methods used for willingness to pay elicitation. In the standard form of contingent valuation
there are open-ended questions and the respondents are asked to state their maximum
willingness to pay for a product or, for example, a specified change or improvement. In the
referendum form of contingent valuation participants are asked to state whether they are
17
willing to pay a given price for the product. Participants, therefore, may either accept or
reject the proposition. Both open-ended and referendum questionnaires are difficult to
answer and are not very realistic, leading to significant overestimates of willingness to pay,
high rates of non-response and/or zero-response (Green et al., 1998).
Most real consumption situations can be described by a situation of discrete choice
analysis. Discrete choice analysis consists of asking the respondents to choose one
alternative (first ranking) from researcher-defined set of alternatives, where each
alternative is described by multiple attributes. Each alternative has different levels of
attributes, predefined by the experimental design. Usually, it is impossible to include all
product’s attributes, so, the researcher takes a decision to include the most important
attributes, according to previous research results, pilot studies or expert opinions
(Kløjgaard et al., 2012).
The representation of each alternative by precise attributes forces consumers to make
a trade-off between different attributes and their levels. Therefore, respondent’s choice may
be explained by the valuation of particular attributes and their changes. It makes possible
to estimate WTP for attributes and marginal rates of attributes’ substitution (Louviere et
al., 2010; Kjaer, 2005).
One highly criticized in the literature drawback of stated preference methods is the
hypothetical bias, which indicates the difference between the amount a participant states
that he/she would pay and an actual amount that he/she pays. A stated preference method
has gained attention which is meant to cope with this issue is pivot discrete choice analysis
or experiment. In this method the alternatives are pivoted around the information basis
available to respondents (Hess and Rose, 2009; Hensher, 2010; Hess et al., 2006; Hensher
et al., 2007). Pivot discrete choice experiment is used in our work for the analysis of new
services related to the electricity consumption, presented in Chapter 4.
Recently there have appeared numerous methods, which combine stated preference
and value elicitation methods with other stated or/and revealed preference methods. Such
combinations allow to simplify, to reduce costs and, as in case of combination with
revealed preference methods, to eliminate biases of stated preferences methods and to
increase internal and external validity of the results. Such methods are mainly developed
for marketing application to cope with upward hypothetical bias of stated preference
surveys. Another wide use of combined methods can be found in environmental studies.
The combined method, which is used in Chapter 3 for the analysis of an eco-
innovative product, is called calibrated auction-conjoint method (CACM) (Norwood and
Lusk, 2011; Kovalsky and Lusk, 2013; Avitia et al., 2011). This method combines the
advantages of the conjoint analysis with those of auctions. The possibility to include
18
numerous attributes with a high number of levels differentiates it from other preference
elicitation methods. Through the analysis of a high number of attributes and the explicit
the trade-off between their levels, possible to trace through WTP estimates, is meant to be
a key to rational consumer behavior, which is translated in less-biased WTP estimates.
CACM used in our study is modified to use the both parts of the method in a hypothetical
setting, which is meant to alleviate the drawbacks of single conjoint analysis and the
auction setting, even hypothetical, is meant to increase the accuracy of the results.
A complementary method of value elicitation used in this thesis is inferred valuation
method. This method, to avoid hypothetical and social desirability biases, asks participants
the amount of WTP they think other participants will be willing to pay for the product or
the increase in the product’s quality. This method distinguishes two utilities that may have
a consumer: a utility to declare the willingness to buy the product, which may partially
reflect social desirability bias or the desire to be better seen by others, and a consumption
utility. Inferred valuation method, allows to disconnect the utility of declaring the
willingness to buy from the utility of consumption. Participants are rewarded for the
accuracy and the research gets less biased estimates of WTP.
In the case of innovative products, the inferred valuation method allows to get an
approximation of the product’s value perceived by an average consumer and to make
forecasts on the average demand for the product after its launch.
Chapter 3
In this third chapter, we present our research on the elicitation of willingness to pay
for eco-innovative products, particularly upgradeable products.
Current ecological situation requires not only an adaptation of behavior, of economic
processes and technologies but the whole community and technology transformation, in
order to cope with the destructing pace of humanity. Both the industry and consumers are
making some efforts to contribute to sustainable development, by introducing new
sustainable products and accepting sustainable consumption practices. Abundant research
has been conducted on new products, but to our knowledge few studies have been done on
new products/services in terms of sustainable development.
A new solution found by the industries, where the rate of products’ change is high,
is based on the upgradeability principle. Upgradeability may avoid the obsolescence, thus,
reduce the replacement rate of products and, subsequently, provide environmental benefits.
Additionally, new upgraded parts may be technologically advanced, providing
supplementary environmental gains. From consumers’ point of view, upgradeable products
19
have a superior value, compared to ordinary products/innovations, through increased life
cycle of the product and its reduced cost in a long perspective.
In this chapter we present a research study eliciting willingness to pay for
upgradeable products. This study was developed within the IDCyclUM project (funding
by the ECOTECH program of the ANR, “Innovations Durables à Cycles d’Upgrade
Multiples”). The estimates of consumers’ acceptance and willingness to pay for
upgradeable vacuum cleaners are obtained with the help of calibrated auction-conjoint
method, defined as a combined method of preference elicitation in Chapter 2.
In this study, the principle of upgradability was applied to two types of vacuum
cleaners: an upright vacuum cleaner and a wired vacuum cleaner. Both vacuum cleaners
are described by specific attributes. There are some attributes that are common to both
products, but most of them have different levels, and there are some attributes specific to
each type of vacuum cleaners, such as the battery type for an upright vacuum cleaner and
the cable length for a wired vacuum cleaner.
The upgrade option is presented as an after-purchase service. The producer provides
consumers with the guarantee that their product could be improved when the new
technology becomes available. Therefore, consumers would not need to buy a new product
to benefit from new technological advances or new functions. Taking into account the
technological possibilities, we considered two upgrades:
- usage optimization and connectivity;
- evolution of the battery/motor.
The standard warranty is proposed as a standard after-sales service, without
sustainable characteristics.
The CACM method allows us to analyze the importance of each attribute level and
each attribute separately inside the product.
For upright vacuum cleaners we found that consumers prefer the products from the
low price segment. Moreover, men prefer lower prices than women as well as the owners
of apartments who largely prefer low-price upright vacuum cleaners. The recharge time of
an upright vacuum cleaner is highly appealing to consumers when it is less than 5 hours
but become much less desirable when 5 to 10 hours are needed. Concerning the autonomy,
weight and power of an upright vacuum cleaner: participants prefer more power and
autonomy, along with a lighter weight.
Participants indicate the standard warranty of an upright vacuum cleaner as an
important after-purchase services attribute, with a medium desirability for the evolution of
the battery/motor and a rather small for the usage optimization and connectivity upgrade.
20
However, there is a difference between men’s and women’s ratings for upgrade functions:
men largely prefer the evolution of the battery or the motor than do women, whereas
women prefer usage optimization and connectivity.
To go further, the distribution of attributes’ importance weights shows that most of
the attributes have equal importance for consumers. Price, weight and autonomy period are
the attributes the most important for consumers.
For the wired vacuum cleaner we obtain the following results. The most desired is a
price of the product within the €100-150 range; slightly less desirable are the products in
the price range below €100, the desirability of the price range €150 - €200 being rather
high as well. Power superior to 2000W obtains the highest desirability ratings, particularly
for the owners of private houses. Another specific characteristic of a wired vacuum cleaner
is the length of the power cable. Clearly, consumers prefer long-cabled vacuum cleaners,
because they are easier to handle, are practical for cleaning large surfaces, and move easily
in small spaces.
Women prefer standard warranty more than do men, as they are probably more risk
averse. Men prefer the possibility of a motor or battery upgrade more than do women, when
the usage optimization and connectivity upgrade is equal for both genders.
The distribution of the attributes importance weights of a wired vacuum cleaner is
also largely uniform with minimums observed for the accessories attribute and the after-
purchase services, and the maximum for the price attribute.
We proceed with the calculation of willingness to pay premiums for the upright and
wired vacuum cleaners comparing their overall differences. These estimates support the
hypothesis that consumers are willing to pay premiums for products with innovative and
sustainable properties, nevertheless, this willingness to pay is found to be very low for the
high-priced products, such as vacuum cleaners.
Information on marginal WTP enables us to analyze the components of vacuum
cleaners for which consumers are willing to pay premiums. These results are of great
importance for companies planning to use the results of this study in the development of
their upgradeable products.
For the upright vacuum cleaner the weight and the number of suction modes have
positive marginal premiums, but at the same time, it is clear that consumers are not willing
to pay more for an upright vacuum cleaner which is less powerful (12V) than for another
more powerful (18V). Regarding the after-purchase services, the standard warranty is
always more attractive to consumers. However, when choosing between two upgrades,
consumers are willing to pay premiums for the evolution of the battery / motor.
21
The situation is similar for the wired vacuum cleaner: marginal WTP are positive for
the "better" attribute levels and negative for the "worst". These premiums of marginal
willingness to pay are significantly different from 0 for most of the attributes.
This confirms the results of previous research. However, despite this positive result,
these premiums are quite low. The after-purchase services attribute or the upgrade receives
both positive and negative amounts of WTP in different cases. Hence, we conclude that the
strategy of a producer should not be based on a higher price differentiation of upgradability,
although the presence of this service is evaluated positively by consumers.
Chapter 4
Chapter 4 presents an experimental study on consumption of electricity. Particular
interest of the study is to analyze the acceptance of electricity contracts equipped with smart
meters, allowing the control of electric appliances (central heating and water heater) at
distance by electricity provider/producer.
The growing use of smart meters and smart grid technologies provides a
technological “support” to the increasing loadings of electricity networks, however, a
significant part of the necessary change should be made in human behavior. The idea of a
smart meter is as follows: it allows a consumer to manage and to monitor his/her electricity
consumption and cost, providing this information to electricity providers at the same time.
Providers, who may also be producers, in turn create an added value to consumers through
the efficient management of the electricity flow and proposition, avoiding over-, under-
loadings and cut outs.
Smart meter is a digital electric two-way meter fixed at consumer’s home, which
allows to manage, supervise and control remotely the electricity consumption of the
household (Pepermans, 2014; Krishnamurti et al., 2012). In addition, it allows a real-time
communication of peak hours, tariff changes and supply conditions to consumers (Gans et
al., 2013; Darby, 2010).
At the same time with these benefits, smart meters are accompanied by risks and
costs. One of the main risks for consumers is a possibility that the “intelligent” electricity
consumption will lead to the increased electricity bills. Comfort decrease may also be one
of the costs, associated with smart metering and energy saving behavior, which may
demand significant trade-offs. Among other concerns of consumers are the intrusion in
their privacy, the loss of control, the necessity of engagement, as well as the lack of interest
or time (Verbong et al., 2013).
The main hypothesis of our research is, hence, to study the acceptance of electricity
contracts with smart meters including the possibility of appliances’ control by the
22
electricity provider. Pivot discrete choice experiment allows us to define the attributes of
electricity contacts that lead to current contracts’ abandon in favor of smart meters and new
contracts, which include the external control by the provider.
The original pivot choice experiment was conducted with private French electricity
consumers in 2015. This research is made in collaboration with the researchers in electrical
engineering from the G2ELab. Pivot choice experiment has allowed us to estimate
consumers WTP for proposed contracts and their particular characteristics. This has also
allowed us to study consumers’ heterogeneity.
Households were proposed to choose between several different contracts,
characterized by four attributes: bill amount variation, pivoted over their current situation
(i.e. decrease of the electricity bill amount, based on the bill of the last year); comfort level;
type of provider’s control, (i.e. control mode of the smart meter) and level of renewable
energy use. The choice of these attributes is motivated by the most important attributes,
according to the literature, taken into account when choosing an electricity contract with
smart metering.
Each proposed contract is analyzed on the basis of the reference alternative, which
represents a "none/take nothing" option (Kontoleon and Yabe, 2003; Shafir and Tversky,
1992). This option increases the realism of the choice situation, which is even more
important to the electricity consumption, which is "invisible" for most households,
explaining every feature of the proposed contract (possible with the method discrete
choice) and linking this information to their actual electricity consumption (possible with
the pivot).
An attribute of a particular interest in our study is the type of control mode attribute,
which describes the level of external presence and control at consumer’s home. There are
four control modes possible: automatic, semi-automatic, free with advice and free (the
current mode). The control mode "free with advice" has no remote control of the heating
system and the water heater. Electricity provider only advises on the optimal management
of the heating system and the water heater by SMS and via the tablet. In the case of semi-
automatic control, the external control is performed during up to 20 days by the electricity
provider and, in addition, consumers receive regular advice on how to manage their
consumption. With the automatic control mode the electricity provider obtains complete
control over the heating system and the water heater for 365 days, giving advice on the use
of electrical appliances, which guarantees a certain level comfort and savings for
consumers.
Inferred valuation method has also been used as an additional method used to elicit
consumers preferences and valuation of smart electricity contracts.
23
The main results we obtained suggest that consumers have actually a positive
evaluation of smart electricity contracts. These findings support the results of previous
research, where the contracts’ attributes are analyzed separately (Verbourg et al, 2013;
Leijten et al, 2014; Richter and Pollitt, 2016; Shipworth et al., 2010). Consumers who
choose intelligent contracts are more numerous than those who want to keep their regular
meter and their current contract. However, this choice is not unconditional. The attributes
of the contracts and their levels have a strong influence on the perception of smart metering
by consumers.
Econometric analysis of the data obtained from 129 participants of the study with
generalized multinomial logit model shows positive utility parameters for free with advice
and semi-automatic control modes and negative for the opt-out option (which also supposes
the free control mode, e .g . the absence of control), therefore consumers do prefer a certain
level of control presence. In comparison with automatic control mode, hence, lower levels
of distant control are preferred.
WTP estimates show that consumers have positive values for external control modes
of their electricity consumption. In average, they are willing to pay 3,74% more of their
bill amount to be engaged with free with advice control mode and 2,85% more of their
electricity bill amount for the semi-automatic control mode. The choice between the current
contract and the automatic control mode is made towards the latter (negative WTP
estimates for opt-out option), which proves that French consumers are willing to accept
smart metering. At the same time, comfort level decrease is accepted only with significant
compensations. Renewable energy part is not significant in our study. These findings may
be used by the authorities and smart electricity providers for the future development of
smart contracts described by the remote control feature and other characteristics, which
should be taken into account when designing electricity contracts taking into account
consumer heterogeneity.
In addition, socio-demographic characteristics are found to have an influence on
consumers’ acceptance of smart contracts. The probability to choose an electricity contract
with external control is smaller for men, for divorced people and for those households who
have individual houses. In contrast, individuals with high revenues and high education level
are associated with the higher probability to choose electricity contracts equipped with
smart meters.
In conclusion, this experimental study has proved that consumers’ preferences are
heterogeneous. However there are significant results to claim that French households
accept electricity contracts with smart meters which include by the remote control by
electricity providers at certain period of time.
24
Finally, the empirical studies presented in Chapters 3 and 4 offer two experimental
approaches that are specific to the issue of consumption of innovative products / services
with sustainable characteristics. They contribute to the understanding of consumer
behavior towards innovative products and to the understanding of the difficulties and
challenges for experimental methods of preference elicitation for these products / services.
In addition, they demonstrate the validity of value theory in consumer behavior.
Organization of the thesis
The structure of the thesis addresses the issue starting with the analysis of the
literature and the development of hypotheses in Chapter 1. Chapter 2 presents the
methodological issues concerning the elicitation of consumer preferences for innovative
and eco-innovative products. Chapters 3 and 4 present the original empirical studies on the
consumption of innovative and eco-innovative products/services. Chapter 3 is submitted
for the publication to the peer-reviewed journal.
25
CHAPTER 1
Consumers’ values and their relationship with individual consumption of innovative products
1. Behavior and its connection with preferences
Behavior, the first notion of this thesis, embraces many different concepts by definition and become the most used word describing the actions of an individual or an entity.
In general sense, behavior, as defined in Cambridge Online Dictionary, is the reaction of a person, an animal or any other substance in a particular situation, conditions with particular stimulus in a particular environment. Stern (2000) defines behavior as a function of the organism and its environment, connecting personal characteristics and contextual factors.
The main purpose of behavioral economics, as a science, is to study human behavior, aiming something in particular, i.e. goal, by making choices limited by the scarce resources.
Individual’s inherent qualities of mind and character are called behavioral dispositions. These dispositions are not controlled by the individual; depend on the current situation and plenty of internal and external conditions. They form the micro-level of non-cognitive behavioral patterns (Rummel, 1975; Witt, 2001).
Basic behavioral dispositions are usually common for humans, these dispositions are called basic wants or inner needs. Such needs or wants include: the need to breathe, water
26
to drink and nutriments to eat, etc. These needs are usually comparatively easy to satisfy (in normal conditions), however, after some period of time they need to be satisfied again by direct inputs (food, water, air, etc.). Another sub-type of basic needs are such needs as sleep or entertainment, where the satisfaction is obtained by indirect inputs – services, like a nap or a TV show. The combination of wants, i.e. motivations or stimulus, and inputs or tools allows an individual to obtain a needed level of satisfaction. In case of non-satisfaction, inner basic wants provoke a heavy deprivation. Other needs and desires provoke also a deprivation but much less intense and more specific (to a particular want) (Witt, 2001).
The distinction between needs/wants and preferences is rather straightforward. Needs are more general and basic, whereas preferences are related to concrete definitions and objects that fulfill concrete needs.
Consumer behavior is a subset of individual’s behavior consisting of specific actions and choices directed on consumption activities. From marketing perspective the need to study consumer (who is also a customer) behavior is explained by the fact that through the purchasing behavior consumer “determine the economic viability of the firm” (Mostert, 2002, p. 41). From consumer studies perspective we aim to analyze the motivations and internal forces, which result in the purchasing and consumption behavior.
With numerous repetitions of needs’ satisfaction an individual learns, gains experience and consumption knowledge (Hoeffler and Ariely, 1999; Witt, 2001). Such experience is also gained by observing and communicating with others. With time, needs and desires form combinations and, in turn, demand new experience and other learning processes. The development of wants, needs and desires in sophisticated forms initiates the formation of attitudes and preferences.
These two notions are conceptually different, where preferences is a less broad concept than attitudes. “People have attitudes towards abstract concepts, individual persons and social groups, events in their personal past and historical figures. Expressions of attitude are also diverse: they include smiles and frowns, verbal statements of approval or abuse, physical assault, charitable contributions, answers to survey questions, and many others” (Kahneman et al., 1999, p.205). Attitudes are considered to be an affective valuation which is automatic and, in contrast to preferences, attitudes are not objective and comparative. “The concept of attitude has a considerably broader range of application than the standard concept of economic preferences” (Kahneman et al., 1999). Mostert (2002) also mention that attitudes being an overall evaluation are stable and difficult to change, even in changing choice conditions. Therefore, consumer behavior analysis is based on preference concept.
27
Preferences, discussed in economics, are also defined as “economic preferences” and/or decision rules (Hauser et al., 2014). The more sophisticated are preferences, the more choice should be offered by different offerings, i.e. products and services. The higher level of satisfaction encourages people to consume more or to buy products which suit better their needs, so we can observe a growing level of consumption expenditures. In this case, the introduction of new products is a means of giving consumers stimulus for consuming, by proposing the products more adapted to their preferences (Witt, 2001).
The formation of preferences, as mentioned above, can be a process of learning (observation and imitation of others, imitation of the personal experience, etc.) or, the preferences may be genetically inherited (Bisin and Verdier, 2001). The process of imitation starts in early childhood by absorption of parents’ habits and actions, observation of social and cultural environment around, peer communication at school, etc. As parents evaluate their children behavior on their own preference patterns unconsciously children take over the same or similar preference templates. This process is also found to be a cultural transmission mechanism, which allows distributing preferences in a heterogeneous way. A simple model of cultural transmission and preference evolution is presented by Bisin and Verdier (2001).
Kapteyn et al. (1980) point out that individual consumption preferences are influenced by personal past consumption experience and by consumption of others, which support previous ideas. The level of satisfaction or welfare is also connected to the process of preference formation.
At the same time, another research current claims that to a large extent, consumers construct their preferences when faced with a specific purchase decision, rather that retrieve pre-formed evaluations, following Moors and Donders (2009). This issue is discussed on the following section.
1.1. Preferences and their changing nature
Most mainstream economists agree that preferences are formed with time and the more experience consumers gain the more stable are the preferences (Hoeffler and Ariely, 1999). The construction of preferences for a new product (new experience for a consumer) is made at the moment of its first meet or/and purchase or/and consumption.
The behavioral decision theory relies on the idea that consumers construct their preferences at the moment of making choice each time, depending on the available information – in the concrete decision-making environment (Hoeffler and Ariely, 1999; Payne et al., 1993). In other words, consumers adapt their consumption behavior on the
28
basis of their past experience and constantly changing consumption environment. The standard model of choice is based on the choice set and the knowledge about it, beliefs about what is available for the choice and preferences among the alternatives of this choice set.
Stable preferences are formed with recurrent choices decisions. Hoeffler and Ariely (1999) mention experience, effort and choice to play a major role in the stable preference formation. In their research the authors (Hoeffler and Ariely, 1999) claim that the strength of preferences grows with the experience, when the response time declines considerably, as well as the violations between the chosen alternative and its further rating place. Efforts and difficult trade-offs between attributes and alternatives play an important role in preference formation: more efforts result in more stable preferences.
This is not the case for innovative products for which the learning process to define value of the product is a more complex problem, because preferences are absent for these products and the choice environment is changed by the introduction of a new alternative (product). The choice between a new product and other familiar products demands more efforts and risks, but may result in the formation of stable preferences (Heoffler et al., 2013).
The stability of preferences for innovative products is also supported by “pioneering advantage” or pioneer brand advantage (PBA) (Carpenter and Nakamoto, 1989; Alpert and Kamins, 1994), which corresponds to the phenomenon observed for pioneering entrants of new markets (high and persisting market shares, higher brand survival rates). Consumers start the analysis of the category of the innovative product from the first “seller” and later have a possibility to compare with other sellers: “…consumer preferences are likely to evolve through time, updated through heuristic judgment processes…” (Carpenter and Nakamoto, 1989, p. 286).
Additionally, learning process during preference formation may be defined as “acquiring a taste”, which means that some things, which are not appreciated at first contact, later with more experience, the distribution of preferences change and some products/features/activities/etc. become preferable (taste, music, odor, etc.).
However, the idea of preference stability of traditional consumer theory is highly criticized in literature, starting from the fact that preferences are choice specific and situation specific, meaning that in any case an individual “recreates” a set of preferences, depending on a particular choice conditions and situation. In addition, preferences are meant to be constantly changing, adapting to environment, choice possibilities and changing nature of a human-being.
29
To support this, Garcia-Torres (2009) argues that the classical consumer theory is not very useful, when talking about product innovation, because it takes into account only quantities of a product and its price, while the preferences are constant. The author claims that we should keep in mind that preferences are constantly changing (and not stable as assumed in traditional consumer theory), as well as the choice set of products (technological change), when the habits of consumption may stay constant. However, with the appearance of the new product the choice set changes and the preferences possibly too.
Another assumption about preferences made in the early research, which is found too strong by Garcia-Torres (2009) is that in traditional consumer theory preferences are considered as being not influenced by neither past experience nor future expectations. The person which takes a decision to buy a product conserves in memory (more longtime for younger people) his previous experience with the product and/or with similar products, has knowledge about his personal preferences and his values, so it is logical to suppose that his current decision is connected with the past.
Another support for the hypothesis of preference instability is presented in Hauser et al. (2014). The authors claim that the process of learning of one’s preferences is conducted during the decision-making. The decision-making, a process with a specific duration, allows a consumer start with his initial preferences (before facing a concrete choice situation) and make a choice, based on his final preferences. Another argument states that in case when preferences do not change during decision-making, consumer’s expertise about his/her preferences changes through their learning.
In this thesis, we agree with the previous literature that preferences are indeed specific for each particular situation, particularly for innovative products. Preferences become more complex with learning and experience and through this process are modified. Therefore, this level of complexity may not be considered as a stability of preferences but instead mean the creation of new preferences, and as each choice situation (and each new product in the choice set) demand more learning and efforts, preferences are indeed not stable and change during decision-making (Hauser et al., 2014).
However, value concept is a concept, which resumes better the idea of stability on the individual level.
In the concept of value, which will be presented in the section 2 of this chapter, we affirm that values are stable for each individual, make call to different preferences in different situations, therefore the combination “value-preference” is different each time, which leads to different choices.
Attitudes, discussed above, being broader and less objective than preferences, are not taken into account in the economic decision-making, and are discussed below in the section only through their impact on the formation of values.
30
1.2. Preferences, as a parameter of the economic decision-making process
Personal related factors of the consumer, e.g. sex, age, social position, profession, psychological factors, etc. are important factors in formation of consumer preferences and values.
Sen (1970, cited in Hausman, 2011) distinguishes two types of preferences: basic preferences, which are not based on personal beliefs and non-basic preferences, which are based on personal beliefs. The majority of preferences are found to be non-basic.
Hausman (2011) describes four main concepts of preference.
1. Preference as an enjoyment comparison means a comparison between different alternatives and choosing the one, which is more pleasant and brings more enjoyment. This concept is based on a mental attitude of a person.
2. Preference as a comparative evaluation means comparing choice alternatives according to their partial (one or some criterions considered) or total (every feature taken in account, complete comparison) ranking on consumer's point of view. The theory of comparative evaluations emphasizes the fact that each product/service is examined as a set of attributes and an individual constructs his/her preferences on a full or partial comparison of these attributes. In other words, an individual compares the alternatives of the choice set with the respect to the attributes, which he/she considers to be the most important in current circumstances and in accordance with his/her values.
3. Preference as a favoring means an alternative is chosen according to different specific features, which will bring better satisfaction by the product and “favors” it over other alternatives. However, it does not mean that the “favored” product is better than “not-favored”.
4. Preference as a choice ranking. This type of preferences is a straightforward decision between a specific range of choice options and their attributes, by making a ranking from the least to the most preferable.
31
Enjoyment comparisons and comparative evaluations are mental attitudes towards a product, as mentioned before, whereas choice ranking and favoring are actions.
By this typology of preferences Hausman (2011) largely follows Lancaster (1966) in his approach to consumers’ theory, which originally proposes the idea that a consumer values not a product itself but its characteristics or attributes.
The construction of preferences, following Lancaster (1966), is based on the comparison of attributes of alternatives of the choice set. The attributes are ranked by their importance and an optimal alternative is chosen. Hence, for the unknown category of a product or for an inexperienced consumer the choice decision will have much more alternatives in choice set (all possible combinations of attributes) and the ranking of important attributes may take much more time and efforts. The identification of the attributes may also cause additional difficulties. For example, when choosing a car an inexperienced consumer will need to compare all the cars on the market, when another consumer, who has already owned a car, knows that the most important attributes of a car for him/her are the price and the country origin of the car constructor (as a prove of the quality, for example). Therefore, an experienced consumer will considerably reduce his choice set and compare more easily the alternatives (Hoeffler and Ariely, 1999).
Hausman (2011), agreeing with Sen (1970), suggest that there may be numerous possible ways how one can distinguish or subdivide preferences, however, one should rather look at what lies beneath preferences: needs, motivations, beliefs, values (of a personality, of a product, etc.).
The main unit of preference measurement is utility. In the early research utility is presented as a trade-off between the pleasure and the pain, the measure of satisfaction. The pleasure and the pain can be in turn measured on the basis of their duration, intensity, (un)certainty and remoteness (Garcia-Torres, 2009).
As mentioned above, since the introduction of Lancaster’s theory of consumer, a product should not be considered as an entity, which has a direct utility for consumer but rather as a sum of utilities of product’s characteristics or properties.
From this, Lancaster derives that each characteristics, which has a utility for a consumer, may be a part of many different products and the combination of products may give a different total utility to consumers than each product separately. Similarly, offerings, which are not similar to each other may give similar utilities. Looking like this on products allows to separate utility vectors of each characteristics/attribute of a product and estimate welfare, satisfaction, willingness to pay (WTP), etc. Hence, a consumer, to maximize his utility, chooses the product, which has a better combination of searched characteristics.
32
Through this explanation the connection between values, preferences, attributes, and therefore, utilities and satisfaction may be seen: the choice of the product is made by evaluation of the attributes, which yield higher utilities; whereas these attributes are analyzed according to preferences, guided by individual’s values.
For new products, by definition, it is impossible to have a priori preferences, because of the obscurity of product’s attributes and, consequently, the utility (of the sum of attributes’ utilities) is unknown as well.
2. The concept of value, systems of value and their classification
As discussed earlier, we assume that preferences are constructed and used by individuals in particular situations, when choosing among a particular choice set, with the reference to more stable beliefs, needs and values.
In this thesis we make a hypothesis that values guide preferences and consumption choices, and there exist numerous systems of values, not the only one. These systems, situation- and goal-specific, are recreated each time. Moreover, values’ classification is not a straightforward separation of different types of values but a multilayered embracing classification.
Therefore, this part of the chapter will talk about different theories and definitions of value, the interconnections of different values with each other and other concepts like emotions, preferences, attitudes, beliefs, norms, behavior, etc.
The concept of value is presented in many sciences and addressed in different situations: sociology, psychology, philosophy, marketing and economics, and in each, it has different interpretations. We can find numerous values in literature: market value, replacement value, liquidation value (financial term), use and esteem value (purchase management terms), use value, exchange and cost values (economics terms) and value-in-use, possession value (marketing studies) (Tzokas and Saren, 1999; Lindgreen and Wynstra, 2005 for references).
33
The major work on values by Schwartz (1992, 1994) distinguishes five features, which characterize values. The author says that the value: “is a (1) belief (2) pertaining to desirable end states or modes of conduct, that (3) transcends specific situations, (4) guides selection or evaluation of behavior, people, and events, and (5) is ordered by relative importance to other values in order to form a system of value priorities” (Schwartz, 1994). A combination of values, which guides the person is called value orientation (Hansla et al., 2008; Brosch and Sander, 2015) or value system, i.e. a combination of values, which “works” together.
Hence, all values may be described by following features (Brosch and Sander, 2015):
- Values are beliefs, meaning that when the value is in use it arouses emotions and feelings. For example, when security or independence values are activated, in case of threat of them, individuals try to protect them and feel happy when they can feel and enjoy it.
- Value is connected to the desirable goal or end-state. It means that values are activated or motivated by something, which is the goal for an individual. Usually this feature serves to distinguish different values. In addition, it is supposed that values guide actions, therefore, behavior.
- Values may be the same for numerous actions and situations. For example,
if someone values traditions, he values them during family holidays and he may also value them during sport or business meetings. It differentiates them from norms, which are situation-based.
- Values serve as standards and criteria, because they guide individual and
“pre-select” possible actions, people, products, etc. - Values have relative importance, being prioritized by each individual. This
hierarchy of values distinguishes them from attitudes and norms.
Relative importance of multiple values (systems of values) guides action. This means that any action is rarely activated by a sole value. Usually several relevant values motivate an individual for action, being either in a common action, a compromise or a counteraction.
Go get the “vague” view on how we can classify values on certain categories in order to describe them, let’s answer one question: whether value is attached to someone or something. If the value is attached to an individual as a personality, we consider this value
34
as personal; if the value concerns an individual as economic agent we call this value a consumer (or customer) value. However, if the value is applied to a product (service) we call it product (service) value. Cultural values, as also included in the concept, as a supplementary concept inside personal value concept, are inherent to any individual of any culture, however, there may exist some cultural and religious values, which mediate or amplify other values and create new ones (Overby et al., 2005). In addition, two distinct value types (innovation value and environmental values) are discussed in their connection to the consumption of innovative and eco-innovative products.
Being a complex theory, value analysis and classification is not straightforward. Numerous researchers treat different concepts (meaning different things), giving them the same names, while others subdivide large value definitions into numerous small ones, making the structuring difficult. In addition, one cannot completely detach one type of value (for example, product value and any other) from another.
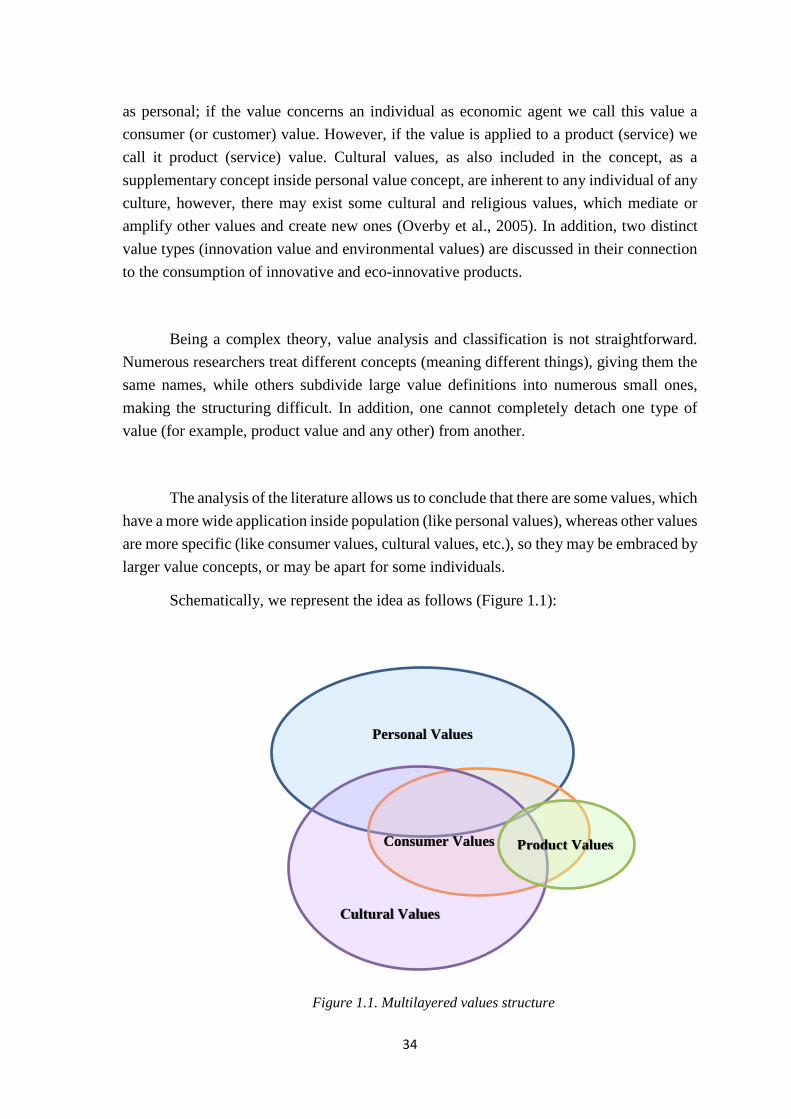
The analysis of the literature allows us to conclude that there are some values, which have a more wide application inside population (like personal values), whereas other values are more specific (like consumer values, cultural values, etc.), so they may be embraced by larger value concepts, or may be apart for some individuals.
Schematically, we represent the idea as follows (Figure 1.1):
Figure 1.1. Multilayered values structure
Personal Values
Consumer Values
Сultural Values
Product Values
35
We hereby suppose that several value systems are interposed or influence together individuals’ behavior, or they may be independent or contradicting. Therefore, the goal of this chapter is to present an all-embracing explanation of what the value is, how it works for an individual, what is in its’ core and how their classification may be.
2.1. Personal values
Personal values are those values, which are constant, e.g. stable, attributes for a person. As it was previously mentioned, they are consistent in time and within situations, and some value change may however occur in response to significant changes in personal circumstances and the societal environment (Knafo et al., 2011). Contrary to preferences, personal values do not have any connection with a particular situation, time or product. Such values create an integral value system of a personality and can also be referred to as personal standards, rules, ideals, etc. (Sanchez-Fernandez and Iniesta-Bonillo, 2007, Rokeach, 1973). These values are based on cultural, social and familial environments of an individual (Lai, 1995) and are used by the individual to select actions and to evaluate oneself, others and all events (Schwartz, 1992).
The primary work with these ideas has appeared in 1973 by Milton Rokeach and called “The nature of human values”. The author has developed 36 values, where 18 of them are terminal (end goals of existence) and the other 18 are instrumental (related to the modes of behavior), claiming that values are based on personality traits and influence individual attitudes and behavior. Therefore, the change in values leads to the change in behavior.
“… values are special kinds of preferences for modes of conduct or end-states of existence.” (Gutman, 1982, p.63).
Further work has proposed a more simple classification of personal values, known as “List of Values” methodology (Kahle 1977; Kahle et al., 1986). These authors distinguish 9 values: self-respect, security, warm relationships with others, sense of accomplishment, self-fulfillment, sense of belonging, being well respected, fun and enjoyment in life, and excitement. These values represent a personal reality awareness based on attitudes. Values are considered to be more stable than attitudes and beliefs, and influencing behavior (connection of values with behavior will be discussed further in details). Specifically, attitudes reflect the evaluation of an object on the scale from negative to positive, whereas values depict the desirable (i.e. positive) aspect of a behavior (Brosch and Sander, 2015).
36
Shalom H. Schwartz is known for his huge contribution to the topic with the most widely known classification of personal values by now.
Schwartz (1994, p.21) defines human values as “desirable trans-situational goals, varying in importance, which serve as guiding principles in the life of a person or other social entity”. As the author explains, each individual as a part of society needs to find his “place” in this society. Values and social standards are the ways of how one can position himself and communicate this information to other participants of society and interact with them.
This research direction on values is incepted by Schwartz and Bilsky (1987) and continued by Schwartz (1992, 1994). It consists on the idea that “values should influence behavior indirectly through attitudes” (cited in Follows and Jobber, 2000).
Schwartz and Bilsky (1987) divide values on collective and individual value groups, lately the latter were re-named into self-enhancement values.
• Collective values are subdivided into pro-social (re-named in self-transcendence in Schwartz, 1992) and restrictive-conformity values social (re-named in conservation values in Schwartz, 1992), which represent the concern about the welfare of other members of society and concerns about the personal conformity to society respectively.
Self-transcendence values include such values like benevolence and universalism (Schwartz, 1992, Follows and Jobber, 2000). Environmental concern values are also attributed to this category: “a strong underlying concern for the welfare for others would lead to a higher level of importance placed on the environmental consequences of a product because a product that damages the environment would be detrimental to society” (Follows and Jobber, 2000, p. 728). Conservation values include conformity, security and tradition values.
• In the individual (self-enhancement) value group are such values: personal achievement, enjoyment, power and hedonism.
At the same time, several other values have been added to the classification: openness to change, self-direction and stimulation values.
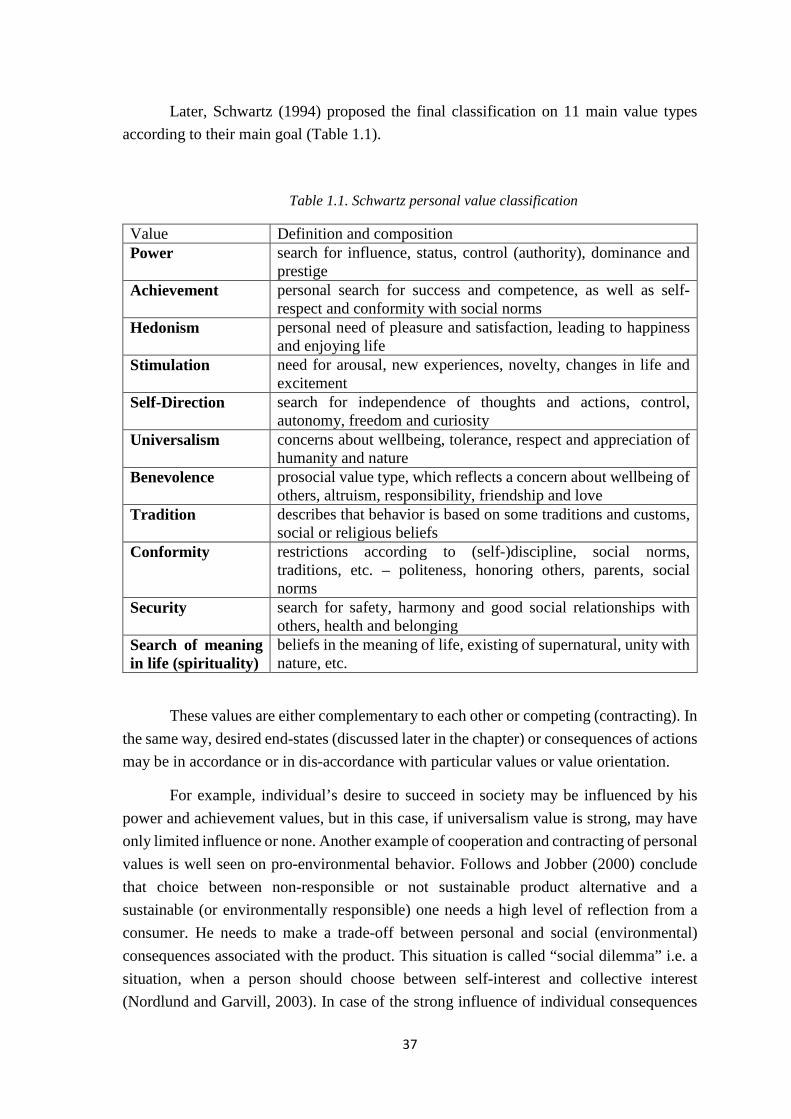
37
Later, Schwartz (1994) proposed the final classification on 11 main value types according to their main goal (Table 1.1).
Table 1.1. Schwartz personal value classification
Value Definition and composition Power search for influence, status, control (authority), dominance and
prestige Achievement personal search for success and competence, as well as self-
respect and conformity with social norms Hedonism personal need of pleasure and satisfaction, leading to happiness
and enjoying life Stimulation need for arousal, new experiences, novelty, changes in life and
excitement Self-Direction search for independence of thoughts and actions, control,
autonomy, freedom and curiosity Universalism concerns about wellbeing, tolerance, respect and appreciation of
humanity and nature Benevolence prosocial value type, which reflects a concern about wellbeing of
others, altruism, responsibility, friendship and love Tradition describes that behavior is based on some traditions and customs,
social or religious beliefs Conformity restrictions according to (self-)discipline, social norms,
traditions, etc. – politeness, honoring others, parents, social norms
Security search for safety, harmony and good social relationships with others, health and belonging
Search of meaning in life (spirituality)
beliefs in the meaning of life, existing of supernatural, unity with nature, etc.
These values are either complementary to each other or competing (contracting). In the same way, desired end-states (discussed later in the chapter) or consequences of actions may be in accordance or in dis-accordance with particular values or value orientation.
For example, individual’s desire to succeed in society may be influenced by his power and achievement values, but in this case, if universalism value is strong, may have only limited influence or none. Another example of cooperation and contracting of personal values is well seen on pro-environmental behavior. Follows and Jobber (2000) conclude that choice between non-responsible or not sustainable product alternative and a sustainable (or environmentally responsible) one needs a high level of reflection from a consumer. He needs to make a trade-off between personal and social (environmental) consequences associated with the product. This situation is called “social dilemma” i.e. a situation, when a person should choose between self-interest and collective interest (Nordlund and Garvill, 2003). In case of the strong influence of individual consequences
38
consumer may choose a non-sustainable product, even having a high environmental concern. “A concern for the welfare of others indirectly results in an intention to purchase environmentally responsible product” (Follows and Jobber, 2000, p. 739), where a self-transcendence value plays a major role.
Follows and Jobber (2000) give advice for marketers based on these results: in order to increase consumers’ purchase intentions of environmentally responsible products marketing strategy should carefully explain both individual and environmental consequences of the product, with the stress on specific consequences for the given product. Consumers should have clear information about positive environmental consequences and, at the same time, positive individual consequences due to sustainability of the product. For marketers, at the same, the analysis and the further modification (of the product) of consumers’ negative individual consequences should be a priority, holding constant the level of positive social sustainable consequences1 (Follows and Jobber, 2000).
Cultural values
In any society, people usually become a member of a group in order to survive. “Group success depends on culture: the system of values, beliefs, artifacts, and art forms which sustain social organization and rationalize action. Values and beliefs which fit the ecosystem survive and multiply; less fit ones eventually disappear. And thus cultural traits are selected much like genetic traits. At the same time, cultural values and beliefs influence how people interact with their ecosystem and apply selective pressure on species. Not only have people and their environment coevolved, but social systems and environmental systems have coevolved.” (Norgaard, 1994, p.41 cited in Munda, 1997, p.224)
Hence, another value classification aroused in literature is cultural values, which include beliefs, motives and ideas about what is desirable for particular social and cultural groups of people (Overby et al., 2005; Allen and Ng, 1999). In Swartz classification - further extension of his personal value research (Knafo et al., 2011) cultural values are defined as nation-level values, which largely explain the variation in societal rules, norms, practices and policies across countries.
As personal values, these values are independent of any products’, services’ evaluations, situation and consequences contexts. Cultural and social norms, being in the core of cultural values are also used to calibrate the behavior of societies and vice versa. Cultural values are promoted by cultural and social norms, an individual which belongs to
1 The question of environmental values and concerns will be discussed later in details.
39
a particular culture and society accepts its values and, therefore, integrates them in his personal value system.
At the same time cultural values have an indirect influence on consumption values (discussed below), “filtering” information and products. Culture allows making choices in accordance with stable and well-established cognitive system of a person and society (through communication with others and cultural traditions), influences the understanding of desired end-states and the ways of their achievement.
Referring to the scheme presented earlier (Figure 1.1), we assume that cultural values are largely included in personal values, and are hardly separable in some cases. In other cases, they may act separately, so they still are not the same concepts. For example, some religious traditions, may be supported only because social norms (cultural values) oblige or because of personal convictions (personal values), or both social norms and personal convictions may act together and in this case cultural values become a part of individual’s personal values system.
Concluding, personal and cultural values, being a stable part of a personality are present in individual’s everyday life. Consumption is an essential part of individual’s life as well. Overby et al. (2005) support the idea that cultural values and socialization of an individual have an important role in consumers’ decisions about consumption of habitual products due to attachment, traditions and loyalty (Allen and Ng, 1999; Lai, 1995). In turn, some attributes and their levels may become important in the eyes of consumers due to their call to individual’s cultural values (Dawar and Parker, 1994). Extend literature proves the differences in consumer choices across countries, cultures and nationalities.
In addition, Overby et al. (2005) state that national culture significantly influences consumer innovativeness, consumer decision-making process, intentions, persuasion, product attribute importance, and even the relationship between interviewer ethnicity and survey response quality. At the same time, this influence of cultural values on consumption behavior has a direct influence on the offerings’ proposition and NPD processes inside of companies.
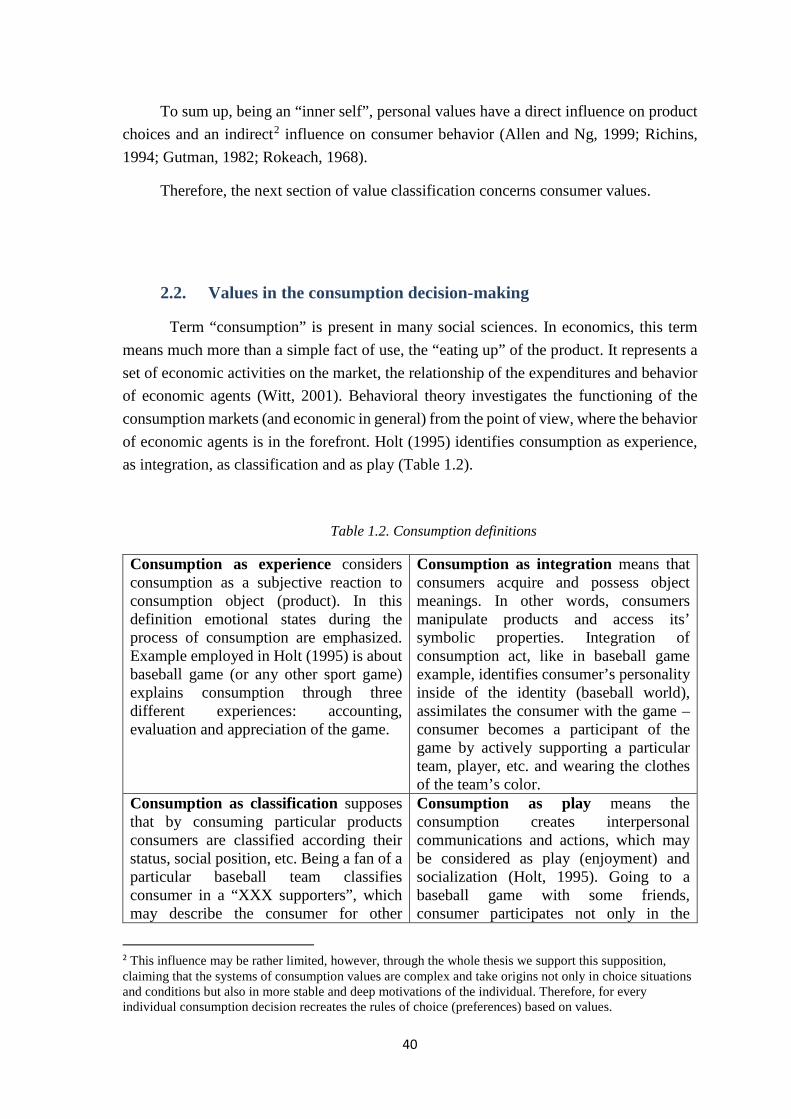
40
To sum up, being an “inner self”, personal values have a direct influence on product choices and an indirect2 influence on consumer behavior (Allen and Ng, 1999; Richins, 1994; Gutman, 1982; Rokeach, 1968).
Therefore, the next section of value classification concerns consumer values.
2.2. Values in the consumption decision-making
Term “consumption” is present in many social sciences. In economics, this term means much more than a simple fact of use, the “eating up” of the product. It represents a set of economic activities on the market, the relationship of the expenditures and behavior of economic agents (Witt, 2001). Behavioral theory investigates the functioning of the consumption markets (and economic in general) from the point of view, where the behavior of economic agents is in the forefront. Holt (1995) identifies consumption as experience, as integration, as classification and as play (Table 1.2).
Table 1.2. Consumption definitions
Consumption as experience considers consumption as a subjective reaction to consumption object (product). In this definition emotional states during the process of consumption are emphasized. Example employed in Holt (1995) is about baseball game (or any other sport game) explains consumption through three different experiences: accounting, evaluation and appreciation of the game.
Consumption as integration means that consumers acquire and possess object meanings. In other words, consumers manipulate products and access its’ symbolic properties. Integration of consumption act, like in baseball game example, identifies consumer’s personality inside of the identity (baseball world), assimilates the consumer with the game – consumer becomes a participant of the game by actively supporting a particular team, player, etc. and wearing the clothes of the team’s color.
Consumption as classification supposes that by consuming particular products consumers are classified according their status, social position, etc. Being a fan of a particular baseball team classifies consumer in a “XXX supporters”, which may describe the consumer for other
Consumption as play means the consumption creates interpersonal communications and actions, which may be considered as play (enjoyment) and socialization (Holt, 1995). Going to a baseball game with some friends, consumer participates not only in the
2 This influence may be rather limited, however, through the whole thesis we support this supposition, claiming that the systems of consumption values are complex and take origins not only in choice situations and conditions but also in more stable and deep motivations of the individual. Therefore, for every individual consumption decision recreates the rules of choice (preferences) based on values.
41
supporters. This classification may be done though consumers’ actions, for example exclaiming the name of the favorite baseball team in a public place may classify the consumer as an aggressive supporter or too passionate.
supporting of the favorite team, but also in peers’ conversations and general enjoyment of the game in a good company.
Historically, with the growth of the average well-being of humans all over the world the consumption level have also grown. Alongside with the growth of choice possibilities, needs, desires, preferences have become more complex and difficult to satisfy (Witt, 2001).
Consumerism is a major feature of the modern economy (Overby et al., 2005) and delivering a superior customer/consumer value has become, in line with innovation, a crucial part of competitive advantage search (Woodruff and Gardial, 1996; Overby et al., 2005; Sweeney and Soutar, 2001) for both profitable and non-profit organizations (Lai, 1995).
Consumers, increasing their consumption levels with the development of the economy and the increase in the proposition, pay less attention to price, taking more into account the value of a product or service.
Earlier in the chapter we have already stated the importance of the consumption behavior analysis and in this section we investigate the concept of value and try to find the definition or the definitions, which display it accurately to a consumer.
Consumption choices permit to obtain a lot of information about a consumer and “represent a fragment of our total personal identity” (Tzokas and Saren, 1999). And, from Holt (1995) definition of consumption, we can conclude that consumption activities, following different goals, are motivated by different values and choice rules.
To position consumer value according to personal value discussed above, we should say that the main difference between personal value and consumer (or customer) value it that the latter is always linked to a particular product or choice situation, has a smaller scope and does not reflect the inner “self”, general valuations and desirable states of life sought by individuals (Woodruff, 1997).
The most common definition of value, which is widely accepted as reference in all economic and marketing literature is following:
“Value is the consumer’s overall assessment of the utility of a product based on perceptions of what is received and what is given.” (Zeithaml, 1988, p.14).
42
In line with this definition Lai (1995) cites Day (1990, p.142) value equation: “Customer's Perceived Benefits-Customer's Perceived Costs = Perceived Customer Value".
We recognize that these definitions reflect a more common definition of exchange value. Nevertheless, let it be clear that this definition gives rise to a series of studies and definitions that seek to explain the value concept concretely from consumers’ and customers’ points of view, and not as an exchange value generally present in economics. By its close connection to the marketing exchange theory this definition leads to its partial reflection in marketing value definition, leaving a room to differing definitions in consumer-related studies (on consumer and product values). These definitions are discussed separately further in the chapter.
Recently the concept of value is subject to constant change, because of high number of innovations, considerable development of technologies and internet services, globalization of markets and liberalization of economies (Lindgreen and Wynstra, 2005), and ergo the perceptions of time and distance, accessibility and availability of products.
In the interest on this research, the multidimensionality and multidisciplinarity of the value concept were studied on marketing and consumer studies literature. We notice that marketing literature has different definitions of value of those found in consumer behaviors studies, purchasing and supply management research. Marketing literature mainly treats customer value (Woodruff and Gardial, 1996; Woodruff, 1997; Roehrich and Llerena, 2011), whereas behavioral studies are concerned with consumer values (Kahle, 1977; Lai, 1995; Holbrook, 1999; Monroe, 1990; Sheth et al., 1991; Hausman, 2011).
Marketing studies usually mean a tangible reimbursement one receives in return for paying for the product, benefits obtained from buying and using the product. In addition, customer value means also a lifelong value of a customer for a firm and its prosperity. It also covers the sum of the profits that the firm can hope to do with a customer for the duration of her relationship with him. Meanwhile, consumer and behavioral studies see value as something desirable and useful individually for each consumer, desired end-states from using the product. Consumer values guide consumers through their consumption decisions: "centrally held cognitive elements that stimulate motivation for behavioral response" (Vinson et al., 1977, p.45).
Moreover, this difference comes out of the idea that a customer is someone (individual or enterprise), who buys a product and has a particular economic value for the
43
seller/producer, whereas a consumer is someone who actually uses a product (Parasuraman and Grewal, 2000). A customer has all the rights for a product and a consumer may not have all these rights to consume a product, however, if we consider that a customer is a consumer at the same time the difference disappears.
In the next section we present customer value, stressing its monetary and relationship bias. In contrast, consumer values concept discusses stable motivations, which guide his/her consumption decisions. We focus our research of the latter, searching to analyze individual consumers.
Customer value
The early research on customer values has appeared in 1940s-1950s, revealing the importance of its’ understanding for the market success of the company. Since then, value creation and the effectiveness of its delivery to customers have been revealed to be two of the key elements in marketing (Lindgreen and Wynstra, 2005; Ulaga and Chacour, 2001; Tzokas and Saren, 1999).
Customer value as described by Woodruff and Gardial (1996) is customers’ perception of what have to happen (i. e. consequences) in a specific use situation, with the help of a product or service offering, in order to accomplish a desired purpose or goal. It is always applicable to the product of use (Woodruff, 1997) and represents a “value-for-money” concept (Sweeney and Soutar, 2001). In marketing value represents a transaction of buyers’ and sellers’ values (Payne and Holt, 2000), which lead to customer satisfaction and loyalty, in case of superior value proposition (see Figure 1.2. red bottom zone – benefits received by the customer are higher than the cost of the product), and to dissatisfaction in case of inferior value proposition by the seller (Figure 1.2. blue upside zone – the cost of the product is higher than the received benefits). The red line represents a fair value line, with economy, parity and premium zones.
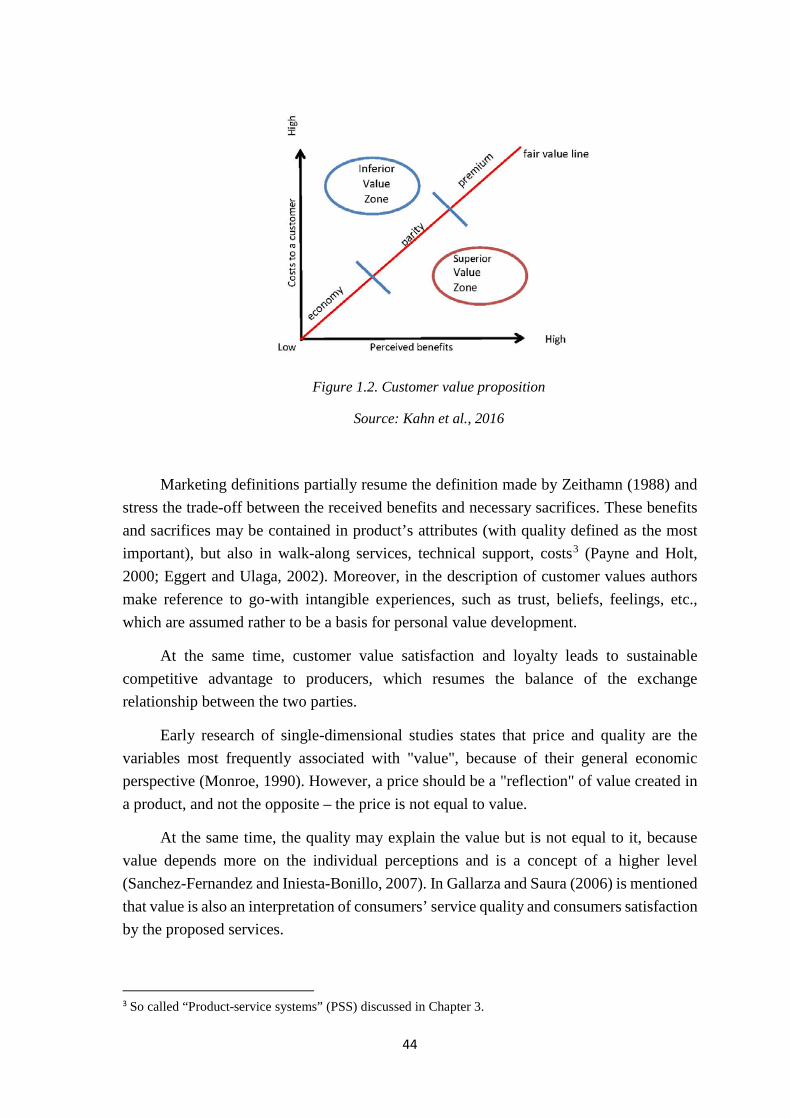
44
Figure 1.2. Customer value proposition
Source: Kahn et al., 2016
Marketing definitions partially resume the definition made by Zeithamn (1988) and stress the trade-off between the received benefits and necessary sacrifices. These benefits and sacrifices may be contained in product’s attributes (with quality defined as the most important), but also in walk-along services, technical support, costs3 (Payne and Holt, 2000; Eggert and Ulaga, 2002). Moreover, in the description of customer values authors make reference to go-with intangible experiences, such as trust, beliefs, feelings, etc., which are assumed rather to be a basis for personal value development.
At the same time, customer value satisfaction and loyalty leads to sustainable competitive advantage to producers, which resumes the balance of the exchange relationship between the two parties.
Early research of single-dimensional studies states that price and quality are the variables most frequently associated with "value", because of their general economic perspective (Monroe, 1990). However, a price should be a "reflection" of value created in a product, and not the opposite – the price is not equal to value.
At the same time, the quality may explain the value but is not equal to it, because value depends more on the individual perceptions and is a concept of a higher level (Sanchez-Fernandez and Iniesta-Bonillo, 2007). In Gallarza and Saura (2006) is mentioned that value is also an interpretation of consumers’ service quality and consumers satisfaction by the proposed services.
3 So called “Product-service systems” (PSS) discussed in Chapter 3.
45
These arguments are supported further in the chapter.
Woodruff and Gardial (1996) theory describes the hierarchy of customer values. This hierarchy distinguishes three levels of value: attributes, consequences and desired end-states, which are also the elements of the means-ends chain theory (Gutman, 1982; Woodruff, 1997; Overby et al., 2005; Sanchez-Fernandez and Iniesta-Bonillo, 2007). Means are the products/services or experiences in which people engage to achieve the end state – the goal, which is valued by the customer. In other words, desired end states reflect personal values. Different means may be used to obtain the ends/end states and the same means may be engaged to achieve to the same final goals. Thus, only desired end states represent value to a customer. Two-side connection between the means and the ends is useful for marketing research and NPD.
Further, this marketing theory results in three conditions, which together influence the decision-making (Gutman, 1982; Woodruff, 1997; Roehrich and Llerena, 2011):
• situation with its constraints;
• consequences;
• value-in-use or possession value.
Value-in-use, as its name suggests, is a functional outcome, a purpose that is found directly in consumption of a product. Any benefit a customer extracts from a product or service occurs to be valuable to him. Back to marketing exchange theory, benefits for both customers and producers are the core of marketing definition of value.
However, even for a specific product or service there may be a number of value-in-use objectives, which the product must meet. For example, a consumer of a car needs it to be a transport, a storage, a comfort, a fast navigation, etc. In this case value is measured by so called attribute-based utilities or benefits (Woodruff, 1997; Spiteri and Dion, 2004), which will be discussed further in the section.
Sometimes customers derive value simply from possessing a product. This notion of possession value acknowledges that products can contain important social, symbolic, self-expressive and aesthetic qualities that accrue to the customer through proximity and association. In this case the link of customer values with personal and consumer values is more direct than in case of value-in-use. For example, possessing a valuable painting or a car reflects the presence of possession value and personal values of power and achievement (according to Schwartz classification).
46
The mere ownership is also a goal of possession value. When a customer pays for the value-in-use he is paying for functioning, when the possession value is in change then the reasons are more psychological, therefore, usually differ from customer to customer.
The second element of value conditions is situation. Values can be created for particular situations, saying that a value and a customer “meet” in a particular use situation. For example, a box of sweets can be bought for several reasons: to enjoy them personally, to offer to someone, and so forth. The value a particular consumer has for a particular product may vary considerably depending upon the demands of different use situations. The product may lose its customer value if it does not correspond to the situation: a spoon is only valuable if it is present at time for dinner.
The third element in customer values dimension is consequences. The ability of customers to attain their desired end-states or goals is determined by the consequences of the product use, which are the outcomes or experiences for consumer. These consequences are linked to the original purposes or purchase goals and may be positive or negative.
Positive desired consequences are called benefits. They can be both objective and subjective like minimal time and lower inventory or stress relief and efficiency. Note that benefits are not the attributes of the product.
Negative consequences can also be objective (e.g. price, time) and subjective (e.g. “difficult in usage”). Usually the most obvious negative consequence is the price. In addition, negative consequences can appear when supposed positive consequences are not received, hence, corresponding negative ones appear. For example, when buying an innovative product there might be negative conclusions that it is “difficult to operate” or “it takes too much efforts/time”. Therefore, it is considered that a value is a trade-off between negative and positive consequences.
From another point of view, consequences can also divided into personal, social and functional or direct. Functional consequences designate straight use experience of the product. Personal consequences ameliorate self-image of the consumer and social consequences represent the image of the consumer to others through consuming a particular product (Overby et al., 2005). Therefore, we can notice a direct connection of customer values with personal and cultural values, meaning that the purchase of a particular product has a direct influence on personality (image, social consequences) and his environment.
With many possible divisions of consequences possible, the general idea is that consumers choose actions, which lead that to the desired consequences, i.e. maximizing positive and minimizing negative consequences (Gutman, 1982). Desired end-states have
47
consequences (of different types), so the link between consequences and values is direct – values and desired end states define, which consequences are desired. Supposing that values have an importance order to consumer, then consequences leading to more important values are more important to individual.
Therefore, summing up these three elements, it means that knowing a situation or particular desired consequences it is possible to figure out which attributes are necessary to fulfill the goal of consumption and attain the desired end-state (Overby et al., 2005; Lindgreen and Wynstra, 2005).
Usually producers use this means-ends theory directly, meaning that they concentrate on attributes and then form the situations in which a consumer can use it. Later, the organizations go in search of customers or markets that might desire their offerings.
However, instead a “top-down” approach should be used in current market conditions, where the company begins with in-depth understanding of the consequences and end states that are important to the customer and then works backward to design a bundle of products and/or services which deliver those consequences. In other words, marketing research advises the switch from product-oriented marketing strategies to consumer-and market-oriented strategies as a way of gaining market share, developing strong relationship with customers based on loyalty (Kahn et al., 2016). Further, a proactive market orientation is developed, helping consumers to anticipate the development of the market and its value proposition (Flint et al., 2011, p.219).
Customer value has a strong connection to relationships and relationship value (Payne and Holt, 2000; Lindgreen and Wynstra, 2005). This value is formed in the relationship marketing and understands the value creation process as a creation of a strong relationship between the two parties of market exchange (consumer-seller, partners, seller-supplier) (Ulaga and Chacour, 2001). In this concept the value is contained not only in a product or in a customer but also in the relationship, which merges the customer and the producer or the seller. This value should not be underestimated when studying long-term relationships (Ulaga and Chacour, 2001). Some research includes this value into walk-along services of the product and, therefore, in the valuation of such services. Nevertheless, the understanding of this value is found to be important for creation of adequate marketing strategies and “it adds complexity and dynamism to value concept” (Payne and Holt, 2000, p.48).
Some literature stresses the importance of the benefits concept in the customer value definition. Eggert and Ulaga (2002) explain that customer value is based on 4 value indicators: perceived sacrifices (price, time, efforts, etc.), perceived product benefits (quality, performance, etc.), perceived personal benefits (personal satisfaction, recognition, etc.) and perceived strategic benefits (know-how spread, skills enhance, strategic position
48
and new products, etc.) (Spiteri and Dion, 2004). These sacrifices and benefits sums up in perceived total sacrifices and perceived total benefits, which together result in perceived customer/relationship value.
As a result of this relationship loyalty is defined as one of possible desired end states of customer values (for more information look Gallarza and Saura, 2006), meaning that if the customer is satisfied by the value proposition of a producer, he remains loyal to the producer and this guarantees his future purchases4 (Lindgreen and Wynstra, 2005; Parasuraman and Grewal, 2000). “Service-dominant logic would suggest that customers are more satisfied with and loyal to suppliers who are able to anticipate their desires well” (Flint et al., 2011, p.219). It is known in marketing studies that gaining a new customer is more difficult than holding current customers, however, the retained customers should also be satisfied (Lindgreen and Wynstra, 2005).
Moreover, customer value satisfaction is an important goal of the exchange relationship between the producer and his customer. It is discussed later in the chapter.
From practical point of view, the analysis of customer values is important for marketing departments: identifying the most strategically critical customer values and consequences may help the companies decide their priorities in product development and gain a competitive advantage (Lindgreen and Wynstra, 2005; Ulaga and Chacour, 2001) and greater market share (Ulaga and Chacour, 2001). This task is of a high importance and difficulty when it concerns new products or future products. A challenge for every producer is to "guess" what will be valued by consumers in 3 years, for instance. A key point for developers is to concentrate on values and consequences of future purchases and not on attributes desired by potential consumers, keeping in mind that the value for a producer differs from value to a consumer (see Lindgreen and Wynstra, 2005 for references). These ideas lead to increasing customer-centricity of companies.
In conclusion, based on the literature review we can conclude that customer value is a trade-off, reached between the seller and the customer in a particular situation, leading to some consequences. This has much of the exchange value, however supposes a strong relationship presence, which leads to benefits to both sides: monetary gains/profitability, loyalty, satisfaction, which are the concepts particularly discussed within customer value literature.
4 Spiteri and Dion (2004) note however that there are some studies, which argue that customer satisfaction is needed but not sufficient condition of customer loyalty. For this literature review see references in Spiteri and Dion (2004).
49
We consider that customer value, as consumers’ (discussed further), passes through the “prism” of personal value, reflecting individual’s preferences for particular final goals in the decision-making process.
The next section talks about consumer values, and the discussion will make the difference between customer and consumer values more evident.
Consumer value
The topic of consumer value is highly developed and discussed both in academic and entrepreneurial worlds. Some definitions, made in marketing studies like Lai’ definition (1995), designate consumer values as being of instrumental nature: “consumption values refer to subjective beliefs about desirable ways to attain personal values”.
As we have already seen in the customer value section, value definitions mention the notion of utility (Anderson et al., 1993; Zeithaml, 1988; Hausman, 2011), a tradeoff between benefits/worth/utility and price/sacrifices of a product or a service (Monroe, 1990; Gallarza and Saura, 2006), and a social experience (Lindgreen and Wynstra, 2005). However, most economists consider more dimensions of the concept, going further marketing literature definitions.
First of all, consumer studies differentiate “value” and “values”. In Holbrook’s (1999) definition the former is a preferential statement, i.e. customer value, and the latter includes the reasons why this preferential statement or judgment looks like this.
Thus, in consumer studies literature consumer values designate a set of stable world-views and motivations, which guide and explain consumers’ consumption practices and choices.
According to Sheth et al. (1991) there are five main types of values:
• Functional value is based on a range of choice attributes. A consumer values functional, physical attributes, which are salient in a product or service. This value usually represents a rational choice, taking into account attributes of a product. This definition takes its roots in Marshall (1890) and Stigler (1950) theory. Quality and price may be considered as parts of functional value (Sweeney and Soutar, 2001).
• Social value is about association or belonging to a certain group of people: demographic, socioeconomic or cultural-ethnic. For example, jewelry can
50
have a strong social value in consumer’s eyes. A concept of social image (personal value) is inside of consumer’s social value. In addition, social value can "touch" all variety of products with social features or benefits in them. Bio- and eco- products may also be considered as attributors to social value. However, this value may not be the best utility choice indicator.
• Emotional value is about individual’s feelings and emotional experiences while possessing a good. By making choices in casual life a variety of emotions arises - feelings of comfort, satisfaction, romantics or happiness, fear and disappointment. This value can be arisen unconsciously or unwillingly as an answer to an experience. Such phrases as “I would enjoy the product” or “it gives me pleasure” or “I want to use it because it makes me feel better” can be used to explain emotional value (Sweeney and Souter, 2001).
• Epistemic value is a cognitive value. It is referred as a “value aroused by curiosity excitement for innovations and novelties, and desire for knowledge” (Sheth et al., 1991, p.162). People are constantly searching for products, which can amuse, intrigue, avoid boredom in routine consumption, create new knowledge and introduce something new or innovative in their lives.
• Conditional value appears in a certain moment for a certain good. The circumstances in which the product was discovered and a person who faced a choice are in play: seasonal value, emergency situation, subtle situation conditions or an important event, for instance once in a lifetime. The examples of such situations may be Christmas, the need of medicaments, candyfloss at a fair or wedding preparation stuff consequently. Sweeney and Soutar (2001) note that any other type of value can also be called conditional in each particular choice situation.
Thus, these values present different attention points, which consumer points our when making a choice. They reflect as well different definitions of consumption (experience, play, integration and classification) discussed earlier.
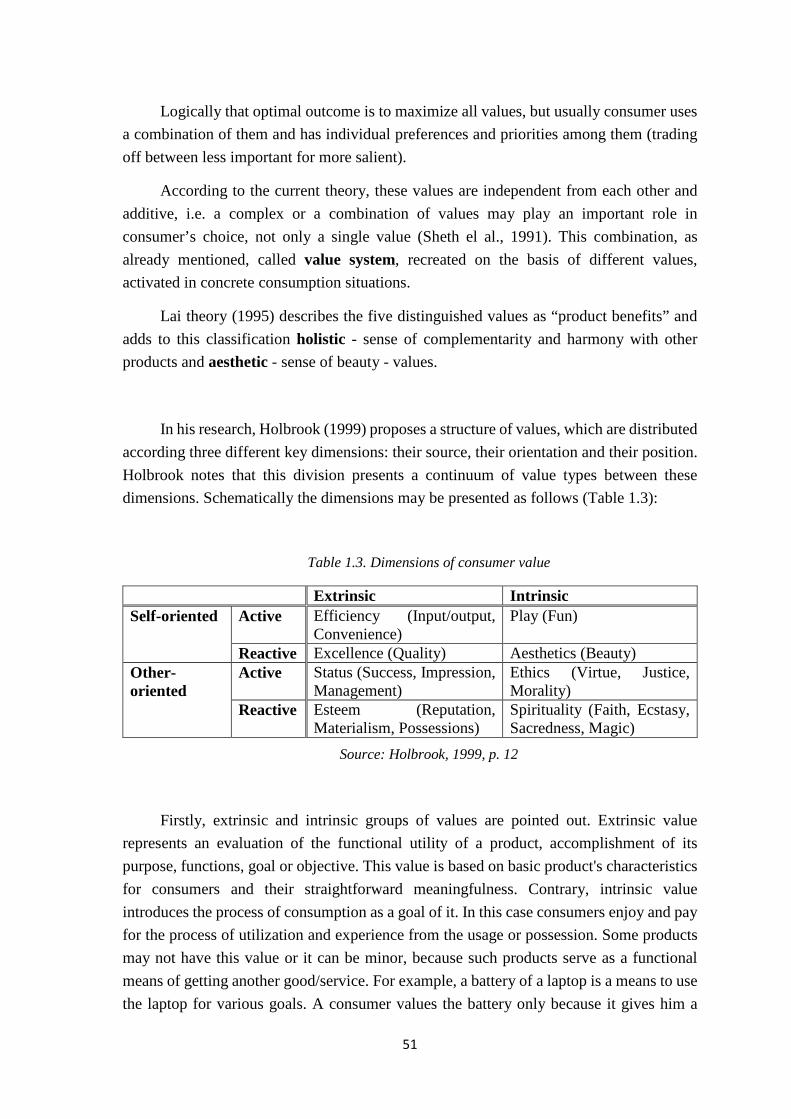
51
Logically that optimal outcome is to maximize all values, but usually consumer uses a combination of them and has individual preferences and priorities among them (trading off between less important for more salient).
According to the current theory, these values are independent from each other and additive, i.e. a complex or a combination of values may play an important role in consumer’s choice, not only a single value (Sheth el al., 1991). This combination, as already mentioned, called value system, recreated on the basis of different values, activated in concrete consumption situations.
Lai theory (1995) describes the five distinguished values as “product benefits” and adds to this classification holistic - sense of complementarity and harmony with other products and aesthetic - sense of beauty - values.
In his research, Holbrook (1999) proposes a structure of values, which are distributed according three different key dimensions: their source, their orientation and their position. Holbrook notes that this division presents a continuum of value types between these dimensions. Schematically the dimensions may be presented as follows (Table 1.3):
Table 1.3. Dimensions of consumer value
Extrinsic Intrinsic Self-oriented Active Efficiency (Input/output,
Convenience) Play (Fun)
Reactive Excellence (Quality) Aesthetics (Beauty) Other-oriented
Active Status (Success, Impression, Management)
Ethics (Virtue, Justice, Morality)
Reactive Esteem (Reputation, Materialism, Possessions)
Spirituality (Faith, Ecstasy, Sacredness, Magic)
Source: Holbrook, 1999, p. 12
Firstly, extrinsic and intrinsic groups of values are pointed out. Extrinsic value represents an evaluation of the functional utility of a product, accomplishment of its purpose, functions, goal or objective. This value is based on basic product's characteristics for consumers and their straightforward meaningfulness. Contrary, intrinsic value introduces the process of consumption as a goal of it. In this case consumers enjoy and pay for the process of utilization and experience from the usage or possession. Some products may not have this value or it can be minor, because such products serve as a functional means of getting another good/service. For example, a battery of a laptop is a means to use the laptop for various goals. A consumer values the battery only because it gives him a
52
possibility to use his laptop for some period of time and to obtain some efficient time of working or amusement.
Secondly, self-oriented and other-oriented groups of values are distinguished. This division corresponds to a result orientation of the product use. Self-oriented value presents a selfish, inner oriented aspect - a consumer and his feelings and reactions are the most important in this consumption event. Other-oriented values take into account others, their reaction and the effect the good will make for them. In this case the range of "others" may vary considerably - from other people up to the Earth and Nature.
Lastly, active versus reactive values. Active value represents an active role of a consumer in manipulating a product in order to "extract" the value from it. It means that it involves things done by a consumer to or with a product. A simple example is a car driven by a consumer. Reactive value occurs when a role of a consumer is passive - a product does something to a consumer. Therefore, the third dimension shows the difference between activity and passivity, control and dominance, etc.
According to these dimensions Holbrook (1999) distinguishes such values:
• Efficiency (Convenience, Output/Input) represents an extrinsic self-oriented value. It shows how much a product is useful and convenient for a user. Buying a yogurt, consumer counts how much has he/she has paid and how much calories and bifidobacteria he/she will get to support his daily activities, thereby counting the output-input fraction. Usually, the convenience term is connected with time when representing a main input in the output-input concern. For example, cooked plates sold in supermarkets are, without any doubts, worth than home, fresh-cooked food, but they have a relative advantage - cooking time. This can also be the case for renting a car for a weekend, where you don't need to get it to the same agency after using, but just make a call and tell where you’ve left it.
• Excellence (Quality) is a value for those who are expecting their purchase to be an instrument in reaching a goal or performing some function. After reaching the consumption goal, one is either satisfied or not. This value is closely connected with the satisfaction concept: the performance of the product or the results of the consumption practice outperform consumer’s expectations.
53
• Status (Success, Impression, Management) implies correcting personal consumption to be respected/valued/impressed by others. By consuming certain products a person is aims the success in society.
• Esteem (Reputation, Materialism, Possessions) is someway different value of status value. It represents an appreciation from consuming or possessing goods by oneself in a somewhat passive way and, at the same time, improving the image among others. Materialism is presented as a way of prestige gain by collecting and possessing valuable material things. The esteem value is more oriented towards self than the status value.
Then, switching from extrinsic types of values to intrinsic Holbrook points out the following values:
• Play (Fun) value shows how products can be valued during a consumer's leisure time by just having fun while using them.
• Aesthetics (Beauty) is a value, which exists when a person likes a product personally, for its aesthetic qualities, not for any extrinsic purpose. A masterpiece is valued because it is a beautiful piece of art, not because it covers a hole in the wall.
• Ethics (Virtue, Justice, Morality) value involves such terms as personal character, restrictions, habits, social norms, ideas about what is right, good, moral and socially acceptable.
• Spirituality (Faith, Ecstasy, Sacredness, Magic) is an intrinsic desire of a consumer to have an access or to adopt something “other”, meaning different things as Divine Power, Cosmic Energy, etc. It includes faith in (dis)connection of self and other-self or other spiritual events valued for their happenings.
Further, Holbrook (1999) describes that value is (1) comparative; (2) personal and (3) situational. By this, the author means that any person may compare values he has
54
for different products, as well as he may compare his values to values of other people. At the same time, changing the set of objects or people comparing in different situations changes the opinions about the value. Value is personal, because it is relative to each individual, therefore, it is different for everybody. Value is situational, because, as already explained earlier, it depends on the situation in which, consumer makes a decision.
We claim that values do not change in each situation but, however, an appropriate value is activated in each situation.
All these dimensions of values has been developed as separate concepts, however, they are interrelated and interdependent, because of complexity of human nature and consumption activities.
This complexity is better reflected in multidimensional concepts of consumer value, which are also referring to personal values and economic preferences during a consumption decision-making process. To support the importance of multidimensionality of value Sweeney and Soutar (2001) conducted a number of factor analysis on four dimensions of values (quality, price, emotional and social values) and found that these four dimensions are statistically significant and, hence, one-dimensional early theories of value are no more credible. The product represents a combination of rational and emotional estimations, so marketers should pay attention to this when developing marketing strategies for durable goods.
2.3. Product value
Another type of value largely discussed in literature is product value. The idea has already been evoked in the literature on consumer research and consists of thinking that the product itself has a value (Sweeney and Soutar, 2001, Tzokas ans Saren, 1999).
Choosing between several alternatives, a consumer performs a value judgement, i.e. an evaluation of the value in this particular trade-off situation (Ulaga and Chacour, 2001).
People may use the same products for different reasons and different products may be used for the same reasons as well. Because of the high number of products proposed on the market, the product itself should have a competitive advantage, i.e. an added value, which is perceived by a consumer while making the choice (Lindgreen and Wystra, 2005).
Therefore, even if this concept is rather indistinct, we support the idea that product value is a separate issue taken into account by the consumer and by the individual.
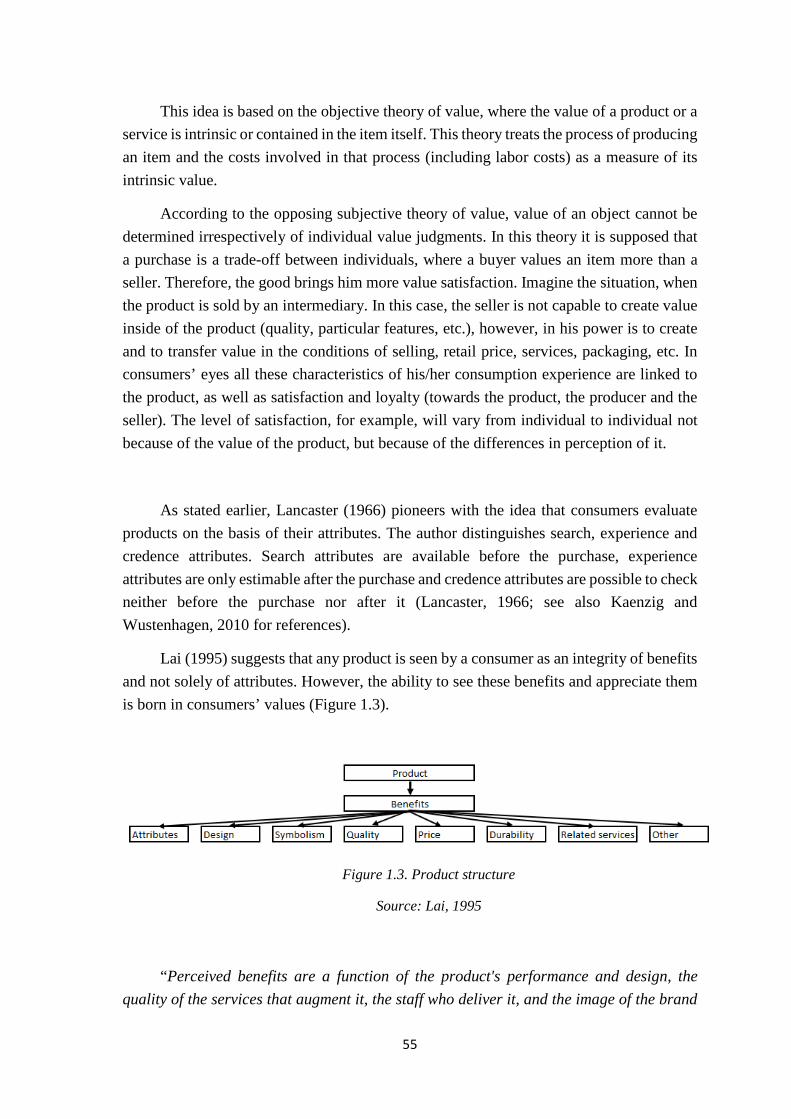
55
This idea is based on the objective theory of value, where the value of a product or a service is intrinsic or contained in the item itself. This theory treats the process of producing an item and the costs involved in that process (including labor costs) as a measure of its intrinsic value.
According to the opposing subjective theory of value, value of an object cannot be determined irrespectively of individual value judgments. In this theory it is supposed that a purchase is a trade-off between individuals, where a buyer values an item more than a seller. Therefore, the good brings him more value satisfaction. Imagine the situation, when the product is sold by an intermediary. In this case, the seller is not capable to create value inside of the product (quality, particular features, etc.), however, in his power is to create and to transfer value in the conditions of selling, retail price, services, packaging, etc. In consumers’ eyes all these characteristics of his/her consumption experience are linked to the product, as well as satisfaction and loyalty (towards the product, the producer and the seller). The level of satisfaction, for example, will vary from individual to individual not because of the value of the product, but because of the differences in perception of it.
As stated earlier, Lancaster (1966) pioneers with the idea that consumers evaluate products on the basis of their attributes. The author distinguishes search, experience and credence attributes. Search attributes are available before the purchase, experience attributes are only estimable after the purchase and credence attributes are possible to check neither before the purchase nor after it (Lancaster, 1966; see also Kaenzig and Wustenhagen, 2010 for references).
Lai (1995) suggests that any product is seen by a consumer as an integrity of benefits and not solely of attributes. However, the ability to see these benefits and appreciate them is born in consumers’ values (Figure 1.3).
Figure 1.3. Product structure
Source: Lai, 1995
“Perceived benefits are a function of the product's performance and design, the quality of the services that augment it, the staff who deliver it, and the image of the brand
56
that the company succeeds in communicating.” say Lindgreen and Wystra (2005, pp. 745). So, these are all perceived physical and service attributes, which are “embraced” in the offering in a particular use situation (Ulaga and Chacour, 2001).
Therefore, what Lai calls “benefits” is the collection of product’s attributes and related external features, which returns to the idea that the value of the product is based on its attributes.
Each product should be “decomposed” on attributes to clearly find its values. There exists several facets, from which a product can be analysed: product related components, service related components and promotion related components (i.e. corporate identity, reliability of supplier, etc.) (Ulaga and Chacour, 2001). In other words, product attributes account concrete attributes (color, form, size, etc.) and abstracts attributes (quality, fit, etc.) (Overby et al., 2005).
Lutz (1986) distinguishes two types of product attributes, according to their perceptibility it time:
- a proportion of quality can be assessed before purchase - search attributes,
- other part of quality perceived only after purchase, while using - experience attributes.
The proportion of these attributes varies greatly according to a type of a product.
We can also say that as consumption is a complex system of experiences, as stated earlier in the chapter, it includes the purchase itself (which may be done online or offline in the store), usage of the product (physical use or virtual use), availability, risk and time variables, warranty and after-sales services. All these characteristics of the offering, together with price and quality, are taken into account, while making choices.
As already mentioned earlier, Zeithaml (1988) looks at value concept from single-dimensional point of view. Quality is meant as an excellence or superiority, and not value. By quality a consumer may mean a group of "qualities" of a product more abstractly. Different researchers distinguish between objective and perceived quality (Dodds and Monroe, 1985), others for mechanistic and humanistic quality (Holbrook and Corfman, 1985), where the first is a feature of an object and the second one involves a person's response to objects.
In any case, quality is based on a bunch of attributes, which signal a consumer and reduce the perceived risks associated with the product. These attributes, forming a general opinion about the product, are divided for intrinsic and extrinsic cues (Zeithaml, 1988). Intrinsic cues are those, which represent basic attributes, non-separable from a product, and
57
the extrinsic ones are usually product related but not "inside" of it (brand, price etc.). These attributes work differently for different products and with various amount of information available, at each moment of time.
Quality has several types: Lutz (1986) divides it into two groups: affective quality and cognitive quality. Affective quality is a perceived one as an overall evaluation. Cognitive quality occurs after a thorough examination of major and minor features of a product after buying and experiencing it.
At the same time, one should note that, as stated in Solomon et al. (2005, p. 324), consumers search for “quality and values”, every time when they buy a product. Additionally, consumer derives value from quality, which enhances their consumption experience and satisfaction.
Time variable, as a product’s attribute (or an associated service or sacrifice), becomes really important nowadays and concerns the delays between the purchase and actual reception of the product (for online purchases, for example), the period of time between the purchase and acquisition of all functions of the product and a simple duration of the product use.
Price is in the list on the least important attributes that consumers associate with quality. In addition, value of the product is usually larger than the price and this difference represents consumer’s incentive to purchase (Lindgreen and Wystra, 2005), reflected in his willingness-to-pay (WTP).
Another separate theory, developed by Richins (1994) should be, on my point of view, be placed in product value chapter. Richins (1994) discusses the influence of products’ meanings on consumption choices, through personal values.
In this theory products have two meanings: public and private. Public meanings are those meanings of the products, which are shared by society at large and are formed during social and cultural experiences of consumers, including media exposure. These public meanings should be in accordance with personal values: “people are likely to care mostdeeply about those possessions whose public meanings are congruent with the self” (Richins, 1994, p.523). In contrast, private meanings are those meanings, which are constructed while using the product, i.e. personal experience. In this theory, a product, having a meaning, reflects personality and personal value of its consumer.
However, we should mention again that in product evaluation personal and consumer values have a huge influence on how a consumer see and perceive the product (Allen and Ng, 1999). Analysis of product’s values enables therefore to track the whole value line: from product value through consumer value to personal value.
58
2.4. Satisfaction as a response on value
Consumer and customer satisfaction is a reaction to value received in possession and/or usage. This is a bond between consumer/customer value requirements and organization's value creation efforts. Therefore, satisfaction and value are not synonyms. First, value tells what is needed, and then, satisfaction indicates what has actually been obtained (Gallarza and Saura, 2006; Hausman, 2011). As shown above, values may exist independently from a particular product or service or be common for several products at the same time. Caelen (2013) defines value equation as a satisfaction of needs divided by costs. Therefore, total satisfaction means a satisfaction of different values, included in individual’s value systems.
Another difference, which helps to define satisfaction in its connection to value is explained as follows: value is a cognitive comparison process taking place before, during and after the purchase/consumption, whereas satisfaction is an affective construct, which occurs only after the purchase towards a concrete product/producer only for the current consumer/customer. For example, a consumer values security a lot (personal value), he values it both when buying a car and a toy for a child (consumer values). Meanwhile, consumer/customer satisfaction is a reaction or a feeling that occurs afterwards for a particular product of use. “When value is viewed as a desirable end-state of consumption, satisfying consumption events are of value to consumers” (Holbrook, 1999, p.58). Therefore, we can say that value and satisfaction have a circular relationship and mutually influence each other.
The level of satisfaction is usually explained by disconfirmation paradigm (Eggert and Ulaga, 2002). It means that customers feel satisfied when the value delivered is equal to the one he has expected. In case of satisfaction after the purchase of consumption, consumer feels satisfied, and feels that it is ordinary, because it is what he/she has expected to satisfy his needs, desire and so on.
If the delivered value is larger than the expected customer value than he/she is very satisfied – positively disconfirming. If the delivered value is lower than the expected one than he/she is dissatisfied – negatively disconfirming. On the other hand, dissatisfaction is usually more accentuated by a consumer, being an aggressive feeling, which leaves more negative traces (Solomon et al., 2005). Therefore, satisfaction may be defined as “the summary psychological state” of positive disconfirmation (Deng et al., 2010).
Transaction-related satisfaction of values in case if they are repeated create overall durable customer satisfaction, which creates strong relationships between a seller and a buyer, these relationships may be extended if a consumer/customer becomes loyal. As a result, this relationship becomes profitable for both exchange participants (Lindgreen and Wystra, 2005; Solomon et al., 2005).
59
3. Environmental values, as a part of individual’s value system
Environmental situation has an impact of humans’ wellbeing as well as economic and social environment. However, environmental concern has mistakenly less importance and urgency in the individual’s life. Basic needs and desires, difficulties and casual dramatic situations are perceived to be more urgent to hold with than ecological and biodiversity problems. Personal well-being (comfort, enjoyment, power, pleasure, etc.) have been for a long time of the first importance for people. However, lately environmental protection has taken place among these first-order values of humanity, presenting a new motive for reflection.
Previous experience and scientific research state the presence of environmental values among and as a part of other individual’s values, playing an important role in decision-making. Particularly, it is worth to note that environmental values are usually discussed in individual perspective, or as a citizen (influence of policies, actions, products on society; voting choices, provision of public goods) but it is important to consider environmental values applied to consumption practices (Turner, 1999; Brosch and Sander, 2015).
Environmentally significant behavior can be defined as a behavior, which is undertaken to make positive changes to the environment (Stern, 2000, Clark et al., 2003). Already mentioned that values create a guidance for individual behavior and value orientations may explain positive and negative attitudes. Altruistic and self-transcendence personal values have positive relationships with pro-environmental values, whereas self-enhancement, security, self-discipline personal values may contradict them.
By environmental values we mean here positive stable positions towards environmental protection (environmental concern) and sustainability. What one understands as environmental positive attitudes depends on his worlds-views (Turner, 1999). Environmental concern is a concern about consequences of environmental problems and consequences of one’s actions for environment (Hansla et al. 2008). They may be subdivided into personal-, social- and biosphere-related concerns.
Environmental values may take part in different life and consumption situations. However, even having positive environmental attitudes, values and concern, consumers sometimes does not transform them into pro-environmental behavior (Nordlund and Garvill, 2002; Clark et al., 2003).
Also consider that personal values may sometimes be in conflict with environmental values. It can be explained by numerous factors, for example, environmental values are
60
usually concerned about future, whereas personal and consumption values may be immediate in time. Environmental values may seem to give less “harm” immediately, privileging personal well-being. In addition, personal values or consumption values called by needs and desires of an individual may be more stable and strong than environmental values.
Empirically, it is found that individuals who do not accept to recycle state that personal and household inconveniences of recycling are more important for them than collective and environmental benefits (see Nordlund and Garvill, 2002 for references).
Environmental values can be divided into several dimensions, following different authors (Nordlund and Garvill, 2002, 2003; Turner, 1999):
- shallow and deep ecology;
- homocentric, ecocentric and egocentric values;
- social-altruistic, biospheric and egoistic values;
- anthropocentric and ecocentric values.
These dimensions represent progressive environmental concern. The progression starts with egocentric (or homocentic or anthropocentic) category, where individuals think that one should protect environment because it contributes to humans’ lives. Meanwhile in ecocentric (or social-altruistic) group individuals believe that one should protect environment, because it has an intrinsic value and this alone is already a reason to protect it. Nordlund and Garvill (2002) also state that individuals with ecocentric environmental values may accept more easily the trade-offs between personal/consumers and environmental values (in environmental values’ favor).
Having strong personal values for altruism and well-being of others amplifies awareness of societal and environmental problems, hence, encourages the formation of ecocentric environmental values. At the same time, higher concentration of “self” and priority for individual consequences may provoke the development of egocentric environmental values. For example, the awareness of negative environmental consequences of the high level of car traffic, which leads to high levels of air pollution; and the degree of seriousness of this situation, are found to have a positive effect on the readiness to reduce personal car use, therefore, have also an influence on consumption values (see Nordlund and Garvill, 2003 for references).
These explanations stress that positive environmental values may, however, be provoked by different sorts of motives and be elaborated from different reasoning process, which in turn evokes different behavior (discussed in the next section).
61
Turner (1999) distinguishes 4 dimensions of value: anthropocentric instrumental, anthropocentric intrinsic, non-anthropocentric instrumental and non-anthropocentric intrinsic values. This classification divides values according to their attachment to individual and his needs and desires (anthropocentric or non-anthropocentric), and their nature (intrinsic or instrumental).
Anthropocentric instrumental value corresponds to total economic value (TEV, which equals use + non-use values), where the part of non-use value is represented by altruism motivations and is also called existence value. Existence value is described as a value, which individuals have when they feel better when knowing that rare animal or plant species are protected and preserved somewhere on the planet.
Anthropocentric intrinsic values are culturally dependent and attribute value to entities, which have intrinsic value or, as said by Turner (1999, p.21), “good of their own” or “inherent worth”, which is then used by individuals for their own goals.
Non-anthropocentric instrumental values suppose that entities have their value, but they are not connected to human interests.
Finally, last value dimension is non-anthropocentric intrinsic value, which is « the value that the object possesses independently of the valuation of valuers » (Turner, 1999, p.21) or an “inherent worth” of the product.
Being a classification apart, environmental values have nevertheless numerous bonds with previously discussed personal, consumer and product values. Measuring environmental values has as well numerous interceptions with consumer and personal value theories: for example, through measuring universalism and benevolence values one may perceive individual’s altruism values (Brosch and Sander, 2015). Here, it is supposed that environmental values may be “born” inside each (personal, consumer, product) other value. Looking on the schema of values (see Figure 1.1) we can place it inside each circle separately or intersect with several of them.
3.1. Personal and consumption values and their transformation into pro-environmental behavior
Personal values and value orientations are found to have influence on environmental values and environmental decision-making through the awareness prism and individual’s world view.
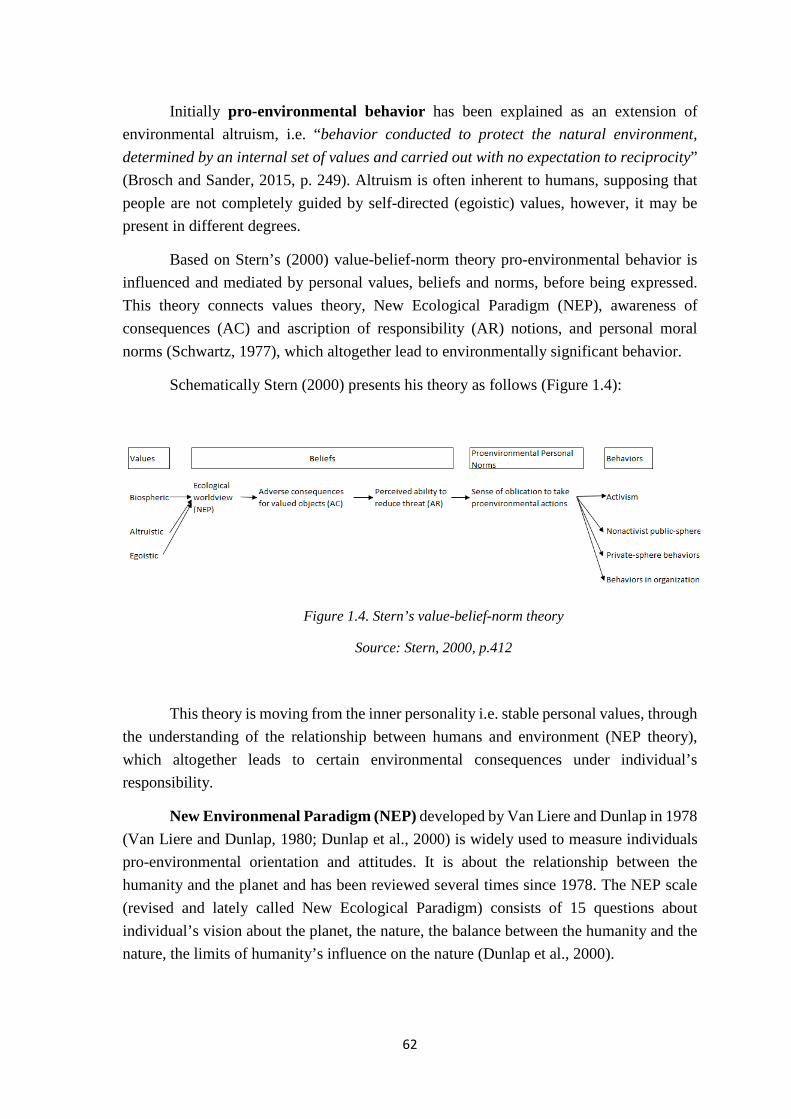
62
Initially pro-environmental behavior has been explained as an extension of environmental altruism, i.e. “behavior conducted to protect the natural environment, determined by an internal set of values and carried out with no expectation to reciprocity” (Brosch and Sander, 2015, p. 249). Altruism is often inherent to humans, supposing that people are not completely guided by self-directed (egoistic) values, however, it may be present in different degrees.
Based on Stern’s (2000) value-belief-norm theory pro-environmental behavior is influenced and mediated by personal values, beliefs and norms, before being expressed. This theory connects values theory, New Ecological Paradigm (NEP), awareness of consequences (AC) and ascription of responsibility (AR) notions, and personal moral norms (Schwartz, 1977), which altogether lead to environmentally significant behavior.
Schematically Stern (2000) presents his theory as follows (Figure 1.4):
Figure 1.4. Stern’s value-belief-norm theory
Source: Stern, 2000, p.412
This theory is moving from the inner personality i.e. stable personal values, through the understanding of the relationship between humans and environment (NEP theory), which altogether leads to certain environmental consequences under individual’s responsibility.
New Environmenal Paradigm (NEP) developed by Van Liere and Dunlap in 1978 (Van Liere and Dunlap, 1980; Dunlap et al., 2000) is widely used to measure individuals pro-environmental orientation and attitudes. It is about the relationship between the humanity and the planet and has been reviewed several times since 1978. The NEP scale (revised and lately called New Ecological Paradigm) consists of 15 questions about individual’s vision about the planet, the nature, the balance between the humanity and the nature, the limits of humanity’s influence on the nature (Dunlap et al., 2000).
63
The awareness of existing environmental problems and risks (AR), and the knowledge that the individual may do something to avoid/ameliorate this negative/positive consequences (AR) are influenced and exacerbated by personal values.
Consequently, the comprehension that the environmental threat (consequences) (AC) may “hurt” personal values and it is in individual’s responsibility to avoid these negative consequences through his/her pro-environmental actions (Stern, 2000; Nordlund and Garvill, 2003; Slimak and Dietz, 2006). The origins of this structure are formulated in Schwartz’s (1977) norm-activation theory.
In other words, individual’s pro-environmental actions are activated, when the individual believes that environmental conditions may have negative consequences for the things they have positive values for (Brosch and Sander, 2015).
All these values pass then through the norms prism (Schwartz, 1977; Stern et al., 2000). Personal norms consist of self-expectations, whereas social norms of expectations, obligations and sanctions (Schwartz, 1977). Norms create the last connection between values and pro-environmental behavior, and are usually conceptualized as “a personal norm that one should take action as a consumer, as a citizen, and/or as an activist” (Brosch and Sander, 2015, p. 338).
Stern’s value-belief-norm theory resumes fractionally Schwartz norm-activation theory, which is based on the notion that individual’s behavior is a function of beliefs about actions’ consequences and understanding of responsibilities of personal actions. This theory gives the beginning to altruism scale. Altruism scale consists of 9 questions, which measure personal norms, awareness of risks and consequences (Clark et al., 2003).
At the same time Stern (2000) indicates that pro-environmental behavior may also be motivated by products’ characteristics, which are only indirectly correlated with environmental impact (power, performance of the car) or such factors like luxury, waste, the importance of time spent with family, personal capabilities and contextual forces.
These ideas support our hypothesis of multi-faceted connection of values and their systematic influence on human behavior, reflected by their superposition on Figure 1.1.
Therefore, the system of values, AC and AR, through norms and ecological world
view initiate environmentally significant behavior (Stern, 2000), which can be divided into following classes:
- Environnemental activism, i.e. active participation in environnemental protection, organisations, etc.;
64
- Non-activist behavior in public sphere, i.e. non-active support of environmental protection, actions, policies, etc.;
- Environmentalism in private sphere, i.e. participation in environmental
protection in private behaviors (consumption, private waste management, travelling, recycling, etc.);
- Other behaviors in organizations, i.e. influencing others’ behavior.
Personal values and pro-environmental behavior may “work” together and overlap each other, but they may be, however, in conflict and, as said before, personal values may “slow down” the manifestation of environmental values and prevent pro-social behavior.
Egoistic values correlate positively with awareness of both immediate and future consequences, whereas, in contrast, altruistic and biospheric values have a positive correlation with only future consequences. Self-enhancement personal values have negative correlation with pro-environmental behavior. Repeated character of environmental behavior (for example recycling or car-sharing) may create obstacles with time and evoke egocentric or pro-self values, leading to the weakening of the environmental values.
Simultaneously, environmental values have a positive correlation with consumer behavior. Choosing paper bags instead of plastic ones or fuel-efficient/electric cars, which reduce energy consumption, represent the presence of pro-environmental values, translated in consumption behavior.
“One important obstacle to consistency between pro-environmental values and behavior might be people’s tendency to exaggerate the pleasure of indulging in a consumer life-style and the negatively of giving that up” (Brosch and Sander, 2015, p. 251). Consumers have high valuations of pleasure and happiness (hedonic value) from possessing a particular product or service. It is also possible that the desire and еру anticipation of the product may be also valuable for a consumer. In both cases, it mitigates connected environmental values and pro-environmental consequences in favor of immediate personal consequences.
To conclude, we can see that environmental value may be embraced in a
multidimensional value concept, which cannot be structured without any correlations in definitions. In addition, with time, society, technology and media development (etc.) the concept of value has also become very dynamic.
65
Particular case of value formation is innovation processes and products. The difficulty with innovative products is that consumers are not well equipped to project, create, and imagine offerings that they have not experienced.
4. Innovation and innovation values in the consumption decision-making
The characteristics of 5th Kondratieff wave imply that from 1990 our economy is engaged into the period of high technological development, based on networking and communication, i.e. information age. So, the process of research and development (R&D) is now deeply integrated in core activities of companies, with constantly growing budgets for it.
Hence, modern economy, marked by the rapid development of new technologies, has an innovation as a key factor of the economic success of companies. It is necessary for companies to be able not only to maintain a leading position on existing markets, but also - and perhaps more - to develop new markets on the basis of scientific and technological discoveries of recent years (DGCIS, 2011, Khazanchi et al., 2007). “…companies with investment patterns that don’t satisfy their customers and investors don’t survive.” (Christensen, 2011, p.23).
To start with, there exists numerous definitions of word “innovation” and following concepts. Innovation, being closely connected to “new”, should be, however, distinguished from invention (OECD, 2007). Discovery is necessary for invention, when it is not always needed for innovation. The idea that innovation is a practical application of inventions and knowledge is taken for reference (Trott, 2012).
Innovation can be an idea, a product or a service, which is perceived as new and improved by a consumer or any other relevant unit of adoption (Rogers, 1995; OECD, 2007; Dewar and Dutton, 1986). Innovation, of any sort, should first by detected (as advantageous for a company or an individual), adopted, effectively implemented and used in order to obtain the expected benefits of the innovation (Klein and Sorra, 1996).
In European Commission MEI project report (2007, p.4) is stated that “Innovation occurs within a wider context that shapes innovation processes, innovation output and economic and environmental outcomes. This wider context encompasses the values, beliefs, knowledge and networks of actors, the technologies in place, economic growth, the product
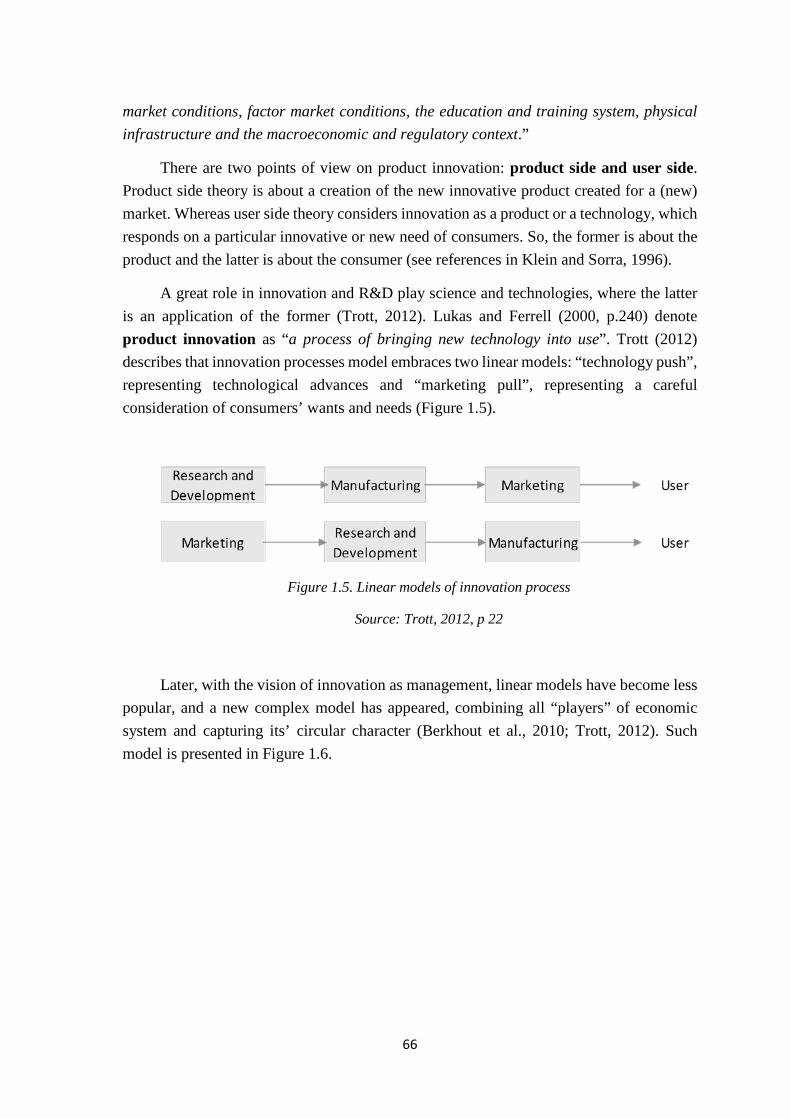
66
market conditions, factor market conditions, the education and training system, physical infrastructure and the macroeconomic and regulatory context.”
There are two points of view on product innovation: product side and user side. Product side theory is about a creation of the new innovative product created for a (new) market. Whereas user side theory considers innovation as a product or a technology, which responds on a particular innovative or new need of consumers. So, the former is about the product and the latter is about the consumer (see references in Klein and Sorra, 1996).
A great role in innovation and R&D play science and technologies, where the latter is an application of the former (Trott, 2012). Lukas and Ferrell (2000, p.240) denote product innovation as “a process of bringing new technology into use”. Trott (2012) describes that innovation processes model embraces two linear models: “technology push”, representing technological advances and “marketing pull”, representing a careful consideration of consumers’ wants and needs (Figure 1.5).
Figure 1.5. Linear models of innovation process
Source: Trott, 2012, p 22
Later, with the vision of innovation as management, linear models have become less popular, and a new complex model has appeared, combining all “players” of economic system and capturing its’ circular character (Berkhout et al., 2010; Trott, 2012). Such model is presented in Figure 1.6.
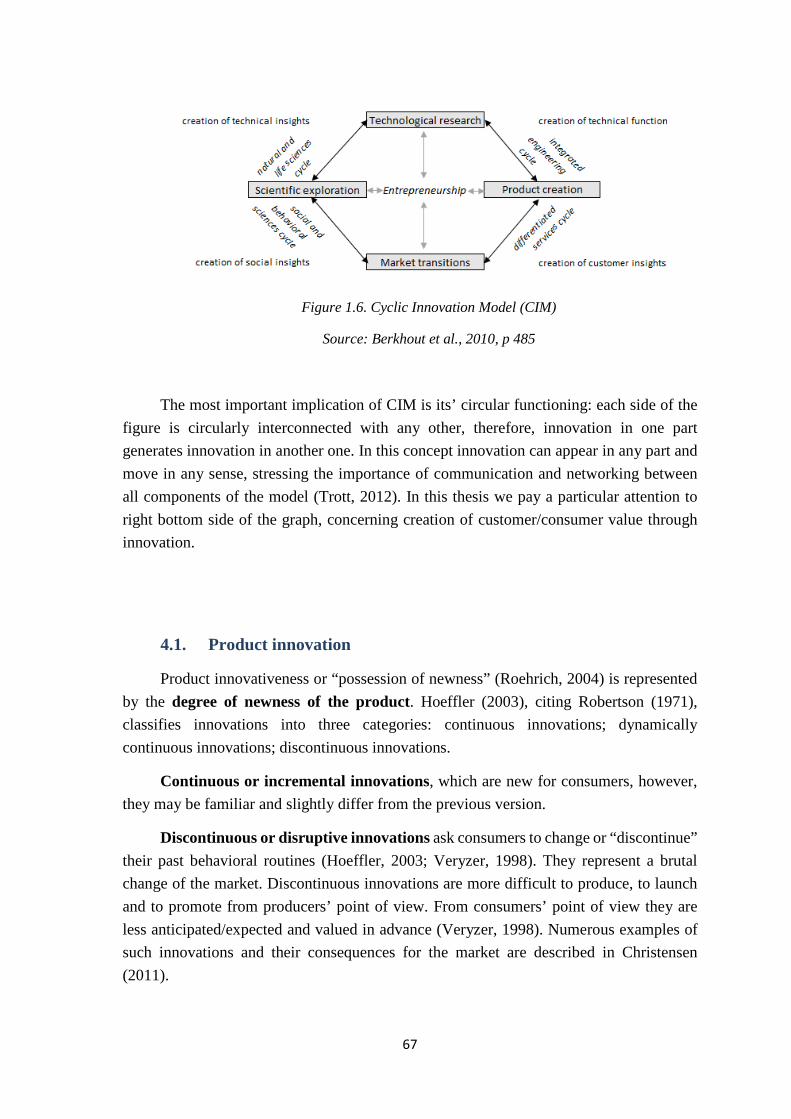
67
Figure 1.6. Cyclic Innovation Model (CIM)
Source: Berkhout et al., 2010, p 485
The most important implication of CIM is its’ circular functioning: each side of the figure is circularly interconnected with any other, therefore, innovation in one part generates innovation in another one. In this concept innovation can appear in any part and move in any sense, stressing the importance of communication and networking between all components of the model (Trott, 2012). In this thesis we pay a particular attention to right bottom side of the graph, concerning creation of customer/consumer value through innovation.
4.1. Product innovation
Product innovativeness or “possession of newness” (Roehrich, 2004) is represented by the degree of newness of the product. Hoeffler (2003), citing Robertson (1971), classifies innovations into three categories: continuous innovations; dynamically continuous innovations; discontinuous innovations.
Continuous or incremental innovations, which are new for consumers, however, they may be familiar and slightly differ from the previous version.
Discontinuous or disruptive innovations ask consumers to change or “discontinue” their past behavioral routines (Hoeffler, 2003; Veryzer, 1998). They represent a brutal change of the market. Discontinuous innovations are more difficult to produce, to launch and to promote from producers’ point of view. From consumers’ point of view they are less anticipated/expected and valued in advance (Veryzer, 1998). Numerous examples of such innovations and their consequences for the market are described in Christensen (2011).
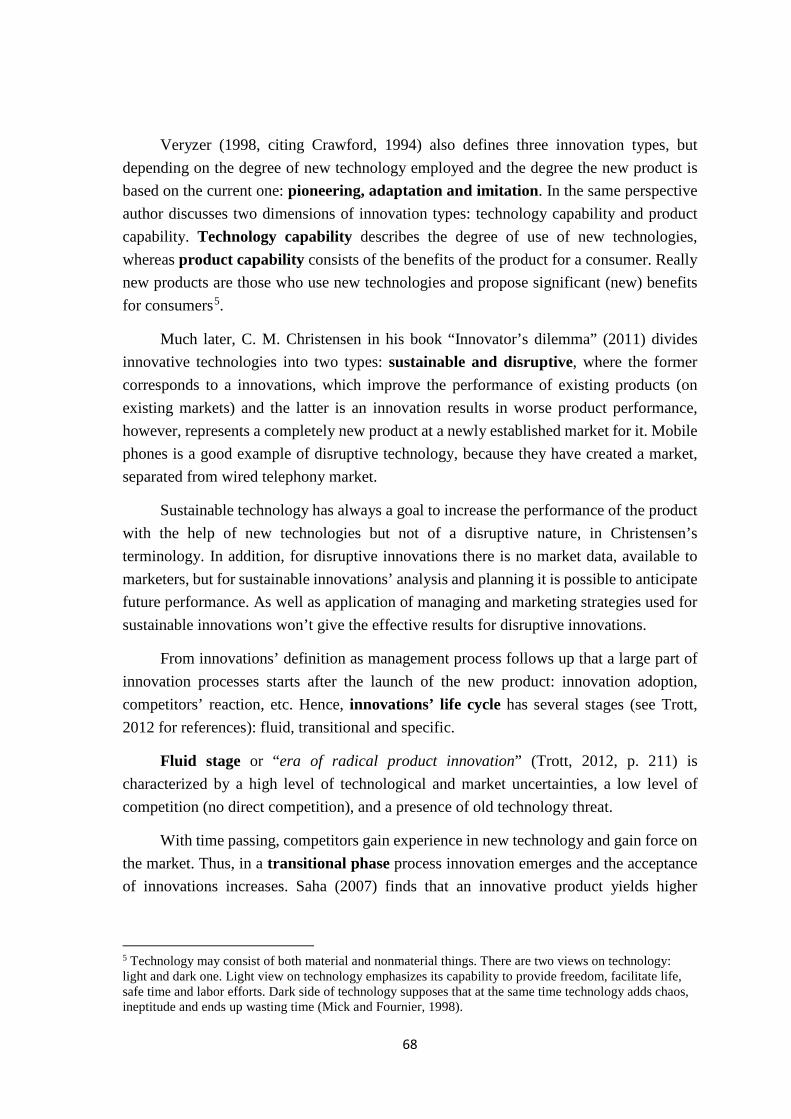
68
Veryzer (1998, citing Crawford, 1994) also defines three innovation types, but depending on the degree of new technology employed and the degree the new product is based on the current one: pioneering, adaptation and imitation. In the same perspective author discusses two dimensions of innovation types: technology capability and product capability. Technology capability describes the degree of use of new technologies, whereas product capability consists of the benefits of the product for a consumer. Really new products are those who use new technologies and propose significant (new) benefits for consumers5.
Much later, C. M. Christensen in his book “Innovator’s dilemma” (2011) divides innovative technologies into two types: sustainable and disruptive, where the former corresponds to a innovations, which improve the performance of existing products (on existing markets) and the latter is an innovation results in worse product performance, however, represents a completely new product at a newly established market for it. Mobile phones is a good example of disruptive technology, because they have created a market, separated from wired telephony market.
Sustainable technology has always a goal to increase the performance of the product with the help of new technologies but not of a disruptive nature, in Christensen’s terminology. In addition, for disruptive innovations there is no market data, available to marketers, but for sustainable innovations’ analysis and planning it is possible to anticipate future performance. As well as application of managing and marketing strategies used for sustainable innovations won’t give the effective results for disruptive innovations.
From innovations’ definition as management process follows up that a large part of innovation processes starts after the launch of the new product: innovation adoption, competitors’ reaction, etc. Hence, innovations’ life cycle has several stages (see Trott, 2012 for references): fluid, transitional and specific.
Fluid stage or “era of radical product innovation” (Trott, 2012, p. 211) is characterized by a high level of technological and market uncertainties, a low level of competition (no direct competition), and a presence of old technology threat.
With time passing, competitors gain experience in new technology and gain force on the market. Thus, in a transitional phase process innovation emerges and the acceptance of innovations increases. Saha (2007) finds that an innovative product yields higher
5 Technology may consist of both material and nonmaterial things. There are two views on technology: light and dark one. Light view on technology emphasizes its capability to provide freedom, facilitate life, safe time and labor efforts. Dark side of technology supposes that at the same time technology adds chaos, ineptitude and ends up wasting time (Mick and Fournier, 1998).
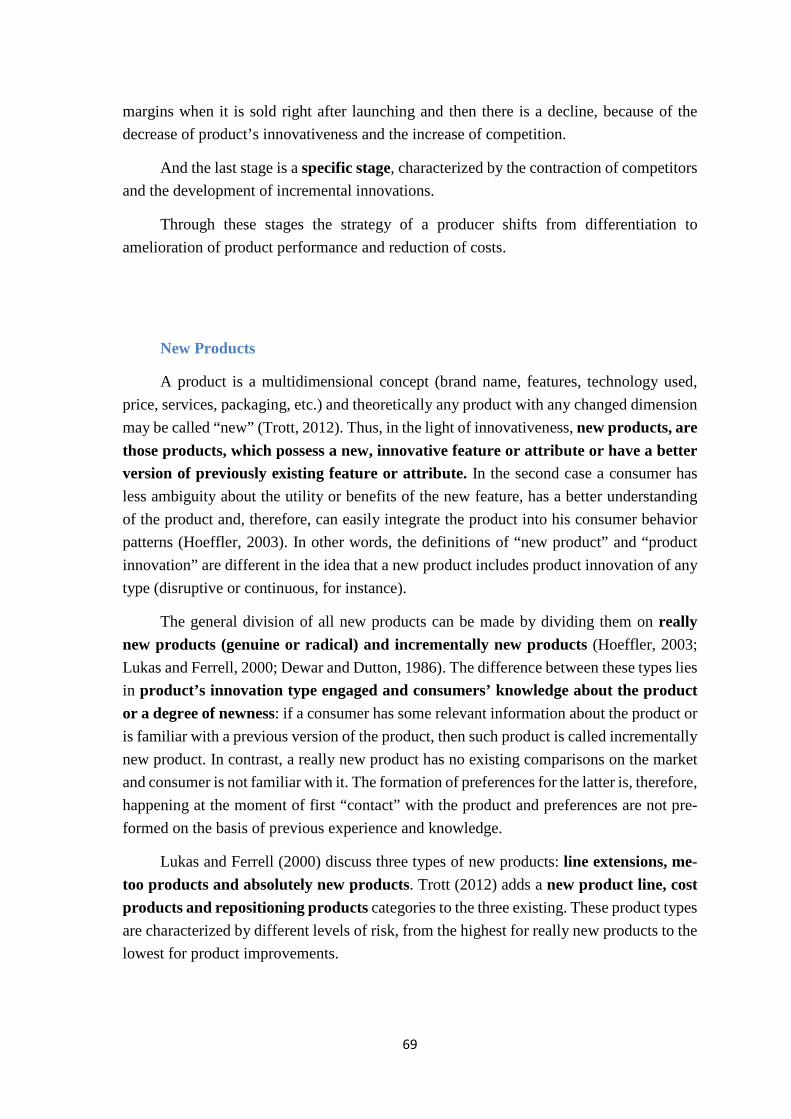
69
margins when it is sold right after launching and then there is a decline, because of the decrease of product’s innovativeness and the increase of competition.
And the last stage is a specific stage, characterized by the contraction of competitors and the development of incremental innovations.
Through these stages the strategy of a producer shifts from differentiation to amelioration of product performance and reduction of costs.
New Products
A product is a multidimensional concept (brand name, features, technology used, price, services, packaging, etc.) and theoretically any product with any changed dimension may be called “new” (Trott, 2012). Thus, in the light of innovativeness, new products, are those products, which possess a new, innovative feature or attribute or have a better version of previously existing feature or attribute. In the second case a consumer has less ambiguity about the utility or benefits of the new feature, has a better understanding of the product and, therefore, can easily integrate the product into his consumer behavior patterns (Hoeffler, 2003). In other words, the definitions of “new product” and “product innovation” are different in the idea that a new product includes product innovation of any type (disruptive or continuous, for instance).
The general division of all new products can be made by dividing them on really new products (genuine or radical) and incrementally new products (Hoeffler, 2003; Lukas and Ferrell, 2000; Dewar and Dutton, 1986). The difference between these types lies in product’s innovation type engaged and consumers’ knowledge about the product or a degree of newness: if a consumer has some relevant information about the product or is familiar with a previous version of the product, then such product is called incrementally new product. In contrast, a really new product has no existing comparisons on the market and consumer is not familiar with it. The formation of preferences for the latter is, therefore, happening at the moment of first “contact” with the product and preferences are not pre-formed on the basis of previous experience and knowledge.
Lukas and Ferrell (2000) discuss three types of new products: line extensions, me-too products and absolutely new products. Trott (2012) adds a new product line, cost products and repositioning products categories to the three existing. These product types are characterized by different levels of risk, from the highest for really new products to the lowest for product improvements.
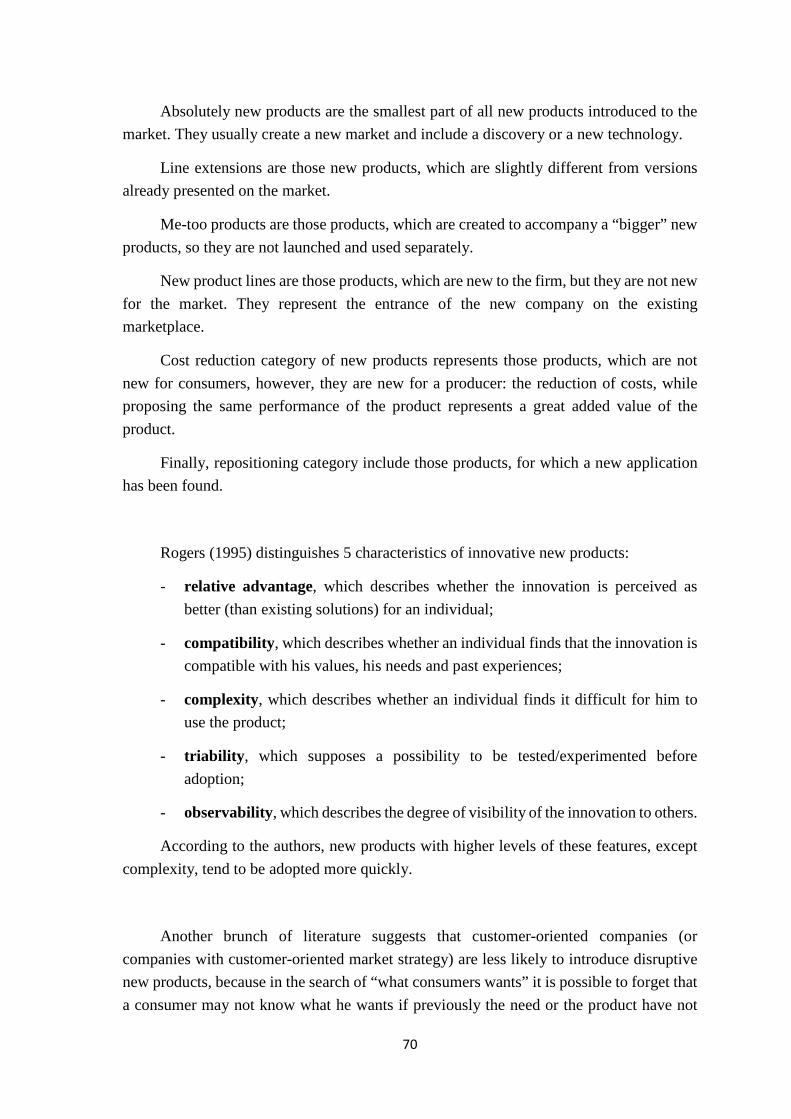
70
Absolutely new products are the smallest part of all new products introduced to the market. They usually create a new market and include a discovery or a new technology.
Line extensions are those new products, which are slightly different from versions already presented on the market.
Me-too products are those products, which are created to accompany a “bigger” new products, so they are not launched and used separately.
New product lines are those products, which are new to the firm, but they are not new for the market. They represent the entrance of the new company on the existing marketplace.
Cost reduction category of new products represents those products, which are not new for consumers, however, they are new for a producer: the reduction of costs, while proposing the same performance of the product represents a great added value of the product.
Finally, repositioning category include those products, for which a new application has been found.
Rogers (1995) distinguishes 5 characteristics of innovative new products:
- relative advantage, which describes whether the innovation is perceived as better (than existing solutions) for an individual;
- compatibility, which describes whether an individual finds that the innovation is compatible with his values, his needs and past experiences;
- complexity, which describes whether an individual finds it difficult for him to use the product;
- triability, which supposes a possibility to be tested/experimented before adoption;
- observability, which describes the degree of visibility of the innovation to others.
According to the authors, new products with higher levels of these features, except complexity, tend to be adopted more quickly.
Another brunch of literature suggests that customer-oriented companies (or companies with customer-oriented market strategy) are less likely to introduce disruptive new products, because in the search of “what consumers wants” it is possible to forget that a consumer may not know what he wants if previously the need or the product have not
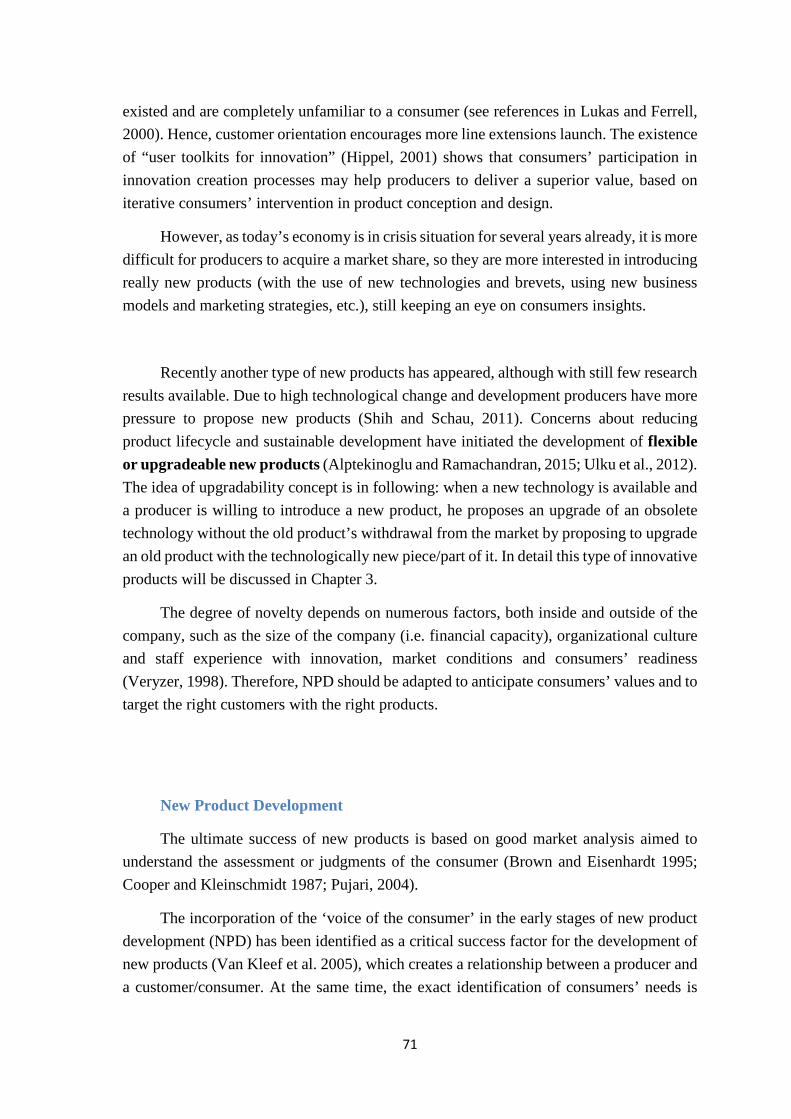
71
existed and are completely unfamiliar to a consumer (see references in Lukas and Ferrell, 2000). Hence, customer orientation encourages more line extensions launch. The existence of “user toolkits for innovation” (Hippel, 2001) shows that consumers’ participation in innovation creation processes may help producers to deliver a superior value, based on iterative consumers’ intervention in product conception and design.
However, as today’s economy is in crisis situation for several years already, it is more difficult for producers to acquire a market share, so they are more interested in introducing really new products (with the use of new technologies and brevets, using new business models and marketing strategies, etc.), still keeping an eye on consumers insights.
Recently another type of new products has appeared, although with still few research results available. Due to high technological change and development producers have more pressure to propose new products (Shih and Schau, 2011). Concerns about reducing product lifecycle and sustainable development have initiated the development of flexible or upgradeable new products (Alptekinoglu and Ramachandran, 2015; Ulku et al., 2012). The idea of upgradability concept is in following: when a new technology is available and a producer is willing to introduce a new product, he proposes an upgrade of an obsolete technology without the old product’s withdrawal from the market by proposing to upgrade an old product with the technologically new piece/part of it. In detail this type of innovative products will be discussed in Chapter 3.
The degree of novelty depends on numerous factors, both inside and outside of the company, such as the size of the company (i.e. financial capacity), organizational culture and staff experience with innovation, market conditions and consumers’ readiness (Veryzer, 1998). Therefore, NPD should be adapted to anticipate consumers’ values and to target the right customers with the right products.
New Product Development
The ultimate success of new products is based on good market analysis aimed to understand the assessment or judgments of the consumer (Brown and Eisenhardt 1995; Cooper and Kleinschmidt 1987; Pujari, 2004).
The incorporation of the ‘voice of the consumer’ in the early stages of new product development (NPD) has been identified as a critical success factor for the development of new products (Van Kleef et al. 2005), which creates a relationship between a producer and a customer/consumer. At the same time, the exact identification of consumers’ needs is
72
important, because the correction of any appeared error at any of NPD stages could be costly and imply time delays in production and commercialization (Hippel, 2001).
There are several answers to give by the NPD:
• what are the final values of the product for consumers;
• what is the concept of the product;
• what are different versions of the product to offer to consumers;
• what is products architecture;
• what is the design and physical form of the final product (Trott, 2012).
“Careful assessment of value orientations and emerging value trends will allow the identification of new product opportunities and the repositioning of existing products” (Vinson et al., 1977).
Changing importance in values and value systems of consumer may be insights to producers about the characteristics (attributes, services, etc.) of the products, which should be changed and/or ameliorated. For example, lower importance given to tradition value, may signal that brand name, image or product design should be updated to more contemporary and innovative. Whereas, high importance of functional consumer value may suggest that consumer appreciate the integration of the latest technological advances.
At the same time, marketing and promotional strategies should also reflect personal, consumer and product values in order to attract consumers. Knowing the preferences and values of target market segments producers will be able to pick up a necessary type and format of advertisements, “which will reach and enhance the important value of consumers” (Vinson, 1977, p.49).
In this light, increasing concerns about the environment and sustainability of all the participants of market exchange and regulations a new type of NPD has appeared in the 21st century: environmental new product development (ENPD) or in other literature Sustainable Product and Service Development (SPSD). Environmental or sustainable NPD includes life cycle and environmental cycle analysis, suppliers and producers involvement in environmental protection, etc.
In Maxwell and van der Vorst (2003, p. 884) SPSD defined as “the process of making products and/or services in a more sustainable way through-out their entire lifecycle, from the conception to end of life”. In SPSD the Triple Bottom Line (economic, social and environmental equilibrium) principle of sustainable development is one of the main conditions of NPD, adding it to the classic product requirements.
73
For example, worldwide campaign invoking to recycle on daily basis has a relationship with a high importance need of environmentally responsible products, made of recyclable; disassembling or reusable materials in order to reduce considerable waste amounts. Therefore, eco-design is an added value of the product for consumers, proposing an additional satisfaction, from lower environmental impact of the product.
Maxwell and van der Vorst (2003) propose criteria of sustainability for products and services: functionality, quality, technical feasibility, customer requirements, market demand, compliance with legislation, environmental impacts, social impacts and economic impacts.
Numerous issues should be solved by companies, engaged in sustainable new product development processes: optimization of economic aspects, functionality optimization production (optimization, elimination of emissions and waste), distribution, consumption (reduction of waste from consumption, packaging, reduction of energy use), raw materials management, well-being of employees of the production/management, sustainable products’ end of life management, etc. (Maxwell and van der Vorst, 2003).
However, any business, in line with sustainability intentions, is interested in business and financial indicators, such as resource management, market share, profitability, etc. Re-looking the way the product is designed, produced (starting for efficient raw materials use, energy efficiency up to packaging) and distributed proposes numerous benefits for producers (Maxwell and van der Vorst, 2003; Porter and Van der Linde, 1996; Hart, 1997): reduced volume of initial resources and raw materials; careful analysis and therefore, better control over the resources employed; better relationships with suppliers; reduced energy use; lower level of waste; better use of by-products, lower storage of materials and handling costs, higher quality of final products, lower product and packaging costs, higher safety of products and production processes, etc. These benefits lead to reduced costs and better resource management as well as better managerial understanding of production and pollution costs, leading to higher level of managerial competence.
In this light, most common producers’ concern (higher costs, hence, lower competitiveness) should be eliminated (Porter and Van der Linde, 1996; Hart, 1997). The authors suggest that “pollution often is a form of economic waste” (Porter and Van der Linde, 1996, p. 122), meaning that any side emissions or waste from the production means incomplete and inefficient use of resources. “Process changes to reduce emissions and use resources more productively often result in higher yields” (Porter and Van der Linde, 1996, p. 126).
74
4.2. Consumer innovativeness and the diffusion of innovations
According to Sheth (1981) and Rogers (1995) the acceptance and the adaptation of innovations depends on personal habits and the risks associated with innovations. The strength of individual attachment to existing practice or routine may cause the resistance to the new behavior installation. Because of the ritual behavior a consumer may not be paying attention to innovations or may not be willing to pay the attention.
If we look on the process of choosing in any habitual consumption case, we can see that this process has the same steps (time and place choices, effort and money choices, consumption choices). The “obstacle” for innovation acceptance may affect the whole habit issue or a single step. For example, choosing an innovative product/service with the need to change only timing habits may be accepted easily than the one, which changes the whole consumption experience.
The reaction towards innovative products has several stages: acquaintance, knowledge, persuasion and the decision to adopt the innovation. Sheth (1981) identifies the risks associated with innovations:
- aversive physical, social and economic consequences;
- performance uncertainty;
- perceived side effects.
Later, Hoeffler (2003) proposes more complex classification of risks or difficulties of innovative products’ perception: consumer has no knowledge about the usefulness of the new attributes, and, therefore, about the consequent utility; these new attributes may demand the change of consumption behavior; and lastly, the understanding of the benefits of the new attributes is formed without personal experience - on the basis of the available information, so this perception may be erroneous/biased.
According to habits and risks there is another classification of innovations Sheth (1981):
1. Dual resistance innovations6 (high risks, strong habits). Among such products are nutrition and conservation practices, education and welfare issues.
2. Habit resistance innovations (low risk, strong habits). Products, which replace the existing products are ascribed to this category. The risk of rejection of such products is caused by a very small level of perceived change/difference between a new and a habitual product.
6 Here, by innovation are meant new products.
75
3. Risk resistance innovations (high risk, weak habits). In this category the products are not in conflict with existing habits, they create new habits and usually these are radical innovations.
4. No resistance innovations (low risks, weak habits). The most effortless type of innovations. An example of such innovation is fashion.
One of the main goals of marketing strategy for innovative products is, therefore, diminish the influences of higher risks, due to uncertainty and expose positive consequences of behavior patterns’ change (i.e. clarify consumers’ market vision) (Trott, 2012). Consumers’ market vision of the innovative products increases the chances of innovation acceptance. “New products and services must be accurately responsive to user needs if they are to succeed” says Hippel (2001, p.247). A simple example given in Trott (2012) illustrates this situation: Ipod, being a disruptive innovation in the beginning of 2000th, has used new technologies, changed consumption patterns, and, what is important, was easy to use, what gave a market advantage versus competing products.
In modern society innovation is not a stable state of a newly invented or reinvented product but a continuous improvement after which different consumers have different intentions to adopt it. An important issue of innovation is the necessity if its’ diffusion: new things are not known and without diffusion of information about them are less likely to be accepted by consumers. Rogers (1995) made a significant research on the question of innovation diffusion.
In Roehrich (2004, p. 671) we can find the term “consumer innovativeness”, which denotes “the tendency to buy new products more often and more quickly than other people” or as “receptivity to new ideas”. The author discusses consumer innovativeness on the basis of innate innovativeness concept, which considers four motives for innovativeness:
• expression of the need for stimulation;
• expression of novelty seeking;
• independence towards others’ communicated experience;
• expression of need for uniqueness.
According to readability to adopt innovations there are several groups of consumers (Rogers, 1962, 2010; Robinson, 2009):
76
1. Innovators (about 2.5% of consumers)
Innovators are usually individuals with good imagination, creativity and risk loving. They are first to search information and use innovations. Their level of innovativeness is much higher than the average, so usually other people are not influenced by them.
2. Early adopters (13.5%)
The group of early adopters is opened to things which are new, they are curious and become leaders in society, after whom an innovation "can be trusted" and adopted. They easily see the benefits which an innovation can give them and possible consequences. This group does not need a long persuasion process and helps to “test” the innovation before the majority.
3. Early majority (34%)
Early majority group presents individuals as more tradition-oriented, less educated and less likely to lead. They are more pragmatic, and therefore more risk averse. They are not ready to commit a lot of time and money to learn and to get used to new products, so they try to avoid complex things. They usually follow leaders from previous groups.
4. Late majority (34%)
Late majority consumers are conservative pragmatists who don't like taking risks and are not eager to change things. Such people are afraid of being outdated, so they follow the mainstream.
5. Laggards (16%).
Almost the same concerns laggards who are completely traditional and have a high risk perception of all innovations. These consumers need a high motivation to change their opinions.
This classification, however, does not classify consumers once forever: an individual may be a laggard when choosing a TV, but an innovator as for a coffee preparation option.
77
However, I would like to mention once again the concept of innate innovativeness, explained in Roehrich (2004, based on Midgley(1977)). Innate innovativeness is claimed to be inherent to each individual, whereas actualized innovativeness is reflected in actual innovative behavior. The author discusses this concept as a part of the concept where innovativeness is an independence towards others’ communicated experience.
In this thesis, we, in contrast, use this idea to consider that innovativeness and innovative values are embedded in individual values concept, meaning that regardless of the situation and the product (TV choice or coffee preparation option) innovation acceptance and adoption may be the same, if personal values support individual and consumer openness to change and innovativeness.
In addition, “innovativeness as expression of need for uniqueness” communicates as well with personal and consumption values. For example, possession value is connected with consumer’s need for uniqueness, when choosing a new high-tech TV or an electric car. Or, inversely, conformity personal value or cultural values restrain an individual from choosing a product/service, which is really new for society and his/her cultural environment.
4.3. Eco-innovation, sustainable development and consumption
Recently, environmental and ecological issues have been discussed in most OECD and developing countries, and among such issues are resource efficiency, waste and emissions reduction, better environmental performance and, as a result, a reduced environmental impact (Pujari, 2004). The worsening quality of life in numerous regions (air, water quality, low levels of natural resources, nuclear energy risks, etc.) lead to a higher need of production processes, lifestyle, and consumption behavior change. OECD (2008) has evoked the necessity of (inter-)national encouragement of more sustainable behavior, both of producers and consumers, for humanity welfare.
Eco-innovation is new concept, positioned on the crossing of environmental and innovation studies. From the market perspective, consumer purchase decisions and demand for sustainable and eco-innovative products may sensitize producers to engage in environmental and community concerns, which may lead to the change of consumption values and behavior.
Eco-innovations are all actions (behaviors), measures, products and services, which are new and contribute positively to environmental situation, and other problems of sustainability, creating sustainable consumption patterns (Rennings, 2000). Therefore, the difference between eco-innovations and ordinary innovations is in their purposeful lower
78
level of environmental harm. In other words, such innovation aims to reduce environmental risks, pollution and other negative influences (OECD, 2007).
Eco-innovations, as innovations in general, may be organizational (for example, eco-audit), product and process innovations (for instance, flat screen TV and LED technologies (less energy consuming), electric cars, etc.), and social (changing consumers’ behaviors towards consumption).
OECD (2001, p. 11; 2008) classifies environmental products into 3 categories:
- pollution management (air, water, noise pollution control, etc.);
- cleaner technologies and products;
- resource management (water supply, recycling, renewable energy, sustainable agriculture and eco-tourism, etc.).
Rennings (2000) says that eco-innovation is “pushed” by regulations, policies, and technologies, being encouraged or “pulled” by the market and the cost reduction at the same time. These push measures are considered in here as a part of eco-innovation promotion and management, leading to increasing number of eco-innovation produced, accepted and used by governments, producers and citizens/consumers.
OECD report (2008) on sustainable consumption states that mandatory governmental regulations are “… are the most direct policy instruments for eliminating unsustainable products from the market.” Environmental policies, regulations and standards have a strong influence on eco-innovation (for example, ISO 14000 family). Eco-taxes and governmental changes on unsustainable products, as well as higher consumer prices are meant to regulate market demand. For example, the main measure of French government to reduce carbon emissions is the “bonus-malus” measure, applied for the purchase of new cars: bonus is paid for a purchased vehicle discharging less than 110 grams of CO²/km, otherwise the customer should pay a malus. This regulation is progressive, with decreasing CO²/km level for bonus, and increasing amount of malus, with the latest update in 2016.
The development of technologies also gives a push to eco-innovation development, both process and product eco-innovations. Firms are pushed to use the latest energy and material saving technologies, integrate new technologies in their final production to keep up with competition, create a positive image and propose a range products, the consumers are interested in. For example, eco-labels mean regulatory obligations and norms for producers and at the same time signal consumers about the product’s quality, its’ intangible characteristics and producers responsibilities (Kaenzig and Wustenhagen, 2010). “Fair
79
trade” labels, in addition, infer fair trading conditions for producers in developing countries, promoting equity on international markets. Other examples are obligatory energy efficiency labels on home appliances and cars or health warning labels of harmful products, such as cigarettes of alcohol or genetically modified foods (OECD, 2008). Such labels, as the technological advances they certify, promote sustainable decision-making during choice, purchase and use stages of consumption activities.
Among another governmental actions, promoting sustainable development, are subsidies and incentives. For instance, most OECD countries’ big cities propose incentives to quit a car and use bicycles by installing autonomous bicycle rent stations all over the city, allowing a quick, cheap and zero-pollution transportation mode.
Technology development creates new market opportunities (technologically advances proposition and avoidance of the obsolesce of existing products, creation of new markets) and better resource management, as stated above, however, in the light of this research an important issue is consumers’ behavior and a desirability of changes in lifestyle and consumption habits (Rennings, 2000).
Sustainable consumption is at the same time a lever for sustainable production and the result of it. Employment of greener technologies creates already a greener environment for consumption and consumers’ decisions, and then, sustainable consumption and post-consumption activities (conservation, reuse, recycle, etc) take the relay, creating a sustainable consumption cycle (Jansson et al., 2010).
For example, 5€ milliards in 2014 (+10 %/2013) of eco-production with « AB » label (Agriculture Biologique) has been produced in France and the market is in constant growth. About 9 individuals of 10 have consumed bio products in 2014 in France (Agence BIO, 2014). In the European Union bio products agriculture is as well on growth and development, growing from 4,3 mln of hectares in 2000 up to 10 mlns in 2014 and 71 % of bio products (in value) are consumed in Germany, France, Italy and United Kingdom. This data proves that agriculture, production facilities and processes, consumption become cleaner, understanding the necessity of this change for the world’s well-being.
Jansson et al. (2000), referring to previous research, indicates that usually sustainable consumption term is understood as a curtailment consumer behavior. Switching off lights in an empty room, installing energy saving light bulbs, saving water and recycling are often given as examples. These actions usually demand higher constant efforts from consumers, are costless and provoke a certain level of comfort cut (Nordlund and Gavill, 2002). Being somewhat perturbing on individual level, such actions lead to positive societal and environmental consequences.
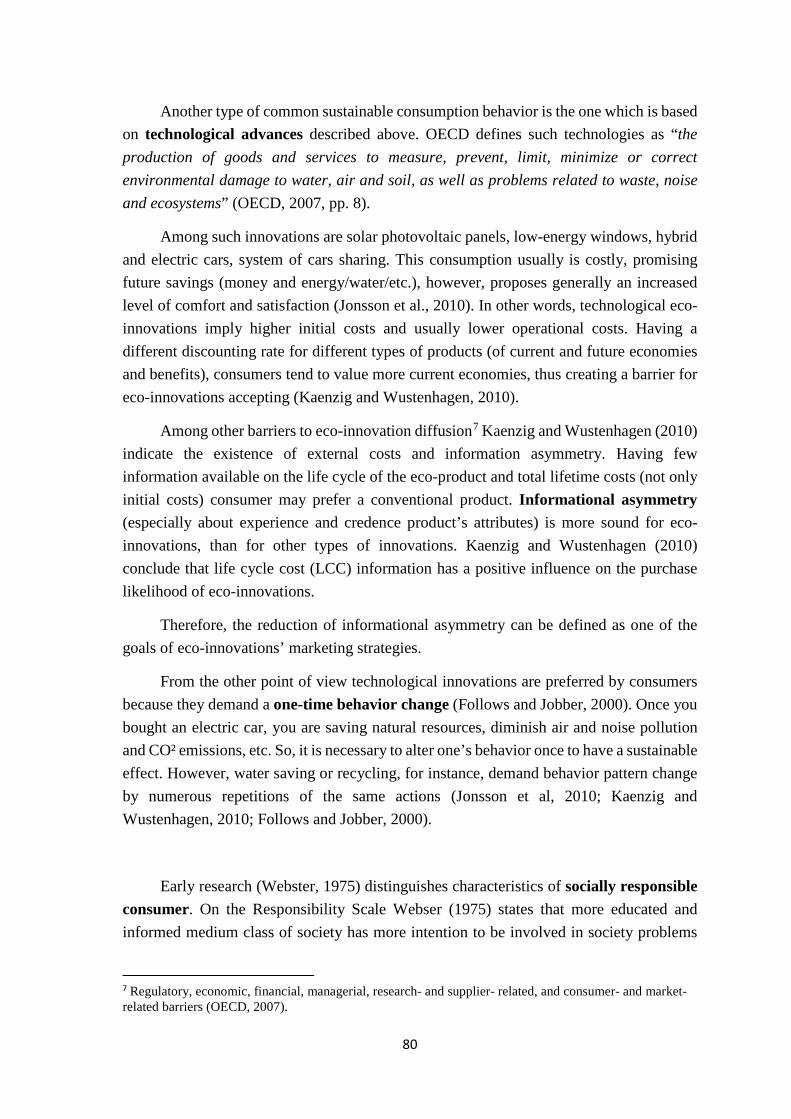
80
Another type of common sustainable consumption behavior is the one which is based on technological advances described above. OECD defines such technologies as “the production of goods and services to measure, prevent, limit, minimize or correct environmental damage to water, air and soil, as well as problems related to waste, noise and ecosystems” (OECD, 2007, pp. 8).
Among such innovations are solar photovoltaic panels, low-energy windows, hybrid and electric cars, system of cars sharing. This consumption usually is costly, promising future savings (money and energy/water/etc.), however, proposes generally an increased level of comfort and satisfaction (Jonsson et al., 2010). In other words, technological eco-innovations imply higher initial costs and usually lower operational costs. Having a different discounting rate for different types of products (of current and future economies and benefits), consumers tend to value more current economies, thus creating a barrier for eco-innovations accepting (Kaenzig and Wustenhagen, 2010).
Among other barriers to eco-innovation diffusion7 Kaenzig and Wustenhagen (2010) indicate the existence of external costs and information asymmetry. Having few information available on the life cycle of the eco-product and total lifetime costs (not only initial costs) consumer may prefer a conventional product. Informational asymmetry (especially about experience and credence product’s attributes) is more sound for eco-innovations, than for other types of innovations. Kaenzig and Wustenhagen (2010) conclude that life cycle cost (LCC) information has a positive influence on the purchase likelihood of eco-innovations.
Therefore, the reduction of informational asymmetry can be defined as one of the goals of eco-innovations’ marketing strategies.
From the other point of view technological innovations are preferred by consumers because they demand a one-time behavior change (Follows and Jobber, 2000). Once you bought an electric car, you are saving natural resources, diminish air and noise pollution and CO² emissions, etc. So, it is necessary to alter one’s behavior once to have a sustainable effect. However, water saving or recycling, for instance, demand behavior pattern change by numerous repetitions of the same actions (Jonsson et al, 2010; Kaenzig and Wustenhagen, 2010; Follows and Jobber, 2000).
Early research (Webster, 1975) distinguishes characteristics of socially responsible consumer. On the Responsibility Scale Webser (1975) states that more educated and informed medium class of society has more intention to be involved in society problems
7 Regulatory, economic, financial, managerial, research- and supplier- related, and consumer- and market-related barriers (OECD, 2007).
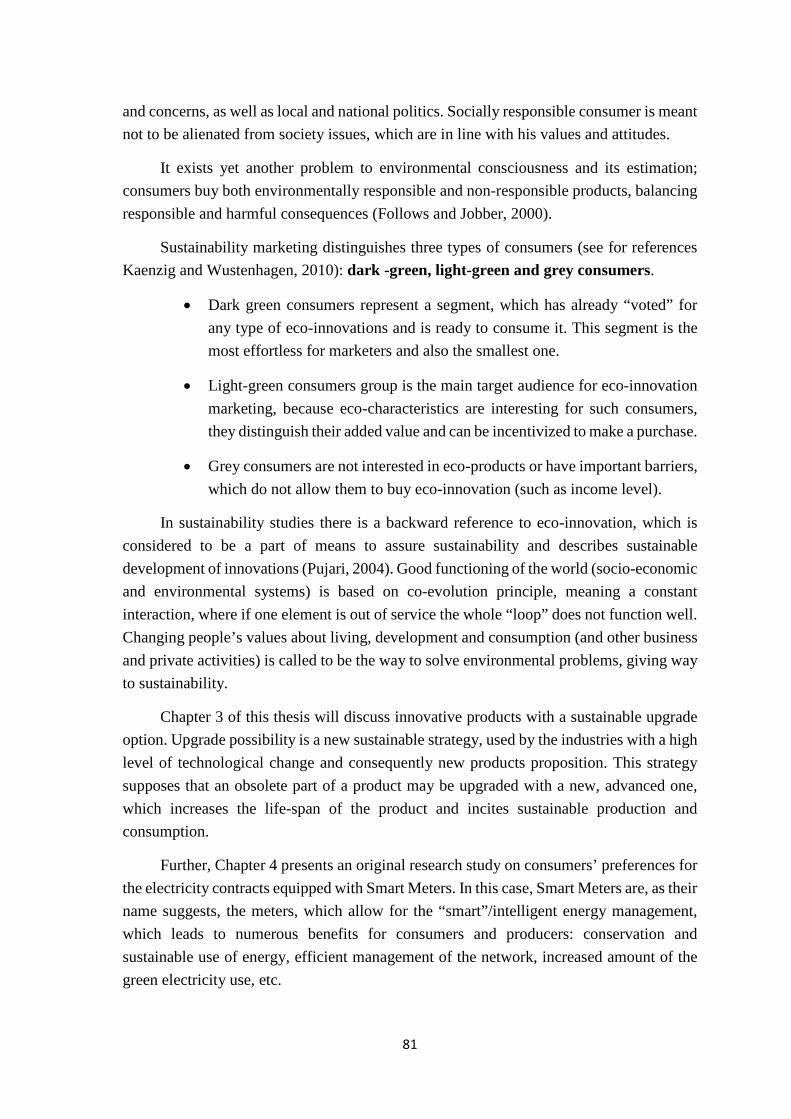
81
and concerns, as well as local and national politics. Socially responsible consumer is meant not to be alienated from society issues, which are in line with his values and attitudes.
It exists yet another problem to environmental consciousness and its estimation; consumers buy both environmentally responsible and non-responsible products, balancing responsible and harmful consequences (Follows and Jobber, 2000).
Sustainability marketing distinguishes three types of consumers (see for references Kaenzig and Wustenhagen, 2010): dark -green, light-green and grey consumers.
• Dark green consumers represent a segment, which has already “voted” for any type of eco-innovations and is ready to consume it. This segment is the most effortless for marketers and also the smallest one.
• Light-green consumers group is the main target audience for eco-innovation marketing, because eco-characteristics are interesting for such consumers, they distinguish their added value and can be incentivized to make a purchase.
• Grey consumers are not interested in eco-products or have important barriers, which do not allow them to buy eco-innovation (such as income level).
In sustainability studies there is a backward reference to eco-innovation, which is considered to be a part of means to assure sustainability and describes sustainable development of innovations (Pujari, 2004). Good functioning of the world (socio-economic and environmental systems) is based on co-evolution principle, meaning a constant interaction, where if one element is out of service the whole “loop” does not function well. Changing people’s values about living, development and consumption (and other business and private activities) is called to be the way to solve environmental problems, giving way to sustainability.
Chapter 3 of this thesis will discuss innovative products with a sustainable upgrade option. Upgrade possibility is a new sustainable strategy, used by the industries with a high level of technological change and consequently new products proposition. This strategy supposes that an obsolete part of a product may be upgraded with a new, advanced one, which increases the life-span of the product and incites sustainable production and consumption.
Further, Chapter 4 presents an original research study on consumers’ preferences for the electricity contracts equipped with Smart Meters. In this case, Smart Meters are, as their name suggests, the meters, which allow for the “smart”/intelligent energy management, which leads to numerous benefits for consumers and producers: conservation and sustainable use of energy, efficient management of the network, increased amount of the green electricity use, etc.
82
Conclusion
Deep understanding of consumers’ values and preferences is crucial for the introduction of innovative products, because such products respond to consumers’ needs, which are new and of uncertain nature. In this case, value insights may be extremely useful, even more useful than preferences’, market needs’ and market possibilities’ analyses.
A piece of research discusses the connections and correlations between values and behavior, supposing that values guide individual behavior. A deep analysis of the literature allows us to conclude that individual value systems are created on the basis of a combination of several types of values. All these values, inside of value systems, interact, compete with each other, guide and amplify each other. An appropriate overlapping scheme is proposed in the chapter.
Personal values are individual's beliefs about life and accepted behavior. Such values may be considered as stable and may be applied in any situation or individual action. These values reflect individual’s particular preferences towards life and the way one lives it. The most widely used personal values classification distinguishes such values: power, achievement, hedonism, stimulation, self-direction, universalism, benevolence, tradition, conformity, security and spirituality. Later, cultural values are assimilated to personal values, describing beliefs and motives about what is desirable and acceptable for particular social and cultural environment.
Consumption behavior, is also influenced by personal values, in combination with values of the individual as an economic agent: customer and consumer values. Customer value is a term, which represents an amount of benefits an individual expects from the product to be satisfied. It expresses the value of the relationship between the customer and the producer, therefore is connected to such notions as a trade-off (costs and benefits), satisfaction, loyalty, producer’s profits and market share, etc.
In consumption studies consumer values are discussed and they denote consumers’ stable motivations and decision rules, applied in the decision-making on consumption choices. Values are applied in particular situations, guiding and planning individual actions, and therefore, behavior. These values are of a particular interest in our research.
Consumer values concept is closely related to attitudes and preferences concepts. Attitude is defined as an affective valuation, which is not objective and comparative. In contrast, economic preferences are comparative and measurable decision rules, a consumer applies in each particular choice situation for each particular product. Particular preferences in concrete choice situations reflect consumers’ values, which are more abstract and not product- and situation-specific. Therefore, consumption decisions are analyzed on the basis
83
of preferences and their measurement, reflected in the willingness to pay for a product or its particular feature.
Additionally, we assume that product itself has an intrinsic value. According to Lancaster’s consumer theory, the value of the product is contained in its’ tangible and intangible (associated services) attributes. Hence, the utility of the product for a consumer may be calculated as a sum of characteristics’ utilities. Utility is, therefore, an empirical measurement of the strength of preferences. Hereby, particular choices may reflect the system of values used by a consumer in the decision-making process.
And as we are interested in the analysis of consumers’ attitudes, preferences and values for innovative products/services and their features, we also discuss product innovativeness and its influence on preference estimation techniques.
Product innovativeness is the degree of newness of the product, according to which all new innovative product are classified into three categories: continuous innovations; dynamically continuous innovations; discontinuous innovations. Depending on the type of innovation employed radically and incrementally new products are distinguished. Besides the degree of newness these types of new products differ in the consumers’ knowledge about the product. Therefore, preferences for such products, due to the presence of innovative features, which are new and unknown to consumers, are formed at the moment of the first contact with the product and they are not based on consumer’s experience. This particularity arises the need of a careful search for a preference elicitation method.
And, more particularly, as the objects of our studies are eco-innovative products/services we suppose that environmental concern and values should be discussed. The difference between eco-innovations and ordinary innovations is in their purposeful lower level of environmental harm. Consumption of eco-innovative or sustainable products encourages the development of and is influenced by environmental values, which are also included in the concept of individual value systems. From the traditional economic theory’s point of view rational consumer has no incentives to contribute to the proposition of public good (environmental protection and sustainability problems) and is motivated only by the personal well-being. However, the extensive research evidence supports the connection between personal/consumer values and pro-environmental behavior, meaning that individual’s values may also lead to the trade-offs, which guarantee sustainable consumption and positive willingness to pay for responsible offerings.
Based on the theory presented in this chapter, we assume the influence of the individual, consumer, product, innovative and environmental values on the acceptance and preferences for (eco-) innovative products. We should, however, identify the key elements in the process of valuation of innovative and eco-innovative products/services and their

84
precise characteristics in order to provide the insights into what is really taken into account by consumers.
The issues discussed in Chapter 1 also raise problems of the observation and analysis of preferences for eco-innovative products, thus an appropriate method, proposing the most reliable measure of individuals’ values and preferences, should be chosen, and this will be the subject of the next chapter.

85
86
CHAPTER 2
Preference and value elicitation for innovative products. Methodological side of the problem
“A challenging preference-elicitation method might also enable consumers to think deeply about their preferences. » Hauser et al., 2014, p.23
Consumers’ attitudes and preferences for innovative products have been described in detail in Chapter 1, but for the empirical analysis it is necessary to examine the existing methods of preferences and value elicitation. Subsequently, these preferences and values can be integrated in the economic analysis used for marketing, governmental and environmental objectives. As evoked earlier, consumer choices are objects of many extrinsic and intrinsic motivations, based on value systems, activated in particular situations with their constraints for particular goals. Each choice situation consists of several possible outcomes, described by characteristics or parameters. Careful analysis of consumers, their preferences and values, enables to analyze their current choices and to predict their future ones (i.e. predict the demand for a particular product or its innovative feature). Inversely, attentive analysis of products, consumption goals, situations and their respective parameters may predict the category of consumers, which will be interested in the product. The use of this information explains the importance of empirical analysis of consumers’ preferences and values, as well as their relationships with products’ characteristics and other aspects of decision-making.
87
Innovative product is a particular type of products, because consumer does not have pre-formed preferences for its new features, simply because he/she is unaware of them. The formation of preferences during the decision-making process is based on values inherent to consumer not only as a consumer, but also as an individual. In addition product has his own intrinsic value called product value and go-aside environmental and innovation values participate as well in decision-making process.
Thus, consumer choices reflect values and preferences. The choice of a rational consumer is supposed to have the highest utility for him among all other choice options available - consumer puts value on the product. In monetary terms the strength of preferences and valuation of the product is translated in consumer’s Willingness to Pay (WTP) for the product. Lancaster theory, the basis of this research, claims that the product’s valuation is in fact a sum of valuations of product’s characteristics. In other words, the utility of the product is composed of the utilities of its characteristics and a rational consumer chooses the product, which has the largest sum of these utilities. In this research work we are investigating the values of consumers for innovative features and their role in decision-making - their utility parts.
Precision of the WTP estimates depends on the choice of preference/WTP elicitation method. This chapter will discuss different approaches to value elicitation through the methods of experimental economics. First, we analyze traditional methods of value elicitation, which consist of revealed preferences methods (real choices) and stated preferences methods (hypothetical choices). Both revealed and stated preference data is used to analyze consumer choices with the help of appropriate econometric models. However, value elicitation methods are often not universal: they may not be applied for particular choice situations. An example of such situation is the case of innovative products decision-making. In case of non-market (the product is not available on the market) valuation revealed preference methods are not applicable and the task of stated preference methods is also complicated. The questions of internal and external validity of hypothetical choices are keen. The possibility to “create” the product and the choice environment are some of the main advantages of stated preference methods. Hypothetical products allow the researcher to estimate values and preferences for a product with particular characteristics, whereas the artificial environment, often called experimental, allows to control the factors, which may influence the choice. Three main classes of stated preference elicitation methods are discussed in this research work:
• conjoint analysis;
• contingent valuation;
• discrete choice analysis with its derivatives.
88
As stated earlier, hypothetical preference elicitation methods are usually conducted in experimental setting – with artificial environment – in the laboratory. Therefore, in this case stated preference methods share many common features with revealed preference methods such as laboratory experiments and auctions. If real economic incentives are absent for participants, as well as the real product to be sold during the auction, such actions may be considered as a part of stated preference elicitation methods, allowing to obtain consumers hypothetical WTP estimates.
The lack of incentives to reveal consumers’ true preferences and WTP may be solved in a number of ways and we describe them in the current chapter. Recently, numerous new attempts are made in order to increase internal and external validity through combining stated and/or revealed data and methods. With numerous combinations possible, we consider one which incorporates the benefits of conjoint analysis and those of auctions. Even if auction mechanism is conducted in a hypothetical way, the bidding procedure makes an approach to real-choice situation and changes participants’ perception of experimental setting.
As all existing ways of mediating hypothetical and other biases do not give a perfect result, one different method is also presented in this thesis, as complementary to the main stated preference elicitation methods. Inferred valuation method performs better, compared to non-hypothetical value elicitation surveys, showing lower results (outperformance), i.e. lower hypothetical bias. Our version of inferred valuation is different from the original method, looking for the answer to the question whether consumers are able to predict the valuation and choices of others. The inferred answers provide us with the insights about applying the obtained results to the population.
Chapter 3 and 4 present the application of discrete choice experiments (stated preference elicitation method) and combined conjoint analysis with auction (combined method), realized during two experimental studies on innovative products.
1. Traditional methods of value elicitation
Value elicitation issue is arisen in many sciences: psychology, social sciences, behavioral decision theory, economics, etc. A high importance of knowledge about customers/consumers is given in marketing (as a part of market research for, for instance,
89
marketing and pricing strategies), management and new product development studies (see Breidert et al., 2006 for references).
Up to date researchers have developed numerous methods, which as a part of marketing research techniques, may be used during the whole product lifecycle:
- before and during NPD to understand the needs and future demand for the product;
- brand-building strategy, competition and satisfaction analysis;
- analysis of ways of product’s re-juvenescence, search for new versions of the product and new markets for it.
Based on previous literature (Hensher, 2009; Ben Akiva et al., 1994) we distinguish several types of data, obtained from value elicitation practices:
• Real market data is where researchers observe real behavior.
Real market data is obtained by discretely and anonymously observing individual real-life choices, without any intervention. Another way to get real market data is to invite consumers to make real choices for money. This payment usually includes a fixed participation fee and a variable part, which depends on the product chosen (Lusk and Shogren, 2011).
Considerable inconvenience of market data is that it is often only available in aggregate forms, combined for several stores, markets, etc., so that personal WTP are difficult to estimate. Moreover, market panel studies usually have high operating costs (Breidert et al., 2006).
Market data is an isolated type of data, because it is not obtained in result of any value elicitation method application or any other controlled way of data management. It are usually used for the analysis just before the launching of the product, i.e. last arrangements.
• Revealed preferences (RP) data implies that researchers survey consumers and analyze their actual choices. The participants of such surveys may be asked to choose an alternative, to describe it and other alternatives with attributes, and, sometimes, to indicate the reasons of (not) choosing a particular alternative (Louviere et al., 2000; Hensher et al., 2007). In order to obtain revealed preference data experimental sessions with consumers are usually organized, where market conditions are preserved and participants make real choices in given conditions. This type of data is available after a real purchase intention
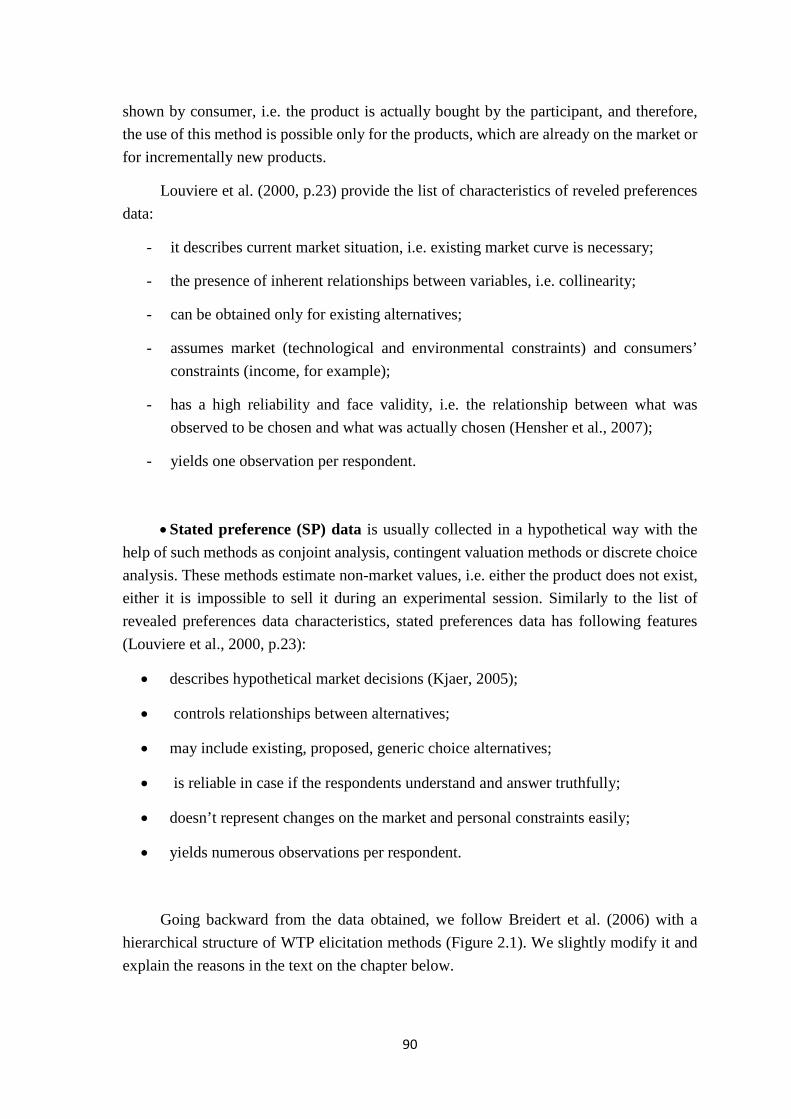
90
shown by consumer, i.e. the product is actually bought by the participant, and therefore, the use of this method is possible only for the products, which are already on the market or for incrementally new products.
Louviere et al. (2000, p.23) provide the list of characteristics of reveled preferences data:
- it describes current market situation, i.e. existing market curve is necessary;
- the presence of inherent relationships between variables, i.e. collinearity;
- can be obtained only for existing alternatives;
- assumes market (technological and environmental constraints) and consumers’ constraints (income, for example);
- has a high reliability and face validity, i.e. the relationship between what was observed to be chosen and what was actually chosen (Hensher et al., 2007);
- yields one observation per respondent.
• Stated preference (SP) data is usually collected in a hypothetical way with the help of such methods as conjoint analysis, contingent valuation methods or discrete choice analysis. These methods estimate non-market values, i.e. either the product does not exist, either it is impossible to sell it during an experimental session. Similarly to the list of revealed preferences data characteristics, stated preferences data has following features (Louviere et al., 2000, p.23):
• describes hypothetical market decisions (Kjaer, 2005);
• controls relationships between alternatives;
• may include existing, proposed, generic choice alternatives;
• is reliable in case if the respondents understand and answer truthfully;
• doesn’t represent changes on the market and personal constraints easily;
• yields numerous observations per respondent.
Going backward from the data obtained, we follow Breidert et al. (2006) with a hierarchical structure of WTP elicitation methods (Figure 2.1). We slightly modify it and explain the reasons in the text on the chapter below.
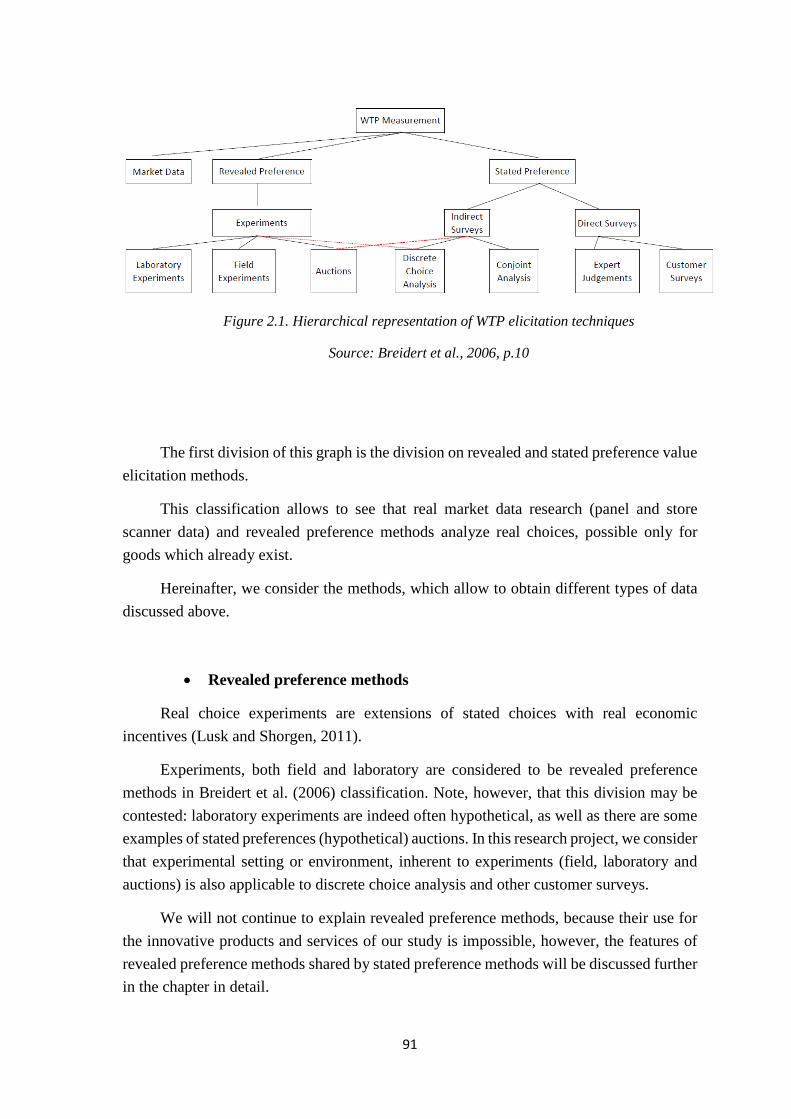
91
Figure 2.1. Hierarchical representation of WTP elicitation techniques
Source: Breidert et al., 2006, p.10
The first division of this graph is the division on revealed and stated preference value elicitation methods.
This classification allows to see that real market data research (panel and store scanner data) and revealed preference methods analyze real choices, possible only for goods which already exist.
Hereinafter, we consider the methods, which allow to obtain different types of data discussed above.
• Revealed preference methods
Real choice experiments are extensions of stated choices with real economic incentives (Lusk and Shorgen, 2011).
Experiments, both field and laboratory are considered to be revealed preference methods in Breidert et al. (2006) classification. Note, however, that this division may be contested: laboratory experiments are indeed often hypothetical, as well as there are some examples of stated preferences (hypothetical) auctions. In this research project, we consider that experimental setting or environment, inherent to experiments (field, laboratory and auctions) is also applicable to discrete choice analysis and other customer surveys.
We will not continue to explain revealed preference methods, because their use for the innovative products and services of our study is impossible, however, the features of revealed preference methods shared by stated preference methods will be discussed further in the chapter in detail.
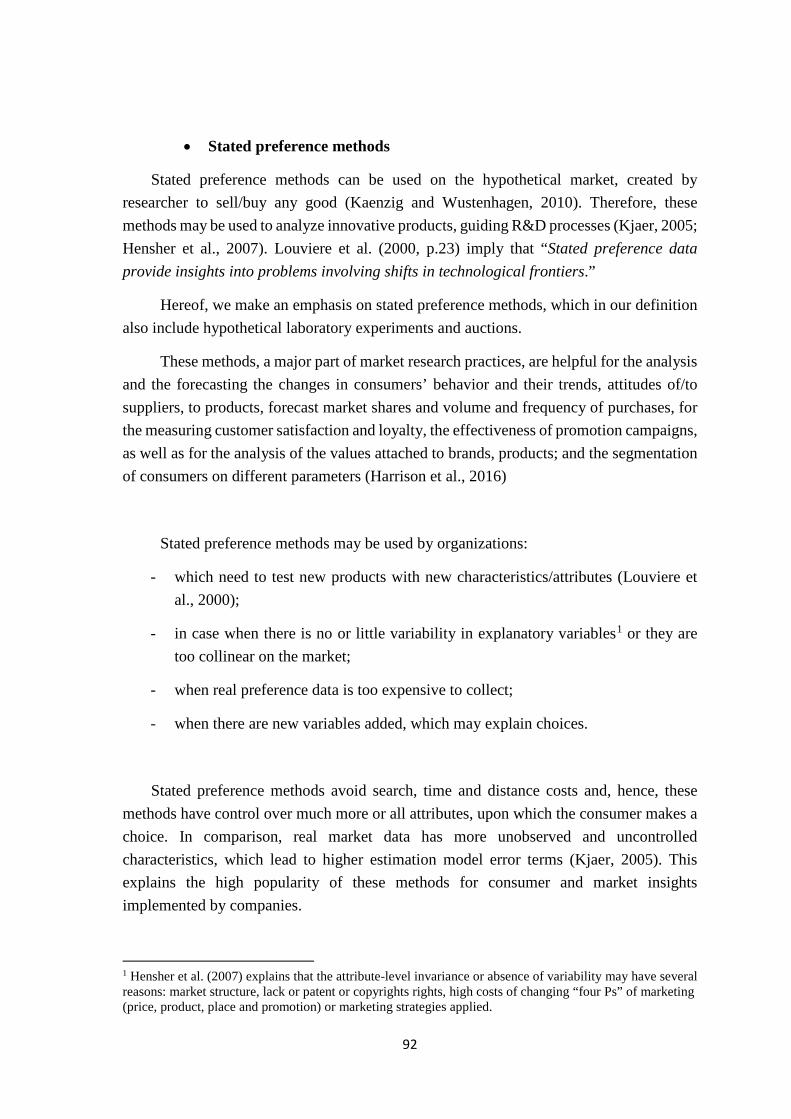
92
• Stated preference methods
Stated preference methods can be used on the hypothetical market, created by researcher to sell/buy any good (Kaenzig and Wustenhagen, 2010). Therefore, these methods may be used to analyze innovative products, guiding R&D processes (Kjaer, 2005; Hensher et al., 2007). Louviere et al. (2000, p.23) imply that “Stated preference data provide insights into problems involving shifts in technological frontiers.”
Hereof, we make an emphasis on stated preference methods, which in our definition also include hypothetical laboratory experiments and auctions.
These methods, a major part of market research practices, are helpful for the analysis and the forecasting the changes in consumers’ behavior and their trends, attitudes of/to suppliers, to products, forecast market shares and volume and frequency of purchases, for the measuring customer satisfaction and loyalty, the effectiveness of promotion campaigns, as well as for the analysis of the values attached to brands, products; and the segmentation of consumers on different parameters (Harrison et al., 2016)
Stated preference methods may be used by organizations:
- which need to test new products with new characteristics/attributes (Louviere et al., 2000);
- in case when there is no or little variability in explanatory variables1 or they are too collinear on the market;
- when real preference data is too expensive to collect;
- when there are new variables added, which may explain choices.
Stated preference methods avoid search, time and distance costs and, hence, these methods have control over much more or all attributes, upon which the consumer makes a choice. In comparison, real market data has more unobserved and uncontrolled characteristics, which lead to higher estimation model error terms (Kjaer, 2005). This explains the high popularity of these methods for consumer and market insights implemented by companies.
1 Hensher et al. (2007) explains that the attribute-level invariance or absence of variability may have several reasons: market structure, lack or patent or copyrights rights, high costs of changing “four Ps” of marketing (price, product, place and promotion) or marketing strategies applied.
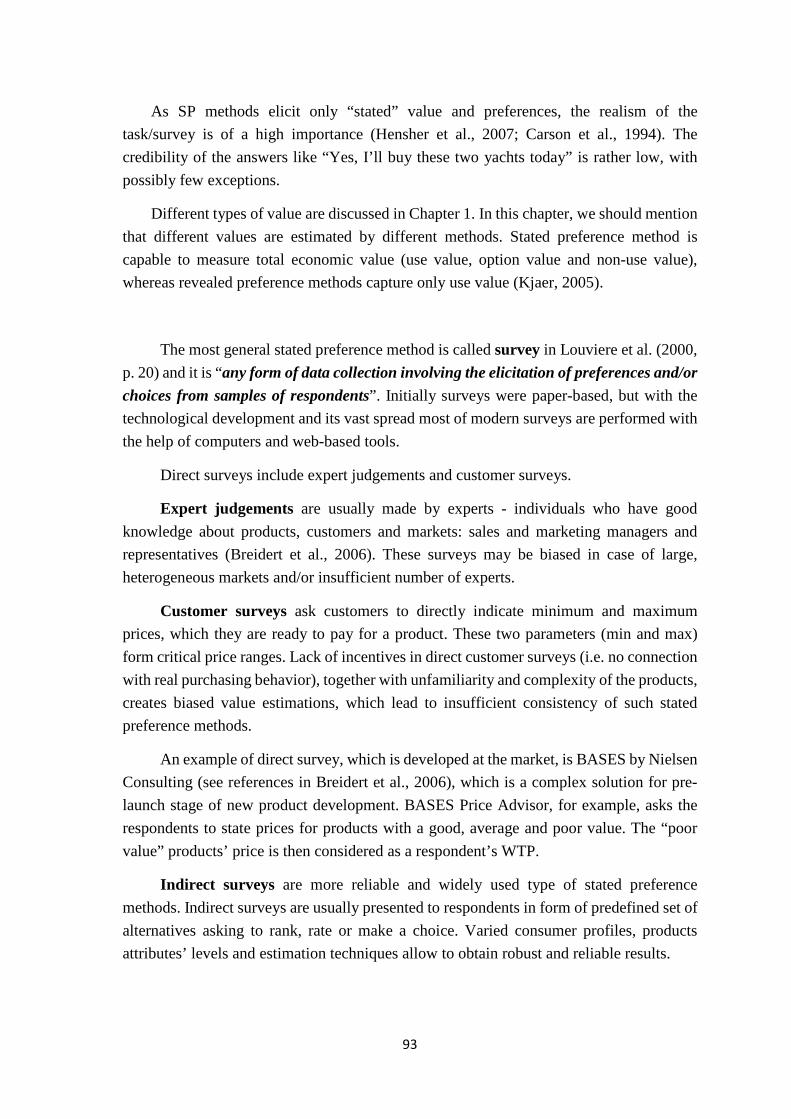
93
As SP methods elicit only “stated” value and preferences, the realism of the task/survey is of a high importance (Hensher et al., 2007; Carson et al., 1994). The credibility of the answers like “Yes, I’ll buy these two yachts today” is rather low, with possibly few exceptions.
Different types of value are discussed in Chapter 1. In this chapter, we should mention that different values are estimated by different methods. Stated preference method is capable to measure total economic value (use value, option value and non-use value), whereas revealed preference methods capture only use value (Kjaer, 2005).
The most general stated preference method is called survey in Louviere et al. (2000, p. 20) and it is “any form of data collection involving the elicitation of preferences and/or choices from samples of respondents”. Initially surveys were paper-based, but with the technological development and its vast spread most of modern surveys are performed with the help of computers and web-based tools.
Direct surveys include expert judgements and customer surveys.
Expert judgements are usually made by experts - individuals who have good knowledge about products, customers and markets: sales and marketing managers and representatives (Breidert et al., 2006). These surveys may be biased in case of large, heterogeneous markets and/or insufficient number of experts.
Customer surveys ask customers to directly indicate minimum and maximum prices, which they are ready to pay for a product. These two parameters (min and max) form critical price ranges. Lack of incentives in direct customer surveys (i.e. no connection with real purchasing behavior), together with unfamiliarity and complexity of the products, creates biased value estimations, which lead to insufficient consistency of such stated preference methods.
An example of direct survey, which is developed at the market, is BASES by Nielsen Consulting (see references in Breidert et al., 2006), which is a complex solution for pre-launch stage of new product development. BASES Price Advisor, for example, asks the respondents to state prices for products with a good, average and poor value. The “poor value” products’ price is then considered as a respondent’s WTP.
Indirect surveys are more reliable and widely used type of stated preference methods. Indirect surveys are usually presented to respondents in form of predefined set of alternatives asking to rank, rate or make a choice. Varied consumer profiles, products attributes’ levels and estimation techniques allow to obtain robust and reliable results.
94
Another advantage of indirect2 SP methods is that the researcher is able to control the choice set – all the alternatives among which the consumer is making choice and their levels are created and varied under researchers’ control (Hensher et al., 2007).
In addition, stated preference methods and particularly indirect surveys usually allow to collect more data from an individual: respondents face multiple choice situations whereas real preference methods usually provide a single choice data.
Conjoint analysis, contingent valuation and discrete choice analysis are the most widely used and efficient stated preference methods. We should also restate that discrete choice analysis may be considered as revealed preference methods if they include real purchase decision for participants. Nevertheless, discrete choices are far more often used in hypothetical setting, hence the classification remains as it is in Figure 2.1.
Due to high relevancy of both preference elicitation data types (SP and RP) in different situations, a growing number of research combines them to get “data enrichment” (Kjaer, 2005; Louviere et al., 2000), which we will discuss later in the chapter.
1.1. Conjoint analysis
This method is one of the most widely used methods of stated preferences elicitation techniques.
Louviere (1988, p. 93) defines it as “decomposition into part-worth utilities or values of a set of individual evaluations of, or discrete choices form, a designed set of multi-attribute alternatives”. Conjoint analysis is largely used in marketing studies, geography, transportation and housing studies (Boxall et al., 1996; Batsell and Louviere, 1991).
Lancaster theory, discussed in the Chapter 1, is supported by early research of Green and Rao (1971, cited in Hauser and Rao, 2004) and describes the decomposition of preferences/utility for a product into partial contributions of product’s characteristics (both physical (quantitative) and qualitative (for example, services connected with products)).
In conjoint analysis, each choice situation consists of several products, where each product has different characteristics or attribute levels, including price (Batsell and Louviere, 1991). A respondent is asked to choose between these different product options (or rank them depending on the design of the questionnaire), according to his/her
2 The word « indirect » will be omitted further for simplicity, because we will consider only indirect stated preferences methods in this chapter.
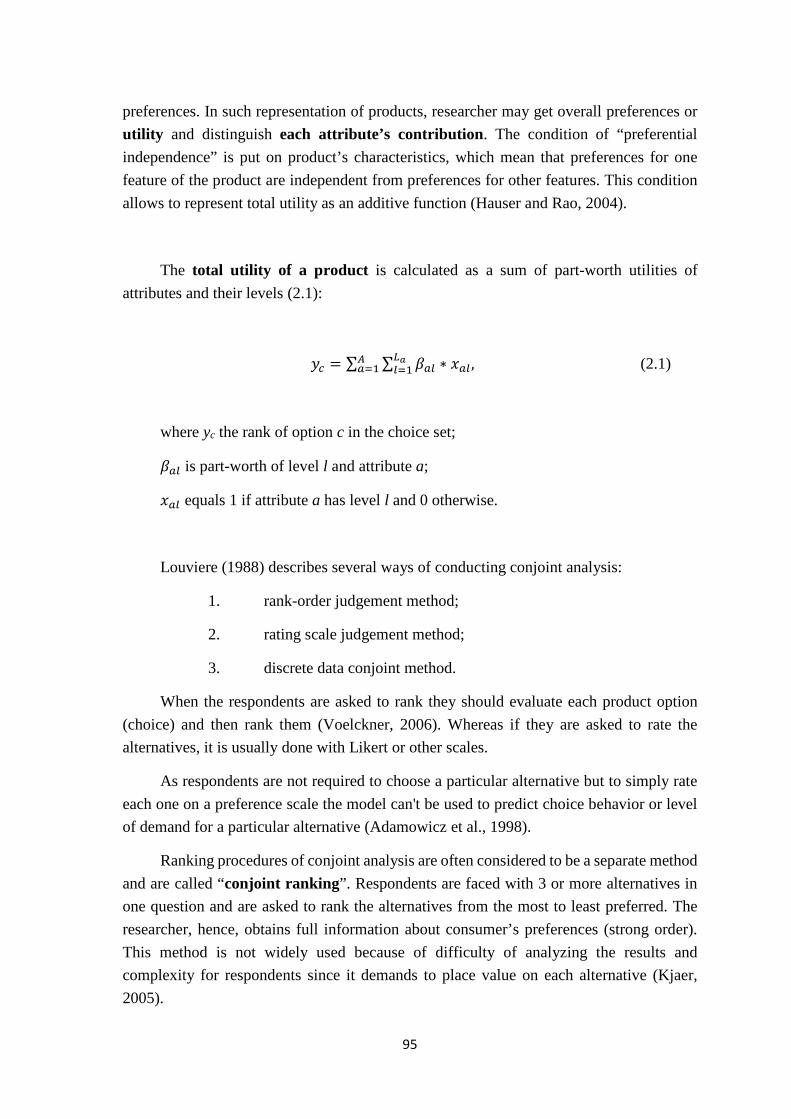
95
preferences. In such representation of products, researcher may get overall preferences or utility and distinguish each attribute’s contribution. The condition of “preferential independence” is put on product’s characteristics, which mean that preferences for one feature of the product are independent from preferences for other features. This condition allows to represent total utility as an additive function (Hauser and Rao, 2004).
The total utility of a product is calculated as a sum of part-worth utilities of attributes and their levels (2.1):
𝑦𝑦𝑐𝑐 = ∑ ∑ 𝛽𝛽𝑎𝑎𝑎𝑎 ∗ 𝑥𝑥𝑎𝑎𝑎𝑎 ,𝐿𝐿𝑎𝑎𝑎𝑎=1
𝐴𝐴𝑎𝑎=1 (2.1)
where yc the rank of option c in the choice set;
𝛽𝛽𝑎𝑎𝑎𝑎 is part-worth of level l and attribute a;
𝑥𝑥𝑎𝑎𝑎𝑎 equals 1 if attribute a has level l and 0 otherwise.
Louviere (1988) describes several ways of conducting conjoint analysis:
1. rank-order judgement method;
2. rating scale judgement method;
3. discrete data conjoint method.
When the respondents are asked to rank they should evaluate each product option (choice) and then rank them (Voelckner, 2006). Whereas if they are asked to rate the alternatives, it is usually done with Likert or other scales.
As respondents are not required to choose a particular alternative but to simply rate each one on a preference scale the model can't be used to predict choice behavior or level of demand for a particular alternative (Adamowicz et al., 1998).
Ranking procedures of conjoint analysis are often considered to be a separate method and are called “conjoint ranking”. Respondents are faced with 3 or more alternatives in one question and are asked to rank the alternatives from the most to least preferred. The researcher, hence, obtains full information about consumer’s preferences (strong order). This method is not widely used because of difficulty of analyzing the results and complexity for respondents since it demands to place value on each alternative (Kjaer, 2005).
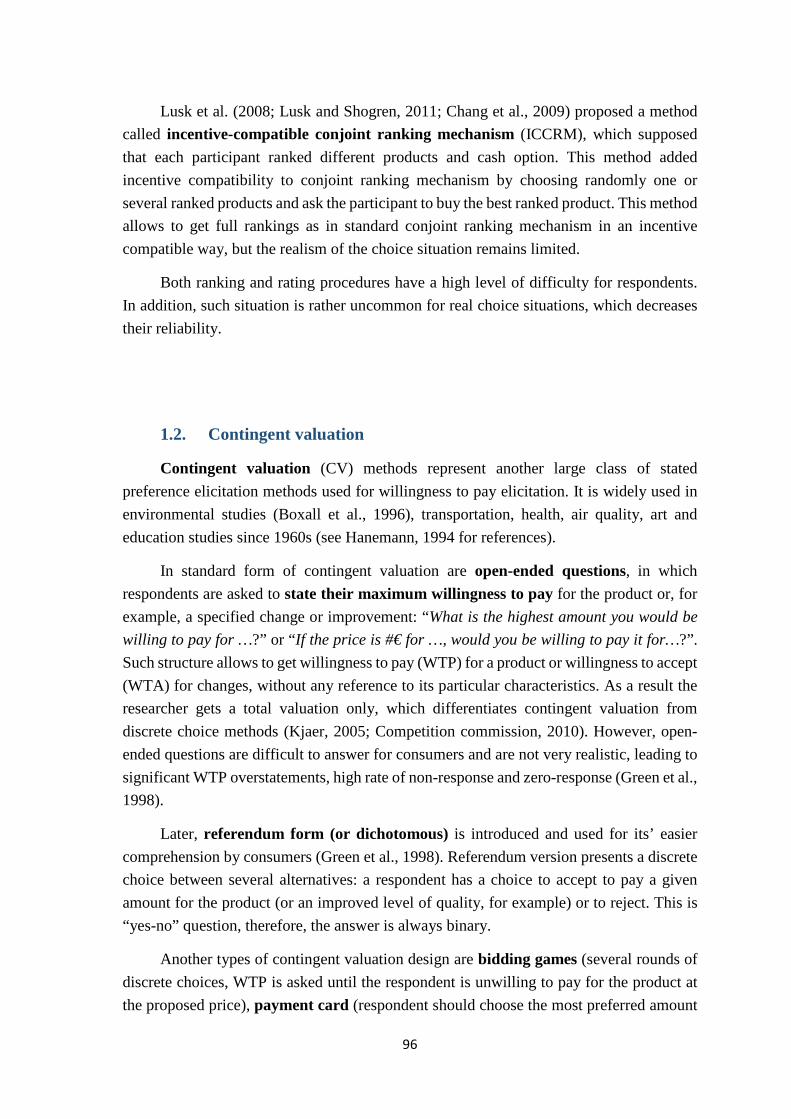
96
Lusk et al. (2008; Lusk and Shogren, 2011; Chang et al., 2009) proposed a method called incentive-compatible conjoint ranking mechanism (ICCRM), which supposed that each participant ranked different products and cash option. This method added incentive compatibility to conjoint ranking mechanism by choosing randomly one or several ranked products and ask the participant to buy the best ranked product. This method allows to get full rankings as in standard conjoint ranking mechanism in an incentive compatible way, but the realism of the choice situation remains limited.
Both ranking and rating procedures have a high level of difficulty for respondents. In addition, such situation is rather uncommon for real choice situations, which decreases their reliability.
1.2. Contingent valuation
Contingent valuation (CV) methods represent another large class of stated preference elicitation methods used for willingness to pay elicitation. It is widely used in environmental studies (Boxall et al., 1996), transportation, health, air quality, art and education studies since 1960s (see Hanemann, 1994 for references).
In standard form of contingent valuation are open-ended questions, in which respondents are asked to state their maximum willingness to pay for the product or, for example, a specified change or improvement: “What is the highest amount you would be willing to pay for …?” or “If the price is #€ for …, would you be willing to pay it for…?”. Such structure allows to get willingness to pay (WTP) for a product or willingness to accept (WTA) for changes, without any reference to its particular characteristics. As a result the researcher gets a total valuation only, which differentiates contingent valuation from discrete choice methods (Kjaer, 2005; Competition commission, 2010). However, open-ended questions are difficult to answer for consumers and are not very realistic, leading to significant WTP overstatements, high rate of non-response and zero-response (Green et al., 1998).
Later, referendum form (or dichotomous) is introduced and used for its’ easier comprehension by consumers (Green et al., 1998). Referendum version presents a discrete choice between several alternatives: a respondent has a choice to accept to pay a given amount for the product (or an improved level of quality, for example) or to reject. This is “yes-no” question, therefore, the answer is always binary.
Another types of contingent valuation design are bidding games (several rounds of discrete choices, WTP is asked until the respondent is unwilling to pay for the product at the proposed price), payment card (respondent should choose the most preferred amount
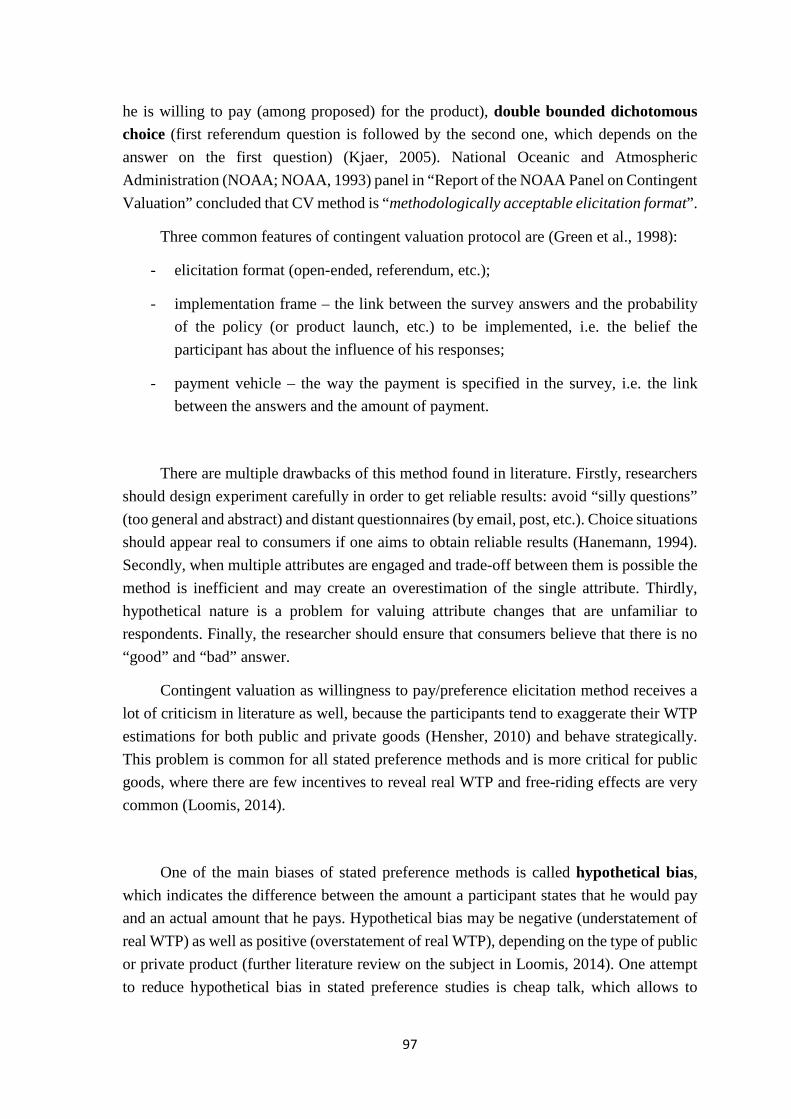
97
he is willing to pay (among proposed) for the product), double bounded dichotomous choice (first referendum question is followed by the second one, which depends on the answer on the first question) (Kjaer, 2005). National Oceanic and Atmospheric Administration (NOAA; NOAA, 1993) panel in “Report of the NOAA Panel on Contingent Valuation” concluded that CV method is “methodologically acceptable elicitation format”.
Three common features of contingent valuation protocol are (Green et al., 1998):
- elicitation format (open-ended, referendum, etc.);
- implementation frame – the link between the survey answers and the probability of the policy (or product launch, etc.) to be implemented, i.e. the belief the participant has about the influence of his responses;
- payment vehicle – the way the payment is specified in the survey, i.e. the link between the answers and the amount of payment.
There are multiple drawbacks of this method found in literature. Firstly, researchers should design experiment carefully in order to get reliable results: avoid “silly questions” (too general and abstract) and distant questionnaires (by email, post, etc.). Choice situations should appear real to consumers if one aims to obtain reliable results (Hanemann, 1994). Secondly, when multiple attributes are engaged and trade-off between them is possible the method is inefficient and may create an overestimation of the single attribute. Thirdly, hypothetical nature is a problem for valuing attribute changes that are unfamiliar to respondents. Finally, the researcher should ensure that consumers believe that there is no “good” and “bad” answer.
Contingent valuation as willingness to pay/preference elicitation method receives a lot of criticism in literature as well, because the participants tend to exaggerate their WTP estimations for both public and private goods (Hensher, 2010) and behave strategically. This problem is common for all stated preference methods and is more critical for public goods, where there are few incentives to reveal real WTP and free-riding effects are very common (Loomis, 2014).
One of the main biases of stated preference methods is called hypothetical bias, which indicates the difference between the amount a participant states that he would pay and an actual amount that he pays. Hypothetical bias may be negative (understatement of real WTP) as well as positive (overstatement of real WTP), depending on the type of public or private product (further literature review on the subject in Loomis, 2014). One attempt to reduce hypothetical bias in stated preference studies is cheap talk, which allows to
98
familiarize respondents with the problem of hypothetical bias before asking actual hypothetical questions. The participants are openly informed about the existence and the reasons of hypothetical bias, which allows to significantly diminish it in practice (Competition Commission, 2010). Another possible approaches of ex ante reduction of hypothetical bias are careful explanation of consequences of the current experiment for population and researchers (policy measures, product exaggerated market influence, and so forth) and honesty statements, signed before the beginning of the experiment.
Similarly, there exists ex post correction of hypothetical bias by calibration techniques, which consists of asking the participants how sure are they about their stated WTP (also called “uncertainty recording”) and adjusting the answers according to the calibration factor. Another way to calibrate answers is to obtain WTP for the same product with a revealed preferences method (validity test) and calculate calibration factor (ration of real and hypothetical WTPs), which subsequently apply for all answers. Certainly, this method has its limits, especially for public goods.
1.3. Discrete choice analysis
Discrete choice analysis3 has been initially used by psychologists in 1960s and then has been implemented in marketing, environmental (Hoyos, 2010) and economic research studies (Bliemer et al., 2009, Rose and Bliemer, 2009). With the rapid development of technologies, innovations and increasing amount of new products introduced to the market, marketers are preoccupied by such questions as: whether consumers will buy a product, at which price and how they will react to changes in available alternatives (new features, innovative products and improvements/upgrades). In general, most of everyday decisions made by consumer represent a discrete choice between several alternatives, so the wide use of this stated preference method of value elicitation is quite intuitive. It allows to better understand the trade-offs between different attributes of the product, being consistent with Lancaster microeconomic theory of value. Another not less important reason of discrete choice models’ popularity is their low level of cognitive complexity for respondents (Kjaer, 2005). Experimental side (i.e. design) of discrete choice analysis is also an advantage, which would be discussed later in the chapter.
Depending on the type of consumption decision to make the design of discrete choice analysis may vary (Carson et al., 1994):
3 Named also as choice experiments or choice analysis in literature.
99
- a choice of an alternative among the available choice set (statistical models for discrete choice data);
- a decision on whether to buy or not the product and, if yes, in which quantity (statistical models for count data);
- a decision on time periods between purchases (statistical models for duration data).
Most frequently discrete choice analysis ask the respondents to choose one alternative (first ranking) from researcher-defined set of alternatives, where each alternative is described by multiple attributes. Each alternative has different levels of attributes, predefined by experimental design. Usually, it is impossible to include all product’s attributes, so, the researcher takes a decision to include the most important attributes, according to previous research results, pilot studies or expert opinions (Kløjgaard et al., 2012).
Choice set has two or more alternatives and is usually, but not obligatory, fixed among all participants.
Train (2009) defines three characteristics of discrete choice sets:
- alternatives are mutually exclusive;
- choice set is exhaustive;
- number of alternatives is finite.
Discrete choice method has numerous potential strengths over other stated preferences techniques for elicitation consumer WTP for a product or a service. One of them is that respondents are asked to make a choice between several alternatives explained by precise attributes, which allow to better describe each choice option (Boxall et al., 1996). It forces a consumer to make a trade-off between different attributes and their levels. Therefore, a respondent’s choice may be explained by valuation of particular attributes and their changes. It makes possible to estimate WTP for attributes and marginal rates of attributes’ substitution (Louviere et al., 2010; Kjaer, 2005). Then, it enables welfare impacts to be estimated for multiple scenarios, i.e. different levels of utility (satisfaction) obtained from each choice.
Cost (price) attribute has a particular role in discrete choice experiments, because its presence allows to get WTP for a product and for each attribute. WTP for a particular attribute is called marginal or part-worth WTP (Kjaer, 2005), which is a marginal rate of
100
substitution4, i.e. trade-offs between attributes and their mutual importance. Hence, discrete choice analysis can be used to estimate the level of customer demand for non-price attributes which are measured in non-monetary terms. It means that the researcher may obtain WTP for one unit (degree, kg, Watt, pollution level, etc.) change of any possible attribute.
In addition, summing up the part worth utilities allows to estimate a total WTP for the product, which is not present for choice during the experimental session.
And lastly, discrete choice method reduces incentives to behave strategically (Centre for International Economics, 2001), by forcing the participants to think over the trade-offs between the attributes, which avoids a simple “yes” to any proposed choice.
Theoretically discrete choice models are based on Lancaster’s theory of value (1966) and random utility models, based on random utility theory - RUT, (Marschak, 1960; Manski and McFadden, 1981; McFadden and Train, 2000; Train , 2009). RUT explains consumer behavior with regards to economic theory.
Neoclassical economic theory assumes that individual is capable to rank and choose alternatives in well-defined and consistent manner (Kjaer, 2005). It means that in case of repeated choice one will choose the same alternative if its characteristics are unchanged. Researcher in turn has no knowledge about individual’s true utility function and individual’s choices reflect this utility function only partially (observable utility). Hence, total utility function is represented by observed utility part (or representative utility, i.e. all factors, which influence choice and are controlled by researcher) and unobserved random utility or error term (Louviere et al., 2000; Adamowitz et al., 1994; Ida, 2009):
𝑈𝑈𝑖𝑖 = 𝑉𝑉𝑖𝑖 + 𝜀𝜀𝑖𝑖, (2.2)
Where Ui is total utility of i alternative; Vi is observable component of utility and εi is unobservable factor (random component).
Unobservable part of utility occurs, when the factors not taken into account (not visible or random) participate in decision-making process. Another explanation treats the unobservable utility term as a consumer heterogeneity in tastes for unobserved product characteristics (Fiebig et al., 2009). It is extreme-value Gumbel distributed and iid
4 We will come back to this question later in the chapter.
101
(independent and identically distributed) and distributed according to a particular probability distribution (Batsell and Luoviere, 1991).
Random utility theory supposes that there are four sources of randomness:
- measurement errors and imperfect information;
- instrumental variables (closely related variables);
- unobserved variables;
- unobserved preference variation (i.e. heterogeneous preferences).
In his Nobel Prize lecture McFadden (2001, p. 353) cites Simon’s (1978) words saying that “The rational man of economics is a maximizer, who will settle for nothing less than the best”. In choice models, based on random utility models, as already said, individual acts rationally i.e. maximizes his utility (Train, 2009). Then, the probability that the alternative i will be chosen is (2.3):
𝑃𝑃𝑖𝑖 = 𝑃𝑃𝑃𝑃𝑃𝑃𝑃𝑃(𝑈𝑈𝑖𝑖 − 𝑈𝑈𝑗𝑗) = 𝑃𝑃𝑃𝑃𝑃𝑃𝑃𝑃(𝑉𝑉𝑖𝑖 + 𝜀𝜀𝑖𝑖 > 𝑉𝑉𝑗𝑗 + 𝜀𝜀𝑗𝑗) = 𝑃𝑃𝑃𝑃𝑃𝑃𝑃𝑃(𝑉𝑉𝑖𝑖 − 𝑉𝑉𝑗𝑗 > 𝜀𝜀𝑗𝑗 − 𝜀𝜀𝑖𝑖),∀𝑖𝑖 ≠ 𝑗𝑗 (2.3)
The probability in (2.3) explains that the difference between the random utility parts of alternatives j and i is less than the difference between the observed utility parts of alternatives i and j for all alternatives in the choice set. These probabilities are nonnegative and the sum of probabilities for all alternatives of the choice set equal to 1. In random utility models, only the difference between utilities matter, an absolute term does not matter neither for a consumer, nor for the researcher (Train, 2009). In addition, only parameters; which can be estimated capture this difference in utilities.
Different estimation models may be applied to random utility models, assuming different specifications of the density of unobserved utility term (Train, 2009).
The most general and widely used estimation model is multinomial logit model (MNL). The probability of a specific alternative i to be chosen from a set of alternatives can be described by multinomial logit model as following:
𝑃𝑃𝐶𝐶𝑖𝑖 = exp (𝑉𝑉𝑖𝑖)∑ exp(𝑉𝑉𝑗𝑗)𝑗𝑗𝑗𝑗𝑗𝑗
, (2.4)
where C is a set of alternatives, including alternatives i and j.
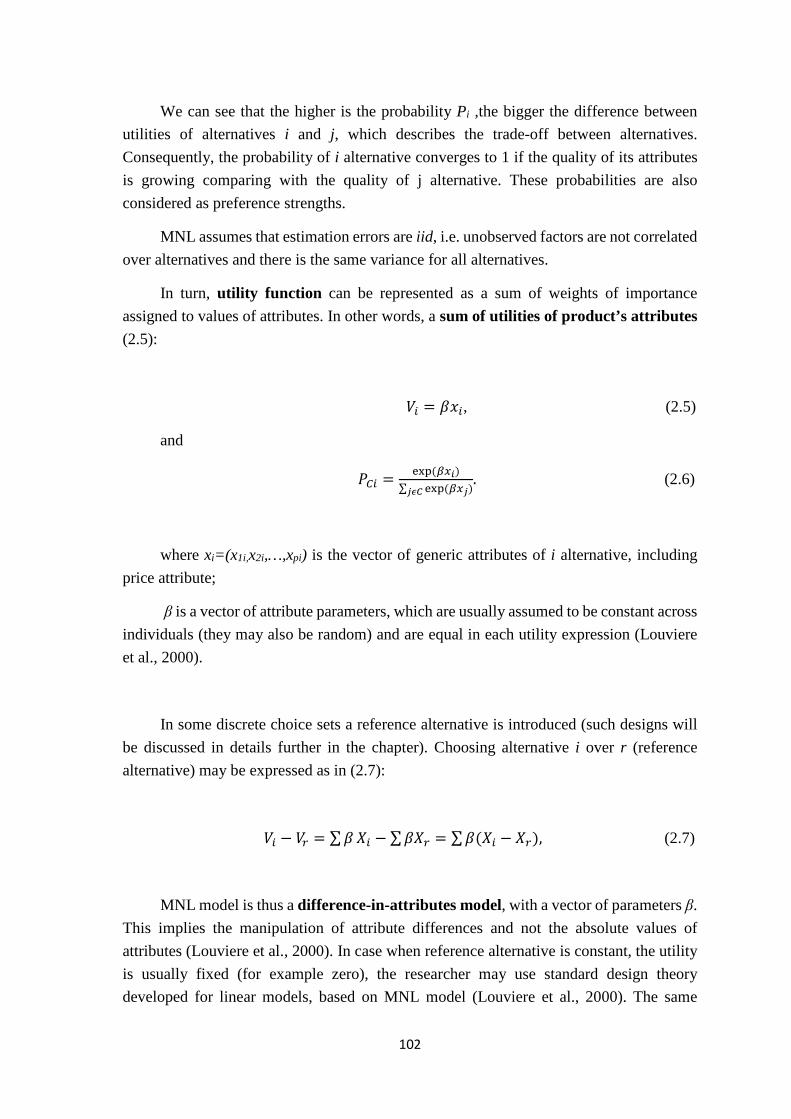
102
We can see that the higher is the probability Pi ,the bigger the difference between utilities of alternatives i and j, which describes the trade-off between alternatives. Consequently, the probability of i alternative converges to 1 if the quality of its attributes is growing comparing with the quality of j alternative. These probabilities are also considered as preference strengths.
MNL assumes that estimation errors are iid, i.e. unobserved factors are not correlated over alternatives and there is the same variance for all alternatives.
In turn, utility function can be represented as a sum of weights of importance assigned to values of attributes. In other words, a sum of utilities of product’s attributes (2.5):
𝑉𝑉𝑖𝑖 = 𝛽𝛽𝑥𝑥𝑖𝑖, (2.5)
and
𝑃𝑃𝐶𝐶𝑖𝑖 = exp (𝛽𝛽𝛽𝛽𝑖𝑖)∑ exp(𝛽𝛽𝛽𝛽𝑗𝑗)𝑗𝑗𝑗𝑗𝑗𝑗
. (2.6)
where xi=(x1i,x2i,…,xpi) is the vector of generic attributes of i alternative, including price attribute;
β is a vector of attribute parameters, which are usually assumed to be constant across individuals (they may also be random) and are equal in each utility expression (Louviere et al., 2000).
In some discrete choice sets a reference alternative is introduced (such designs will be discussed in details further in the chapter). Choosing alternative i over r (reference alternative) may be expressed as in (2.7):
𝑉𝑉𝑖𝑖 − 𝑉𝑉𝑟𝑟 = ∑𝛽𝛽𝑋𝑋𝑖𝑖 − ∑𝛽𝛽𝑋𝑋𝑟𝑟 = ∑𝛽𝛽(𝑋𝑋𝑖𝑖 − 𝑋𝑋𝑟𝑟), (2.7)
MNL model is thus a difference-in-attributes model, with a vector of parameters β. This implies the manipulation of attribute differences and not the absolute values of attributes (Louviere et al., 2000). In case when reference alternative is constant, the utility is usually fixed (for example zero), the researcher may use standard design theory developed for linear models, based on MNL model (Louviere et al., 2000). The same
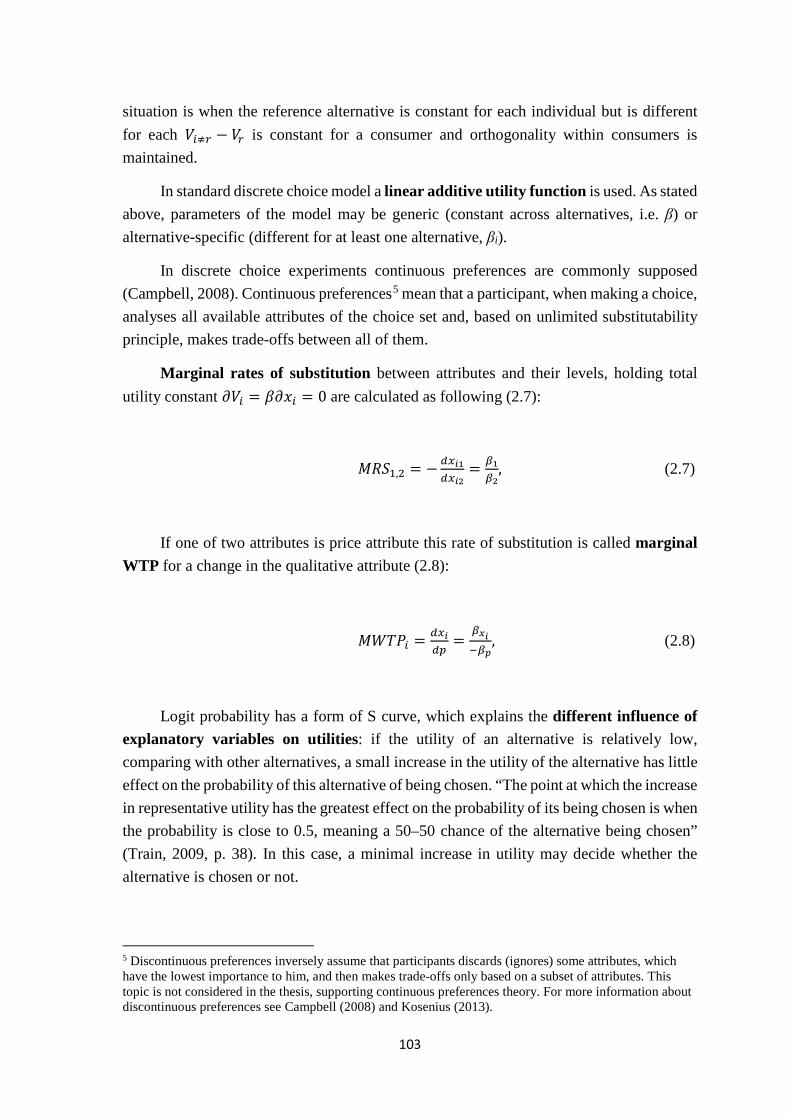
103
situation is when the reference alternative is constant for each individual but is different for each 𝑉𝑉𝑖𝑖≠𝑟𝑟 − 𝑉𝑉𝑟𝑟 is constant for a consumer and orthogonality within consumers is maintained.
In standard discrete choice model a linear additive utility function is used. As stated above, parameters of the model may be generic (constant across alternatives, i.e. β) or alternative-specific (different for at least one alternative, βi).
In discrete choice experiments continuous preferences are commonly supposed (Campbell, 2008). Continuous preferences5 mean that a participant, when making a choice, analyses all available attributes of the choice set and, based on unlimited substitutability principle, makes trade-offs between all of them.
Marginal rates of substitution between attributes and their levels, holding total utility constant 𝜕𝜕𝑉𝑉𝑖𝑖 = 𝛽𝛽𝜕𝜕𝑥𝑥𝑖𝑖 = 0 are calculated as following (2.7):
𝑀𝑀𝑀𝑀𝑀𝑀1,2 = −𝑑𝑑𝛽𝛽𝑖𝑖1𝑑𝑑𝛽𝛽𝑖𝑖2
= 𝛽𝛽1𝛽𝛽2
, (2.7)
If one of two attributes is price attribute this rate of substitution is called marginal WTP for a change in the qualitative attribute (2.8):
𝑀𝑀𝑀𝑀𝑀𝑀𝑃𝑃𝑖𝑖 = 𝑑𝑑𝛽𝛽𝑖𝑖𝑑𝑑𝑑𝑑
=𝛽𝛽𝑥𝑥𝑖𝑖−𝛽𝛽𝑝𝑝
, (2.8)
Logit probability has a form of S curve, which explains the different influence of explanatory variables on utilities: if the utility of an alternative is relatively low, comparing with other alternatives, a small increase in the utility of the alternative has little effect on the probability of this alternative of being chosen. “The point at which the increase in representative utility has the greatest effect on the probability of its being chosen is when the probability is close to 0.5, meaning a 50–50 chance of the alternative being chosen” (Train, 2009, p. 38). In this case, a minimal increase in utility may decide whether the alternative is chosen or not.
5 Discontinuous preferences inversely assume that participants discards (ignores) some attributes, which have the lowest importance to him, and then makes trade-offs only based on a subset of attributes. This topic is not considered in the thesis, supporting continuous preferences theory. For more information about discontinuous preferences see Campbell (2008) and Kosenius (2013).
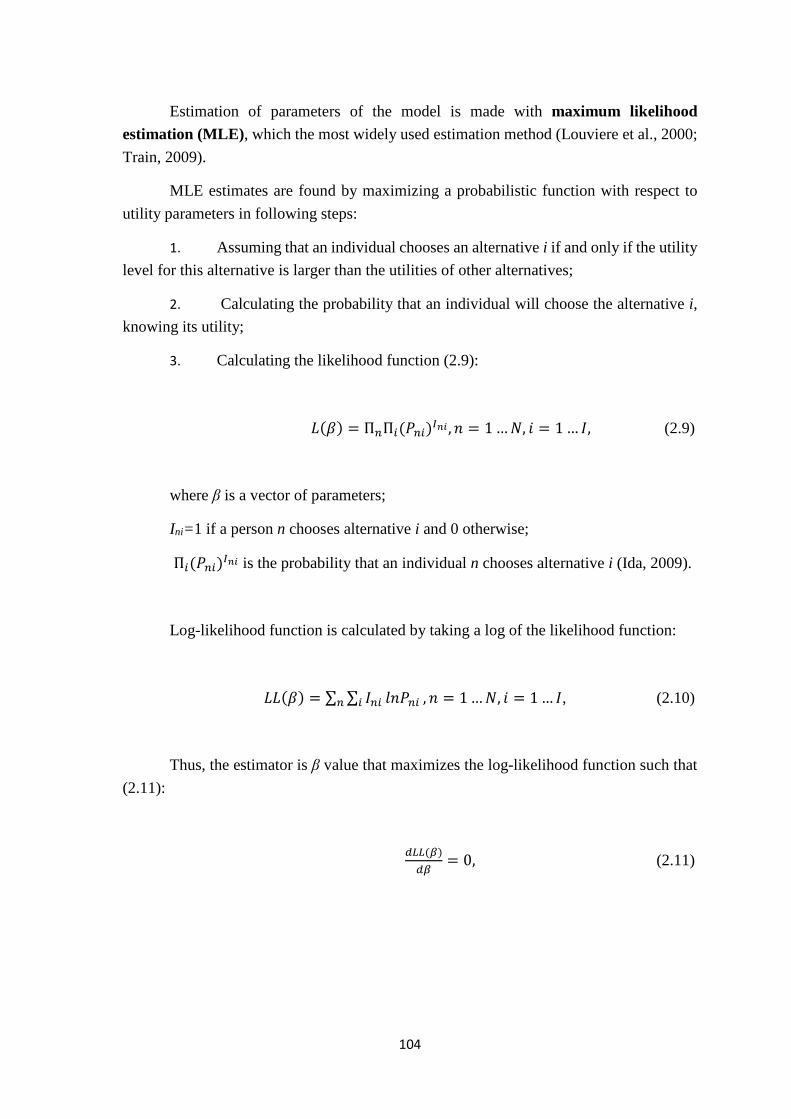
104
Estimation of parameters of the model is made with maximum likelihood estimation (MLE), which the most widely used estimation method (Louviere et al., 2000; Train, 2009).
MLE estimates are found by maximizing a probabilistic function with respect to utility parameters in following steps:
1. Assuming that an individual chooses an alternative i if and only if the utility level for this alternative is larger than the utilities of other alternatives;
2. Calculating the probability that an individual will choose the alternative i, knowing its utility;
3. Calculating the likelihood function (2.9):
𝐿𝐿(𝛽𝛽) = Π𝑛𝑛Π𝑖𝑖(𝑃𝑃𝑛𝑛𝑖𝑖)𝐼𝐼𝑛𝑛𝑖𝑖 ,𝑛𝑛 = 1 …𝑁𝑁, 𝑖𝑖 = 1 … 𝐼𝐼, (2.9)
where β is a vector of parameters;
Ini=1 if a person n chooses alternative i and 0 otherwise;
Π𝑖𝑖(𝑃𝑃𝑛𝑛𝑖𝑖)𝐼𝐼𝑛𝑛𝑖𝑖 is the probability that an individual n chooses alternative i (Ida, 2009).
Log-likelihood function is calculated by taking a log of the likelihood function:
𝐿𝐿𝐿𝐿(𝛽𝛽) = ∑ ∑ 𝐼𝐼𝑛𝑛𝑖𝑖𝑖𝑖 𝑙𝑙𝑛𝑛𝑃𝑃𝑛𝑛𝑖𝑖𝑛𝑛 ,𝑛𝑛 = 1 …𝑁𝑁, 𝑖𝑖 = 1 … 𝐼𝐼, (2.10)
Thus, the estimator is β value that maximizes the log-likelihood function such that (2.11):
𝑑𝑑𝐿𝐿𝐿𝐿(𝛽𝛽)𝑑𝑑𝛽𝛽
= 0, (2.11)
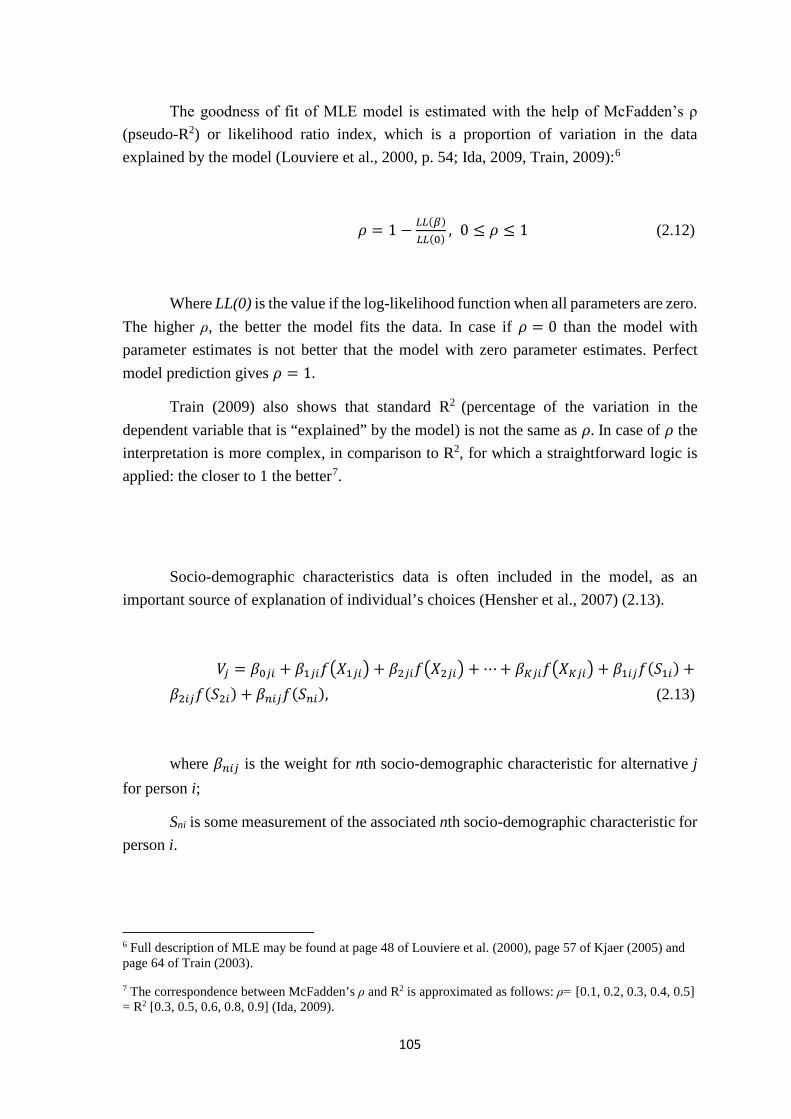
105
The goodness of fit of MLE model is estimated with the help of McFadden’s ρ (pseudo-R2) or likelihood ratio index, which is a proportion of variation in the data explained by the model (Louviere et al., 2000, p. 54; Ida, 2009, Train, 2009):6
𝜌𝜌 = 1 − 𝐿𝐿𝐿𝐿(𝛽𝛽)𝐿𝐿𝐿𝐿(0) , 0 ≤ 𝜌𝜌 ≤ 1 (2.12)
Where LL(0) is the value if the log-likelihood function when all parameters are zero. The higher ρ, the better the model fits the data. In case if 𝜌𝜌 = 0 than the model with parameter estimates is not better that the model with zero parameter estimates. Perfect model prediction gives 𝜌𝜌 = 1.
Train (2009) also shows that standard R2 (percentage of the variation in the dependent variable that is “explained” by the model) is not the same as 𝜌𝜌. In case of 𝜌𝜌 the interpretation is more complex, in comparison to R2, for which a straightforward logic is applied: the closer to 1 the better7.
Socio-demographic characteristics data is often included in the model, as an important source of explanation of individual’s choices (Hensher et al., 2007) (2.13).
𝑉𝑉𝑗𝑗 = 𝛽𝛽0𝑗𝑗𝑖𝑖 + 𝛽𝛽1𝑗𝑗𝑖𝑖𝑓𝑓�𝑋𝑋1𝑗𝑗𝑖𝑖� + 𝛽𝛽2𝑗𝑗𝑖𝑖𝑓𝑓�𝑋𝑋2𝑗𝑗𝑖𝑖� + ⋯+ 𝛽𝛽𝐾𝐾𝑗𝑗𝑖𝑖𝑓𝑓�𝑋𝑋𝐾𝐾𝑗𝑗𝑖𝑖� + 𝛽𝛽1𝑖𝑖𝑗𝑗𝑓𝑓(𝑀𝑀1𝑖𝑖) +𝛽𝛽2𝑖𝑖𝑗𝑗𝑓𝑓(𝑀𝑀2𝑖𝑖) + 𝛽𝛽𝑛𝑛𝑖𝑖𝑗𝑗𝑓𝑓(𝑀𝑀𝑛𝑛𝑖𝑖), (2.13)
where 𝛽𝛽𝑛𝑛𝑖𝑖𝑗𝑗 is the weight for nth socio-demographic characteristic for alternative j for person i;
Sni is some measurement of the associated nth socio-demographic characteristic for person i.
6 Full description of MLE may be found at page 48 of Louviere et al. (2000), page 57 of Kjaer (2005) and page 64 of Train (2003).
7 The correspondence between McFadden’s ρ and R2 is approximated as follows: ρ= [0.1, 0.2, 0.3, 0.4, 0.5] = R2 [0.3, 0.5, 0.6, 0.8, 0.9] (Ida, 2009).
106
As socio-demographic characteristics don’t vary across alternatives it is possible to drop index j.
By this equation Hensher et al. (2007, p. 98) show explicitly that while a socio-demographic characteristic is equal across alternatives, their weight may be “significant predictor for some alternatives but not for others.” At the same time the weights of attributes of alternatives (index i) may vary across individuals.
Model estimation, including socio-demographic characteristics allows to obtain segmentation analysis within population and their reactions to changes in attribute levels.
The development of MNL model – the most used one, has incepted the wide development of other estimation models with different hypotheses. Chapter 4 presents a discrete choice experiment, where several (other than MNL) estimation models are described and used.
Referencing or pivot design of discrete choice analysis
The ubiquitous use of stated preference methods in marketing and consumer studies is already demonstrated earlier in the chapter. The growing interest has been emerging recently around combining stated and revealed preference data (discussed further in the chapter): researchers tend to increase the validity of stated preference data by introducing real data, revealed preference elicitation methods (as a part of stated preference methods’ techniques), increasing context parameter of experiments, etc. However, what a researcher may do in order to increase the significance and the accuracy of stated preference methods’ results, when the use of revealed preference methods is impossible (due to the absence of the product, budget and sample size constraints, etc.)? Another stated preference method has gained attention and is meant to cope with this issue: pivot discrete choice analysis (or also called experiment in literature), where the alternatives are pivoted around the information basis available to the respondents (Hess and Rose, 2009; Hensher, 2010; Hess et al., 2006; Hensher et al., 2007). Different theories in economics, psychology and decision theory among others prove the necessity of knowledge basis for making stated choice decisions in artificial (laboratory) environment for unknown choice options (Hess and Ross, 2009; Kahneman and Tversky, 1979). Kahneman and Tversky (1979) state that usually people, to facilitate their choice process, evaluate alternatives like gains or losses according to their reference point (choice), so conducting an experiment with pivot design an experimentalist may create a consumers' basis of comparison for other unknown or unfamiliar alternatives.
107
Referencing or pivot design has first been used in transportation choice research. Making people deviate from their habitual choices increases the importance of considering other alternatives proposed. Each choice, having several attribute levels, is analyzed on the basis of the reference choice - habitual, which represents a "no choice/ take nothing" option or opt-out discussed above. This reference alternative is constant for all choice situations. Therefore, pivoting is one way to promote relevancy in attribute levels (Hensher, 2010).
When talking about innovative characteristics, this is the way to facilitate participants' choice referring to the product which exists and they do have it (Kaenzig and Wustenhagen, 2010). Referencing creates a context of the choice and is an important determinant of it. Taking transport choices as an example, if a person A takes the bus every morning to go to work and it takes him/her 25 minutes, other options (and their attribute levels) should be proposed with the reference to his/her current choice (time and type of transport) to make him/her switch.
To analyze experiments with referencing alternative (which may imply endogeneity of other alternatives) using a mixed logit model is advised. It is supposed that hypothetical alternatives are more correlated with each other, than with the reference alternative (Hess and Ross, 2009). In addition, there is an evident non-independence between reference alternative and others, because other alternatives are chosen conditionally on the reference (Train and Wilson, 2008).
Chapter 4 presents a pivot choice experiments which uses mixed logit models, which relax the assumption of the independence of irrelevant alternatives by modeling preference heterogeneity, and scaled and generalized MNL models, which both scale and preference heterogeneities.
108
2. Designing stated preference value elicitation method
Product or service which contributes positively to the well-being of individual has an economic value. As stated in Chapter 1 economic value, an amount at which an individual is willing to trade for a good or service, is captured by “willingness to pay” and “willingness to accept” notions.
By way of reminder, both use and non-use parts of the economic value are estimated through the discrete choice analysis. In consumer studies discrete choice analysis is often discussed as discrete choice experiments. The reason of this misidentification of discrete choice analysis (as a revealed preference method, see Figure 2.1) is that the environment of discrete choice treatments is artificial, i.e. created by the researcher, as in revealed preference laboratory experiments and auctions. Therefore, we discuss discrete choice analysis design as an experimental design not mistakenly.
Particularly, discrete choice analysis methods are increasingly used in experimental settings to estimate WTP/WTA for added value of novel products or product’s attributes, trying to optimize the efficiency of new product development processes and to access to consumers’ preferences for innovations. Marketing application of experimental methods gains popularity with the growing consistency of estimates (review in Lusk et al., 2004; Carson et al., 1994).
In terms of experimental economics products or services not currently presented on the marketplace (or there is no marketplace for such goods) are called non-market goods and include new products; both private and public. Willingness to pay for such products can only be measured with the help of stated preferences methods on hypothetical markets, created by researchers.
Previous section explains the reasons why discrete choice methods of preference and willingness to pay elicitation gain more and more popularity, contrary to contingent valuation methods used before for such studies. This section will discuss experimental concept and design of stated preferences methods used for the estimation of new products’ values.
Discrete choice experimental design has several properties according to Louviere et al. (2000): (1) identification and precision (from statistical point of view); (2) realism and complexity (non-statistical properties). Even in case of hypothetical markets (experimental environments) participants tend to give more honest and exact answers due to the increased realism of situation.
109
2.1. Experimental view on the estimation of willingness to pay
A great part of experimental and discrete choice methods aims to elicit willingness to pay for a new product/service or for an improvement. Theoretically WTP and marginal substitution rates have been discussed above in the chapter, further we discuss the topic from the point of view of discrete choice analysis.
WTP corresponds to an amount an individual would like to pay and when it is subtracted from individual’s income, it makes him indifferent to paying for the product, service or improvement.
Consumer’s evaluation of a new good/service or an improvement – WTP is calculated as a difference between utilities (2.14):
𝑣𝑣(𝑃𝑃,𝑦𝑦 −𝑀𝑀𝑀𝑀𝑃𝑃, 𝑞𝑞1) = 𝑣𝑣(𝑃𝑃,𝑦𝑦, 𝑞𝑞0), (2.14)
where q1 and q0 is a good’s 1 and 0 quality;
y is a budget constraint;
P is a market price.
Discrete choice analysis also allows the estimation of willingness to accept (WTA), which is an amount an individual is willing to accept for the reduction in the quality of a good or a service an individual owns. In this case the value of quality degradation equals (2.15):
𝑣𝑣(𝑃𝑃,𝑦𝑦 + 𝑀𝑀𝑀𝑀𝑊𝑊, 𝑞𝑞0) = 𝑣𝑣(𝑃𝑃, 𝑦𝑦, 𝑞𝑞1), (2.15)
Thus, adding this amount to consumer’s income will make him indifferent to having a worse quality of the product (Lusk and Shogren, 2007).
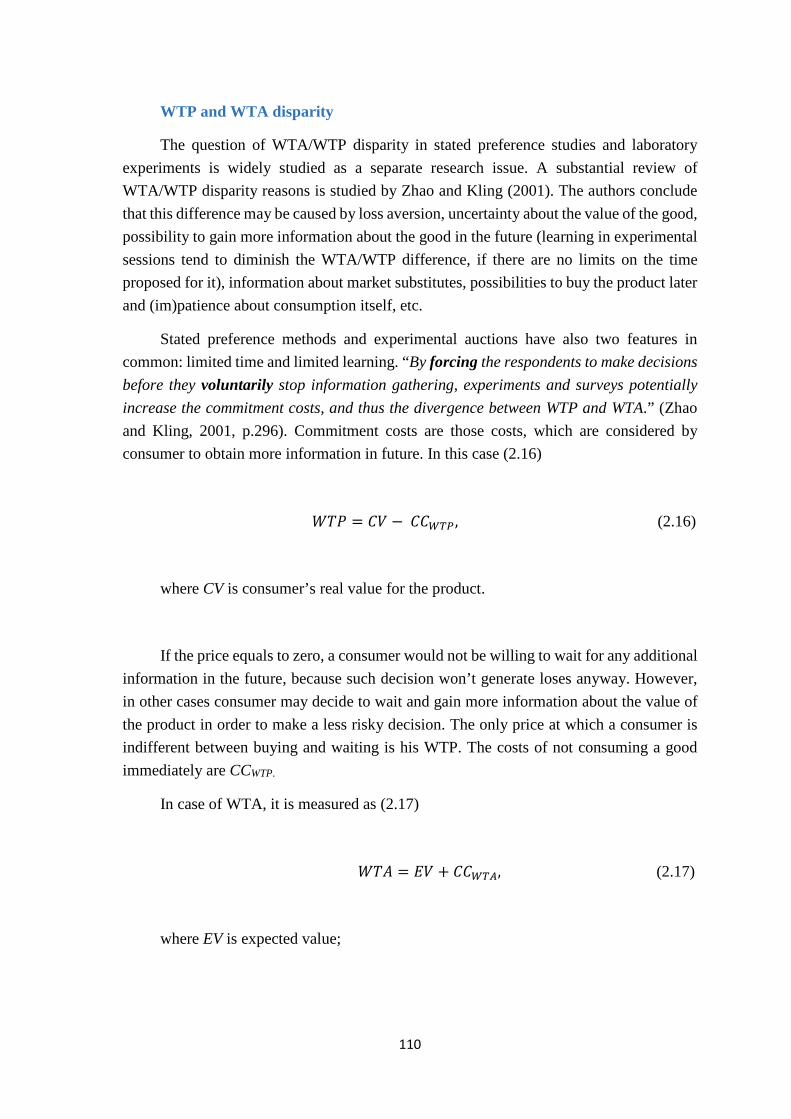
110
WTP and WTA disparity
The question of WTA/WTP disparity in stated preference studies and laboratory experiments is widely studied as a separate research issue. A substantial review of WTA/WTP disparity reasons is studied by Zhao and Kling (2001). The authors conclude that this difference may be caused by loss aversion, uncertainty about the value of the good, possibility to gain more information about the good in the future (learning in experimental sessions tend to diminish the WTA/WTP difference, if there are no limits on the time proposed for it), information about market substitutes, possibilities to buy the product later and (im)patience about consumption itself, etc.
Stated preference methods and experimental auctions have also two features in common: limited time and limited learning. “By forcing the respondents to make decisions before they voluntarily stop information gathering, experiments and surveys potentially increase the commitment costs, and thus the divergence between WTP and WTA.” (Zhao and Kling, 2001, p.296). Commitment costs are those costs, which are considered by consumer to obtain more information in future. In this case (2.16)
𝑀𝑀𝑀𝑀𝑃𝑃 = 𝐶𝐶𝑉𝑉 − 𝐶𝐶𝐶𝐶𝑊𝑊𝑊𝑊𝑊𝑊, (2.16)
where CV is consumer’s real value for the product.
If the price equals to zero, a consumer would not be willing to wait for any additional information in the future, because such decision won’t generate loses anyway. However, in other cases consumer may decide to wait and gain more information about the value of the product in order to make a less risky decision. The only price at which a consumer is indifferent between buying and waiting is his WTP. The costs of not consuming a good immediately are CCWTP.
In case of WTA, it is measured as (2.17)
𝑀𝑀𝑀𝑀𝑊𝑊 = 𝐸𝐸𝑉𝑉 + 𝐶𝐶𝐶𝐶𝑊𝑊𝑊𝑊𝐴𝐴, (2.17)
where EV is expected value;

111
CCwta is commitment costs associated with the selling decision8 (Zhao and Kling, 2001).
These two commitment costs create the divergence of WTP and WTA.
There also exists a disparity between WTP, WTA and actual data. The issue was discussed during NOAA panel about contingent valuation and hypothetical experiments (List and Gallet, 2001; NOAA, 1993). NOAA panel recommended that hypothetical statements should be calibrated, i.e. divided by 2 or by using actual market data. The empirical literature review suggests that calibrating factor ranges from 1 to 10 (literature review in List and Gallet, 2001) and tends to be larger for WTA studies than for WTP studies. Similarly, the factor is larger for public goods versus private, and for within-subjects experimental design versus between-subjects design (List and Gallet, 2001). The authors also state that Vickrey auction has less disparities between hypothetical and actual data than other experimental mechanisms.
2.2. Practical issues of the elicitation mechanism design
When designing an experimental session, either for a revealed or for a stated preference elicitation method the researcher creates an artificial environment, where he controls the conditions, chooses a product or a service of the study, its attributes, avoids possible noise and isolates the changes in the variable of interest by variation of particular attributes’ levels.
The researcher has to take care of numerous issues: alternatives, determination of choice set, number of participants, type of discrete choice experiment, number of questions (experimental design of the choice set) and pre-treatment issues and learning, day and time of the experimental sessions, etc. These steps are described one after another in this section.
1. Alternatives
The set of alternatives, defined by a researcher, may consist of labeled (alternative-specific) or unlabeled (generic) alternatives. Hensher et al. (2005) state that one of the advantages of unlabeled experiments is that the researcher has no need to identify each
8 If a person owns a product, which is unique or will be difficult to buy again (for example, environmental goods or a product unavailable outside of the experimental treatment) commitment costs may be present and rather high.
112
alternative within the set of alternatives. Thus, the only identification of each alternative is made by varying the levels of attributes. In addition, in labeled experiments the name of the alternative may become an attribute of it. For example, a well-known brand of soda may be an influential criterion of choice versus an unknown small brand. Therefore, the decision on whether to label alternatives or not depends on the goal of research and its hypotheses.
2. Choice set determination
Use of all possible configurations of variables and their levels leads to creation of full factorial design. In such designs, each attribute’s level and each attribute are crossed to obtain a product, i.e. a choice alternative (Lusk and Shogren, 2007; Metrics, 2012).
Full factorial designs allow to estimate the effects of changes of all attributes, however, with the growth of the number of attributes and their levels the estimation and the conducting of such experiments becomes difficult or impossible. Imagine the case of three attributes with two levels each. The number of possible products equals to 23=8 and in case of three attributes with 3 levels each it arises to 27 products combinations. Therefore, the number of experimental treatments is usually too high to be conducted.
The total number of products of the full factorial design (𝑃𝑃𝐹𝐹𝐹𝐹) is calculated as follows (2.18):
𝑃𝑃𝐹𝐹𝐹𝐹 = ∏ ∏ 𝑙𝑙𝑗𝑗𝑗𝑗𝐾𝐾𝑗𝑗=1
𝐽𝐽𝑗𝑗=1 , (2.18)
where j is an alternative9,
k is an attribute, which has ljk levels.
Each alternative is usually described by numerous attributes, however, the researcher is usually interested in measuring consumers’ preferences for the changes in only some of them. In order to estimate the effects of the changes of interest with lower number of treatments fractional factorial designs are used. Such designs represent a subset of full factorial designs (Hoyos, 2010). Commonly used fractional factorial design is main-effects design, where all linear (main) effects are separately identifiable. In other words, only higher order effects are taken into account. Interaction effects are minimized. In case of three attributes with two levels each only four treatments are identified.
9 As in discrete choice experiments an individual makes a choice between several alternatives.
113
Avoiding biases (removing confounds between attributes) and increasing the efficiency (quality of design) allow to get “good” estimations. Higher levels of efficiency are obtained with orthogonal, balanced and efficient designs.
Orthogonal designs assume the absence of correlations between variables or attributes with one another. Attribute levels are balanced and all parameters are independently estimable (Metrics, 2012). Orthogonal designs are widely used for the estimation of linear models, because they ensure the absence of multicollinearity and minimize the variances of the parameter estimates from the variance-covariance matrix of the model (Metrics, 2012; Hoyos, 2010). Bliemer et al. (2009, p. 20) however state that “…the properties of orthogonality in SC [stated choice] data are not aligned with the properties of the discrete choice models typically estimated on SC data.” In case of inclusion of socio-demographic characteristics in the design (and utility functions) it is very difficult to obtain an orthogonal design, because such variables like sex, marital status, etc. are constant for the whole choice set, so they create correlations with other variables. Several software packages, like Ngene and SAS, propose relatively easy ways to construct orthogonal designs.
In balanced designs each level of one attribute occurs with each level of other attribute a proportional number of times. Usually balanced designs are not distinguished as a separate group but the balance of attribute levels is a condition, which is strongly suggested to be satisfied, unless there are important reasons not to do so (Carson and Louviere, 2010). For example, in most studies all attribute levels have equivalent importance, so balanced levels are needed, however, if one of the levels is not or less important for the researchers the balance condition may be relaxed.
Efficient designs, as defined in User Manual for Ngene Software Users (Metrics, 2012) minimize the correlation in the data and try to get the parameter estimates with the smallest standard errors possible (Hoyos, 2010). These standard errors are determined by asymptotic variance-covariance matrix, based on the experiment data and prior information about parameter estimates. Therefore, the researcher has to provide priors to construct an efficient design and to know the final model specification in advance (Hoyos, 2010). Priors may be obtained from similar studies in the literature or by conducting a pilot study. If neither similar studies nor pilot studies are available, the researcher may at least “guess” the sign of priors (for example, it should be negative for price attribute or positive for animal and environment protection attribute). Misspecification of priors leads however to great loses in efficiency, hence in case of no information on priors available, the researcher should leave them at zero level.
Efficient designs are introduced in order to increase the statistical efficiency of designs, by taking into account the stated preference model (Bliemer et al., 2009).
114
Recently, efficient designs with more complex specification have appeared: constraint designs - impossible combinations of attribute levels are excluded, pivot designs - participants do not face the same choice situations, instead they are pivoted according to participant’s current situation, increasing the realism of discrete choice sets, and designs with covariates - individuals' characteristics are included in the model in order to optimize the design for each group of respondents (Hoyos, 2010).
Measures of efficiency are used to test the level of precision of the design. Most widely used efficiency measure is D-error, which is a determinant of asymptotic variance-covariance matrix and D-optimal design is the one with the lowest D-error.
“D-optimal designs become more compelling in cases where goods are bundles of attributes and interest lies not in a single WTP estimate but in WTP estimates for a sizeable number of marginal tradeoffs” (Carson and Louviere, 2010, p. 196).
The literature also mentions that if an opt-out alternative is included in the choice set the design loses in efficiency, but gains in credibility. Therefore the design is a compromise between the efficiency and the realism (Hoyos, 2010).
3. Subjects and sample size
In most revealed and stated preference experimental treatments an individual is taken as an experimental unit, which is “the smallest unit of experimental material to which treatment can be allocated independent of other units” (Lusk and Shogren, 2007, p. 51). Individuals are usually assigned randomly to experimental sessions. There are two types of experimental design according to experimental unit assignment: within-subject design and between subject design. Within-subject design is a design, where a single person is assigned to more than one treatment.
Between-subject design assumes participation of each individual in only one treatment (Charness et al., 2012), avoiding learning, exposure, fatigue and demand reduction biases, which are inherent in within-subjects designs. Several environmental research results criticize between-subjects designs for creating a form of “vacuum” in which a participant makes his/her choice, moving the decision-making situation away from reality. Though, these designs are easier to estimate and obtain statistically significant results.
The use of each design type depends largely on the question of the experiment. Most questions about particular decision are posed with between-subjects design, whereas choices about which decision to make are considered with within-subjects design (Charness et al., 2012). For example, a researcher may ask the participant to indicate his/her WTP for a bottle of spring water (between-subjects design) or ask two questions: about his
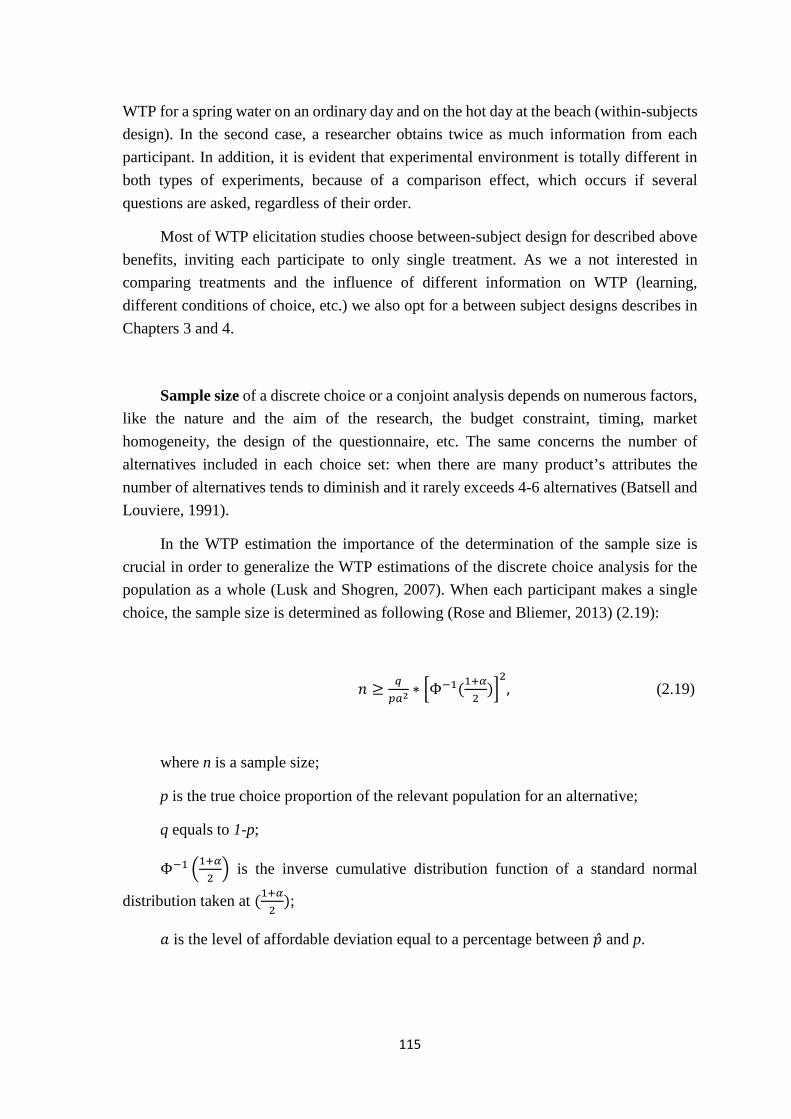
115
WTP for a spring water on an ordinary day and on the hot day at the beach (within-subjects design). In the second case, a researcher obtains twice as much information from each participant. In addition, it is evident that experimental environment is totally different in both types of experiments, because of a comparison effect, which occurs if several questions are asked, regardless of their order.
Most of WTP elicitation studies choose between-subject design for described above benefits, inviting each participate to only single treatment. As we a not interested in comparing treatments and the influence of different information on WTP (learning, different conditions of choice, etc.) we also opt for a between subject designs describes in Chapters 3 and 4.
Sample size of a discrete choice or a conjoint analysis depends on numerous factors, like the nature and the aim of the research, the budget constraint, timing, market homogeneity, the design of the questionnaire, etc. The same concerns the number of alternatives included in each choice set: when there are many product’s attributes the number of alternatives tends to diminish and it rarely exceeds 4-6 alternatives (Batsell and Louviere, 1991).
In the WTP estimation the importance of the determination of the sample size is crucial in order to generalize the WTP estimations of the discrete choice analysis for the population as a whole (Lusk and Shogren, 2007). When each participant makes a single choice, the sample size is determined as following (Rose and Bliemer, 2013) (2.19):
𝑛𝑛 ≥ 𝑞𝑞𝑑𝑑𝑎𝑎2
∗ �Φ−1(1+𝛼𝛼2
)�2
, (2.19)
where n is a sample size;
p is the true choice proportion of the relevant population for an alternative;
q equals to 1-p;
Φ−1 �1+𝛼𝛼2� is the inverse cumulative distribution function of a standard normal
distribution taken at (1+𝛼𝛼2
);
𝑎𝑎 is the level of affordable deviation equal to a percentage between �̂�𝑝 and p.
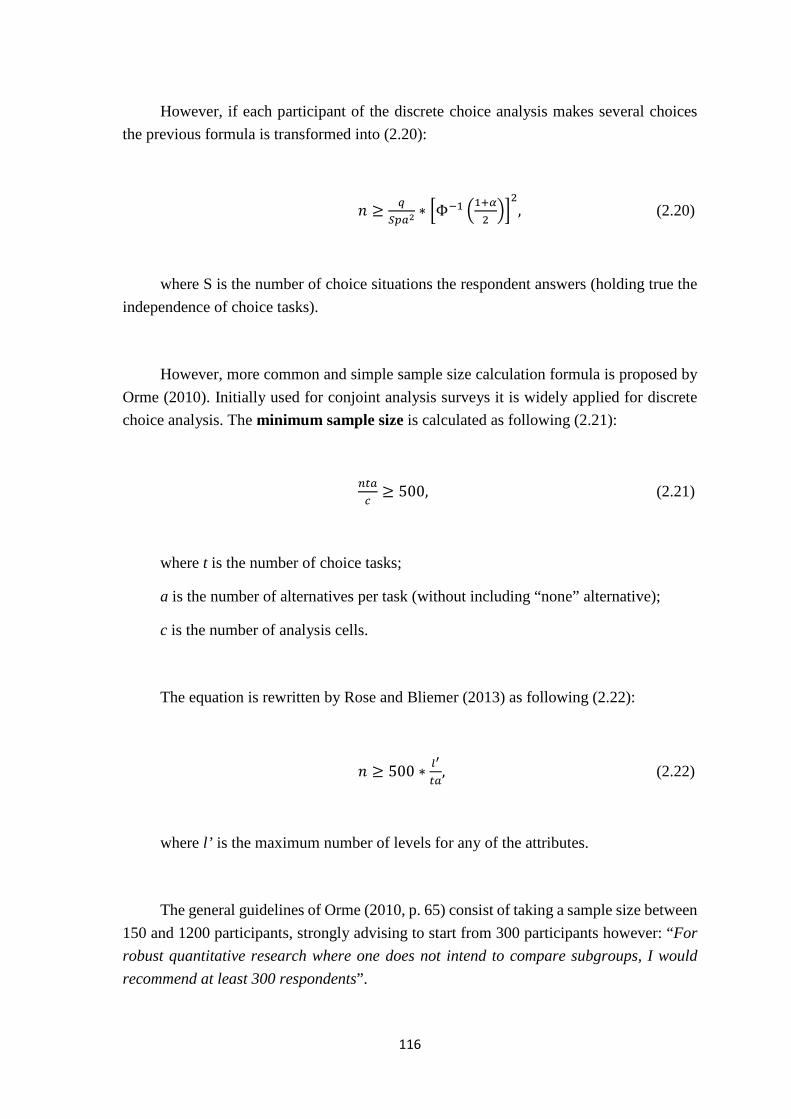
116
However, if each participant of the discrete choice analysis makes several choices the previous formula is transformed into (2.20):
𝑛𝑛 ≥ 𝑞𝑞𝑆𝑆𝑑𝑑𝑎𝑎2
∗ �Φ−1 �1+𝛼𝛼2��2
, (2.20)
where S is the number of choice situations the respondent answers (holding true the independence of choice tasks).
However, more common and simple sample size calculation formula is proposed by Orme (2010). Initially used for conjoint analysis surveys it is widely applied for discrete choice analysis. The minimum sample size is calculated as following (2.21):
𝑛𝑛𝑛𝑛𝑎𝑎𝑐𝑐≥ 500, (2.21)
where t is the number of choice tasks;
a is the number of alternatives per task (without including “none” alternative);
c is the number of analysis cells.
The equation is rewritten by Rose and Bliemer (2013) as following (2.22):
𝑛𝑛 ≥ 500 ∗ 𝑎𝑎′
𝑛𝑛𝑎𝑎, (2.22)
where l’ is the maximum number of levels for any of the attributes.
The general guidelines of Orme (2010, p. 65) consist of taking a sample size between 150 and 1200 participants, strongly advising to start from 300 participants however: “For robust quantitative research where one does not intend to compare subgroups, I would recommend at least 300 respondents”.
117
4. Field vs laboratory experiments
According to the experimental setting all experiments, including experimentally set discrete choice analysis, can be divided into two classes: field experiments and laboratory experiments (Lusk and Shogren, 2007; 2011). Both types have the advantages and the disadvantages.
The main advantage of a laboratory experiment is a level of control (both over price and other non-price parameters). A researcher is able to create an exactly needed experimental environment, minimizing confounding and side effects.
Field experiments, on the other hand, have their own advantages, like self-selection of participants, higher level of knowledge about the question/product of interest, real environment, reduced costs and important economic consequences. In natural field experiments there is no need to induce participants, as they are already interested, but the researcher has a large control lack. The literature states that WTP tends to be larger in field experiments, due to lower level of value uncertainty and lower level of patience (to consume the product), more information about the market situation, similar products and substitutes, and lower expectations to gather more information about the product in the future (Zhao and Kling, 2001; Lusk and Shogren, 2007). The differences are also hidden in the way the participants are informed about their participation (in natural field experiments people may not know that they are observed), the way they are paid and informed/trained before the beginning of the experiment. In some cases, like for new products, which are not at the market yet, field experiments are not possible to conduct (with the exception for market tests for the products, which are already produced). Therefore, researchers’ purpose is to approach laboratory setting to real life situation, holding high levels of both context and control.
Discrete choice experiments conducted in the laboratory setting are carried out under the same conditions as the experiments within revealed preference methods. The difference of stated and revealed preferences experiment is only in the absence of the product and of the real purchase decision. However, in both types of elicitation methods incentives may be introduced to motivate participants (discussed further). Creating a discrete choice questionnaire for a novel non-market product, the researcher has no possibility to sell the product. Therefore, only hypothetical laboratory experiments are possible to conduct and this thesis project focuses on this type of experimental setting.
118
5. Learning and pre-treatment issues
Another issue to be solved before the beginning of the experimental session is whether all participants understand the mechanism and experiment-related issues (Carson et al., 1994; Drichoutis et al., 2011). The use of glossaries, printed explanations, pictures and videos with examples are found to be very useful. The importance of understanding especially concerns the attribute or attributes of risk, i.e. those for which the value elicitation experiment takes place, like innovative features in our case (Kløjgaard et al., 2012). Lusk and Shogren (2007, p. 63) insist that besides a careful explanation, including examples, participants should “a) receive training on the incentive compatible mechanism; b) participate in real-money practice rounds with another good; c) be assured of anonymity” before the main body of the experiment. In addition, participants should be allowed to ask questions before (and in some cases during) the main experimental session.
This pre-experiment mechanism of participants’ familiarization with the experimental procedure and the product of the study is a “warm-up” mechanism (Helm et al., 2011; Carson et al., 1994). It has a positive influence on learning effects and reduces the uncertainty of choices (Hoeffler, 2003).
Helm et al. (2011) in their paper compare two different warm-up procedures before the preference measurement for an innovative product: self-navigated search and information search in laboratory conditions. Individual information search allows a consumer to make an informational basis before the experiment. This informational basis is not complete because there are some innovative features of the product, which are introduced during the experiment at the laboratory. Such separate learning process emphasizes the new features, when a person has already a general impression about the product. The second type of warm-up procedures is a presentation of all attributes directly before the experimental session in the laboratory. The authors conclude that when the information about the product category can be gathered easily and the number of innovative attributes is rather low the best warm-up practice is an individual search method. In case when product category has a high number of new product features, it is better to use laboratory-based warm-up mechanism. Nevertheless, the use of any warm-up procedure yields better results of subsequent conjoint analyses.
Learning during the value elicitation method session (either revealed or stated) is an issue, which may be also controlled through the choice of the method. As already stated in Chapter 1, preferences, being situation- and choice-specific, are dependent on how consumer learns them. For example, conjoint-analysis-like methods make consumer thoroughly think over their preferences, their trade-offs and, even in case of unknown preferences before the experiment, make an “experienced” or rational choice (Hauser et al., 2014).
119
6. Opt-out option or a constant alternative
The inclusion of a constant alternative in the experimental design has a wide recognition in the applied research. It can be represented as a constant choice option, usually used when the choice is made between several well-known brands, or a "no-purchase" or "your usual option" choice (Kontoleon and Yabe, 2003; Tversky and Shafir, 1992; Carson et al., 1994; Batsell and Louviere, 1991). In transportation studies an opt-out option is usually represented by “usual/recent road” or “usual transport mode” (Hess et al., 2008; Greene and Hensher, 2013; Hensher, 2010). Torres et al. (2011) also call opt-out alternative as “business-as-usual” (BAU) alternative.
It is usually recommended to include it in the choice set, because it increases the realism of the exercise (as on the marketplace where a consumer may decide not to buy a product), enhances the theoretical validity of the welfare estimates and improves the statistical efficiency of the estimated model parameters (Kontoleon and Yabe, 2003). In simple terms, the participant is less forced to make a choice when he/she really does not like the proposed alternatives. To be consistent with demand theory, in case of welfare estimation, the opt-out option is obligatory.
For marketers, it may also give information about the “success” of the product of research, i.e. its market penetration (Carson et al., 1994). In case of its absence the study may obtain the exaggerated demand for the product and unrealistic market shares.
In terms of utilities: a participant will choose the opt-out option if the utility from choosing any other option is lower than the one from the opt-out.
Alongside with benefits, there are some disadvantages of the opt-out inclusion. For example, Kontoleon and Yabe (2003) state that opt-out option may distort the incentives of the “true” preference revelation by proposing an easy choice, a “lifebuoy”, when the choice between alternatives becomes complicated. When the choice set is too homogeneous consumer tends to choose the easiest answer, in this case an opt-out option.
Another complication caused by the opt-out option may be found in the econometric analysis of the data. When the attributes of the opt-out are not evident, it may increase the difficulty of choice experiment data analysis. In addition, it may violate the IIA property, by being an alternative considered apart from others.
120
3. Auction as a value elicitation method
Initially auctions were used to elicit individuals’ values for monetary lotteries, to test behavioral patterns and differences between auction mechanisms, and later, they were started to be used for value elicitation for real goods (Lusk and Shogren, 2007).
Auction is a market, with its environment, in which non-market products/services are traded and a consumer may incorporate a market feedback and has real economic consequences to stating preferences, which are different from his real preferences.
Auction is usually considered a revealed preference method, but it is increasingly used to elicit hypothetical/stated WTP for non-market goods. Hereinafter we assume that auction is a part of stated preference methods of value elicitation, which consists of asking a participant to state, through a particular auction mechanism, his WTP for the product (see Figure 2.1).
Usually experimental auction follows one of these two strategies:
- participants bid to upgrade the current product to a new one, which varies only for characteristics to be valued (marginal value of an attribute);
- participants bid for two or more products at the same time and the choice, which is binding is drawn randomly (total value of a product).
Several approaches to experimental auctions are developed in literature. Some of them are based on induced value approach, and other on homegrown values.
Induced values are those values, which are assigned to participants by the experimentalist for one unit of a fictitious commodity. Usually people are told that winning bidder will earn an amount equal to the difference between their assigned induced value and the market price. This difference between induced value and a bid reveals a demand for the good. However, Lusk and Shogren (2007, p. 8) note that “induced value experiments are abstract, focusing on the allocative efficiency of the auction institution itself; these auctions do not provide information on people’s values for real-world goods and services”.
Homegrown values, as stated above, are those values, which people have already for real-world products and they apply them during experiments (which are “not induced”, i.e. are formed inside the individual, and are unknown to the researcher).
Whereas induced values methods are widely used in methodological research, homegrown values are more popular in studies of individual preferences, marketing and
121
environmental studies (Harrison et al. 2004). The current research will use homegrown values for the estimation of values for innovative products.
As mentioned in Lusk and Shogren (2007) values stated in hypothetical way may be 2 to 20 times greater than real values (Voelckner, 2006; Hensher, 2010; Silva et al., 2007). The main reason of that is the lack of salient economic commitments and a possible way to increase participants’ commitment is to make the auction incentive compatible.
An auction is called incentive compatible when it induces each participant to submit a bid10 that reflects his/her truthful value for the product. This is a weakly dominant strategy for a participant is such type of auctions (Wertenbroch and Skiera, 2002; Lusk and Shogren, 2011). Incentive compatible auctions can also be called as "separating what people say from what they pay" (Lusk and Shogren, 2007, p. 19) as the market price is independent from the bids.
William Vickrey has incepted a wide development of literature on the incentive compatible auctions. A number of auction-related issues has been analyzed by his followers: auction mechanisms, number of bidders and products’ influence, uncertainty and risk preferences, information uncertainty and asymmetry, etc. (see Lusk and Shogren (2007) for references; Vickrey, 1961).
Incentive compatible auctions include: English auction (1st price auction), Vickrey auction (2nd price auction), Becker-Degroot-Marshak (BDM) mechanism, nth price auction, random nth price auction, etc. Lusk and Shogren (2007, p. 69) propose a comparative table of incentive compatible mechanisms (Table 2.1), which is competed in Lusk and Shogren (2011, p. 219). The choice of auction institution has a great influence on the results obtained, both statistically and economically (Lusk et al., 2004; Lusk and Shogren, 2011).
10 A bid is an amount a participant states (in hypothetical setting) or is ready to pay for the product during the auction.
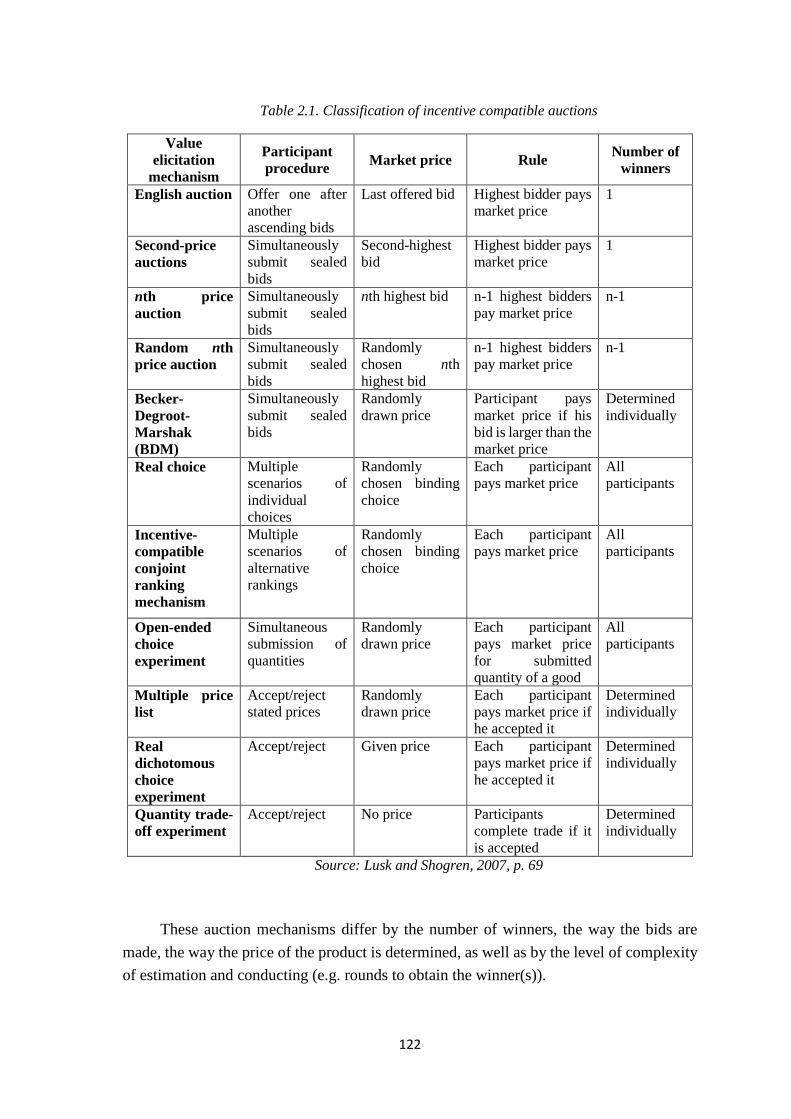
122
Table 2.1. Classification of incentive compatible auctions
Value elicitation
mechanism
Participant procedure Market price Rule Number of
winners
English auction Offer one after another ascending bids
Last offered bid Highest bidder pays market price
1
Second-price auctions
Simultaneously submit sealed bids
Second-highest bid
Highest bidder pays market price
1
nth price auction
Simultaneously submit sealed bids
nth highest bid n-1 highest bidders pay market price
n-1
Random nth price auction
Simultaneously submit sealed bids
Randomly chosen nth highest bid
n-1 highest bidders pay market price
n-1
Becker-Degroot-Marshak (BDM)
Simultaneously submit sealed bids
Randomly drawn price
Participant pays market price if his bid is larger than the market price
Determined individually
Real choice Multiple scenarios of individual choices
Randomly chosen binding choice
Each participant pays market price
All participants
Incentive-compatible conjoint ranking mechanism
Multiple scenarios of alternative rankings
Randomly chosen binding choice
Each participant pays market price
All participants
Open-ended choice experiment
Simultaneous submission of quantities
Randomly drawn price
Each participant pays market price for submitted quantity of a good
All participants
Multiple price list
Accept/reject stated prices
Randomly drawn price
Each participant pays market price if he accepted it
Determined individually
Real dichotomous choice experiment
Accept/reject Given price Each participant pays market price if he accepted it
Determined individually
Quantity trade-off experiment
Accept/reject No price Participants complete trade if it is accepted
Determined individually
Source: Lusk and Shogren, 2007, p. 69
These auction mechanisms differ by the number of winners, the way the bids are made, the way the price of the product is determined, as well as by the level of complexity of estimation and conducting (e.g. rounds to obtain the winner(s)).
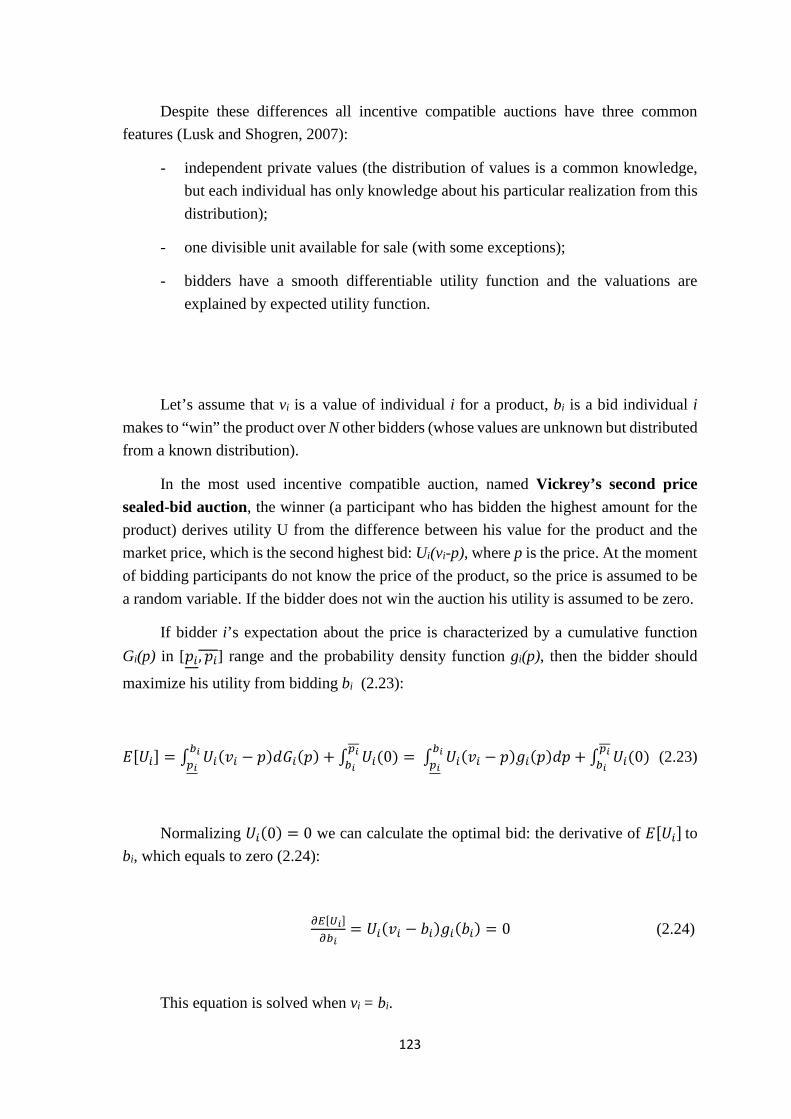
123
Despite these differences all incentive compatible auctions have three common features (Lusk and Shogren, 2007):
- independent private values (the distribution of values is a common knowledge, but each individual has only knowledge about his particular realization from this distribution);
- one divisible unit available for sale (with some exceptions);
- bidders have a smooth differentiable utility function and the valuations are explained by expected utility function.
Let’s assume that vi is a value of individual i for a product, bi is a bid individual i makes to “win” the product over N other bidders (whose values are unknown but distributed from a known distribution).
In the most used incentive compatible auction, named Vickrey’s second price sealed-bid auction, the winner (a participant who has bidden the highest amount for the product) derives utility U from the difference between his value for the product and the market price, which is the second highest bid: Ui(vi-p), where p is the price. At the moment of bidding participants do not know the price of the product, so the price is assumed to be a random variable. If the bidder does not win the auction his utility is assumed to be zero.
If bidder i’s expectation about the price is characterized by a cumulative function Gi(p) in [𝑝𝑝𝑖𝑖, 𝑝𝑝𝑖𝑖] range and the probability density function gi(p), then the bidder should
maximize his utility from bidding bi (2.23):
𝐸𝐸[𝑈𝑈𝑖𝑖] = ∫ 𝑈𝑈𝑖𝑖(𝑣𝑣𝑖𝑖 − 𝑝𝑝)𝑑𝑑𝐺𝐺𝑖𝑖(𝑝𝑝) + ∫ 𝑈𝑈𝑖𝑖(0)𝑑𝑑𝑖𝑖𝑏𝑏𝑖𝑖
𝑏𝑏𝑖𝑖𝑑𝑑𝑖𝑖
= ∫ 𝑈𝑈𝑖𝑖(𝑣𝑣𝑖𝑖 − 𝑝𝑝)𝑔𝑔𝑖𝑖(𝑝𝑝)𝑑𝑑𝑝𝑝 + ∫ 𝑈𝑈𝑖𝑖(0)𝑑𝑑𝑖𝑖𝑏𝑏𝑖𝑖
𝑏𝑏𝑖𝑖𝑑𝑑𝑖𝑖
(2.23)
Normalizing 𝑈𝑈𝑖𝑖(0) = 0 we can calculate the optimal bid: the derivative of 𝐸𝐸[𝑈𝑈𝑖𝑖] to bi, which equals to zero (2.24):
𝜕𝜕𝐸𝐸[𝑈𝑈𝑖𝑖]𝜕𝜕𝑏𝑏𝑖𝑖
= 𝑈𝑈𝑖𝑖(𝑣𝑣𝑖𝑖 − 𝑃𝑃𝑖𝑖)𝑔𝑔𝑖𝑖(𝑃𝑃𝑖𝑖) = 0 (2.24)
This equation is solved when vi = bi.
124
If a bidder submits a bid which is much greater than his real value than he has a risk that the second highest bid may exceed his value, so he will have a utility loss (and monetary loss). If he submits a bid less than his value, he risks to be outbidded, causing him to lose an opportunity to obtain a good he is interested in. Therefore, the bidder’s utility is maximized, when the bid equals his value for the good (Lusk and Shogren, 2007, p. 21-22).
As the price is not affected by the quantity of bidders, initial wealth levels, bidders’ risk preferences and the price of the product, the bidder is incentivized to bid sincerely his value for the product in Vickrey’s second price auctions.
Another popular auction mechanism of individual WTP elicitation is Becker-Degroot-Marshak (BDM) mechanism (Noussair el al., 2004).
In BDM procedure one of the participants is asked to draw a ticket marked with a price from an envelope to determine the purchase price (Wertenbroch and Skiera, 2002; Voelckner, 2006).
There are several advantages of the BDM auction among other incentive-compatible auctions. First, it is a rather easy auction for participants. When confronted with the BDM mechanism, subjects are explicitly told that “your best interest is served by accurately representing your preference. The best thing you could do is be honest” (Grether and Plott, 1979, p. 637).
This mechanism does not require particular knowledge, experience and learning, so it requires fewer rounds to get meaningful results.
Secondly, the design and procedures of experiment provides an easy way to find the dominant strategy, therefore, to find individual motivations of heterogeneous consumers, measured in their WTP.
Lastly, BDM auctions tend to have lower costs of participation than other mechanisms. This mechanism also requires comparatively less time and if measuring WTP less participants.
The procedure consists of several stages (Noussair et al., 2004):
- all participants submit a bid (price offer) for a product in a closed envelope;
- the researcher randomly draws a market price of the product from the range of prices (the distribution of prices is the same as the range for WTP bids and participants informed about that);
125
The fact that the price is chosen randomly behind the participant explicitly shows that the price is independent from the bids.
- all subjects whose bid was greater than the price received the product at the market price.
If an individual submits an offer that is higher than his true WTP, then he risks to buy the product at a price that exceeds his true WTP. If the offer is lower than the true WTP, then the participant risks not to get the product even if the price of the product is lower than the true WTP. Hence, the best strategy in the BDM auction mechanism is to submit an offer that is equal to individual’s true WTP (Kaas and Ruprecht, 2006; Noussair et al., 2004).
The choice of an auction mechanism depends, as stated before, on the research goals, which oblige researchers to regulate two parameters of an auction mechanism: control and context. Control parameter corresponds to the degree of control over the experimental environment, i.e. the probability of external influences’ intrusion in the decision-making processes. Context parameter is about the association of experimental choices to real life situations. In other words experiments search for the balance between internal and external validity (Lusk and Shogren, 2011).
Internal validity corresponds to the ability to demonstrate that the relationships (correlations of variables of the model) are causal, whereas external validity means that the obtained results in the experiment may be applied and projected to other settings (experiments, real markets, etc.) (Carson et al., 1994). Lusk and Shorgen (2011) list and explain the ways to increase external validity of experiments. The validity depends on the experimental environment and characteristics of the subject sample (size and representability of population), the nature of decision tasks, the information available to the participants, the presence and implication of the researchers, as well as whether the choice decision is made repeatedly or once by the participant.
All value elicitation methods, not only auctions, may be analyzed according to their control and context parameters’ levels. For instance, induced value experiments and non-experimental data are completely opposed: the former method has a high control level and a low context, whereas the latter has a high context level and a low control level. Field experiments have high level of context and some control over environment. At the same time, laboratory experiments eliciting values for real goods have medium levels for both context and control parameters.
126
4. Combined methods of value elicitation
Recently there has appeared a literature combining stated preference and value elicitation methods with either stated or/and revealed preference methods, particularly experimental auctions. The combination of stated preference methods allows to simplify, reduce costs and, as in case of combination with revealed preference methods, eliminate biases of stated preferences methods and increase internal and external validity of the results. Combined methods often allow the use of the benefits of stated and revealed data. Such methods are mainly developed for marketing application to cope with upward hypothetical bias of stated preference surveys. Another wide use of combined methods can be found in environmental studies.
One of them is called CVM-X for a contingent valuation methods with calibration by experiment (Fox et al., 1998). Its goal is to calibrate hypothetical survey values with experimentally obtained values in four steps:
- survey to elicit hypothetical values for a good with a high number of participants;
- use a subsample of the hypothetical survey for an experiment (incentive compatible auction) in order to elicit real values for the same good;
- estimate a calibration function relating the experimental bids to the hypothetical survey bids;
- use the calibration function to adjust the values of other survey participants (who did not take part in the experimental auction).
The authors describe CVM-X method as a “cost-effective tool that combines the advantages of contingent valuation method and experimental auction markets, thereby increasing the validity and accuracy of surveys while broadening the scope of nonmarket valuation in the laboratory.” (Fox et al., 1998, p. 456). Thus, the authors stress that contingent valuation permits to invite a broad sample size for the first stage; to make incentive compatible auctions with few participants (wherefrom the reduction of costs) and to get more reliable results due to the calibration technique.
Another example of combined methods is Customized Conjoint Analysis (CCA).
The origins of the method might be found in the estimations made by Srinivasan and Shocker (1981), Srinivasan (1988) and later by Srinivasan and Park (1997). They base their method on previously proposed similar versions (conjunctive-compensatory self-explicated approach (Casemap), choice-based CA, hybrid CA, adaptive CA, etc.) and call
127
their method Customized Conjoint Analysis. In CCA, first, self-explicated part-worths (or part-worth utilities) are estimated for a large number of attributes on the basis of “importance weights” of attributes. At the next stage, the researcher chooses the most important attributes on the basis of the obtained part-worths. The chosen attributes are called “core attributes”. Then, for each participant a weighted average of self-explicated and conjoint part-worths for the core attributes are calculated. The advantage of this method is that from a wide range of attributes it can estimate individual-level part-worths for the core attributes. In addition, as its name says, such estimation is made individually for each participant, i.e. core attributes differ for each participant.
Environmental application of a combined method (there is no particular method name given by the authors) may be found in Adamowitz et al. (1994). The authors start their research on the choice of water recreational site with a contingent behavior analysis and discrete choice models. The recreational sites are described with attributes, which have several levels. Then preferences are elicited from both actual and hypothetical choices with discrete choice models with the same combinations of attributes and their levels. The random utility models of both choice sets are estimated jointly with MNL techniques (for SP data a scale factor is applied).
Another recent combined method is called in Norwood and Lusk (2011) calibrated auction-conjoint method (CACM), combines benefits of conjoint analysis, such as simplicity for respondents (Adamovitz et al., 1998, and Voelckner, 2006) and revealing demand separately for each alternative, with those of auctions11, as less biased measure of WTP, possibility to answer more deliberately placing the bids in the market environment. The possibility to include numerous attributes with high number of levels differentiates it from other value elicitation methods. This systematic way of analysis is meant to be a key to rational consumer behavior, which is translated in less-biased WTP estimates. This method allows to think deeply about the needed trade-offs between the levels/alternatives and, in contrast to other presented above combined methods, does not suppose any preference distribution law and does not require comparisons with revealed preference data.
Combined methods presented here have obviously numerous advantages. However, as revealed preference methods themselves are not applicable for innovative non-market products, the only possible combination consists of two stated preference methods. CACM, used in our original study and presented in Chapter 3 is modified to use the both methods in a hypothetical setting, which is meant to alleviate the drawbacks of singular conjoint analysis and, even hypothetical, auction setting increases the accuracy of the results.
11 BDM auction mechanism is used by the method.
128
5. Inferred valuation method
A complementary method of value elicitation is inferred valuation method, which takes the roots in a beauty contest game. Beauty contest is a concept developed by John Maynard Keynes and is introduced in his work “The General Theory of Employment, Interest and Money” (1936, cited in Duffy and Nagel, 1997).
First studied experimentally by Rosemarie Nagel, the beauty contest game appeals to behavioral economists because of its simplicity, yet a capacity to capture reasoning, which is present in many real-world situations, as described by Keynes.
The analogy of the game is as follows: in the photo contest published by the local newspaper, the participants are asked to choose “the most beautiful” woman among six pretenders. Those people who picked the most popular face receive a prize.
The easiest strategy is to choose the pretenders depending on one's personal judgments about the beauty. However, a “player”, building a strategy which maximizes his/her chances to win a prize, will generally look from the position of the prevailing perception of beauty, and base his/her choices on the expected public opinion. Therefore, the result of a beauty contest does not show a personal "valuation" of the beauty but the most likely group result - an estimation of public perception.
Beauty contest games are usually used in theoretical research on individuals’ reasoning in game theory and behavioral studies. In marketing and policy application, a similar method is developed by Jayson Lusk and Bailey Norwood (Lusk and Norwood, 2009; Norwood and Lusk, 2010) and called Inferred valuation method.
Lusk and Norwood (2009) introduce this method among other methods used for value elicitation for non-market goods with moral (social norms) or environmental considerations. The attempts to decrease biases are already described earlier in the chapter, however, all of them have a different approach of the one presented in this section. “The effectiveness of both the calibration and cheap-talk methods appear to be good and person-specific.”(Norwood and Lusk, 2009, p. 501).
In choices with moral pressures, public opinion or the fact of participating in research session/experiment, consumers tend to choose a product (or a quantity, to state their WTP) which is “better” for their social image or look better in researchers’ eyes, stated in Lusk and Norwood (2009; Norwood and Lusk, 2010). People estimate that they engage in pro-social or pro-environmental, etc. issues and valuate the product more than others. This tendency to misspecify/misrepresent real values and preferences, due to social image concerns of participants, is called social desirability bias. This bias may be present when
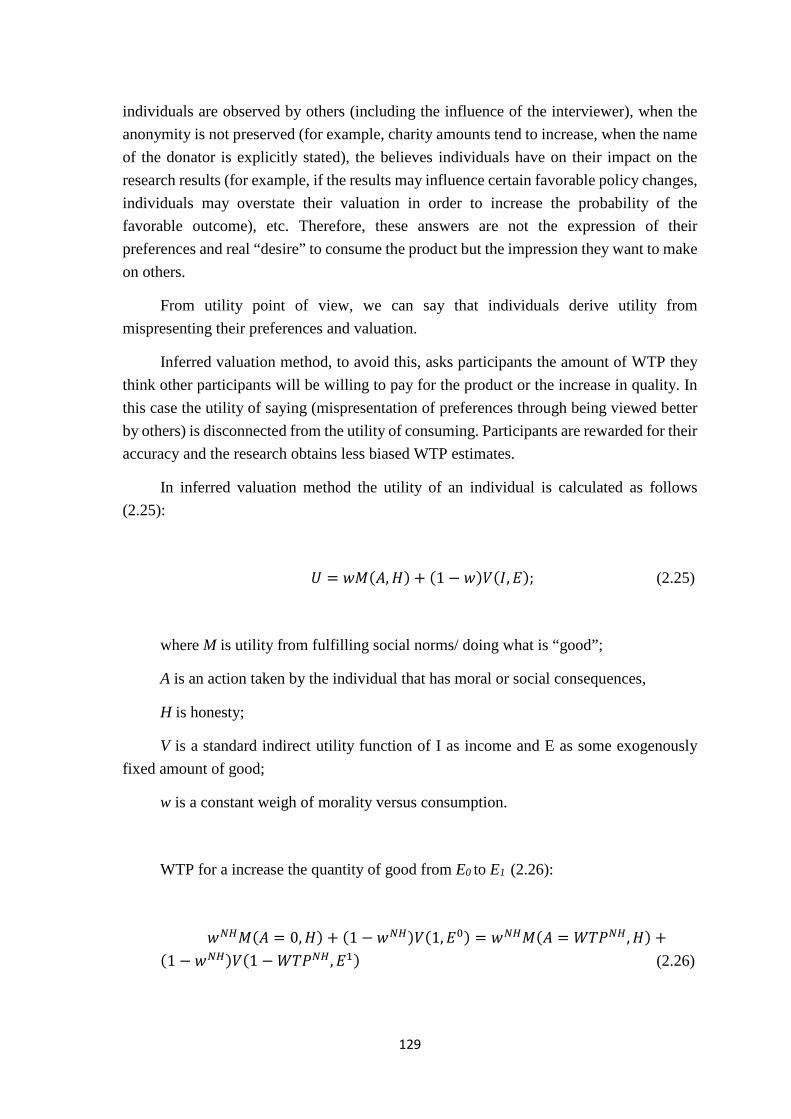
129
individuals are observed by others (including the influence of the interviewer), when the anonymity is not preserved (for example, charity amounts tend to increase, when the name of the donator is explicitly stated), the believes individuals have on their impact on the research results (for example, if the results may influence certain favorable policy changes, individuals may overstate their valuation in order to increase the probability of the favorable outcome), etc. Therefore, these answers are not the expression of their preferences and real “desire” to consume the product but the impression they want to make on others.
From utility point of view, we can say that individuals derive utility from mispresenting their preferences and valuation.
Inferred valuation method, to avoid this, asks participants the amount of WTP they think other participants will be willing to pay for the product or the increase in quality. In this case the utility of saying (mispresentation of preferences through being viewed better by others) is disconnected from the utility of consuming. Participants are rewarded for their accuracy and the research obtains less biased WTP estimates.
In inferred valuation method the utility of an individual is calculated as follows (2.25):
𝑈𝑈 = 𝑤𝑤𝑀𝑀(𝑊𝑊,𝐻𝐻) + (1 − 𝑤𝑤)𝑉𝑉(𝐼𝐼,𝐸𝐸); (2.25)
where M is utility from fulfilling social norms/ doing what is “good”;
A is an action taken by the individual that has moral or social consequences,
H is honesty;
V is a standard indirect utility function of I as income and E as some exogenously fixed amount of good;
w is a constant weigh of morality versus consumption.
WTP for a increase the quantity of good from E0 to E1 (2.26):
𝑤𝑤𝑁𝑁𝑁𝑁𝑀𝑀(𝑊𝑊 = 0,𝐻𝐻) + (1 − 𝑤𝑤𝑁𝑁𝑁𝑁)𝑉𝑉(1,𝐸𝐸0) = 𝑤𝑤𝑁𝑁𝑁𝑁𝑀𝑀(𝑊𝑊 = 𝑀𝑀𝑀𝑀𝑃𝑃𝑁𝑁𝑁𝑁,𝐻𝐻) +(1 − 𝑤𝑤𝑁𝑁𝑁𝑁)𝑉𝑉(1 −𝑀𝑀𝑀𝑀𝑃𝑃𝑁𝑁𝑁𝑁,𝐸𝐸1) (2.26)
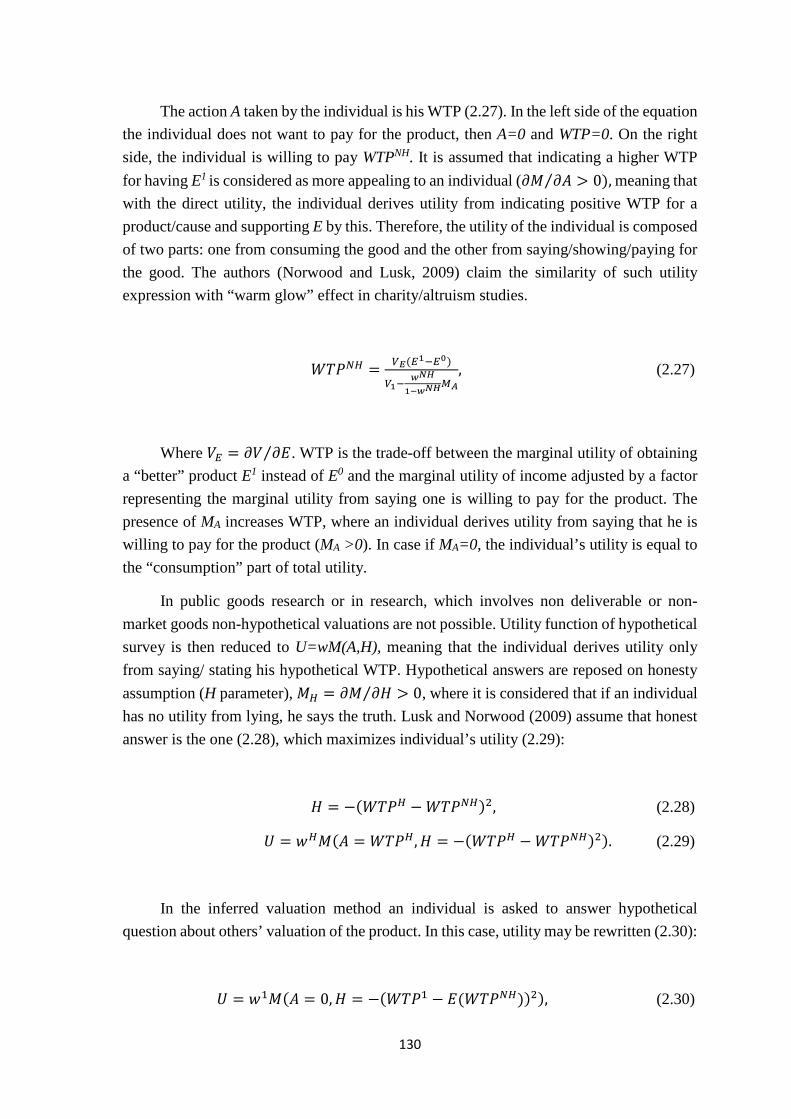
130
The action A taken by the individual is his WTP (2.27). In the left side of the equation the individual does not want to pay for the product, then A=0 and WTP=0. On the right side, the individual is willing to pay WTPNH. It is assumed that indicating a higher WTP for having E1 is considered as more appealing to an individual (𝜕𝜕𝑀𝑀 𝜕𝜕𝑊𝑊 > 0⁄ ), meaning that with the direct utility, the individual derives utility from indicating positive WTP for a product/cause and supporting E by this. Therefore, the utility of the individual is composed of two parts: one from consuming the good and the other from saying/showing/paying for the good. The authors (Norwood and Lusk, 2009) claim the similarity of such utility expression with “warm glow” effect in charity/altruism studies.
𝑀𝑀𝑀𝑀𝑃𝑃𝑁𝑁𝑁𝑁 = 𝑉𝑉𝐸𝐸(𝐸𝐸1−𝐸𝐸0)
𝑉𝑉1−𝑤𝑤𝑁𝑁𝑁𝑁
1−𝑤𝑤𝑁𝑁𝑁𝑁𝑀𝑀𝐴𝐴
, (2.27)
Where 𝑉𝑉𝐸𝐸 = 𝜕𝜕𝑉𝑉 𝜕𝜕𝐸𝐸⁄ . WTP is the trade-off between the marginal utility of obtaining a “better” product E1 instead of E0 and the marginal utility of income adjusted by a factor representing the marginal utility from saying one is willing to pay for the product. The presence of MA increases WTP, where an individual derives utility from saying that he is willing to pay for the product (MA >0). In case if MA=0, the individual’s utility is equal to the “consumption” part of total utility.
In public goods research or in research, which involves non deliverable or non-market goods non-hypothetical valuations are not possible. Utility function of hypothetical survey is then reduced to U=wM(A,H), meaning that the individual derives utility only from saying/ stating his hypothetical WTP. Hypothetical answers are reposed on honesty assumption (H parameter), 𝑀𝑀𝑁𝑁 = 𝜕𝜕𝑀𝑀 𝜕𝜕𝐻𝐻⁄ > 0, where it is considered that if an individual has no utility from lying, he says the truth. Lusk and Norwood (2009) assume that honest answer is the one (2.28), which maximizes individual’s utility (2.29):
𝐻𝐻 = −(𝑀𝑀𝑀𝑀𝑃𝑃𝑁𝑁 −𝑀𝑀𝑀𝑀𝑃𝑃𝑁𝑁𝑁𝑁)2, (2.28)
𝑈𝑈 = 𝑤𝑤𝑁𝑁𝑀𝑀(𝑊𝑊 = 𝑀𝑀𝑀𝑀𝑃𝑃𝑁𝑁,𝐻𝐻 = −(𝑀𝑀𝑀𝑀𝑃𝑃𝑁𝑁 −𝑀𝑀𝑀𝑀𝑃𝑃𝑁𝑁𝑁𝑁)2). (2.29)
In the inferred valuation method an individual is asked to answer hypothetical question about others’ valuation of the product. In this case, utility may be rewritten (2.30):
𝑈𝑈 = 𝑤𝑤1𝑀𝑀(𝑊𝑊 = 0,𝐻𝐻 = −(𝑀𝑀𝑀𝑀𝑃𝑃1 − 𝐸𝐸(𝑀𝑀𝑀𝑀𝑃𝑃𝑁𝑁𝑁𝑁))2), (2.30)
131
Where WTP1 is individual’s inferred valuation, and E(WTPNH) is individual’s expectation about other’s individual evaluation (non-hypothetical setting). A= 0 because individual does not derive utility from saying/stating his WTP, therefore (2.31),
𝑀𝑀𝑀𝑀𝑃𝑃1 = 𝐸𝐸(𝑀𝑀𝑀𝑀𝑃𝑃𝑁𝑁𝑁𝑁). (2.31)
Inferred valuation method is though a good method to compare to revealed preference valuations, and Lusk and Shorgen (2009) claim that it can outperform them (WTP1≤WTPNH). In case of hypothetical valuation inferred valuation is expected to be lower as well (WTP1≤WTPNH≤WTPH), keeping in mind that WTPNH≤WTPH and inferred valuation is an estimate closely related to real WTP.
In case of innovative products with the inferred valuation method it is possible to make consumers reveal an approximation of overall consumers’ valuation of the product and make a forecast of future demand. As it is impossible to use revealed preference methods for such goods, inferred valuation is used as an approximation of hypothetical answers to real valuations following the logic of inferred hypothetical WTP estimates described above. Chapter 4 uses inferred valuation method to estimate consumers’ average valuation and compares it to individual hypothetical answers.
132
Conclusion
In this chapter we have explained the methodological basis of the theory developed in Chapter 1. Due to a complex concept of value, for different values the same methods may not always be appropriate, and, therefore, the reliability of the data obtained may vary.
In addition, measuring value of the products, which are not yet on the market, i.e. new products, is a problem, which demands a high level of investigation and search for the right method of value estimation.
This chapter has presented different methods, which may be used for value and preference elicitation. Initially, these methods are divided on two major classes: revealed preference methods and stated preference methods. The former analyzes real choices and the latter analyzes hypothetical choices. For innovative products, which are only at a certain stage of NPD real choices are impossible, since the products are not yet produced and/or available for sale. Therefore, the main discussion of this chapter consists of the analysis of stated preference methods.
Traditional stated preference methods of value elicitation are: conjoint analysis, contingent valuation and discrete choice analysis.
Conjoint analysis consists of asking the participants to choose between several predefined alternatives or to rank/rate them. Contingent valuation method asks the participants to answer yes-no questions about their willingness to pay about particular products.
Both of these methods have been very popular but are lately very criticized for their unrealistic environment, difficulty of comprehension (like ranking different alternatives in conjoint analysis), little detailed results (like for contingent valuation, where the valuation is obtained only for products, described by bundles of attributes and their marginal contribution is impossible to distinguish) and additionally, high hypothetical biases.
At the same time, most real choice situations may be described by discrete choice situation: a consumer, willing to buy a bottle of water in a store, is faced to several bottled water alternatives at given price, with current characteristics of choice (spring or sparkling, cold or ambient temperature, etc.) at the current situation (hot or cold weather, sole or family consumption, etc.). And, here, he makes his choice. In the experimental setting discrete choice analysis suits the best to estimation of consumers’ preferences and values in such situations. In this thesis, discrete choice analysis conducted in experimental laboratory with invited participants is called discrete choice experiment, but its’ hypothetical nature remains unchanged.
133
The researcher, has the knowledge about the components of the utility only partially – an observed part of utility, but there exists also an unobserved utility part – random utility error term. The total utility is then the sum of these two parts, following the Random Utility Theory. Models, based on this theory are called Random Utility Models, suppose that observable part of utility corresponds to the factors, which are controlled by the researcher, whereas unobserved utility may explain the presence of unknown attributes/factors, which influence the choice, the presence of preference and taste heterogeneity, imperfect information, etc. The existing literature allows us to conclude that different estimation models may be applied to random utility models, assuming different distribution laws of unobserved utility term (and the hypotheses of its particular distribution).
Numerous attempts to alleviate hypothetical biases and to increase internal and external validity are discussed in the chapter. Particularly, one of them is to use a combination of stated preference methods with revealed or stated preference methods. The information on such methods has been analyzed and calibrated auction-conjoint method is chosen for the further use. This method is described in detail in Chapter 3, which presents a study on vacuum cleaners with upgrade options. CACM method consists of two parts: a conjoint analysis and an auction. In our study, CACM method is a combination of two stated preference methods, unlike the original method. The innovative product is not available for sale in this study, however, the bidding procedure itself makes conjoint analysis stages to look more like in real choice situations – the participants are placing their bids for an average product and then, on the basis of their conjoint analysis valuation, the WTP for four alternative products are calculated. The deep understanding of product’s attributes and their levels, possible due to conjoint analysis creates positive conditions to more rational bids, i.e. amounts of WTP stated during the auction part. Calibration mechanism, at last, allows to change the ratings of conjoint analysis stages if the participant considers WTPs being not corresponding to his/her preferences.
Pivot discrete choice experiment, being a special case of a discrete choice analysis, assumes that having a referencing alternative consumers promote relevancy in attribute levels and facilitate consumers’ reasoning through, like in case of innovative products, referring the unknown alternative to an already known one or the one, which consumers own. Thus, this method aims to decrease hypothetical bias of stated preference methods. It is presented in Chapter 4.
Chapter 4 presents the study on electricity contracts, equipped with smart meters. We are investigating consumers’ acceptance and willingness to pay for electricity contracts described by 4 attributes: bill amount variation or the level of economies (pivoted around
134
their real annual bill amount); comfort level, part of renewable energy, control mode. In case of pivoting, participants associate their reference level consumption (current) with proposed contracts, violating the independence of irrelevant alternatives property of multinomial logit models. Therefore, mixed logit, generalized and scale multinomial logit models are used for estimation. In addition, these models enable us to measure consumer heterogeneity in preferences for “smart” contracts, in particular for control mode attribute.
Inferred valuation, as a complementary method, is used in Chapter 4. It allows us to obtain a mean valuation of an alternative in a way, which approaches to revealed valuations. In this method, participants are asked to choose an alternative, which, on participant’s view, is chosen by the majority.
Preference and WTP elicitation with these methods includes different hypotheses, proceedings and therefore, on our point of view, are more adapted for different products and valuation situations.

135
136
CHAPTER 3
Elicitation of willingness to pay for upgradeable products with calibrated auction-conjoint method
As already discussed in Chapter 1, the 21st century is a century of consumerism: growing amounts of consumption, which lead to growing production levels and natural resources use (water, air, energy, land, etc.). Constantly changing consumer needs and preferences force producers to produce more products, diversifying product lines and including numerous innovations and associated services. This situation results in negative consequences on environment and ecosystem; and are not compatible with sustainable development principles.
Current ecological situation requires not only an adaptation of behavior, economic processes and technologies but the whole community and technology transformation, in order to cope with the destructing pace of humanity. Both the industry and consumers are forced or willing to make some efforts to contribute to sustainable development, by introducing new sustainable products and accepting sustainable consumption practices. Abundant research has been conducted on new products, but to our knowledge few studies have been done on new products in terms of sustainable development (Hopwood et al., 2005).
Introduction of “Product-Service Systems” (PSS) is a means of coping with the growing effect of such production and consumption. Products are increasingly sold not alone, but bundled with services, which guarantee good functioning of the product and
137
expand the products’ lifetime. This is also the way to differentiate the product and to create the added value for consumer.
Three types of PSS are distinguished: product-oriented services, use-oriented services and result-oriented services. This chapter will discuss product-oriented PSS, which assumes the consumer has all the rights on the product (tangible part) but additional services (like warranty) are provided by the producer.
Currently most products sold on the market may be characterized by some tangible characteristics and intangible associated services. The product has thus fixed set of characteristics, which becomes obsolete in time (high levels of technological change, changing consumer preferences, etc.). A new strategy adopted by the industries, where the rate of products’ change is high, is based on the upgradeability principle. Upgradeability may expand the products’ lifetime and avoid obsolescence, thus reduce the replacement rate of products and, subsequently, provide environmental benefits. Additionally, new upgraded parts may be technologically advanced, providing environmental gains. From consumers’ point of view, upgradeable products have as well a superior value, compared to ordinary products/innovations, through increased life cycle of the product and its reduced cost in long perspective. From producers’ point of view upgradeability results in reduced energy, materials use and increased clients’ loyalty. Additional profit may be achieved through regular upgrades and their installation services, proposed to clients.
In this chapter we present a research study eliciting willingness to pay for upgradeable products. This study was developed within the IDCyclUM project. The estimates of consumers’ acceptance and willingness to pay for upgradeable vacuum cleaners are obtained with the help of Calibrated Auction-Conjoint Method, defined as a combined method in Chapter 2. This method is meant to contribute to consumers’ deeper understanding of product’s attributes (including upgrade function), their impact on the product’s price and their contribution to sustainable products’ development and consumption. Participation in sustainable consumption or eco-participation is based on the process of learning and “guidance” (through upgrades, which guarantee to reduce environmental impact from the use of the product) made by producers. Such preference analysis, according to Norwood and Lusk (2011), the authors of the method, allows to elicit rational consumer decision-making behavior. Experimental protocol consists of an auction-like part, which even being hypothetical (unlike the original paper of Norwood and Lusk (2011)) puts a participant in a real market choice environment, where he/she chooses between several products, which increases the realism of the situation and yields less biased (compared to conjoint analysis and contingent valuation tasks) results.
138
This chapter is organized as following. In Section 1 we present the project, the concept of upgradability and the calibrated auction-conjoint method. Section 2 presents the experiment and its design, whereas Section 3 discusses the main results of the study and their discussion. The chapter is completed with our conclusions.
1. Presentation of the “IDCyclUM” project and the goal of research
Project IDCyclUM is a project of French National Research Agency titled “Sustainable Innovations with Multiple Upgrade Cycles” (IDCyclUM, 2011).
Figure 3.1. IDCyclUM project presentation and participants
Source: IDCyclUM, 2011.
It aims to join industry and academic research forces (Figure 3.1) in order to propose new industry opportunities for sustainable economy and development. The project is focused on the development of new sustainable products based on upgradability of their parts and/or components.
According to sustainable development goals the project aims to make a positive research contribution to three spheres:
‐ environmental (extending the lifespan of products, material consumption reduction, reduction of waste production, reduction of energy consumption, etc.);
‐ economic (for companies upgradability is a source of a new revenue, better distributed over time; improved customer retention and loyalty);
‐ societal (the upgradability services are necessarily local, coming as a substitute for a delocalized production of new products).
There changes represent the sources of added value creation, by creating new parameters/attributes, which guide consumers’ choices.
139
Moors and Donders (2003) argue that the importance and success on the market of new innovative products is explained by the added value for consumers. The estimation of added value may pose several difficulties, depending on the type of new product: radical or genuinely vs. artificially new products (Veryzer, 1998). These product types are characterized by different levels of risk, levels of uncertainty about product’s utility and, therefore, level of satisfaction. Sustainable innovation is usually more complex and ambiguous (due to inner contradictions). In this chapter, we consider new sustainable products based on the upgradeability of their components or parts.
New product development originates from new technologies or from new market possibilities (Eliashberg et al., 1995). But the ultimate success of new products is based on the assessment of consumers’ judgments (Brown and Eisenhardt, 1995; Cooper and Kleinschmidt ,1987). In fact, the incorporation of consumer’s perceptions in the early stages of new product development has been identified as a critical success factor (Van Kleef et al., 2005). Marketing research advises to switch from product-oriented marketing strategies to consumer-oriented strategies as a way of successful introduction of new products on the market, gaining market share, developing strong relationship with consumers.
Consumer-oriented studies could be carried out at four different stages of new product development: 1) at the stage of identification of technological opportunities, 2) at the development stage, 3) at the testing stage, and 4) at the market launch stage. Most often, consumer research is performed during the development, testing or launching of a new product, while various studies show that successful new product development is mainly based on the quality of the identification of possibilities: analysis of a market (consumer needs and market opportunities) (Veryzer, 1998), technological possibilities, anticipation of new product costs, etc.
Decomposition of value of the product (tangible/product and intangible/services parts) and its recomposition (upgrades) modifies consumers’ perceptions of value. Therefore, this study has several goals:
‐ elicit consumers’ preferences for upgradeable products;
‐ estimate willingness to pay for upgrades of different types;
‐ analyze value systems of consumers;
‐ propose solutions for NPD process within the goals of IDCyclUM projet. This goal is not discussed in this chapter.
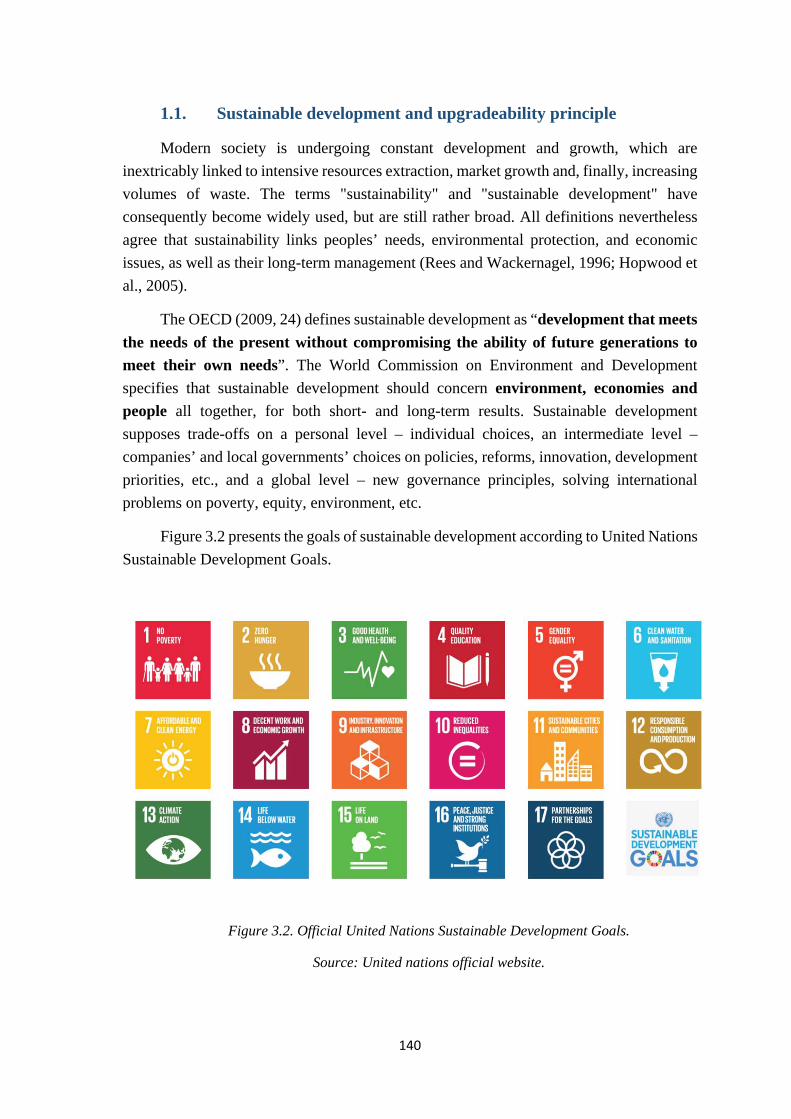
140
1.1. Sustainable development and upgradeability principle
Modern society is undergoing constant development and growth, which are inextricably linked to intensive resources extraction, market growth and, finally, increasing volumes of waste. The terms "sustainability" and "sustainable development" have consequently become widely used, but are still rather broad. All definitions nevertheless agree that sustainability links peoples’ needs, environmental protection, and economic issues, as well as their long-term management (Rees and Wackernagel, 1996; Hopwood et al., 2005).
The OECD (2009, 24) defines sustainable development as “development that meets the needs of the present without compromising the ability of future generations to meet their own needs”. The World Commission on Environment and Development specifies that sustainable development should concern environment, economies and people all together, for both short- and long-term results. Sustainable development supposes trade-offs on a personal level – individual choices, an intermediate level – companies’ and local governments’ choices on policies, reforms, innovation, development priorities, etc., and a global level – new governance principles, solving international problems on poverty, equity, environment, etc.
Figure 3.2 presents the goals of sustainable development according to United Nations Sustainable Development Goals.
Figure 3.2. Official United Nations Sustainable Development Goals.
Source: United nations official website.
141
From new product development processes side, we can conclude that the achievement of these goals is only possible by making compromises throughout the whole process line (from management and raw resources choice to final market positioning). The trade-offs between important products’ characteristics, available after consumer and market analysis are crucial for the success of new sustainable products. “Establishing
specific target market for greener products and assessing market needs are important for
market success.” (Pujari, 2004).
In the research reported below, we consider that an individual who makes a decision to buy a product with incorporated sustainable features participates in sustainable development. To encourage companies that turn their activities towards sustainable development (efficient resource management, waste products management, corporate social responsibility), consumers have to buy innovative products with sustainable features.
Sustainable product optimally represent a “win-win” situation, meaning less waste (of emissions and pollution), less energy and resources needed to production, which leads to a higher cost effectiveness for both consumers and producers. To achieve this situation is, however, more difficult for a producer.
Due to high technological change and development producers have more pressure to propose new products (Shih and Schau, 2011). The perceived rate of innovation (PRI) is a rate at which consumers perceive that technological conditions change. This rate varies among product categories and influences the speed of innovation adoption. The uncertainly about when the new technology arrives, influences consumers’ decisions about the adoption of innovation. This uncertainly is called “new-obsolete paradox” (Mick and Fournier, 1998; Shih and Schau, 2011). Among other technology paradoxes (for more information see Mick and Fournier, 1998) new-obsolete paradox pictures consumers’ fears to adopt an innovation, because of the soon arrival of even newer technology. Even in case when consumers are capable to estimate their expectations about future technologies development this paradox is present.
A new strategy to produce a sustainable innovative product is based on upgradeability principle. Possibility to upgrade the existing product provides an opportunity to mitigate consumers’ fears, while coping up with the speed of technological innovations development.
Upgradeable product may be interpreted as a product designed to avoid obsolescence, by changing old parts of the product by new ones with technological advances. Such product thus may be considered as a sustainable product. Nidumolu et al. (2009) claim that
142
“[S]mart companies now treat sustainability as innovation’s new frontier”. The aim of our research is to analyze the consumer’s perception of such products and willingness to pay (WTP) for them.
In their fundamental research on upgradeable (or flexible) products, Alptekinoglu and Ramachandran (2014) show that consumers may adjust some attributes of a product while using/consuming it. These authors assume that if consumers’ preferences change over time, this may result in disutility from having a “bad” product at time t+1, whereas they bought the product at time t when it was still “good”. Consumers are interested in buying an upgradeable product when they consider it to have a high value and so to be worth of paying a premium. At the same time, they anticipate a significant cost reduction in future because upgrading the product’s obsolete parts only and not buying a new expensive product will generate economies. The paper also claims that “a flexible product may lead to more profits [to a producer] than a portfolio of standard products when consumer preferences are more stable” due to an elevated value of each upgrade. Upgrade provides an opportunity to mitigate consumers’ fears (about future utility, costs, etc.), while coping up with the speed of technological innovations development.
The nature of upgrades, according to Umeda et al. (2005, p. 167), may be functional or parametric: “…functional upgrading, which adds or removes functions such as adding
the two-sided copying function to a photocopier, and parametric upgrading, which changes
the performance of a product such as increasing copying speed.”
Bisiaux (2015) defines several types of parametric upgrades:
‐ upgrade of functionality and performance, through the amelioration of existing parts and components;
‐ upgrade of the design, through the amelioration of the estheticism, facility and comfort of use;
‐ upgrade of environmental performance.
The authors also report that upgrades may be distinguished by the way they are installed: the upgrades may be independent or insensitive. Independence of the upgrade means the necessity to replace a part of the product by its ameliorated version. Insensitivity means that the component itself has some functional margins, hence there is no need to replace the component. In this case the upgrade only consists of ameliorating the functioning of the component though using these margins.
These notions are supported in the empirical work of Ülkü et al. (2012). These authors use a titration method and state that the valorization of an upgradeable product depends on the initial price and the price of an upgrade, the periods between upgrades, the
143
perceived quality of the upgrade and perceived efforts to install it. The results show that consumers are willing to pay premiums for upgradeable products, however, the more distant the upgrade, the smaller the premiums will be. Consumers tend to undervalue future savings when the product has a short upgrade period and to overvalue future savings in case of a long upgrade period. So, an upgradeable strategy is advantageous for long life-cycle products with slow technology development processes. The authors also conclude that consumers are willing to pay less if the perceived quality of an upgrade is low and the perceived efforts are high.
In their empirical research on upgradeable products, Inoue et al. (2014) focus on a vacuum cleaner with a performance upgrade in which a motor part is changed. Three different scenarios are proposed to a consumer: an upgrade with an amelioration of suction power; an upgrade leading to a noise decrease; and an upgrade leading to an energy consumption decrease. Upgrade time is taken to be seven years, which is the estimated trade-up time. Another empirical study, by Pialot and Millet (2014), also analyzes the upgradability of vacuum cleaners. These authors conduct multi-country quantitative and qualitative surveys and show that more than 55% of products are replaced when they still work, due to an accumulation of dissatisfaction with the product (accumulation of problems) and to the lure of the functions/design of new products available on the market – in other words, to the “versatility” of consumers faced with upcoming innovations. This situation is also called “new-obsolete paradox” (Mick and Fournier, 1998).
More recently, Michaud et al. (2015) considered the price of an upgrade (separately from the price of the product) and of its installation, and whether it is installed by the user or by a specialist. These authors show that these parameters influence consumers’ preferences and the acceptability of an upgrade: the utility of buying an upgradeable product is greater than the utility of not buying it, but significant heterogeneity of individual preferences exists for different products and for the upgrade attributes. In addition, more time between two upgrades increases the purchase probability. This result can be linked to the perception that consumers have about future technological development of products. When upgrades have to be made by the user (versus a specialist), the probability of purchasing the product decreases.
In this chapter, we continue the research started by Michaud et al. (2015), but the current study has several important differences. First, in Michaud et al. (2015) there is a choice experiment with a few attributes for each upgradeable product, whereas in our research we use a calibrated auction-conjoint method that allows for a large number of attributes. This method also enables us to analyze the weight of each attribute and each level of attribute. So, based on the main results of previous research – the existence of premiums for upgradeable products –, we want to know why they exist and how they are formed. In addition, any hypothesis about the distribution law of consumers’ preferences
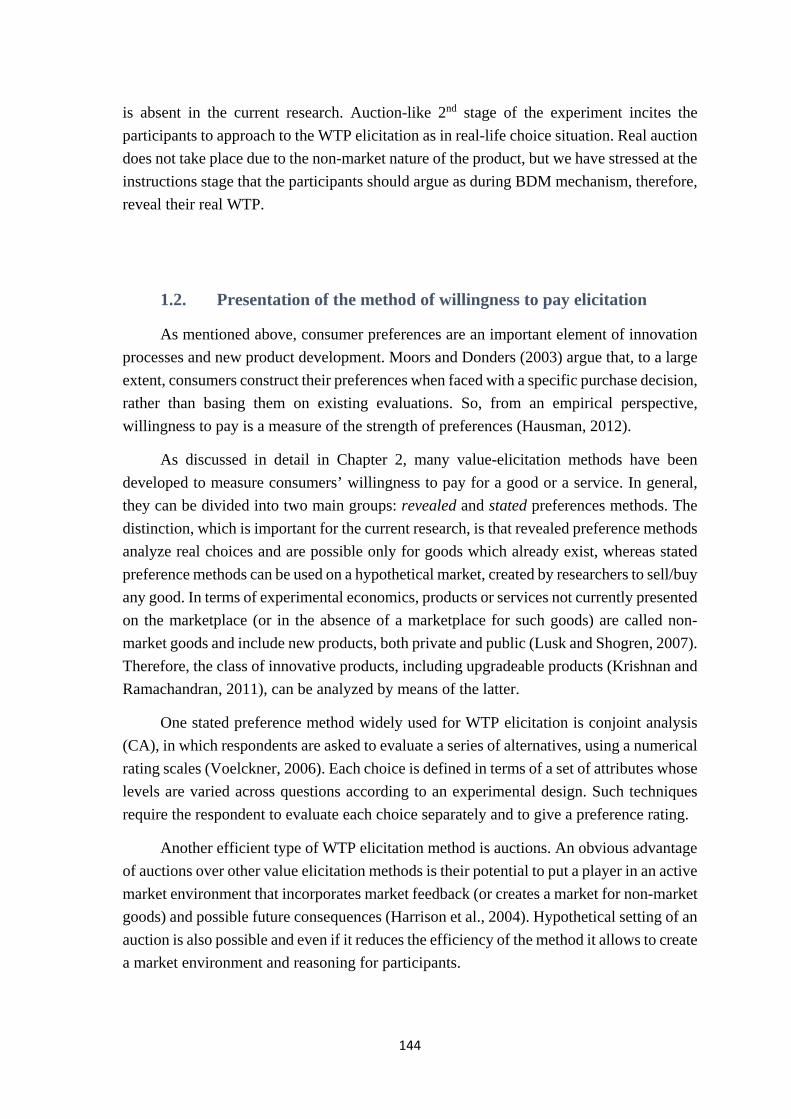
144
is absent in the current research. Auction-like 2nd stage of the experiment incites the participants to approach to the WTP elicitation as in real-life choice situation. Real auction does not take place due to the non-market nature of the product, but we have stressed at the instructions stage that the participants should argue as during BDM mechanism, therefore, reveal their real WTP.
1.2. Presentation of the method of willingness to pay elicitation
As mentioned above, consumer preferences are an important element of innovation processes and new product development. Moors and Donders (2003) argue that, to a large extent, consumers construct their preferences when faced with a specific purchase decision, rather than basing them on existing evaluations. So, from an empirical perspective, willingness to pay is a measure of the strength of preferences (Hausman, 2012).
As discussed in detail in Chapter 2, many value-elicitation methods have been developed to measure consumers’ willingness to pay for a good or a service. In general, they can be divided into two main groups: revealed and stated preferences methods. The distinction, which is important for the current research, is that revealed preference methods analyze real choices and are possible only for goods which already exist, whereas stated preference methods can be used on a hypothetical market, created by researchers to sell/buy any good. In terms of experimental economics, products or services not currently presented on the marketplace (or in the absence of a marketplace for such goods) are called non-market goods and include new products, both private and public (Lusk and Shogren, 2007). Therefore, the class of innovative products, including upgradeable products (Krishnan and Ramachandran, 2011), can be analyzed by means of the latter.
One stated preference method widely used for WTP elicitation is conjoint analysis (CA), in which respondents are asked to evaluate a series of alternatives, using a numerical rating scales (Voelckner, 2006). Each choice is defined in terms of a set of attributes whose levels are varied across questions according to an experimental design. Such techniques require the respondent to evaluate each choice separately and to give a preference rating.
Another efficient type of WTP elicitation method is auctions. An obvious advantage of auctions over other value elicitation methods is their potential to put a player in an active market environment that incorporates market feedback (or creates a market for non-market goods) and possible future consequences (Harrison et al., 2004). Hypothetical setting of an auction is also possible and even if it reduces the efficiency of the method it allows to create a market environment and reasoning for participants.
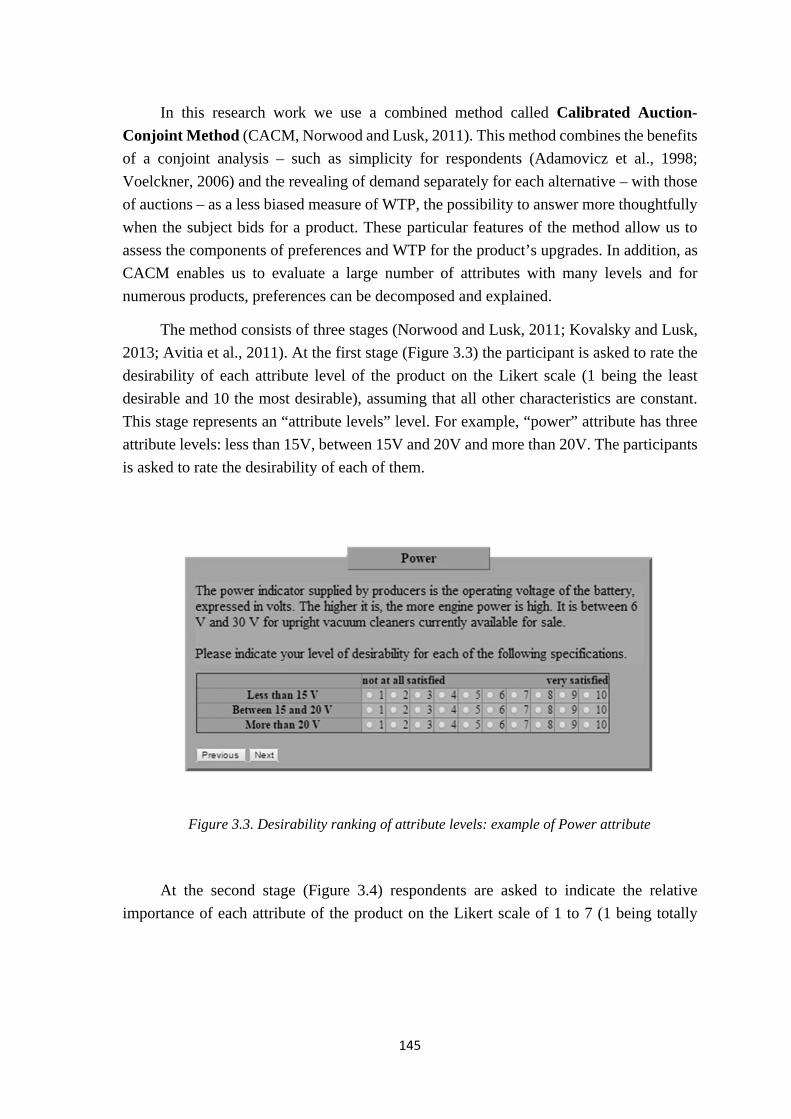
145
In this research work we use a combined method called Calibrated Auction-Conjoint Method (CACM, Norwood and Lusk, 2011). This method combines the benefits of a conjoint analysis – such as simplicity for respondents (Adamovicz et al., 1998; Voelckner, 2006) and the revealing of demand separately for each alternative – with those of auctions – as a less biased measure of WTP, the possibility to answer more thoughtfully when the subject bids for a product. These particular features of the method allow us to assess the components of preferences and WTP for the product’s upgrades. In addition, as CACM enables us to evaluate a large number of attributes with many levels and for numerous products, preferences can be decomposed and explained.
The method consists of three stages (Norwood and Lusk, 2011; Kovalsky and Lusk, 2013; Avitia et al., 2011). At the first stage (Figure 3.3) the participant is asked to rate the desirability of each attribute level of the product on the Likert scale (1 being the least desirable and 10 the most desirable), assuming that all other characteristics are constant. This stage represents an “attribute levels” level. For example, “power” attribute has three attribute levels: less than 15V, between 15V and 20V and more than 20V. The participants is asked to rate the desirability of each of them.
Figure 3.3. Desirability ranking of attribute levels: example of Power attribute
At the second stage (Figure 3.4) respondents are asked to indicate the relative importance of each attribute of the product on the Likert scale of 1 to 7 (1 being totally
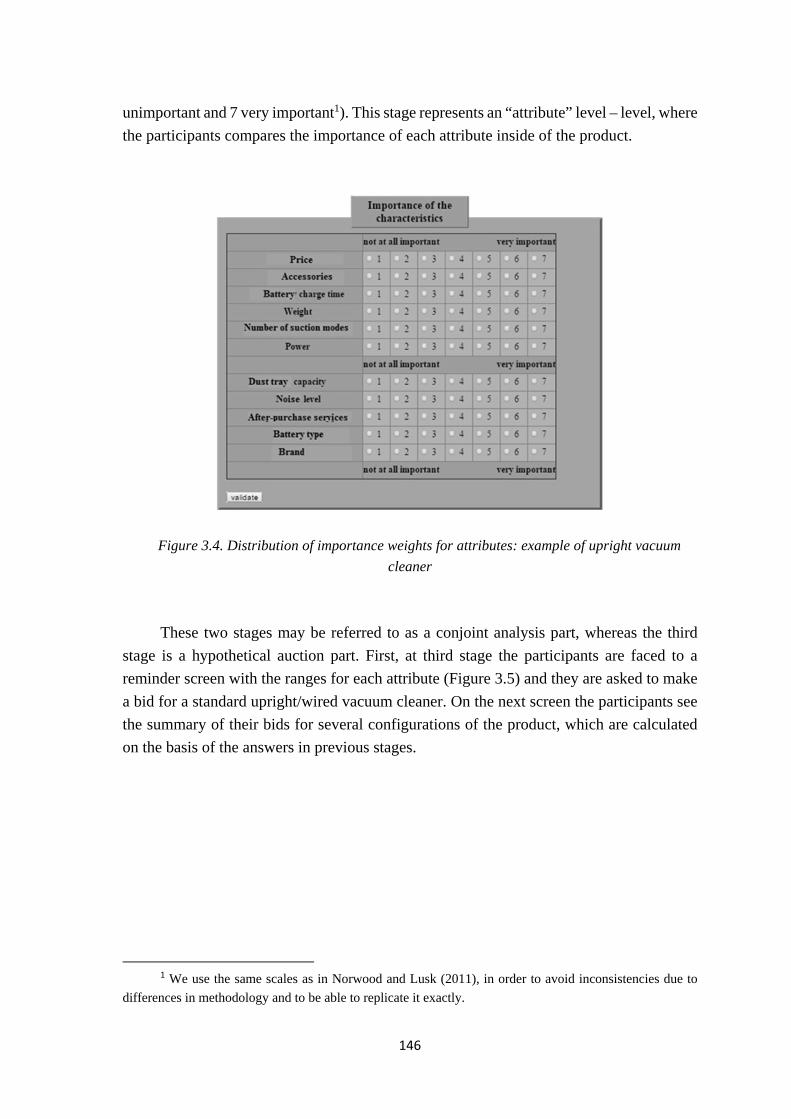
146
unimportant and 7 very important1). This stage represents an “attribute” level – level, where the participants compares the importance of each attribute inside of the product.
Figure 3.4. Distribution of importance weights for attributes: example of upright vacuum
cleaner
These two stages may be referred to as a conjoint analysis part, whereas the third stage is a hypothetical auction part. First, at third stage the participants are faced to a reminder screen with the ranges for each attribute (Figure 3.5) and they are asked to make a bid for a standard upright/wired vacuum cleaner. On the next screen the participants see the summary of their bids for several configurations of the product, which are calculated on the basis of the answers in previous stages.
1 We use the same scales as in Norwood and Lusk (2011), in order to avoid inconsistencies due to
differences in methodology and to be able to replicate it exactly.
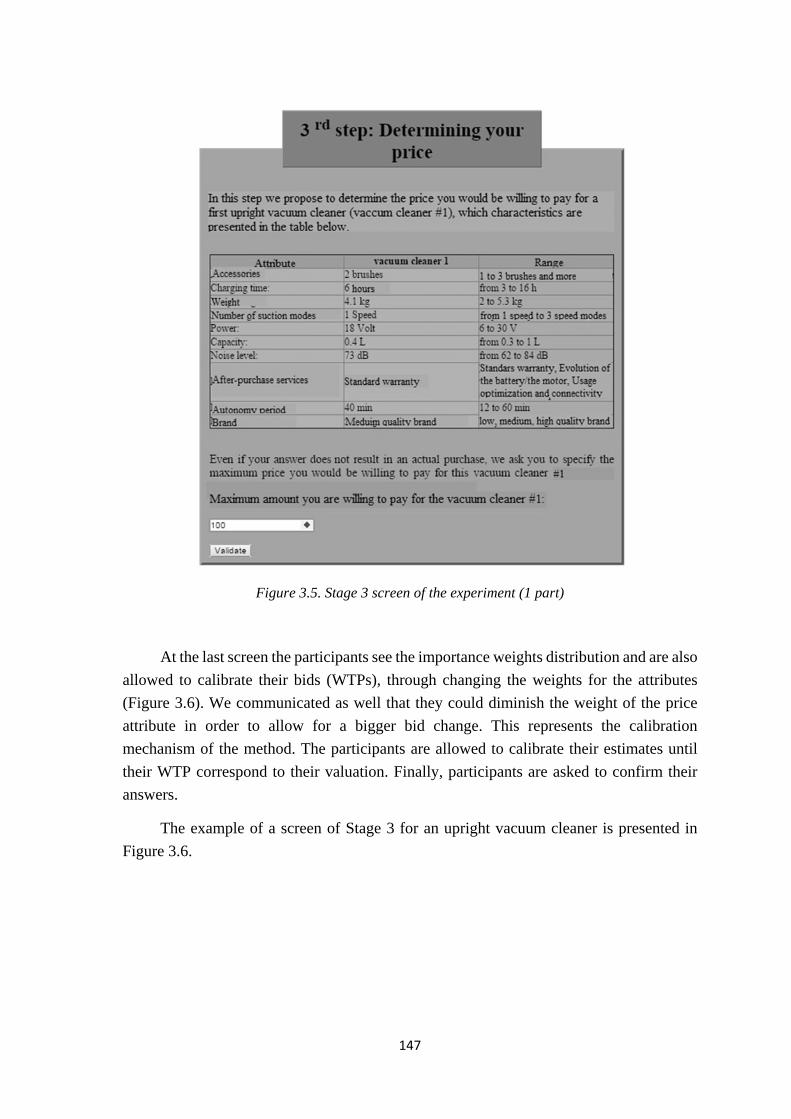
147
Figure 3.5. Stage 3 screen of the experiment (1 part)
At the last screen the participants see the importance weights distribution and are also allowed to calibrate their bids (WTPs), through changing the weights for the attributes (Figure 3.6). We communicated as well that they could diminish the weight of the price attribute in order to allow for a bigger bid change. This represents the calibration mechanism of the method. The participants are allowed to calibrate their estimates until their WTP correspond to their valuation. Finally, participants are asked to confirm their answers.
The example of a screen of Stage 3 for an upright vacuum cleaner is presented in Figure 3.6.
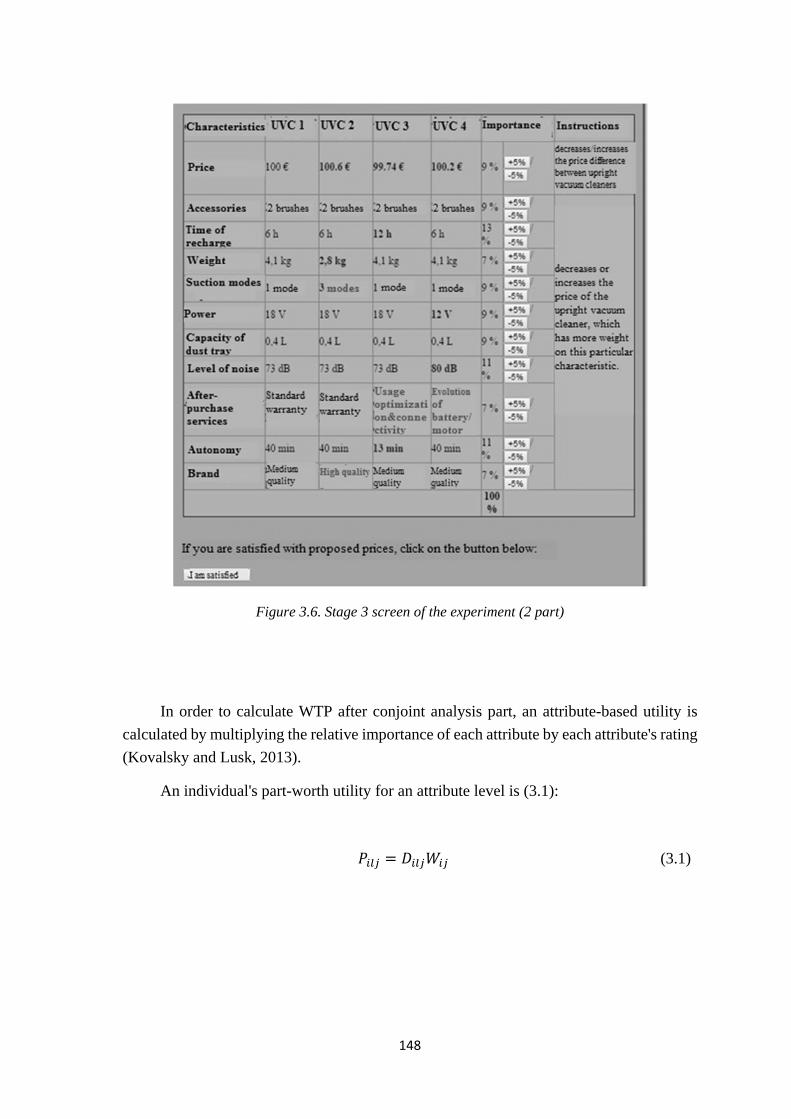
148
Figure 3.6. Stage 3 screen of the experiment (2 part)
In order to calculate WTP after conjoint analysis part, an attribute-based utility is calculated by multiplying the relative importance of each attribute by each attribute's rating (Kovalsky and Lusk, 2013).
An individual's part-worth utility for an attribute level is (3.1):
(3.1)
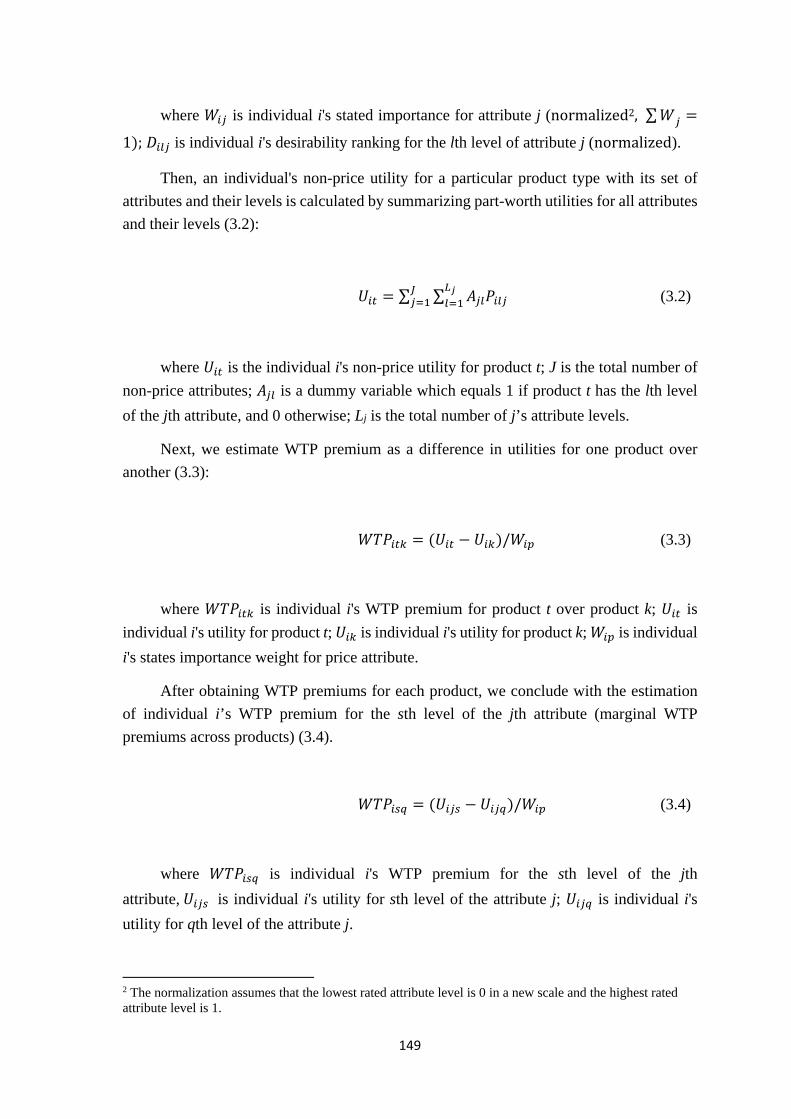
149
where is individual i's stated importance for attribute j (normalized2, ∑
1 ; is individual i's desirability ranking for the lth level of attribute j (normalized).
Then, an individual's non-price utility for a particular product type with its set of attributes and their levels is calculated by summarizing part-worth utilities for all attributes and their levels (3.2):
∑ ∑ (3.2)
where is the individual i's non-price utility for product t; J is the total number of non-price attributes; is a dummy variable which equals 1 if product t has the lth level of the jth attribute, and 0 otherwise; Lj is the total number of j’s attribute levels.
Next, we estimate WTP premium as a difference in utilities for one product over another (3.3):
/ (3.3)
where is individual i's WTP premium for product t over product k; is individual i's utility for product t; is individual i's utility for product k; is individual i's states importance weight for price attribute.
After obtaining WTP premiums for each product, we conclude with the estimation of individual i’s WTP premium for the sth level of the jth attribute (marginal WTP premiums across products) (3.4).
/ (3.4)
where is individual i's WTP premium for the sth level of the jth attribute, is individual i's utility for sth level of the attribute j; is individual i's utility for qth level of the attribute j.
2 The normalization assumes that the lowest rated attribute level is 0 in a new scale and the highest rated attribute level is 1.
150
This method allows a participant to analyze a large number of attributes one by one and to recalculate the bids (by changing the weight for an attribute ( ) if at the end of the session they do not agree with the calculation of their bids. So, at this stage participants "calibrate" their answers of the two previous stages. The ability to revise the rating makes these hypothetical answers more sincere. Norwood and Lusk (2011) report that 99% of participants change their ratings after seeing the results of the WTP calculation. In Kovalsky and Lusk (2013), this parameter is 45% when an online survey tool is used.
Original method uses BDM auction mechanism to elicit non-hypothetical willingness to pay and asks the participants to actually buy one of proposed products. In our research, due to unavailability of the products of research, we present the auction part as in Norwood and Lusk (2011) with BDM mechanism, where a weakly dominant strategy is to honestly state the real value for the product. Each participant places a bid for a standard product and then we stop the experiment after WTP estimation for the upgraded products. Finally, to be sure that participants follow the honesty strategy we ask them to confirm their agreement with the estimates. Even in absence of the “real” auction we claim that the presentation of the auction mechanism and thus several concrete choice options, like in real market choice situation, with the prices (WTPs) announced in €, we force the participants to believe that they are faced to a real choice and their hypothetical responses will be close to their real WTP.
To our knowledge, this research is the only one that uses CACM for durable products with an upgrade possibility.
2. The experiment on upright and wired vacuum cleaners
2.1. General information on the method and the experimental design
For CACM (Calibrated Auction-Conjoint Method) treatment the WTP measurements were calculated on the basis of consumers’ answers to multiple questions about vacuum cleaners. This type of product was chosen with our industrial partner.
The concept of upgradeable products was applied to two types of vacuum cleaner: an upright wireless vacuum cleaner and a wired vacuum cleaner. Based on the results of previous studies (Michaud et al., 2015) and on the commercialization results of a non-
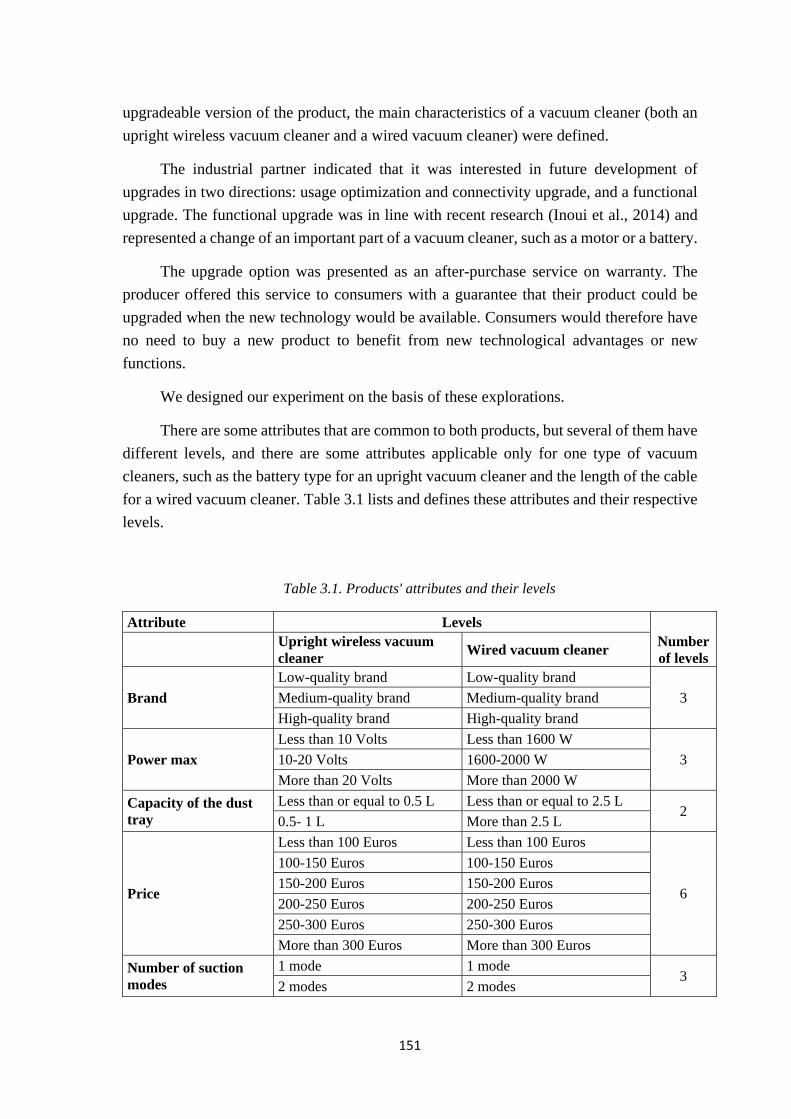
151
upgradeable version of the product, the main characteristics of a vacuum cleaner (both an upright wireless vacuum cleaner and a wired vacuum cleaner) were defined.
The industrial partner indicated that it was interested in future development of upgrades in two directions: usage optimization and connectivity upgrade, and a functional upgrade. The functional upgrade was in line with recent research (Inoui et al., 2014) and represented a change of an important part of a vacuum cleaner, such as a motor or a battery.
The upgrade option was presented as an after-purchase service on warranty. The producer offered this service to consumers with a guarantee that their product could be upgraded when the new technology would be available. Consumers would therefore have no need to buy a new product to benefit from new technological advantages or new functions.
We designed our experiment on the basis of these explorations.
There are some attributes that are common to both products, but several of them have different levels, and there are some attributes applicable only for one type of vacuum cleaners, such as the battery type for an upright vacuum cleaner and the length of the cable for a wired vacuum cleaner. Table 3.1 lists and defines these attributes and their respective levels.
Table 3.1. Products' attributes and their levels
Attribute Levels Number of levels Upright wireless vacuum
cleaner Wired vacuum cleaner
Brand Low-quality brand Low-quality brand
3 Medium-quality brand Medium-quality brand High-quality brand High-quality brand
Power max Less than 10 Volts Less than 1600 W
3 10-20 Volts 1600-2000 W More than 20 Volts More than 2000 W
Capacity of the dust tray
Less than or equal to 0.5 L Less than or equal to 2.5 L 2
0.5- 1 L More than 2.5 L
Price
Less than 100 Euros Less than 100 Euros
6
100-150 Euros 100-150 Euros 150-200 Euros 150-200 Euros 200-250 Euros 200-250 Euros 250-300 Euros 250-300 Euros More than 300 Euros More than 300 Euros
Number of suction modes
1 mode 1 mode 3
2 modes 2 modes
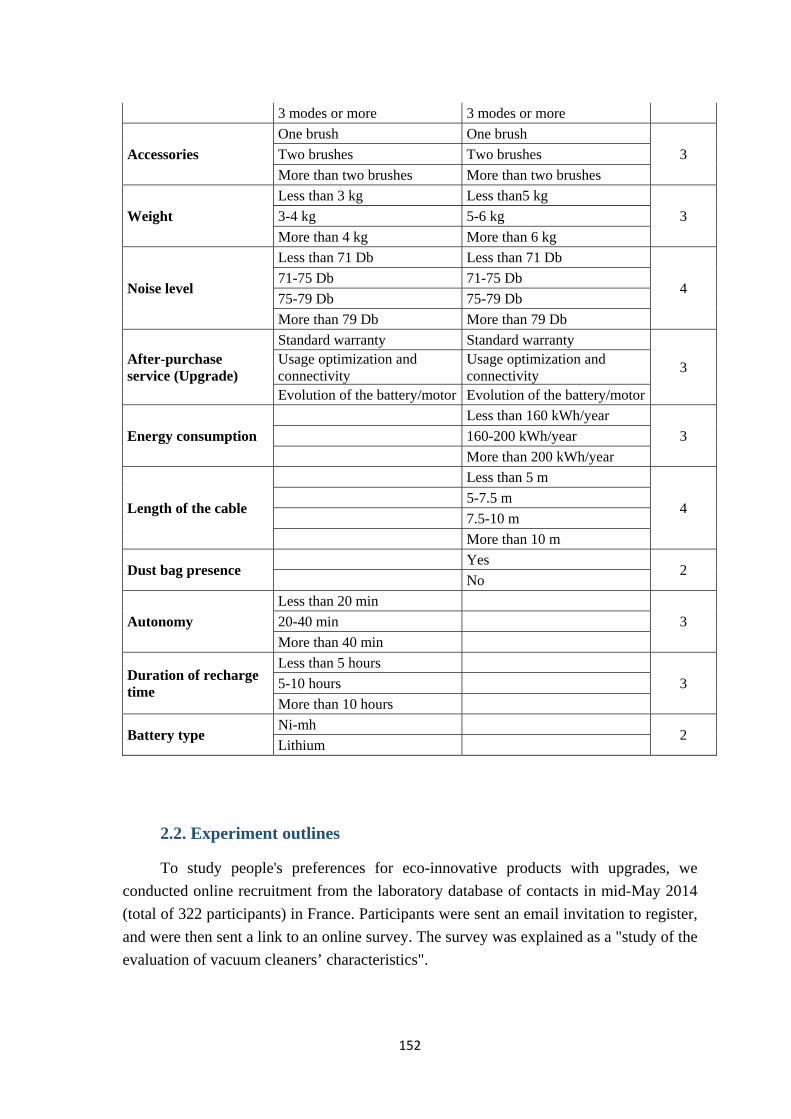
152
3 modes or more 3 modes or more
Accessories One brush One brush
3 Two brushes Two brushes More than two brushes More than two brushes
Weight Less than 3 kg Less than5 kg
3 3-4 kg 5-6 kg More than 4 kg More than 6 kg
Noise level
Less than 71 Db Less than 71 Db
4 71-75 Db 71-75 Db 75-79 Db 75-79 Db More than 79 Db More than 79 Db
After-purchase service (Upgrade)
Standard warranty Standard warranty
3 Usage optimization and connectivity
Usage optimization and connectivity
Evolution of the battery/motor Evolution of the battery/motor
Energy consumption Less than 160 kWh/year
3 160-200 kWh/year More than 200 kWh/year
Length of the cable
Less than 5 m
4 5-7.5 m 7.5-10 m More than 10 m
Dust bag presence Yes
2 No
Autonomy Less than 20 min
3 20-40 min More than 40 min
Duration of recharge time
Less than 5 hours 3 5-10 hours
More than 10 hours
Battery type Ni-mh
2 Lithium
2.2. Experiment outlines
To study people's preferences for eco-innovative products with upgrades, we conducted online recruitment from the laboratory database of contacts in mid-May 2014 (total of 322 participants) in France. Participants were sent an email invitation to register, and were then sent a link to an online survey. The survey was explained as a "study of the evaluation of vacuum cleaners’ characteristics".
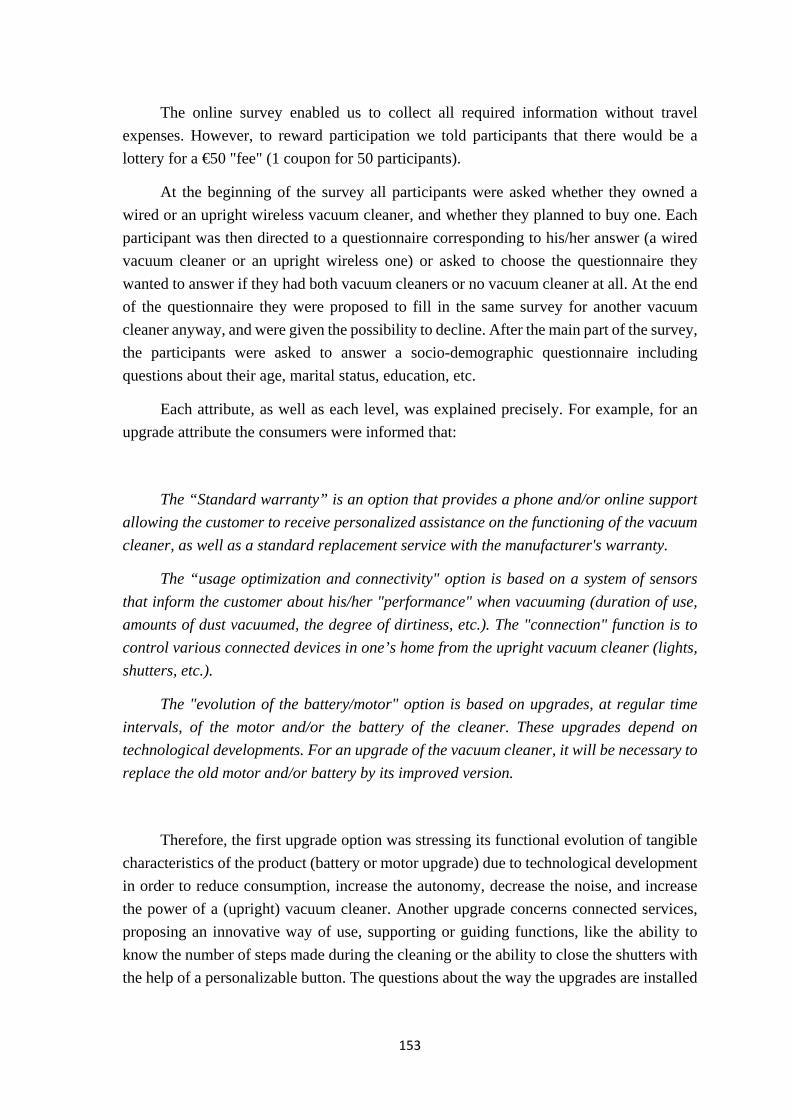
153
The online survey enabled us to collect all required information without travel expenses. However, to reward participation we told participants that there would be a lottery for a €50 "fee" (1 coupon for 50 participants).
At the beginning of the survey all participants were asked whether they owned a wired or an upright wireless vacuum cleaner, and whether they planned to buy one. Each participant was then directed to a questionnaire corresponding to his/her answer (a wired vacuum cleaner or an upright wireless one) or asked to choose the questionnaire they wanted to answer if they had both vacuum cleaners or no vacuum cleaner at all. At the end of the questionnaire they were proposed to fill in the same survey for another vacuum cleaner anyway, and were given the possibility to decline. After the main part of the survey, the participants were asked to answer a socio-demographic questionnaire including questions about their age, marital status, education, etc.
Each attribute, as well as each level, was explained precisely. For example, for an upgrade attribute the consumers were informed that:
The “Standard warranty” is an option that provides a phone and/or online support
allowing the customer to receive personalized assistance on the functioning of the vacuum
cleaner, as well as a standard replacement service with the manufacturer's warranty.
The “usage optimization and connectivity" option is based on a system of sensors
that inform the customer about his/her "performance" when vacuuming (duration of use,
amounts of dust vacuumed, the degree of dirtiness, etc.). The "connection" function is to
control various connected devices in one’s home from the upright vacuum cleaner (lights,
shutters, etc.).
The "evolution of the battery/motor" option is based on upgrades, at regular time
intervals, of the motor and/or the battery of the cleaner. These upgrades depend on
technological developments. For an upgrade of the vacuum cleaner, it will be necessary to
replace the old motor and/or battery by its improved version.
Therefore, the first upgrade option was stressing its functional evolution of tangible characteristics of the product (battery or motor upgrade) due to technological development in order to reduce consumption, increase the autonomy, decrease the noise, and increase the power of a (upright) vacuum cleaner. Another upgrade concerns connected services, proposing an innovative way of use, supporting or guiding functions, like the ability to know the number of steps made during the cleaning or the ability to close the shutters with the help of a personalizable button. The questions about the way the upgrades are installed
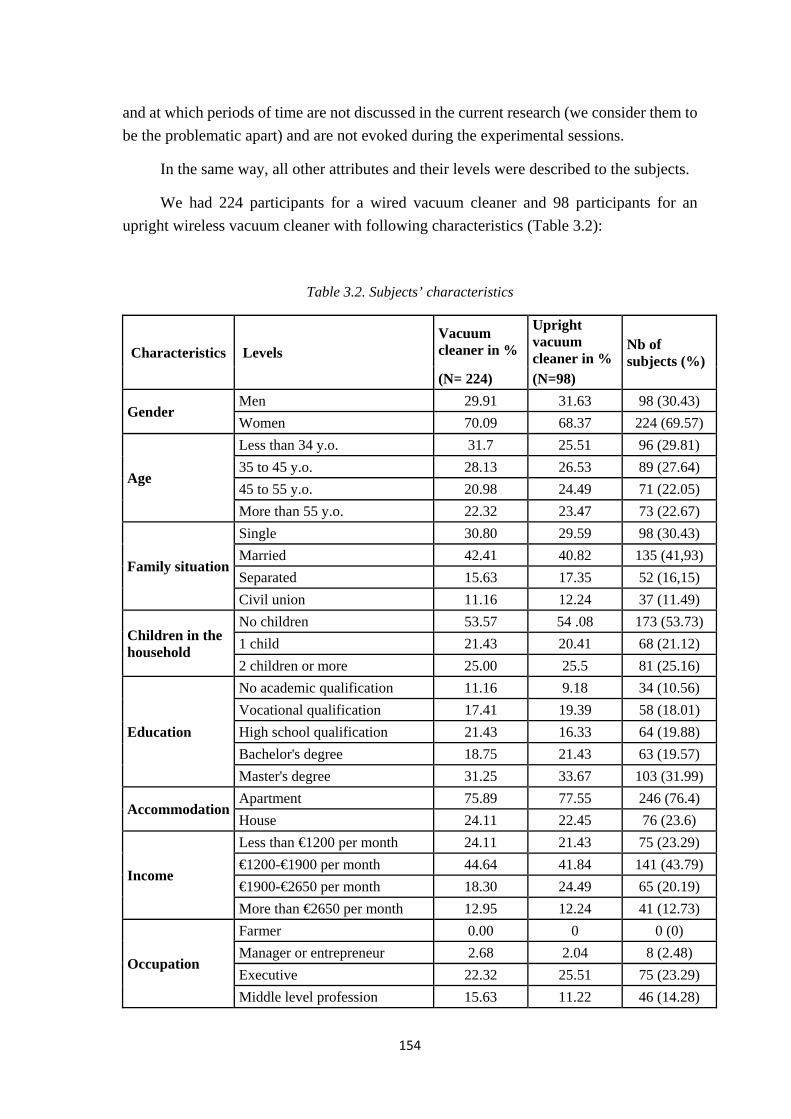
154
and at which periods of time are not discussed in the current research (we consider them to be the problematic apart) and are not evoked during the experimental sessions.
In the same way, all other attributes and their levels were described to the subjects.
We had 224 participants for a wired vacuum cleaner and 98 participants for an upright wireless vacuum cleaner with following characteristics (Table 3.2):
Table 3.2. Subjects’ characteristics
Characteristics Levels Vacuum cleaner in %
Upright vacuum cleaner in %
Nb of subjects (%)
(N= 224) (N=98)
Gender Men 29.91 31.63 98 (30.43) Women 70.09 68.37 224 (69.57)
Age
Less than 34 y.o. 31.7 25.51 96 (29.81) 35 to 45 y.o. 28.13 26.53 89 (27.64) 45 to 55 y.o. 20.98 24.49 71 (22.05) More than 55 y.o. 22.32 23.47 73 (22.67)
Family situation
Single 30.80 29.59 98 (30.43) Married 42.41 40.82 135 (41,93) Separated 15.63 17.35 52 (16,15) Civil union 11.16 12.24 37 (11.49)
Children in the household
No children 53.57 54 .08 173 (53.73) 1 child 21.43 20.41 68 (21.12) 2 children or more 25.00 25.5 81 (25.16)
Education
No academic qualification 11.16 9.18 34 (10.56) Vocational qualification 17.41 19.39 58 (18.01) High school qualification 21.43 16.33 64 (19.88) Bachelor's degree 18.75 21.43 63 (19.57) Master's degree 31.25 33.67 103 (31.99)
Accommodation Apartment 75.89 77.55 246 (76.4) House 24.11 22.45 76 (23.6)
Income
Less than €1200 per month 24.11 21.43 75 (23.29) €1200-€1900 per month 44.64 41.84 141 (43.79) €1900-€2650 per month 18.30 24.49 65 (20.19) More than €2650 per month 12.95 12.24 41 (12.73)
Occupation
Farmer 0.00 0 0 (0) Manager or entrepreneur 2.68 2.04 8 (2.48) Executive 22.32 25.51 75 (23.29) Middle level profession 15.63 11.22 46 (14.28)
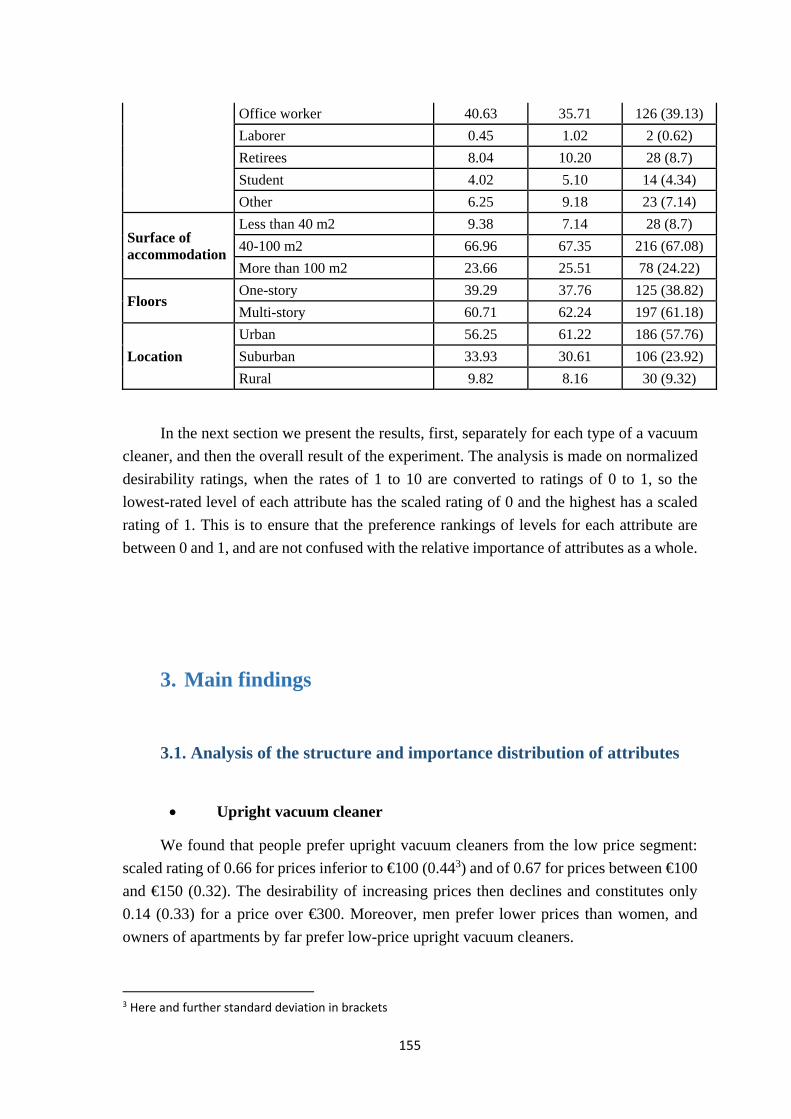
155
Office worker 40.63 35.71 126 (39.13) Laborer 0.45 1.02 2 (0.62) Retirees 8.04 10.20 28 (8.7) Student 4.02 5.10 14 (4.34) Other 6.25 9.18 23 (7.14)
Surface of accommodation
Less than 40 m2 9.38 7.14 28 (8.7) 40-100 m2 66.96 67.35 216 (67.08) More than 100 m2 23.66 25.51 78 (24.22)
Floors One-story 39.29 37.76 125 (38.82) Multi-story 60.71 62.24 197 (61.18)
Location Urban 56.25 61.22 186 (57.76) Suburban 33.93 30.61 106 (23.92) Rural 9.82 8.16 30 (9.32)
In the next section we present the results, first, separately for each type of a vacuum cleaner, and then the overall result of the experiment. The analysis is made on normalized desirability ratings, when the rates of 1 to 10 are converted to ratings of 0 to 1, so the lowest-rated level of each attribute has the scaled rating of 0 and the highest has a scaled rating of 1. This is to ensure that the preference rankings of levels for each attribute are between 0 and 1, and are not confused with the relative importance of attributes as a whole.
3. Main findings
3.1. Analysis of the structure and importance distribution of attributes
Upright vacuum cleaner
We found that people prefer upright vacuum cleaners from the low price segment: scaled rating of 0.66 for prices inferior to €100 (0.443) and of 0.67 for prices between €100 and €150 (0.32). The desirability of increasing prices then declines and constitutes only 0.14 (0.33) for a price over €300. Moreover, men prefer lower prices than women, and owners of apartments by far prefer low-price upright vacuum cleaners.
3 Here and further standard deviation in brackets
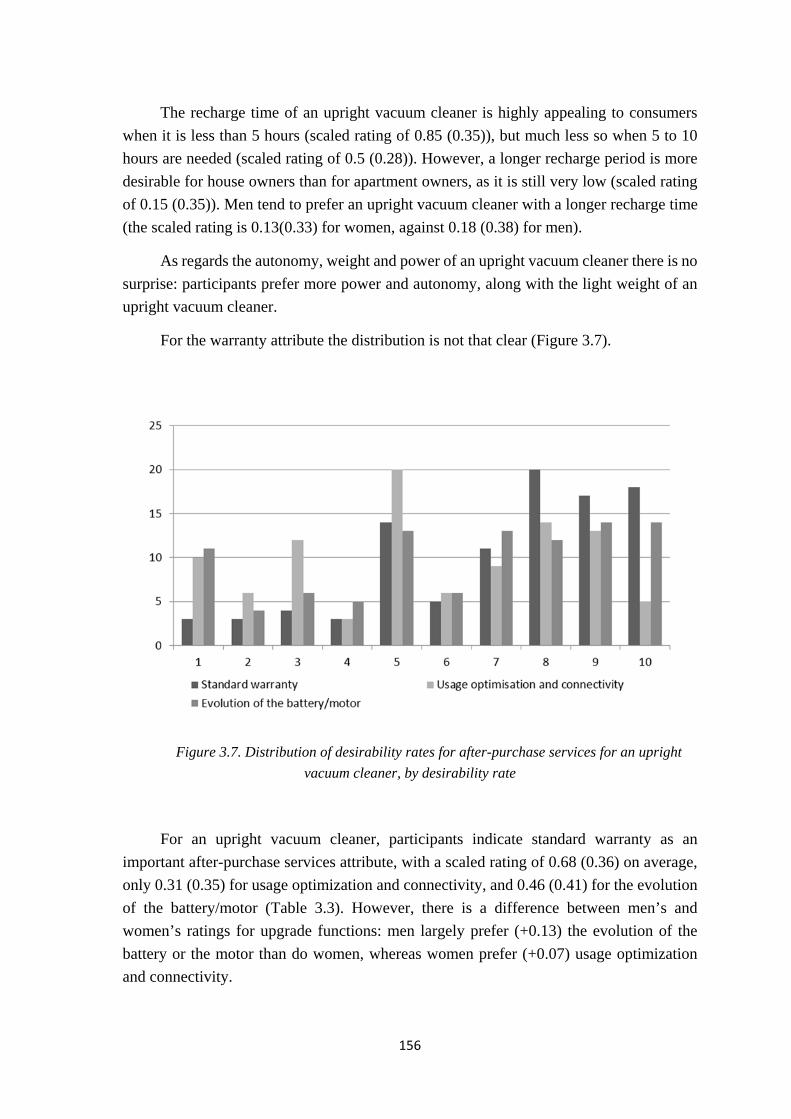
156
The recharge time of an upright vacuum cleaner is highly appealing to consumers when it is less than 5 hours (scaled rating of 0.85 (0.35)), but much less so when 5 to 10 hours are needed (scaled rating of 0.5 (0.28)). However, a longer recharge period is more desirable for house owners than for apartment owners, as it is still very low (scaled rating of 0.15 (0.35)). Men tend to prefer an upright vacuum cleaner with a longer recharge time (the scaled rating is 0.13(0.33) for women, against 0.18 (0.38) for men).
As regards the autonomy, weight and power of an upright vacuum cleaner there is no surprise: participants prefer more power and autonomy, along with the light weight of an upright vacuum cleaner.
For the warranty attribute the distribution is not that clear (Figure 3.7).
Figure 3.7. Distribution of desirability rates for after-purchase services for an upright
vacuum cleaner, by desirability rate
For an upright vacuum cleaner, participants indicate standard warranty as an important after-purchase services attribute, with a scaled rating of 0.68 (0.36) on average, only 0.31 (0.35) for usage optimization and connectivity, and 0.46 (0.41) for the evolution of the battery/motor (Table 3.3). However, there is a difference between men’s and women’s ratings for upgrade functions: men largely prefer (+0.13) the evolution of the battery or the motor than do women, whereas women prefer (+0.07) usage optimization and connectivity.
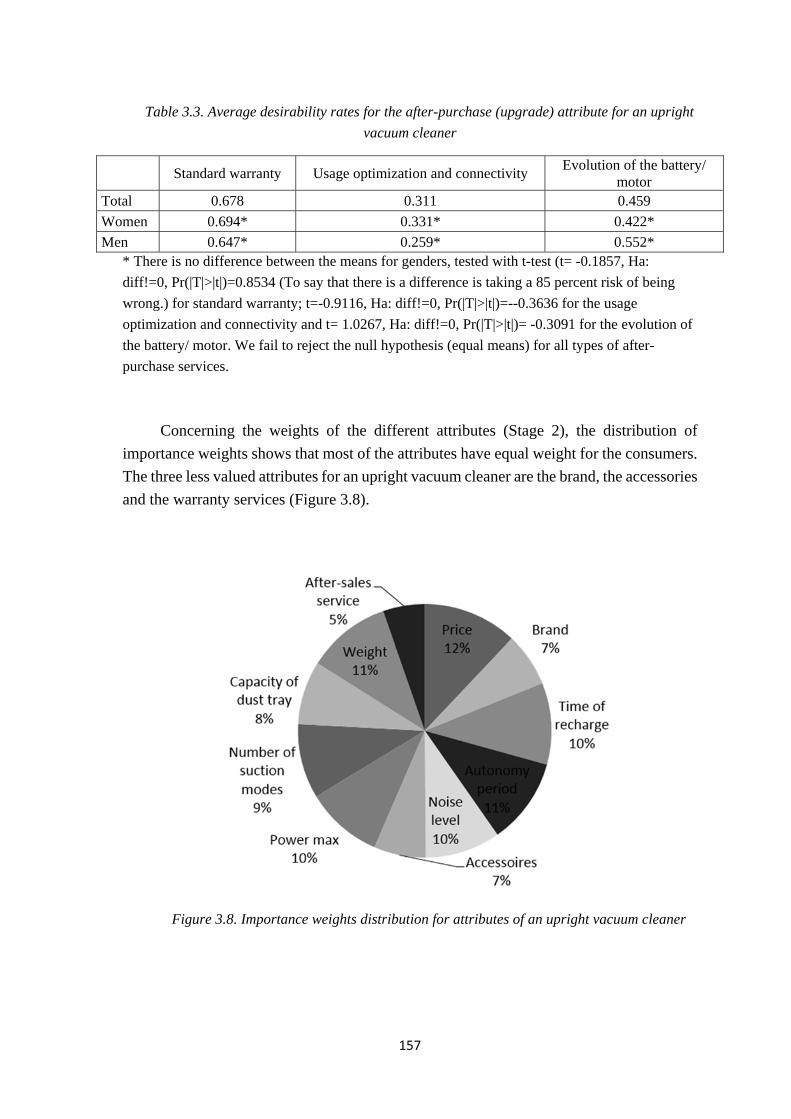
157
Table 3.3. Average desirability rates for the after-purchase (upgrade) attribute for an upright
vacuum cleaner
Standard warranty Usage optimization and connectivity Evolution of the battery/ motor
Total 0.678 0.311 0.459 Women 0.694* 0.331* 0.422* Men 0.647* 0.259* 0.552*
* There is no difference between the means for genders, tested with t-test (t= -0.1857, Ha: diff!=0, Pr(|T|>|t|)=0.8534 (To say that there is a difference is taking a 85 percent risk of being wrong.) for standard warranty; t=-0.9116, Ha: diff!=0, Pr(|T|>|t|)=--0.3636 for the usage optimization and connectivity and t= 1.0267, Ha: diff!=0, Pr(|T|>|t|)= -0.3091 for the evolution of the battery/ motor. We fail to reject the null hypothesis (equal means) for all types of after-purchase services.
Concerning the weights of the different attributes (Stage 2), the distribution of importance weights shows that most of the attributes have equal weight for the consumers. The three less valued attributes for an upright vacuum cleaner are the brand, the accessories and the warranty services (Figure 3.8).
Figure 3.8. Importance weights distribution for attributes of an upright vacuum cleaner
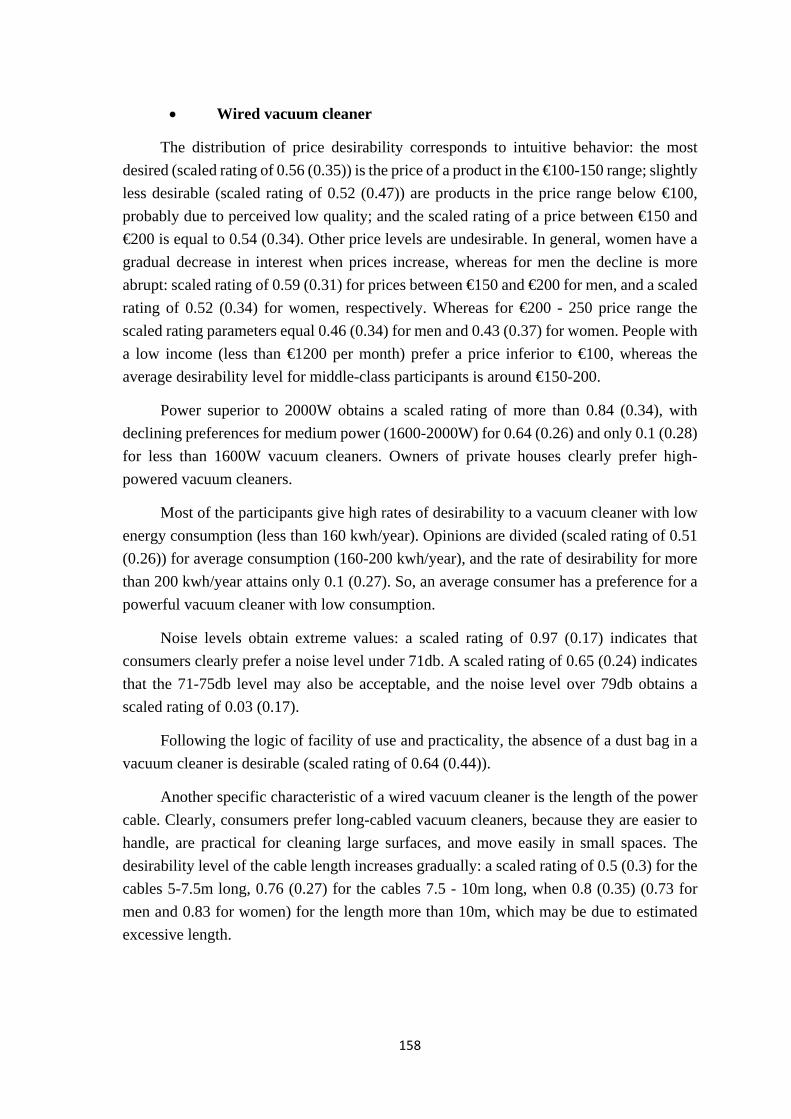
158
Wired vacuum cleaner
The distribution of price desirability corresponds to intuitive behavior: the most desired (scaled rating of 0.56 (0.35)) is the price of a product in the €100-150 range; slightly less desirable (scaled rating of 0.52 (0.47)) are products in the price range below €100, probably due to perceived low quality; and the scaled rating of a price between €150 and €200 is equal to 0.54 (0.34). Other price levels are undesirable. In general, women have a gradual decrease in interest when prices increase, whereas for men the decline is more abrupt: scaled rating of 0.59 (0.31) for prices between €150 and €200 for men, and a scaled rating of 0.52 (0.34) for women, respectively. Whereas for €200 - 250 price range the scaled rating parameters equal 0.46 (0.34) for men and 0.43 (0.37) for women. People with a low income (less than €1200 per month) prefer a price inferior to €100, whereas the average desirability level for middle-class participants is around €150-200.
Power superior to 2000W obtains a scaled rating of more than 0.84 (0.34), with declining preferences for medium power (1600-2000W) for 0.64 (0.26) and only 0.1 (0.28) for less than 1600W vacuum cleaners. Owners of private houses clearly prefer high-powered vacuum cleaners.
Most of the participants give high rates of desirability to a vacuum cleaner with low energy consumption (less than 160 kwh/year). Opinions are divided (scaled rating of 0.51 (0.26)) for average consumption (160-200 kwh/year), and the rate of desirability for more than 200 kwh/year attains only 0.1 (0.27). So, an average consumer has a preference for a powerful vacuum cleaner with low consumption.
Noise levels obtain extreme values: a scaled rating of 0.97 (0.17) indicates that consumers clearly prefer a noise level under 71db. A scaled rating of 0.65 (0.24) indicates that the 71-75db level may also be acceptable, and the noise level over 79db obtains a scaled rating of 0.03 (0.17).
Following the logic of facility of use and practicality, the absence of a dust bag in a vacuum cleaner is desirable (scaled rating of 0.64 (0.44)).
Another specific characteristic of a wired vacuum cleaner is the length of the power cable. Clearly, consumers prefer long-cabled vacuum cleaners, because they are easier to handle, are practical for cleaning large surfaces, and move easily in small spaces. The desirability level of the cable length increases gradually: a scaled rating of 0.5 (0.3) for the cables 5-7.5m long, 0.76 (0.27) for the cables 7.5 - 10m long, when 0.8 (0.35) (0.73 for men and 0.83 for women) for the length more than 10m, which may be due to estimated excessive length.
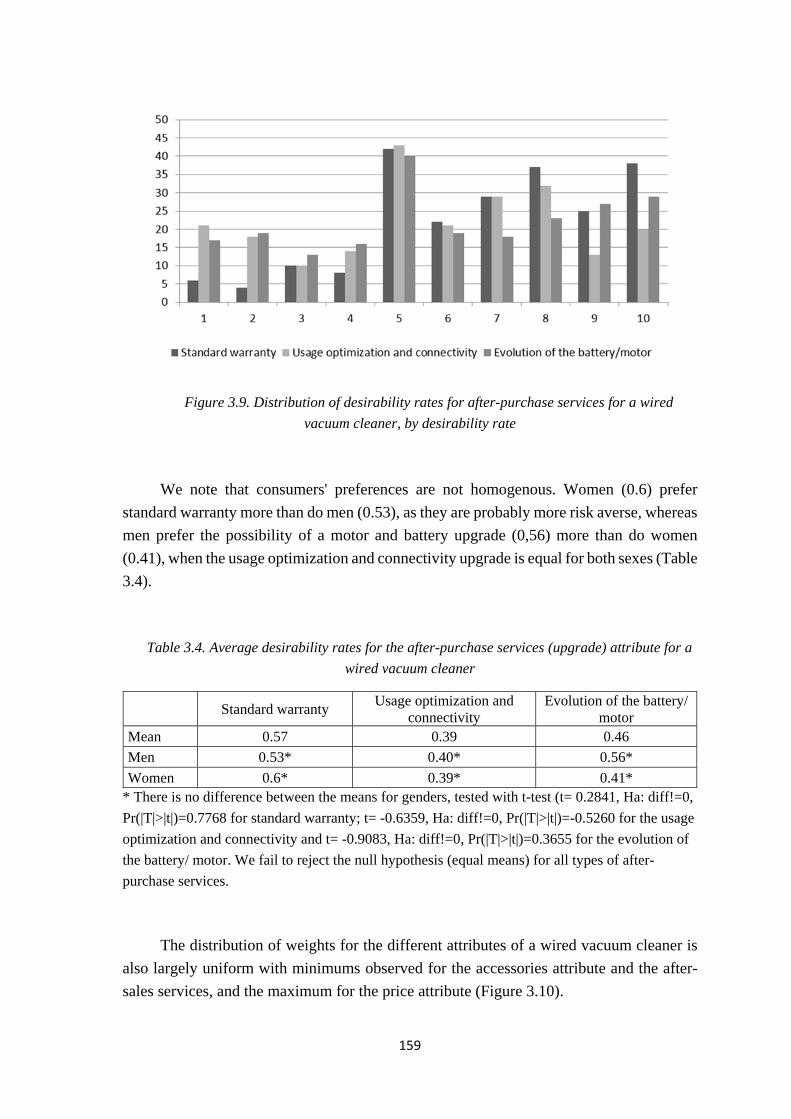
159
Figure 3.9. Distribution of desirability rates for after-purchase services for a wired
vacuum cleaner, by desirability rate
We note that consumers' preferences are not homogenous. Women (0.6) prefer standard warranty more than do men (0.53), as they are probably more risk averse, whereas men prefer the possibility of a motor and battery upgrade (0,56) more than do women (0.41), when the usage optimization and connectivity upgrade is equal for both sexes (Table 3.4).
Table 3.4. Average desirability rates for the after-purchase services (upgrade) attribute for a
wired vacuum cleaner
Standard warranty Usage optimization and connectivity
Evolution of the battery/ motor
Mean 0.57 0.39 0.46 Men 0.53* 0.40* 0.56* Women 0.6* 0.39* 0.41*
* There is no difference between the means for genders, tested with t-test (t= 0.2841, Ha: diff!=0, Pr(|T|>|t|)=0.7768 for standard warranty; t= -0.6359, Ha: diff!=0, Pr(|T|>|t|)=-0.5260 for the usage optimization and connectivity and t= -0.9083, Ha: diff!=0, Pr(|T|>|t|)=0.3655 for the evolution of the battery/ motor. We fail to reject the null hypothesis (equal means) for all types of after-purchase services.
The distribution of weights for the different attributes of a wired vacuum cleaner is also largely uniform with minimums observed for the accessories attribute and the after-sales services, and the maximum for the price attribute (Figure 3.10).
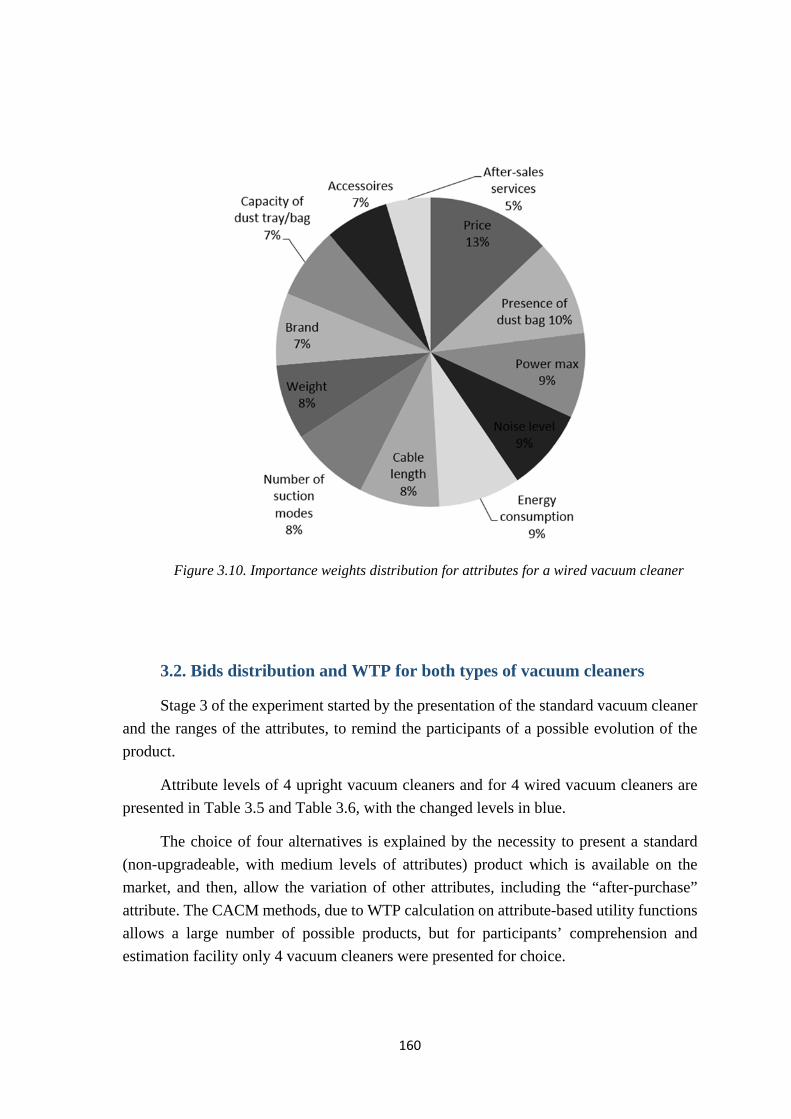
160
Figure 3.10. Importance weights distribution for attributes for a wired vacuum cleaner
3.2. Bids distribution and WTP for both types of vacuum cleaners
Stage 3 of the experiment started by the presentation of the standard vacuum cleaner and the ranges of the attributes, to remind the participants of a possible evolution of the product.
Attribute levels of 4 upright vacuum cleaners and for 4 wired vacuum cleaners are presented in Table 3.5 and Table 3.6, with the changed levels in blue.
The choice of four alternatives is explained by the necessity to present a standard (non-upgradeable, with medium levels of attributes) product which is available on the market, and then, allow the variation of other attributes, including the “after-purchase” attribute. The CACM methods, due to WTP calculation on attribute-based utility functions allows a large number of possible products, but for participants’ comprehension and estimation facility only 4 vacuum cleaners were presented for choice.
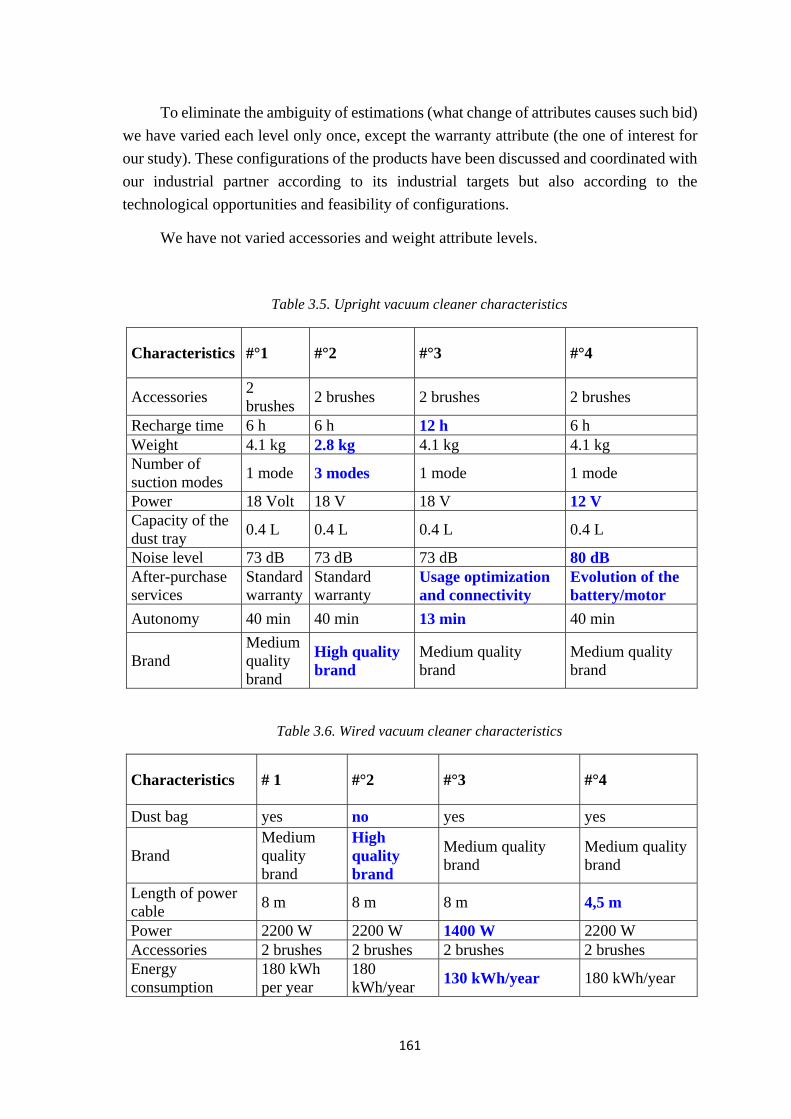
161
To eliminate the ambiguity of estimations (what change of attributes causes such bid) we have varied each level only once, except the warranty attribute (the one of interest for our study). These configurations of the products have been discussed and coordinated with our industrial partner according to its industrial targets but also according to the technological opportunities and feasibility of configurations.
We have not varied accessories and weight attribute levels.
Table 3.5. Upright vacuum cleaner characteristics
Characteristics #°1 #°2 #°3 #°4
Accessories 2 brushes 2 brushes 2 brushes 2 brushes
Recharge time 6 h 6 h 12 h 6 h Weight 4.1 kg 2.8 kg 4.1 kg 4.1 kg Number of suction modes 1 mode 3 modes 1 mode 1 mode
Power 18 Volt 18 V 18 V 12 V Capacity of the dust tray 0.4 L 0.4 L 0.4 L 0.4 L
Noise level 73 dB 73 dB 73 dB 80 dB After-purchase services
Standard warranty
Standard warranty
Usage optimization and connectivity
Evolution of the battery/motor
Autonomy 40 min 40 min 13 min 40 min
Brand Medium quality brand
High quality brand
Medium quality brand
Medium quality brand
Table 3.6. Wired vacuum cleaner characteristics
Characteristics # 1 #°2 #°3 #°4
Dust bag yes no yes yes
Brand Medium quality brand
High quality brand
Medium quality brand
Medium quality brand
Length of power cable 8 m 8 m 8 m 4,5 m
Power 2200 W 2200 W 1400 W 2200 W Accessories 2 brushes 2 brushes 2 brushes 2 brushes Energy consumption
180 kWh per year
180 kWh/year 130 kWh/year 180 kWh/year
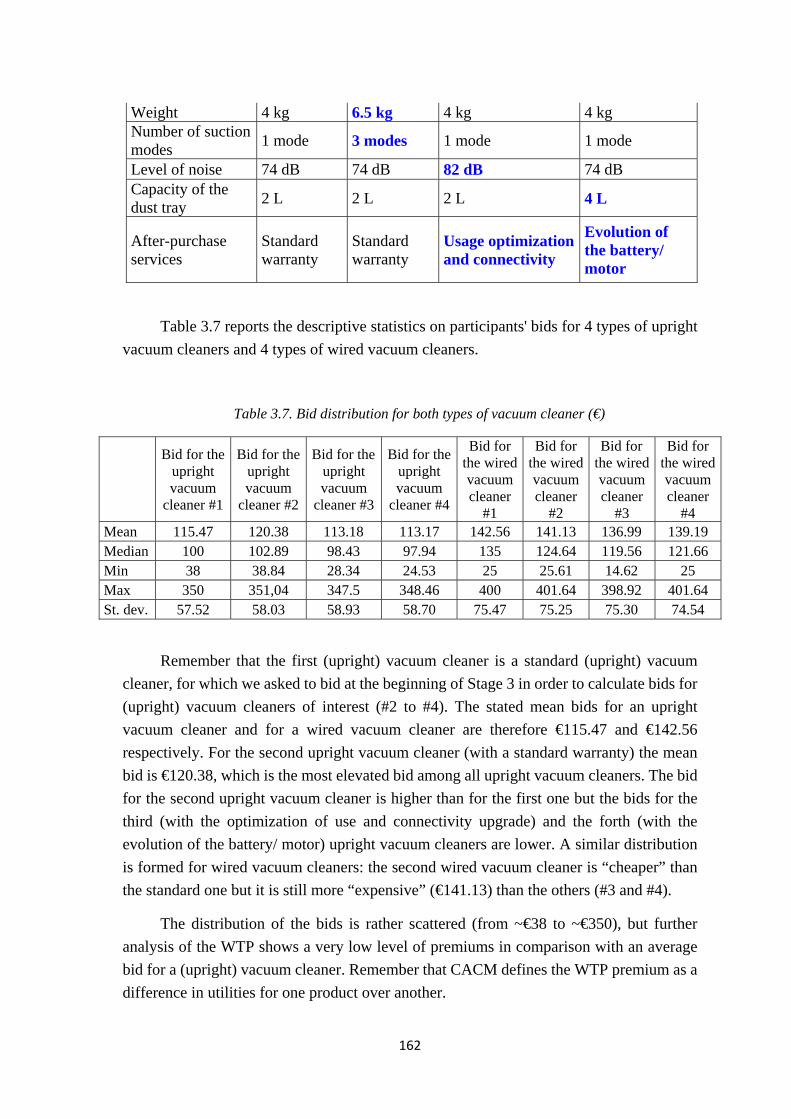
162
Weight 4 kg 6.5 kg 4 kg 4 kg Number of suction modes 1 mode 3 modes 1 mode 1 mode
Level of noise 74 dB 74 dB 82 dB 74 dB Capacity of the dust tray 2 L 2 L 2 L 4 L
After-purchase services
Standard warranty
Standard warranty
Usage optimization and connectivity
Evolution of the battery/ motor
Table 3.7 reports the descriptive statistics on participants' bids for 4 types of upright vacuum cleaners and 4 types of wired vacuum cleaners.
Table 3.7. Bid distribution for both types of vacuum cleaner (€)
Bid for the
upright vacuum
cleaner #1
Bid for the upright vacuum
cleaner #2
Bid for the upright vacuum
cleaner #3
Bid for the upright vacuum
cleaner #4
Bid for the wired vacuum cleaner
#1
Bid for the wired vacuum cleaner
#2
Bid for the wired vacuum cleaner
#3
Bid for the wired vacuum cleaner
#4 Mean 115.47 120.38 113.18 113.17 142.56 141.13 136.99 139.19 Median 100 102.89 98.43 97.94 135 124.64 119.56 121.66 Min 38 38.84 28.34 24.53 25 25.61 14.62 25 Max 350 351,04 347.5 348.46 400 401.64 398.92 401.64 St. dev. 57.52 58.03 58.93 58.70 75.47 75.25 75.30 74.54
Remember that the first (upright) vacuum cleaner is a standard (upright) vacuum cleaner, for which we asked to bid at the beginning of Stage 3 in order to calculate bids for (upright) vacuum cleaners of interest (#2 to #4). The stated mean bids for an upright vacuum cleaner and for a wired vacuum cleaner are therefore €115.47 and €142.56 respectively. For the second upright vacuum cleaner (with a standard warranty) the mean bid is €120.38, which is the most elevated bid among all upright vacuum cleaners. The bid for the second upright vacuum cleaner is higher than for the first one but the bids for the third (with the optimization of use and connectivity upgrade) and the forth (with the evolution of the battery/ motor) upright vacuum cleaners are lower. A similar distribution is formed for wired vacuum cleaners: the second wired vacuum cleaner is “cheaper” than the standard one but it is still more “expensive” (€141.13) than the others (#3 and #4).
The distribution of the bids is rather scattered (from ~€38 to ~€350), but further analysis of the WTP shows a very low level of premiums in comparison with an average bid for a (upright) vacuum cleaner. Remember that CACM defines the WTP premium as a difference in utilities for one product over another.
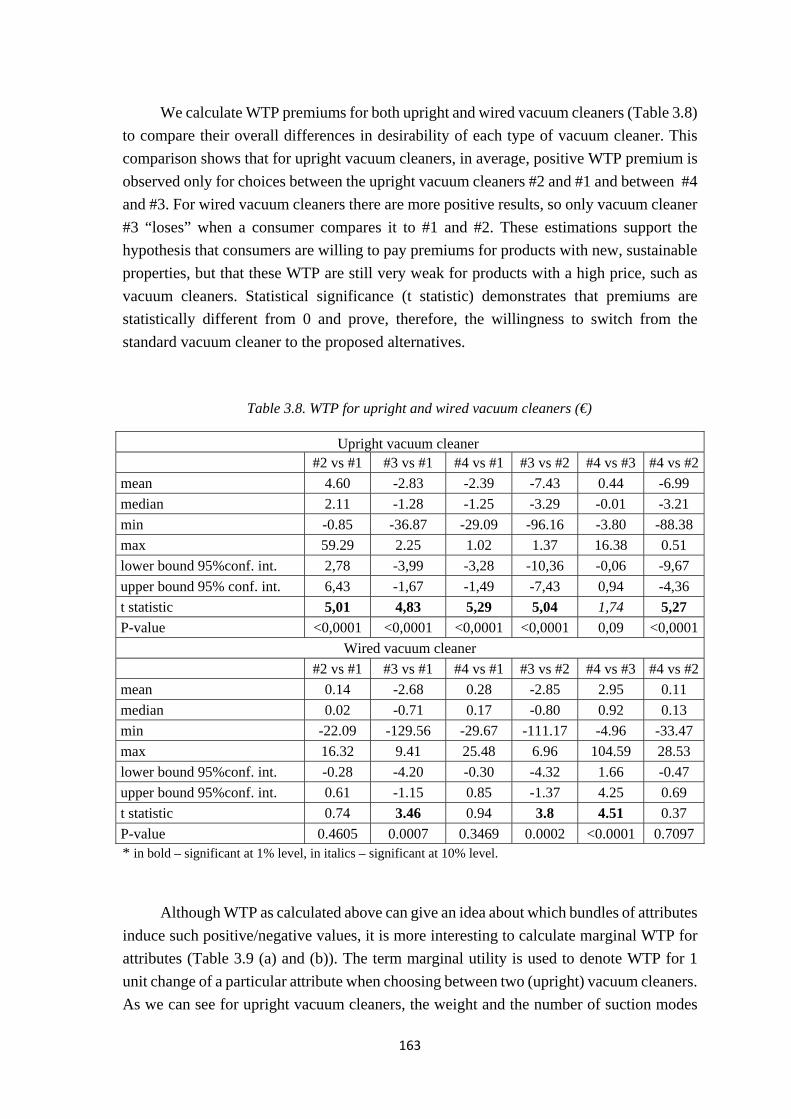
163
We calculate WTP premiums for both upright and wired vacuum cleaners (Table 3.8) to compare their overall differences in desirability of each type of vacuum cleaner. This comparison shows that for upright vacuum cleaners, in average, positive WTP premium is observed only for choices between the upright vacuum cleaners #2 and #1 and between #4 and #3. For wired vacuum cleaners there are more positive results, so only vacuum cleaner #3 “loses” when a consumer compares it to #1 and #2. These estimations support the hypothesis that consumers are willing to pay premiums for products with new, sustainable properties, but that these WTP are still very weak for products with a high price, such as vacuum cleaners. Statistical significance (t statistic) demonstrates that premiums are statistically different from 0 and prove, therefore, the willingness to switch from the standard vacuum cleaner to the proposed alternatives.
Table 3.8. WTP for upright and wired vacuum cleaners (€)
Upright vacuum cleaner #2 vs #1 #3 vs #1 #4 vs #1 #3 vs #2 #4 vs #3 #4 vs #2mean 4.60 -2.83 -2.39 -7.43 0.44 -6.99 median 2.11 -1.28 -1.25 -3.29 -0.01 -3.21 min -0.85 -36.87 -29.09 -96.16 -3.80 -88.38 max 59.29 2.25 1.02 1.37 16.38 0.51 lower bound 95%conf. int. 2,78 -3,99 -3,28 -10,36 -0,06 -9,67 upper bound 95% conf. int. 6,43 -1,67 -1,49 -7,43 0,94 -4,36 t statistic 5,01 4,83 5,29 5,04 1,74 5,27 P-value <0,0001 <0,0001 <0,0001 <0,0001 0,09 <0,0001
Wired vacuum cleaner #2 vs #1 #3 vs #1 #4 vs #1 #3 vs #2 #4 vs #3 #4 vs #2mean 0.14 -2.68 0.28 -2.85 2.95 0.11 median 0.02 -0.71 0.17 -0.80 0.92 0.13 min -22.09 -129.56 -29.67 -111.17 -4.96 -33.47 max 16.32 9.41 25.48 6.96 104.59 28.53 lower bound 95%conf. int. -0.28 -4.20 -0.30 -4.32 1.66 -0.47 upper bound 95%conf. int. 0.61 -1.15 0.85 -1.37 4.25 0.69 t statistic 0.74 3.46 0.94 3.8 4.51 0.37 P-value 0.4605 0.0007 0.3469 0.0002 <0.0001 0.7097 * in bold – significant at 1% level, in italics – significant at 10% level.
Although WTP as calculated above can give an idea about which bundles of attributes induce such positive/negative values, it is more interesting to calculate marginal WTP for attributes (Table 3.9 (a) and (b)). The term marginal utility is used to denote WTP for 1 unit change of a particular attribute when choosing between two (upright) vacuum cleaners. As we can see for upright vacuum cleaners, the weight and the number of suction modes
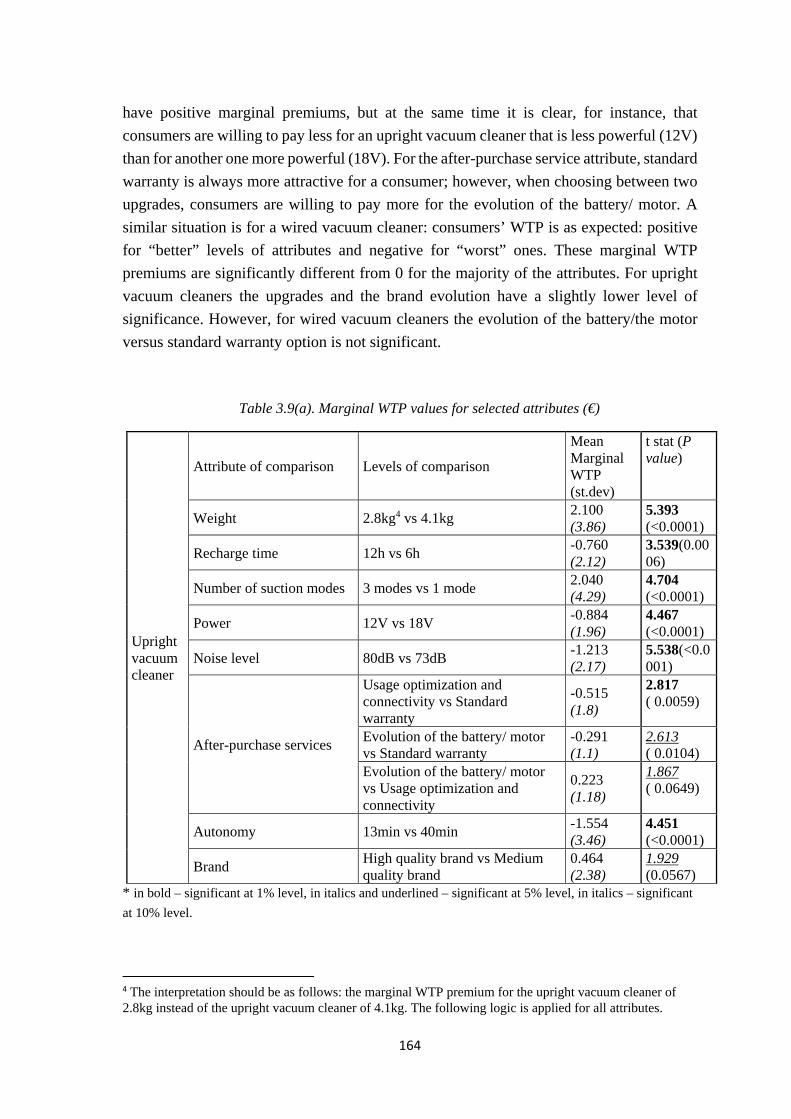
164
have positive marginal premiums, but at the same time it is clear, for instance, that consumers are willing to pay less for an upright vacuum cleaner that is less powerful (12V) than for another one more powerful (18V). For the after-purchase service attribute, standard warranty is always more attractive for a consumer; however, when choosing between two upgrades, consumers are willing to pay more for the evolution of the battery/ motor. A similar situation is for a wired vacuum cleaner: consumers’ WTP is as expected: positive for “better” levels of attributes and negative for “worst” ones. These marginal WTP premiums are significantly different from 0 for the majority of the attributes. For upright vacuum cleaners the upgrades and the brand evolution have a slightly lower level of significance. However, for wired vacuum cleaners the evolution of the battery/the motor versus standard warranty option is not significant.
Table 3.9(a). Marginal WTP values for selected attributes (€)
Upright vacuum cleaner
Attribute of comparison Levels of comparison
Mean Marginal WTP (st.dev)
t stat (P value)
Weight 2.8kg4 vs 4.1kg 2.100 (3.86)
5.393 (<0.0001)
Recharge time 12h vs 6h -0.760 (2.12)
3.539(0.0006)
Number of suction modes 3 modes vs 1 mode 2.040 (4.29)
4.704 (<0.0001)
Power 12V vs 18V -0.884 (1.96)
4.467 (<0.0001)
Noise level 80dB vs 73dB -1.213 (2.17)
5.538(<0.0001)
After-purchase services
Usage optimization and connectivity vs Standard warranty
-0.515 (1.8)
2.817 ( 0.0059)
Evolution of the battery/ motor vs Standard warranty
-0.291 (1.1)
2.613 ( 0.0104)
Evolution of the battery/ motor vs Usage optimization and connectivity
0.223 (1.18)
1.867 ( 0.0649)
Autonomy 13min vs 40min -1.554 (3.46)
4.451 (<0.0001)
Brand High quality brand vs Medium quality brand
0.464 (2.38)
1.929 (0.0567)
* in bold – significant at 1% level, in italics and underlined – significant at 5% level, in italics – significant at 10% level.
4 The interpretation should be as follows: the marginal WTP premium for the upright vacuum cleaner of 2.8kg instead of the upright vacuum cleaner of 4.1kg. The following logic is applied for all attributes.
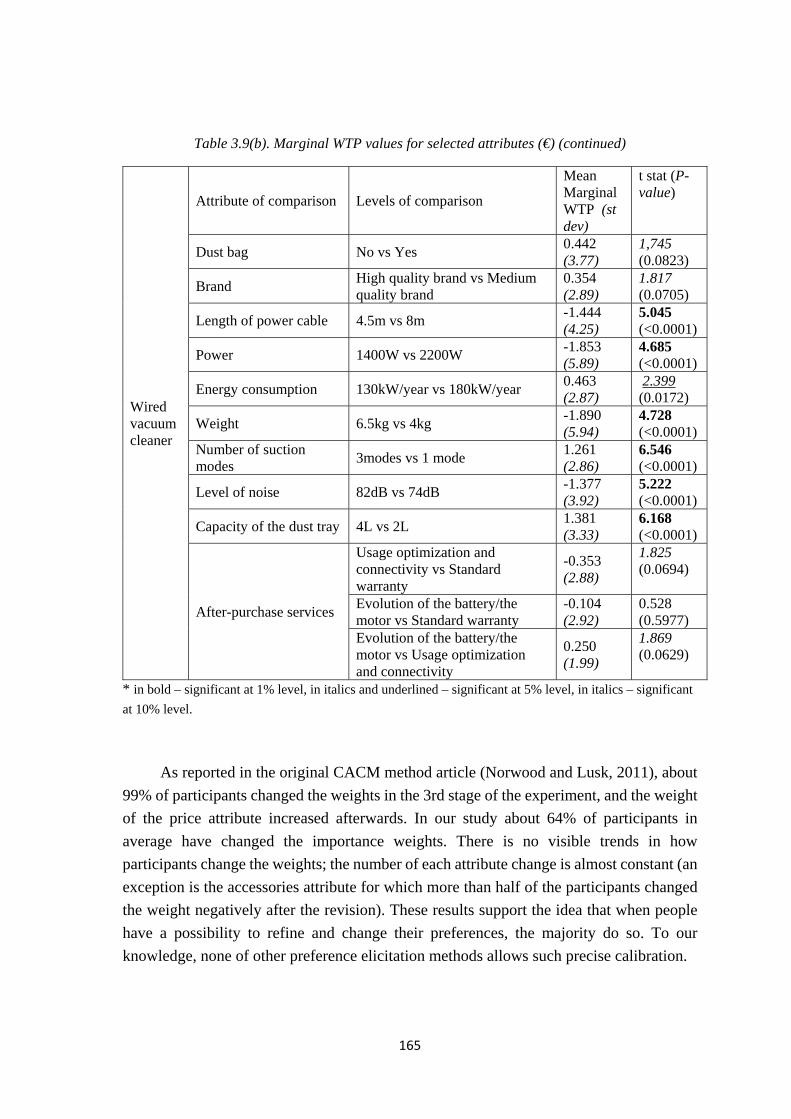
165
Table 3.9(b). Marginal WTP values for selected attributes (€) (continued)
Wired vacuum cleaner
Attribute of comparison Levels of comparison
Mean Marginal WTP (st dev)
t stat (P-value)
Dust bag No vs Yes 0.442 (3.77)
1,745 (0.0823)
Brand High quality brand vs Medium quality brand
0.354 (2.89)
1.817 (0.0705)
Length of power cable 4.5m vs 8m -1.444 (4.25)
5.045 (<0.0001)
Power 1400W vs 2200W -1.853 (5.89)
4.685 (<0.0001)
Energy consumption 130kW/year vs 180kW/year 0.463 (2.87)
2.399 (0.0172)
Weight 6.5kg vs 4kg -1.890 (5.94)
4.728 (<0.0001)
Number of suction modes 3modes vs 1 mode 1.261
(2.86) 6.546 (<0.0001)
Level of noise 82dB vs 74dB -1.377 (3.92)
5.222 (<0.0001)
Capacity of the dust tray 4L vs 2L 1.381 (3.33)
6.168 (<0.0001)
After-purchase services
Usage optimization and connectivity vs Standard warranty
-0.353 (2.88)
1.825 (0.0694)
Evolution of the battery/the motor vs Standard warranty
-0.104 (2.92)
0.528 (0.5977)
Evolution of the battery/the motor vs Usage optimization and connectivity
0.250 (1.99)
1.869 (0.0629)
* in bold – significant at 1% level, in italics and underlined – significant at 5% level, in italics – significant at 10% level.
As reported in the original CACM method article (Norwood and Lusk, 2011), about 99% of participants changed the weights in the 3rd stage of the experiment, and the weight of the price attribute increased afterwards. In our study about 64% of participants in average have changed the importance weights. There is no visible trends in how participants change the weights; the number of each attribute change is almost constant (an exception is the accessories attribute for which more than half of the participants changed the weight negatively after the revision). These results support the idea that when people have a possibility to refine and change their preferences, the majority do so. To our knowledge, none of other preference elicitation methods allows such precise calibration.
166
Conclusion
Technological development level and high product turnover increase the number of products launched every year, aiming to satisfy changing consumers’ preferences and constantly aiming to deliver a superior customer/consumer value. Unfortunately, it results not only in benefits for consumers but also in severe environmental consequences through increased materials and energy use, pollution and waste amounts. The world’s economy and society resolutions for this problem is the gradual transition to sustainability principles at every stage of economy, production and consumption.
Previous studies pointed out the risks of selling a new product and a current one at the same time, especially when consumers anticipate future evolution (development) of the product (Krishnan and Ramachandran, 2011). The “new-obsolete paradox” explains this anticipation as a risk for a consumer, when buying a new product.
A possible solution to this problem is the introduction of upgradeable products (with upgradeable parts), which allows consumers to buy a product now and to upgrade it in the future. This work is also of interest with regard to sustainable development.
The aim of our research was to analyze consumers’ perception of a product upgrade and to estimate their WTP for it. For this purpose we chose to use a new method: the Calibrated Auction-Conjoint Method. The advantage of this method is that it enables one to have a clear image of how preferences are formed. It permits to get WTP estimations of all variations of (upright) vacuum cleaners, based on the attribute-based utility functions, which reflect a rational choice behavior. This advantage allows us to make a long post-experience estimation of WTP for different vacuum cleaners’ configurations, depending on the research needs during new product development stages. Auction part of the experiment, being hypothetical though, proposes good insights on WTP for vacuum cleaners, based on rational consumer behavior, which guarantees the absence of high biases in hypothetical statement. We want to stress, however, that the non-hypothetical “auction” part in this research is omitted due to the absence of the research products, so what we call auction is the environment, in which participants place a hypothetical bid for a product and then are faced to the estimations of 4 different alternatives. Nevertheless, we consider that CACM in such configuration should not have much difference with the original method, because participants are asked to bid for a product (Product 1 out of 4 available).
There are however some limits to this method. As found in previous papers where it has also been used, it is valid and allows to obtain significant results for products with a low price. The calculation of utility function allows for a small bids’ variation in the presence of a large number of attributes, and in case of high prices this variation is too
167
small to be perceived by a consumer. At the same time, low weights of the price attribute (because of a large number of attributes) create small WTP values. In our case, due to product complexity – the presence of a large number of attributes which matter to a consumer, the distribution of weights does not show much preference for any attribute, so there is no “decisive” attribute. The CACM method is therefore a good WTP elicitation method for those products that have many attributes but few of which are essential for a consumer, even in case of high prices.
A key advantage of the CACM is nevertheless the possibility to estimate numerous attributes with a large number of attribute levels. Hence, we can still have a good overview of preference composition thanks to the analysis of attributes and their levels. If we look at the ratings given by each participant for each level of attribute, we can conclude that the participants had an expected behavior: the rating scores decreased for some attributes (i.e. price, time of recharge, noise) or increased (i.e. autonomy, number of accessories, number of speed modes) for others. The distribution of importance weights among attributes does not show any significant preference for a particular attribute.
WTP analysis reveals that consumers are willing to pay premiums for upgradeable products, which are significantly different from 0. This supports previous research results. Despite this positive result, these premiums are however rather low. The upgrade attribute receives both positive and negative WTP in different cases. From this we conclude that a producer’s strategy should not be based on high price differentiation of upgradeability, although the presence of an upgrade is viewed positively by consumers.

168
169
CHAPTER 4
French households’ willingness to pay for electricity contracts using Smart Meters
In the report by the European Commission (European Commission, 2011b) it is clearly said that now, after being implemented into products and services sector, innovation should be integrated in the sphere of extremely high importance in Europe with numerous challenges: the efficient and sustainable use of natural resources.
“The need to rethink energy systems by focusing on the environment and the needs of the population, rationalizing resources and delivering more efficient services has acquired a key role in the definition of possible new technological developments” (International Energy Agency, 2014 cited in Bigerna et al., 2016, p. 400).
Even if it seems that the industrial energy consumption has more influence on overall level of consumption, the private consumption of households takes a priority position. Households represent a large share of total electricity consumption, so the change in consumption levels may be significant. Private sector consumption may also be more flexible (Richter and Pollitt, 2016).
The growing use of smart meters and smart grid technologies provides a technological “support” of increasing electricity circuits loadings, however, a significant part of the necessary change should be made in human behavior. The idea of a smart meter is as follows: it allows a consumer to manage and to monitor his/her electricity consumption and cost, providing this information to electricity providers at the same time. Providers, who may also be producers, in turn create an added value to consumers through
170
efficiently managing the electricity flow and proposition, avoiding over-, under-loads and cut outs.
One of the largest smart meter installation campaigns is organized in the UK by Smart Energy GB with £11.7 billion of estimated costs (consumer funds) and predicted savings of £17 billion (Stedman, 2016). In France, a smart meter called “Linky” is already installed in 40,000 households only in 2016 and the complete installation is expected to be finished in 2021, requiring between 5€ and 7€ billion and the installation of 35 million of smart meters (ENEDIS, 2016).
Thereby, a global energy transformation, still with some heterogeneity – the EU has a leading position followed by the USA, and “smart meterification” are coming soon. In this light, an equally important question is the readiness and willingness to accept smart grids, whose integral part is a smart meter, by households, which represent the micro level of the whole energy system functioning (Leijten et al., 2014). Verbong et al. (2013) states that the introduction of smart meter technologies will cause technological, environmental and economic upgrades of existing electricity systems, influencing the everyday order of the households’ life. In addition, the implementation of smart meters is expected to bring to surface and to question the well-established consumers’ habits and to create a new responsible society through behavioral change.
This chapter aims to measure the heterogeneity of preferences of French households and their willingness to pay for specific electricity contracts equipped with smart meters, which enable the electricity distributors to control, for more or less long periods of time and more or less frequently, households' consumption. The main research question is which contracts and under which conditions are French consumers willing to accept smart electricity? To our knowledge very few studies try to answer this question, proposing a set of contracts, especially with the same methods (the only example of close study is Richter and Pollitt, 2016).
The original pivot choice experiment was conducted with private French electricity consumers in 2015. This research is made in collaboration with the researchers in electrical engineering from the G2ELab. Pivot choice experiment has allowed us to estimate consumers WTP for proposed contracts and their particular characteristics. This has also allowed us to study consumers’ heterogeneity.
Households were proposed to choose between several different contracts, characterized by four attributes: bill amount variation, pivoted over their current situation (i.e. decrease of electricity bill amount, based on the bill of the last year); comfort level; type of provider’s control, (i.e. control mode of the smart meter) and the level of renewable energy use. The choice of these attributes is motivated by the most important attributes, according to the literature, taken into account when choosing an electricity contract with
171
smart metering. The share of renewable energy (solar and wind) corresponds to the European Commission goal to increase the use renewable energy through the smart grids.
Additionally, an inferred valuation method has been used in order to propose a complementary and comparable estimation of preferences for the contracts’ smart features.
This chapter is organized as follows. Section 1 presents the information on smart meters and smart grid technologies. It also covers previous studies on consumers’ acceptance of smart technologies and green electricity. Section 2 discusses the methodologies used in the study. Section 3 explains the design and the flow of the experiment. Finally, the main findings are discussed in the section 4 of the chapter, which is then finished with the conclusions.
The results of this chapter may provide the insights into whether or not smart meters are accepted, upon which attributes they are accepted if so, and how future installation of smart meters should be proceeded.
1. Smart meters and smart grids technologies
Smart grid can be defined as an intelligent electricity network, which efficiently manages behavior and actions of all its participants in order to ensure economically efficient and sustainable power system (European Commission, 2011a; Bigerna et al., 2016). It is a collaboration of numerous organizations and products.
The European Commission has defined several goals for smart grids to achieve before 2020 “guaranteeing high security, quality and economic efficiency of electricity supply in an open market environment” (European Commission, 2011a, p. 3):
- a 20% decrease in EU greenhouse gas emissions below 1990 levels;
- a 20% in EU energy consumption out of renewable energy resources;
- a 20% decrease in EU energy consumption compared to expected levels.
Smart grids aim to change the way energy producers and providers communicate with their clients and at the same time to change consumers’ role in electricity consumption, who become “prosumers” (if they produce electricity) or “consumactors” if they are active actors of electricity network management. It becomes possible to make more grounded decisions about consumption practices, adapting and responding to the current state of electricity networks, e.g. load, price, etc. (Ellabban and Abu-Rub, 2016). Thus, this transformation broadens the role of the consumer (Li, 2016):
172
- As a consumer – consuming electricity;
- As a citizen – having attitudes towards smart grids;
- As a producer – producing renewable electricity (from eolians or solar panels).
Only through transforming the participants’ roles and responsibilities it is possible to achieve 20-20-20 goals.
Particularly, moving to lower-impact energy systems necessitates the installation of smart meters in individual dwellings and the establishment of an advanced metering infrastructure. Smart meter is a digital electric two-way meter fixed at consumer’s home, which allows to manage, supervise and control remotely the consumption of electricity of the household (Pepermans, 2014; Krishnamurti et al., 2012). In addition, it allows real-time communication of peak hours, tariff changes and supply conditions to consumers (Gans et al., 2013; Darby, 2010).
On the European Commission website smart meters are denoted as:
“With smart meters, consumers can adapt – in time and volume - their energy usage to different energy prices throughout the day, saving money on their energy bills by consuming more energy in lower price periods”1.
As already stated above, the introduction of smart meters allows for a more active communication between consumer and electricity provider in order to understand, monitor and adjust the way one consumes/produces electricity. Darby (2010, p.443) indicates that having a smart meter at home may permit consumers to “choose tariffs that suit their daily consumption patterns, and may decide to alter their normal practices and behaviors in order to avoid high spot electricity prices” receiving real time pricing signals and having a distant control over “smart home2” appliances.
Therefore, the literature mainly agrees about two main features of smart meters (Darby, 2010):
- it allows the storing and measuring of data at specified intervals of time;
1 The Official European Commission website, https://ec.europa.eu/energy/en/topics/markets-and-consumers/smart-grids-and-meters 2 The term “smart home” corresponds to the set of connected/controlled appliances (TV, shutters, lights, etc.), renewable sources of energy production (solar panels, private eolians) connected to a smart meter, which controls, manages, saves the production/consumption data and communicates it to energy providers.
173
- it allows a two-way communication between a consumer and a supplier; and more particularly automatic management of metering and electricity consumption.
Krishnamurti et al. (2012) state that one of the main benefits of introducing smart meters is the ability to increase the operational efficiency of the network, thus allowing its proactive maintenance.
To continue this list we will summarize all the benefits of smart grids found in literature. From the consumers’ point of view we can list the following benefits:
- more detailed information about household’s electricity use history, high-use alerts (European Commission, 2011c);
- autonomy in billing – the absence of visits of electricity provider’s technicians in order to read meters (the absence of rendez-vous);
- possibility of changing the conditions of the contract or a capacity of the meter remotely and in 24h delay;
- reduction of blackout occurring (Krishnamurti et al.,2012; Pratt et al., 2010);
- possibility of having dynamic tariffs;
- increase in the accuracy/quality of consumption and, consequently, an opportunity to reduce electricity consumption and save money (Verbong et al., 2013, Gans et al., 2013, Darby, 2006);
- showing concern about the environment and sustainable use of natural resources, including renewable energy (Walker and Cass, 2007; Richter and Pollitt, 2016);
- increase of the knowledge about the whole electricity system, create new experienced (aware) consumers, who communicate with technology (Bertoldo et al., 2015).
For electricity producers/providers there are also numerous benefits, which make it possible to:
- propose qualitative services to consumers by increasing the operational efficiency, security and reliability of electricity grids (Clastres, 2011; Verbong et al., 2013; European Commission, 2011c; Kirkham and Marinovici, 2013);
- customer/consumer satisfaction increase;
- reduce the occurrence of blackouts and peak periods (ENEDIS, 2016);
174
- reduce the costs of maintenance and management of electricity grids. Clasters (2011, p.3) state that “almost 70% of investment in Europe’s energy sector between now and 2035 will concern electricity”.
- enable demand response programs and advanced tariff systems, which propose dynamic prices depending on consumers’ demand of electricity (Krishnamurti et al., 2012; Dave et al., 2013);
- produce a reasonable amount of electricity, avoiding underproduction and costly storage equipment needed in case of overproduction (ENEDIS, 2016);
- fraud prevention and detection (European Commission, 2011d);
- introduction of innovation and innovative products, promotion of customer orientation (Clastes, 2011);
- participation in sustainable development, thus improving the social-ecological resilience of societies (Frederics et al., 2015).
However, at the same time, as is the case of most innovative technologies, smart meters are accompanied by risks and costs. One of the main risks for consumers is a possibility that “intelligent” electricity consumption will lead to increased electricity bills. Historically, households have got used to the fact that the price of each kW is equal whether one consumes it at 14pm or at 3am, so it may be difficult to change the habitual way of life and to pay attention when turning on a washing machine, heating and cooking after work. Therefore, the installation of smart meter may not lead to savings for all households: those who consume less at daytime peak hours will benefit, however those who over-consume at day peak hours may have a negative utility (Krishnamurti et al., 2012). Comfort decrease may also be one of the associated costs, associated with smart metering and energy saving behavior, which may demand some trade-offs.
Another important concern of consumers is the intrusion in their privacy. The installation of smart meters in one’s home leads to higher level of available information for both consumers and electricity producers. The detailed consumption history is useful, however, may reveal when the consumer is at home, what types of appliances he/she uses and other private information. Consumers may be afraid of being monitored and surveyed all the time, may not trust electricity providers who could misuse private information (Quinn, 2009; Krishnamurti et al., 2012). Quinn (2009) stresses that smart meter information is potentially profitable, so the access to it and its use should be regulated by policies for both consumer protection and “incentive regulation”. For example, for green electricity consumption in the UK fiscal incentives include taxes and cap-and-trade instruments (Scarpa and Willis, 2010). The regulation of smart metering should also take into account that private information should nevertheless be accessible to electricity
175
providers to control and constantly improve the quality of their services and make the analysis of the activity of the smart grid network (for more information see Quinn, 2009).
Some governmental formalities have been done, for example in France, to prevent misuse of consumers’ private data and to prevent negative perception of smart metering. Article L337-3-1 of « Energy Code » of French Law on smart meters and the transmission of private consumption data guarantees that providers will only have an access to real-time private consumption data upon consumer agreement (Code de l’Energie, 2015).
The loss of control is also listed as a concern for consumers, as well as the lack of interest or time at all for being concerned about the consumption and its management (Verbong et al., 2013). The necessity of engagement in a new energy consumption experience may represent an additional concern.
1.1. Demand-side management and its consequences on consumer energy saving behavior
The demand-side management is a large research field within the topic of smart grid development. For the interest of this research, we consider it to be necessary to explain the structure of the demand-side management and its influence on consumers.
Demand-side management programs consist of two parts: demand response and energy efficiency programs.
Energy efficiency consists of using less energy while obtaining the same level of end service and comfort. It corresponds to load interruptions for short periods of time, which should either be imperceptible or only faintly perceptible by consumers. Such strategy may be effective for those home appliances, which are constantly plugged and therefore consuming (for example, a refrigerator). This energy efficiency measure of smart meters is analyzed and applied in our study.
Another strategy, used mainly for home appliances, which consume in fixed intervals (like a dishwasher) is demand shifting, which consists in launching them in the periods of time when the load and the price of electricity is lower (Richter and Pollitt, 2016).
Demand response is “…a change in consumers’ electricity use profile following dynamic tariff structures or incentive payments for the sake of operating the electric grid more efficiently and reliably.” (Ellabban and Abu-Rub, 2016, p. 1289). In other words, consumers are able to “respond” by their behavior to a changing proposition of electricity and its price.
176
Demand side may be of two types: incentive-based and price-based. Incentive based demand side programs include direct incentives from electricity providers in the form of bill credits or payments.
Price-based demand side programs include dynamic pricing (Time of Use, Real Time pricing, Critical Peak Pricing, etc.), in which the price of a kW of electricity is different depending on its production cost, network load, etc. The Time of Use program consists of creating a timetable of prices for a long period. Such pricing is the most stable dynamic pricing. Real Time pricing consists of varying prices in real time – usually with hourly updates (Duetschke and Paetz, 2013). Such pricing allows the sensitization of consumers to sustainable consumption practices and reduces peak consumption periods. In addition, the effectiveness of dynamic pricing as an incentive for energy saving behavior is also explained by making electricity “visible”, though communicating its price in real time. It is meant to inform consumers, i.e. increase their awareness of current network situation and electricity cost, and incite them to (re)act accordingly to the situation. As a governmental resolution, the introduction of dynamic pricing tariffs for electricity rests on a simple idea that the price is an important parameter for consumers, when making consumption choices.
Dynamic pricing, as an important part of demand side management, has been already applied experimentally and there are some results available about consumers’ acceptance. Duetschke and Paetz (2013) conduct a series of experiments (conjoint analysis and field experiment) in Germany to test the acceptance of dynamic pricing tariffs and elicit consumers’ preferences. The results suggest that consumers have positive preferences towards dynamic pricing, but prefer those which are relatively simple, like Time of Use tariffs. The difference in savings should also be large enough. The authors also find that automated demand response control is preferred by consumers to a manual, ensuring the better use of dynamic price periods and their effective use. Consumers, who became more aware of the dynamic pricing concept through the experiments, were more ready to accept it and successfully integrate it in their lives. However, in the field experiment participants expressed some fears towards accepting real time pricing, being afraid about not knowing the prices in advance and being forced to pay a high price due to the unexpected reasons like unusually bad weather conditions or accidents making it impossible to use renewable resources of energy.
Salies (2013) in his research on real time pricing states that significant savings are possible with such type of dynamic pricing and discovers the reasons why consumers are not willing to accept such electricity contracts. A trade-off between real time pricing (to decrease the occurrence of peak consumption periods) and adoption incentives should be made. The author supports previous results and states that simple dynamic contracts with simultaneous economic incentives are preferred by consumers. In addition, if switching to
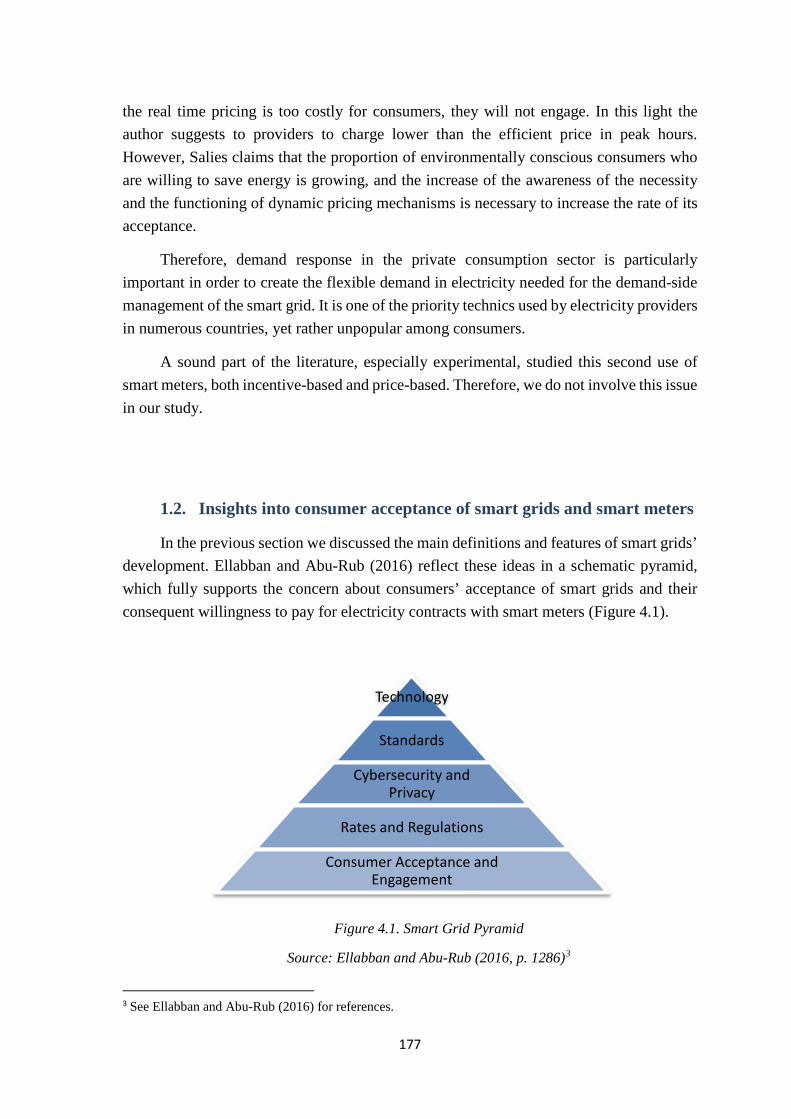
177
the real time pricing is too costly for consumers, they will not engage. In this light the author suggests to providers to charge lower than the efficient price in peak hours. However, Salies claims that the proportion of environmentally conscious consumers who are willing to save energy is growing, and the increase of the awareness of the necessity and the functioning of dynamic pricing mechanisms is necessary to increase the rate of its acceptance.
Therefore, demand response in the private consumption sector is particularly important in order to create the flexible demand in electricity needed for the demand-side management of the smart grid. It is one of the priority technics used by electricity providers in numerous countries, yet rather unpopular among consumers.
A sound part of the literature, especially experimental, studied this second use of smart meters, both incentive-based and price-based. Therefore, we do not involve this issue in our study.
1.2. Insights into consumer acceptance of smart grids and smart meters
In the previous section we discussed the main definitions and features of smart grids’ development. Ellabban and Abu-Rub (2016) reflect these ideas in a schematic pyramid, which fully supports the concern about consumers’ acceptance of smart grids and their consequent willingness to pay for electricity contracts with smart meters (Figure 4.1).
Figure 4.1. Smart Grid Pyramid
Source: Ellabban and Abu-Rub (2016, p. 1286)3
3 See Ellabban and Abu-Rub (2016) for references.
Technology
Standards
Cybersecurity and Privacy
Rates and Regulations
Consumer Acceptance and Engagement

178
The necessity of investigating of consumers’ acceptance is a major goal of smart grid development, implementation, efficient functioning and penetration into consumer behavior (Leijten et al., 2014).
Moreover, recently consumers have become a central element in smart grid studies, moving the emphasis from issues around technological and economic incentives. With a growing number of experimental and field studies with consumers on smart metering and the acceptance of smart grid technologies some results are already available.
The analysis of 148 research papers made by Bigerna et al. (2016) concludes that smart grids development and integration is significantly influenced by consumer behavior, lifestyle and habits. The authors conclude that consumers are sensitive to tariffs increases; therefore need to be motivated.
Verbong et al. (2013) conduct a series of experiments on smart grids in Netherlands using Strategic Niche Management. An important part of this research consists of the investigation of interactions of consumers (households) and in-home smart meters technologies, e.g. smart energy monitors or in-home displays. The importance of technological equipment, such as sensors and smart meters (as a part of consumers’ appliances) is emphasized, being highly present in consumers’ lives when smart grids are used.
As consumers are communicating in most cases through these in-home displays (of any type) we think it is necessary to explain their functionalities and necessity for smart home management.
In-home display, which represents a smart meter interface for consumers is usually a tablet or a portable tactile screen or a screen integrated in the wall. Darby (2010) reports that through trial studies with consumers it has been found that consumers who use in-home displays manage their electricity consumption more efficiently and are able to make savings. Wood and Newborough (2007) also mention that in-home displays have to promote energy-saving action and serve as a guide to a responsible energy consumption. As we have already said, feedback information may be a successful way of inciting energy saving behavior, however, electronic feedback is found to be much more efficient, because it demands a higher level of involvement and attention, allows to get information in real time, inciting by this to actions.
179
Useful information reflected by in-home displays may be (Wood and Newborough, 2007):
- current consumption levels of different types of utilities (energy, water, gas, etc.);
- consumption levels of particular appliances or in particular rooms at a particular period;
- size of energy savings, which have been possible after applying energy saving behavior, guided by the in-home display advices or information;
- energy use predictions at a current levels and with possible changes in use, frequency and changing the routine of activities;
- comparisons with neighbors/other consumers with similar dwelling characteristics or/and consumption habits;
- comparisons with past consumption (week, month, year).
Recent technologies have increased the popularity of the use of web-based applications for smartphones or touchpads. Such connected electricity management applications may be installed on any personal device, which makes them less expensive, easy to use and update, allowing access anywhere and anytime.
The presence of direct access to information and management of electricity consumption, as well as recent changes in the use of green electricity (accessibility and more possibilities to install photovoltaic panels and small personal aeoliens) generate a class of active users. At the same time this evokes new problems and issues related to the regulation and responsibilities of all network participants: which actions are under consumers’ responsibility (self-organisation) and what kind of institutional adaptations are needed to let the consumers implement these actions (Verbong et al., 2013; Heiskanen and Matschoss, 2016). The literature review allows us to conclude that consumers have a positive vision of smart meters but they are concerned about the distribution of roles (who plays the dominant role) and responsibilities, and how costs and benefits are allocated. In addition, consumers also expect smart grids to allow for a more active households/end-users participation in the sphere of electricity: dynamic pricing, the possibility to observe and analyze one’s electricity consumption, etc., to be briefly implemented into the energy market.
Thus, in order to change electricity consumption behavior several conditions should be satisfied. Firstly, there should be a possibility to easily opt-in and opt-out between
180
existing electricity contracts, engagements and providers. Secondly, a consumer should have some incentives to do so. One of the incentives, as mentioned above, is the environmental position. Another one may be an economic and other incentives (Verbong et al., 2013). In our experiment, we are proposing a contract, which proposes a decrease of the electricity bill amount generated by the provider’s monitoring of households' consumption more or less frequently.
Another conclusion made by Verbong et al. (2013) says that consumers’ willingness to implement and use smart grids is heterogeneous: they believe that smart meters and smart grid technologies should be implemented, however, the right to choose whether/when participate should be reserved to consumers: “It is considered unlikely that end-users will trust an external party with control over home electrical appliances, yet, at the same time users might not want to manually have to switch off appliances whenever this is more efficient” (Verbong et al., 2013, p.122).
Leijten et al. (2014) conducts a series of experiments (conjoint analysis) in Denmark to test the acceptability of smart grids and, generally, of greener energy systems. This study introduces an attribute called “adjustment type”, which represent the external control of electricity consumption It has two levels: autonomous/ manual adjustments of consumption levels and automatic, technology based adjustments. Automatic adjustment supposes that energy-consuming electronic appliances at consumer’s home are switched on during off-peak hours and off during peak hours of the day. Such adjustment does not need the constant consumers’ control and supervision. According to this research, price is found to be the most important attribute (5.37 out of 7 importance scores), the 2nd level of importance is attributed to how the adjustments in energy use are made (automatically or manually by the user) (5,22). The use of green energy (5,1) and production level (4,96) conclude this list. However, only the price and the type of adjustment notes are statistically significant. Conjoint analysis allowed to conclude that consumers preferred a stable price (over the increase) and manual adjustment. The least accepted systems combined automatic adjustment and the increase in price. An important finding is that the autonomous/manual adjustment mode is preferred by consumers over an automatic adjustment mode. The authors explain this by assuming that consumers prefers autonomy above convenience and comfort, guaranteed by automatic adjustment. The authors also mentioned that consumers may not be ready to implement such technologies in their everyday lives. These results generate a debate on the level of automatism of the adjustments: consumers are accepting smart grids, but a careful reflection and analysis of smart metering control mode with the subsequent ease of use and comfort levels should be made. Leijten et al. (2014, p. 982) suggest that “by allowing consumers to overrule the system when needed which may meet their need for autonomy”.
181
Gans et al. (2013) present the results of the experiment on residential energy in Northern Ireland using advanced meters with real-time feedback. The authors argue that making the electricity “visible” – traceable helps consumers to be more participative and responsible towards their electricity consumption level, as already mentioned above. Implementing in-home accessible displays, during a natural experiment (reformation of electricity system in Northern Ireland due to installation of advanced meters for prepaid electricity contracts users) involving tens of thousands of households, allowed the reduction of metering, outage investigation and fraud-related costs, air pollution and improved energy security.
Using the billing information as it is now in France (so-called indirect feedback (Gans et al., 2013)), allows households to have information about their monthly/semester/yearly electricity consumption, as well as comparisons with previous periods and parts of renewable energy. However, this information is not meant to encourage consumers to reduce, track and use this information anyhow. Additionally, this information has not enough lightning (back of the bill). As well as the lack of incentives with plain tariffing. Introducing smart technologies with in-home displays, internet access or portable tablets may encourage and facilitate some segments of consumers or may frighten and alienate others (Darby, 2010). In-home displays are found to be efficient in money saving (range 5-15%, in Darby, 2006), however, they are more efficient in the short term, losing their efficiency over time. It is emphasized, however, that the key point of any type of feedback is the raising of consumers awareness about their electricity consumption routines, and possible ways to improve them. In-home displays may also be used to check for irregularities in consumption or just to see the limits of consumption (for those who cannot reduce their consumption any more). Darby also claims that there may be households, for whom feedback may be beneficial only in combination with advices/expertise and finance, which help to improve their consumption experience. These results guide us to a conclusion that a direct access to consumption information is indeed beneficial, but has a rather short-term impact. Therefore, the importance of the analysis of the acceptance of automatic or partially automatic control modes of smart meters is suggested.
Demand side management usually uses a complex of programs and incentives at the same time to obtain significant results. A way to apply demand response and energy efficiency measures at the same time is to propose dynamic tariffs to consumers and to share the control about more appliances with electricity providers, which allow to balance consumption and avoid network overloads at peak hours (Richter and Pollitt, 2016). The authors conclude that consumers have positive valuations of remoted monitoring and control, however, would like to accept compensations for that. These compensations consist of fixed and variable amounts, creating incentivizing pricing strategies for different clusters of consumers. Only fixed compensations are found not to have significant effect on consumers’ participation, unless the expected bill savings are high: “households that
182
are willing to give up more control to service providers to shift, interrupt or reduce their energy consumption offer higher potential for volatility reduction and efficiency gains” (Richter and Pollitt, 2016, p.40). In addition, the inclusion of conditions on the use of the information obtained through smart metering (usage data sharing, personal identification) as well as technical support reveals a significant consumer heterogeneity in WTP for these attributes. Further in the chapter we will present some more research results on smart meters employment characteristics including dynamic pricing. These results conclude the presence of consumers’ reservations facing demand response and dynamic tariffs. According to these results, we assume that consumers are not yet “mature” enough to be able to control their consumption depending on the current tariff and that direct external electricity consumption control may be an alternative approach to demand response management.
Bertoldo et al. (2015) present their recent results of the experiment (using the social representations method) in two areas in France: both rural and urban. In this study the participants have showed positive attitudes towards sustainable consumption possibilities proposed through the use of a smart meter. However, the participants have their limits in comfort decrease. Some participants show low interest in demand-side tariffs saying that it is a form of discrimination/unfair to pay more in peak hours (if the peak hour is at 19h and generally getting home after work at 18h30 people start consuming) stating that it is not their fault that they have a similar need and schedule of life with other people. This information also reveal the limits of dynamic pricing technics and their subsequent acceptance by consumers.
Another important side of the same question is discussed in Shipworth et al. (2010) paper on central heating thermostat settings and subsequent CO2 emissions. Heating demand temperatures and heating duration are the factors, which influence the energy demand for heating. Citing the UK’s Energy Saving Trust, Shipworth et al. (2010) state that by controlling the heating (timer, thermostat and thermostatic radiator valves) one can save around 17% of the heating bill. The mean and the median thermostat settings are equal to 21°C (sd 2.5°C), with 30% of participants settings less than 20°C and 40% with equal or more than 22°C.
Theoretically, the situation should be different. The Agency for Environment and Energy Management (in French, Agence de l’environnement et de la maîtrise de l’énergie, ADEME) suggests the introduction of a temperature of 19 ° in the living rooms of houses and other apartments/offices/etc., which is supported by Energy Code of France (Site Officiel de Ministère de l'Environnement, de l'Energie et de la Mer, 2016).
These particular features of smart metering and electricity contracts are meant to respond to different needs and preferences of consumers. Four types of consumers according to their electricity consumption practices are defined in Valocchi et al. (2007):
183
- “energy epicures”, who consume heavily and have no interest in controlling consumption;
- passive ratepayers, who take little or no interest in managing their use;
- “stalwarts” who are careful and innovative;
- frugal customers who are willing to take responsibility about their consumption, but are limited by the budget.
The findings of Heiskanen and Matschoss (2016, p. 5) prove that the energy consumption and management sector is also perceptive to consumer innovativeness: “… user innovations focus on a new way of combining existing services, products or new kinds of applications instead of completely new inventions…”. The authors find several areas in which consumers are particularly interested and where they may express their innovativeness if improved/allowed to do so:
- personalized real-time information on energy use;
- remote control and monitoring of electrical equipment;
- use and sharing of renewable energy;
- load management by grid operators and dynamic pricing.
In the 2014 Report by the European Commission (European Commission, 2014) it is said that by 2020, it is expected that almost 72% of European consumers will have a smart meter for electricity.
Therefore, extensive research and experiments should continue in order to define the possible limits and motivation of consumers, their acceptance levels and willingness to pay for particular conditions of smart grid technologies, in particular smart metering.
Very few literature analyses concrete electricity contracts, combining all the motivations and findings listed above and elicits willingness to pay for them, searching to analyze the heterogeneity of preferences and define which attributes of the contacts encourage them to quit “dumb” meters to pass to smart ones. The existing results support our decision about the choice of electricity contracts’ attributes. We emphasize our study on the automatization of the control mode of smart meters, which allows to make energy savings. Based on the literature review, we propose different levels of automatization and
184
external control, in order to elicit consumers’ acceptance of smart meters in the choice of their electricity contracts.
2. Methodology
A pivoted choice experiment is used in this chapter, proposing to choose between three alternatives of smart metering, based on four characteristics. Being a hypothetical method, pivot discrete choice experiment nonetheless provides more realistic results than an ordinary discrete choice experiment. To our knowledge, there is no similar research on electricity contracts that uses a pivoted choice experiment.
2.1. Discrete choice analysis and pivot discrete choice experiment
There are many value elicitation methods which have now been developed. The general distinction divides all methods on real, revealed and stated preferences. Real and revealed preferences methods analyze real choices, possible only for goods/services which already exist, whereas stated preference methods can also be used on the hypothetical market, created by researchers to sell/buy any good or service (Train, 2009). Discrete choice analysis (often called as discrete choice experiment in literature) is one of most commonly used method of stated preferences elicitation and as a general rule, it asks the respondents to choose one alternative (first ranking) in a researcher-defined set of alternatives. Discrete choice experiments are based on a random utility theory (RUT), which, in turn, is based on the theory of rational choice behavior (Louviere et al., 2010).
The common criticism of stated preferences methods is that WTP estimations obtained are much larger than non-hypothetical (real or incentive-compatible) (Voelckner, 2006; Hensher, 2010; Silva et al., 2007). The main reason is the lack of salient economic commitment.
The growing interest is emerging recently around pivoted discrete choice experiments for stated preferences elicitation, where the alternatives are pivoted around the information basis available to the respondents, in other words a reference level (Train and Wilson, 2008; Hess and Rose, 2009, Hensher, 2010; Hess et al., 2008). Different theories in economics, psychology and decision theory prove the necessity of knowledge base for making stated choice decisions in artificial (laboratory) environment for unknown choice
185
options (Hess and Rose, 2009; Rose et al., 2008). Kahneman and Tversky (1979) also state that usually people, to facilitate their choice process, evaluate alternatives like gains or losses according to their reference point (current situation), so by conducting an experiment with pivot design an experimentalist may create a consumers' basis of comparison for other unknown or unfamiliar alternatives. From the other point of view, as researchers are constantly searching how to deal with the hypothetical bias, referencing an experiment can make a difference and get stated preferences and revealed preferences results closer to each other (Hensher, 2010).
Referencing or pivot design has first been used in transportation choice research. Making people to deviate from their habitual choices makes it important to thoroughly consider and reflect upon other alternatives proposed. Each choice (having several attribute levels) is analyzed on the basis of the reference alternative (habitual itinerary), which represents a "no choice/ take nothing" option (Kontoleon and Yabe, 2003; Shafir and Tversky, 1992). It increases the realism of the exercise, enhances the theoretical validity of the welfare estimates and improves the statistical efficiency of the estimated choice parameters (Kontoleon and Yabe, 2003). Expressed simply, the participant is less forced to make a choice when he really does not like any of all other alternatives.
Thus, pivoting is one way to promote relevancy in attribute levels (Hensher, 2010). In addition, when talking about innovative characteristics, this is the way to facilitate participants' choice referring to a product which exists and which they have.
Apart from the reference alternative, pivot choice experiments follow the same rules as other discrete choice analysis methods.
2.2. Estimation models seeking to account for the heterogeneity of consumers’ preferences
As described in Chapter 2 discrete choice analysis is substantially based of Random Utility Theory (RUT) and the most widely used estimation model by now is multinomial logit model (MNL). The common representation of RUT for MNL is presented following the research of McFadden (1984), Train (2009), McFadden and Train (2000), Pepermans (2014) and Rose et al., (2008).
Suppose that individual i (i=1,2,…,I) is presented to a multiple choice tasks n (n=1,2,…,N) between several alternatives j (j=1,2,…,J), described by attributes. So, the utility that the subject has from choosing an alternative j in choice task n is (4.1):
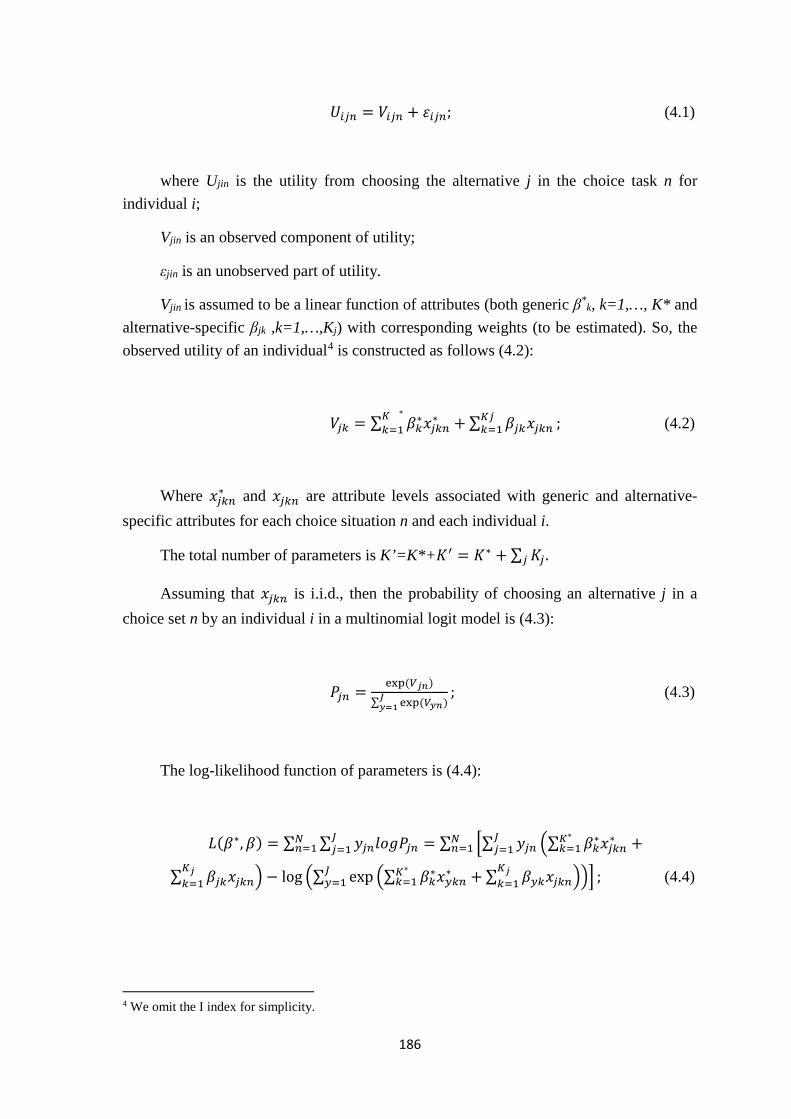
186
𝑈𝑈𝑖𝑖𝑖𝑖𝑖𝑖 = 𝑉𝑉𝑖𝑖𝑖𝑖𝑖𝑖 + 𝜀𝜀𝑖𝑖𝑖𝑖𝑖𝑖; (4.1)
where Ujin is the utility from choosing the alternative j in the choice task n for individual i;
Vjin is an observed component of utility;
εjin is an unobserved part of utility.
Vjin is assumed to be a linear function of attributes (both generic β*k, k=1,…, K* and
alternative-specific βjk ,k=1,…,Kj) with corresponding weights (to be estimated). So, the observed utility of an individual4 is constructed as follows (4.2):
𝑉𝑉𝑖𝑖𝑗𝑗 = ∑ 𝛽𝛽𝑗𝑗∗𝑥𝑥𝑖𝑖𝑗𝑗𝑖𝑖∗𝐾𝐾 ∗
𝑗𝑗=1 + ∑ 𝛽𝛽𝑖𝑖𝑗𝑗𝑥𝑥𝑖𝑖𝑗𝑗𝑖𝑖𝐾𝐾𝑖𝑖𝑗𝑗=1 ; (4.2)
Where 𝑥𝑥𝑖𝑖𝑗𝑗𝑖𝑖∗ and 𝑥𝑥𝑖𝑖𝑗𝑗𝑖𝑖 are attribute levels associated with generic and alternative-specific attributes for each choice situation n and each individual i.
The total number of parameters is K’=K*+𝐾𝐾′ = 𝐾𝐾∗ + ∑ 𝐾𝐾𝑖𝑖𝑖𝑖 .
Assuming that 𝑥𝑥𝑖𝑖𝑗𝑗𝑖𝑖 is i.i.d., then the probability of choosing an alternative j in a choice set n by an individual i in a multinomial logit model is (4.3):
𝑃𝑃𝑖𝑖𝑖𝑖 = exp (𝑉𝑉𝑗𝑗𝑗𝑗)
∑ exp (𝑉𝑉𝑦𝑦𝑗𝑗)𝐽𝐽𝑦𝑦=1
; (4.3)
The log-likelihood function of parameters is (4.4):
𝐿𝐿(𝛽𝛽∗,𝛽𝛽) = ∑ ∑ 𝑦𝑦𝑖𝑖𝑖𝑖𝑙𝑙𝑙𝑙𝑙𝑙𝑃𝑃𝑖𝑖𝑖𝑖𝐽𝐽𝑖𝑖=1
𝑁𝑁𝑖𝑖=1 = ∑ �∑ 𝑦𝑦𝑖𝑖𝑖𝑖 �∑ 𝛽𝛽𝑗𝑗∗𝑥𝑥𝑖𝑖𝑗𝑗𝑖𝑖∗𝐾𝐾∗
𝑗𝑗=1 +𝐽𝐽𝑖𝑖=1
𝑁𝑁𝑖𝑖=1
∑ 𝛽𝛽𝑖𝑖𝑗𝑗𝑥𝑥𝑖𝑖𝑗𝑗𝑖𝑖𝐾𝐾𝑗𝑗𝑗𝑗=1 � − log �∑ exp �∑ 𝛽𝛽𝑗𝑗∗𝑥𝑥𝑦𝑦𝑗𝑗𝑖𝑖∗𝐾𝐾∗
𝑗𝑗=1 + ∑ 𝛽𝛽𝑦𝑦𝑗𝑗𝑥𝑥𝑖𝑖𝑗𝑗𝑖𝑖𝐾𝐾𝑗𝑗𝑗𝑗=1 �𝐽𝐽
𝑦𝑦=1 �� ; (4.4)
4 We omit the I index for simplicity.
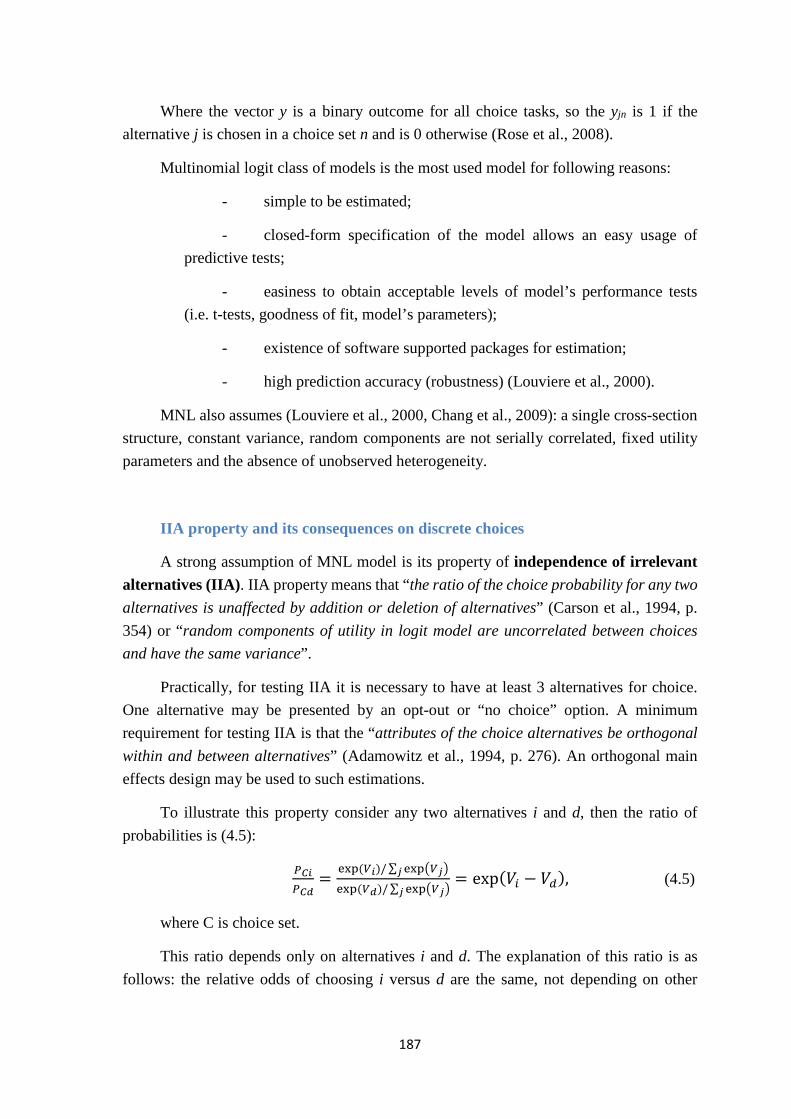
187
Where the vector y is a binary outcome for all choice tasks, so the yjn is 1 if the alternative j is chosen in a choice set n and is 0 otherwise (Rose et al., 2008).
Multinomial logit class of models is the most used model for following reasons:
- simple to be estimated;
- closed-form specification of the model allows an easy usage of predictive tests;
- easiness to obtain acceptable levels of model’s performance tests (i.e. t-tests, goodness of fit, model’s parameters);
- existence of software supported packages for estimation;
- high prediction accuracy (robustness) (Louviere et al., 2000).
MNL also assumes (Louviere et al., 2000, Chang et al., 2009): a single cross-section structure, constant variance, random components are not serially correlated, fixed utility parameters and the absence of unobserved heterogeneity.
IIA property and its consequences on discrete choices
A strong assumption of MNL model is its property of independence of irrelevant alternatives (IIA). IIA property means that “the ratio of the choice probability for any two alternatives is unaffected by addition or deletion of alternatives” (Carson et al., 1994, p. 354) or “random components of utility in logit model are uncorrelated between choices and have the same variance”.
Practically, for testing IIA it is necessary to have at least 3 alternatives for choice. One alternative may be presented by an opt-out or “no choice” option. A minimum requirement for testing IIA is that the “attributes of the choice alternatives be orthogonal within and between alternatives” (Adamowitz et al., 1994, p. 276). An orthogonal main effects design may be used to such estimations.
To illustrate this property consider any two alternatives i and d, then the ratio of probabilities is (4.5):
𝑃𝑃𝐶𝐶𝐶𝐶𝑃𝑃𝐶𝐶𝐶𝐶
= exp (𝑉𝑉𝐶𝐶)/∑ exp�𝑉𝑉𝑗𝑗�𝑗𝑗
exp (𝑉𝑉𝐶𝐶)/∑ exp�𝑉𝑉𝑗𝑗�𝑗𝑗= exp(𝑉𝑉𝑖𝑖 − 𝑉𝑉𝑑𝑑), (4.5)
where C is choice set.
This ratio depends only on alternatives i and d. The explanation of this ratio is as follows: the relative odds of choosing i versus d are the same, not depending on other
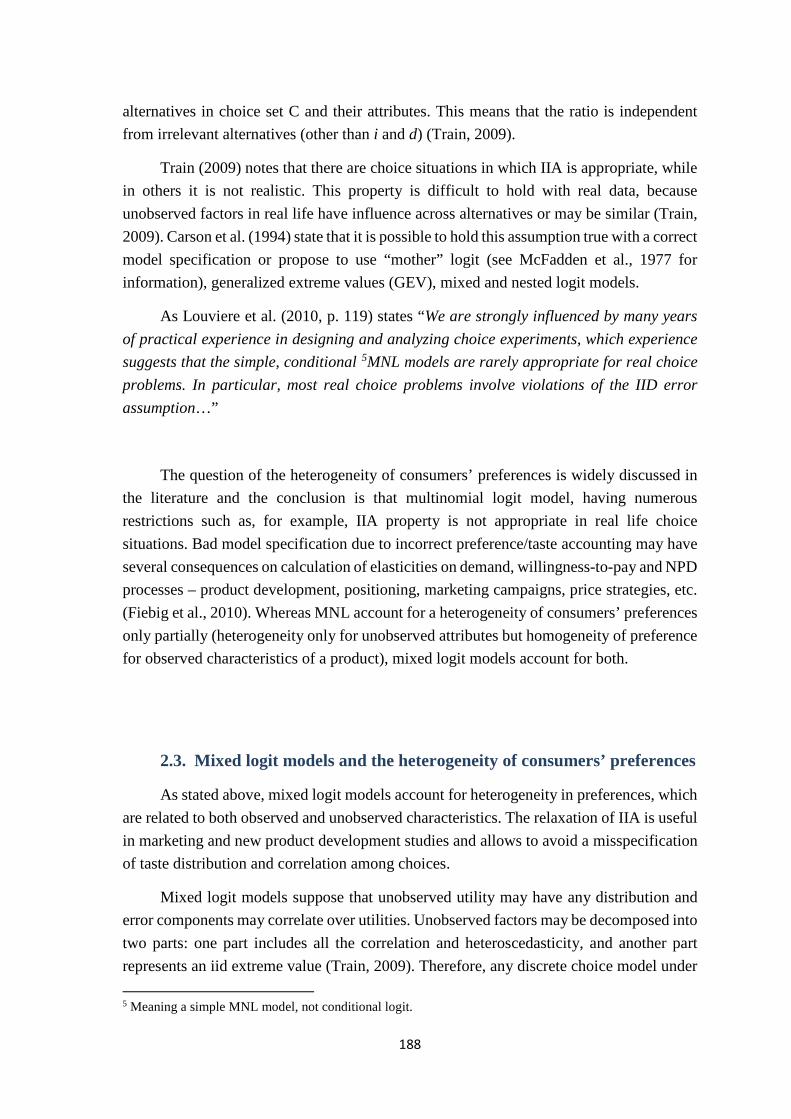
188
alternatives in choice set C and their attributes. This means that the ratio is independent from irrelevant alternatives (other than i and d) (Train, 2009).
Train (2009) notes that there are choice situations in which IIA is appropriate, while in others it is not realistic. This property is difficult to hold with real data, because unobserved factors in real life have influence across alternatives or may be similar (Train, 2009). Carson et al. (1994) state that it is possible to hold this assumption true with a correct model specification or propose to use “mother” logit (see McFadden et al., 1977 for information), generalized extreme values (GEV), mixed and nested logit models.
As Louviere et al. (2010, p. 119) states “We are strongly influenced by many years of practical experience in designing and analyzing choice experiments, which experience suggests that the simple, conditional 5MNL models are rarely appropriate for real choice problems. In particular, most real choice problems involve violations of the IID error assumption…”
The question of the heterogeneity of consumers’ preferences is widely discussed in the literature and the conclusion is that multinomial logit model, having numerous restrictions such as, for example, IIA property is not appropriate in real life choice situations. Bad model specification due to incorrect preference/taste accounting may have several consequences on calculation of elasticities on demand, willingness-to-pay and NPD processes – product development, positioning, marketing campaigns, price strategies, etc. (Fiebig et al., 2010). Whereas MNL account for a heterogeneity of consumers’ preferences only partially (heterogeneity only for unobserved attributes but homogeneity of preference for observed characteristics of a product), mixed logit models account for both.
2.3. Mixed logit models and the heterogeneity of consumers’ preferences
As stated above, mixed logit models account for heterogeneity in preferences, which are related to both observed and unobserved characteristics. The relaxation of IIA is useful in marketing and new product development studies and allows to avoid a misspecification of taste distribution and correlation among choices.
Mixed logit models suppose that unobserved utility may have any distribution and error components may correlate over utilities. Unobserved factors may be decomposed into two parts: one part includes all the correlation and heteroscedasticity, and another part represents an iid extreme value (Train, 2009). Therefore, any discrete choice model under 5 Meaning a simple MNL model, not conditional logit.
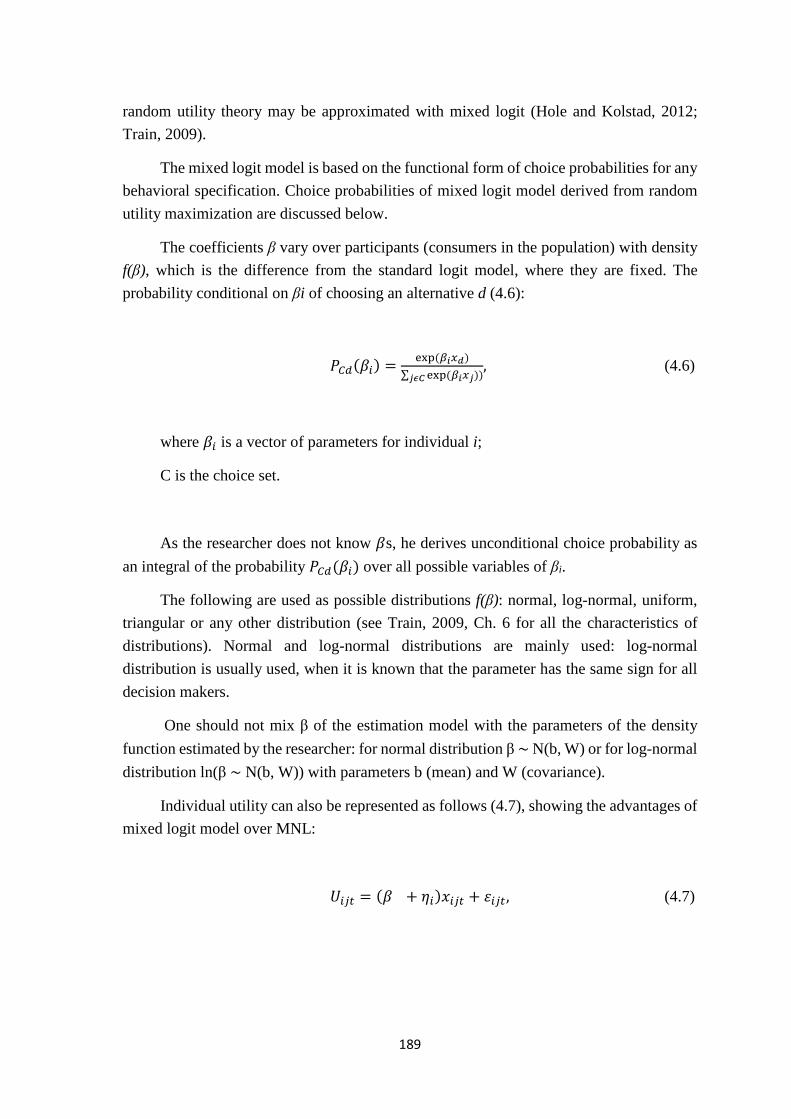
189
random utility theory may be approximated with mixed logit (Hole and Kolstad, 2012; Train, 2009).
The mixed logit model is based on the functional form of choice probabilities for any behavioral specification. Choice probabilities of mixed logit model derived from random utility maximization are discussed below.
The coefficients β vary over participants (consumers in the population) with density f(β), which is the difference from the standard logit model, where they are fixed. The probability conditional on βi of choosing an alternative d (4.6):
𝑃𝑃𝐶𝐶𝑑𝑑(𝛽𝛽𝑖𝑖) = exp (𝛽𝛽𝐶𝐶𝑥𝑥𝐶𝐶)∑ exp(𝛽𝛽𝐶𝐶𝑥𝑥𝑗𝑗))𝑗𝑗𝑗𝑗𝐶𝐶
, (4.6)
where 𝛽𝛽𝑖𝑖 is a vector of parameters for individual i;
C is the choice set.
As the researcher does not know 𝛽𝛽s, he derives unconditional choice probability as an integral of the probability 𝑃𝑃𝐶𝐶𝑑𝑑(𝛽𝛽𝑖𝑖) over all possible variables of βi.
The following are used as possible distributions f(β): normal, log-normal, uniform, triangular or any other distribution (see Train, 2009, Ch. 6 for all the characteristics of distributions). Normal and log-normal distributions are mainly used: log-normal distribution is usually used, when it is known that the parameter has the same sign for all decision makers.
One should not mix β of the estimation model with the parameters of the density function estimated by the researcher: for normal distribution β ∼ N(b, W) or for log-normal distribution ln(β ∼ N(b, W)) with parameters b (mean) and W (covariance).
Individual utility can also be represented as follows (4.7), showing the advantages of mixed logit model over MNL:
𝑈𝑈𝑖𝑖𝑖𝑖𝑖𝑖 = (𝛽𝛽 + 𝜂𝜂𝑖𝑖)𝑥𝑥𝑖𝑖𝑖𝑖𝑖𝑖 + 𝜀𝜀𝑖𝑖𝑖𝑖𝑖𝑖, (4.7)
190
where 𝛽𝛽 is a vector of mean attribute utility weights (parameter) in the population;
𝜂𝜂𝑖𝑖 is a vector of individual i-specific deviations from the mean;
𝜀𝜀𝑖𝑖𝑖𝑖𝑖𝑖 is a iid extreme value error vector.
WTP issues for mixed logit models
Since the utility of an alternative is a linear function of the product’s attributes the ratio between two coefficients is the marginal rate of substitution between these two attributes. If one of two attributes is the price attribute this rate of substitution is called marginal WTP for a change in the qualitative attribute (4.8):
𝑀𝑀𝑀𝑀𝑀𝑀𝑃𝑃𝑖𝑖 = 𝑑𝑑𝑥𝑥𝐶𝐶𝑑𝑑𝑑𝑑
=𝛽𝛽𝑥𝑥𝐶𝐶−𝛽𝛽𝑝𝑝
, (4.8)
Hole and Kolstad (2012, p. 44-45) treat the question of mixed logit models’ usage for WTP estimations and state that “Since the WTP for an attribute is given by the ratio of the attribute coefficient to the price coefficient, the WTP from a mixed logit model is given by the ratio of two randomly distributed terms. Depending on the choice of distributions for the coefficients this can lead to WTP distributions which are heavily skewed and that may not even have defined moments.”
The authors propose to leave the fixed price coefficient in order to deal with this problem. In this case a WTP is the distribution of the coefficient of an attribute scaled by the fixed price coefficient. However, the assumption that the price coefficient is fixed among all consumers – all individuals have the same preferences for price, may be too strong in some cases, but may be needed to guarantee modelling implementability. A way to specify heterogeneous preferences for the price is to leave the coefficient to be log-normally distributed, therefore, the coefficient is always positive but the WTP distribution may be skewed, producing unrealistic estimates (means and standard deviations) (Hole and Kolstad, 2012).
Nevertheless, usually the research leaves the price coefficient to be normally distributed and fixed, supposing that it may be positive or negative (for all consumers at the same time in different choice situations), since normal distribution does not restrain the coefficients to be positive, as in log-normal distribution (Train, 2009).
Previous analysis of consumers’ preferences with mixed logit models find that when heterogeneity in preferences is allowed it ameliorates the model fit, providing, therefore,
191
the proof of the presence of preferences’ heterogeneity (for references see Hole and Kolstad, 2012).
2.4. Generalized MNL - a new method, which accounts for preference and scale heterogeneity
While the mixed logit model allows random coefficients of the observed attributes and supports the hypothesis of independent and identically distributed (iid) error terms, recently some doubts have been aroused about the exactitude in accounting of consumers’ preferences in such models. Instead of claiming that heterogeneity comes out the differences of consumers and their preferences, the idea that consumers’ tastes are homogeneous and their scale is different has started the development of scaled MNL models (Gu et al., 2013; Greene and Hensher, 2010).
Fiebig and coauthors (2010) support the idea of previous research that the differences in tastes/preferences captured by mixed logit model is better explained as “scale” heterogeneity. This means that the scale/standard deviation of the error term is different from the others’. The scale parameter is positive for all consumers, whereas “attribute weights may vary in the population, for all consumers they must have the same sign” (Fiebig et al., 2010, p.2).
Scale heterogeneity model (S-MNL) assumes that error vector 𝜀𝜀 has a scale (variance) that is normalized to that of the standard extreme value distribution.
Through MNL, in which individual utility with scaling parameter may be represented (4.9):
𝑈𝑈𝑖𝑖𝑖𝑖𝑖𝑖 = 𝛽𝛽𝑥𝑥𝑖𝑖𝑖𝑖𝑖𝑖 + 𝜀𝜀𝑖𝑖𝑖𝑖𝑖𝑖 𝜎𝜎⁄ , (4.9)
where 𝜎𝜎 is the scale of the error term. MNL model assumes 𝜎𝜎 to be normalized to 1.
If 𝜎𝜎 is heterogeneous in population and its value for a person i is 𝜎𝜎𝑖𝑖, then S-MNL model’s individual utility is following (4.10):
𝑈𝑈𝑖𝑖𝑖𝑖𝑖𝑖 = (𝛽𝛽𝜎𝜎𝑖𝑖)𝑥𝑥𝑖𝑖𝑖𝑖𝑖𝑖 + 𝜀𝜀𝑖𝑖𝑖𝑖𝑖𝑖. (4.10)
192
It means that vector 𝛽𝛽 is scaled (upwards or downwards) proportionally across individuals and choice behavior is more random for some consumers than for others (Gu et al., 2013).
The advantage of this model over mixed logit is that the vector of parameters is 𝛽𝛽𝜎𝜎𝑖𝑖 is simpler that the one of mixed logit (𝛽𝛽 + 𝜂𝜂𝑖𝑖), most distributions, which are assumed in mixed models are not actually normal and the fact that previous research shows that when comparing individual coefficient vectors between consumers it seems that a certain scale is present. Therefore, S-MNL fits better to capture the heterogeneity in preferences.
The authors state that scale may differ across people or choice situations, therefore it is assumed to be dependent of personal characteristics or choice situations (4.11):
𝜎𝜎𝑖𝑖𝑖𝑖 = 𝑒𝑒𝑥𝑥𝑒𝑒(𝜎𝜎� + 𝜃𝜃𝑧𝑧𝑖𝑖𝑖𝑖 + 𝜏𝜏𝜀𝜀𝑖𝑖), (4.11)
where 𝑧𝑧𝑖𝑖𝑖𝑖 is a vector of characteristics of individual i and choice situation t. This vector may contain demographic information or choice situation features (parameters of entropy/ similarity/etc.);
τ is the coefficient on the unobserved scale heterogeneity.
As a more complex method of accounting for heterogeneity Fiebig et al. (2010) present also a generalized multinomial logit model (G-MNL), which nests mixed logit and S-MNL (4.12). Therefore, this model accounts for both: heterogeneity in scale and heterogeneity in preferences.
𝑈𝑈𝑖𝑖𝑖𝑖𝑖𝑖 = [𝜎𝜎𝑖𝑖𝛽𝛽 + 𝛾𝛾𝜂𝜂𝑖𝑖 + (1 − 𝛾𝛾)𝜎𝜎𝑖𝑖𝜂𝜂𝑖𝑖]𝑥𝑥𝑖𝑖𝑖𝑖𝑖𝑖 + 𝜀𝜀𝑖𝑖𝑖𝑖𝑖𝑖, (4.12)
where 𝛾𝛾 is a weighting parameter between 0 and 1 and it defines how the variance of taste heterogeneity varies in scale, if the model includes both of them;
However, this initial restriction of 𝛾𝛾 (0,1) is criticized and empirical studies show that without this restriction it is still possible to make behavioral interpretations (Gu et al., 2013).
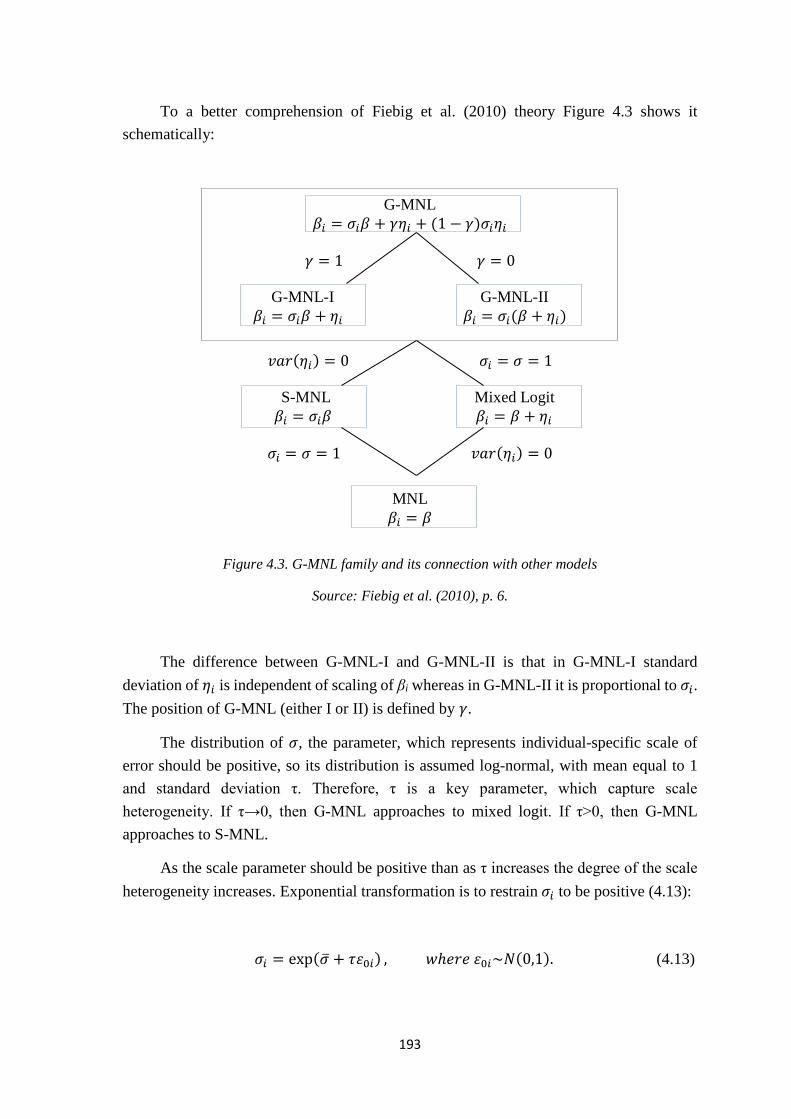
193
To a better comprehension of Fiebig et al. (2010) theory Figure 4.3 shows it schematically:
G-MNL 𝛽𝛽𝑖𝑖 = 𝜎𝜎𝑖𝑖𝛽𝛽 + 𝛾𝛾𝜂𝜂𝑖𝑖 + (1 − 𝛾𝛾)𝜎𝜎𝑖𝑖𝜂𝜂𝑖𝑖
𝛾𝛾 = 1 𝛾𝛾 = 0
G-MNL-I G-MNL-II
𝛽𝛽𝑖𝑖 = 𝜎𝜎𝑖𝑖𝛽𝛽 + 𝜂𝜂𝑖𝑖 𝛽𝛽𝑖𝑖 = 𝜎𝜎𝑖𝑖(𝛽𝛽 + 𝜂𝜂𝑖𝑖)
𝑣𝑣𝑣𝑣𝑣𝑣(𝜂𝜂𝑖𝑖) = 0 𝜎𝜎𝑖𝑖 = 𝜎𝜎 = 1
S-MNL Mixed Logit 𝛽𝛽𝑖𝑖 = 𝜎𝜎𝑖𝑖𝛽𝛽 𝛽𝛽𝑖𝑖 = 𝛽𝛽 + 𝜂𝜂𝑖𝑖
𝜎𝜎𝑖𝑖 = 𝜎𝜎 = 1 𝑣𝑣𝑣𝑣𝑣𝑣(𝜂𝜂𝑖𝑖) = 0
MNL 𝛽𝛽𝑖𝑖 = 𝛽𝛽
Figure 4.3. G-MNL family and its connection with other models
Source: Fiebig et al. (2010), p. 6.
The difference between G-MNL-I and G-MNL-II is that in G-MNL-I standard deviation of 𝜂𝜂𝑖𝑖 is independent of scaling of βi whereas in G-MNL-II it is proportional to 𝜎𝜎𝑖𝑖. The position of G-MNL (either I or II) is defined by 𝛾𝛾.
The distribution of 𝜎𝜎, the parameter, which represents individual-specific scale of error should be positive, so its distribution is assumed log-normal, with mean equal to 1 and standard deviation τ. Therefore, τ is a key parameter, which capture scale heterogeneity. If τ→0, then G-MNL approaches to mixed logit. If τ>0, then G-MNL approaches to S-MNL.
As the scale parameter should be positive than as τ increases the degree of the scale heterogeneity increases. Exponential transformation is to restrain 𝜎𝜎𝑖𝑖 to be positive (4.13):
𝜎𝜎𝑖𝑖 = exp(𝜎𝜎� + 𝜏𝜏𝜀𝜀0𝑖𝑖) , 𝑤𝑤ℎ𝑒𝑒𝑣𝑣𝑒𝑒 𝜀𝜀0𝑖𝑖~𝑁𝑁(0,1). (4.13)
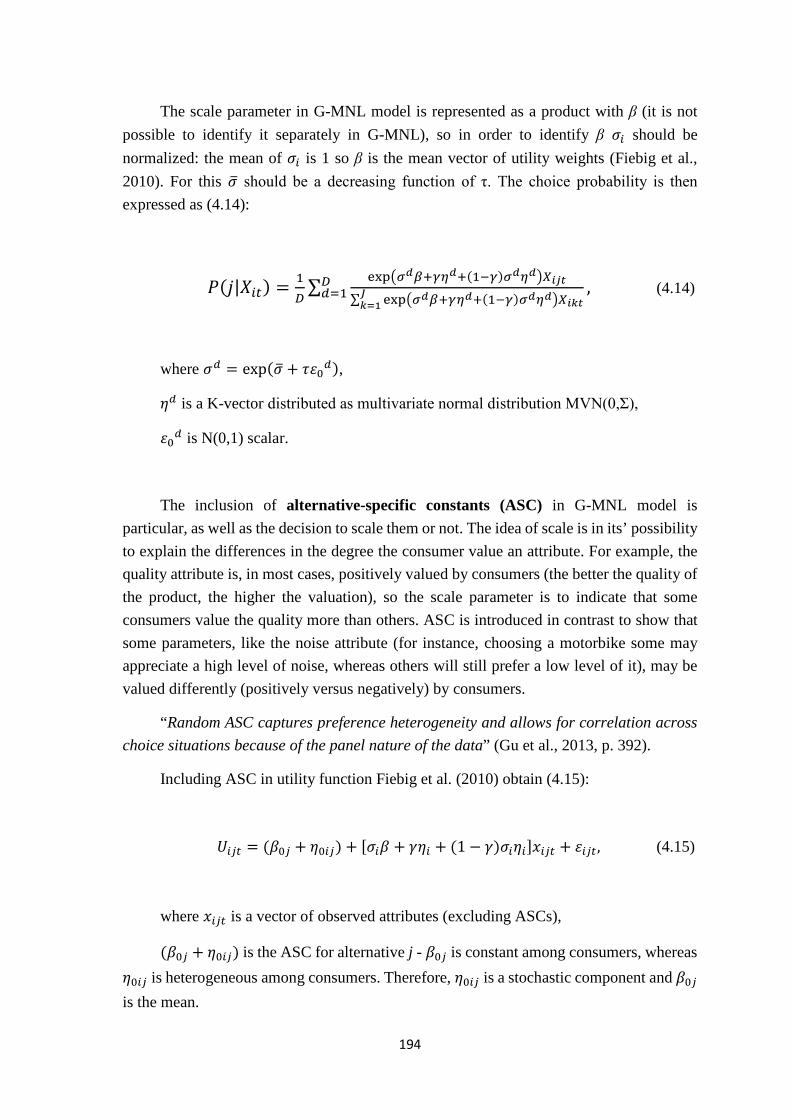
194
The scale parameter in G-MNL model is represented as a product with β (it is not possible to identify it separately in G-MNL), so in order to identify β 𝜎𝜎𝑖𝑖 should be normalized: the mean of 𝜎𝜎𝑖𝑖 is 1 so β is the mean vector of utility weights (Fiebig et al., 2010). For this 𝜎𝜎� should be a decreasing function of τ. The choice probability is then expressed as (4.14):
𝑃𝑃(𝑗𝑗|𝑋𝑋𝑖𝑖𝑖𝑖) = 1𝐷𝐷∑ exp�𝜎𝜎𝐶𝐶𝛽𝛽+𝛾𝛾𝜂𝜂𝐶𝐶+(1−𝛾𝛾)𝜎𝜎𝐶𝐶𝜂𝜂𝐶𝐶�𝑋𝑋𝐶𝐶𝑗𝑗𝑖𝑖
∑ exp�𝜎𝜎𝐶𝐶𝛽𝛽+𝛾𝛾𝜂𝜂𝐶𝐶+(1−𝛾𝛾)𝜎𝜎𝐶𝐶𝜂𝜂𝐶𝐶�𝑋𝑋𝐶𝐶𝑖𝑖𝑖𝑖𝐽𝐽𝑖𝑖=1
,𝐷𝐷𝑑𝑑=1 (4.14)
where 𝜎𝜎𝑑𝑑 = exp(𝜎𝜎� + 𝜏𝜏𝜀𝜀0𝑑𝑑),
𝜂𝜂𝑑𝑑 is a K-vector distributed as multivariate normal distribution MVN(0,Σ),
𝜀𝜀0𝑑𝑑 is N(0,1) scalar.
The inclusion of alternative-specific constants (ASC) in G-MNL model is particular, as well as the decision to scale them or not. The idea of scale is in its’ possibility to explain the differences in the degree the consumer value an attribute. For example, the quality attribute is, in most cases, positively valued by consumers (the better the quality of the product, the higher the valuation), so the scale parameter is to indicate that some consumers value the quality more than others. ASC is introduced in contrast to show that some parameters, like the noise attribute (for instance, choosing a motorbike some may appreciate a high level of noise, whereas others will still prefer a low level of it), may be valued differently (positively versus negatively) by consumers.
“Random ASC captures preference heterogeneity and allows for correlation across choice situations because of the panel nature of the data” (Gu et al., 2013, p. 392).
Including ASC in utility function Fiebig et al. (2010) obtain (4.15):
𝑈𝑈𝑖𝑖𝑖𝑖𝑖𝑖 = (𝛽𝛽0𝑖𝑖 + 𝜂𝜂0𝑖𝑖𝑖𝑖) + [𝜎𝜎𝑖𝑖𝛽𝛽 + 𝛾𝛾𝜂𝜂𝑖𝑖 + (1 − 𝛾𝛾)𝜎𝜎𝑖𝑖𝜂𝜂𝑖𝑖]𝑥𝑥𝑖𝑖𝑖𝑖𝑖𝑖 + 𝜀𝜀𝑖𝑖𝑖𝑖𝑖𝑖, (4.15)
where 𝑥𝑥𝑖𝑖𝑖𝑖𝑖𝑖 is a vector of observed attributes (excluding ASCs),
(𝛽𝛽0𝑖𝑖 + 𝜂𝜂0𝑖𝑖𝑖𝑖) is the ASC for alternative j - 𝛽𝛽0𝑖𝑖 is constant among consumers, whereas 𝜂𝜂0𝑖𝑖𝑖𝑖 is heterogeneous among consumers. Therefore, 𝜂𝜂0𝑖𝑖𝑖𝑖 is a stochastic component and 𝛽𝛽0𝑖𝑖 is the mean.
195
The goodness of fit and the quality of the estimation models are measured on the basis of log likelihood index, Akaike information criterion (AIC) and Bayesian information criterion (BIC).
3. Experiment and the hypotheses
Pivot choice experiment allows to get an estimation for entire electricity contracts and for particular attributes, eliciting consumer preferences for smart meters. We suppose that there are different groups of consumers, which may have different valuations of smart grid technologies, applied to their electricity contracts and their consumption. Heterogeneity in preferences is particularly applied to the attribute of control mode, because while some consumers may value automatic control of smart meters and consumption practices, some may prefer to have full control over their consumption and home appliances and avoid external intrusion.
Electricity contracts are characterized by the attributes, which define consumers’ choices. New contracts, proposed to consumers, aim to emphasize their differences with ordinary contracts they are characterized by four attributes (Table 4.1): bill amount variation, control mode type, comfort level, part of renewable energy.
The participants are faced with 12 choice situations, based on their own electricity consumption. Each choice situation consists of 3 alternatives, where the 3rd alternative is an “opt-out” alternative or the standard electricity contract currently held by a participant. This alternative does not have any “smart” levels of attributes and all levels are set on the base level.
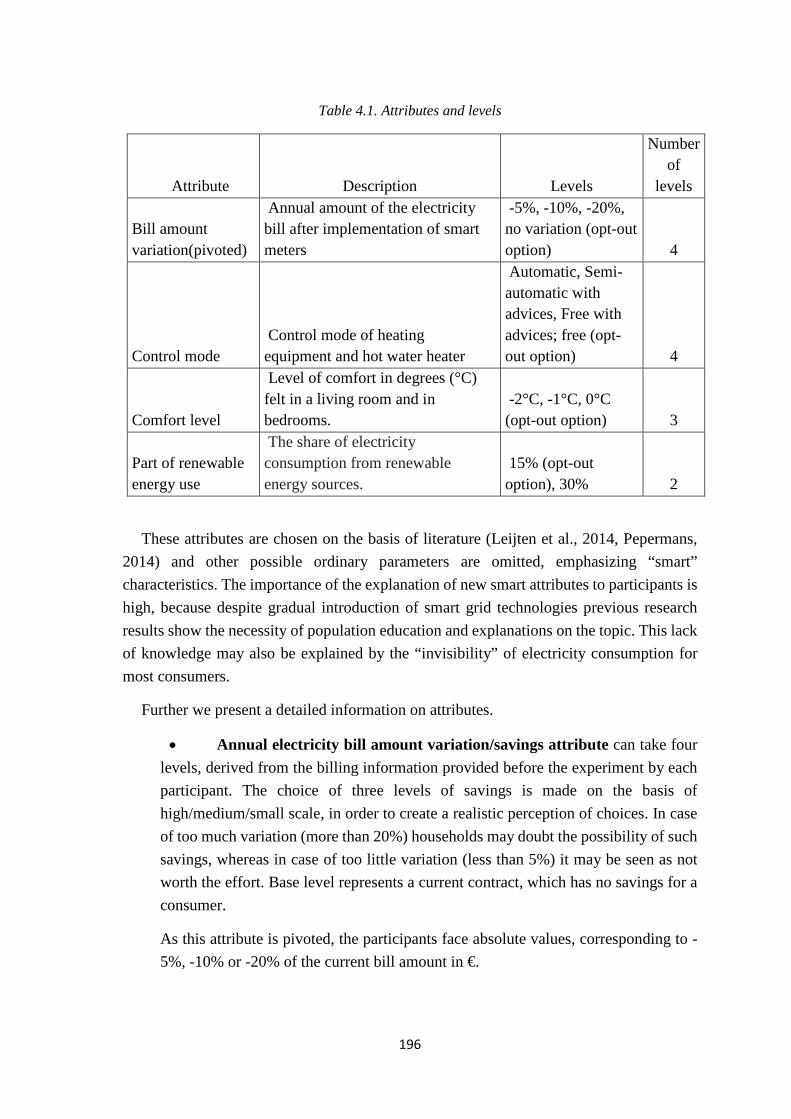
196
Table 4.1. Attributes and levels
Attribute Description Levels
Number of
levels
Bill amount variation(pivoted)
Annual amount of the electricity bill after implementation of smart meters
-5%, -10%, -20%, no variation (opt-out option) 4
Control mode Control mode of heating equipment and hot water heater
Automatic, Semi-automatic with advices, Free with advices; free (opt-out option) 4
Comfort level
Level of comfort in degrees (°C) felt in a living room and in bedrooms.
-2°C, -1°C, 0°C (opt-out option) 3
Part of renewable energy use
The share of electricity consumption from renewable energy sources.
15% (opt-out option), 30% 2
These attributes are chosen on the basis of literature (Leijten et al., 2014, Pepermans, 2014) and other possible ordinary parameters are omitted, emphasizing “smart” characteristics. The importance of the explanation of new smart attributes to participants is high, because despite gradual introduction of smart grid technologies previous research results show the necessity of population education and explanations on the topic. This lack of knowledge may also be explained by the “invisibility” of electricity consumption for most consumers.
Further we present a detailed information on attributes.
• Annual electricity bill amount variation/savings attribute can take four levels, derived from the billing information provided before the experiment by each participant. The choice of three levels of savings is made on the basis of high/medium/small scale, in order to create a realistic perception of choices. In case of too much variation (more than 20%) households may doubt the possibility of such savings, whereas in case of too little variation (less than 5%) it may be seen as not worth the effort. Base level represents a current contract, which has no savings for a consumer.
As this attribute is pivoted, the participants face absolute values, corresponding to -5%, -10% or -20% of the current bill amount in €.
197
• The comfort attribute indicates the comfort in the consumer's home and is measured in degrees of Celsius, because, on researchers’ point of view, such measure is the most clear and easy for participants to understand. We believe that one's comfort depends on the temperature in the living room and in the bedrooms, as well as the average time in minutes of a shower per day per person. Our experience considers three possible changes compared to current levels of comfort :
- Maintaining the current temperature of the consumer’s home and no limitation of time for showers (No change – base level);
- A decrease in temperature by 1°C for the living room and 2°C for bedrooms, and a limited time for showering of 10 minutes per day per person;
- A decrease in temperature of 2°C for the living room and 3°C for bedrooms, and a limited time for showering of 8 minutes per day per person.
• Control mode attribute is a level of smart meters “penetration” into households’ life: it concerns the control mode of heating and hot water heater either by automatic adjustment or manual by consumers. As mentioned in Allcott (2011) heating and cooling are major electricity consumers in the US, when more than a half of energy consumption goes on the refrigerators, air conditioners and housing and water heating. The distribution is similar in France, which is why the control mode concerns heating and water heater. The concerns of privacy and loss of control are widely discussed above, so this attribute has several levels of control. In-home equipment includes temperature sensors in all rooms; a central control station that communicates with your wireless equipment and your electricity supplier; a tablet (in-home display), which stores and analyzes all information collected by the sensors on your consumption. This attribute can be applied in three forms:
- A fully automatic control mode. This control mode is based on a central control station, a tablet and automatic sensors placed on the heating system and hot water heater. All these facilities will allow the electricity provider to pilot directly household’s electricity consumption related to heating and hot water and give advice. This automatic control mode involves a one year commitment and the electricity supplier will manage optimally household’s electricity consumption.
- A semi-automatic control mode. It differs from the automatic control mode by the engagement period: the control of consumer’s facilities by the electricity supplier is conducted for up to 20 days over the year. These 20 days are the periods when domestic electricity consumption is the highest. The
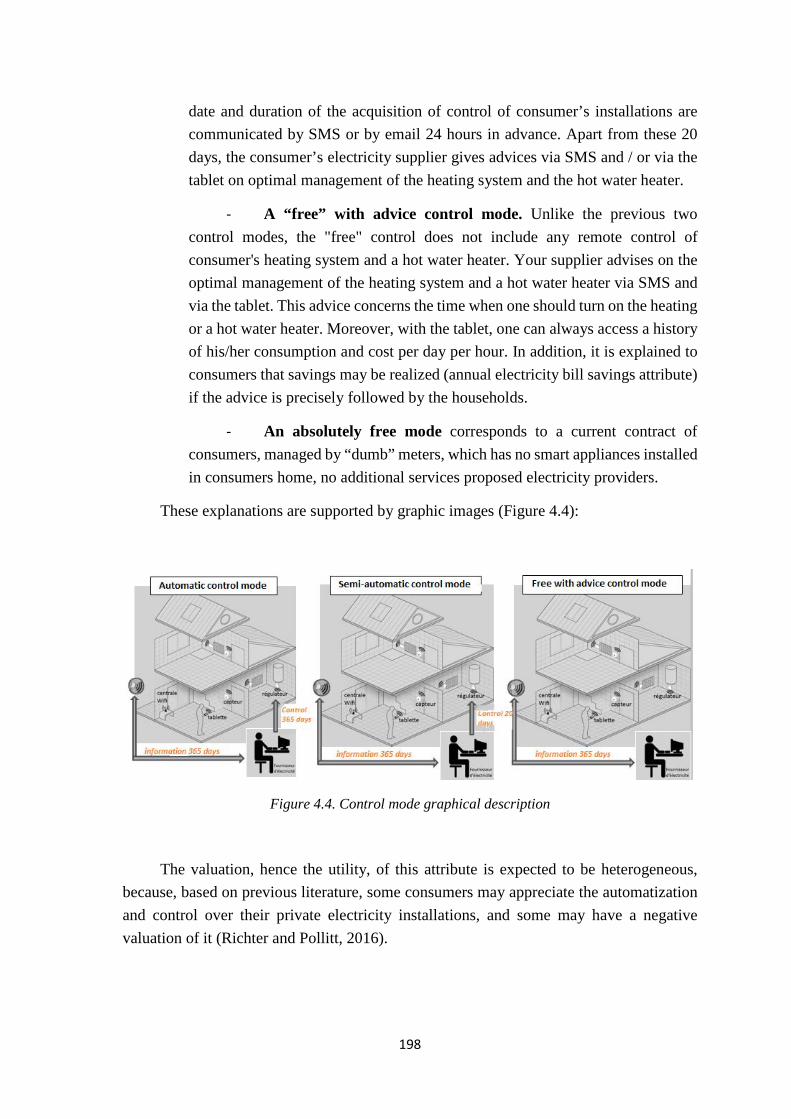
198
date and duration of the acquisition of control of consumer’s installations are communicated by SMS or by email 24 hours in advance. Apart from these 20 days, the consumer’s electricity supplier gives advices via SMS and / or via the tablet on optimal management of the heating system and the hot water heater.
- A “free” with advice control mode. Unlike the previous two control modes, the "free" control does not include any remote control of consumer's heating system and a hot water heater. Your supplier advises on the optimal management of the heating system and a hot water heater via SMS and via the tablet. This advice concerns the time when one should turn on the heating or a hot water heater. Moreover, with the tablet, one can always access a history of his/her consumption and cost per day per hour. In addition, it is explained to consumers that savings may be realized (annual electricity bill savings attribute) if the advice is precisely followed by the households.
- An absolutely free mode corresponds to a current contract of consumers, managed by “dumb” meters, which has no smart appliances installed in consumers home, no additional services proposed electricity providers.
These explanations are supported by graphic images (Figure 4.4):
Figure 4.4. Control mode graphical description
The valuation, hence the utility, of this attribute is expected to be heterogeneous, because, based on previous literature, some consumers may appreciate the automatization and control over their private electricity installations, and some may have a negative valuation of it (Richter and Pollitt, 2016).
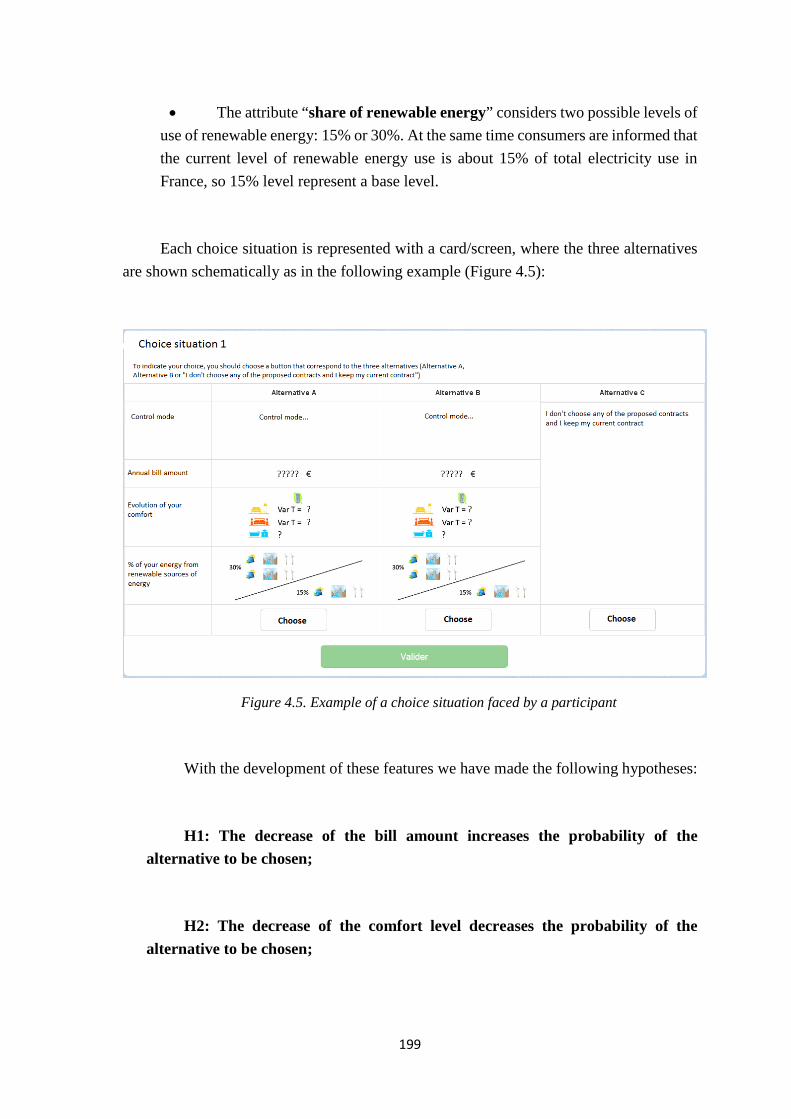
199
• The attribute “share of renewable energy” considers two possible levels of use of renewable energy: 15% or 30%. At the same time consumers are informed that the current level of renewable energy use is about 15% of total electricity use in France, so 15% level represent a base level.
Each choice situation is represented with a card/screen, where the three alternatives are shown schematically as in the following example (Figure 4.5):
Figure 4.5. Example of a choice situation faced by a participant
With the development of these features we have made the following hypotheses:
H1: The decrease of the bill amount increases the probability of the alternative to be chosen;
H2: The decrease of the comfort level decreases the probability of the alternative to be chosen;
200
H3: The increase in the use of renewable energy increases the probability of the alternative to be chosen;
H4: The automatization of smart meters control increases the probability of the alternative to be chosen.
3.1. Experimental design
By way of reminder, the utility of alternative i is then be given by (4.16):
𝑈𝑈𝑖𝑖 = 𝛽𝛽𝑓𝑓 ∗ 𝐹𝐹𝑖𝑖 + 𝛽𝛽𝑑𝑑 ∗ 𝑃𝑃𝑖𝑖 + 𝛽𝛽𝑐𝑐 ∗ 𝐶𝐶𝑖𝑖 + 𝛽𝛽𝐸𝐸𝐸𝐸 ∗ 𝐸𝐸𝐸𝐸𝑖𝑖 + 𝜀𝜀 (4.16)
Where 𝛽𝛽𝑓𝑓 is a coefficient associated with the annual electricity bill variation attribute (F), 𝛽𝛽𝑑𝑑 is a coefficient associated with the control mode attribute (P), 𝛽𝛽𝑐𝑐 is a coefficient associated with the comfort attribute (C), 𝛽𝛽𝐸𝐸𝐸𝐸 is a coefficient associated with the renewable energy use attribute (ER) for alternative i.
On the basis of utility configuration (4.16) and model assumptions the design of the experiment (choice situations) are developed.
Recently efficient designs have become widely used because of their higher statistical efficiency, due to taking into account the stated choice model type, in comparison with orthogonal designs (Bliemer et al., 2009). In addition, including a reference alternative (pivot) leads to designs with even higher statistical efficiency (Rose et al, 2008).
Several efficient designs with 12 choice cards with unlabeled alternatives have been created with Ngene software (Mertics, 2012) and one of them has been chosen (D-efficiency measure equals 0.0025). It generates parameter estimates with as small as possible standard errors for MNL model. Dominant and dominating alternatives have been ruled out.
Our choice experiment is pivoted over the reference level of bill amount, in order to create an efficient design we used the data obtained on the recruitment stage to calculate the average amount of annual bill amount, which was implemented in the utility function calculation on the phase of creation of the design. Priors set to zero, because of the absence of similar previous research, pilots and any information possible to use, however, the signs of utility functions are specified.
201
In pivot experiments an opt-out option is usually presented as a reference alternative, proposing to stay in current situation, so we call it “keep your current contract” choice. A participant will choose the opt-out option if the utility of choosing any of other options is lower than the one for the opt-out. The utility of the opt-out alternative (reference alternative) equals to zero.
4. Main findings
The participants for the study were recruited via the recruitment procedure conducted on the laboratory website and via media.
During the recruitment stage, participants were asked to provide their annual electricity bill amount, as well as their socio-demographic information. This information enabled the researchers to create an identification number/ profile in advance and to protect the anonymity condition, as well as to save time during the session. Participants who stated the absence of electric heating or the presence of supplementary heating were eliminated.
This way of identification is also used in order to assure the correct creation and functioning of the pivot experiment during the experiment.
When the participants arrived to the session they were identified with their identification numbers, created during the recruitment stage. An envelope with their participation remuneration was put down at each desk with 30€ in it. The participants were explained that this money was completely acquired by them, for their participation in the experimental session and the time and information provided during the on-line recruitment questionnaire.
Then, the flow of the experiment was explained, including examples, and from this moment the participants were asked not to communicate with one another.
In total 129 participants took part in 12 sessions in our experimental laboratory. The main characteristics of the participants are presented in Table 4.3.
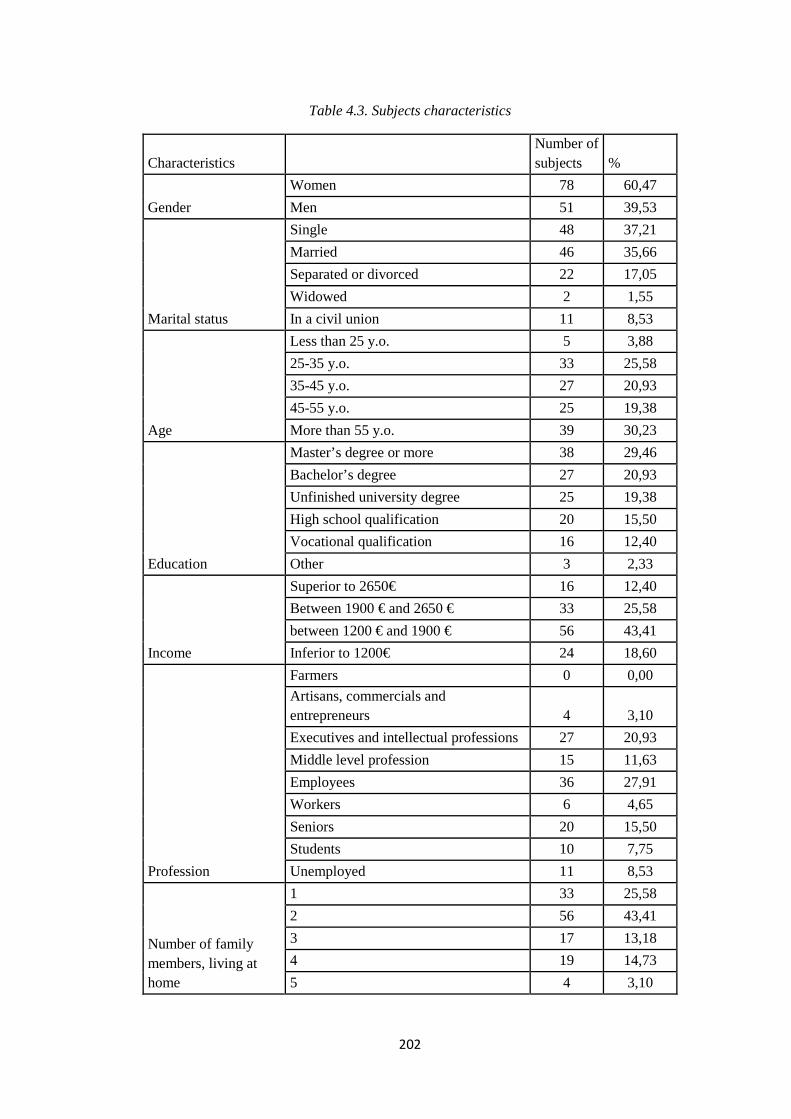
202
Table 4.3. Subjects characteristics
Characteristics Number of subjects %
Gender Women 78 60,47 Men 51 39,53
Marital status
Single 48 37,21 Married 46 35,66 Separated or divorced 22 17,05 Widowed 2 1,55 In a civil union 11 8,53
Age
Less than 25 y.o. 5 3,88 25-35 y.o. 33 25,58 35-45 y.o. 27 20,93 45-55 y.o. 25 19,38 More than 55 y.o. 39 30,23
Education
Master’s degree or more 38 29,46 Bachelor’s degree 27 20,93 Unfinished university degree 25 19,38 High school qualification 20 15,50 Vocational qualification 16 12,40 Other 3 2,33
Income
Superior to 2650€ 16 12,40 Between 1900 € and 2650 € 33 25,58 between 1200 € and 1900 € 56 43,41 Inferior to 1200€ 24 18,60
Profession
Farmers 0 0,00 Artisans, commercials and entrepreneurs 4 3,10 Executives and intellectual professions 27 20,93 Middle level profession 15 11,63 Employees 36 27,91 Workers 6 4,65 Seniors 20 15,50 Students 10 7,75 Unemployed 11 8,53
Number of family members, living at home
1 33 25,58 2 56 43,41 3 17 13,18 4 19 14,73 5 4 3,10
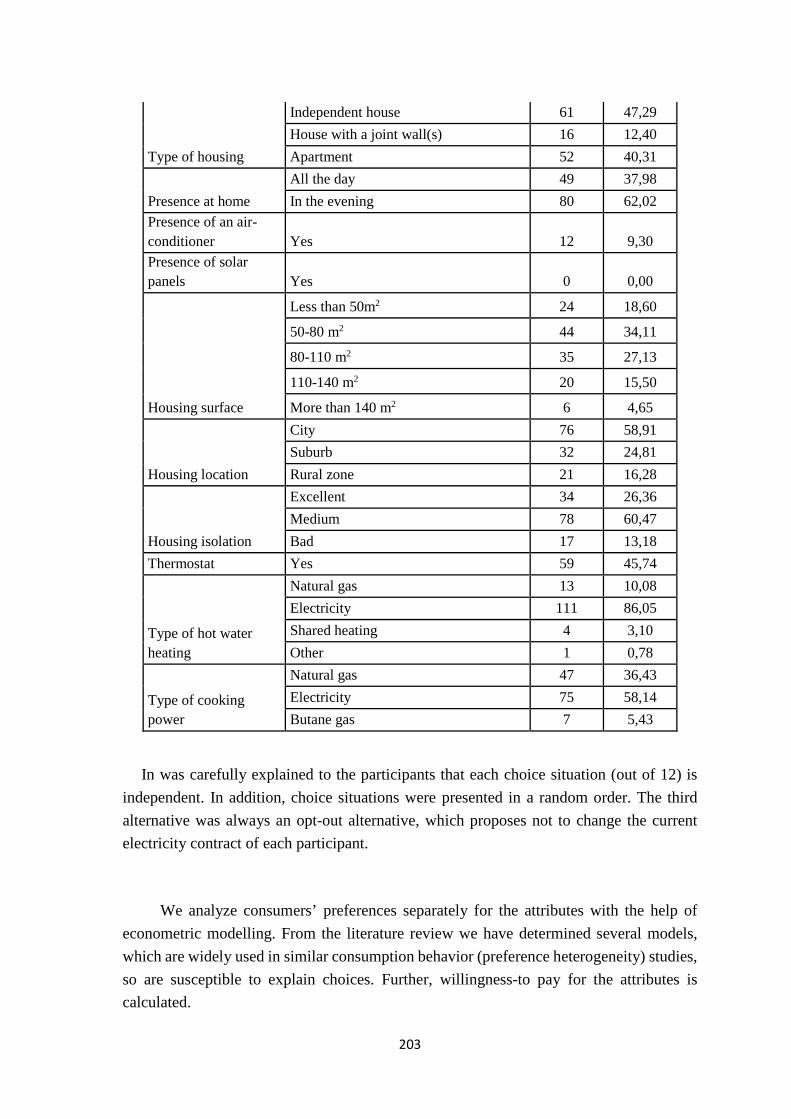
203
Type of housing
Independent house 61 47,29 House with a joint wall(s) 16 12,40 Apartment 52 40,31
Presence at home All the day 49 37,98 In the evening 80 62,02
Presence of an air-conditioner Yes 12 9,30 Presence of solar panels Yes 0 0,00
Housing surface
Less than 50m2 24 18,60
50-80 m2 44 34,11
80-110 m2 35 27,13
110-140 m2 20 15,50
More than 140 m2 6 4,65
Housing location
City 76 58,91 Suburb 32 24,81 Rural zone 21 16,28
Housing isolation
Excellent 34 26,36 Medium 78 60,47 Bad 17 13,18
Thermostat Yes 59 45,74
Type of hot water heating
Natural gas 13 10,08 Electricity 111 86,05 Shared heating 4 3,10 Other 1 0,78
Type of cooking power
Natural gas 47 36,43 Electricity 75 58,14 Butane gas 7 5,43
In was carefully explained to the participants that each choice situation (out of 12) is independent. In addition, choice situations were presented in a random order. The third alternative was always an opt-out alternative, which proposes not to change the current electricity contract of each participant.
We analyze consumers’ preferences separately for the attributes with the help of econometric modelling. From the literature review we have determined several models, which are widely used in similar consumption behavior (preference heterogeneity) studies, so are susceptible to explain choices. Further, willingness-to pay for the attributes is calculated.
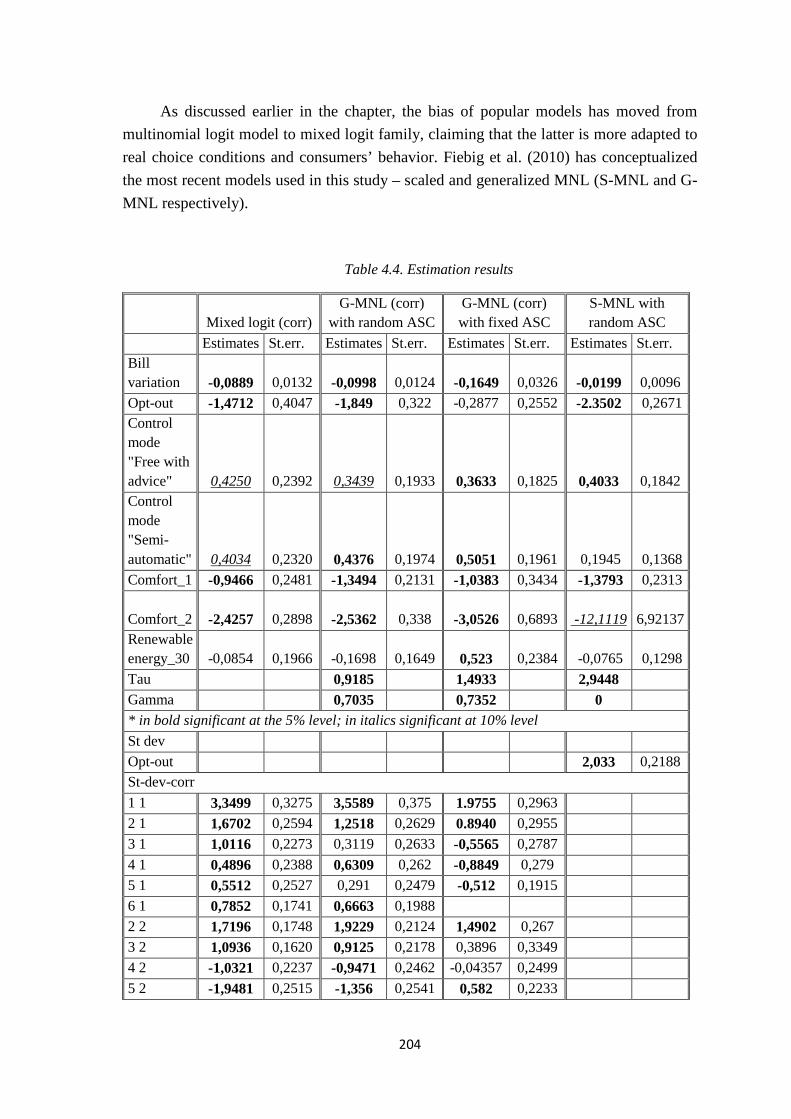
204
As discussed earlier in the chapter, the bias of popular models has moved from multinomial logit model to mixed logit family, claiming that the latter is more adapted to real choice conditions and consumers’ behavior. Fiebig et al. (2010) has conceptualized the most recent models used in this study – scaled and generalized MNL (S-MNL and G-MNL respectively).
Table 4.4. Estimation results
Mixed logit (corr) G-MNL (corr)
with random ASC G-MNL (corr) with fixed ASC
S-MNL with random ASC
Estimates St.err. Estimates St.err. Estimates St.err. Estimates St.err. Bill variation -0,0889 0,0132 -0,0998 0,0124 -0,1649 0,0326 -0,0199 0,0096 Opt-out -1,4712 0,4047 -1,849 0,322 -0,2877 0,2552 -2.3502 0,2671 Control mode "Free with advice" 0,4250 0,2392 0,3439 0,1933 0,3633 0,1825 0,4033 0,1842 Control mode "Semi-automatic" 0,4034 0,2320 0,4376 0,1974 0,5051 0,1961 0,1945 0,1368 Comfort_1 -0,9466 0,2481 -1,3494 0,2131 -1,0383 0,3434 -1,3793 0,2313
Comfort_2 -2,4257 0,2898 -2,5362 0,338 -3,0526 0,6893 -12,1119
6,92137 Renewable energy_30 -0,0854 0,1966 -0,1698 0,1649 0,523 0,2384 -0,0765 0,1298 Tau 0,9185 1,4933 2,9448 Gamma 0,7035 0,7352 0 * in bold significant at the 5% level; in italics significant at 10% level St dev Opt-out 2,033 0,2188 St-dev-corr 1 1 3,3499 0,3275 3,5589 0,375 1.9755 0,2963 2 1 1,6702 0,2594 1,2518 0,2629 0.8940 0,2955 3 1 1,0116 0,2273 0,3119 0,2633 -0,5565 0,2787 4 1 0,4896 0,2388 0,6309 0,262 -0,8849 0,279 5 1 0,5512 0,2527 0,291 0,2479 -0,512 0,1915 6 1 0,7852 0,1741 0,6663 0,1988 2 2 1,7196 0,1748 1,9229 0,2124 1,4902 0,267 3 2 1,0936 0,1620 0,9125 0,2178 0,3896 0,3349 4 2 -1,0321 0,2237 -0,9471 0,2462 -0,04357 0,2499 5 2 -1,9481 0,2515 -1,356 0,2541 0,582 0,2233
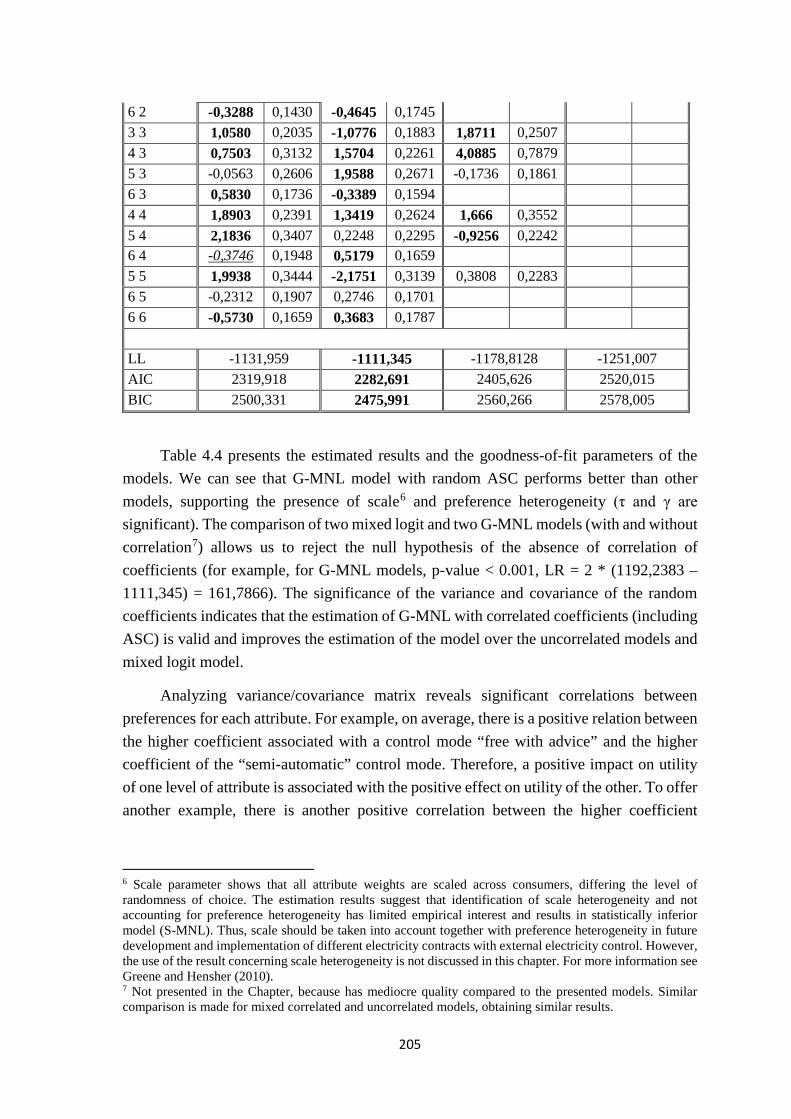
205
6 2 -0,3288 0,1430 -0,4645 0,1745 3 3 1,0580 0,2035 -1,0776 0,1883 1,8711 0,2507 4 3 0,7503 0,3132 1,5704 0,2261 4,0885 0,7879 5 3 -0,0563 0,2606 1,9588 0,2671 -0,1736 0,1861 6 3 0,5830 0,1736 -0,3389 0,1594 4 4 1,8903 0,2391 1,3419 0,2624 1,666 0,3552 5 4 2,1836 0,3407 0,2248 0,2295 -0,9256 0,2242 6 4 -0,3746 0,1948 0,5179 0,1659 5 5 1,9938 0,3444 -2,1751 0,3139 0,3808 0,2283 6 5 -0,2312 0,1907 0,2746 0,1701 6 6 -0,5730 0,1659 0,3683 0,1787 LL -1131,959 -1111,345 -1178,8128 -1251,007 AIC 2319,918 2282,691 2405,626 2520,015 BIC 2500,331 2475,991 2560,266 2578,005
Table 4.4 presents the estimated results and the goodness-of-fit parameters of the models. We can see that G-MNL model with random ASC performs better than other models, supporting the presence of scale6 and preference heterogeneity (τ and γ are significant). The comparison of two mixed logit and two G-MNL models (with and without correlation7) allows us to reject the null hypothesis of the absence of correlation of coefficients (for example, for G-MNL models, p-value < 0.001, LR = 2 * (1192,2383 – 1111,345) = 161,7866). The significance of the variance and covariance of the random coefficients indicates that the estimation of G-MNL with correlated coefficients (including ASC) is valid and improves the estimation of the model over the uncorrelated models and mixed logit model.
Analyzing variance/covariance matrix reveals significant correlations between preferences for each attribute. For example, on average, there is a positive relation between the higher coefficient associated with a control mode “free with advice” and the higher coefficient of the “semi-automatic” control mode. Therefore, a positive impact on utility of one level of attribute is associated with the positive effect on utility of the other. To offer another example, there is another positive correlation between the higher coefficient
6 Scale parameter shows that all attribute weights are scaled across consumers, differing the level of randomness of choice. The estimation results suggest that identification of scale heterogeneity and not accounting for preference heterogeneity has limited empirical interest and results in statistically inferior model (S-MNL). Thus, scale should be taken into account together with preference heterogeneity in future development and implementation of different electricity contracts with external electricity control. However, the use of the result concerning scale heterogeneity is not discussed in this chapter. For more information see Greene and Hensher (2010). 7 Not presented in the Chapter, because has mediocre quality compared to the presented models. Similar comparison is made for mixed correlated and uncorrelated models, obtaining similar results.
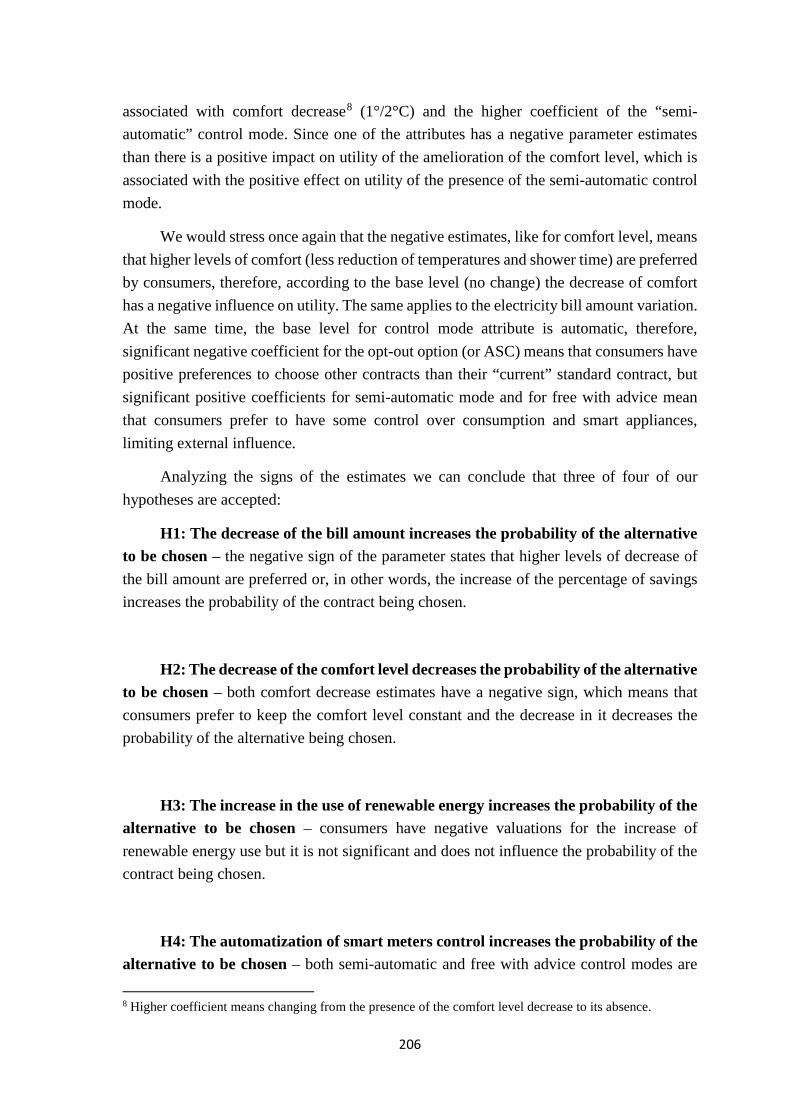
206
associated with comfort decrease8 (1°/2°C) and the higher coefficient of the “semi-automatic” control mode. Since one of the attributes has a negative parameter estimates than there is a positive impact on utility of the amelioration of the comfort level, which is associated with the positive effect on utility of the presence of the semi-automatic control mode.
We would stress once again that the negative estimates, like for comfort level, means that higher levels of comfort (less reduction of temperatures and shower time) are preferred by consumers, therefore, according to the base level (no change) the decrease of comfort has a negative influence on utility. The same applies to the electricity bill amount variation. At the same time, the base level for control mode attribute is automatic, therefore, significant negative coefficient for the opt-out option (or ASC) means that consumers have positive preferences to choose other contracts than their “current” standard contract, but significant positive coefficients for semi-automatic mode and for free with advice mean that consumers prefer to have some control over consumption and smart appliances, limiting external influence.
Analyzing the signs of the estimates we can conclude that three of four of our hypotheses are accepted:
H1: The decrease of the bill amount increases the probability of the alternative to be chosen – the negative sign of the parameter states that higher levels of decrease of the bill amount are preferred or, in other words, the increase of the percentage of savings increases the probability of the contract being chosen.
H2: The decrease of the comfort level decreases the probability of the alternative to be chosen – both comfort decrease estimates have a negative sign, which means that consumers prefer to keep the comfort level constant and the decrease in it decreases the probability of the alternative being chosen.
H3: The increase in the use of renewable energy increases the probability of the alternative to be chosen – consumers have negative valuations for the increase of renewable energy use but it is not significant and does not influence the probability of the contract being chosen.
H4: The automatization of smart meters control increases the probability of the alternative to be chosen – both semi-automatic and free with advice control modes are 8 Higher coefficient means changing from the presence of the comfort level decrease to its absence.
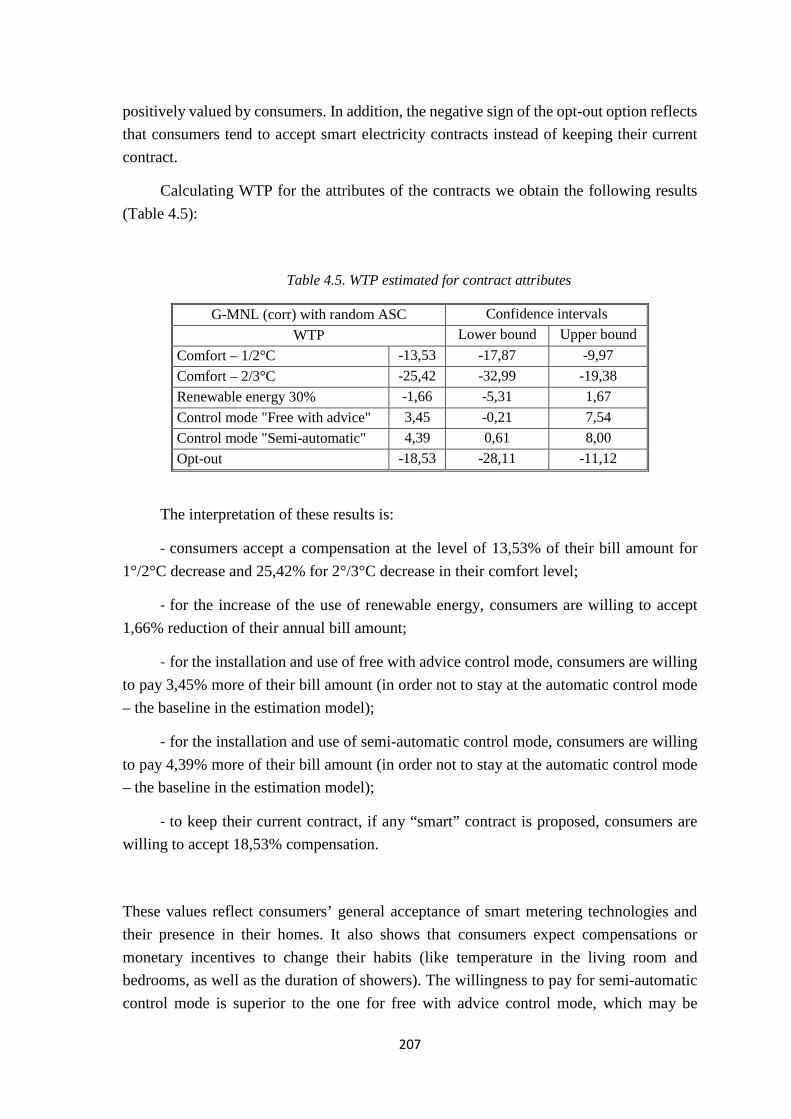
207
positively valued by consumers. In addition, the negative sign of the opt-out option reflects that consumers tend to accept smart electricity contracts instead of keeping their current contract.
Calculating WTP for the attributes of the contracts we obtain the following results (Table 4.5):
Table 4.5. WTP estimated for contract attributes
G-MNL (corr) with random ASC Confidence intervals WTP Lower bound Upper bound
Comfort – 1/2°C -13,53 -17,87 -9,97 Comfort – 2/3°C -25,42 -32,99 -19,38 Renewable energy 30% -1,66 -5,31 1,67 Control mode "Free with advice" 3,45 -0,21 7,54 Control mode "Semi-automatic" 4,39 0,61 8,00 Opt-out -18,53 -28,11 -11,12
The interpretation of these results is:
- consumers accept a compensation at the level of 13,53% of their bill amount for 1°/2°C decrease and 25,42% for 2°/3°C decrease in their comfort level;
- for the increase of the use of renewable energy, consumers are willing to accept 1,66% reduction of their annual bill amount;
- for the installation and use of free with advice control mode, consumers are willing to pay 3,45% more of their bill amount (in order not to stay at the automatic control mode – the baseline in the estimation model);
- for the installation and use of semi-automatic control mode, consumers are willing to pay 4,39% more of their bill amount (in order not to stay at the automatic control mode – the baseline in the estimation model);
- to keep their current contract, if any “smart” contract is proposed, consumers are willing to accept 18,53% compensation.
These values reflect consumers’ general acceptance of smart metering technologies and their presence in their homes. It also shows that consumers expect compensations or monetary incentives to change their habits (like temperature in the living room and bedrooms, as well as the duration of showers). The willingness to pay for semi-automatic control mode is superior to the one for free with advice control mode, which may be
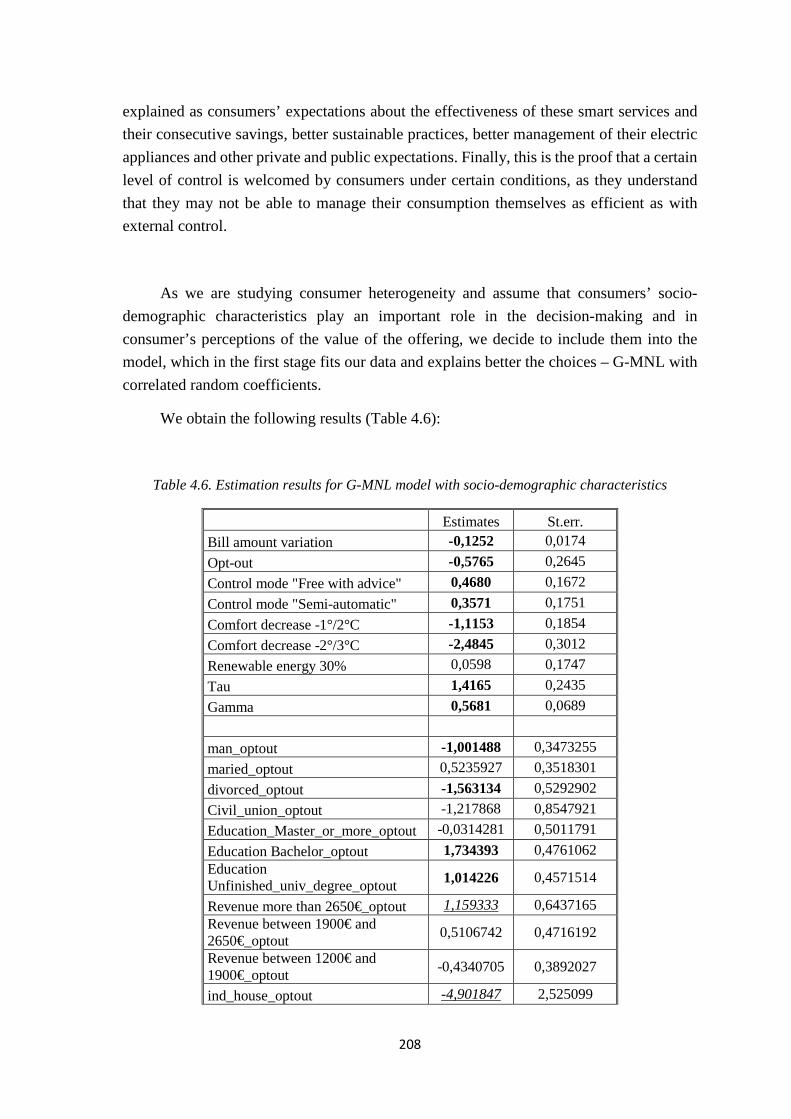
208
explained as consumers’ expectations about the effectiveness of these smart services and their consecutive savings, better sustainable practices, better management of their electric appliances and other private and public expectations. Finally, this is the proof that a certain level of control is welcomed by consumers under certain conditions, as they understand that they may not be able to manage their consumption themselves as efficient as with external control.
As we are studying consumer heterogeneity and assume that consumers’ socio-demographic characteristics play an important role in the decision-making and in consumer’s perceptions of the value of the offering, we decide to include them into the model, which in the first stage fits our data and explains better the choices – G-MNL with correlated random coefficients.
We obtain the following results (Table 4.6):
Table 4.6. Estimation results for G-MNL model with socio-demographic characteristics
Estimates St.err. Bill amount variation -0,1252 0,0174 Opt-out -0,5765 0,2645 Control mode "Free with advice" 0,4680 0,1672 Control mode "Semi-automatic" 0,3571 0,1751 Comfort decrease -1°/2°C -1,1153 0,1854 Comfort decrease -2°/3°C -2,4845 0,3012 Renewable energy 30% 0,0598 0,1747 Tau 1,4165 0,2435 Gamma 0,5681 0,0689 man_optout -1,001488 0,3473255 maried_optout 0,5235927 0,3518301 divorced_optout -1,563134 0,5292902 Civil_union_optout -1,217868 0,8547921 Education_Master_or_more_optout -0,0314281 0,5011791 Education Bachelor_optout 1,734393 0,4761062 Education Unfinished_univ_degree_optout 1,014226 0,4571514
Revenue more than 2650€_optout 1,159333 0,6437165 Revenue between 1900€ and 2650€_optout 0,5106742 0,4716192
Revenue between 1200€ and 1900€_optout -0,4340705 0,3892027
ind_house_optout -4,901847 2,525099

209
House_joint_wall_optout -0,1115864 0,3676711 surface_optout -0,0061887 0,0066103 age30_45_optout -0,328015 0,4226575 age45_60_optout 0,1677142 0,626773 age_plus60_optout 0,4525625 0,6174191
* in bold significant at the 5% level; in italics significant at 10% level
St-dev-corr 1 1 3,2213 0,4101 2 1 2,0407 0,3083 3 1 0,0563 0,2338 4 1 -0,0188 0,2415 5 1 0,6498 0,3249 6 1 -0,0935 0,2252 2 2 1,8893 0,2481 3 2 1,6126 0,2067 4 2 -0,8966 0,2047 5 2 -2,2911 0,2628 6 2 0,1726 0,1523 3 3 -0,7909 0,1742 4 3 2,0399 0,2461 5 3 1,8530 0,2708 6 3 0,1197 0,1750 4 4 0,8179 0,2117 5 4 0,5689 0,2382 6 4 -0,7813 0,1750 5 5 -2,5818 0,2964 6 5 0,4266 0,1924 6 6 0,3263 0,1326 LL -1098.2109 AIC 2288.422 BIC 2584.815
The estimation results and the goodness-of-fit parameters of the model show that the quality of the model has increased with the inclusion of socio-demographic parameters and some of them are significant. It supports the methodological literature results presented in Chapter 2, proving that socio-demographic characteristics are an important source of explanation of individual’s choices. Man and divorced individuals have less probability to choose contracts with external control by electricity providers, whereas well-educated people will have more probability to choose them. Level of the salary is found to play a significant role – people with the salary superior to 2650€ per month have positive utility
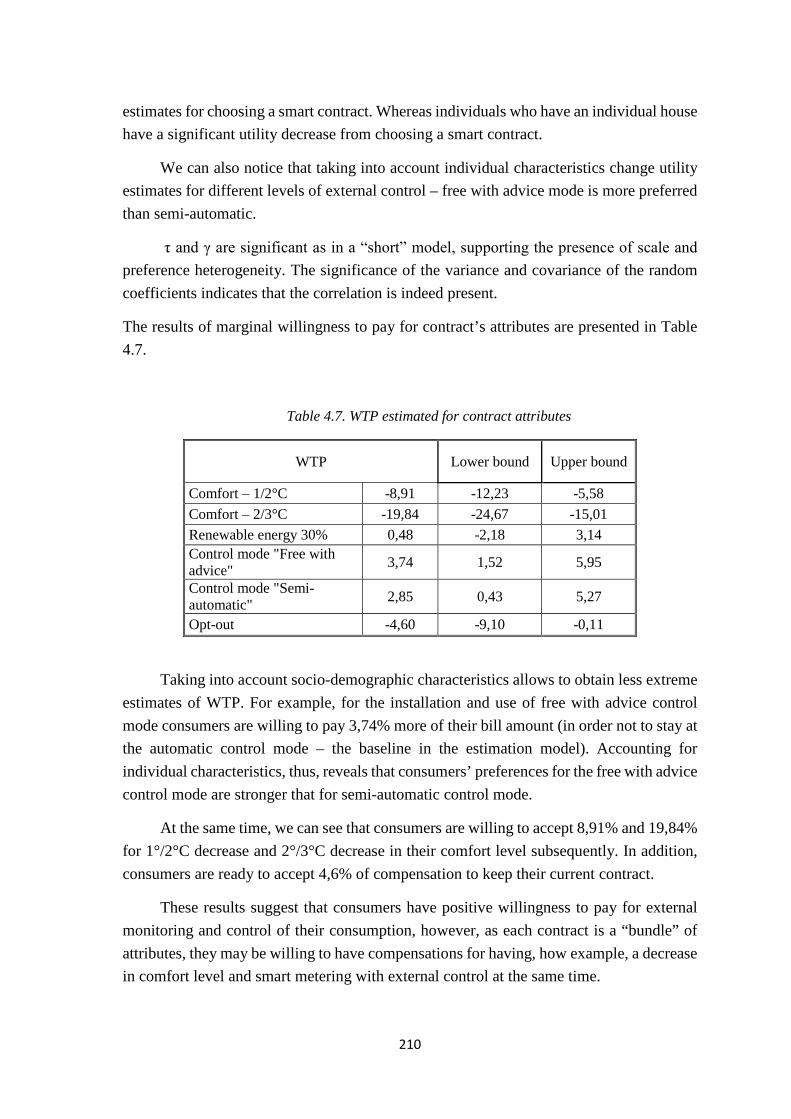
210
estimates for choosing a smart contract. Whereas individuals who have an individual house have a significant utility decrease from choosing a smart contract.
We can also notice that taking into account individual characteristics change utility estimates for different levels of external control – free with advice mode is more preferred than semi-automatic.
τ and γ are significant as in a “short” model, supporting the presence of scale and preference heterogeneity. The significance of the variance and covariance of the random coefficients indicates that the correlation is indeed present.
The results of marginal willingness to pay for contract’s attributes are presented in Table 4.7.
Table 4.7. WTP estimated for contract attributes
WTP Lower bound Upper bound
Comfort – 1/2°C -8,91 -12,23 -5,58 Comfort – 2/3°C -19,84 -24,67 -15,01 Renewable energy 30% 0,48 -2,18 3,14 Control mode "Free with advice" 3,74 1,52 5,95
Control mode "Semi-automatic" 2,85 0,43 5,27
Opt-out -4,60 -9,10 -0,11
Taking into account socio-demographic characteristics allows to obtain less extreme estimates of WTP. For example, for the installation and use of free with advice control mode consumers are willing to pay 3,74% more of their bill amount (in order not to stay at the automatic control mode – the baseline in the estimation model). Accounting for individual characteristics, thus, reveals that consumers’ preferences for the free with advice control mode are stronger that for semi-automatic control mode.
At the same time, we can see that consumers are willing to accept 8,91% and 19,84% for 1°/2°C decrease and 2°/3°C decrease in their comfort level subsequently. In addition, consumers are ready to accept 4,6% of compensation to keep their current contract.
These results suggest that consumers have positive willingness to pay for external monitoring and control of their consumption, however, as each contract is a “bundle” of attributes, they may be willing to have compensations for having, how example, a decrease in comfort level and smart metering with external control at the same time.
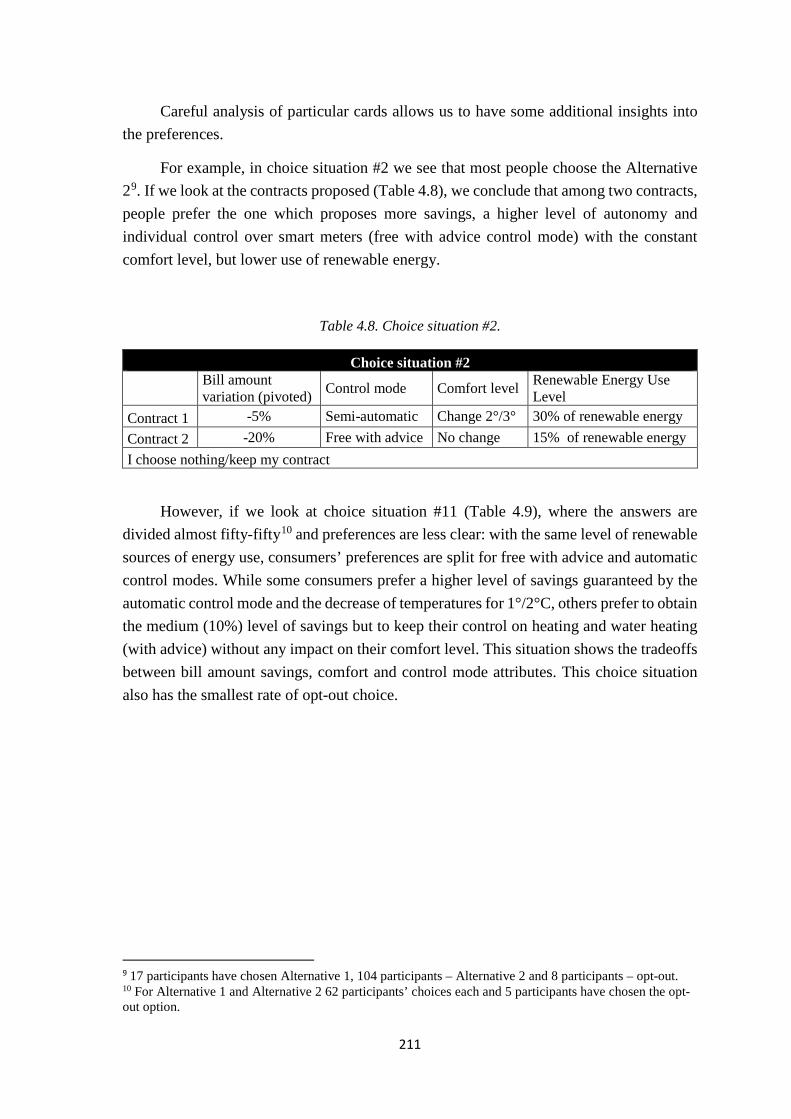
211
Careful analysis of particular cards allows us to have some additional insights into the preferences.
For example, in choice situation #2 we see that most people choose the Alternative 29. If we look at the contracts proposed (Table 4.8), we conclude that among two contracts, people prefer the one which proposes more savings, a higher level of autonomy and individual control over smart meters (free with advice control mode) with the constant comfort level, but lower use of renewable energy.
Table 4.8. Choice situation #2.
Choice situation #2
Bill amount variation (pivoted) Control mode Comfort level Renewable Energy Use
Level Contract 1 -5% Semi-automatic Change 2°/3° 30% of renewable energy Contract 2 -20% Free with advice No change 15% of renewable energy I choose nothing/keep my contract
However, if we look at choice situation #11 (Table 4.9), where the answers are divided almost fifty-fifty10 and preferences are less clear: with the same level of renewable sources of energy use, consumers’ preferences are split for free with advice and automatic control modes. While some consumers prefer a higher level of savings guaranteed by the automatic control mode and the decrease of temperatures for 1°/2°C, others prefer to obtain the medium (10%) level of savings but to keep their control on heating and water heating (with advice) without any impact on their comfort level. This situation shows the tradeoffs between bill amount savings, comfort and control mode attributes. This choice situation also has the smallest rate of opt-out choice.
9 17 participants have chosen Alternative 1, 104 participants – Alternative 2 and 8 participants – opt-out. 10 For Alternative 1 and Alternative 2 62 participants’ choices each and 5 participants have chosen the opt-out option.
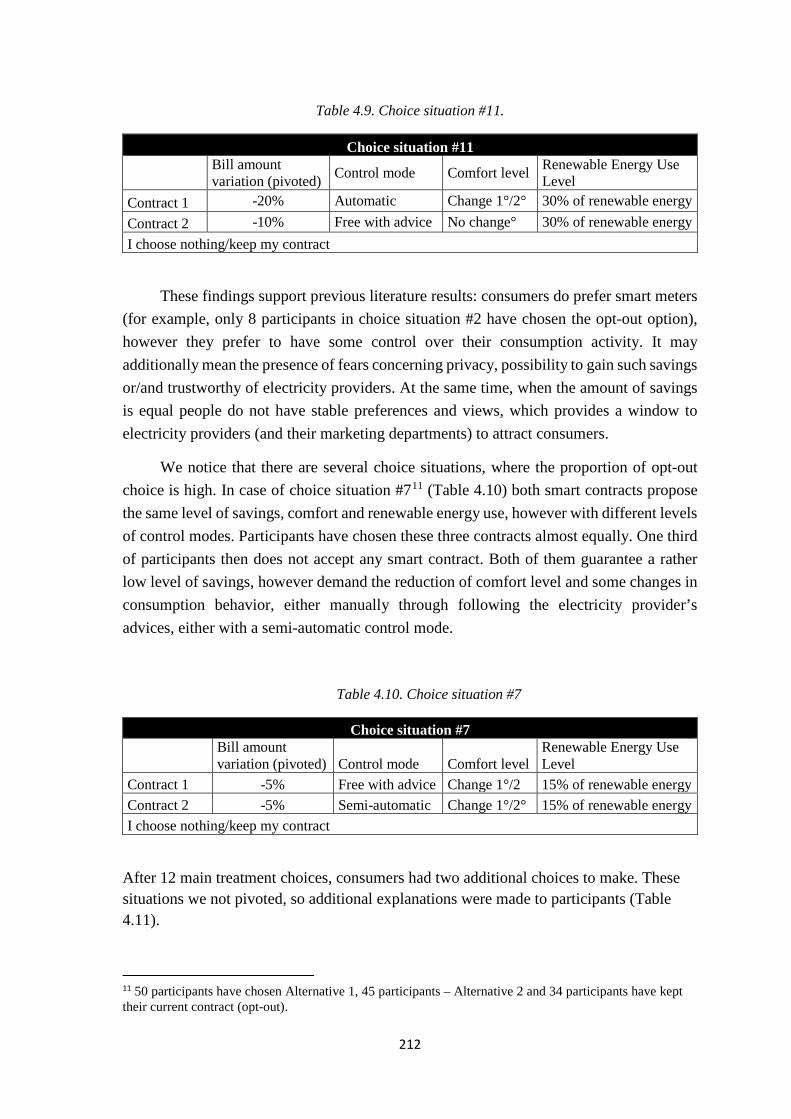
212
Table 4.9. Choice situation #11.
Choice situation #11
Bill amount variation (pivoted) Control mode Comfort level Renewable Energy Use
Level Contract 1 -20% Automatic Change 1°/2° 30% of renewable energy Contract 2 -10% Free with advice No change° 30% of renewable energy I choose nothing/keep my contract
These findings support previous literature results: consumers do prefer smart meters (for example, only 8 participants in choice situation #2 have chosen the opt-out option), however they prefer to have some control over their consumption activity. It may additionally mean the presence of fears concerning privacy, possibility to gain such savings or/and trustworthy of electricity providers. At the same time, when the amount of savings is equal people do not have stable preferences and views, which provides a window to electricity providers (and their marketing departments) to attract consumers.
We notice that there are several choice situations, where the proportion of opt-out choice is high. In case of choice situation #711 (Table 4.10) both smart contracts propose the same level of savings, comfort and renewable energy use, however with different levels of control modes. Participants have chosen these three contracts almost equally. One third of participants then does not accept any smart contract. Both of them guarantee a rather low level of savings, however demand the reduction of comfort level and some changes in consumption behavior, either manually through following the electricity provider’s advices, either with a semi-automatic control mode.
Table 4.10. Choice situation #7
Choice situation #7
Bill amount variation (pivoted) Control mode Comfort level
Renewable Energy Use Level
Contract 1 -5% Free with advice Change 1°/2 15% of renewable energy Contract 2 -5% Semi-automatic Change 1°/2° 15% of renewable energy I choose nothing/keep my contract
After 12 main treatment choices, consumers had two additional choices to make. These situations we not pivoted, so additional explanations were made to participants (Table 4.11).
11 50 participants have chosen Alternative 1, 45 participants – Alternative 2 and 34 participants have kept their current contract (opt-out).
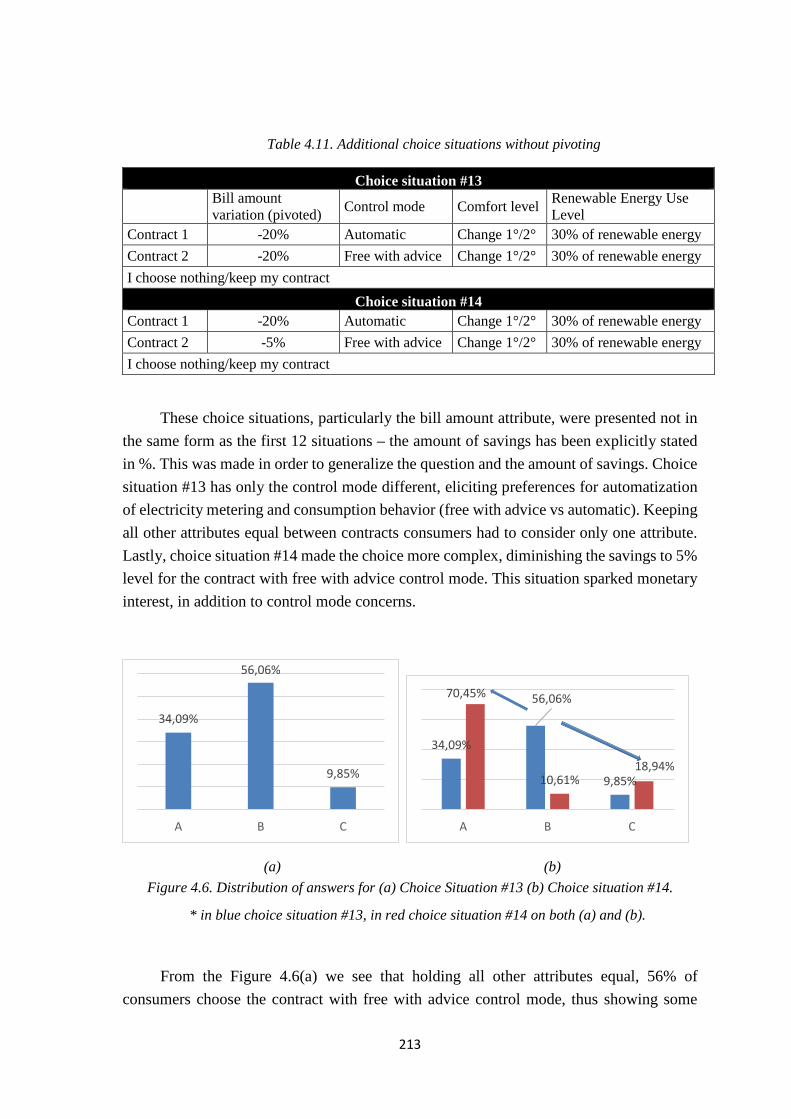
213
Table 4.11. Additional choice situations without pivoting
Choice situation #13
Bill amount variation (pivoted) Control mode Comfort level Renewable Energy Use
Level Contract 1 -20% Automatic Change 1°/2° 30% of renewable energy Contract 2 -20% Free with advice Change 1°/2° 30% of renewable energy I choose nothing/keep my contract
Choice situation #14 Contract 1 -20% Automatic Change 1°/2° 30% of renewable energy Contract 2 -5% Free with advice Change 1°/2° 30% of renewable energy I choose nothing/keep my contract
These choice situations, particularly the bill amount attribute, were presented not in the same form as the first 12 situations – the amount of savings has been explicitly stated in %. This was made in order to generalize the question and the amount of savings. Choice situation #13 has only the control mode different, eliciting preferences for automatization of electricity metering and consumption behavior (free with advice vs automatic). Keeping all other attributes equal between contracts consumers had to consider only one attribute. Lastly, choice situation #14 made the choice more complex, diminishing the savings to 5% level for the contract with free with advice control mode. This situation sparked monetary interest, in addition to control mode concerns.
(a) (b) Figure 4.6. Distribution of answers for (a) Choice Situation #13 (b) Choice situation #14.
* in blue choice situation #13, in red choice situation #14 on both (a) and (b).
From the Figure 4.6(a) we see that holding all other attributes equal, 56% of consumers choose the contract with free with advice control mode, thus showing some
34,09%
56,06%
9,85%
A B C
34,09%
56,06%
9,85%
70,45%
10,61%18,94%
A B C
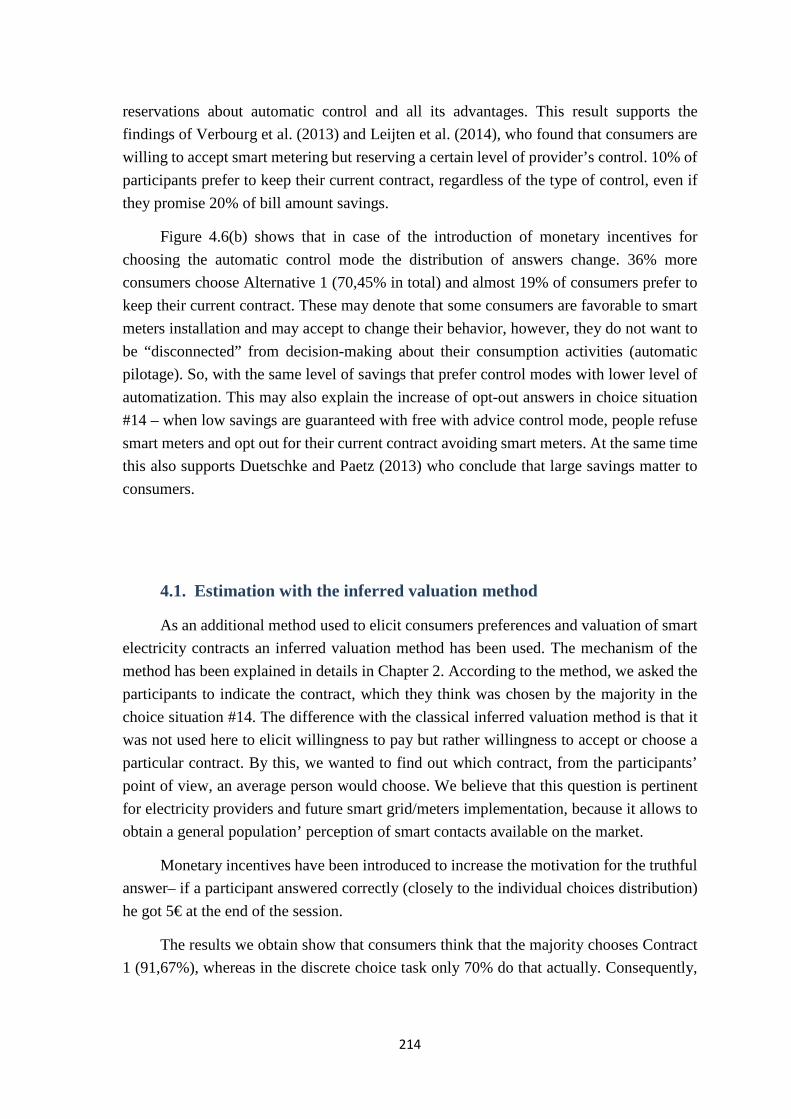
214
reservations about automatic control and all its advantages. This result supports the findings of Verbourg et al. (2013) and Leijten et al. (2014), who found that consumers are willing to accept smart metering but reserving a certain level of provider’s control. 10% of participants prefer to keep their current contract, regardless of the type of control, even if they promise 20% of bill amount savings.
Figure 4.6(b) shows that in case of the introduction of monetary incentives for choosing the automatic control mode the distribution of answers change. 36% more consumers choose Alternative 1 (70,45% in total) and almost 19% of consumers prefer to keep their current contract. These may denote that some consumers are favorable to smart meters installation and may accept to change their behavior, however, they do not want to be “disconnected” from decision-making about their consumption activities (automatic pilotage). So, with the same level of savings that prefer control modes with lower level of automatization. This may also explain the increase of opt-out answers in choice situation #14 – when low savings are guaranteed with free with advice control mode, people refuse smart meters and opt out for their current contract avoiding smart meters. At the same time this also supports Duetschke and Paetz (2013) who conclude that large savings matter to consumers.
4.1. Estimation with the inferred valuation method
As an additional method used to elicit consumers preferences and valuation of smart electricity contracts an inferred valuation method has been used. The mechanism of the method has been explained in details in Chapter 2. According to the method, we asked the participants to indicate the contract, which they think was chosen by the majority in the choice situation #14. The difference with the classical inferred valuation method is that it was not used here to elicit willingness to pay but rather willingness to accept or choose a particular contract. By this, we wanted to find out which contract, from the participants’ point of view, an average person would choose. We believe that this question is pertinent for electricity providers and future smart grid/meters implementation, because it allows to obtain a general population’ perception of smart contacts available on the market.
Monetary incentives have been introduced to increase the motivation for the truthful answer– if a participant answered correctly (closely to the individual choices distribution) he got 5€ at the end of the session.
The results we obtain show that consumers think that the majority chooses Contract 1 (91,67%), whereas in the discrete choice task only 70% do that actually. Consequently,
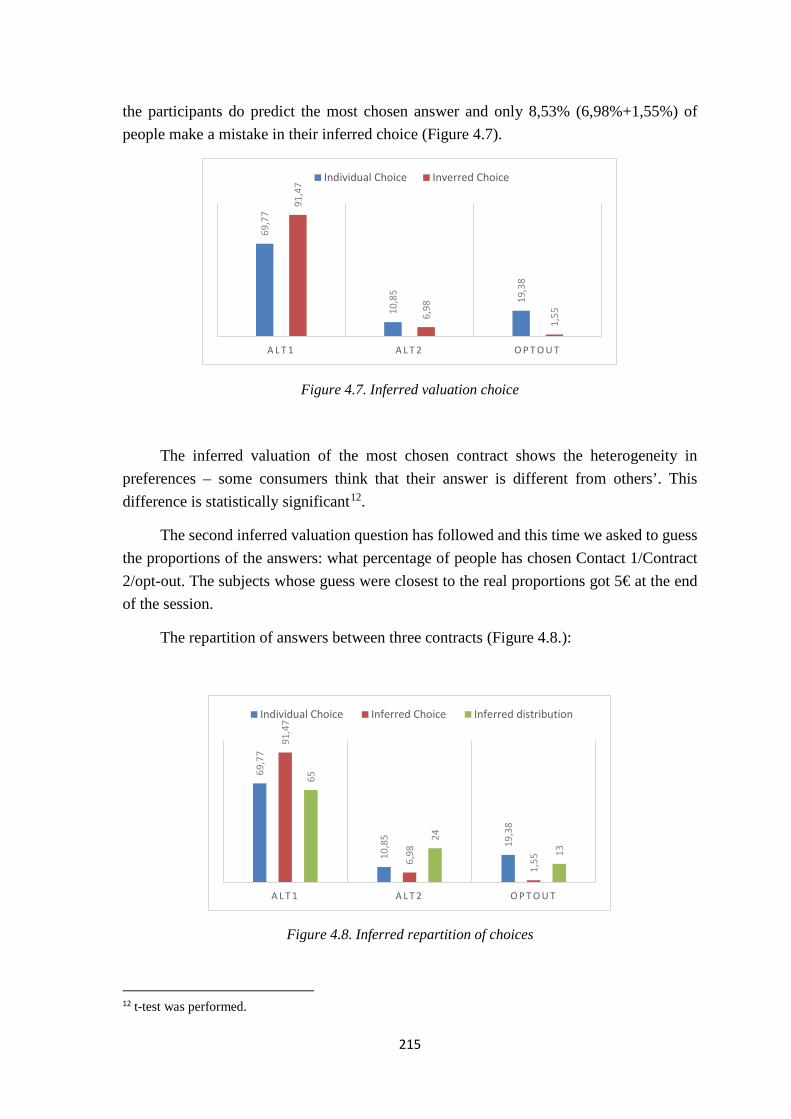
215
the participants do predict the most chosen answer and only 8,53% (6,98%+1,55%) of people make a mistake in their inferred choice (Figure 4.7).
Figure 4.7. Inferred valuation choice
The inferred valuation of the most chosen contract shows the heterogeneity in preferences – some consumers think that their answer is different from others’. This difference is statistically significant12.
The second inferred valuation question has followed and this time we asked to guess the proportions of the answers: what percentage of people has chosen Contact 1/Contract 2/opt-out. The subjects whose guess were closest to the real proportions got 5€ at the end of the session.
The repartition of answers between three contracts (Figure 4.8.):
Figure 4.8. Inferred repartition of choices
12 t-test was performed.
69,7
7
10,8
5
19,3
8
91,4
7
6,98
1,55
A L T 1 A L T 2 O P T O U T
Individual Choice Inverred Choice
69,7
7
10,8
5
19,3
8
91,4
7
6,98
1,55
65
24
13
A L T 1 A L T 2 O P T O U T
Individual Choice Inferred Choice Inferred distribution

216
These results show that individuals are able to predict the outcome for the whole group of participants, because the actual outcome (personal valuations) is rather close to the repartition question, especially for the alternative 1. From the distribution of inferred choices we also see that, even if the percentage for the first alternative is quite close to the individual answers, Alternative 2 and opt-out outcomes are not precise: there is an overestimation for Contract 2 and underestimation for the opt-out option. It means that consumers in their majority think that society has a positive valuation of electricity contracts equipped with smart meters (participants think 89% of choices correspond to smart contracts).
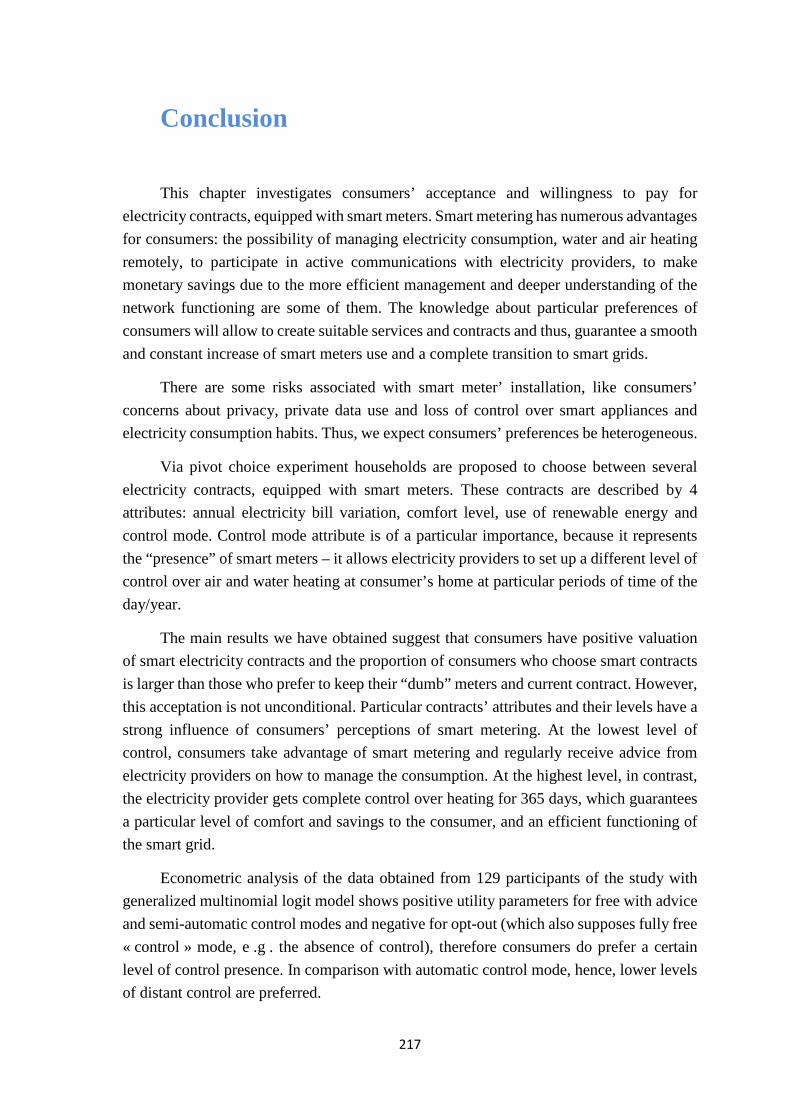
217
Conclusion
This chapter investigates consumers’ acceptance and willingness to pay for electricity contracts, equipped with smart meters. Smart metering has numerous advantages for consumers: the possibility of managing electricity consumption, water and air heating remotely, to participate in active communications with electricity providers, to make monetary savings due to the more efficient management and deeper understanding of the network functioning are some of them. The knowledge about particular preferences of consumers will allow to create suitable services and contracts and thus, guarantee a smooth and constant increase of smart meters use and a complete transition to smart grids.
There are some risks associated with smart meter’ installation, like consumers’ concerns about privacy, private data use and loss of control over smart appliances and electricity consumption habits. Thus, we expect consumers’ preferences be heterogeneous.
Via pivot choice experiment households are proposed to choose between several electricity contracts, equipped with smart meters. These contracts are described by 4 attributes: annual electricity bill variation, comfort level, use of renewable energy and control mode. Control mode attribute is of a particular importance, because it represents the “presence” of smart meters – it allows electricity providers to set up a different level of control over air and water heating at consumer’s home at particular periods of time of the day/year.
The main results we have obtained suggest that consumers have positive valuation of smart electricity contracts and the proportion of consumers who choose smart contracts is larger than those who prefer to keep their “dumb” meters and current contract. However, this acceptation is not unconditional. Particular contracts’ attributes and their levels have a strong influence of consumers’ perceptions of smart metering. At the lowest level of control, consumers take advantage of smart metering and regularly receive advice from electricity providers on how to manage the consumption. At the highest level, in contrast, the electricity provider gets complete control over heating for 365 days, which guarantees a particular level of comfort and savings to the consumer, and an efficient functioning of the smart grid.
Econometric analysis of the data obtained from 129 participants of the study with generalized multinomial logit model shows positive utility parameters for free with advice and semi-automatic control modes and negative for opt-out (which also supposes fully free « control » mode, e .g . the absence of control), therefore consumers do prefer a certain level of control presence. In comparison with automatic control mode, hence, lower levels of distant control are preferred.
218
WTP estimates show that consumers have positive values for external control modes of their electricity consumption. In average, they are willing to pay 3,74% more of their bill amount to be engaged with free with advice control mode and 2,85% more of their electricity bill amount for the semi-automatic control mode. The choice between the current contract and the automatic control mode is made towards the latter (negative WTP estimates for opt-out option), which proves that French consumers are willing to accept Smart Metering. At the same time, comfort level decrease is accepted only with significant compensations. Renewable energy part is not significant in our study. These findings may be used by the authorities and smart electricity providers about the future development of smart contracts with remote control and other attributes, which should be taken into account when designing electricity contracts taking into account consumer heterogeneity.
In addition, individual’s characteristics are found to have an influence on consumers’ acceptance of smart contracts. The probability to choose an electricity contract with external control is smaller for men, for divorced people and for those households who have individual houses. In contrast, individuals with high revenues and high education level are associated with the higher probability to choose electricity contracts equipped with smart meters.
Additional results are obtained on the basis of comparative analysis of particular cards, which focalize on monetary savings and control modes trade-offs.
Firstly, in the presence of significant monetary gains (or savings) consumers are willing to accept distant control mode of their consumption. Negative sign of this attribute show that less there are variation (fewer savings) less the consumers are ready to accept a smart contract.
Secondly, 34% of consumers accept automatic control mode of smart meters, whereas 56% of consumers prefer free control mode with provider’s advices on how to manage smart meters and electricity consumption.
Lastly, about 10% or consumers prefer to keep their current contract even if 20% savings are promised and when the savings are equal to 5% almost 20% prefer their current contract.
Inferred valuation method allows us to obtain consumers’ opinion on which contract is chosen by the majority or an average person. Consumers think that the majority chooses Contract 1 (91,67%), which proposes high level of savings (20%) with the automatic external control mode. In the discrete choice task only 70% do that actually. Thus, the participants are able to predict the most chosen contract and only almost 8% of people make a mistake in their inferred choice.
219
In conclusion, consumers’ preferences are heterogeneous, which is proved by all the stages of this experimental study, but there are nevertheless significant results to claim that French households accept electricity contracts with Smart Meters, which are described by the remoted control by electricity providers at certain period of time.
However, we may also consider that there are some limits to this study. Due to a limited number of participants in the study the question of heterogeneity of preferences may not be representative to the population as a whole. In addition, some questions, which are not discussed in the study (such as numerous questions concerning smart installations, the differences between producers and providers of electricity and therefore the source of control; privacy of personal data issues, etc.) should also be studied.
Further research may also move towards field studies with different levels of incentives for different levels of provider’s control of Smart Meters proposed, leaving the question of dynamic pricing aside for its limited efficiency.
220
General conclusion
Modern state of economy is characterized by an increased level of technological change which leads, from one side, to the increased levels of consumption and products’ proposition, and, from the other side, to the increased environmental impact. Governments are searching to cope with the destructing pace of humanity though the regulation related to societal, environmental, sustainable production and use issues, which forces and encourages the companies to respond with innovative and sustainable offerings.
Economic viability of such products should be measured carefully and the main actor of this measurement process is a consumer. Decisions made by an individual as economic agent are based on his/her needs or wants, beliefs, attributes, preferences and values. “Whenever we choose which car to buy, which job to take, or which bet to play we exhibit preference among alternatives” states Tversky (1969, p. 433). Thus, to understand how and in which way the business should develop, the measurement and the elicitation of preferences should be carefully done, guiding companies through their new product development processes.
The particularity of innovative products is that, depending on the type of the innovation, consumers have little or no knowledge about the product and its’ utility. Therefore, their preferences are either uncertain or inexistent. The measurement of such preferences may be more difficult, providing unstable results and inaccurate willingness to pay estimations. In addition, for a better comprehension of consumers’ preferences for innovative products, we should found appropriate methods or elaborated new methods in order to obtain reliable results and to estimate the viability of the products. Innovative products with sustainable features, called eco-innovations, add one another dimension to consumers’ preferences – environmental concern. Previous literature already proves the influence of environmental concern of individual decision-making, but further analysis of its influence on the perception and preferences for eco-innovative products is needed. The existing research literature analyzes the environmental dimension of products and their
221
tangible characteristics, however, the larger angle of view should be considered. In effect, products are increasingly sold bundled with services, creating so called “Product-Service Systems” (PSS). These PSS are more and more used for the introduction of sustainable features, services or consumption practices, which guarantee good functioning of the product, expand its lifetime and decrease its environmental impact. And there exists very few empirical results for PSS with the environmental dimension. We try to fill in this gap conducting our studies on eco-products (vacuum cleaners) with sustainable upgrade service and on electricity contracts with smart metering – an eco-innovative service, which proposes the efficient management of electricity consumption and, thus, its lower and sustainable production, use and distribution.
We suppose that economic preferences, being concrete decision rules of consumers, which target specific products in specific situations, should be analyzed in their connection to values, which are more stable individual mindsets, guiding individual behavior. Values, discussed in their personal, consumer and product perspective, are found not to act individually but to create individual’s value systems. Whereas values are assumed to be stable, value systems are formed for each product and each choice situation.
This thesis aims to answer the questions about consumption behavior of consumers, the nature of their values and preferences for eco-innovative products, while seeking to define appropriate methods, which enable to obtain a reliable measure of these values and preferences. Chapter 1 presents the main concepts of consumption behavior on the basis of the extend review of the existing literature in economic and marketing studies. The concepts of preferences and values are particularly analyzed. Further, in Chapter 2 we discuss different approaches of experimental economics to empirical elicitation of preferences for innovative products. Chapters 3 and 4 present two original empirical studies on eco-innovative products/services. The conclusion of the main results obtained in these studies is presented below.
Chapter 3 presents an experiment on consumers’ preferences for the upgradeable products. Upgradeable product, which is a new type of innovative products, allows consumers to benefit from the use of latest technological advances through the upgrade of their current product with a new part. Such upgrade allows to ameliorate the product, to increase of its life-span and to reduce the environmental harm through the decrease of raw materials use, of production costs, of waste amount, etc. The results reveal that, first of all, consumers have heterogeneous preferences of such innovative features as upgradeability. Calibrated auction-conjoint method, used in the study, allows to notice that for upgradeable upright and wired vacuum cleaners consumers have high valuations of their principal attributes (like power, autonomy, price, etc.), paying less attention to the possibility to upgrade the product. Nevertheless, consumers are found to be sensible to the presence of
222
upgrade options, stating positive willingness to pay premiums for the vacuum cleaners with upgrades. This supports previous research results. However, these preferences and, hence premiums, depend considerably on the type of the upgrade and the related product configurations (other attributes’ levels). The upgrade attribute receives both positive and negative WTP in different cases. From this we conclude that a producer’s strategy should not be based on high price differentiation of upgradeability, although the presence of an upgrade is viewed positively by consumers.
The main advantage of the calibrated auction-conjoint method relies on the possibility to present and to analyze a large number of product’s attributes that encourages consumers to discover them accurately and to subsequently discover/state their preferences for them and their particular levels. Such preference elicitation aims to approach the rational consumer behavior and mitigate the risks associated with unknown innovative attributes.
Whereas Chapter 3 discovers consumers’ preferences for innovative products, Chapter 4 analyzes them for innovative services or products associated with a significant service part. The product of the empirical study presented in Chapter 4 is an electricity contract, equipped with smart meters. Such contracts propose to manage households’ electricity consumption at distance more or less frequently, which have numerous benefits for both producers and consumers. Previous literature distinguish the main benefits for consumers, which are: the decrease of electricity consumption, hence the savings, more efficient and sustainable consumption, the increased use of renewable energy and an active role in electricity network management. However, there are distinguished some risks, which explain a heterogeneity in consumers’ preferences for “smart” electricity contracts: lack of autonomy, intrusion in privacy, decrease in the comfort level, etc. With the help of pivot choice experiment the obtained results show the presence of positive preferences for such contracts. Particularly, the preferences for the external control performed by electricity providers are heterogeneous: consumers prefer to have a certain level of external management but these preferences weaken with the increase of the external control. This may be explained by the desire to benefit from smart technologies and at the same time the fear of the loss of the control over the consumption practices. These results support the previous literature available on smart metering and its particular adjustments. In addition and surprisingly, the increased level of renewable energy use seems not to affect the choice.
Pivot discrete choice experiment allows us to study preferences for each attribute separately, as well as to estimate marginal willingness to pay. The decreased level of hypothetical bias of stated preference estimates and the increased realism of the study are two particular features of pivot discrete choice experiments. Positive estimates for two different medium levels of external control of smart meters and negative willingness to pay
223
for keeping the current contract give the insights to producers on how the electricity contracts with smart metering should be designed.
In conclusion, our experimental studies show that consumers have heterogeneous preferences for innovative and eco-innovative offerings (products and services). These preferences result in positive willingness to pay in particular situations for the innovations, which have the technological advances guaranteeing a lower environmental impact, and negative willingness to pay for those innovations, which refuse the introduction of such technologies.
Through the preference analysis we proceed to the analysis of the values of consumers. For example, preferences and positive willingness to pay for sustainable characteristics of the products (upgradability and external control of smart meters) represent environmental values, universalism and benevolence personal values, translated in consumption behavior. At the same time, another example of the co-work of different values for the same final goals can be seen through these pro-environmental choices: they explained by the consciousness about health, nature, society (including cultural values’ influence), and relevant personal values.
From the other point of view, high importance given to functional characteristics (i.e. the battery type, power and autonomy for vacuum cleaners) shows the roles of tradition personal values, functional and emotional consumer values.
Generally, strong preferences exhibited by consumers for innovative products reflect the presence of their stimulation personal values, epistemic consumer values, as well as innovative values. Different typology of innovativeness of consumers also explains the heterogeneity of consumers’ acceptance of new technologies, changing their habits.
Changing importance in values and value systems of consumer may give the insights to producers about the characteristics (attributes, services, etc.) of the products, which should be changed and/or ameliorated. For example, lower importance given to tradition value, may signal that brand name, functional parameters or product design should be updated in a more innovative way, and vice versa. Whereas high importance of functional consumer value suggests that consumers appreciate the integration of the latest technological advances.
Thus, marketing and promotional strategies should also reflect personal, consumer and product values in order to attract consumers. Knowing the preferences and values of target market segments producers will be able to pick up a necessary type and format of advertisements that “touch” the important consumers’ values.
224
Additionally, values are based on individual personality and mindset. For example, being open to new knowledge and experience helps self-direction, stimulation and universalism values to be activated, mitigating tradition and power values.
This research thesis proposes the insights into the empirical issues, associated with preference and willingness to pay elicitation for innovative products. Therefore, it can be used as a basis for the further research and in applied marketing research. As stated above, the aim of the marketing research on innovative products is to describe these products in a way that provides understanding of consumers’ preferences for the innovative features. Quantification of those preferences is an additional target of the research. Thus, stated preference methods is a way to explore consumers’ willingness to pay for new and innovative products (not yet produced and launched), as well as to reduce operating and new product development costs. We are aware that the estimates obtained with stated preference methods may differ from the real life data, however, the methods chosen in this thesis, make us claim that we can emphasize the realism of the study, reducing hypothetical biases. Both calibrated auction-conjoint method and pivot discrete choice method allow to provide the light on the way consumers construct and learn their preferences. The calibrated auction-conjoint method permits the participants to discover a large number of attributes, their levels, state the importance of them, making the trade-offs visible. This method provides the information searched for by companies in order to identify important product attributes, and thus, individuals' systems of values, which are in turn integrated into consumer oriented marketing strategies. In addition, such method allows post-estimation preference calibration made by a consumer in case if he/she does not agree with the final estimates. This is assumed to be the key to a rational consumer behavior in stated preference method setting. In pivot discrete choice experiment there are found numerous advantages as well. Stated choice situations yield numerous observations per participant, which may not be made for real choices. Econometric models’ estimates reflecting utility contributions of each attribute and marginal willingness to pay estimates yield precise insights of consumers’ preferences. However, to generalize the possibility of use of these methods for other types of products in different conditions should be tested.
Finally, we can conclude that the experimental methods offer relevant and precise tools of preferences elicitation, allow to quantify them and apply these results for the new product development and further explanation of real choices. As stated in Chapter 2, the combination of stated and revealed preference methods on the same products should be tested, to increase the validity of the results and further application of these methods for innovative products’ analysis.
From theoretical side, innovative products represent a particular case of decision-making with lower level of information available and higher levels of risk and
225
uncertainty. Therefore, consumers’ preferences are formed and should also be elicited in a particular way in order to measure them precisely. Values, describing personal mindset and motivations, are not product- and situation-specific. However, innovative product, being a new alternative in consumer’s choice set, may provoke the re-composition of individual’s value systems. Therefore, particular changes in choice sets (different treatment with varying choice sets and information available to participants) should be tested.
All this knowledge will offer guidelines for how technology and innovations should be designed, implemented and promoted in order to meet consumers’ preferences and values, and thus favor a higher acceptance of innovative and eco-innovative products.
The theoretical and methodological framework proposed in this thesis provide a solid research basis for the analysis of innovative and eco-innovative products and services. The methods applied in chapters 3 and 4 are new to preference elicitation studies on innovative products and product-service systems, and found to be suitable tools for such estimations. Further research may be directed towards testing these methods on other new products with various levels of novelty and from different price segments, which will allow to make conclusions about the generalization of the use of these methods. In addition, further combination of stated and revealed preference methods should be considered. Particularly, both studies (chapter 3 and 4) may be considered application in non-hypothetical settings.
226
References
ADAMOWICS, W., P., BOXALL, M., WILLIAMS and J., LOUVRIERE (1998). “Stated preference approaches for measuring passive use values: choice experiments and contingent valuation”. American Journal of Agricultural Economics, 80(1), 64-75.
ADAMOWICZ, W., J., LOUVIERE, and M., WILLIAMS (1994). “Combining revealed and stated preference methods for valuing environmental amenities”. Journal of environmental economics and management, 26(3), 271-292.
Agence BIO d’après différentes sources européennes « Repères La filière bio en plein développement » (2014). Accessed June 2016. URL : http://www.agencebio.org/sites/default/files/upload/documents/4_Chiffres/BrochureCC/CC2015_FrEurSynthese.pdf
ALBERINI, A., and M., FILIPPINI (2011). “Response of residential electricity demand to price: The effect of measurement error”. Energy Economics, 33, 889–895.
ALLCOTT, H. (2011). “Social norms and energy conservation”. Journal of Public Economics, 95(9), 1082-1095.
ALLEN, M. W., and S. H., NG (1999). "The direct and indirect influences of human values on product ownership." Journal of Economic Psychology 20(1), 5-39.
ALPERT, F. H., and M. A., Kamins (1994). “Pioneer brand advantage and consumer behavior: A conceptual framework and propositional inventory”. Journal of the Academy of Marketing Science, 22(3), 244-253.
227
ALPTEKINOGLU, A. and K., RAMACHANDRAN (2015). “Flexible products for dynamic preferences.” Georgia Tech Scheller College of Business Research Paper No. 2015-10. Available at: http://ssrn.com/abstract=2037631 or http://dx.doi.org/10.2139/ssrn.2037631
ANDERSON, J. C., D., JAIN, and P. K. CHINTAGUNTA (1993). “Understanding customer value in business markets: methods of customer value assessment”. Journal of Business-to-Business Marketing, 1(1), 3-30.
AVITIA, J., M., COSTA-FONT, J. M., GIL, and J. L., LUSK (2011). “A calibrate auction-conjoint experiment to elicit consumer valuation of sustainable farming: is agro-systems preservation relevant?” Paper presented at the EAAE 2011 Congress Change and Uncertainty, ETH Zurich, Zurich, Switzerland, August 30 - September 2.
BATSELL, R. R., and J. J., LOUVIERE (1991). “Experimental analysis of choice”. Marketing letters, 2(3), 199-214.
BERKHOUT, G., D., HARTMANN, and P. TROTT. (2010). "Connecting technological capabilities with market needs using a cyclic innovation model." R&d Management 40(5), 474-490.
BERTOLDO R., M., POUMADERE, and L. C. JR., RODRIGUES (2015). “When meters start to talk: the public’s encounter with smart meters in France”. Energy Research & Social Science, 9, 146-156.
BIGERNA, S., C. A., BOLLINO, and S., MICHELI (2016). “Socio-economic acceptability for smart grid development–a comprehensive review”. Journal of Cleaner Production, 131, 399–409.
BISIN, A., and T., VERDIER (2001). "The economics of cultural transmission and the dynamics of preferences." Journal of Economic theory 97(2), 298-319.
BLIEMER, M. C., J.M., ROSE, and D.A., HENSHER (2009). “Efficient stated choice experiments for estimating nested logit models”. Transportation Research Part B: Methodological, 43(1), 19-35.
228
BREIDERT, C., M., HAHSLER, and T., REUTTERER (2006). “A review of methods for measuring willingness-to-pay”. Innovative Marketing, 2(4), 8-32.
BROSCH, T., and D. SANDER (2015). Handbook of value: perspectives from economics, neuroscience, philosophy, psychology and sociology. Oxford University Press.
BROWN, S.L., and K.M., EISENHARDT (1995). “Product development: past research, present findings, and future directions”. Academy of Management Review, 20(2), 343-378.
CAELEN, J. (2013). Le consommateur au cœur de l’innovation. CNRS.
CAMPBELL, D. (2008). “Identification and analysis of discontinuous preferences in discrete choice experiments”. In European Association of Environmental and Resource Economists Annual Conference Gothenburg, Sweden, 25-28.
CARPENTER, G. S., and K., NAKAMOTO (1989). “Consumer preference formation and pioneering advantage”. Journal of Marketing research, 285-298.
CARSON, R. T., LOUVIERE, J. J., ANDERSON, D. A., ARABIE, P., BUNCH, D. S., HENSHER, D. A., and H., TIMMERMANS (1994). “Experimental analysis of choice”. Marketing letters, 5(4), 351-367.
CENTRE FOR INTERNATIONAL ECONOMICS CANBERRA AND SYDNEY (2001). "Review of WTP methodologies".
CHANG, J. B., J. L., LUSK, and F. B., NORWOOD (2009). “How closely do hypothetical surveys and laboratory experiments predict field behavior?”. American Journal of Agricultural Economics, 91(2), 518-534.
CHARNESS, G., U., GNEEZY, and M.A., KUHN (2012). “Experimental methods: Between-subject and within-subject design”. Journal of Economic Behavior & Organization, 81(1), 1-8.
CHOI, A. S., and K. S., FIELDING. (2013). "Environmental attitudes as WTP predictors: A case study involving endangered species." Ecological Economics 89, 24-32.
229
CHRISTENSEN, C. M. (2011). The innovator’s dilemma: revolutionary national bestseller that changed the way we do business. / Clayton M. Christensen. 1st HarperBusiness ed. New York / HarperBusiness, c.2000.
CLARK, C. F., M. J., KOTCHEN, and M. R., MOORE. (2003). “Internal and external influences on pro-environmental behavior: Participation in a green electricity program”. Journal of environmental psychology, 23(3), 237-246.
CLASTRES, C. (2011). “Smart grids: Another step towards competition, energy security and climate change objectives”. Energy Policy, 39(9), 5399-5408.
CODE DE L’ÉNERGIE (2015). Article L337-3-1. Accessed August 2016. URL: https://www.legifrance.gouv.fr/affichCodeArticle.do?cidTexte=LEGITEXT000023983208&idArticle=LEGIARTI000031050629&dateTexte=&categorieLien=cid
COMPETITION COMMISSION (2010). “Review of stated preference and willingness to pay methods”.
COOPER, R.G., and E. J., KLEINSCHMIDT (1987). “Success factors of product innovation”. Industrial Marketing Management, 16, 215-223.
CRAWFORD C. M. (1994). New Products Management, 4th Edition. Boston/ Richard D. Irwin, Inc.
DARBY, S. (2006). “The effectiveness of feedback on energy consumption”. A Review for DEFRA of the Literature on Metering, Billing and direct Displays, 486, 2006.
DARBY, S. (2010). “Smart metering: what potential for householder engagement?” Building Research & Information, 38(5), 442-457.
DAVE S., M., SOORIYABANDARA, and M., YEARWORTH (2013). “System behavior modeling for demand response provision in a Smart Grid”. Energy Policy, 61, 172-181.
230
DAWAR, N., and P., PARKER. (1994). "Marketing universals: Consumers' use of brand name, price, physical appearance, and retailer reputation as signals of product quality." The Journal of Marketing. 81-95.
DAY, G. S. (1990). Market Driven Strategy, New York, NY: Free Press.
DENG, Z., Y., LU, K. K., WEI, and J., ZHANG (2010). “Understanding customer satisfaction and loyalty: An empirical study of mobile instant messages in China”. International journal of information management, 30(4), 289-300.
DEWAR, R. D., and J. E., DUTTON. (1986). “The adoption of radical and incremental innovations: An empirical analysis”. Management science, 32(11), 1422-1433.
DIRECTION GENERALE DE LA COMPETITIVITE, DE L'INDUSTRIE ET DES SERVICES (DGCIS). (2011). « L’innovation dans les entreprises : moteurs, moyens et enjeux ». Ministère de l’Economie, des Finances et de l’Industrie : Paris.
DODDS, W. B., and K. B., MONROE (1985). “The effect of brand and price information on subjective product evaluations”. NA-Advances in Consumer Research, Volume 12.
DRICHOUTIS, A. C., R. M., NAYGA, and P., LAZARIDIS (2011). “The role of training in experimental auctions”. American Journal of Agricultural Economics, 1-14.
DUFFY, J., and R. NAGEL (1997). “On the robustness of behaviour in experimental ‘beauty contest’ games”. The Economic Journal, 107(445), 1684-1700.
DUNLAP, R. E., K. D., Van LIERE, A. G., MERTIG, and R. E., JONES. (2000). “New trends in measuring environmental attitudes: measuring endorsement of the new ecological paradigm: a revised NEP scale." Journal of social issues 56(3), 425-442.
DÜTSCHKE, E., and A. G., PAETZ (2013). “Dynamic electricity pricing—Which programs do consumers prefer?” Energy Policy, 59, 226-234.
231
EGGERT, A., and W., ULAGA (2002). "Customer perceived value: a substitute for satisfaction in business markets?" Journal of Business & Industrial Marketing, 17(2/3), 107 – 118.
ELIASHBERG, J., G.L., LILIEN, and V.R., RAO (1995). “Minimizing technological oversights: a marketing research perspective”. ISBM Report 9-1995, Institute for the Study of Business Markets, The Pennsylvania State University.
ELLABBAN, O., and H., ABU-RUB (2016). “Smart grid customers' acceptance and engagement: An overview”. Renewable and Sustainable Energy Reviews, 65, 1285-1298.
ENEDIS (2016) « Linky, le compteur communicant d’Enedis » Site official de ENEDIS. Accessed September 2016. URL : http://www.enedis.fr/linky-le-compteur-communicant-derdf
EUROPEAN COMMISSION (2011a). “Smart Grid Mandate Standardization Mandate to European Standardisation Organisations (ESOs) to support European Smart Grid deployment” Directorate-General For Energy. Brussels 1st March 2011 https://ec.europa.eu/energy/sites/ener/files/documents/2011_03_01_mandate_m490_en.pdf
EUROPEAN COMMISSION (2011b). “Communication From The Commission To The European Parliament, The Council, The European Economic And Social Committee And The Committee Of The Regions. Smart Grids: from innovation to deployment”. Brussels, 12.4.2011. URL : http://eur-lex.europa.eu/legal-content/EN/TXT/PDF/?uri=CELEX:52011DC0202&from=EN
EUROPEAN COMMISSION (2011c). “Definition, Expected Services, Functionalities And Benefits Of Smart Grids. Accompanying Documents To Communication From The Commission To The European Parliament, The Council, The European Economic And Social Committee And The Committee Of The Regions Smart Grids: from innovation to deployment. Brussels, 12.4.2011.URL : http://eur-lex.europa.eu/legal-content/EN/TXT/PDF/?uri=CELEX:52011SC0463&from=EN
EUROPEAN COMMISSION (2011d). “A joint contribution of DG ENER and DG INFSO towards the Digital Agenda, Action 73: Set of common functional requirements of the SMART METER” URL: https://ec.europa.eu/energy/sites/ener/files/documents/2011_10_smart_meter_funtionalities_report.pdf
232
EUROPEAN COMMISSION (2014). “2014 Annual Report on the European Union’s development and external assistance policies and their implementation in 2013”.
FIEBIG, D. G., M. P., KEANE, J. J., LOUVIERE, and N., WASI (2010). “The generalized multinomial logit model: Accounting for scale and coefficient heterogeneity”. Marketing Science, 29(3), 393-421.
FLINT, D. J., C. P., BLOCKER, and P. J., BOUTIN (2011). “Customer value anticipation, customer satisfaction and loyalty: An empirical examination”. Industrial Marketing Management, 40(2), 219-230.
FOLLOWS, S. B., and D., JOBBER. (2000). “Environmentally responsible purchase behaviour: a test of a consumer model”. European journal of Marketing, 34(5/6), 723-746.
FOX, J. A., J. F., SHOGREN, D. J., HAYES, and J. B., KLIEBENSTEIN (1998). “CVM-X: calibrating contingent values with experimental auction markets”. American Journal of Agricultural Economics, 80(3), 455-465.
FREDERIKS, E. R., K., STENNER, and E. V., HOBMAN (2015). “The socio-demographic and psychological predictors of residential energy consumption: A comprehensive review”. Energies, 8(1), 573-609.
GALLARZA, M. G., and I. G., SAURA. (2006). "Value dimensions, perceived value, satisfaction and loyalty: an investigation of university students’ travel behaviour." Tourism management 27(3), 437-452.
GANS, W., A., ALBERINI, and A., LONGO (2013). “Smart meter devices and the effect of feedback on residential electricity consumption: Evidence from a natural experiment in Northern Ireland”. Energy Economics, 36, 729-743.
GARCIA-TORRES, A. (2009). “Consumer behavior: evolution of preferences and the search for novelty”. Cornell family papers ONU-MERIT Working papers, 1-36.
233
GREENE, W. H., and D. A., HENSHER (2010). “Does scale heterogeneity across individuals matter? An empirical assessment of alternative logit models”. Transportation, 37(3), 413-428.
GREENE, W. H., and D. A., HENSHER (2013). “Revealing additional dimensions of preference heterogeneity in a latent class mixed multinomial logit model”. Applied Economics, 45(14), 1897-1902.
GREEN, P. E. and V. R., RAO (1971). “Conjoint measurement for quantifying judgmental data,” Journal of Marketing Research, 8, 355-363.
GRETHER, D. M., and C. R., PLOTT (1979). “Economic theory of choice and the preference reversal phenomenon”. The American Economic Review, 69(4), 623-638.
GU, Y., A. R., HOLE, and S., KNOX (2013). “Fitting the generalized multinomial logit model in Stata”. Stata J, 13(2), 382-397.
HANSLA, A., A., GAMBLA, A., JULIUSSON, and T., GARLING. (2008). “Psychological determinants of attitude towards and willingness to pay for green electricity”. Energy policy, 36(2), 768-774.
HARRISON, G. W., R. M., HARSTAD, and E. E., RUTSTRÖM (2004). “Experimental methods and elicitation of values”. Experimental economics, 7(2), 123-140.
HARRISON, M., J., CUPMAN, O., TRUMAN, and P.N., HAGUE (2016). Market Research in Practice: An Introduction to Gaining Greater Market Insight. Kogan Page Publishers.
HART, S. L. (1997). “Beyond greening”. Harvard Business Review. January-February, 66-76.
HAUSER, J. R., S., DONG, and M., DING (2014). “Self-reflection and articulated consumer preferences”. Journal of Product Innovation Management, 31(1), 17-32.
HAUSMAN, D. M. (2011). Preference, value, choice, and welfare. Cambridge University Press.
234
HEISKANEN, E., and K., MATSCHOSS (2016). “Consumers as innovators in the electricity sector? Consumer perceptions on smart grid services”. International Journal of Consumer Studies, 1-10.
HELM, R., C., BUEHREN, and R., PABST (2011). “Warm-ups before preference measurement”. University of Regensburg Working Papers in Business, Economics and Management Information Systems.
HENSHER, D. A. (2006). “How do respondents process stated choice experiments? Attribute consideration under varying information load.” Journal of Applied Econometrics, 21, 861-878.
HENSHER, D. A. (2010). “Hypothetical bias, choice experiments and willingness to pay”. Transportation Research Part B: Methodological, 44(6), 735-752.
HENSHER, D. A., J. M., ROSE, and W. H., GREENE (2007). Applied choice analysis: a primer. Cambridge University Press. First published 2005.
HESS, S., J.M., ROSE, and D. A., HENSHER (2008). “Asymmetric preference formation in willingness to pay estimates in discrete choice models”. Transportation Research Part E: Logistics and Transportation Review, 44 (5), 847-863.
HESS, S., and J. M., ROSE (2009). “Should reference alternatives in pivot design SC surveys be treated differently?” Environmental and Resource Economics, 42(3), 297-317.
HIPPEL, E. (2001). "User toolkits for innovation." Journal of product innovation management 18(4), 247-257.
HOEFFLER, S. (2003). "Measuring preferences for really new products." Journal of Marketing Research 40(4), 406-420.
HOEFFLER, S., and D., ARIELY. (1999). "Constructing stable preferences: A look into dimens0069ons of experience and their impact on preference stability." Journal of Consumer Psychology 8(2), 113-139.
235
HOEFFLER, S., D., ARIELY, P., WEST, and R., DUCLOS (2013). Preference exploration and learning: the role of intensiveness and extensiveness of experience.Journal of Consumer Psychology, 23(3), 330-340.
HOLBROOK, M. B. (1999). Consumer value: a framework for analysis and research. Psychology Press.
HOLBROOK, M. B., and K. P., CORFMAN. (1985). “Quality and value in the consumption experience: Phaedrus rides again”. Perceived quality, 31(2), 31-57.
HOLE, A. R., and J. R., KOLSTAD (2012). “Mixed logit estimation of willingness to pay distributions: a comparison of models in preference and WTP space using data from a health-related choice experiment”. Empirical Economics, 42(2), 445-469.
HOLT, D. B. (1995). "How consumers consume: A typology of consumption practices." Journal of consumer research, 1-16.
HOPWOOD, B., M., MELLOR and G., O'BRIEN (2005). “Sustainable development: mapping different approaches”. Sustainable Development, 13, 38-52.
HOYOS, D. (2010). “The state of the art of environmental valuation with discrete choice experiments”. Ecological economics, 69(8), 1595-1603.
IDA, T. (2009). Broadband economics: lessons from Japan (Vol. 43). Taylor & Francis.
IDCYCLUM (2011). “Méthodologie de conception et d’intégration d’Innovations Durables à CYCLes d’Upgrade Multiples“. Programme ECOTECH.ANR-GUI-AAP-04 – Doc Scientifique 2011 - IDCyclUM – VF – mars11
INOUE, M., S., YAMADA, T., YAMADA, and S., BRACKE (2014). “An upgradable product design method for improving performance, co2 savings, and production cost reduction: vacuum cleaner case study”. International Journal of Supply Chain Management, 3(4), 100-106.
236
JANSSON, J., A., MARELL, and A., NORDLUND. (2010). "Green consumer behavior: determinants of curtailment and eco-innovation adoption." Journal of consumer marketing, 27(4), 358-370.
KAAS, K., and H., RUPRECHT (2006). “Are the Vickrey auction and the BDM-mechanism really incentive compatible? Empirical results and optimal bidding strategies in the case of uncertain willingness-to-pay”. Schmalenbach Business Review, 58, 37-55.
KAENZIG, J., and R., WÜSTENHAGEN (2010). “The effect of life cycle cost information on consumer investment decisions regarding eco‐innovation”. Journal of Industrial Ecology, 14(1), 121-136.
KAHLE, L. R. (1977). "Social values in the eighties: a special issue," Psychology and Marketing, 2, 231-238.
KAHLE, L. R., S. E., BEATTY, and P. HOMER. (1986). "Alternative measurement approaches to consumer values: the list of values (LOV) and values and life style (VALS)." Journal of consumer research, 405-409.
KAHN B., P. FADER, and D., BELL. “Introduction to marketing” on-line lectures University of Pennsylvania. Accessed in 2016. Available at: coursera.org.
KAHNEMAN D., and A., TVERSKY (1979). “Prospect Theory: An analysis of decision under risk” Econometrica 47(2), 263-292.
KAHNEMAN, D., I., RITOV, D., SCHKADE, S. J., SHERMAN, and H. R., VARIAN (1999). “Economic preferences or attitude expressions?: An analysis of dollar responses to public issues”. In Elicitation of Preferences. Springer Netherlands, 203-242.
KHAZANCHI, S., M. W., LEWIS, and K. K., BOYER. (2007). "Innovation-supportive culture: The impact of organizational values on process innovation." Journal of Operations Management 25(4), 871-884.
KIRKHAM, H., and C., MARINOVICI (2013).”Technology readiness and the smart grid”. Innovative Smart Grid Technologies (ISGT). IEEE PES, 1-6.
237
KJAER, T. (2005). A review of the discrete choice experiment-with emphasis on its application in health care. Odense, Denmark: Syddansk Universitet.
KLEIN, K. J., and J. S., SORRA. (1996). "The challenge of innovation implementation." Academy of management review 21(4), 1055-1080.
KLØJGAARD, M. E., M., BECH, and R., SØGAARD (2012). “Designing a stated choice experiment: the value of a qualitative process”. Journal of Choice Modelling, 5(2), 1-18.
KNAFO, A., S., ROCCAS, and L., SAGIV (2011). “The value of values in cross-cultural research: A special issue in honor of Shalom Schwartz”. Journal of cross-cultural psychology, 42(2), 178-185.
KONTOLEON, A., and M., YABE (2003). “Assessing the impacts of alternative ‘opt-out’ formats in choice experiment studies: consumer preferences for genetically modified content and production information in food”. Journal of Agricultural policy and Resources, 5(1), 1-43.
KOSENIUS, A. K. (2013). “Preference discontinuity in choice experiment: Determinants and implications”. The Journal of Socio-Economics, 45, 138-145.
KOVALSKY, K. L., and J. L., LUSK (2013). “Do consumers really know how much they are willing to pay?” The Journal of Consumers Affairs, 47(1), 98-127.
KRISHNAMURTI, T., D., SCHWARTZ, A., DAVIS, B., FISCHOFF, W., BRUINE DE BRUIN, L., LAVE, and J., WANG (2012). “Preparing for smart grid technologies: A behavioral decision research approach to understanding consumer expectations about smart meters”. Energy Policy, 790-797.
KRISHNAN, V., and K., RAMACHANDRAN (2011). “Integrated product architecture and pricing for managing sequential innovation”. Management Science, 57(11), 2040-2053.
238
LAI A. W. (1995). "Consumer values, product benefits and customer value: a Consumption behavior approach", in NA - Advances in Consumer Research Volume 22, eds. Frank R. Kardes and Mita Sujan, Provo, UT : Association for Consumer Research, 381-388.
MINISTÈRE DE L'ENVIRONNEMENT, DE L'ÉNERGIE ET DE LA MER(2016). « La limitation de la température de chauffage ». 19 mai 2010 (mis à jour le 15 janvier 2016) Le site officiel de Ministère de l'Environnement, de l'Energie et de la Mer. Accessed October 2016. URL : http://www.developpement-durable.gouv.fr/La-limitation-de-la-temperature-de.html
LANCASTER, K. J. (1966). “A new approach to consumer theory”. The journal of political economy, 132-157.
LEIJTEN, F., J., BOLDERDIJK, K., KEIZER, M., GORSIRA, E., VAN DER WERFF, and L., STEG (2014). “Factors that influence consumers' acceptance of future energy systems: the effects of adjustment type, production level, and price”. Energy Efficiency, 973-985.
LI, H. (2016). « Consumer behavior, social influence, and smart grid implementation”. Thesis work. Institut für Sozialwissenschaften der Universität Stuttgart? URL: http://elib.uni-stuttgart.de/bitstream/11682/8833/1/dissertation_Huijie%20Li2016.pdf
Van LIERE, K. D., and R. E., DUNLAP. (1980). “The social bases of environmental concern: a review of hypotheses, explanations and empirical evidence”. The Public Opinion Quarterly, 44(2), 181–197. Available at: http://www.jstor.org/stable/2748427
LINDGREEN, A., and F., WYNSTRA. (2005). "Value in business markets: What do we know? Where are we going?." Industrial Marketing Management, 34(7), 732-748.
LIST, J. A., and C. A., GALLET (2001). “What experimental protocol influence disparities between actual and hypothetical stated values?”. Environmental and Resource Economics, 20(3), 241-254.
LOOMIS, J. B. (2014). “Strategies for overcoming hypothetical bias in stated preference surveys”. Journal of Agricultural and Resource Economics, 39(1), 34-46.
239
LOUVIERE, J.J., T.N., FLYNN, and R. T., CARSON (2010). “Discrete choice experiments are not conjoint Analysis”. Journal of Choice Modelling, 3(3), 57-72.
LUCAS, B.A., and O. C., FERRELL. (2000). “The effect of market orientation on product innovation”. Journal of the Academy of Marketing Science, 28(2), 239-247.
LUSK, J. L., T., FELDKAMP, and T. C., SCHROEDER (2004). “Experimental auction procedure: impact on valuation of quality differentiated goods”. American Journal of Agricultural Economics, 86(2), 389-405.
LUSK, J. L., and F. B., NORWOOD (2009). “An inferred valuation method”. Land Economics, 85(3), 500-514.
LUSK, J. L., and J. F., SHOGREN (2007). Experimental auctions: Methods and applications in economic and marketing research. Cambridge University Press.
LUSK, J., and J. F., SHOGREN (2011). The Oxford handbook of the economics of food consumption and policy. Oxford University Press.
LUTZ, R. (1986). “Quality is as quality does: An attitudinal perspective on consumer quality judgments”. In Presentation to the Marketing Science Institute Trustees’ Meeting, Cambridge, MA.
MANSKI, C. F., and D., MCFADDEN (1981). Structural analysis of discrete data with econometric applications ( 202-4). Cambridge, MA: Mit Press.
MARSCHAK, J. (1960). "Binary-choice constraints and random utility indicators", in Arrow, K. J., Karlin, S.; Suppes, P. Mathematical models in the social sciences, 1959: Proceedings of the first Stanford symposium, Stanford mathematical studies in the social sciences, IV, Stanford, California: Stanford University Press, 312–329.
MARSHALL, A. (1980). Principles of economics: An introductory volume, MacMillan, London.
MCFADDEN, D. L. (1984). “Econometric analysis of qualitative response models”. Handbook of econometrics, 2, 1395-1457.
240
MCFADDEN, D. (2001). “Economic choices”. The American Economic Review, 91(3), 351-378.
MCFADDEN, D., and K., TRAIN (2000). “Mixed MNL models for discrete response”. Journal of applied Econometrics, 15(5), 447-470.
MCFADDEN, D., W. B., TYE, and K., TRAIN (1977). An application of diagnostic tests for the independence from irrelevant alternatives property of the multinomial logit model. Institute of Transportation Studies, University of California.
METRICS, C. (2012). Ngene 1.1. 1 User Manual & Reference Guide. Sydney, Australia: ChoiceMetrics.
MICK, D. G. and S., FOURNIER. (1998). "Paradoxes of technology: Consumer cognizance, emotions, and coping strategies." Journal of Consumer research, 25(2), 123-143.
MIDGLEY, D. F. (1977). Innovation and new product marketing. Croom Helm.
MICHAUD, C., I., JOLY, D., LLERENA, and V., LOBASENKO. “Consumers’ preferences for eco-innovative products: elicitation of willingness to pay for upgradeable products.” forthcoming.
MONROE, K. B. (1990). Pricing-making profitable decisions, McGraw Hill. New York.
MOORS, E. H., and R., DONDERS. (2009). “Understanding consumer needs and preferences in new product development: the case of functional food innovations”. Innovation Studies Utrecht (ISU) Available at: http://www.geo.uu.nl/isu/pdf/isu0903.pdf
MOSTERT, P. G. (2002). “Buying behaviour of South African internet users” (Doctoral dissertation). University of Pretoria
MUNDA, G. (1997). "Environmental economics, ecological economics, and the concept of sustainable development." Environmental values, 6(2), 213-233.
241
NATIONAL OCEANIC AND ATMOSPHERIC ADMINISTRATION. (1993). "Report of the NOAA Panel on Contingent Valuation." Fed. Reg. 58, 4601-14.
NETZER, O., and V., SRINIVASAN (2011). “Adaptive self-explication of multi-attribute preferences”. Journal of Marketing Research, 48(1), 140-156.
NIDUMOLU, R., C. K., PRAHALAD, and M. R., RANGASWAMI (2009). “Why sustainability is now the key driver of innovation.” Harvard Business Review, September Issue URL: https://hbr.org/2009/09/why-sustainability-is-now-the-key-driver-of-innovation
NORDLUND, A. M., and J., GARVILL. (2002). "Value structures behind proenvironmental behavior." Environment and Behavior, 34(6), 740-756.
NORDLUND, A. M., and J., GARVILL. (2003). "Effects of values, problem awareness, and personal norm on willingness to reduce personal car use." Journal of environmental psychology, 23(4), 339-347.
NORGAARD, R.B. (1994). Development Betrayed. London: Routledge.
NORWOOD, F. B., and J. L., LUSK (2011). “A calibrated auction-conjoint valuation method: valuing pork and eggs produced under differing animal welfare conditions”. Journal of Environmental Economics and Management, 62, 80-94.
NOUSSAIR, C., S., ROBIN, and B., RUFFIEUX (2004). "Revealing consumers’ willingness-to-pay: A comparison of the BDM mechanism and the Vickrey auction”. Journal of Economic Psychology, 25, 725–741.
ORGANISATION FOR ECONOMIC CO-OPERATION AND DEVELOPMENT OECD (2001). Environmental Goods and Services: The Benefits of Further Global Trade Liberalisation, OECD, Paris.
ORGANISATION FOR ECONOMIC CO-OPERATION AND DEVELOPMENT OECD (2007). Final report MEI project about measuring eco-innovation, OECD, Paris.
242
ORGANISATION FOR ECONOMIC CO-OPERATION AND DEVELOPMENT OECD (2008). Promoting Sustainable Consumption: Good Practices In OECD Countries – OECD.
ORME, B. (2010) Getting Started with Conjoint Analysis: Strategies for Product Design and Pricing Research. Second Edition, Madison, Wis.: Research Publishers LLC, 57-66.
OVERBY, J. W., R. B., WOODRUFF, and S. F. GARDIAL (2005). "The influence of culture upon consumers’ desired value perceptions: A research agenda." Marketing Theory, 5(2), 139-163.
PARASURAMAN, A., and D., GREWAL (2000). "Serving customers and consumers effectively in the twenty-first century: A conceptual framework and overview." Journal of the Academy of Marketing Science, 28(1), 9-16.
PAYNE, J. W., J. R., BETTMAN, and E. J. JOHNSON (1993). The adaptive decision maker. Cambridge University Press.
PAYNE, A., and S., HOLT. (1999). "A review of the ‘value’ literature and implications for relationship marketing." Australasian Marketing Journal (AMJ), 7(1), 41-51.
PEPERMANS, G. (2014). “Valuing smart meters”. Energy Economics, 45, 280-294.
PIALOT, O., and D., MILLET (2014). “Why upgradability should be considered for rationalizing materials?” Paper presented at 21st CIRP Conference on Life Cycle Engineering, Procedia CIRP 15, 329-384.
PORTER, M., and C. V. der LINDE. (1996). "Green and competitive: ending the stalemate." Business and the Environment, 61-77.
PRATT, R.G., M. C. W., KINTNER-MEYER, P.J., BALDUCCI, T.F., SANQUIST, C., GERKENSMEYER, K.P., SCHNEIDER, S., KATIPAMULA, and T. J., SECRES (2010).”The Smart Grid: An Estimation of the Energy and CO2 Benefits”. Prepared for the U.S. Department of Energy under Contract DE-AC05-76RL01830. Pacific Northwest National Laboratory Richland, Washington.
243
PUJARI, D. (2006). "Eco-innovation and new product development: understanding the influences on market performance." Technovation , 26(1), 76-85.
QUINN, E. (2009). “Smart metering and privacy: existing law and competing policies.” A report for the Colorado Public Utilities Commission , Spring 2009.
REES, W. AND M., WACKERNAGEL. (1996). "Urban ecological footprints: why cities cannot be sustainable - and why they are a key to sustainability." Environmental impact assessment review, 16(4), 223-248.
RENNINGS, K. (2000). "Redefining innovation—eco-innovation research and the contribution from ecological economics." Ecological economics, 32(2), 319-332.
RICHINS, M. L. (1994). "Special possessions and the expression of material values." Journal of consumer research, 522-533.
RICHTER, L. L., and M. G., POLLITT (2016). “Which Smart Electricity Service Contracts Will Consumers Accept? The demand for compensation in a platform market”. (No. 1632). Faculty of Economics, University of Cambridge.
ROBERTSON, T. S. (1971). Innovative behavior and communication. New York: Holt, Rinehart and Winston.
ROBINSON, L. (2009). "A summary of diffusion of innovations." Enabling change.
ROEHRICH, G. (2004). Consumer innovativeness: concepts and measurements. Journal of Business Research, 57(6), 671-677.
ROEHRICH, G. and D., LLERENA. (2011). “Questioning the concept of value: from business models to the emergence of new markets”. In: Valérie Chanal, dir., Rethinking business models for innovation: lessons from entrepreneurial projects (131-154). Available at: http://prodinra.inra.fr/record/310131
ROGERS, E. M. (1962). Diffusion of innovations. Free Press, New York.
ROGERS, E. M. (2010). Diffusion of innovations. Simon and Schuster.
244
ROKEACH, M. (1973). The nature of human values (Vol. 438). New York: Free press.
ROSE, J. M., and M. C., BLIEMER (2009). “Constructing efficient stated choice experimental designs”. Transport Reviews, 29(5), 587-617.
ROSE, J. M., and M. C., BLIEMER (2013). “Sample size requirements for stated choice experiments”. Transportation, 40(5), 1021-1041.
ROSE, J. M., M. C., BLIEMER, D. A., HENSHER, and A. T., COLLINS (2008). “Designing efficient stated choice experiments in the presence of reference alternatives”. Transportation Research Part B: Methodological, 42(4), 395-406.
RUMMEL, R. J. (1975). "Understanding conflict and war: The dynamic psychological field (vol. 1). Beverly Hills." California: Sage Publications. Retrieved February 8, 2006.
GUTMAN, J. (1982). “A means-end chain model based on consumer categorization processes”. The Journal of Marketing, 60-72.
SAHA S. "Consumer preferences and product and process R&D" RAND Journal of Economics, 38(1), 250-268.
SALIES, E. (2013). “Real-time pricing when some consumers resist in saving electricity”. Energy policy, 59, 843-849.
SÁNCHEZ-FERNÁNDEZ R. and M. A., INIESTA-BONILLO (2007). “The concept of perceived value: a systematic review of the research”. Marketing Theory, 7(4), 427–451.
SCARPA, R., and K., WILLIS (2010). “Willingness-to-pay for renewable energy: Primary and discretionary choice of British households' for micro-generation technologies”. Energy Economics, 32(1), 129-136.
SCHWARTZ, S. H. (1977). "Normative influences on altruism." Advances in experimental social psychology, 10, 221-279.
245
SCHWARTZ, S. H. (1992). “Universals in the content and structure of values: Theoretical advances and empirical tests in 20 countries”. Advances in experimental social psychology, 25, 1-65.
SCHWARTZ, S. H. (1994). “Are there universal aspects in the structure and contents of human values?” Journal of social issues, 50(4), 19-45.
SCHWARTZ, S. H., and W., BILSKY (1990). “Towards a theory of the universal content and structure of values: Extensions and cross-cultural replications”. Journal of personality and social psychology, 58(5), 878.
SEN A. (1970). Collective choice and social welfare. San Francisco: Holden-Day.
SHAFIR, E., and A., TVERSKY (1992). “Thinking through uncertainty: Nonconsequential reasoning and choice”. Cognitive psychology, 24(4), 449-474.
SHETH, J. N. (1981). “Psychology of Innovation Resistance: the less developed concept (LDC) in diffusion research”, Research in Marketing, 4, 273-282.
SHETH J. N., B. I., NEWMAN and L. G., BARBARA (1991). “Why we buy what we buy: A theory of consumption values”. Journal of Business Research, 22, 159-170.
SHIH, E., and H. J., SCHAU (2011). "To justify or not to justify: the role of anticipated regret on consumers’ decisions to upgrade technological innovations." Journal of Retailing, 87(2), 242-251.
SHIPWORTH, M., S. K., FIRTH, M. I., GENTRY, A. J., WRIGHT, D. T., SHIPWORTH, and K. J., LOMAS (2010). “Central heating thermostat settings and timing: building demographics”. Building Research & Information, 38(1), 50-69.
SILVA, A., R., NAYGA, B., CAMPBELL, and J., PARK (2007). “On the use of valuation mechanisms to measure consumers’ willingness to pay for novel products: A comparison of hypothetical and non-hypothetical values”. International Food and Agribusiness Management Review, 10(2), 165-180.
246
SIMON, H. A. (1978). “Rationality as process and as product of thought”. The American economic review, 68(2), 1-16.
SLIMAK, M. W., and T., DIETZ (2006). "Personal values, beliefs, and ecological risk perception." Risk analysis, 26(6), 1689-1705.
SOLOMON, M. R., E., TISSIER-DESBORDES, and B., HEILBRUNN (2005). Comportement du consommateur (Vol. 6). Pearson education.
SPITERI, J. M., and P. A., Dion (2004). “Customer value, overall satisfaction, end-user loyalty, and market performance in detail intensive industries”. Industrial marketing management, 33(8), 675-687.
SRINIVASAN, V. (1988). “A conjunctive‐compensatory approach to the self‐explication of multiattributed preferences”. Decision Sciences, 19(2), 295-305.
SRINIVASAN, V., and C. S., PARK (1997). “Surprising robustness of the self-explicated approach to customer preference structure measurement”. Journal of Marketing Research, 286-291.
SRINIVASAN, V., and A. D., SHOCKER (1981). LINMAP version-IV-Users manual. Nashville, TN: Vanderbilt University.
STEDMAN, M. (2016). “Smart meters: The intelligent choice?”. Renewable Energy Focus, 17(4), 142-143.
STERN, P. C. (2000). "New environmental theories: toward a coherent theory of environmentally significant behavior." Journal of social issues, 56(3), 407-424.
STIGLER, G. J. (1950). “The development of utility theory”. J. Political Economy, 58, 307-327, 373-396.
STRANGE, T. and A., BAYLEY. (2009). “What is sustainable development?” in Sustainable Development: Linking Economy, Society, Environment, OECD Publishing. Available at: http://dx.doi.org/10.1787/9789264055742-3-en
247
SWEENEY, J. C., and G. N., SOUTAR. (2001). "Consumer perceived value: The development of a multiple item scale." Journal of retailing, 77(2), 203-220.
THALER, R. (1985). "Mental accounting and consumer choice." Marketing science, 4(3), 199-214.
TORRES, C., N., HANLEY, and S., COLOMBO (2011). “Incorrectly accounting for taste heterogeneity in choice experiments: Does it really matter for welfare measurement?”. Stirling Economics Discussion Paper, 2011-02.
TRAIN, K. E. (2009). Discrete choice methods with simulation. Cambridge university press.
TRAIN, K. E., and W.W., WILSON (2008). “Estimation on stated-preference experiments constructed from revealed-preference choices”. Transportation Research Part B: Methodological, 42(3), 191-203.
TROTT, P. (2012). Innovation management and new product development. Pearson education –5th edition.
TURNER, R. K. (1999). “The place of economic values in environmental valuation.” In Valuing environmental preferences: Theory and practice of the contingent valuation method in the US, EU, and developing countries. 17-41.
TVERSKY, A. (1969). “Intransitivity of preferences”. Psychological review, 76(1), 31.
TZOKAS, N., and M., SAREN (1999). "Value transformation in relationship marketing." Australasian Marketing Journal (AMJ), 7(1), 52-62.
ULAGA, W., and S., CHACOUR. (2001). "Measuring customer-perceived value in business markets: a prerequisite for marketing strategy development and implementation." Industrial marketing management, 30(6), 525-540.
248
ULKU, S., C. V., DIMOFTE, and G. M., SCHMIDT. (2012). “Consumer valuation of modularly upgradeable products”, Management Science, 1761-1776.
VALOCCHI, M., A., SCHURR, J., JULIANO, and E., NELSON (2007). “Plugging in the consumer: Innovating utility business models for the future”. IBM Institute for Business Value, 114.
VAN KLEEF, E., H.C.M., VAN TRIJP, and P., LUNING (2005). “Consumer research in the early stages of new product development: a critical review of methods and techniques”. Food Quality and Preference, 16, 181–201.
VERBONG, G. P., S., BEEMSTERBOER, and F., SENGERS (2013). “Smart grids or smart users? Involving users in developing a low carbon electricity economy”. Energy Policy, 117-125.
VERYZER, R. W. (1998). "Discontinuous innovation and the new product development process." Journal of product innovation management, 15(4), 304-321.
VICKREY, W. (1961). “Counterspeculation, auctions and competitive sealed tenders.” Journal of Finance, 16, 8–37.
VINSON, D. E., J. E., SCOTT, and L. M., Lamont (1977). “The role of personal values in marketing and consumer behavior”. The Journal of Marketing, 44-50.
VOELCKNER, F. (2006). “An empirical comparison of methods for measuring consumers' willingness to pay”. Market Lett, 17, 137-149.
WALKER, G., and N., Cass (2007). “Carbon reduction, ‘the public’ and renewable energy: engaging with socio-technical configurations”. Area, 39(4), 458- 469.
WEBSTER, F. E. (1975). “Determining the characteristics of the socially conscious consumer.” Journal of consumer research, 2(3), 188-196.
WERTENBROCH, K., and B., SKIERA (2002). Measuring consumers’ willingness to pay at the point of purchase. Journal of Marketing Research, 39(2), 228-241.
249
WITT, U. (2001). "Learning to consume – A theory of wants and the growth of demand." Journal of Evolutionary Economics, 11(1), 23-36.
WOOD, G., and M., NEWBOROUGH (2007). “Energy-use information transfer for intelligent homes: Enabling energy conservation with central and local displays”. Energy and buildings, 39(4), 495-503.
WOODRUFF, R. B. (1997). “Customer value: the next source for competitive advantage.” Journal of the academy of marketing science, 25(2), 139-153.
WOODRUFF, R. B., and S., GARDIAL. (1996). Know your customer: New approaches to understanding customer value and satisfaction. Wiley.
ZEITHAML, V. A. (1988). "Consumer perceptions of price, quality, and value: a means-end model and synthesis of evidence." The Journal of marketing, 2-22.
ZHAO, J., and C. L., KLING (2001). “A new explanation for the WTP/WTA disparity”. Economics Letters, 73(3), 293-300.
Abstract
The general purpose of this thesis is to analyze the different types of values that determine and explain the choices and behavior of consumers with a particular focus on innovative products. Specifically, we want to know whether consumers are willing to pay for innovative products with sustainable features and how consumer preferences and characteristics of the product are involved in the process of the decision-making. In addition, we test new methods for such estimations.
In the Chapter 1 we claim that individual preferences are reflected in willingness to pay for a product/service and are based on individual’s values. These values are stable for each individual, guide his/her preferences and actions as an individual (personal values) and as an economic agent (customer and consumer values). With the focus on the consumption of innovative and sustainable products, this thesis discusses also environmental and innovative values.
The importance of value analysis for innovative products is of a high importance for companies, because it allows to anticipate preferences and their changes, and by this, helps to define the priorities of new product development processes.
The complex systems of these values result in particular challenges for the estimation, discussed in Chapter 2. Therefore, the accuracy of WTP estimates depends on the choice of the method used by the researcher.
The obtained results show that consumers have positive valuations of innovative products with sustainable characteristics. These valuations are based on consumers preferences and values inherent to him/her are an individual and as a consumer. The empirical studies presented in Chapters 3 and 4 offer two experimental approaches, which contribute to the understanding of consumer behavior towards innovative products and to the understanding of the difficulties and challenges for experimental methods of preference elicitation for these products/services. In addition, they demonstrate the validity of value theory in consumer behavior.
Keywords: innovation, consumer behavior, values, preferences, experimental economics.
Résumé
L’objectif de cette thèse est d’analyser les différents types de valeurs qui déterminent et expliquent les
choix et comportements des consommateurs avec une attention particulière pour les produits innovants. Plus particulièrement, on cherche à déterminer leurs consentements à payer pour des produits innovants avec des caractéristiques durables d’une part, et comment les préférences du consommateur et les caractéristiques du produit interviennent dans le processus de la prise de la décision d’autre part.
Dans le premier chapitre, nous affirmons que les préférences individuelles sont reflétées dans leurs consentements à payer pour un produit / service et sont basées sur les valeurs individuelles. Ces valeurs sont stables pour chaque individu, guident ses préférences et ses actions en tant qu'individu (valeurs personnelles) et en tant qu'agent économique (valeurs client et consommateur). En se focalisant sur la consommation de produits innovants et durables, cette thèse aborde également les valeurs environnementales et innovantes.
L'analyse des valeurs pour les produits innovants est d'une grande importance pour les entreprises, car elle permet d'anticiper les préférences et leurs changements, et par là même, elle contribue à la définition des priorités dans les processus de développement de nouvelles offres de produits.
Les systèmes complexes de ces valeurs entraînent des défis particuliers pour l'estimation, qui sont discutés dans le chapitre 2. Notamment, l'exactitude des estimations du CAP dépend du choix de la méthode utilisée par le chercheur.
Les résultats obtenus montrent que les consommateurs ont une valorisation positive de produits innovants avec des caractéristiques durables. Ces valorisations sont basées sur les préférences des consommateurs et ses valeurs personnelles et de consommateur. Les études empiriques présentées dans les chapitres 3 et 4 proposent deux approches expérimentales qui contribuent à la compréhension des comportements des consommateurs à l'égard de produits innovants et à la compréhension des difficultés et défis des méthodes expérimentales d'élicitation de préférences pour ces produits/services. En outre, ils démontrent la validité du concept des valeurs dans le comportement des consommateurs. Mots-clés : innovation, comportement du consommateur, préférences, valeurs, économie expérimentale.
![[PPT]Consumer Behavior and Marketing Strategy - Lars … to CB.ppt · Web viewIntro to Consumer Behavior Consumer behavior--what is it? Applications Consumer Behavior and Strategy](https://img.pdfslide.us/doc/110x75/5af357b67f8b9a74448b60fb/pptconsumer-behavior-and-marketing-strategy-lars-to-cbpptweb-viewintro.jpg)