Embed Size (px)
Citation preview
New Jersey Agricultural Experiment Station
P-02145-1-05 July 2005
Consumer Awareness of the Jersey Fresh
Promotional Program
Ramu Govindasamy Kevin Sullivan
Venkata S Puduri Brian Schilling
and Logan Brown
Department of Agricultural, Food and Resource Economics and the
Food Policy Institute Rutgers, The State University of New Jersey
55 Dudley Road New Brunswick, NJ 08901-8520
Tel.: (732) 932-9155 ext.254 FAX: (732) 932-8887
July 2005
*Dr. Ramu Govindasamy is the lead author and principal contact for the study. Dr. Govindasamy is Associate Professor, Department of Agricultural, Food and Resource Economics. Kevin Sullivan is Institutional Research Analyst, New Jersey Agricultural Experiment Station. Venkata S Puduri is a Post Doctoral Research Associate Department of Agricultural, Food and Resource Economics. Brian Schilling is Associate Director, Food Policy Institute, and Logan Brown is Economic Development Representative, New Jersey Department of Agriculture.
Acknowledgments
The authors wish to acknowledge several individuals who provided useful comments
and guidance in the completion of this study. At the New Jersey Department of
Agriculture, the valuable input of Secretary Charles Kuperus and Division of Marketing
and Development Director Al Murray is especially noted. The constructive feedback of
Margaret Brennan, Associate Director of the New Jersey Agricultural Experiment
Station and Lou Cooperhouse, Director of the Food Innovation Research and Extension
center is also greatly appreciated. Funding for this study was provided by the
Agricultural Marketing Service, USDA and the New Jersey Department of Agriculture.

ii
Table of Contents
Page
Acknowledgments ............................................................................................................ i
Table of Contents.............................................................................................................ii
List of Tables...................................................................................................................iii
List of Figures.................................................................................................................. v
Data and Estimation .................................................................................................... 5
Study Results .............................................................................................................. 5
Characteristics of Survey Respondents..................................................................... 31
Conclusions ............................................................................................................... 34

iii
List of Tables Page
Table 1: Expenditures on the Jersey Fresh Program (1984-2003)................................ 4
Table 2: Recognized Jersey Fresh by Household Size ................................................. 6
Table 3: Recognized Jersey Fresh by Sex.................................................................... 6
Table 4: Recognized Jersey Fresh by Age.................................................................... 7
Table 5: Recognized Jersey Fresh by Education .......................................................... 7
Table 6: Recognized Jersey Fresh by Occupation........................................................ 8
Table 7: Recognized Jersey Fresh by Income .............................................................. 8
Table 8: Heard about Jersey Fresh by Marital Status ................................................... 9
Table 9: Places Consumers Have Seen or Heard About Jersey Fresh......................... 9
Table 10: Consumers Association of the Jersey Fresh Logo ........................................ 10
Table 11: Willing to Pay More for Jersey Fresh by Sex................................................. 13
Table 12: Willing to Pay More for Jersey Fresh by Occupation..................................... 14
Table 13: Willing to Pay More for Jersey Fresh by Number of persons in a Family ...... 14
Table 14: Willing to Pay More for Jersey Fresh by Age................................................. 15
Table 15: Willing to Pay More for Jersey Fresh by Income ........................................... 16
Table 16: Willing to Pay More for Jersey Fresh by Education ....................................... 17
Table 17: Willing to Pay More for Jersey Fresh by Marital Status ................................. 18
Table 18: Consumer appeal toward different types of food advertisements.................. 20
Table 19: Relative Quantities of Fresh Produce Bought by Consumers in 2003........... 21
Table 20: Jersey Fresh Expenditure per Month by Number of persons in a Family ...... 22
Table 21: Jersey Fresh Expenditure per Month by Sex................................................. 22
Table 22: Jersey Fresh Expenditure per Month by Age ................................................ 23
Table 23: Jersey Fresh Expenditure per Month by Education....................................... 24
Table 24: Jersey Fresh Expenditure per Month by Occupation..................................... 24
Table 25: Jersey Fresh Expenditure per Month by Income level................................... 25
Table 26: Jersey Fresh Expenditure per Month by Marital Status................................. 26
Table 27: Expenditure on Produce per Month by Number of persons in a Family ........ 27
Table 28: Expenditure on Produce per Month by Sex................................................... 27

iv
Table 29: Expenditure on Produce per Month by Age................................................... 28
Table 30: Expenditure on Produce per Month by Education ......................................... 28
Table 31: Expenditure on Produce per Month by Occupation ....................................... 29
Table 32: Expenditure on Produce per Month by Income ............................................. 29
Table 33: Expenditure on Produce per Month by Marital Status ................................... 30
Table 34: Age Distribution of Survey Respondents....................................................... 32
Table 35: Distribution of Survey Respondents by Occupation ...................................... 32
Table 36: Distribution of Survey Respondents by Ethnicity ........................................... 32
Table 37: Distribution of Survey Respondents by Income Level ................................... 33
Table 38: Distribution of Survey Respondents by Marital Status................................... 33

v
List of Figures Page
Figure 1. New Jersey Consumer Recognition of Jersey Fresh ....................................... 5 Figure 2. Various Consumer Perceptions of Jersey Fresh ............................................ 11 Figure 3. Consumers Willing to Pay More For Jersey Fresh ......................................... 12 Figure 4. Consumers Willing to Pay More For Jersey Fresh by Income Level .............. 16 Figure 5. Consumers Behavior and Perceptions of Jersey Fresh ................................. 19 Figure 6. Consumers Visiting Farmers Markets ............................................................ 30 Figure 7. Distribution of Respondents by Location Type............................................... 31

vi
Executive Summary
The Jersey Fresh marketing program, one of the nation’s leading examples of
state-sponsored agricultural marketing promotion, enables consumers to easily identify
quality fresh produce from New Jersey by promoting locally grown fruits and vegetables
in the market with Jersey Fresh’s logos. This study utilizes a consumer survey to
evaluate the effectiveness of the Jersey Fresh Program in terms of the impact the
promotional logos have on consumers. The results of this study provide valuable
information that may be used to improve the Jersey Fresh Program, and also may be
used in the promotion of other New Jersey farm products as well as products in other
states which have similar promotional programs.
Among other things, this study demonstrated that the Jersey Fresh promotional
program has created significant brand awareness among New Jersey consumers and
that consumers are willing to purchase Jersey Fresh produce when it’s available.
Consumers reported seeing the Jersey Fresh logo most frequently on in-store produce
displays. What’s more, women were more likely than men to be aware of Jersey Fresh,
as were married people. Survey participants believed Jersey Fresh produce to be
better than produce in other states in terms of quality and freshness. Moreover,
consumers associate the Jersey Fresh logo with locally grown, quality produce.
Suggestions that emerged from the study include increasing the availability of
Jersey Fresh produce during the production seasons would ensure continued consumer
patronage. Also, increasing promotions of Jersey Fresh produce in supermarkets may
further increase the popularity of Jersey Fresh produce. The study showed that a

vii
majority of consumers were willing to pay only a small percentage premium for Jersey
Fresh produce over the market prices for other fresh produce; therefore, significant
price differentials are not recommended for Jersey Fresh produce.
The results of this study lead to a better understanding of New Jersey consumers’
shopping behavior, their preferences towards local produce and their demographic
composition. The results may be especially encouraging to those developing marketing
strategies for Jersey Fresh produce or for other similar New Jersey consumer products.

2
Introduction
Jersey Fresh is one of the nation’s leading examples of state-sponsored
agricultural marketing promotion and is one of the major programs funded by the New
Jersey Department of Agriculture (NJDA). The purpose of this program is to enable
consumers to easily identify quality fresh produce from New Jersey by promoting locally
grown fruits and vegetables in the market with Jersey Fresh logos. The program
attempts to increase the awareness of many fresh fruits and vegetables available from
New Jersey by targeting consumers of New Jersey, near by Philadelphia, New York and
the Delmarva (Delaware, Maryland and Virginia) region.
The importance of this program arises from many key factors that affect the
market share of state-grown produce. New Jersey’s agriculture constitutes a key
industry for the state, contributing to income and employment. It provides livelihood for
approximately 20,000 workers and accounts for 16,000 in other industry sector jobs.
The geographic location of New Jersey provides some distinct advantages that can
translate into increased profits for farmers. New Jersey is the most densely populated
state in the U. S. and has per capita income near the highest in the nation. Moreover,
the consumer demand for fresh and quality produce has been growing. Due to New
Jersey’s convenient location close to the big consumer markets of the northeastern
states, produce can be picked at the height of ripeness and transported to these
markets in minimal time and at minimal costs. The Jersey Fresh Program was
developed by the NJDA to capitalize on these competitive advantages, to boost the
returns to New Jersey farmers, and to increase their share of the retail market,

3
especially during the growing season. The program campaign highlights the freshness
aspect of New Jersey produce to give local growers a competitive edge over the
produce that is shipped from other states.
The Jersey Fresh Program attempts to create consumer awareness through
billboards, radio and television advertising, special promotions, and distribution of
attractive point-of-purchase materials. These advertisements are well identified with the
Jersey Fresh logo, designed to catch consumer attention. The NJDA also participates in
many promotional events such as farmers’ market fairs, trade shows, cooking
competitions, and in-store Jersey Fresh produce demos held throughout the state. The
program distributes price-cards, stickers, banners, paper bags, and worker’s aprons.
Participating retail organizations receive exposure through Jersey Fresh television
commercials and billboards.
Since its introduction in 1984, the Jersey Fresh Program has undergone many
changes. The logo has been enhanced many times and has undergone new designs
and changes in style. The Jersey Fresh-From the Garden State logo, which appeared in
1984, has been the most popular and standing logo (Zeldis, 1993). Apart from this logo
the other logos that have been adopted include the Demand the Freshest campaign
theme adopted in 1987, the Farm Fresh to You Each Morning campaign theme adopted
in 1988, the Premium Jersey Fresh Logo from the regulatory component of the
campaign started in 1988, and the Five-a-Day for Better Health campaign launched in
1992. All these campaigns helped the program to establish and enhance consumer
awareness through the years (Gallup, 1988). As shown in Table 1, funding levels for
4
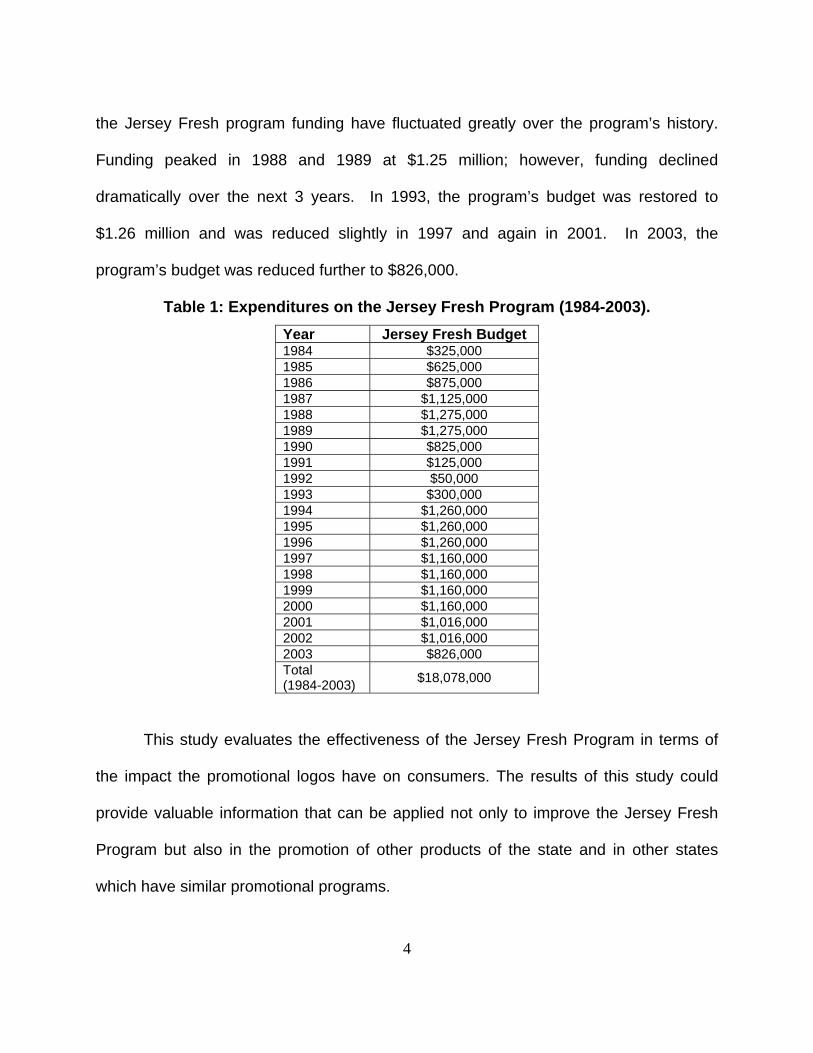
the Jersey Fresh program funding have fluctuated greatly over the program’s history.
Funding peaked in 1988 and 1989 at $1.25 million; however, funding declined
dramatically over the next 3 years. In 1993, the program’s budget was restored to
$1.26 million and was reduced slightly in 1997 and again in 2001. In 2003, the
program’s budget was reduced further to $826,000.
Table 1: Expenditures on the Jersey Fresh Program (1984-2003). Year Jersey Fresh Budget 1984 $325,000 1985 $625,000 1986 $875,000 1987 $1,125,000 1988 $1,275,000 1989 $1,275,000 1990 $825,000 1991 $125,000 1992 $50,000 1993 $300,000 1994 $1,260,000 1995 $1,260,000 1996 $1,260,000 1997 $1,160,000 1998 $1,160,000 1999 $1,160,000 2000 $1,160,000 2001 $1,016,000 2002 $1,016,000 2003 $826,000 Total (1984-2003) $18,078,000
This study evaluates the effectiveness of the Jersey Fresh Program in terms of
the impact the promotional logos have on consumers. The results of this study could
provide valuable information that can be applied not only to improve the Jersey Fresh
Program but also in the promotion of other products of the state and in other states
which have similar promotional programs.

5
Data and Estimation
1000 questionnaires were mailed to single-family households, randomly selected
from a population of more than 3 million households. A dollar bill was enclosed with
each survey as a token of appreciation for the survey participants’ time in completing
the survey. The mailing list was obtained from www.infousa.com, a provider of sales
and marketing support for all types of organizations. A total of 321 usable surveys were
returned. A copy of the survey is attached.
Study Results An important measure of the success of a promotional program is the brand
recognition that it creates. In this regard, the Jersey Fresh program appears to be
highly successful. As Figure 1 shows, seventy-five percent of respondents had either
heard of Jersey Fresh and/or recognized the Jersey Fresh logo. According to the 1996
Figure 1. New Jersey Consumer Recognition of Jersey Fresh
Have you heard of the Jersey Fresh Name or seen logo in the past?
Yes75%
No25%

6
Jersey Fresh survey (Govindasamy et al., 1996), about 77% of the participants
reported that they were aware of the Jersey Fresh Program and that they recognized
the logo.
Tables 2 through 8 present the types of people and households more likely to
recognize Jersey Fresh. In general, larger households of 4 or more recognized the
Jersey Fresh program more than smaller households (see Table 2).
Table 2: Recognized Jersey Fresh by Household Size
Heard about Jersey Fresh Yes No Total Household
Size Frequency Percent Frequency Percent Frequency Percent 1 35 67.31% 17 32.69% 52 100.00% 2 77 77.00% 23 23.00% 100 100.00% 3 47 78.33% 13 21.67% 60 100.00% 4 48 81.36% 11 18.64% 59 100.00% 5 16 76.19% 5 23.81% 21 100.00% 6 12 80.00% 3 20.00% 15 100.00%
7 + 2 100.00% 0 0.00% 2 100.00% Total 237 76.70% 72 23.30% 309 100.00%
As Table 3 shows, a slightly higher proportion of women recognized Jersey
Fresh than men. Seventy-eight percent of the women surveyed recognized Jersey
Fresh while 74% of the men did.
Table 3: Recognized Jersey Fresh by Sex
Heard about Jersey Fresh Yes No Total
Sex Frequency Percent Frequency Percent Frequency Percent Male 86 74.14% 30 25.86% 116 100.00% Female 152 77.55% 44 22.45% 196 100.00% Total 238 76.28% 74 23.72% 312 100.00%

7
As Table 4 shows, people aged 36-50 recognized Jersey Fresh more than other
age groups.
Table 4: Recognized Jersey Fresh by Age
Heard about Jersey Fresh Yes No Total Age
Distribution Frequency Percent Frequency Percent Frequency Percent 0-20 1 100.00% 0 0.00% 1 100.00% 21-35 23 67.65% 11 32.35% 34 100.00% 36-50 99 81.82% 22 18.18% 121 100.00% 51-65 65 77.38% 19 22.62% 84 100.00% 65 and Above 51 70.83% 21 29.17% 72 100.00% Total 239 76.60% 73 23.40% 312 100.00%
As Table 5 shows, people with 2 or 4-year college degrees recognized Jersey
Fresh more than other education levels. Seventy-nine percent of the people with 2 or 4-
year college degree recognized Jersey Fresh.
Table 5: Recognized Jersey Fresh by Education
Heard about Jersey Fresh Yes No Total
Educational Levels Frequency Percent Frequency Percent Frequency Percent No Formal Schooling 1 50.00% 1 50.00% 2 100.00%Up to High School 94 74.02% 33 25.98% 127 100.00%2/4 College Degree 96 79.34% 25 20.66% 121 100.00%Post Graduate 45 76.27% 14 23.73% 59 100.00%Total 236 76.38% 73 23.62% 309 100.00%
As Table 6 shows, employed people recognized Jersey Fresh slightly more than
those in other occupation groups. Seventy-nine percent of the people employed by
others recognized Jersey Fresh.

8
Table 6: Recognized Jersey Fresh by Occupation
Heard about Jersey Fresh Yes No Total
Occupation Frequency Percent Frequency Percent Frequency Percent Retired 54 73.97% 19 26.03% 73 100.00%Self-employed 29 74.36% 10 25.64% 39 100.00%Employed by others 118 79.19% 31 20.81% 149 100.00%Homemaker 28 73.68% 10 26.32% 38 100.00%Others 9 81.82% 2 18.18% 11 100.00%Total 238 76.76% 72 23.24% 310 100.00%
As Table 7 shows, people with higher incomes recognized Jersey Fresh the most
while the people with the lowest income levels recognized Jersey Fresh the least. Only
60% of those people with income less than $20,000 recognized Jersey Fresh, 68% of
people surveyed with income between $20,000 and $39,000 recognized Jersey Fresh,
while 80% of all respondents with income levels greater than $40,000 did recognize
Jersey Fresh.
Table 7: Recognized Jersey Fresh by Income
Heard about Jersey Fresh Yes No Total Income
(dollars) Frequency Percent Frequency Percent Frequency Percent Up to 20,000 18 60.00% 12 40.00% 30 100.00% 20,000-39,000 32 68.09% 15 31.91% 47 100.00% 40,000-59,000 37 80.43% 9 19.57% 46 100.00% 60,000-79,000 31 81.58% 7 18.42% 38 100.00% 80,000-99,000 21 72.41% 8 27.59% 29 100.00% 100,000-More 71 81.61% 16 18.39% 87 100.00% Total 210 75.81% 67 24.19% 277 100.00%
As Table 8 shows, married people recognized Jersey Fresh more than single,
widowed and separated people. Divorced people recognized Jersey Fresh slightly less
than married people. Seventy-nine of the married people surveyed recognized Jersey
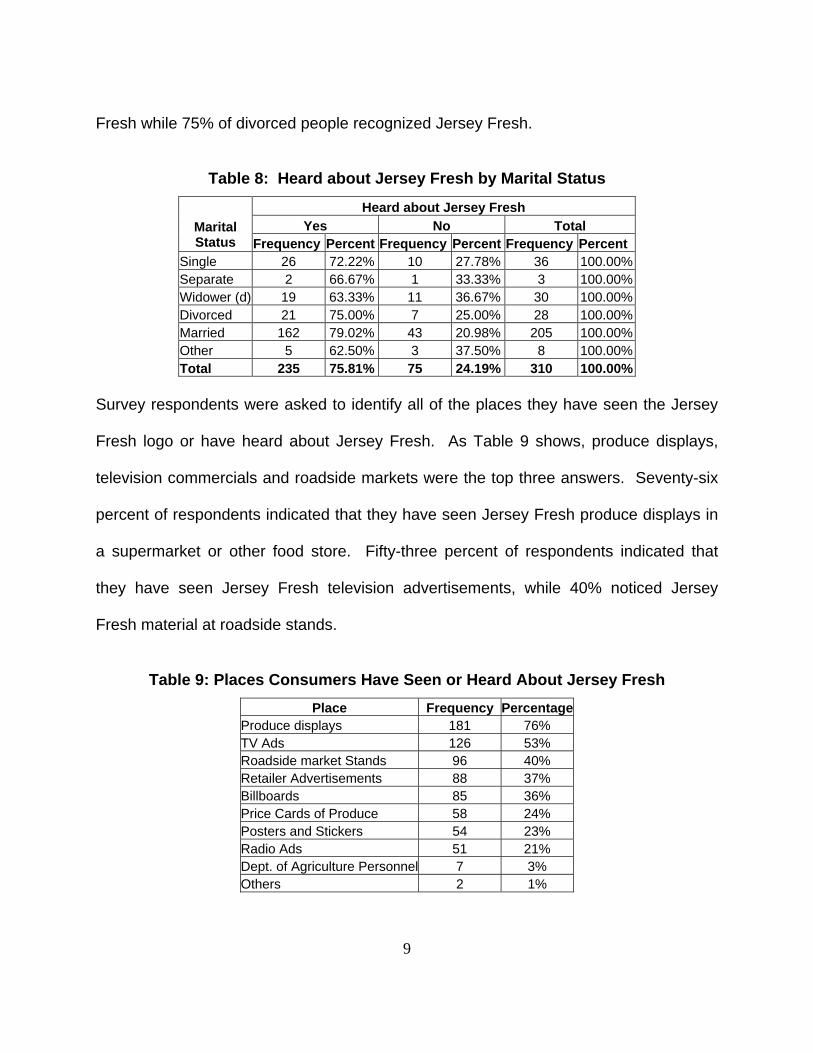
9
Fresh while 75% of divorced people recognized Jersey Fresh.
Table 8: Heard about Jersey Fresh by Marital Status
Heard about Jersey Fresh Yes No Total Marital
Status Frequency Percent Frequency Percent Frequency Percent Single 26 72.22% 10 27.78% 36 100.00% Separate 2 66.67% 1 33.33% 3 100.00% Widower (d) 19 63.33% 11 36.67% 30 100.00% Divorced 21 75.00% 7 25.00% 28 100.00% Married 162 79.02% 43 20.98% 205 100.00% Other 5 62.50% 3 37.50% 8 100.00% Total 235 75.81% 75 24.19% 310 100.00%
Survey respondents were asked to identify all of the places they have seen the Jersey
Fresh logo or have heard about Jersey Fresh. As Table 9 shows, produce displays,
television commercials and roadside markets were the top three answers. Seventy-six
percent of respondents indicated that they have seen Jersey Fresh produce displays in
a supermarket or other food store. Fifty-three percent of respondents indicated that
they have seen Jersey Fresh television advertisements, while 40% noticed Jersey
Fresh material at roadside stands.
Table 9: Places Consumers Have Seen or Heard About Jersey Fresh
Place Frequency Percentage Produce displays 181 76% TV Ads 126 53% Roadside market Stands 96 40% Retailer Advertisements 88 37% Billboards 85 36% Price Cards of Produce 58 24% Posters and Stickers 54 23% Radio Ads 51 21% Dept. of Agriculture Personnel 7 3% Others 2 1%

10
Survey respondents were asked to identify the types of products they associate
with Jersey Fresh. As Table 10 shows, New Jersey Farmers’ Produce and Quality
Produce were the top 2 most frequently cited answers. Eighty-seven percent of
respondents indicated that they associate Jersey Fresh with New Jersey produce and
58% of respondents indicated that they associate Jersey Fresh with quality produce.
Table 10: Consumers Association of the Jersey Fresh Logo
Association Frequency PercentageNJ Farmers' Produce 207 87% Quality Produce 138 58% NJ Dept. of Agriculture 55 23% Dairy and Eggs 30 13% Meat from NJ 8 3% Other 2 1%
Figure 2 lists various charts depicting consumer’s perceptions regarding Jersey
Fresh produce. New Jersey consumers consider Jersey Fresh produce to be of high
quality. For example, 60% of respondents consider Jersey Fresh produce to be higher
quality than produce from other states, and 68% consider Jersey Fresh produce to be
higher quality than produce from other countries.
Consumers also indicated that Jersey Fresh displays actually induce changes in
their buying habits. For instance, 11% said they definitely purchase more produce
when Jersey Fresh is available, and 40% said they occasionally purchase more
produce when it is Jersey Fresh. Furthermore, 27% of respondents said they would
change their usual shopping location in order to purchase Jersey Fresh produce, and
50% said they would occasionally change their usual shopping location.

11
Figure 2. Various Consumer Perceptions of Jersey Fresh
Customers perception of Jersey Fresh produce quality compared to other state
Same26%
Worse1%
Don't know13%
Better60%
Customers perceptions of Jersey Fresh produce quality compared to other countries
Better68%
Worse1%
Same10%
Don't know21%
Would you consider changing your usual shopping market to be able to
purchageJersey Fresh produce?
Definitely27%
No23%
Occasion-ally50%
Would "Jersey Fresh" displays prompt you to buy more than originally planned
No Change49%
Definitely purchase
More11%
Occasional-ly
purchase more 40%
Have you ever bought fresh produce advertised with the Jersey Fresh logo?
No9%
Yes91%
Customers perception of Jersey Fresh produce quality compared to other state
Same26%
Worse1%
Don't know13%
Better60%

12
While 91% of respondents indicated that they have purchased Jersey Fresh
produce, 92% said they would prefer a greater selection of Jersey Fresh produce. The
information in Figure 2 suggests that the Jersey Fresh program is a having a positive
impact on New Jersey fruit and vegetable revenues. In addition, there appears to be
opportunities to capture even more of consumers demand for fresh fruit and vegetables.
Base on the survey results, the average consumer spends approximately $52 per
month on Jersey Fresh produce, or $624 per year. In total, the average consumer
spends approximately $70 per month on all produce, or $840 per year. In general,
consumers are willing to pay more for Jersey Fresh produce. The majority (65%) of
surveyed consumers said they would be willing to pay at least a 1%-5% more for Jersey
Fresh produce. Forty-six percent of those consumers surveyed said they would be
willing to pay between 1% and 5% more for Jersey Fresh produce, while 14% said they
would be willing to pay between 6% and 10% more, and 4% said they would be willing
to pay between 11% and 15% more. Thirty-five percent of survey respondents said
they would not be willing to pay an additional amount for Jersey Fresh produce.
Figure 3. Consumers Willing to Pay More for Jersey Fresh
How much more over the current price would you be willing to pay for Jersey Fresh produce that is
fresh from local farms and quality tested?
More than 20 %0%
6 % to 10 % more 14%
16 % to 20 % more 1%
11 % to 15 % more 4%
I will not pay more35%
1 % to 5 % more 46%

13
As Table 11 shows, female respondents were more willing to pay an additional
premium for Jersey Fresh produce as compared to male respondents. Seventy percent
of female respondents said they would be willing to pay at least 1% to 5% more for
Jersey Fresh produce, while 60% of male respondents said they would be willing to pay
more. Furthermore, homemakers were more likely to pay more for Jersey Fresh
produce than any other group (see Table 12). Seventy-seven percent of homemakers
indicated that they would be willing to pay at least 1% to 5% more for Jersey Fresh
produce. However, homemakers were the least likely to pay more than a 5% premium
for Jersey Fresh produce. This underscores the homemakers’ desire to find the best
balance between quality and price. Additionally, married respondents were more likely
to pay at least 1% to 5% more for Jersey Fresh produce.
Table 11: Willing to Pay More for Jersey Fresh by Sex
Sex Willing to Pay More (Percent) Male Female Total
Frequency 34 43 77 Not Pay Percent 44.16% 55.84% 100.00%
Frequency 33 70 103 1% to 5% Percent 32.04% 67.96% 100.00%
Frequency 12 20 32 6% to 10% Percent 37.50% 62.50% 100.00%
Frequency 5 4 9 11% to 15% Percent 55.56% 44.44% 100.00%
Frequency 0 4 4 16% + Percent 0.00% 100.00% 100.00%
Frequency 84 141 225 Total Percent 37.33% 62.67% 100.00%

14
Table 12: Willing to Pay More for Jersey Fresh by Occupation
Occupation Willing to Pay More (Percent) Retired
Self-employed
Employed by others Homemaker Others Total
Frequency 22 12 39 6 1 80 Not Pay Percent 27.50% 15.00% 48.75% 7.50% 1.25% 100.00%
Frequency 23 8 47 17 6 101 1% to 5% Percent 22.77% 7.92% 46.53% 16.83% 5.94% 100.00%
Frequency 5 4 21 1 1 32 6% to 10% Percent 15.63% 12.50% 65.63% 3.13% 3.13% 100.00%
Frequency 0 4 5 0 0 9 11% to 15% Percent 0.00% 44.44% 55.56% 0.00% 0.00% 100.00%
Frequency 1 0 1 2 0 4 16% + Percent 25.00% 0.00% 25.00% 50.00% 0.00% 100.00%
Frequency 51 28 113 26 8 226 Total Percent 22.57% 12.39% 50.00% 11.50% 3.54% 100.00%
Table 13: Willing to Pay More for Jersey Fresh by Number of persons in a Family
Household Size Willing to Pay More (Percent) 1 2 3 4 5 6 7 8 Total
Frequency 13 23 15 17 4 4 0 1 77 Not Pay Percent 16.88% 29.87% 19.48% 22.08% 5.19% 5.19% 0.00% 1.30% 100.00%
Frequency 10 37 19 19 9 7 0 1 102 1% to 5% Percent 9.80% 36.27% 18.63% 18.63% 8.82% 6.86% 0.00% 0.98% 100.00%
Frequency 4 10 7 8 3 0 0 0 32 6% to 10% Percent 12.50% 31.25% 21.88% 25.00% 9.38% 0.00% 0.00% 0.00% 100.00%
Frequency 3 4 2 0 0 0 0 0 9 11% to 15% Percent 33.33% 44.44% 22.22% 0.00% 0.00% 0.00% 0.00% 0.00% 100.00%
Frequency 2 1 0 1 0 0 0 0 4 16% + Percent 50.00% 25.00% 0.00% 25.00% 0.00% 0.00% 0.00% 0.00% 100.00%
Frequency 32 75 43 45 16 11 0 2 224 Total Percent 14.28% 33.48% 19.20% 20.09% 7.14% 4.91% 0.00% 0.90% 100.00%

15
As Table 13 shows, larger households were more willing to pay an additional
premium for Jersey Fresh produce; however, larger households were only willing to
spend up to 10% more. Single person households were the least likely to pay an
additional premium for Jersey Fresh.
As people age, their willingness to pay a premium for Jersey Fresh produce
increases; however, people 65 and older are the least willing to spend additional money
on Jersey Fresh produce (see Table 14). The results in Table 14 are most likely
caused by the direct relationship between age and income. Indeed, people with higher
income were more willing to pay an additional premium for Jersey Fresh produce.
However, the willingness to pay more for Jersey Fresh produce actually decreases at
the highest income levels (see Figure 4 and Table 15).
Table 14: Willing to Pay More for Jersey Fresh by Age
Age Distribution Willing to Pay More (Percent) 0-20 21-35 36-50 51-65
65 and Above Total
Frequency 0 4 34 23 19 80 Not Pay Percent 0.00% 5.00% 42.50% 28.75% 23.75% 100.00%
Frequency 1 15 37 28 21 102 1% to 5% Percent 0.98% 14.71% 36.27% 27.45% 20.59% 100.00%
Frequency 0 2 21 5 4 32 6% to 10% Percent 0.00% 6.25% 65.63% 15.63% 12.50% 100.00%
Frequency 0 1 0 7 1 9 11% to 15% Percent 0.00% 11.11% 0.00% 77.78% 11.11% 100.00%
Frequency 0 0 3 0 1 4 16% + Percent 0.00% 0.00% 75.00% 0.00% 25.00% 100.00%
Frequency 1 22 95 63 46 227 Total Percent 0.44% 9.69% 41.85% 27.75% 20.26% 100.00%

16
0%10%20%30%40%50%60%70%80%90%
Percent of Respondents
Willing to Pay More
Up to20,000
20,000-39,000
40,000-59,000
60,000-79,000
80,000-99,000
100,000- More
Income Level
Figure 4. Consumers Willing to Pay More for Jersey Fresh by Income Level
Table 15: Willing to Pay More for Jersey Fresh by Income
Income (dollars) Willing to Pay More (Percent)
Up to 20,000
20,000-39,000
40,000-59,000
60,000-79,000
80,000-99,000
100,000 - More Total
Frequency 6 9 10 4 7 27 63 Not Pay Percent 9.52% 14.29% 15.87% 6.35% 11.11% 42.86% 100.00%
Frequency 6 17 17 22 7 25 94 1% to 5% Percent 6.38% 18.09% 18.09% 23.40% 7.45% 26.60% 100.00%
Frequency 1 4 8 2 1 15 31 6% to 10% Percent 3.23% 12.90% 25.81% 6.45% 3.23% 48.39% 100.00%
Frequency 1 0 2 0 5 1 9 11% to 15% Percent 11.11% 0.00% 22.22% 0.00% 55.56% 11.11% 100.00%
Frequency 0 1 0 1 1 1 4 16% + Percent 0.00% 25.00% 0.00% 25.00% 25.00% 25.00% 100.00%
Frequency 14 31 37 29 21 69 201 Total Percent 6.97% 15.42% 18.41% 14.43% 10.45% 34.33% 100.00%

17
As Table 16 shows, respondents with more years of education were more willing
to pay a premium for Jersey Fresh produce increases. For example, 68% of those
respondents with a 2-year or 4-year college degree were willing to pay more for Jersey
Fresh produce, while only 61% of high school graduates were willing to pay more.
Table 16: Willing to Pay More for Jersey Fresh by Education
Educational Levels
Willing to Pay More (Percent)
No Formal
Schooling
Up to High
School
2/4 College Degree
Post Graduate Total
Frequency 1 34 30 13 78 Not Pay Percent 1.28% 43.59% 38.46% 16.67% 100.00%
Frequency 0 39 44 18 101 1% to 5% Percent 0.00% 38.61% 43.56% 17.82% 100.00%
Frequency 0 12 14 6 32 6% to 10% Percent 0.00% 37.50% 43.75% 18.75% 100.00%
Frequency 0 1 5 3 9 11% to 15% Percent 0.00% 11.11% 55.56% 33.33% 100.00%
Frequency 0 2 0 2 4 16% + Percent 0.00% 50.00% 0.00% 50.00% 100.00%
Frequency 1 88 93 42 224 Total Percent 0.45% 39.29% 41.52% 18.75% 100.00%
As Table 17 shows, married respondents were more willing to pay an additional
premium for Jersey Fresh produce while divorced people were the least likely group to
pay more for Jersey Fresh produce. However, single people were more likely to pay
11% or more additional premium for Jersey Fresh produce than any other group,
possibly because single people have more disposable income than the other marital
status groups.

18
Table 17: Willing to Pay More for Jersey Fresh by Marital Status
Marital Status Willing to Pay More (Percent) Single Separate
Widower (d) Divorced Married Other Total
Frequency 10 0 7 9 47 3 76 Not Pay Percent 13.16% 0.00% 9.21% 11.84% 61.84% 3.95% 100.00%
Frequency 7 1 9 7 77 2 103 1% to 5% Percent 6.80% 0.97% 8.74% 6.80% 74.76% 1.94% 100.00%
Frequency 5 1 1 1 24 0 32 6% to 10% Percent 15.63% 3.13% 3.13% 3.13% 75.00% 0.00% 100.00%
Frequency 2 0 0 1 6 0 9 11% to 15% Percent 22.22% 0.00% 0.00% 11.11% 66.67% 0.00% 100.00%
Frequency 1 0 0 1 2 0 4 16% + Percent 25.00% 0.00% 0.00% 25.00% 50.00% 0.00% 100.00%
Frequency 25 2 17 19 156 5 224 Total Percent 11.16% 0.89% 7.59% 8.48% 69.64% 2.23% 100.00%
Figure 5 presents more graphical representations of consumer behavior and
perceptions with regard to Jersey Fresh produce. Fifteen percent of consumers
surveyed indicated that they always look specifically for Jersey Fresh logo items, while
62% said they occasionally look for Jersey Fresh logo items, and 23% said they never
look for the Jersey Fresh logo.
With regard to price, 22% of consumers said the price of Jersey Fresh produce
was higher than expected while 41% said the Jersey Fresh price was the same as other
fresh produce. In terms of freshness, 65% of consumers surveyed said that Jersey
Fresh produce was very fresh compared to other produce, while 22% said that Jersey
Fresh produce was the same as other fresh produce. In terms of quality, 59% of
consumers indicated that Jersey Fresh produce represented better quality as compared
to other fresh produce, while 26% of consumers thought the quality was the same as
other fresh produce. In terms of packaging, 55% of consumers surveyed thought that

19
Figure 5. Consumers Behavior and Perceptions of Jersey Fresh
Has Jersey Fresh program increased your consumption of New Jersey produce?
Yes28% No
42%
Don't Know30%
While shopping for fresh produce do you look specifically for Jersey Fresh
logo items?
Occasion-ally62%
Never23%
Alw ays15%
Consumers' opinion of Jersey Fresh produce compared with other fresh produce
in terms of quality.
Poor in quality
0%Don't know
15%
Same as others26%
Better in quality59%
Consumers' opinion of Jersey Fresh produce compared with other fresh produce in terms
of price
Lower Prices than expected
7%
Higher Prices than expected
22%
Don't know30%
Same price as others
41%
Consumers' opinion of Jersey Fresh produce compared with other fresh produce
in terms of packaging
Poor Package
1%
Better Package
15%
Don't know29%
Same as the others
55%
Consumers' opinion of Jersey Fresh produce compared with other fresh produce in terms
of freshness
Very Fresh65%
Don't know13%
Same as the others
22%

20
the Jersey Fresh packaging was the same as other fresh produce, while 15% thought
that Jersey Fresh packaging was better, and 1% thought Jersey Fresh produce
packaging was poor in comparison to other fresh produce.
In general, consumers want to purchase locally grown fresh produce. Eighty-six
percent of surveyed consumers actually wish to buy produce that is grown on New
Jersey farms; however, only 15% of consumers always look for Jersey Fresh produce
and 62% only look for it occasionally. This indicates that there may be an opportunity to
capture more of the produce market, either through increased marketing or by making
Jersey Fresh produce more visible and more widely available.
Table 18 reveals consumers’ preferences regarding different types of food
advertisements. Not surprisingly, special price tags were most appealing to the
consumers surveyed, 68% said that special price tags were more attractive, while only
4% indicated that special price tags were less attractive. Special in-store
demonstrations were the second most attractive type of advertisement (47% of
respondents), followed by colorful stickers (33%), posters and banners (31%), and
brochures (25%). Indeed, brochures were the least attractive type of advertisement
among consumers surveyed.
Table 18: Consumer appeal toward different types of food advertisements
More Attractive Neutral Less Attractive Type Frequency % Frequency % Frequency %
Special price tags 196 68% 82 28% 12 4% Special in-store demos 129 47% 115 41% 33 12% Colorful stickers 91 33% 153 55% 34 12% Posters and Banners 84 31% 155 57% 33 12% Brochures 67 25% 147 54% 57 21%

21
Survey respondents were asked to indicate how much of each type of fresh
produce they purchase during the year. They were given 5 types of produce and given
4 different relative amounts (all, most, some, none). The results are presented in Table
19. In general, consumers purchase a mixed assortment of produce from a number of
different sources. Fifty-nine percent of respondents said some of their produce was
Jersey Fresh, while 27% said that most of their produce was Jersey Fresh, and 9% said
that all of their purchased produce was Jersey Fresh.
Table 19: Relative Quantities of Fresh Produce Bought by Consumers in 2003
All Most Some None Type Frequency % Frequency % Frequency % Frequency % Jersey Fresh Produce 24 9% 73 27% 159 59% 12 5%
Locally grown Produce 16 6% 91 33% 163 59% 6 2%
Vine ripened Produce 12 4% 31 12% 192 70% 38 14%
Out-of-state Produce 6 2% 57 21% 201 73% 11 4%
Organic Produce 3 1% 12 4% 109 40% 148 55%
As expected, larger households tend to spend more on Jersey Fresh produce (see
Table 20). For example, 64% of respondents whose household size was 3 persons or
less spent less than $30 per month on Jersey Fresh produce. By contrast, the majority
of respondents whose household size was 4 persons or more spent more than $30 per
month on Jersey Fresh produce.

22
Table 20: Jersey Fresh Expenditure per Month by Number of persons in a Family
Household Size Jersey Fresh Expenditure (dollars) 1 2 3 4 5 6 7 8 Total
Frequency 1 3 4 1 1 1 0 0 11 0-10 Percent 9.09% 27.27% 36.36% 9.09% 9.09% 9.09% 0.00% 0.00% 100.00%
Frequency 6 12 7 5 3 2 0 1 36 10-20 Percent 16.67% 33.33% 19.44% 13.89% 8.33% 5.56% 0.00% 2.78% 100.00%
Frequency 5 10 3 4 2 0 0 0 24 20-30 Percent 20.83% 41.67% 12.50% 16.67% 8.33% 0.00% 0.00% 0.00% 100.00%
Frequency 2 2 2 2 3 1 0 0 12 30-40 Percent 16.67% 16.67% 16.67% 16.67% 25.00% 8.33% 0.00% 0.00% 100.00%
Frequency 1 5 0 3 1 2 0 0 12 40-50 Percent 8.33% 41.67% 0.00% 25.00% 8.33% 16.67% 0.00% 0.00% 100.00%
Frequency 4 7 6 5 2 1 0 0 25 50-More Percent 16.00% 28.00% 24.00% 20.00% 8.00% 4.00% 0.00% 0.00% 100.00%
Frequency 19 39 22 20 12 7 0 1 120 Total Percent 15.83% 32.50% 18.33% 16.67% 10.00% 5.83% 0.00% 0.83% 100.00%
Table 21: Jersey Fresh Expenditure per Month by Sex
Sex Jersey Fresh Expenditure (dollars) Male Female Total
Frequency 1 10 11 0-10 Percent 9.09% 90.91% 100.00%
Frequency 14 23 37 10-20 Percent 37.84% 62.16% 100.00%
Frequency 7 17 24 20-30 Percent 29.17% 70.83% 100.00%
Frequency 3 9 12 30-40 Percent 25.00% 75.00% 100.00%
Frequency 5 7 12 40-50 Percent 41.67% 58.33% 100.00%
Frequency 14 11 25 50-More Percent 56.00% 44.00% 100.00%
Frequency 44 77 121 Total Percent 36.36% 63.64% 100.00%

23
Table 21 shows the breakdown of monthly Jersey Fresh expenditures by sex. In
general, female respondents tended to spend slightly less than males. For example,
35% of female respondents spent $30 or more per month while 50% of male
respondents spent $30 or more per month on Jersey Fresh produce.
Table 22: Jersey Fresh Expenditure per Month by Age
Age Distribution Jersey Fresh Expenditure (dollars) 0-20 21-35 36-50 51-65
65 and Above Total
Frequency 0 1 3 4 3 11 0-10 Percent 0.00% 9.09% 27.27% 36.36% 27.27% 100.00%
Frequency 0 6 15 7 9 37 10-20 Percent 0.00% 16.22% 40.54% 18.92% 24.32% 100.00%
Frequency 0 3 12 6 3 24 20-30 Percent 0.00% 12.50% 50.00% 25.00% 12.50% 100.00%
Frequency 0 2 6 3 1 12 30-40 Percent 0.00% 16.67% 50.00% 25.00% 8.33% 100.00%
Frequency 0 3 3 4 2 12 40-50 Percent 0.00% 25.00% 25.00% 33.33% 16.67% 100.00%
Frequency 0 0 10 8 7 25 50-More Percent 0.00% 0.00% 40.00% 32.00% 28.00% 100.00%
Frequency 0 15 49 32 25 121 Total Percent 0.00% 12.40% 40.50% 26.45% 20.66% 100.00%
Table 22 shows the breakdown of monthly Jersey Fresh expenditures by age
group. In general, it appears that younger age groups tend to spend less money on
Jersey Fresh produce than older age groups.
Table 23 shows the breakdown of monthly Jersey Fresh expenditures by
education levels. It is difficult to make generalizations of Jersey Fresh expenditure
levels based on education.

24
Table 23: Jersey Fresh Expenditure per Month by Education
Educational Levels Jersey Fresh Expenditure (dollars)
No Formal
Schooling
Up to High
School
2/4 College Degree
Post Graduate Total
Frequency 0 5 5 1 11 0-10 Percent 0.00% 45.45% 45.45% 9.09% 100.00%
Frequency 0 13 19 5 37 10-20 Percent 0.00% 35.14% 51.35% 13.51% 100.00%
Frequency 0 11 7 6 24 20-30 Percent 0.00% 45.83% 29.17% 25.00% 100.00%
Frequency 0 6 5 1 12 30-40 Percent 0.00% 50.00% 41.67% 8.33% 100.00%
Frequency 0 3 7 2 12 40-50 Percent 0.00% 25.00% 58.33% 16.67% 100.00%
Frequency 0 12 9 2 23 50-More Percent 0.00% 52.17% 39.13% 8.70% 100.00%
Frequency 0 50 52 17 119 Total Percent 0.00% 42.02% 43.70% 14.29% 100.00%
Table 24: Jersey Fresh Expenditure per Month by Occupation
Occupation Jersey Fresh Expenditure (dollars) Retired
Self-employed
Employed by others Homemaker Others Total
Frequency 1 1 8 1 0 11 0-10 Percent 9.09% 9.09% 72.73% 9.09% 0.00% 100.00%
Frequency 11 1 18 4 3 37 10-20 Percent 29.73% 2.70% 48.65% 10.81% 8.11% 100.00%
Frequency 5 2 14 3 0 24 20-30 Percent 20.83% 8.33% 58.33% 12.50% 0.00% 100.00%
Frequency 1 2 7 2 0 12 30-40 Percent 8.33% 16.67% 58.33% 16.67% 0.00% 100.00%
Frequency 3 2 5 0 1 11 40-50 Percent 27.27% 18.18% 45.45% 0.00% 9.09% 100.00%
Frequency 6 5 11 2 1 25 50-More Percent 24.00% 20.00% 44.00% 8.00% 4.00% 100.00%
Frequency 27 13 63 12 5 120 Total Percent 22.50% 10.83% 52.50% 10.00% 4.17% 100.00%

25
Interestingly, self-employed respondents tend to spend the most money on
Jersey Fresh produce (see Table 24). For example, 69% of self-employed respondents
spent more than $30 per month on Jersey Fresh produce. By contrast, the majority of
all other occupation groups spent less than $30 per month on Jersey Fresh produce.
Table 25: Jersey Fresh Expenditure per Month by Income level
Income (dollars) Jersey Fresh Expenditure (dollars)
Up to 20,000
20,000-39,000
40,000-59,000
60,000-79,000
80,000-99,000
100,000 - More Total
Frequency 0 1 1 4 3 2 11 0-10 Percent 0.00% 9.09% 9.09% 36.36% 27.27% 18.18% 100.00%
Frequency 6 5 8 5 3 8 35 10-20 Percent 17.14% 14.29% 22.86% 14.29% 8.57% 22.86% 100.00%
Frequency 1 3 1 8 3 6 22 20-30 Percent 4.55% 13.64% 4.55% 36.36% 13.64% 27.27% 100.00%
Frequency 2 5 2 0 0 3 12 30-40 Percent 16.67% 41.67% 16.67% 0.00% 0.00% 25.00% 100.00%
Frequency 1 2 2 0 2 4 11 40-50 Percent 9.09% 18.18% 18.18% 0.00% 18.18% 36.36% 100.00%
Frequency 1 3 5 3 1 9 22 50-More Percent 4.55% 13.64% 22.73% 13.64% 4.55% 40.91% 100.00%
Frequency 11 19 19 20 12 32 113 Total Percent 9.73% 16.81% 16.81% 17.70% 10.62% 28.32% 100.00%
Table 25 shows the breakdown of monthly Jersey Fresh expenditures by income
levels. Surprisingly, the two groups most likely to spend less than $30 per week on
Jersey Fresh were at the upper end of the income range.
Eighty-five percent of the $60,000-$79,000 income group and 75% of the
$80,000-$99,000 income group spent less than $30 per month on Jersey Fresh
produce.

26
As expected, married respondents spent more on Jersey Fresh produce than the
other groups (see Table 26). In addition, divorced respondents spent more than
widowed and single respondents.
Table 26: Jersey Fresh Expenditure per Month by Marital Status
Marital Status Jersey Fresh Expenditure (dollars) Single Separate
Widower (d) Divorced Married Other Total
Frequency 1 0 3 0 6 0 10 0-10 Percent 10.00% 0.00% 30.00% 0.00% 60.00% 0.00% 100.00%
Frequency 4 0 7 3 21 1 36 10-20 Percent 11.11% 0.00% 19.44% 8.33% 58.33% 2.78% 100.00%
Frequency 3 0 1 4 15 1 24 20-30 Percent 12.50% 0.00% 4.17% 16.67% 62.50% 4.17% 100.00%
Frequency 2 0 1 2 7 0 12 30-40 Percent 16.67% 0.00% 8.33% 16.67% 58.33% 0.00% 100.00%
Frequency 1 0 1 0 10 0 12 40-50 Percent 8.33% 0.00% 8.33% 0.00% 83.33% 0.00% 100.00%
Frequency 0 1 2 2 20 0 25 50-More Percent 0.00% 4.00% 8.00% 8.00% 80.00% 0.00% 100.00%
Frequency 11 1 15 11 79 2 119 Total Percent 9.24% 0.84% 12.61% 9.24% 66.39% 1.68% 100.00%
Tables 27 through 33 show the breakdown of monthly produce expenditures by
different categories. These tables can be compared with the tables above which show
the breakdown of monthly Jersey Fresh produce expenditures for different categories.
As expected, larger families spend more on produce than smaller families (see Table
27). Sex doesn’t appear to be a determining factor with regard to monthly produce
expenditures. (See Table 28). In general, respondents between ages 21-35 spent less
on produce than respondents older than age 35 (see Table 29). As Table 30 indicates,
more respondents in up to High School and 2/4 College Degree spend on Jersey Fresh
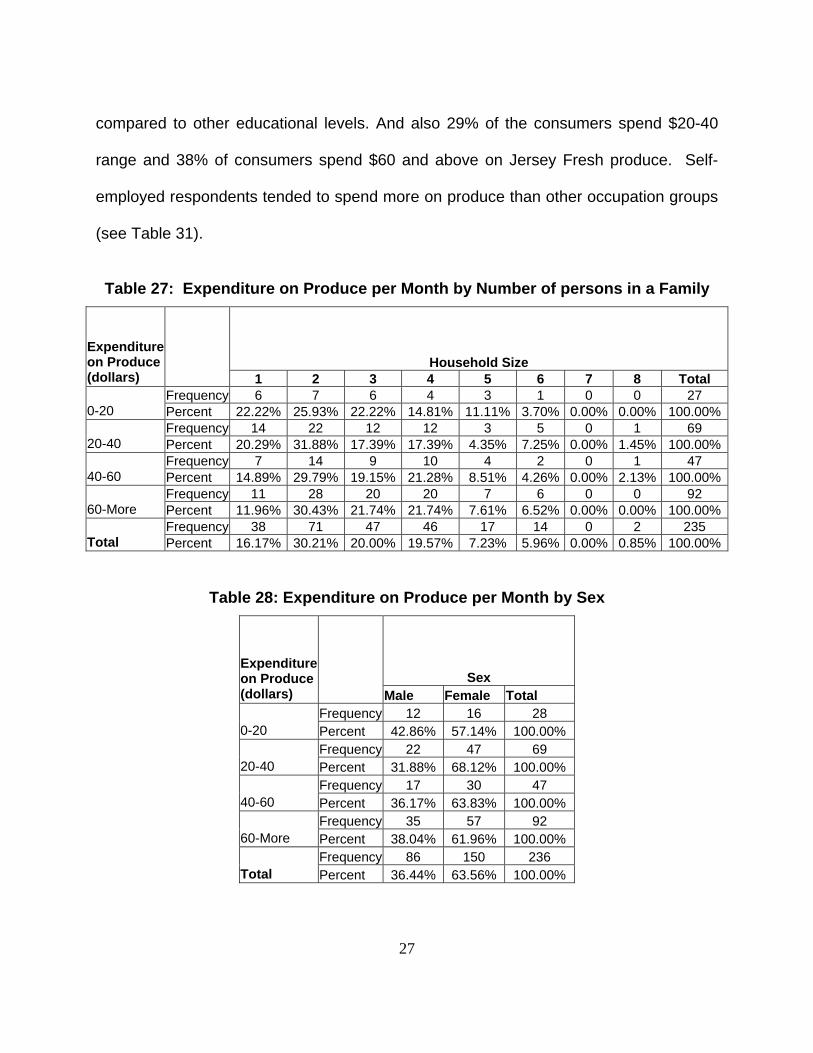
27
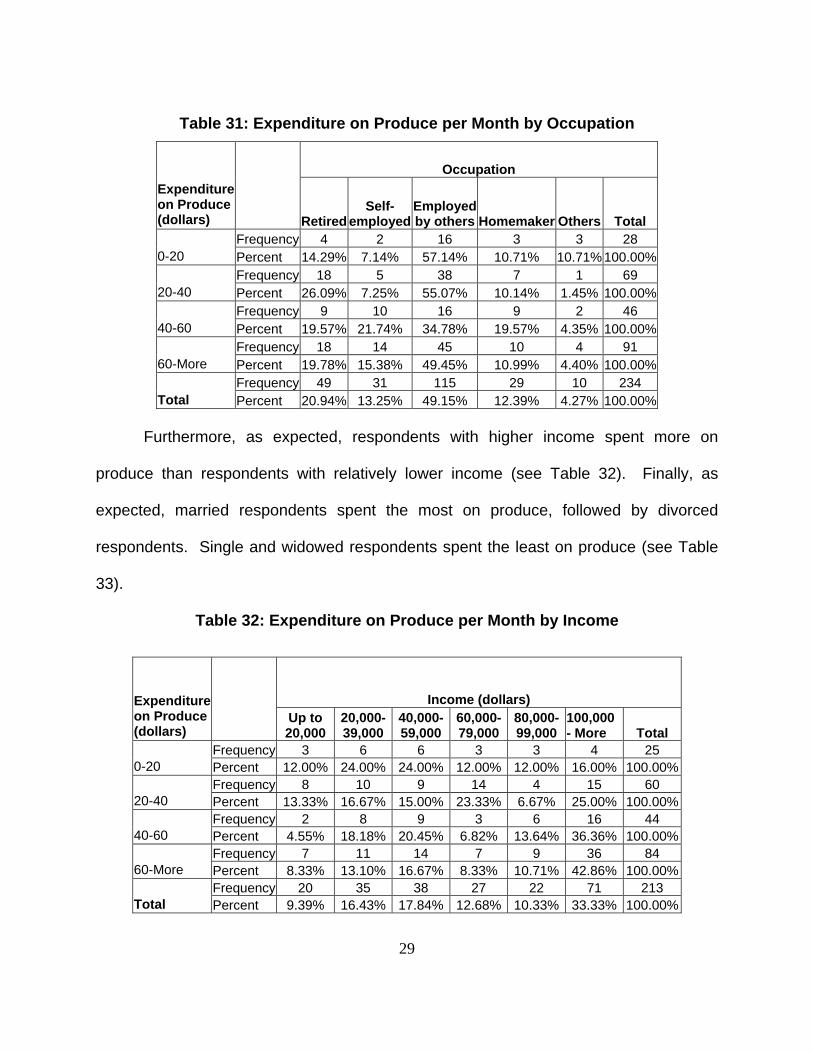
compared to other educational levels. And also 29% of the consumers spend $20-40
range and 38% of consumers spend $60 and above on Jersey Fresh produce. Self-
employed respondents tended to spend more on produce than other occupation groups
(see Table 31).
Table 27: Expenditure on Produce per Month by Number of persons in a Family
Household Size Expenditure on Produce (dollars) 1 2 3 4 5 6 7 8 Total
Frequency 6 7 6 4 3 1 0 0 27 0-20 Percent 22.22% 25.93% 22.22% 14.81% 11.11% 3.70% 0.00% 0.00% 100.00%
Frequency 14 22 12 12 3 5 0 1 69 20-40 Percent 20.29% 31.88% 17.39% 17.39% 4.35% 7.25% 0.00% 1.45% 100.00%
Frequency 7 14 9 10 4 2 0 1 47 40-60 Percent 14.89% 29.79% 19.15% 21.28% 8.51% 4.26% 0.00% 2.13% 100.00%
Frequency 11 28 20 20 7 6 0 0 92 60-More Percent 11.96% 30.43% 21.74% 21.74% 7.61% 6.52% 0.00% 0.00% 100.00%
Frequency 38 71 47 46 17 14 0 2 235 Total Percent 16.17% 30.21% 20.00% 19.57% 7.23% 5.96% 0.00% 0.85% 100.00%
Table 28: Expenditure on Produce per Month by Sex
Sex Expenditure on Produce (dollars) Male Female Total
Frequency 12 16 28 0-20 Percent 42.86% 57.14% 100.00%
Frequency 22 47 69 20-40 Percent 31.88% 68.12% 100.00%
Frequency 17 30 47 40-60 Percent 36.17% 63.83% 100.00%
Frequency 35 57 92 60-More Percent 38.04% 61.96% 100.00%
Frequency 86 150 236 Total Percent 36.44% 63.56% 100.00%

28
Table 29: Expenditure on Produce per Month by Age
Age Distribution Expenditure on Produce (dollars) 0-20 21-35 36-50 51-65
65 and Above Total
Frequency 1 6 7 7 7 28 0-20 Percent 3.57% 21.43% 25.00% 25.00% 25.00% 100.00%
Frequency 0 10 28 19 12 69 20-40 Percent 0.00% 14.49% 40.58% 27.54% 17.39% 100.00%
Frequency 0 4 19 15 8 46 40-60 Percent 0.00% 8.70% 41.30% 32.61% 17.39% 100.00%
Frequency 0 7 41 23 20 91 60-More Percent 0.00% 7.69% 45.05% 25.27% 21.98% 100.00%
Frequency 1 27 95 64 47 234 Total Percent 0.43% 11.54% 40.60% 27.35% 20.09% 100.00%
Table 30: Expenditure on Produce per Month by Education
Educational Levels
Expenditure on Produce (dollars)
No Formal
Schooling
Up to High
School
2/4 College Degree
Post Graduate Total
Frequency 1 6 18 3 28 0-20 Percent 3.57% 21.43% 64.29% 10.71% 100.00%
Frequency 0 32 24 13 69 20-40 Percent 0.00% 46.38% 34.78% 18.84% 100.00%
Frequency 0 19 15 13 47 40-60 Percent 0.00% 40.43% 31.91% 27.66% 100.00%
Frequency 0 33 35 22 90 60-More Percent 0.00% 36.67% 38.89% 24.44% 100.00%
Frequency 1 90 92 51 234 Total Percent 0.43% 38.46% 39.32% 21.79% 100.00%
29
Table 31: Expenditure on Produce per Month by Occupation
Occupation Expenditure on Produce (dollars) Retired
Self-employed
Employed by others Homemaker Others Total
Frequency 4 2 16 3 3 28 0-20 Percent 14.29% 7.14% 57.14% 10.71% 10.71% 100.00%
Frequency 18 5 38 7 1 69 20-40 Percent 26.09% 7.25% 55.07% 10.14% 1.45% 100.00%
Frequency 9 10 16 9 2 46 40-60 Percent 19.57% 21.74% 34.78% 19.57% 4.35% 100.00%
Frequency 18 14 45 10 4 91 60-More Percent 19.78% 15.38% 49.45% 10.99% 4.40% 100.00%
Frequency 49 31 115 29 10 234 Total Percent 20.94% 13.25% 49.15% 12.39% 4.27% 100.00%
Furthermore, as expected, respondents with higher income spent more on
produce than respondents with relatively lower income (see Table 32). Finally, as
expected, married respondents spent the most on produce, followed by divorced
respondents. Single and widowed respondents spent the least on produce (see Table
33).
Table 32: Expenditure on Produce per Month by Income
Income (dollars) Expenditure on Produce (dollars)
Up to 20,000
20,000-39,000
40,000-59,000
60,000-79,000
80,000-99,000
100,000 - More Total
Frequency 3 6 6 3 3 4 25 0-20 Percent 12.00% 24.00% 24.00% 12.00% 12.00% 16.00% 100.00%
Frequency 8 10 9 14 4 15 60 20-40 Percent 13.33% 16.67% 15.00% 23.33% 6.67% 25.00% 100.00%
Frequency 2 8 9 3 6 16 44 40-60 Percent 4.55% 18.18% 20.45% 6.82% 13.64% 36.36% 100.00%
Frequency 7 11 14 7 9 36 84 60-More Percent 8.33% 13.10% 16.67% 8.33% 10.71% 42.86% 100.00%
Frequency 20 35 38 27 22 71 213 Total Percent 9.39% 16.43% 17.84% 12.68% 10.33% 33.33% 100.00%

30
Table 33: Expenditure on Produce per Month by Marital Status
Marital Status Expenditure on Produce (dollars) Single Separate
Widower (d) Divorced Married Other Total
Frequency 7 0 4 5 11 1 28 0-20 Percent 25.00% 0.00% 14.29% 17.86% 39.29% 3.57% 100.00%
Frequency 12 1 9 5 40 1 68 20-40 Percent 17.65% 1.47% 13.24% 7.35% 58.82% 1.47% 100.00%
Frequency 3 0 1 5 39 0 48 40-60 Percent 6.25% 0.00% 2.08% 10.42% 81.25% 0.00% 100.00%
Frequency 6 1 9 7 64 4 91 60-More Percent 6.59% 1.10% 9.89% 7.69% 70.33% 4.40% 100.00%
Frequency 28 2 23 22 154 6 235 Total Percent 11.91% 0.85% 9.79% 9.36% 65.53% 2.55% 100.00%
Figure 6 exhibits consumer behavior with regard to farmers markets. Seventy-
eight percent of New Jersey consumers surveyed indicated that they visit farmers
markets.
Figure 6. Consumers Visiting Farmers Markets
How often do you visit Farmers’ Markets?
More than once a week
9%Once in a month22%
Once in a Week22%
Never22%
Less than once a month
25%

31
Thirty-one percent said they visit farmers markets at least once per week, while
22% said they visit farmers markets once per month. Only 22% of those surveyed said
they never visit a farmer’s market.
Characteristics of Survey Respondents As Figure 7 shows, 72% of survey respondents considered lived in suburban
neighborhoods, 15% lived in rural areas, and 13% lived in urban areas. More than 50%
of survey respondents have lived in New Jersey for at least 35 years.
Figure 7. Distribution of Respondents by Location Type
When asked the question, “Do you believe it is necessary to maintain open
space/greenery in New Jersey”, 98% of respondents responded yes and only 2%
responded negatively. Furthermore, 95% believe that agriculture will help maintain
open space/greenery in New Jersey.
Sixty-three percent of survey respondents were female. The average family size
of survey respondents was 2.84 and the average number of children per household was
0.66. As Table 34 shows, 39% of the survey respondents were between 36 and 50
years of age, and 50% were under the age of 50.
Fig 7: Distribution of Respondents by Location
Urban13%
Rural15%
Suburban72%

32
Table 34: Age Distribution of Survey Respondents
Age Distribution Frequency PercentageLess than 20 1 0.3221-35 34 10.9036-50 121 38.7851-65 84 26.92Over 65 72 23.08Total 312 100.00
As Table 35 shows, 61% of respondents were either employed or self-employed,
while 24% were retired, and 12% were homemakers.
Table 35: Distribution of Survey Respondents by Occupation
Occupation Frequency Percentage Employed by others 149 48.06Retired 73 23.55Self-employed 39 12.58Homemaker 38 12.26Other 11 3.55Total 310 100.00
Eighty-four percent of respondents were Caucasian, 6% were Hispanic (or Latino), 4%
were African American, and 4% were Asian. See Table 36 for a further breakdown of
respondents by ethnicity.
Table 36: Distribution of Survey Respondents by Ethnicity Occupation Frequency Percentage
Caucasian 259 83.82Hispanic or Latino 17 5.50African American 12 3.88Asian 12 3.88Others 7 2.28American Indian and Alaska Native 1 0.32Native Hawaiian and other Pacific 1 0.32Total 309 100.00

33
The majority of respondents had household income above $60,000 per year (see Table
37). Thirty-one percent of respondents earned more than $100,000 per year.
Table 37: Distribution of Survey Respondents by Income Level
Income Group (in dollars) Frequency Percentage
Less than 20,000 30 10.8320,000-39,000 47 16.9740,000-59,000 46 16.6060,000-79,000 38 13.7280,000-99,000 29 10.47100,000 or more 87 31.41Total 160 57.76
Sixty-six percent of respondents were married, 12% of respondents were single, 10%
were widowed, and 9% were divorced (see Table 38).
Table 38: Distribution of Survey Respondents by Marital Status
Marital Status Frequency Percentage
Married 205 66.13Single 36 11.61Widower 30 9.68Divorced 28 9.03Other 8 2.58Separated 3 0.97Total 310 100.00

34
Conclusions The results of the survey indicate that the Jersey Fresh promotional program has
been effective in creating brand awareness among New Jersey consumers. The study
also confirmed that consumer are willing to purchase Jersey Fresh produce if available.
Females were more likely to be aware of Jersey Fresh, as were married people.
Consumers reported seeing the Jersey Fresh logo most frequently on in-store produce
displays. Moreover, consumers associate the Jersey Fresh logo with locally grown,
quality produce.
Increasing the availability of Jersey Fresh produce during the production seasons
would ensure continued consumer patronage. Also, increasing promotions of Jersey
Fresh produce in supermarkets may further increase the popularity of Jersey Fresh
produce. Moreover, the study showed that a majority of consumers were willing to pay
only a small percentage premium for Jersey Fresh produce over the market prices for
other fresh produce.
Survey participants believed Jersey Fresh produce to be better than produce in
other states and counties in terms of quality and freshness. This research may lead to
better understanding of New Jersey consumers’ shopping behavior, their preferences
towards local produce and their demographic composition. These findings may be
especially encouraging to those developing marketing strategies for Jersey Fresh
produce or for other similar consumer products in the state of New Jersey.

35
Selected Readings and References
Adelaja, A. O. and R. G. Brumfield. 1992. “Research Note on Equity and Ethics in State Promotion of Agricultural Products”. Journal of Agricultural and Environmental Ethics, 4:82-88.
Adelaja, A. O. and R. G. Brumfield. 1990. “Product Differentiation and State Promotion of Farm
Produce: An Analysis of the Jersey Fresh Tomato”. Journal of Food Distribution Research, 21:73-85.
Adelaja, A.O., R.G. Brumfield, and K. Lininger, "Product Differentiation and State Promotion of
Farm Produce: An Analysis of the Jersey Fresh Tomato", Journal of Food Distribution Research, 21(1990):73-85.
Adelaja, A. O., R. M. Nayga, Jr., and Brian Schilling. 1994. “Returns to the Jersey Fresh
Promotional Program: An Econometric Analysis of the Effects of Promotion Expenditures on Agricultural Cash Receipts in New Jersey”. NJAES Pub. No. SR-02134-1-94, April 1994.
Alston, J., and James, J. 2002. “Beggar-thy-Neighbor Aspects of Generic Commodity
Promotion Programs.” NICPRE Quarterly, Vol. 8, No. 2. Blisard, N. 1997. Generic Dairy Advertising: How Effective? Food and Marketing, Economic
Research Service, USDA, January-February 1997. Capps, O., Besssler, D., and Williams, G. 2003. Evaluating the Economic Impacts Associated
with Advertising Efforts of the Florida Department of Citrus. Report prepared by Forecasting and Business Analytics, LLC for the Advertising Review Committee of the Florida Department of Citrus.
Gallup Organization, Inc., “Awareness of and Attitude Toward Jersey Fresh Program,”
Princeton, New Jersey, 1988. Govindasamy, R., A. Pingali, J. Italia, and D. Thatch. 1998. “Consumer Response to State-
Sponsored Marketing Programs: The Case of Jersey Fresh.” NJAES Pub. No. P-02137-2-98, February 1998.
Halloran, J. M. and M. V. Martin. 1989. “Should States be in the Agricultural Promotion Business?” Journal of Agribusiness, 5:65-74. Kaiser, H .M., D. J. Liu, T. D. Mount and O. D. Forker. 1992. Impacts of Dairy Promotion from
Consumer Demand to Farm Supply”, in Commodity Advertising and Promotion, eds. H. W. Kinnucan, S. R. Thompson and H. S. Chang, Iowa State University Press.
Kinnucan, H. W. 1986. Demographic Versus Media Advertising Effects on Milk Demand: The
Case of the New York City Market”. Northeastern Journal of Agricultural and Resource Economics, 15:66-74.

36
Kinnucan, H. W. and O. D. Forker. 1986. “Seasonality in the Consumer Response to Milk
Advertising with Implications for Milk Promotion Policy”. American Journal of Agricultural Economics, 68:562-71.
New Jersey Department of Agriculture, New Jersey Agricultural Statistics Service. New Jersey
Annual Report and Agricultural Statistics, Trenton, New Jersey, (various years). Patterson, P., Burkink, T., Lipsey, R., Lipsey, J., Roth, R., and Martin, M. (2003). Targeting
Tourists with State Branding Programs. Agribusiness, Vol 19 (4), 525-538. Richards, T., and Patterson P. 1998. New Varieties and the Returns to Commodity Promotion:
Washington Fuji Apples. Morrison School of Agribusiness and Resource Management Working Paper Series, Arizona State University, MSABR 98-02.
Thompson, S. R. and D. A. Eiler. 1975. “Producer Returns from Increased Milk Advertising”. American Journal of Agricultural Economics, 57:505-08.
Ward, R. W., J. Chang and S. Thompson. 1985. “Commodity Advertising: Theoretical Issues
Relating to Generic Brand Promotions”. Journal of Agribusiness, 1:269-76. Ward, R. W. and B. L. Dixon. 1989. “Effectiveness of Milk Advertising Since the Dairy and
Tobacco Adjustment Act of 1983". American Journal of Agricultural Economics, 71:730-40.
Waugh, F. V. 1959. “Needed Research on the Effectiveness of Farm Products Promotions”.
Journal of Farm Economics, 41:364-76. Wolf, A. F. 1944. “Measuring the Effects of Agricultural Advertising”. Journal of Farm
Economics, 26:327-47. Zeldis Research Associates, “Jersey Fresh Tracking Study”, submitted to Wenzel and
Associates on Behalf of the New Jersey Department of Agriculture, November 1993. Zeldis Research Associates, “Jersey Fresh Tracking Study”, submitted to Wenzel and
Associates on Behalf of the New Jersey Department of Agriculture, December 1995.

Rutgers Cooperative Extension Department of Agricultural, Food and Resource Economics
Food Policy Institute N.J. Agricultural Experiment Station
Rutgers, The State University of New Jersey, New Brunswick
© Rutgers, The State University of New Jersey, an equal opportunity, affirmative action institution.