Embed Size (px)
Citation preview
Consumer awareness and understanding of alcohol pregnancy warning labels
Research Report
28/10/2016
Project commissioned: 10 May 2016
Final report received: 30 September 2016
Provider: Colmar Brunton, Social Research Agency
ISBN: 978-1-927303-87-0
Citation: Rout, J. Hannan, T. (2016). Consumer awareness and understanding of alcohol pregnancy
warning labels. Wellington: Health Promotion Agency
Prepared for the Health Promotion Agency by:
Colmar Brunton, Social Research Agency
This document is available at: www.hpa.org.nz
Any queries regarding this report should be directed to HPA at the following address:
Cath Edmondson, General Manager, Research, Policy and Advice
Health Promotion Agency
PO Box 2142
Wellington 6140
New Zealand
www.hpa.org.nz
27/10/2016
COMMISSIONING CONTACT’S COMMENTS
ACKNOWLEDGEMENTS
HPA would like to thank those respondents who took the time to participate in this research.
COPYRIGHT
The copyright owner of this publication is HPA. HPA permits the reproduction of material from this
publication without prior notification, provided that fair representation is made of the material and
HPA is acknowledged as the source.
DISCLAIMER
This research has been carried out by an independent party under contract to HPA. The views,
observations and analysis expressed in this report are those of the authors and are not to be
attributed to HPA.
Prepared by Colmar Brunton | 28-Oct-16
Consumer awareness and understanding
of alcohol pregnancy warning labels
FINAL RESEARCH REPORT
Organisation: Health Promotion Agency
Attention: Fiona Imlach
From: Jocelyn Rout and Tim Hannan
Date: 30 September 2016
Consumer awareness and understanding of alcohol pregnancy warning labels
Prepared by Colmar Brunton | 28-Oct-16
Table of Contents
Executive summary ........................................................................................................................................................ 1
Background and objectives ............................................................................................................................................ 5
Research method ........................................................................................................................................................... 7
Awareness of alcohol pregnancy warning labels ....................................................................................................... 10
Effectiveness of labels on message clarity .................................................................................................................. 22
Effectiveness of colour ................................................................................................................................................. 26
General attitudes towards drinking ............................................................................................................................. 27
Appendix A: detailed results on recall of warning messages ..................................................................................... 30
Appendix B: Sample profiles ........................................................................................................................................ 34
Appendix C: Calculation of risk of alcohol dependency ............................................................................................. 36
Appendix D: Demographic analysis ............................................................................................................................. 37
Appendix E: Questionnaire .......................................................................................................................................... 41
Consumer awareness and understanding of alcohol pregnancy warning labels
Prepared by Colmar Brunton | 28-Oct-16 Page | 1
Executive summary
This section summarises the key purpose, findings, and conclusions of the research.
Background and objectives
Australia and New Zealand are to reconsider in 2017 whether to introduce mandatory warning labels on alcohol
containers that advise of the risks of drinking while pregnant or trying to become pregnant. Heath Promotion
Agency (HPA) commissioned Colmar Brunton to undertake an online survey of consumers so there will be some
New Zealand based consumer research to take into account.
The purpose of the research is to assess the effectiveness of the current alcohol pregnancy warning labelling
scheme, focusing on:
Recall and awareness of the labelling on alcohol products by consumers
o How many people are aware or recall a label unprompted
o How many people are aware or recall a label when prompted
Reading and comprehension, or what consumers understand from current pregnancy warning labels
o Does the current label (text versus pictogram) convey the message ‘Don’t drink if you are
pregnant’?
o Is the pictogram compared to text better or worse at conveying this message?
o Has the label had any effect on raising awareness, prompting conversations, changing
behaviour?
Research method
An online survey of 1,488 consumers was carried out from 7-29 June, 2016. The total sample includes 387
women aged 18-34 years (‘young women’) and 388 women with children under 15 years (‘women with
children’). From a recent survey of alcohol producers in New Zealand, the most commonly used pregnancy
warning labels were the ‘pregnant lady’ pictogram and the DrinkWise text (‘It is safest not to drink while
pregnant’).1 An alternative text (‘Don’t drink pregnant’)2 was also tested.
Key findings
The research findings are summarised below using five criteria that research literature recommends for
assessing the effectiveness of warning labels: attention, recall of the message, reading and comprehension,
judgement of the product’s risks and hazards, and behavioural compliance with the message.
1: Attention (the ability to attract the attention of the consumer) and 2: Recall of the message
Few consumers recall pregnancy warning labels without prompting, but with visual prompting more than four in
ten consumers recall at least one of the three alcohol pregnancy warning labels tested.
Unprompted recall of pregnancy warning labels on alcohol products sits at 3%, and increases to 10% once
respondents are asked to consider labels seen on alcohol products.
With visual prompting of three labels (see chart overleaf), awareness is highest for the DrinkWise text,
followed closely by the pictogram. Additional analysis shows that more than four in ten consumers
1 Ministry for Primary Industries. (2014). Evaluation of voluntary pregnancy labelling on alcohol products in New Zealand. MPI Technical Paper 2014/17. Wellington: Ministry for Primary Industries 2 ‘Don’t drink pregnant’ is an optional text that can be used in conjunction with the pictogram by DB (as part of The HEINEKEN Company) although only the pictogram is used in New Zealand
Consumer awareness and understanding of alcohol pregnancy warning labels
Prepared by Colmar Brunton | 28-Oct-16 Page | 2
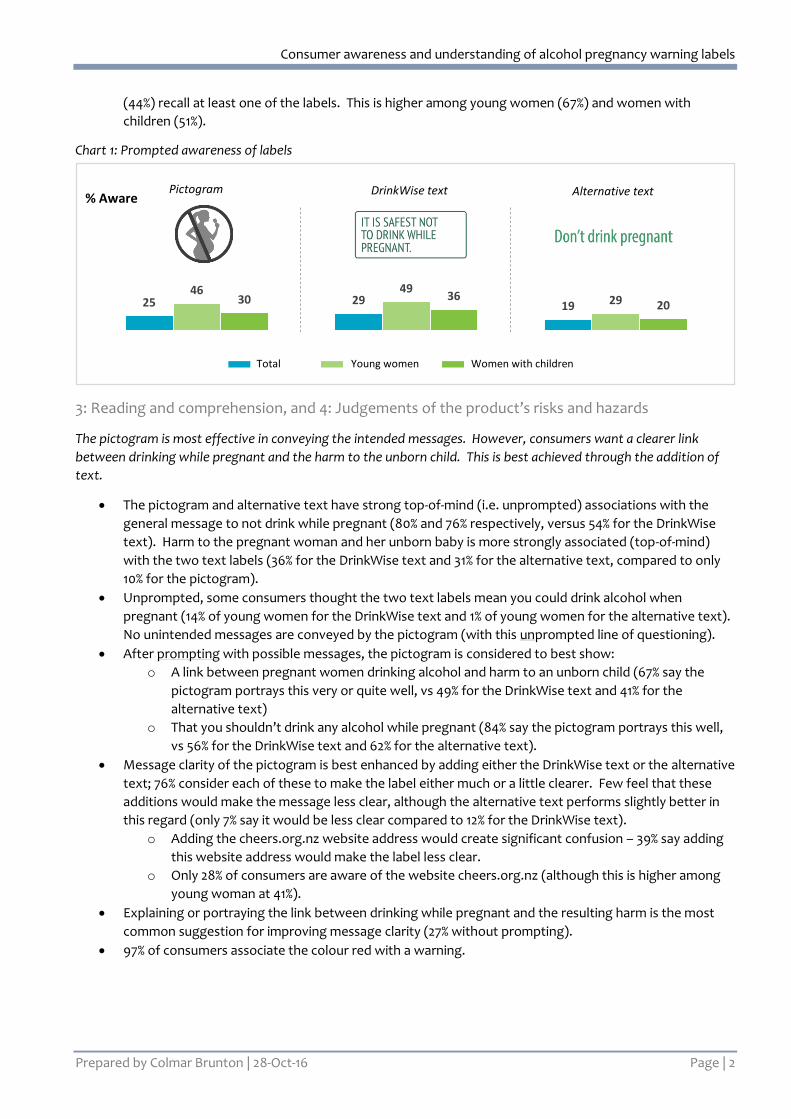
(44%) recall at least one of the labels. This is higher among young women (67%) and women with
children (51%).
Chart 1: Prompted awareness of labels
3: Reading and comprehension, and 4: Judgements of the product’s risks and hazards
The pictogram is most effective in conveying the intended messages. However, consumers want a clearer link
between drinking while pregnant and the harm to the unborn child. This is best achieved through the addition of
text.
The pictogram and alternative text have strong top-of-mind (i.e. unprompted) associations with the
general message to not drink while pregnant (80% and 76% respectively, versus 54% for the DrinkWise
text). Harm to the pregnant woman and her unborn baby is more strongly associated (top-of-mind)
with the two text labels (36% for the DrinkWise text and 31% for the alternative text, compared to only
10% for the pictogram).
Unprompted, some consumers thought the two text labels mean you could drink alcohol when
pregnant (14% of young women for the DrinkWise text and 1% of young women for the alternative text).
No unintended messages are conveyed by the pictogram (with this unprompted line of questioning).
After prompting with possible messages, the pictogram is considered to best show:
o A link between pregnant women drinking alcohol and harm to an unborn child (67% say the
pictogram portrays this very or quite well, vs 49% for the DrinkWise text and 41% for the
alternative text)
o That you shouldn’t drink any alcohol while pregnant (84% say the pictogram portrays this well,
vs 56% for the DrinkWise text and 62% for the alternative text).
Message clarity of the pictogram is best enhanced by adding either the DrinkWise text or the alternative
text; 76% consider each of these to make the label either much or a little clearer. Few feel that these
additions would make the message less clear, although the alternative text performs slightly better in
this regard (only 7% say it would be less clear compared to 12% for the DrinkWise text).
o Adding the cheers.org.nz website address would create significant confusion – 39% say adding
this website address would make the label less clear.
o Only 28% of consumers are aware of the website cheers.org.nz (although this is higher among
young woman at 41%).
Explaining or portraying the link between drinking while pregnant and the resulting harm is the most
common suggestion for improving message clarity (27% without prompting).
97% of consumers associate the colour red with a warning.
% Aware
25 29 1946 49
2930 3620
Total Young women Women with children
Pictogram DrinkWise text Alternative text
Consumer awareness and understanding of alcohol pregnancy warning labels
Prepared by Colmar Brunton | 28-Oct-16 Page | 3
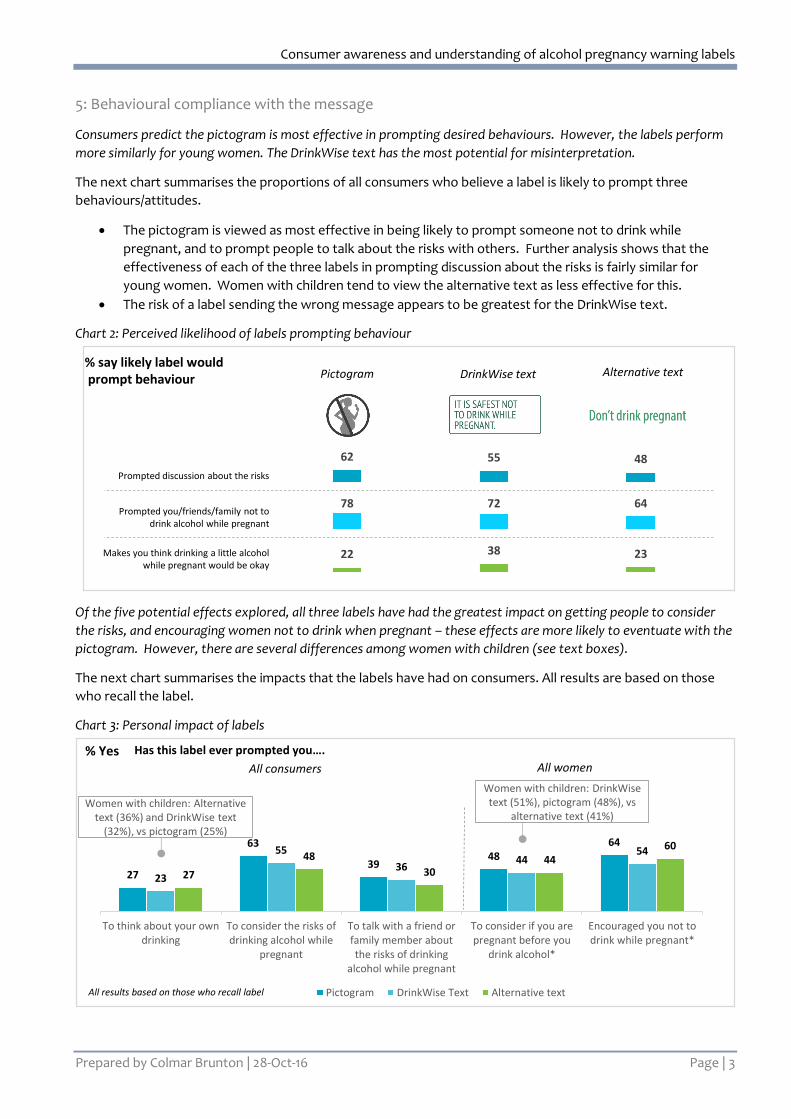
5: Behavioural compliance with the message
Consumers predict the pictogram is most effective in prompting desired behaviours. However, the labels perform
more similarly for young women. The DrinkWise text has the most potential for misinterpretation.
The next chart summarises the proportions of all consumers who believe a label is likely to prompt three
behaviours/attitudes.
The pictogram is viewed as most effective in being likely to prompt someone not to drink while
pregnant, and to prompt people to talk about the risks with others. Further analysis shows that the
effectiveness of each of the three labels in prompting discussion about the risks is fairly similar for
young women. Women with children tend to view the alternative text as less effective for this.
The risk of a label sending the wrong message appears to be greatest for the DrinkWise text.
Chart 2: Perceived likelihood of labels prompting behaviour
Of the five potential effects explored, all three labels have had the greatest impact on getting people to consider
the risks, and encouraging women not to drink when pregnant – these effects are more likely to eventuate with the
pictogram. However, there are several differences among women with children (see text boxes).
The next chart summarises the impacts that the labels have had on consumers. All results are based on those
who recall the label.
Chart 3: Personal impact of labels
% say likely label wouldprompt behaviour
62 55 48
Prompted discussion about the risks
Prompted you/friends/family not to drink alcohol while pregnant
Makes you think drinking a little alcohol while pregnant would be okay
78 72 64
22 38 23
Pictogram DrinkWise text Alternative text
% Yes
27
63
3948
64
23
55
3644
54
27
48
3044
60
To think about your owndrinking
To consider the risks ofdrinking alcohol while
pregnant
To talk with a friend orfamily member aboutthe risks of drinking
alcohol while pregnant
To consider if you arepregnant before you
drink alcohol*
Encouraged you not todrink while pregnant*
Pictogram DrinkWise Text Alternative text
Has this label ever prompted you….
All consumers All women
Women with children: Alternative text (36%) and DrinkWise text
(32%), vs pictogram (25%)
Women with children: DrinkWisetext (51%), pictogram (48%), vs
alternative text (41%)
All results based on those who recall label
Consumer awareness and understanding of alcohol pregnancy warning labels
Prepared by Colmar Brunton | 28-Oct-16 Page | 4
Conclusions
This research highlights the important role of alcohol warning labelling in raising awareness of the risks and
harms of drinking alcohol while pregnant (or when planning a pregnancy). Overall, those who recall the
labelling have a clear understanding of what they mean and many have been prompted by the labels to consider
the risks of drinking while pregnant and, for some, discuss these risks with family and friends.
Recall levels of alcohol pregnancy warning labels should be interpreted with care. Whilst prompted recall levels
are significant, an evaluation of the extent to which the labels are capturing consumers’ attention should be
made in the context of how widespread the labels have been used by the industry (this is being evaluated
separately by the Ministry for Primary Industries). Further, this research did not assess drinking situations or
venues. This is relevant as those drinking from a glass at a venue may not see the bottle.
The pictogram is superior in conveying the intended messages. Having said this, consumers would like the label
to better portray the link between drinking while pregnant and the harm to the unborn child. Combining the
pictogram and text will assist with this, if the text wording is clear, direct and specific. Consumers also identified
the red-coloured pictogram as associated with a warning. The combination of the pictogram with the
cheers.org.nz website was confusing for a significant proportion of consumers.
The DrinkWise text, which is currently used in New Zealand, is misinterpreted by some consumers to mean that
you can drink alcohol in pregnancy. Therefore, it cannot be recommended as an ideal text to accompany a
pictogram. Further research to test possible text options is required.
Consumer awareness and understanding of alcohol pregnancy warning labels
Prepared by Colmar Brunton | 28-Oct-16 Page | 5
Background and objectives
Alcohol is a known teratogen, a substance that can affect the development of the fetus. Drinking alcohol during
pregnancy can cause pregnancy complications (miscarriage, stillbirth or premature birth) and Fetal Alcohol
Spectrum Disorder (FASD). FASD is an umbrella term for the range of physical, behavioural, mental and learning
disabilities that affect a child exposed to alcohol during pregnancy.
The Health Promotion Agency (HPA) is undertaking a programme of work to reduce drinking during pregnancy.
This includes primary prevention strategies that raise awareness of the risks of drinking during pregnancy
among the general public or women of child-bearing age.3 Labelling of alcohol beverages is one of those
primary prevention strategies.4
HPA (formerly as ALAC) lodged an application with Food Standards Australia New Zealand (FSANZ) in 2006 to
introduce mandatory warning labels on alcohol containers in New Zealand that advise of the risks of drinking
while pregnant or trying to become pregnant. This application is currently on hold while a trial of voluntary
labelling is underway.
In 2011, an independent review of Food Labelling Law and Policy for Australia and New Zealand recommended
that warnings about drinking alcohol while pregnant should be mandated on labels on alcohol containers.5 At
this time, the Forum of Australian and New Zealand Food Ministers (the Forum) agreed to allow the alcohol
industry two years for a trial of voluntary labelling. Since then, two separate evaluations of labelling uptake
were undertaken in New Zealand (Ministry for Primary Industries, 2014) and Australia (Siggins & Miller, 2014)6. In
New Zealand, the percentage of products with some sort of pregnancy warning (pictogram or text) ranged
from 32% for spirits to 62% for RTDs (ready to drink premixed spirit drinks). In this report, most alcohol producers
indicated they would provide labelling by 2015-2016. The Forum extended the voluntary labelling trial for
another two years in 2014. An interim survey undertaken by the Ministry for Primary Industries in the second
part of 2015 indicates that this has increased: for example, beer labelling increased from 57% in 2014 to 87% in
2015. Ministry for Primary Industries (MPI) is undertaking further evaluation of labelling uptake in 2016. This will
be used to inform decisions about continuation of voluntary labelling or introducing some level of regulation.
HPA has commissioned Colmar Brunton to undertake an online survey of consumers so there will be some New
Zealand based consumer research to take into account when the alcohol pregnancy warning label issue is
reconsidered in 2017.
Evidence suggests that alcohol warning labels alone are unlikely to reduce risky drinking during pregnancy.
However, they can increase awareness and promote conversations about the risks of drinking during pregnancy
and may contribute to a shift in the drinking culture (Thomas, Gonneau, Poole, & Cook, 2014) 7(Wilkinson et al.,
2009)8(Petticrew et al., 2016)9. One of HPA’s goals is to promote consistent, standardized clear messages to
encourage women to stop drinking if they are pregnant, trying to get pregnant or possibly pregnant. Having a
3 Secondary prevention strategies include supporting health professionals to routinely perform alcohol screening and brief intervention for women
of child-bearing age; tertiary prevention strategies include supporting services that target and treat women at highest risk of having an alcohol-exposed pregnancy. 4 The other major primary prevention activity that HPA is undertaking is the Don’t Know Don’t Drink campaign. 5 The independent Panel for the Review of Food Labelling Law and Policy (2011) Labelling Logic – The Final Report of the Review of Food Labelling Law and Policy http://www.foodlabellingreview.gov.au/internet/foodlabelling/publishing.nsf/content/labelling-logic 6 Available from http://www.health.gov.au/internet/main/publishing.nsf/content/foodsecretariat-stakeholder-publications. 7 Thomas, G., Gonneau, G., Poole, N., & Cook, J. (2014). The effectiveness of alcohol warning labels in the prevention of Fetal Alcohol Spectrum
Disorder: A brief review. The International Journal of Alcohol and Drug Research, 3(1), 91. http://doi.org/10.7895/ijadr.v3i1.126 8 Wilkinson, C., Allsop, S., Cail, D., Chikrizhs, T., Daube, M., Kirby, G., & Mattick, R. (2009). Alcohol Warning Labels: Evidence of impact on alcohol
consumption amongst women of childbearing age. New South Wales. 9 Petticrew, M., Douglas, N., Knai, C., Durand, M. A., Eastmure, E., & Mays, N. (2016). Health information on alcoholic beverage containers: has the alcohol industry’s pledge in England to improve labelling been met? Addiction (Abingdon, England), 111(1), 51–5. http://doi.org/10.1111/add.13094
Consumer awareness and understanding of alcohol pregnancy warning labels
Prepared by Colmar Brunton | 28-Oct-16 Page | 6
clear, unambiguous and obvious warning on all alcohol containers helps to reinforce these messages from
health professionals and the Don’t know? Don’t drink campaign.
In the research literature, the criteria for assessing the effectiveness of warning labels are:
Attention (the ability to attract the attention of the consumer)
Reading and comprehension
Recall of the message
Judgements of the product’s risks and hazards
Behavioural compliance with the message (Wilkinson et al., 2009).
Research objectives
The purpose of the research is to assess the effectiveness of current alcohol pregnancy warning labelling
scheme, focusing on:
Recall and awareness of the labelling on alcohol products by consumers
o How many people are aware or recall a label unprompted
o How many people are aware or recall a label when prompted
Reading and comprehension, or what consumers understand from current pregnancy warning labels
o Does the current label (text versus pictogram) convey the message ‘Don’t drink if you are
pregnant’?
o Is the pictogram compared to text better or worse at conveying this message?
o Has the label had any effect on raising awareness, prompting conversations, changing
behaviour?
Consumer awareness and understanding of alcohol pregnancy warning labels
Prepared by Colmar Brunton | 28-Oct-16 Page | 7
Research method
This section details the methodological approach used in carrying out the research.
In total 1,488 consumers were surveyed online from 7-29 June, 2016. The total sample includes 387 women aged
18-34 years and 388 women with children under 15 years. Detailed sample profiles are provided in Appendix B.
Questionnaire development
The questionnaire was developed in close consultation with HPA and was cognitively pre-tested10 with four
respondents before being used in field.
A significant advantage of online research is the ability to display images to respondents. Respondents were
presented with images of the labels including ‘in-situ’ on generic bottles.
The average interview length was 12 minutes. The questionnaire is included in Appendix E.
Sampling
Target populations
The target population for this research is adult New Zealanders, with a particular interest in women of child
bearing age (defined as women 18 to 34 years for the purposes of this research) and women with children
(under 15 years).
Sampling approach
All respondents were recruited via Colmar Brunton’s online panel. Respondents were invited to participate via
an email invitation containing a link to the survey.
We recruited a ‘core sample’ representative of the general New Zealand public aged 18 years and over by age,
gender, location, household income and ethnic group (including Māori and Pacific respondents). In addition to
the core sample, to allow separate analysis we collected two booster samples of women aged 18 to 34 years,
and women with children under the age of 15 years. Both drinkers and non-drinkers were surveyed.
Prior to the start of fieldwork we set quotas for age by gender by region, household income by household size,
and ethnicity (including Māori, Pacific and Asian groups)11. Statistics New Zealand population counts were used
for this purpose.
Representativeness of online surveys
This is a non-probability survey designed to provide a representative picture of the target populations. Not all
individuals have internet access in New Zealand (82% of individuals had internet access as at the 2013 Census),
and online panels do not include every member of the target population, so online surveys cannot be said to be
‘truly representative’ of all groups. With this in mind, quotas were applied at the sampling and selection stage,
and the final results have been weighted to be representative of consumers in the target population using
Census data. We are confident the results will provide a reasonable picture of the population.
10 Cognitive pre-testing seeks to understand the cognitive processes respondents undergo in answering the questions. Knowledge of respondents’
thought processes helps researchers to ensure questions are understood in the way they are intended. Cognitive interviewing also provides insight into why respondents came to their answer. A small number of changes were made to the questionnaire following the cognitive pre-testing. 11 All quotas were met or exceeded, with the exception of males 18-29 years. This group is typically less likely to respond to a survey. Weighting
was used to ensure this demographic group contributed to the total sample in line with its prevalence in the target population.
Consumer awareness and understanding of alcohol pregnancy warning labels
Prepared by Colmar Brunton | 28-Oct-16 Page | 8
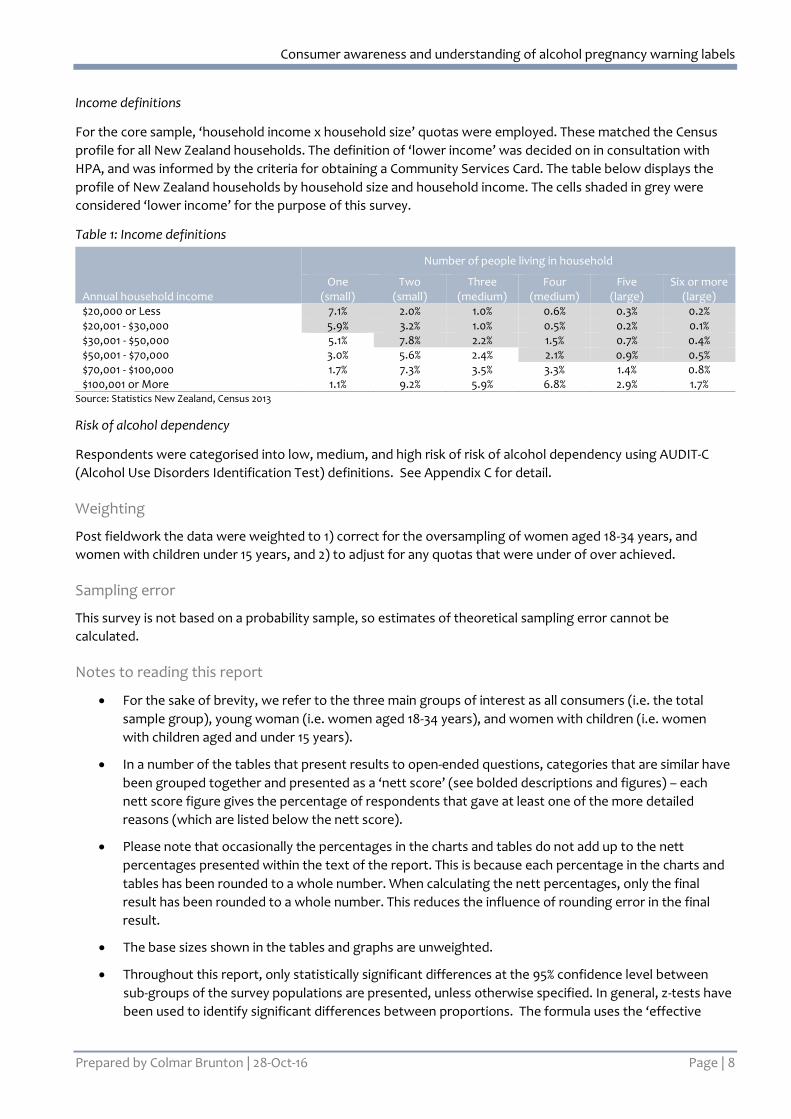
Income definitions
For the core sample, ‘household income x household size’ quotas were employed. These matched the Census
profile for all New Zealand households. The definition of ‘lower income’ was decided on in consultation with
HPA, and was informed by the criteria for obtaining a Community Services Card. The table below displays the
profile of New Zealand households by household size and household income. The cells shaded in grey were
considered ‘lower income’ for the purpose of this survey.
Table 1: Income definitions
Annual household income
Number of people living in household
One (small)
Two (small)
Three (medium)
Four (medium)
Five (large)
Six or more (large)
$20,000 or Less 7.1% 2.0% 1.0% 0.6% 0.3% 0.2% $20,001 - $30,000 5.9% 3.2% 1.0% 0.5% 0.2% 0.1% $30,001 - $50,000 5.1% 7.8% 2.2% 1.5% 0.7% 0.4% $50,001 - $70,000 3.0% 5.6% 2.4% 2.1% 0.9% 0.5% $70,001 - $100,000 1.7% 7.3% 3.5% 3.3% 1.4% 0.8% $100,001 or More 1.1% 9.2% 5.9% 6.8% 2.9% 1.7%
Source: Statistics New Zealand, Census 2013
Risk of alcohol dependency
Respondents were categorised into low, medium, and high risk of risk of alcohol dependency using AUDIT-C
(Alcohol Use Disorders Identification Test) definitions. See Appendix C for detail.
Weighting
Post fieldwork the data were weighted to 1) correct for the oversampling of women aged 18-34 years, and
women with children under 15 years, and 2) to adjust for any quotas that were under of over achieved.
Sampling error
This survey is not based on a probability sample, so estimates of theoretical sampling error cannot be
calculated.
Notes to reading this report
For the sake of brevity, we refer to the three main groups of interest as all consumers (i.e. the total
sample group), young woman (i.e. women aged 18-34 years), and women with children (i.e. women
with children aged and under 15 years).
In a number of the tables that present results to open-ended questions, categories that are similar have
been grouped together and presented as a ‘nett score’ (see bolded descriptions and figures) – each
nett score figure gives the percentage of respondents that gave at least one of the more detailed
reasons (which are listed below the nett score).
Please note that occasionally the percentages in the charts and tables do not add up to the nett
percentages presented within the text of the report. This is because each percentage in the charts and
tables has been rounded to a whole number. When calculating the nett percentages, only the final
result has been rounded to a whole number. This reduces the influence of rounding error in the final
result.
The base sizes shown in the tables and graphs are unweighted.
Throughout this report, only statistically significant differences at the 95% confidence level between
sub-groups of the survey populations are presented, unless otherwise specified. In general, z-tests have
been used to identify significant differences between proportions. The formula uses the ‘effective
Consumer awareness and understanding of alcohol pregnancy warning labels
Prepared by Colmar Brunton | 28-Oct-16 Page | 9
base’.12 Using the effective base reduces the likelihood of statistical tests producing significant results
because of the adjustments made by weighting.
From a recent survey of alcohol producers in New Zealand, the most commonly used pregnancy
warning labels were the ‘pregnant lady’ pictogram and the DrinkWise text (‘It is safest not to drink
while pregnant’).13 An alternative text (‘Don’t drink pregnant’)14 was also tested.
12 The ‘effective base’ is an estimate of the base size after accounting for weighting. It is calculated by dividing the weighted base by the sum of the squared weights. 13 Ministry for Primary Industries. (2014). Evaluation of voluntary pregnancy labelling on alcohol products in New Zealand. MPI Technical Paper 2014/17. Wellington: Ministry for Primary Industries 14 ‘Don’t drink pregnant’ is an optional text that can be used in conjunction with the pictogram by DB (as part of The HEINEKEN Company) although only the pictogram is used in New Zealand
Consumer awareness and understanding of alcohol pregnancy warning labels
Prepared by Colmar Brunton | 28-Oct-16 Page | 10
Awareness of alcohol pregnancy warning messages and labels
This section covers consumers’ recall of alcohol pregnancy warning messages and labels.
Unprompted awareness of pregnancy warning messages
Responses to two questions are used to establish respondents’ unprompted awareness of alcohol pregnancy
warning messages:
Whether respondents had recently heard or seen any messages or warnings about drinking alcohol or
the risks or harms of drinking alcohol (73% of respondents recalled these types of messages/warnings) –
note, these messages or warning could have been seen anywhere, e.g. from a health professional, or via
the media.
What the messages were about (respondents were asked to describe as much detail as possible).
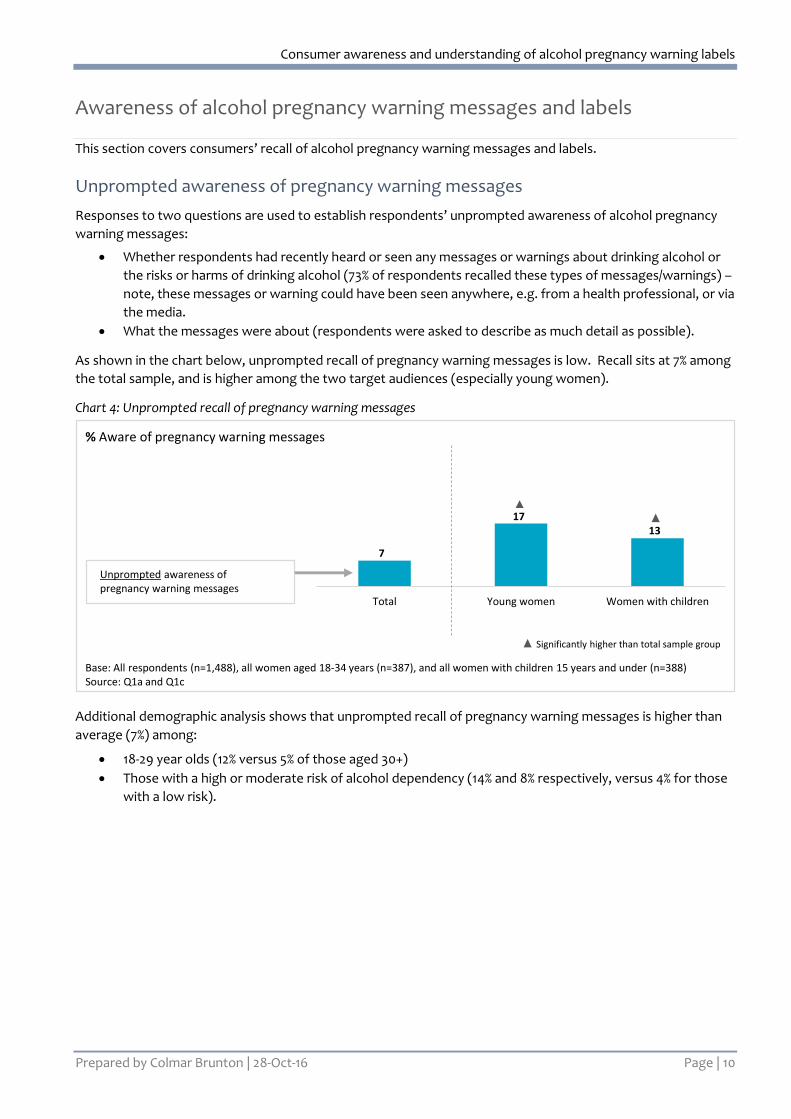
As shown in the chart below, unprompted recall of pregnancy warning messages is low. Recall sits at 7% among
the total sample, and is higher among the two target audiences (especially young women).
Chart 4: Unprompted recall of pregnancy warning messages
Additional demographic analysis shows that unprompted recall of pregnancy warning messages is higher than
average (7%) among:
18-29 year olds (12% versus 5% of those aged 30+)
Those with a high or moderate risk of alcohol dependency (14% and 8% respectively, versus 4% for those
with a low risk).
% Aware of pregnancy warning messages
Unprompted awareness of pregnancy warning messages
Total Young women Women with children
17
7
13
Significantly higher than total sample group
Base: All respondents (n=1,488), all women aged 18-34 years (n=387), and all women with children 15 years and under (n=388)Source: Q1a and Q1c
Consumer awareness and understanding of alcohol pregnancy warning labels
Prepared by Colmar Brunton | 28-Oct-16 Page | 11
Awareness of pregnancy warning labels on alcohol products (without visual
prompting)
The following questions were used to establish respondents’ awareness of alcohol pregnancy warning labels:
Whether respondents had recently heard or seen any messages or warnings about drinking alcohol or
the risks or harms of drinking alcohol
Where respondents had seen or heard the messages and what the messages were about (respondents
were asked to describe as much detail as possible)
Whether respondents had seen messages or warnings about drinking alcohol or the risks or harms of
drinking alcohol on alcohol products, and what they had seen.
Note, whilst respondents were prompted with the question about what they’d seen on alcohol products (last
bullet point above), they were not visually shown the labels at this stage. Recall following visual prompting is
covered in the next section of the report.
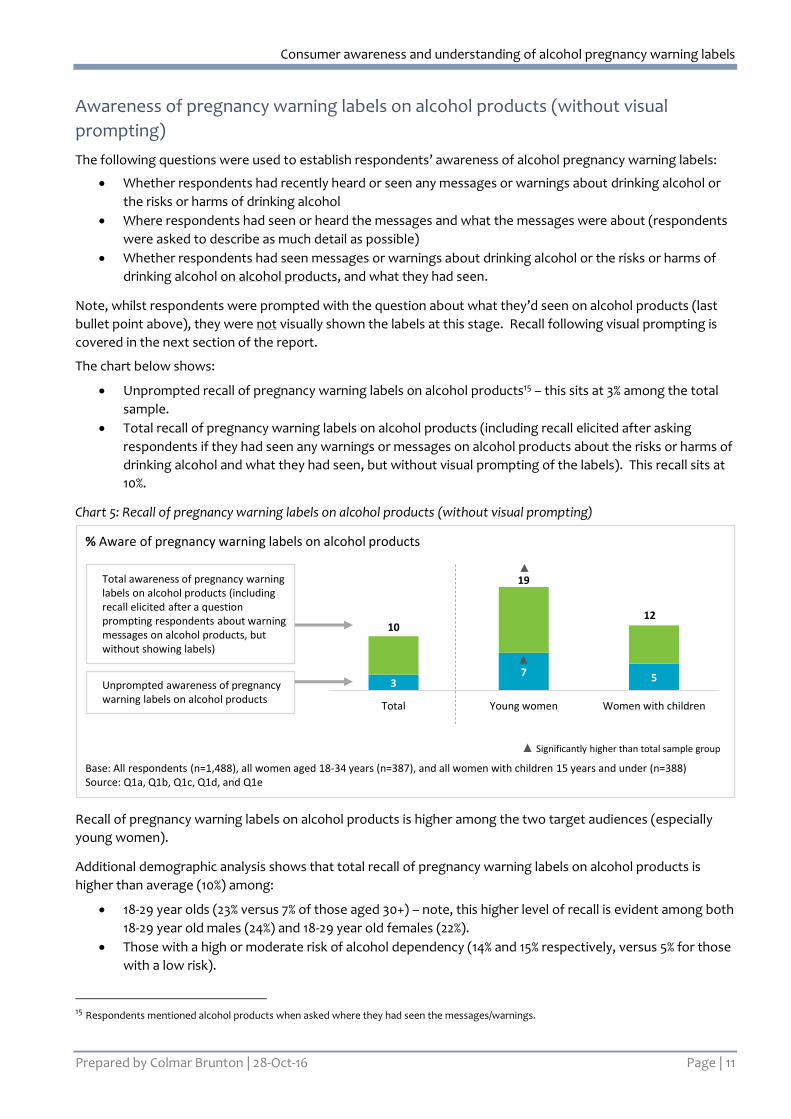
The chart below shows:
Unprompted recall of pregnancy warning labels on alcohol products15 – this sits at 3% among the total
sample.
Total recall of pregnancy warning labels on alcohol products (including recall elicited after asking
respondents if they had seen any warnings or messages on alcohol products about the risks or harms of
drinking alcohol and what they had seen, but without visual prompting of the labels). This recall sits at
10%.
Chart 5: Recall of pregnancy warning labels on alcohol products (without visual prompting)
Recall of pregnancy warning labels on alcohol products is higher among the two target audiences (especially
young women).
Additional demographic analysis shows that total recall of pregnancy warning labels on alcohol products is
higher than average (10%) among:
18-29 year olds (23% versus 7% of those aged 30+) – note, this higher level of recall is evident among both
18-29 year old males (24%) and 18-29 year old females (22%).
Those with a high or moderate risk of alcohol dependency (14% and 15% respectively, versus 5% for those
with a low risk).
15 Respondents mentioned alcohol products when asked where they had seen the messages/warnings.
37 5
Total Young women Women with children
% Aware of pregnancy warning labels on alcohol products
Total awareness of pregnancy warning labels on alcohol products (including recall elicited after a question prompting respondents about warning messages on alcohol products, but without showing labels)
Unprompted awareness of pregnancy warning labels on alcohol products
19
1012
Significantly higher than total sample group
Base: All respondents (n=1,488), all women aged 18-34 years (n=387), and all women with children 15 years and under (n=388)Source: Q1a, Q1b, Q1c, Q1d, and Q1e
Consumer awareness and understanding of alcohol pregnancy warning labels
Prepared by Colmar Brunton | 28-Oct-16 Page | 12
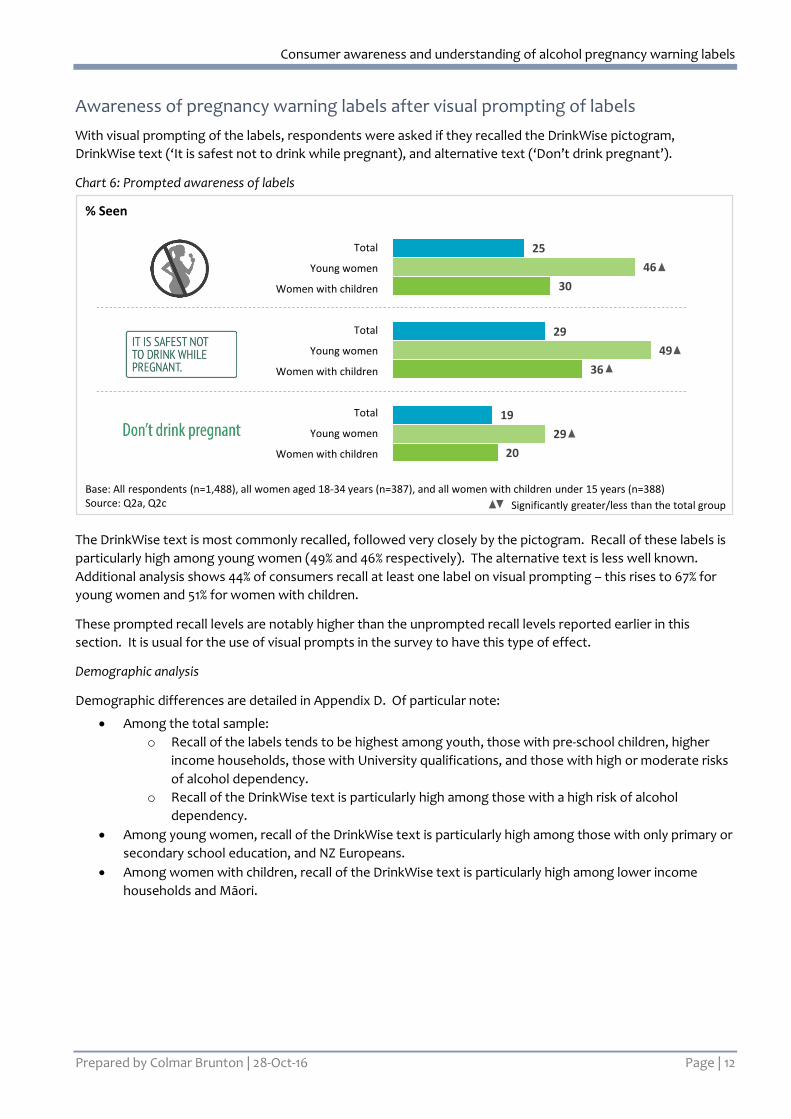
Awareness of pregnancy warning labels after visual prompting of labels
With visual prompting of the labels, respondents were asked if they recalled the DrinkWise pictogram,
DrinkWise text (‘It is safest not to drink while pregnant), and alternative text (‘Don’t drink pregnant’).
Chart 6: Prompted awareness of labels
The DrinkWise text is most commonly recalled, followed very closely by the pictogram. Recall of these labels is
particularly high among young women (49% and 46% respectively). The alternative text is less well known.
Additional analysis shows 44% of consumers recall at least one label on visual prompting – this rises to 67% for
young women and 51% for women with children.
These prompted recall levels are notably higher than the unprompted recall levels reported earlier in this
section. It is usual for the use of visual prompts in the survey to have this type of effect.
Demographic analysis
Demographic differences are detailed in Appendix D. Of particular note:
Among the total sample:
o Recall of the labels tends to be highest among youth, those with pre-school children, higher
income households, those with University qualifications, and those with high or moderate risks
of alcohol dependency.
o Recall of the DrinkWise text is particularly high among those with a high risk of alcohol
dependency.
Among young women, recall of the DrinkWise text is particularly high among those with only primary or
secondary school education, and NZ Europeans.
Among women with children, recall of the DrinkWise text is particularly high among lower income
households and Māori.
Base: All respondents (n=1,488), all women aged 18-34 years (n=387), and all women with children under 15 years (n=388)Source: Q2a, Q2c
% Seen
25
29
19
46
49
29
30
36
20
Total
Young women
Women with children
Total
Young women
Women with children
Total
Young women
Women with children
Significantly greater/less than the total group
Consumer awareness and understanding of alcohol pregnancy warning labels
Prepared by Colmar Brunton | 28-Oct-16 Page | 13
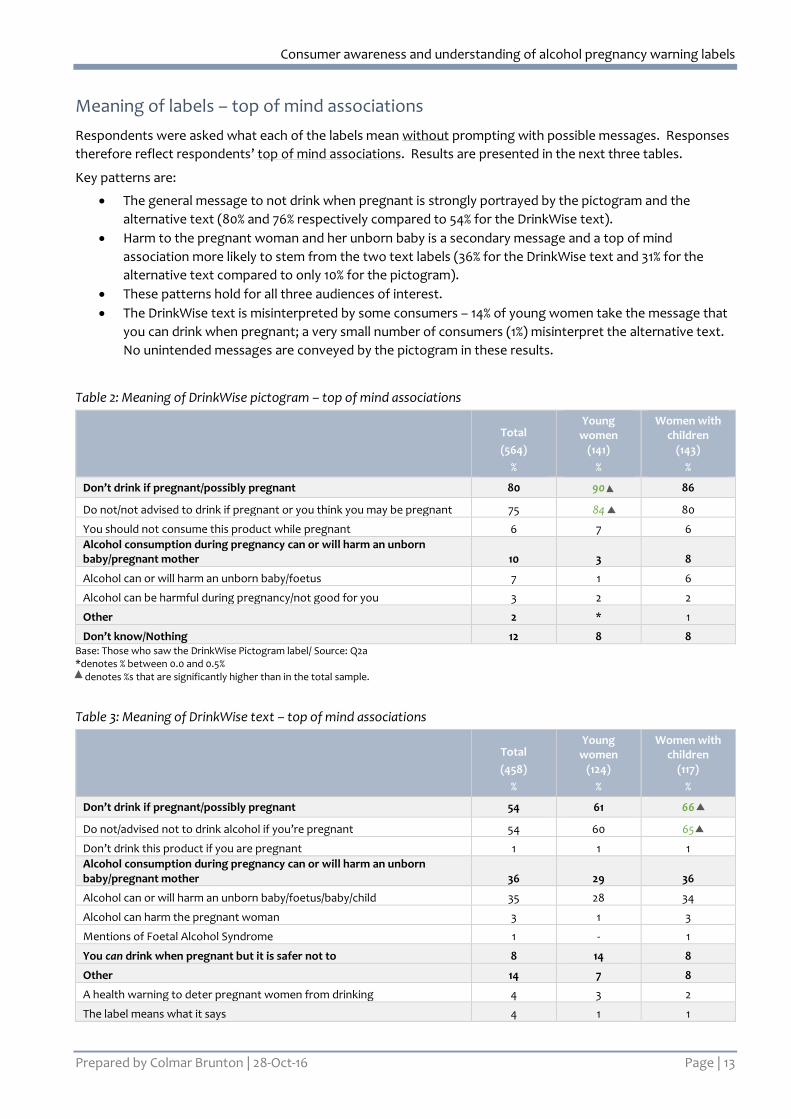
Meaning of labels – top of mind associations
Respondents were asked what each of the labels mean without prompting with possible messages. Responses
therefore reflect respondents’ top of mind associations. Results are presented in the next three tables.
Key patterns are:
The general message to not drink when pregnant is strongly portrayed by the pictogram and the
alternative text (80% and 76% respectively compared to 54% for the DrinkWise text).
Harm to the pregnant woman and her unborn baby is a secondary message and a top of mind
association more likely to stem from the two text labels (36% for the DrinkWise text and 31% for the
alternative text compared to only 10% for the pictogram).
These patterns hold for all three audiences of interest.
The DrinkWise text is misinterpreted by some consumers – 14% of young women take the message that
you can drink when pregnant; a very small number of consumers (1%) misinterpret the alternative text.
No unintended messages are conveyed by the pictogram in these results.
Table 2: Meaning of DrinkWise pictogram – top of mind associations
Total
(564)
%
Young women
(141)
%
Women with children
(143)
%
Don’t drink if pregnant/possibly pregnant 80 90 86
Do not/not advised to drink if pregnant or you think you may be pregnant 75 84 80
You should not consume this product while pregnant 6 7 6
Alcohol consumption during pregnancy can or will harm an unborn baby/pregnant mother 10 3 8
Alcohol can or will harm an unborn baby/foetus 7 1 6
Alcohol can be harmful during pregnancy/not good for you 3 2 2
Other 2 * 1
Don’t know/Nothing 12 8 8 Base: Those who saw the DrinkWise Pictogram label/ Source: Q2a *denotes % between 0.0 and 0.5% denotes %s that are significantly higher than in the total sample.
Table 3: Meaning of DrinkWise text – top of mind associations
Total
(458)
%
Young women
(124)
%
Women with children
(117)
%
Don’t drink if pregnant/possibly pregnant 54 61 66
Do not/advised not to drink alcohol if you’re pregnant 54 60 65
Don’t drink this product if you are pregnant 1 1 1
Alcohol consumption during pregnancy can or will harm an unborn baby/pregnant mother 36 29 36
Alcohol can or will harm an unborn baby/foetus/baby/child 35 28 34
Alcohol can harm the pregnant woman 3 1 3
Mentions of Foetal Alcohol Syndrome 1 - 1
You can drink when pregnant but it is safer not to 8 14 8
Other 14 7 8
A health warning to deter pregnant women from drinking 4 3 2
The label means what it says 4 1 1
Consumer awareness and understanding of alcohol pregnancy warning labels
Prepared by Colmar Brunton | 28-Oct-16 Page | 14
Other 6 3 4
Don’t know/Nothing * * - Base: Those who saw the DrinkWise Text label/ Source: Q2a *denotes % between 0.0 and 0.5% denotes %s that are significantly higher than in the total sample.
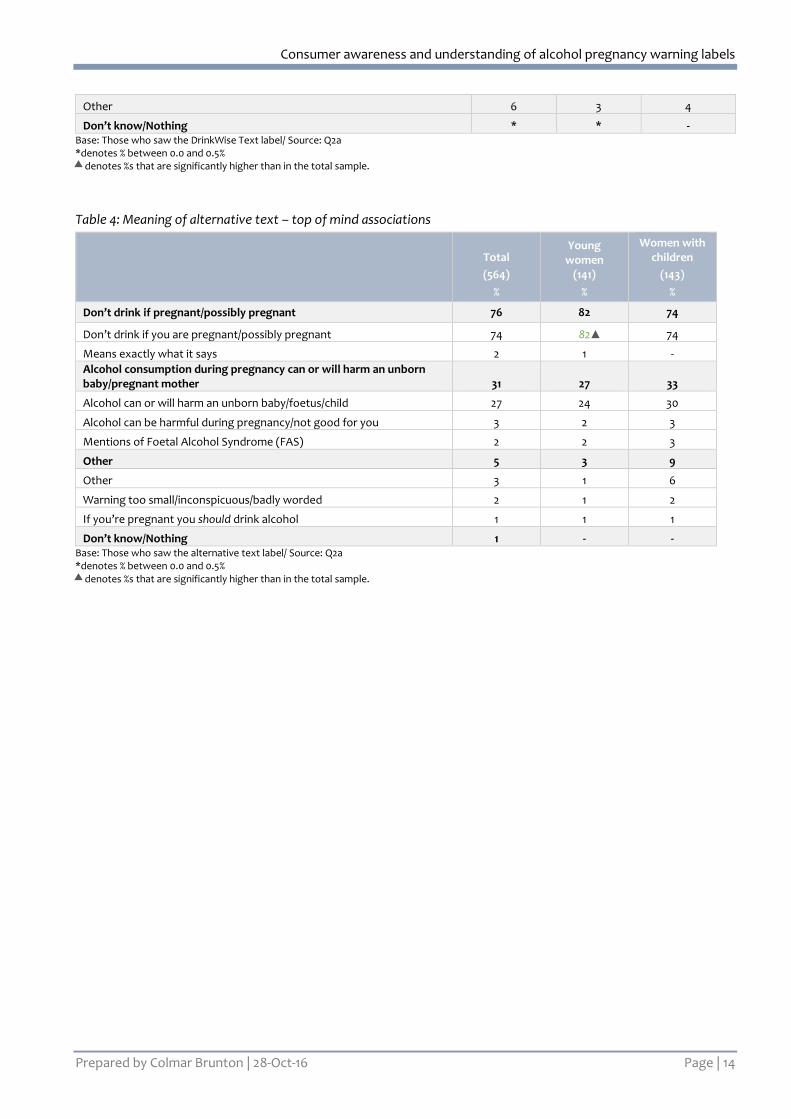
Table 4: Meaning of alternative text – top of mind associations
Total
(564)
%
Young women
(141)
%
Women with children
(143)
%
Don’t drink if pregnant/possibly pregnant 76 82 74
Don’t drink if you are pregnant/possibly pregnant 74 82 74
Means exactly what it says 2 1 -
Alcohol consumption during pregnancy can or will harm an unborn baby/pregnant mother 31 27 33
Alcohol can or will harm an unborn baby/foetus/child 27 24 30
Alcohol can be harmful during pregnancy/not good for you 3 2 3
Mentions of Foetal Alcohol Syndrome (FAS) 2 2 3
Other 5 3 9
Other 3 1 6
Warning too small/inconspicuous/badly worded 2 1 2
If you’re pregnant you should drink alcohol 1 1 1
Don’t know/Nothing 1 - - Base: Those who saw the alternative text label/ Source: Q2a *denotes % between 0.0 and 0.5% denotes %s that are significantly higher than in the total sample.
Consumer awareness and understanding of alcohol pregnancy warning labels
Prepared by Colmar Brunton | 28-Oct-16 Page | 15
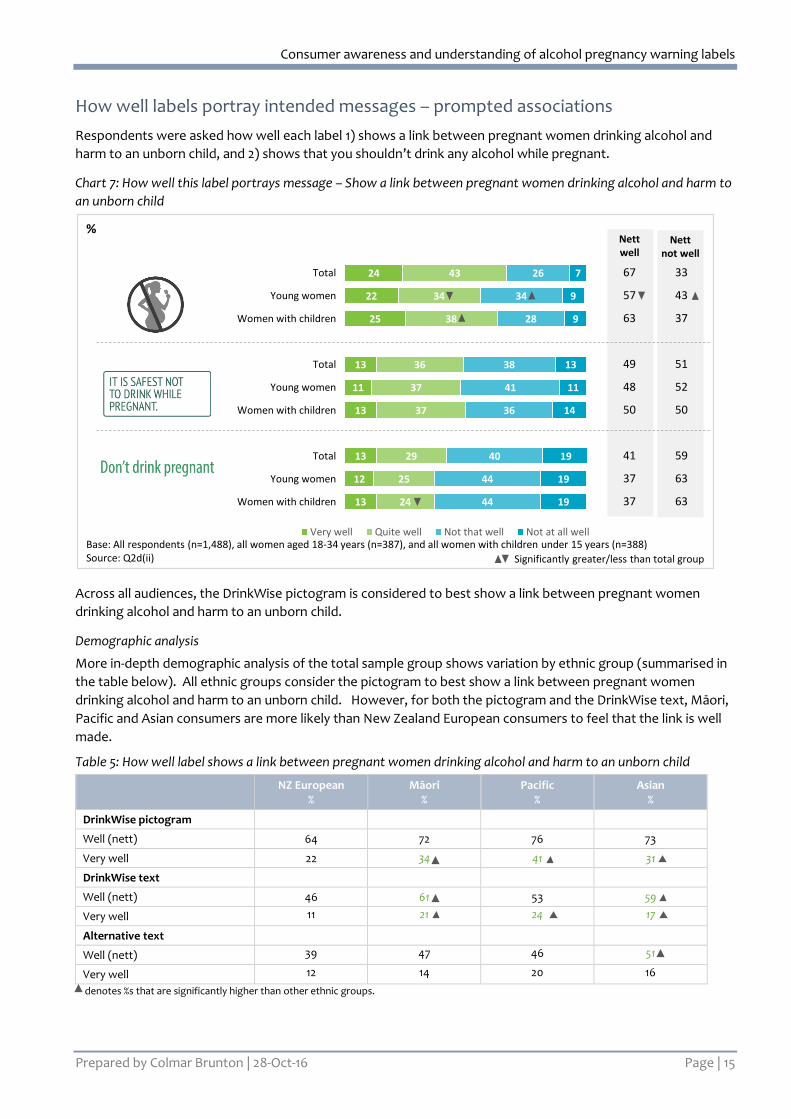
How well labels portray intended messages – prompted associations
Respondents were asked how well each label 1) shows a link between pregnant women drinking alcohol and
harm to an unborn child, and 2) shows that you shouldn’t drink any alcohol while pregnant.
Chart 7: How well this label portrays message – Show a link between pregnant women drinking alcohol and harm to
an unborn child
Across all audiences, the DrinkWise pictogram is considered to best show a link between pregnant women
drinking alcohol and harm to an unborn child.
Demographic analysis
More in-depth demographic analysis of the total sample group shows variation by ethnic group (summarised in
the table below). All ethnic groups consider the pictogram to best show a link between pregnant women
drinking alcohol and harm to an unborn child. However, for both the pictogram and the DrinkWise text, Māori,
Pacific and Asian consumers are more likely than New Zealand European consumers to feel that the link is well
made.
Table 5: How well label shows a link between pregnant women drinking alcohol and harm to an unborn child
NZ European
% Māori
% Pacific
% Asian
%
DrinkWise pictogram
Well (nett) 64 72 76 73
Very well 22 34 41 31
DrinkWise text
Well (nett) 46 61 53 59
Very well 11 21 24 17
Alternative text
Well (nett) 39 47 46 51
Very well 12 14 20 16
denotes %s that are significantly higher than other ethnic groups.
Base: All respondents (n=1,488), all women aged 18-34 years (n=387), and all women with children under 15 years (n=388)Source: Q2d(ii)
%
24
22
25
13
11
13
13
12
13
43
34
38
36
37
37
29
25
24
26
34
28
38
41
36
40
44
44
7
9
9
13
11
14
19
19
19
Very well Quite well Not that well Not at all well
67 33
57 43
63 37
49 51
48 52
50 50
41 59
37 63
37 63
Significantly greater/less than total group
Nettwell
Nettnot well
Total
Young women
Women with children
Total
Young women
Women with children
Total
Young women
Women with children
Consumer awareness and understanding of alcohol pregnancy warning labels
Prepared by Colmar Brunton | 28-Oct-16 Page | 16
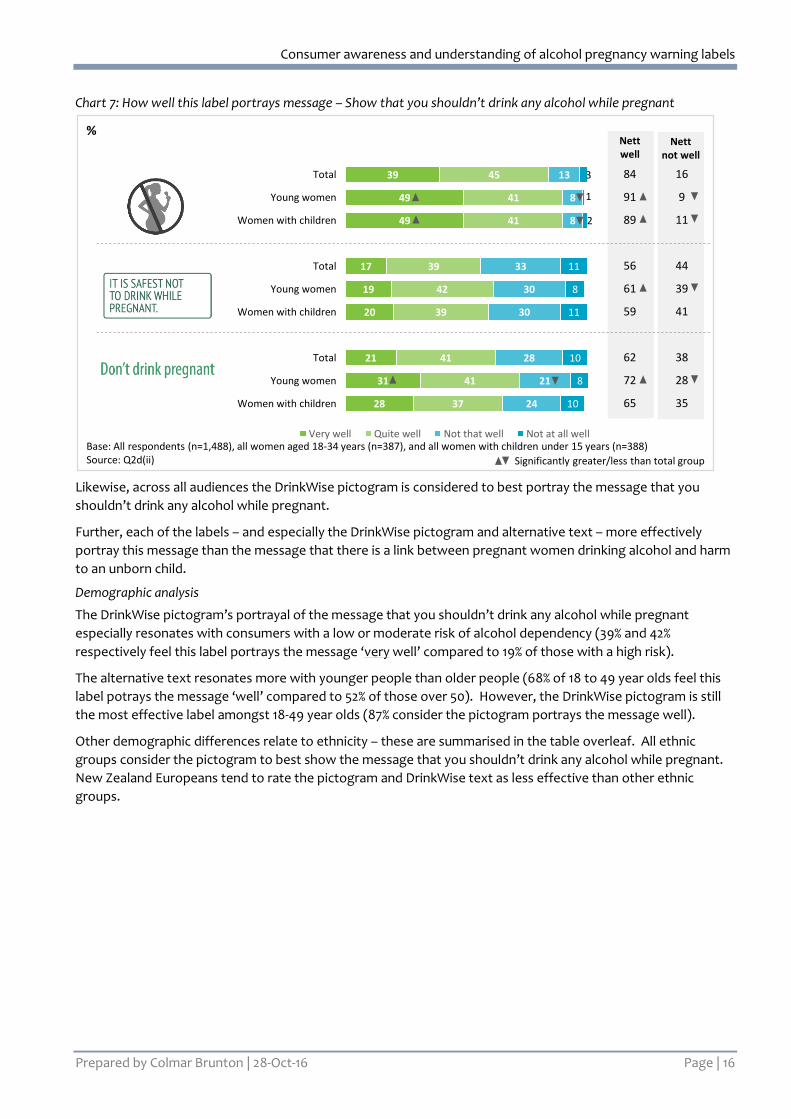
Chart 7: How well this label portrays message – Show that you shouldn’t drink any alcohol while pregnant
Likewise, across all audiences the DrinkWise pictogram is considered to best portray the message that you
shouldn’t drink any alcohol while pregnant.
Further, each of the labels – and especially the DrinkWise pictogram and alternative text – more effectively
portray this message than the message that there is a link between pregnant women drinking alcohol and harm
to an unborn child.
Demographic analysis
The DrinkWise pictogram’s portrayal of the message that you shouldn’t drink any alcohol while pregnant
especially resonates with consumers with a low or moderate risk of alcohol dependency (39% and 42%
respectively feel this label portrays the message ‘very well’ compared to 19% of those with a high risk).
The alternative text resonates more with younger people than older people (68% of 18 to 49 year olds feel this
label potrays the message ‘well’ compared to 52% of those over 50). However, the DrinkWise pictogram is still
the most effective label amongst 18-49 year olds (87% consider the pictogram portrays the message well).
Other demographic differences relate to ethnicity – these are summarised in the table overleaf. All ethnic
groups consider the pictogram to best show the message that you shouldn’t drink any alcohol while pregnant.
New Zealand Europeans tend to rate the pictogram and DrinkWise text as less effective than other ethnic
groups.
Base: All respondents (n=1,488), all women aged 18-34 years (n=387), and all women with children under 15 years (n=388)Source: Q2d(ii)
%
39
49
49
17
19
20
21
31
28
45
41
41
39
42
39
41
41
37
13
8
8
33
30
30
28
21
24
3
1
2
11
8
11
10
8
10
Very well Quite well Not that well Not at all well
Nettwell
Nettnot well
84 16
91 9
89 11
56 44
61 39
59 41
62 38
72 28
65 35
Significantly greater/less than total group
Total
Young women
Women with children
Total
Young women
Women with children
Total
Young women
Women with children
Consumer awareness and understanding of alcohol pregnancy warning labels
Prepared by Colmar Brunton | 28-Oct-16 Page | 17
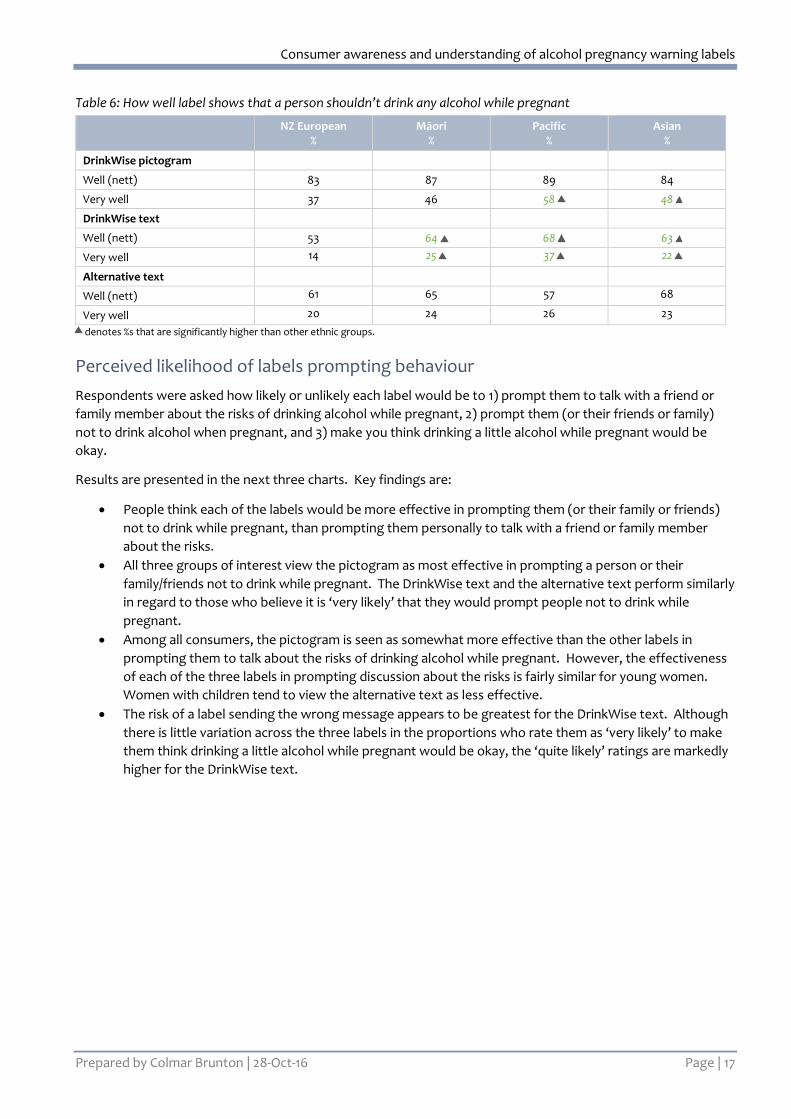
Table 6: How well label shows that a person shouldn’t drink any alcohol while pregnant
NZ European
% Māori
% Pacific
% Asian
%
DrinkWise pictogram
Well (nett) 83 87 89 84
Very well 37 46 58 48
DrinkWise text
Well (nett) 53 64 68 63
Very well 14 25 37 22
Alternative text
Well (nett) 61 65 57 68
Very well 20 24 26 23
denotes %s that are significantly higher than other ethnic groups.
Perceived likelihood of labels prompting behaviour
Respondents were asked how likely or unlikely each label would be to 1) prompt them to talk with a friend or
family member about the risks of drinking alcohol while pregnant, 2) prompt them (or their friends or family)
not to drink alcohol when pregnant, and 3) make you think drinking a little alcohol while pregnant would be
okay.
Results are presented in the next three charts. Key findings are:
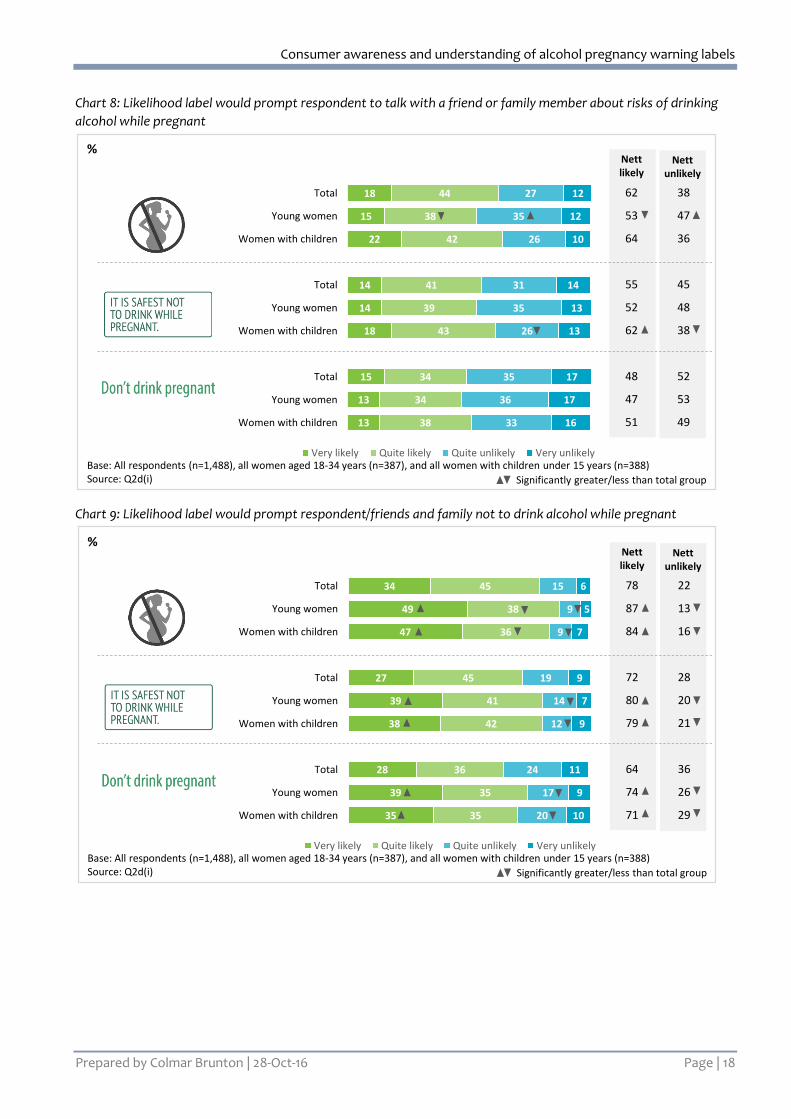
People think each of the labels would be more effective in prompting them (or their family or friends)
not to drink while pregnant, than prompting them personally to talk with a friend or family member
about the risks.
All three groups of interest view the pictogram as most effective in prompting a person or their
family/friends not to drink while pregnant. The DrinkWise text and the alternative text perform similarly
in regard to those who believe it is ‘very likely’ that they would prompt people not to drink while
pregnant.
Among all consumers, the pictogram is seen as somewhat more effective than the other labels in
prompting them to talk about the risks of drinking alcohol while pregnant. However, the effectiveness
of each of the three labels in prompting discussion about the risks is fairly similar for young women.
Women with children tend to view the alternative text as less effective.
The risk of a label sending the wrong message appears to be greatest for the DrinkWise text. Although
there is little variation across the three labels in the proportions who rate them as ‘very likely’ to make
them think drinking a little alcohol while pregnant would be okay, the ‘quite likely’ ratings are markedly
higher for the DrinkWise text.
Consumer awareness and understanding of alcohol pregnancy warning labels
Prepared by Colmar Brunton | 28-Oct-16 Page | 18
Chart 8: Likelihood label would prompt respondent to talk with a friend or family member about risks of drinking
alcohol while pregnant
Chart 9: Likelihood label would prompt respondent/friends and family not to drink alcohol while pregnant
Base: All respondents (n=1,488), all women aged 18-34 years (n=387), and all women with children under 15 years (n=388)Source: Q2d(i)
%
18
15
22
14
14
18
15
13
13
44
38
42
41
39
43
34
34
38
27
35
26
31
35
26
35
36
33
12
12
10
14
13
13
17
17
16
Very likely Quite likely Quite unlikely Very unlikely
Nettlikely
Nettunlikely
62 38
53 47
64 36
55 45
52 48
62 38
48 52
47 53
51 49
Significantly greater/less than total group
Total
Young women
Women with children
Total
Young women
Women with children
Total
Young women
Women with children
Base: All respondents (n=1,488), all women aged 18-34 years (n=387), and all women with children under 15 years (n=388)Source: Q2d(i)
%
34
49
47
27
39
38
28
39
35
45
38
36
45
41
42
36
35
35
15
9
9
19
14
12
24
17
20
6
5
7
9
7
9
11
9
10
Very likely Quite likely Quite unlikely Very unlikely
Nettlikely
Nettunlikely
78 22
87 13
84 16
72 28
80 20
79 21
64 36
74 26
71 29
Significantly greater/less than total group
Total
Young women
Women with children
Total
Young women
Women with children
Total
Young women
Women with children
Consumer awareness and understanding of alcohol pregnancy warning labels
Prepared by Colmar Brunton | 28-Oct-16 Page | 19
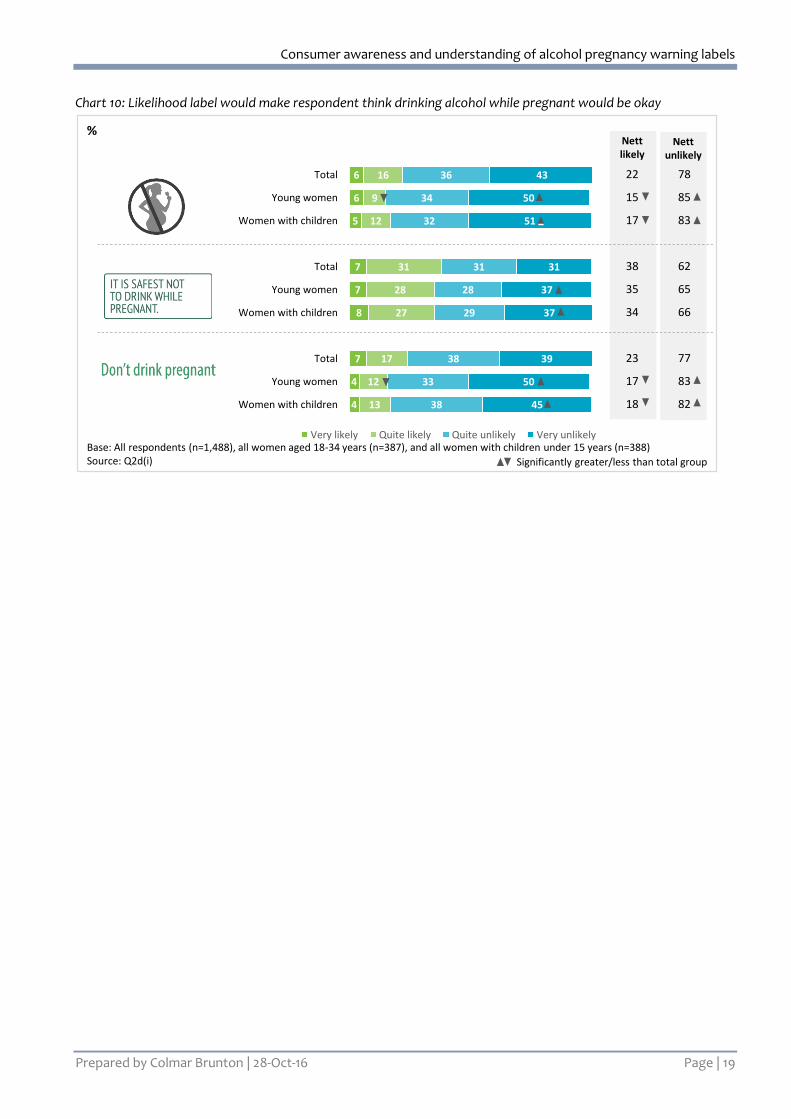
Chart 10: Likelihood label would make respondent think drinking alcohol while pregnant would be okay
Base: All respondents (n=1,488), all women aged 18-34 years (n=387), and all women with children under 15 years (n=388)Source: Q2d(i)
%
6
6
5
7
7
8
7
4
4
16
9
12
31
28
27
17
12
13
36
34
32
31
28
29
38
33
38
43
50
51
31
37
37
39
50
45
Very likely Quite likely Quite unlikely Very unlikely
Nettlikely
Nettunlikely
22 78
15 85
17 83
38 62
35 65
34 66
23 77
17 83
18 82
-
Significantly greater/less than total group
Total
Young women
Women with children
Total
Young women
Women with children
Total
Young women
Women with children
Consumer awareness and understanding of alcohol pregnancy warning labels
Prepared by Colmar Brunton | 28-Oct-16 Page | 20
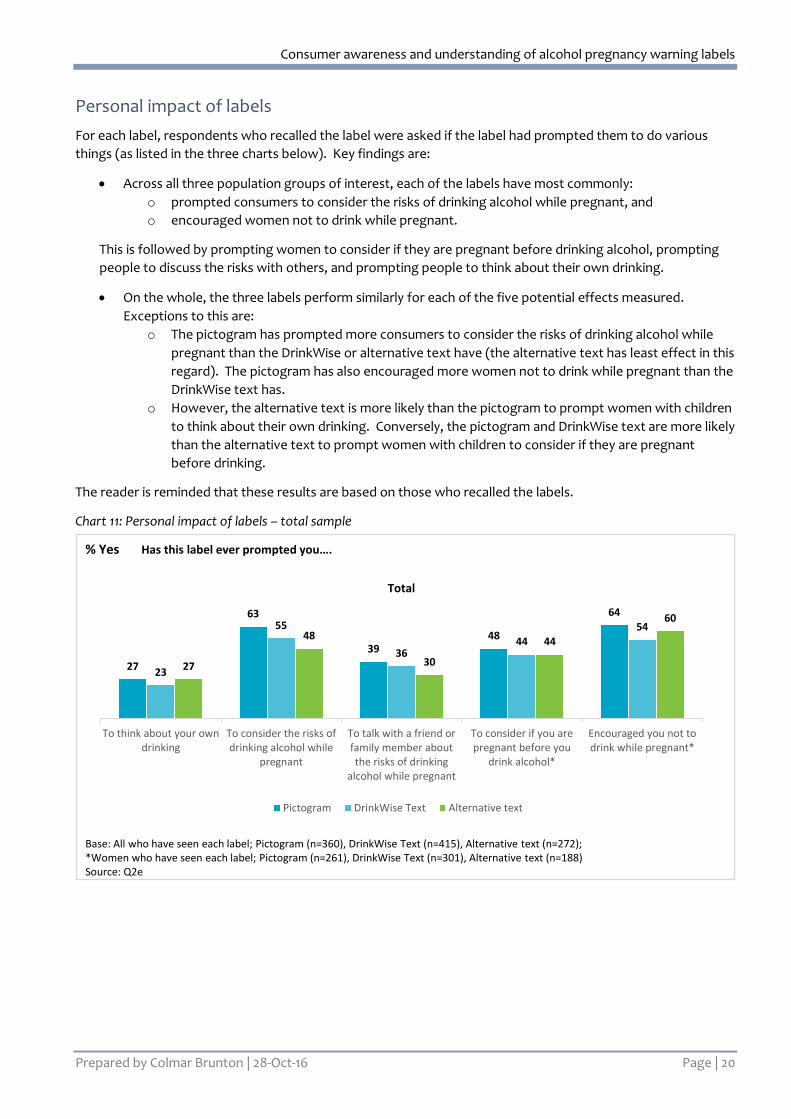
Personal impact of labels
For each label, respondents who recalled the label were asked if the label had prompted them to do various
things (as listed in the three charts below). Key findings are:
Across all three population groups of interest, each of the labels have most commonly:
o prompted consumers to consider the risks of drinking alcohol while pregnant, and
o encouraged women not to drink while pregnant.
This is followed by prompting women to consider if they are pregnant before drinking alcohol, prompting
people to discuss the risks with others, and prompting people to think about their own drinking.
On the whole, the three labels perform similarly for each of the five potential effects measured.
Exceptions to this are:
o The pictogram has prompted more consumers to consider the risks of drinking alcohol while
pregnant than the DrinkWise or alternative text have (the alternative text has least effect in this
regard). The pictogram has also encouraged more women not to drink while pregnant than the
DrinkWise text has.
o However, the alternative text is more likely than the pictogram to prompt women with children
to think about their own drinking. Conversely, the pictogram and DrinkWise text are more likely
than the alternative text to prompt women with children to consider if they are pregnant
before drinking.
The reader is reminded that these results are based on those who recalled the labels.
Chart 11: Personal impact of labels – total sample
Base: All who have seen each label; Pictogram (n=360), DrinkWise Text (n=415), Alternative text (n=272); *Women who have seen each label; Pictogram (n=261), DrinkWise Text (n=301), Alternative text (n=188)Source: Q2e
% Yes
27
63
3948
64
23
55
3644
54
27
48
30
44
60
To think about your owndrinking
To consider the risks ofdrinking alcohol while
pregnant
To talk with a friend orfamily member aboutthe risks of drinking
alcohol while pregnant
To consider if you arepregnant before you
drink alcohol*
Encouraged you not todrink while pregnant*
Pictogram DrinkWise Text Alternative text
Has this label ever prompted you….
Total
Consumer awareness and understanding of alcohol pregnancy warning labels
Prepared by Colmar Brunton | 28-Oct-16 Page | 21
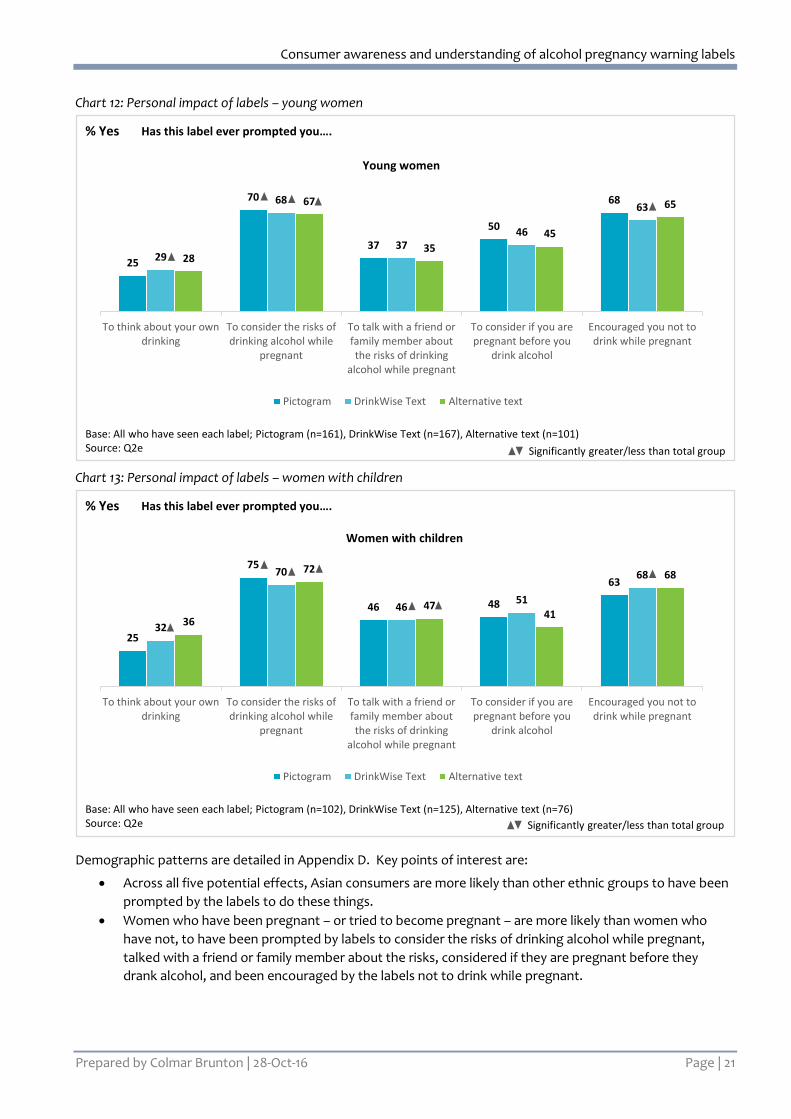
Chart 12: Personal impact of labels – young women
Chart 13: Personal impact of labels – women with children
Demographic patterns are detailed in Appendix D. Key points of interest are:
Across all five potential effects, Asian consumers are more likely than other ethnic groups to have been
prompted by the labels to do these things.
Women who have been pregnant – or tried to become pregnant – are more likely than women who
have not, to have been prompted by labels to consider the risks of drinking alcohol while pregnant,
talked with a friend or family member about the risks, considered if they are pregnant before they
drank alcohol, and been encouraged by the labels not to drink while pregnant.
Base: All who have seen each label; Pictogram (n=161), DrinkWise Text (n=167), Alternative text (n=101)Source: Q2e
% Yes
25
70
37
50
68
29
68
3746
63
28
67
35
45
65
To think about your owndrinking
To consider the risks ofdrinking alcohol while
pregnant
To talk with a friend orfamily member aboutthe risks of drinking
alcohol while pregnant
To consider if you arepregnant before you
drink alcohol
Encouraged you not todrink while pregnant
Pictogram DrinkWise Text Alternative text
Has this label ever prompted you….
Young women
Significantly greater/less than total group
Base: All who have seen each label; Pictogram (n=102), DrinkWise Text (n=125), Alternative text (n=76)Source: Q2e
% Yes
25
75
46 48
63
32
70
4651
68
36
72
4741
68
To think about your owndrinking
To consider the risks ofdrinking alcohol while
pregnant
To talk with a friend orfamily member aboutthe risks of drinking
alcohol while pregnant
To consider if you arepregnant before you
drink alcohol
Encouraged you not todrink while pregnant
Pictogram DrinkWise Text Alternative text
Has this label ever prompted you….
Women with children
Significantly greater/less than total group
Consumer awareness and understanding of alcohol pregnancy warning labels
Prepared by Colmar Brunton | 28-Oct-16 Page | 22
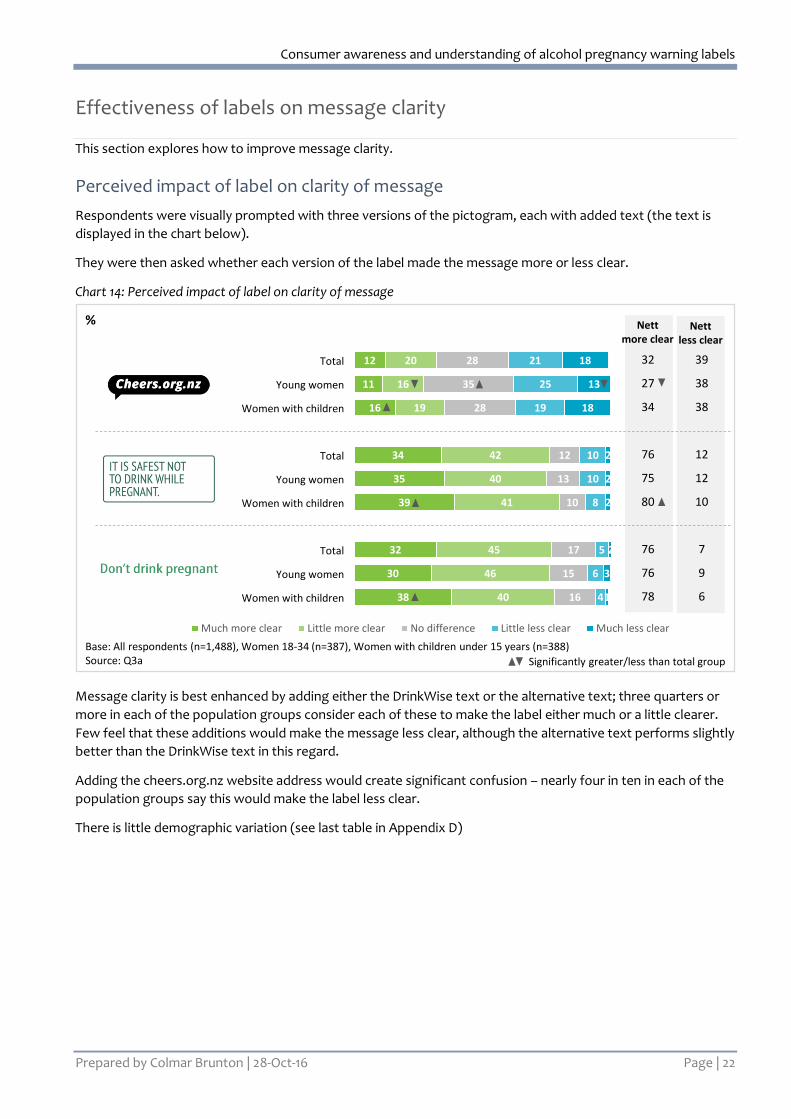
Effectiveness of labels on message clarity
This section explores how to improve message clarity.
Perceived impact of label on clarity of message
Respondents were visually prompted with three versions of the pictogram, each with added text (the text is
displayed in the chart below).
They were then asked whether each version of the label made the message more or less clear.
Chart 14: Perceived impact of label on clarity of message
Message clarity is best enhanced by adding either the DrinkWise text or the alternative text; three quarters or
more in each of the population groups consider each of these to make the label either much or a little clearer.
Few feel that these additions would make the message less clear, although the alternative text performs slightly
better than the DrinkWise text in this regard.
Adding the cheers.org.nz website address would create significant confusion – nearly four in ten in each of the
population groups say this would make the label less clear.
There is little demographic variation (see last table in Appendix D)
Base: All respondents (n=1,488), Women 18-34 (n=387), Women with children under 15 years (n=388)Source: Q3a
%
12
11
16
34
35
39
32
30
38
20
16
19
42
40
41
45
46
40
28
35
28
12
13
10
17
15
16
21
25
19
10
10
8
5
6
4
18
13
18
2
2
2
2
3
1
Much more clear Little more clear No difference Little less clear Much less clear
Nett more clear
Nettless clear
32 39
27 38
34 38
76 12
75 12
80 10
76 7
76 9
78 6
Significantly greater/less than total group
Total
Young women
Women with children
Total
Young women
Women with children
Total
Young women
Women with children
Consumer awareness and understanding of alcohol pregnancy warning labels
Prepared by Colmar Brunton | 28-Oct-16 Page | 23
Awareness of website cheers.org.nz
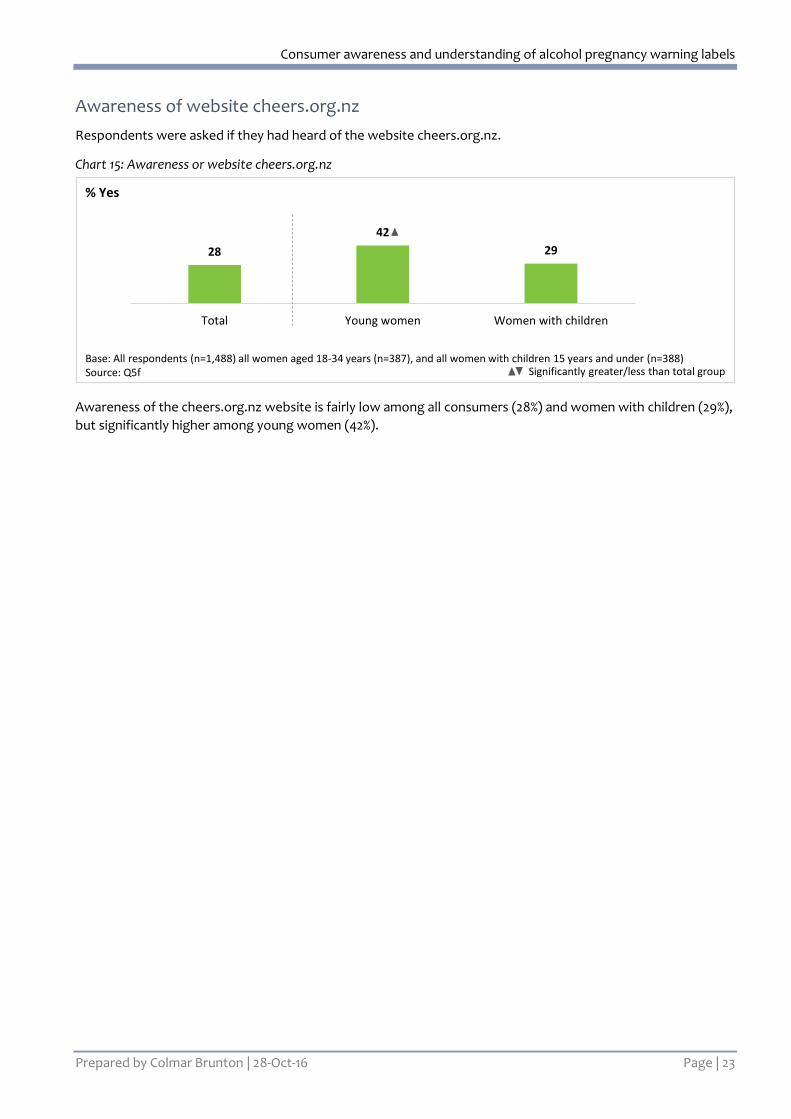
Respondents were asked if they had heard of the website cheers.org.nz.
Chart 15: Awareness or website cheers.org.nz
Awareness of the cheers.org.nz website is fairly low among all consumers (28%) and women with children (29%),
but significantly higher among young women (42%).
Base: All respondents (n=1,488) all women aged 18-34 years (n=387), and all women with children 15 years and under (n=388)Source: Q5f
28
42
29
Total Young women Women with children
% Yes
Significantly greater/less than total group
Consumer awareness and understanding of alcohol pregnancy warning labels
Prepared by Colmar Brunton | 28-Oct-16 Page | 24
Suggestions for improving message clarity
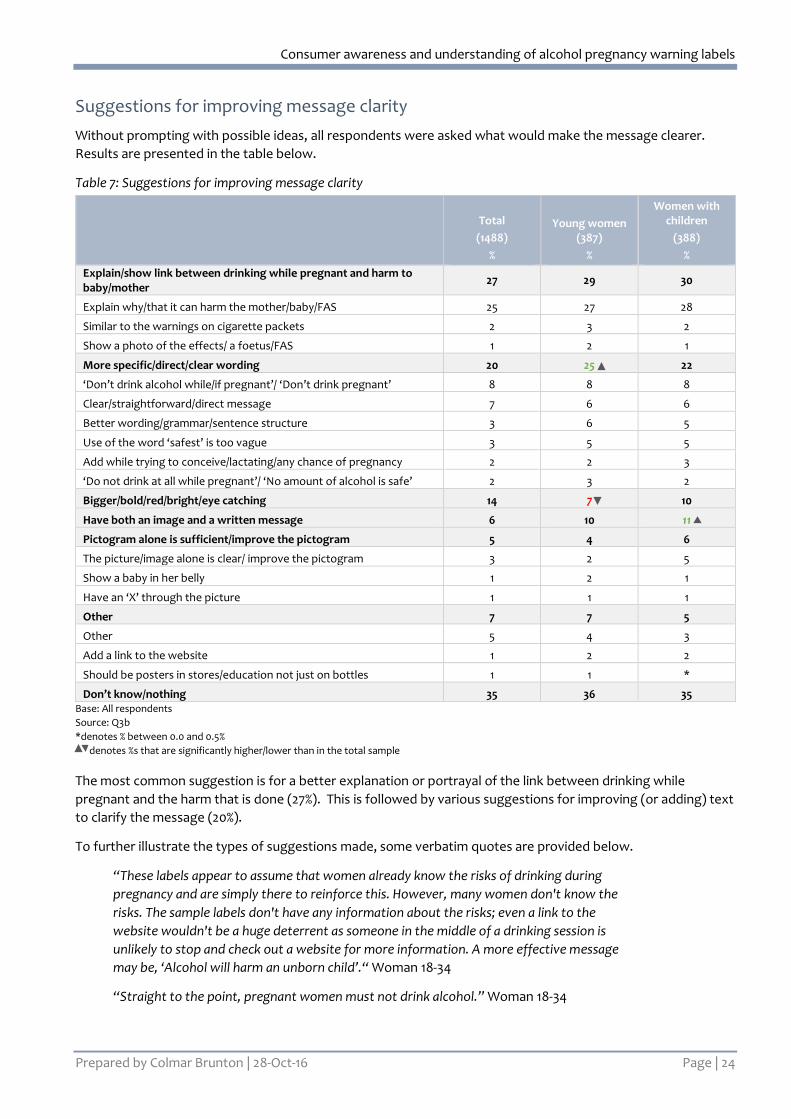
Without prompting with possible ideas, all respondents were asked what would make the message clearer.
Results are presented in the table below.
Table 7: Suggestions for improving message clarity
Total
(1488)
%
Young women (387)
%
Women with children
(388)
%
Explain/show link between drinking while pregnant and harm to baby/mother
27 29 30
Explain why/that it can harm the mother/baby/FAS 25 27 28
Similar to the warnings on cigarette packets 2 3 2
Show a photo of the effects/ a foetus/FAS 1 2 1
More specific/direct/clear wording 20 25 22
‘Don’t drink alcohol while/if pregnant’/ ‘Don’t drink pregnant’ 8 8 8
Clear/straightforward/direct message 7 6 6
Better wording/grammar/sentence structure 3 6 5
Use of the word ‘safest’ is too vague 3 5 5
Add while trying to conceive/lactating/any chance of pregnancy 2 2 3
‘Do not drink at all while pregnant’/ ‘No amount of alcohol is safe’ 2 3 2
Bigger/bold/red/bright/eye catching 14 7 10
Have both an image and a written message 6 10 11
Pictogram alone is sufficient/improve the pictogram 5 4 6
The picture/image alone is clear/ improve the pictogram 3 2 5
Show a baby in her belly 1 2 1
Have an ‘X’ through the picture 1 1 1
Other 7 7 5
Other 5 4 3
Add a link to the website 1 2 2
Should be posters in stores/education not just on bottles 1 1 *
Don’t know/nothing 35 36 35 Base: All respondents
Source: Q3b
*denotes % between 0.0 and 0.5%
denotes %s that are significantly higher/lower than in the total sample
The most common suggestion is for a better explanation or portrayal of the link between drinking while
pregnant and the harm that is done (27%). This is followed by various suggestions for improving (or adding) text
to clarify the message (20%).
To further illustrate the types of suggestions made, some verbatim quotes are provided below.
“These labels appear to assume that women already know the risks of drinking during
pregnancy and are simply there to reinforce this. However, many women don't know the
risks. The sample labels don't have any information about the risks; even a link to the
website wouldn't be a huge deterrent as someone in the middle of a drinking session is
unlikely to stop and check out a website for more information. A more effective message
may be, ‘Alcohol will harm an unborn child’.“ Woman 18-34
“Straight to the point, pregnant women must not drink alcohol.” Woman 18-34
Consumer awareness and understanding of alcohol pregnancy warning labels
Prepared by Colmar Brunton | 28-Oct-16 Page | 25
“Bigger label on the product.” Woman 18-34
“Image instead of words.” Woman with child(ren)
“Beside the picture explain what would happen to your baby if you drink while you
pregnant.” Woman with child(ren)
Consumer awareness and understanding of alcohol pregnancy warning labels
Prepared by Colmar Brunton | 28-Oct-16 Page | 26
Effectiveness of colour
This section examines the effectiveness of colour in conveying a warning.
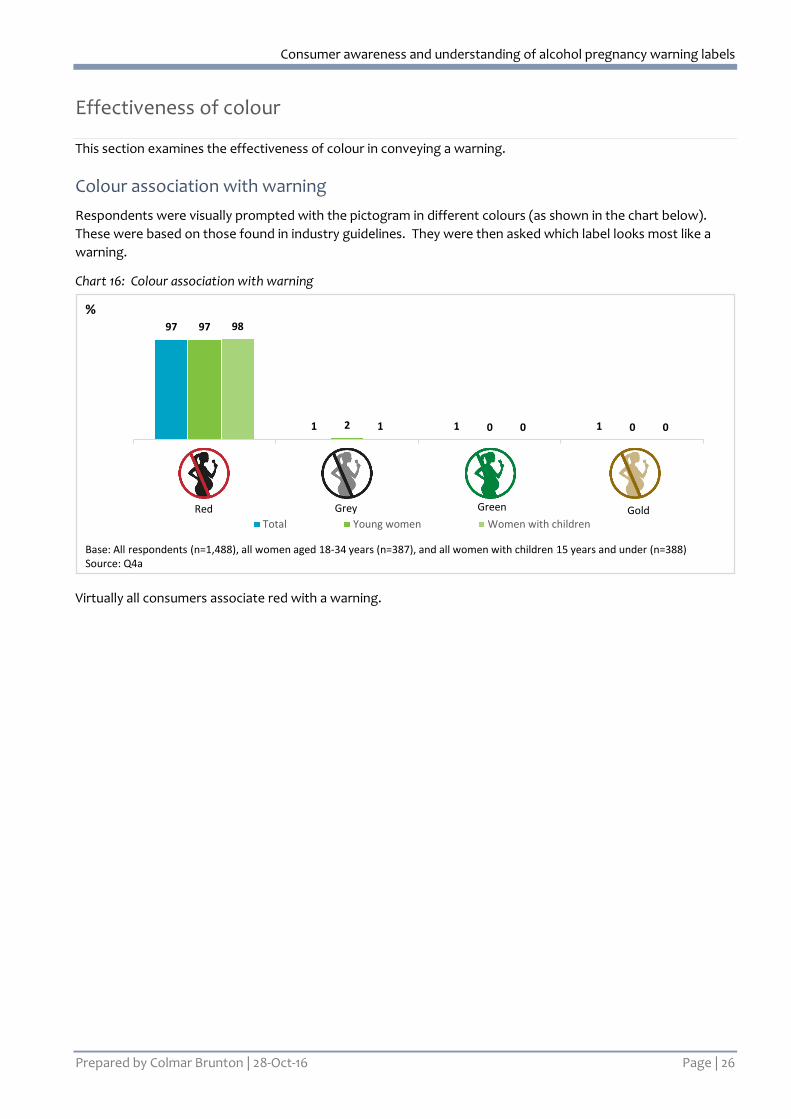
Colour association with warning
Respondents were visually prompted with the pictogram in different colours (as shown in the chart below).
These were based on those found in industry guidelines. They were then asked which label looks most like a
warning.
Chart 16: Colour association with warning
Virtually all consumers associate red with a warning.
Base: All respondents (n=1,488), all women aged 18-34 years (n=387), and all women with children 15 years and under (n=388)Source: Q4a
%97
1 1 1
97
2 0 0
98
1 0 0
Total Young women Women with children
Red Grey Green Gold
Consumer awareness and understanding of alcohol pregnancy warning labels
Prepared by Colmar Brunton | 28-Oct-16 Page | 27
General attitudes towards drinking
This section explores the target audiences’ attitudes towards drinking alcohol and their self-reported
knowledge of the risks and harms of drinking alcohol.
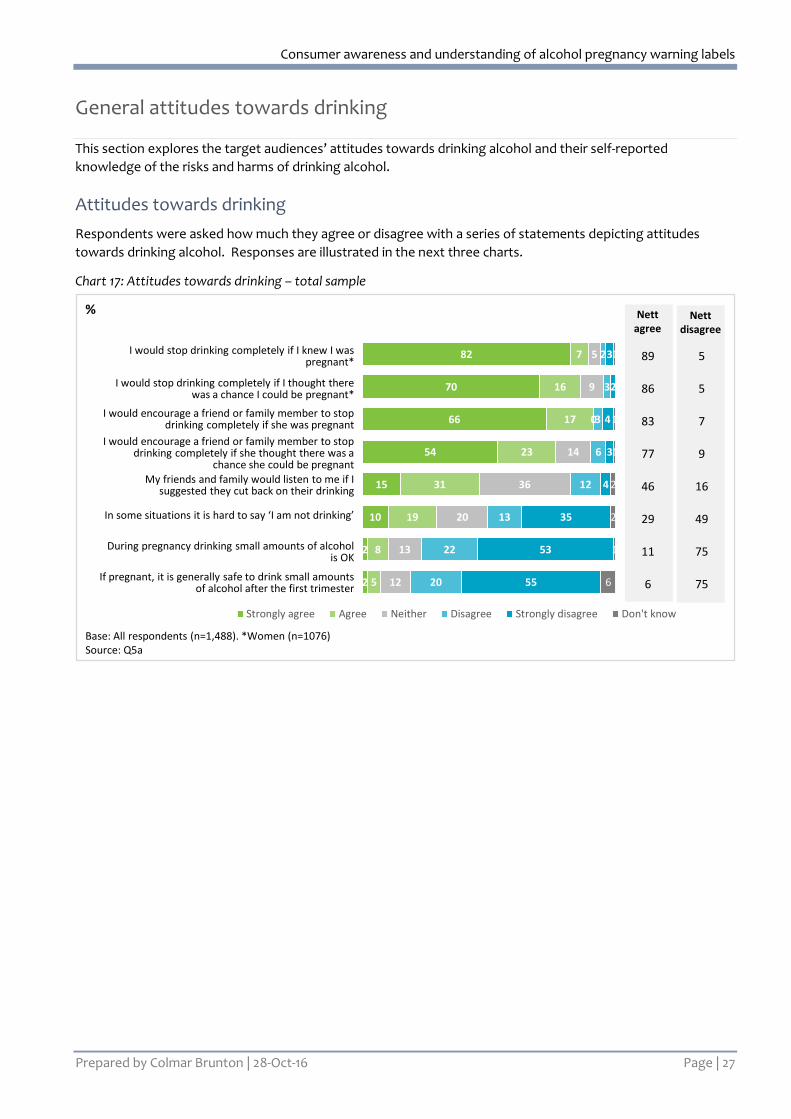
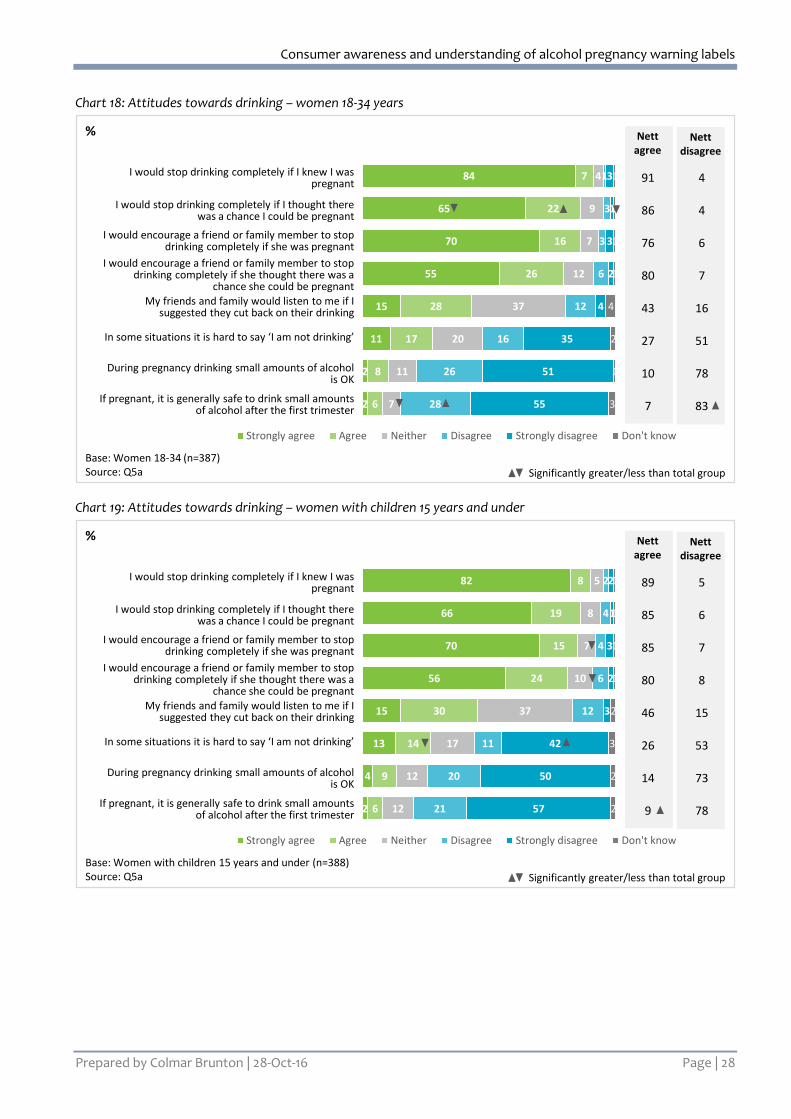
Attitudes towards drinking
Respondents were asked how much they agree or disagree with a series of statements depicting attitudes
towards drinking alcohol. Responses are illustrated in the next three charts.
Chart 17: Attitudes towards drinking – total sample
Base: All respondents (n=1,488). *Women (n=1076)Source: Q5a
%
82
70
66
54
15
10
2
2
7
16
17
23
31
19
8
5
5
9
0
14
36
20
13
12
2
3
3
6
12
13
22
20
3
2
4
3
4
35
53
55
1
1
1
2
2
1
6
Strongly agree Agree Neither Disagree Strongly disagree Don't know
Nett agree
Nett disagree
I would stop drinking completely if I knew I was pregnant*
I would stop drinking completely if I thought there was a chance I could be pregnant*
I would encourage a friend or family member to stop drinking completely if she was pregnant
I would encourage a friend or family member to stop drinking completely if she thought there was a
chance she could be pregnant
My friends and family would listen to me if I suggested they cut back on their drinking
In some situations it is hard to say ‘I am not drinking’
During pregnancy drinking small amounts of alcohol is OK
If pregnant, it is generally safe to drink small amounts of alcohol after the first trimester
89 5
86 5
83 7
77 9
46 16
29 49
11 75
6 75
Consumer awareness and understanding of alcohol pregnancy warning labels
Prepared by Colmar Brunton | 28-Oct-16 Page | 28
Chart 18: Attitudes towards drinking – women 18-34 years
Chart 19: Attitudes towards drinking – women with children 15 years and under
Base: Women 18-34 (n=387)Source: Q5a
%
84
65
70
55
15
11
2
2
7
22
16
26
28
17
8
6
4
9
7
12
37
20
11
7
1
3
3
6
12
16
26
28
3
1
3
2
4
35
51
55
1
1
1
1
4
2
1
3
Strongly agree Agree Neither Disagree Strongly disagree Don't know
Nett agree
Nett disagree
91 4
86 4
76 6
80 7
43 16
27 51
10 78
7 83
Significantly greater/less than total group
I would stop drinking completely if I knew I was pregnant
I would stop drinking completely if I thought there was a chance I could be pregnant
I would encourage a friend or family member to stop drinking completely if she was pregnant
I would encourage a friend or family member to stop drinking completely if she thought there was a
chance she could be pregnantMy friends and family would listen to me if I
suggested they cut back on their drinking
In some situations it is hard to say ‘I am not drinking’
During pregnancy drinking small amounts of alcohol is OK
If pregnant, it is generally safe to drink small amounts of alcohol after the first trimester
Base: Women with children 15 years and under (n=388)Source: Q5a
%
82
66
70
56
15
13
4
2
8
19
15
24
30
14
9
6
5
8
7
10
37
17
12
12
2
4
4
6
12
11
20
21
2
1
3
2
3
42
50
57
1
1
1
1
2
3
2
2
Strongly agree Agree Neither Disagree Strongly disagree Don't know
Nett agree
Nett disagree
89 5
85 6
85 7
80 8
46 15
26 53
14 73
9 78
Significantly greater/less than total group
I would stop drinking completely if I knew I was pregnant
I would stop drinking completely if I thought there was a chance I could be pregnant
I would encourage a friend or family member to stop drinking completely if she was pregnant
I would encourage a friend or family member to stop drinking completely if she thought there was a
chance she could be pregnantMy friends and family would listen to me if I
suggested they cut back on their drinking
In some situations it is hard to say ‘I am not drinking’
During pregnancy drinking small amounts of alcohol is OK
If pregnant, it is generally safe to drink small amounts of alcohol after the first trimester
Consumer awareness and understanding of alcohol pregnancy warning labels
Prepared by Colmar Brunton | 28-Oct-16 Page | 29
Self-reported knowledge of risks and harms of drinking alcohol
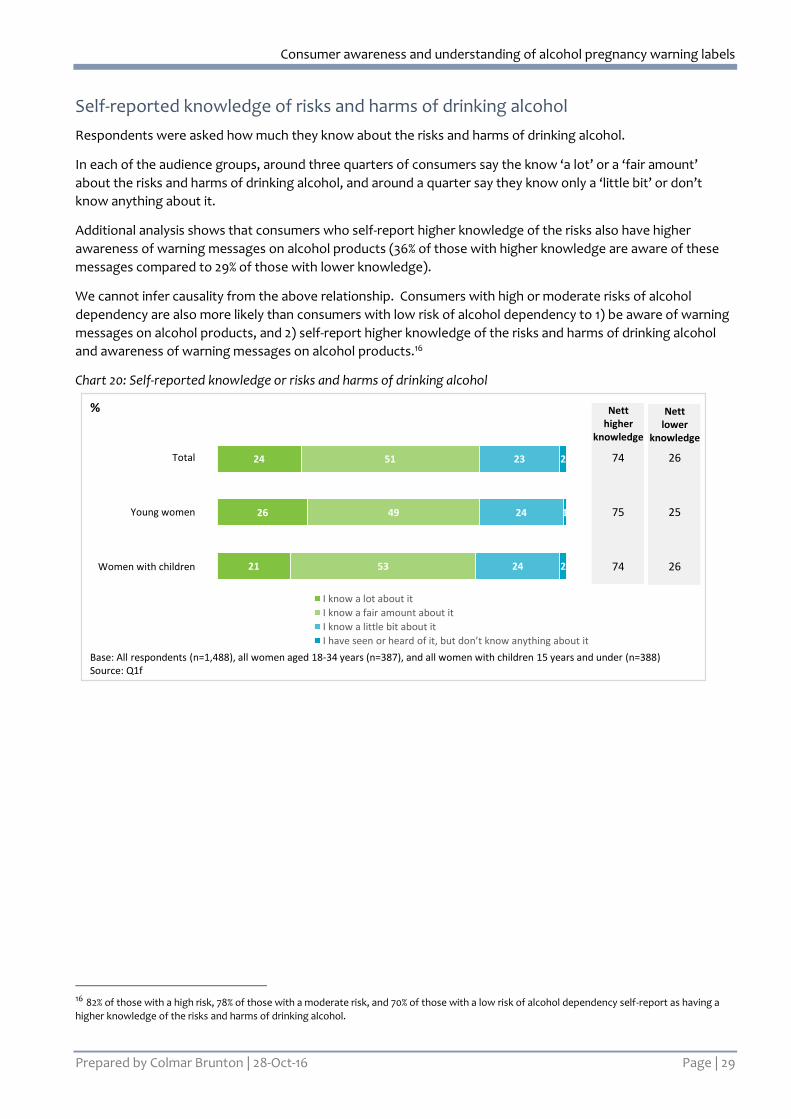
Respondents were asked how much they know about the risks and harms of drinking alcohol.
In each of the audience groups, around three quarters of consumers say the know ‘a lot’ or a ‘fair amount’
about the risks and harms of drinking alcohol, and around a quarter say they know only a ‘little bit’ or don’t
know anything about it.
Additional analysis shows that consumers who self-report higher knowledge of the risks also have higher
awareness of warning messages on alcohol products (36% of those with higher knowledge are aware of these
messages compared to 29% of those with lower knowledge).
We cannot infer causality from the above relationship. Consumers with high or moderate risks of alcohol
dependency are also more likely than consumers with low risk of alcohol dependency to 1) be aware of warning
messages on alcohol products, and 2) self-report higher knowledge of the risks and harms of drinking alcohol
and awareness of warning messages on alcohol products.16
Chart 20: Self-reported knowledge or risks and harms of drinking alcohol
16 82% of those with a high risk, 78% of those with a moderate risk, and 70% of those with a low risk of alcohol dependency self-report as having a
higher knowledge of the risks and harms of drinking alcohol.
Base: All respondents (n=1,488), all women aged 18-34 years (n=387), and all women with children 15 years and under (n=388)Source: Q1f
%
24
26
21
51
49
53
23
24
24
2
1
2
I know a lot about it
I know a fair amount about it
I know a little bit about it
I have seen or heard of it, but don’t know anything about it
Nett higher
knowledge
Nettlower
knowledge
74 26
75 25
74 26
Total
Young women
Women with children
Consumer awareness and understanding of alcohol pregnancy warning labels
Prepared by Colmar Brunton | 28-Oct-16 Page | 30
Appendix A: detailed results on recall of warning messages
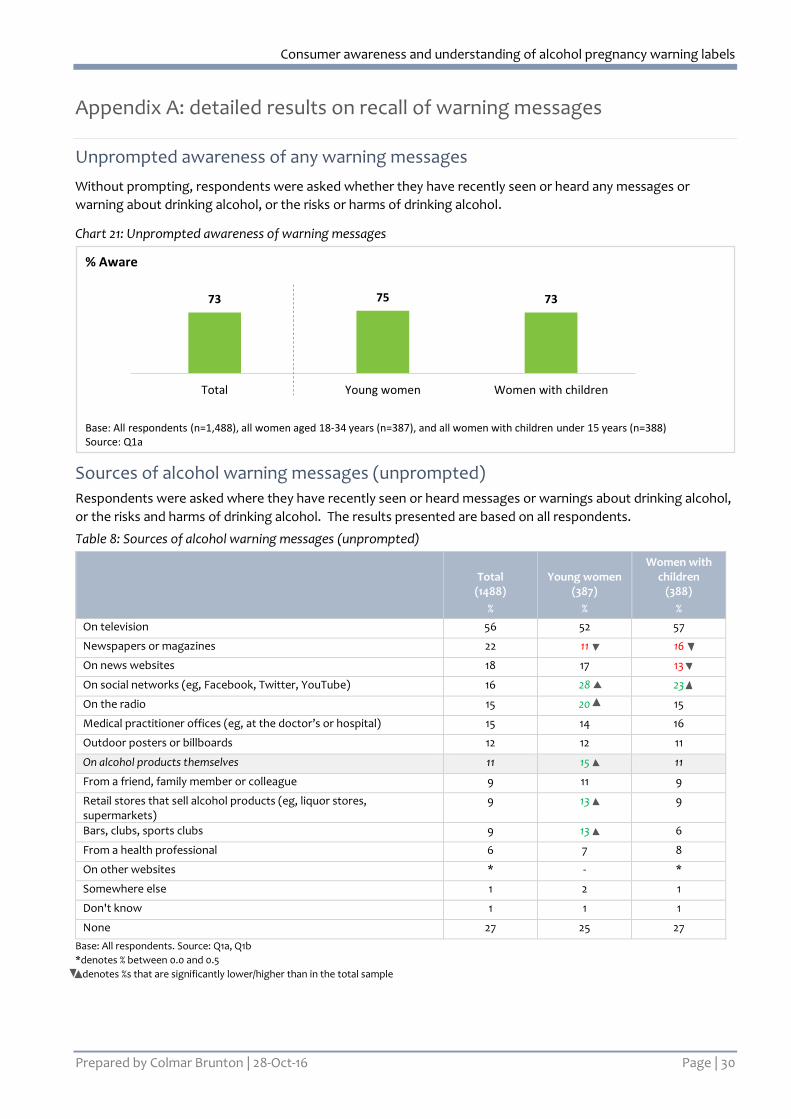
Unprompted awareness of any warning messages
Without prompting, respondents were asked whether they have recently seen or heard any messages or
warning about drinking alcohol, or the risks or harms of drinking alcohol.
Chart 21: Unprompted awareness of warning messages
Sources of alcohol warning messages (unprompted)
Respondents were asked where they have recently seen or heard messages or warnings about drinking alcohol,
or the risks and harms of drinking alcohol. The results presented are based on all respondents.
Table 8: Sources of alcohol warning messages (unprompted)
Total
(1488)
%
Young women (387)
%
Women with children
(388)
%
On television 56 52 57
Newspapers or magazines 22 11 16
On news websites 18 17 13
On social networks (eg, Facebook, Twitter, YouTube) 16 28 23
On the radio 15 20 15
Medical practitioner offices (eg, at the doctor’s or hospital) 15 14 16
Outdoor posters or billboards 12 12 11
On alcohol products themselves 11 15 11
From a friend, family member or colleague 9 11 9
Retail stores that sell alcohol products (eg, liquor stores, supermarkets)
9 13 9
Bars, clubs, sports clubs 9 13 6
From a health professional 6 7 8
On other websites * - *
Somewhere else 1 2 1
Don't know 1 1 1
None 27 25 27
Base: All respondents. Source: Q1a, Q1b
*denotes % between 0.0 and 0.5
denotes %s that are significantly lower/higher than in the total sample
Base: All respondents (n=1,488), all women aged 18-34 years (n=387), and all women with children under 15 years (n=388)Source: Q1a
73 75 73
Total Young women Women with children
% Aware
Consumer awareness and understanding of alcohol pregnancy warning labels
Prepared by Colmar Brunton | 28-Oct-16 Page | 31
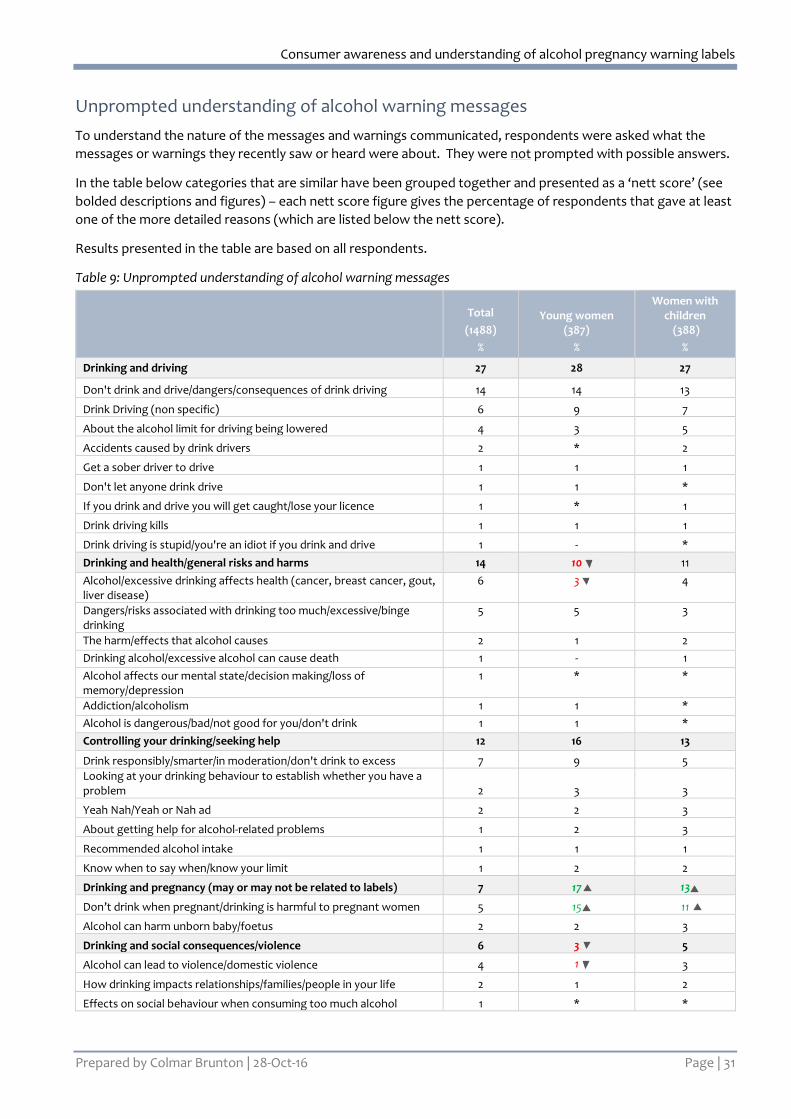
Unprompted understanding of alcohol warning messages
To understand the nature of the messages and warnings communicated, respondents were asked what the
messages or warnings they recently saw or heard were about. They were not prompted with possible answers.
In the table below categories that are similar have been grouped together and presented as a ‘nett score’ (see
bolded descriptions and figures) – each nett score figure gives the percentage of respondents that gave at least
one of the more detailed reasons (which are listed below the nett score).
Results presented in the table are based on all respondents.
Table 9: Unprompted understanding of alcohol warning messages
Total
(1488)
%
Young women (387)
%
Women with children
(388)
%
Drinking and driving 27 28 27
Don't drink and drive/dangers/consequences of drink driving 14 14 13
Drink Driving (non specific) 6 9 7
About the alcohol limit for driving being lowered 4 3 5
Accidents caused by drink drivers 2 * 2
Get a sober driver to drive 1 1 1
Don't let anyone drink drive 1 1 *
If you drink and drive you will get caught/lose your licence 1 * 1
Drink driving kills 1 1 1
Drink driving is stupid/you're an idiot if you drink and drive 1 - *
Drinking and health/general risks and harms 14 10 11
Alcohol/excessive drinking affects health (cancer, breast cancer, gout, liver disease)
6 3 4
Dangers/risks associated with drinking too much/excessive/binge drinking
5 5 3
The harm/effects that alcohol causes 2 1 2
Drinking alcohol/excessive alcohol can cause death 1 - 1
Alcohol affects our mental state/decision making/loss of memory/depression
1 * *
Addiction/alcoholism 1 1 *
Alcohol is dangerous/bad/not good for you/don't drink 1 1 *
Controlling your drinking/seeking help 12 16 13
Drink responsibly/smarter/in moderation/don't drink to excess 7 9 5
Looking at your drinking behaviour to establish whether you have a problem 2 3 3
Yeah Nah/Yeah or Nah ad 2 2 3
About getting help for alcohol-related problems 1 2 3
Recommended alcohol intake 1 1 1
Know when to say when/know your limit 1 2 2
Drinking and pregnancy (may or may not be related to labels) 7 17 13
Don’t drink when pregnant/drinking is harmful to pregnant women 5 15 11
Alcohol can harm unborn baby/foetus 2 2 3
Drinking and social consequences/violence 6 3 5
Alcohol can lead to violence/domestic violence 4 1 3
How drinking impacts relationships/families/people in your life 2 1 2
Effects on social behaviour when consuming too much alcohol 1 * *
Consumer awareness and understanding of alcohol pregnancy warning labels
Prepared by Colmar Brunton | 28-Oct-16 Page | 32
Other 7 9 7
Other 5 6 4
Alcohol issues with youth drinking 1 1 1
Don't do drugs and drive/dangers/consequences of driving on drugs 1 1 1
Dangers for women, e.g., drink spiking, rape 1 1 -
Smoking * * 1
Nothing/Don’t know 19 17 16
Do not recall any warnings or messages 27 25 27 Base: All respondents.
Source: Q1c
*denotes % between 0.0 and 0.5%
denotes %s that are significantly lower/higher than in the total sample
Totals may not add to 100% due to multiple responses
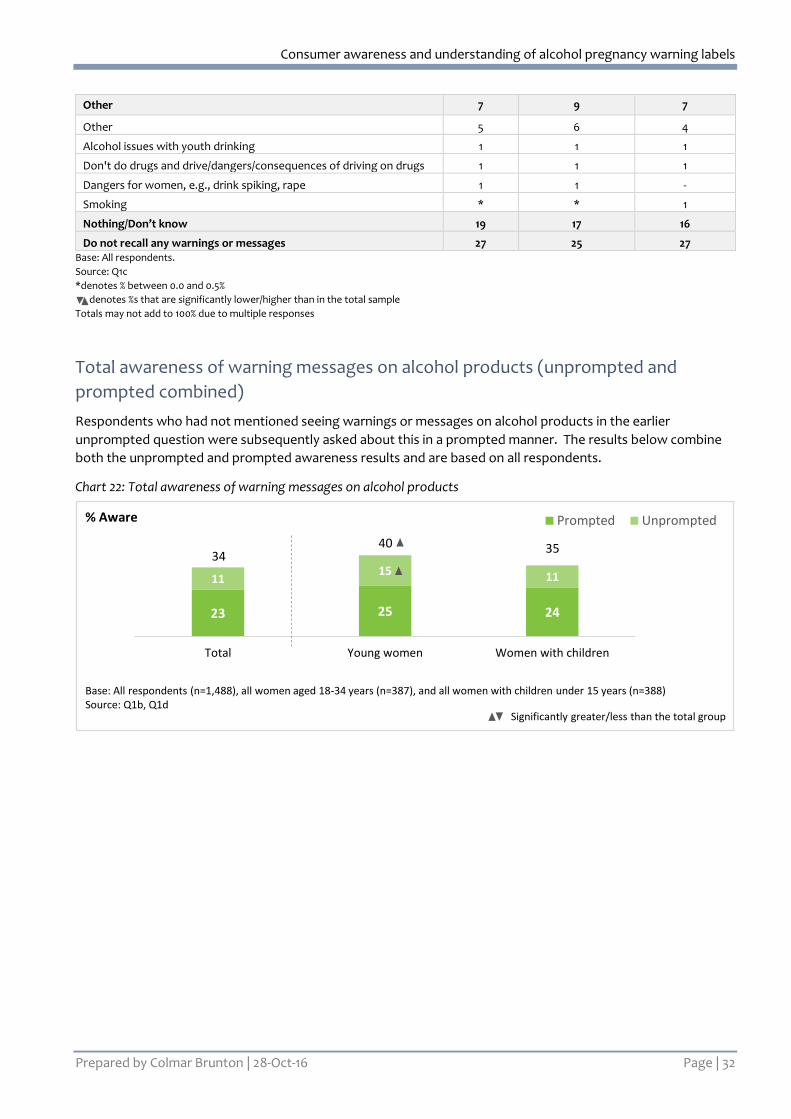
Total awareness of warning messages on alcohol products (unprompted and
prompted combined)
Respondents who had not mentioned seeing warnings or messages on alcohol products in the earlier
unprompted question were subsequently asked about this in a prompted manner. The results below combine
both the unprompted and prompted awareness results and are based on all respondents.
Chart 22: Total awareness of warning messages on alcohol products
Base: All respondents (n=1,488), all women aged 18-34 years (n=387), and all women with children under 15 years (n=388)Source: Q1b, Q1d
23 25 24
1115 11
Total Young women Women with children
Prompted Unprompted
35
% Aware
Significantly greater/less than the total group
3440
Consumer awareness and understanding of alcohol pregnancy warning labels
Prepared by Colmar Brunton | 28-Oct-16 Page | 33
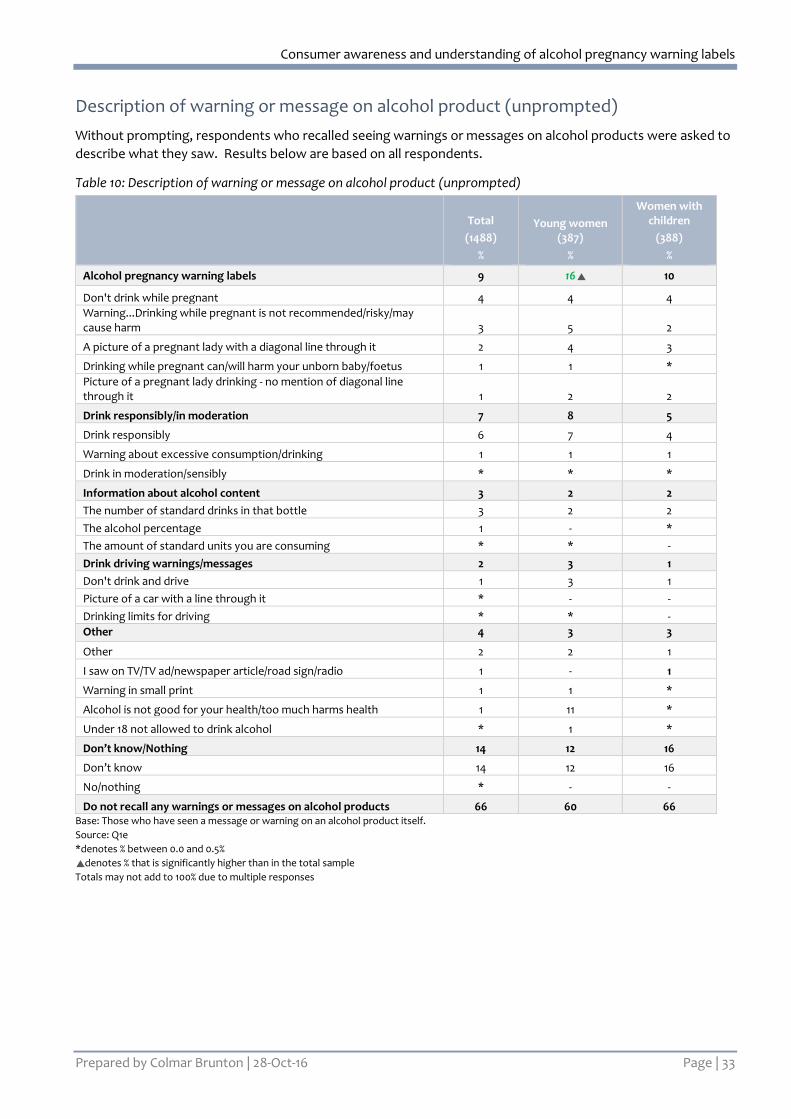
Description of warning or message on alcohol product (unprompted)
Without prompting, respondents who recalled seeing warnings or messages on alcohol products were asked to
describe what they saw. Results below are based on all respondents.
Table 10: Description of warning or message on alcohol product (unprompted)
Total
(1488)
%
Young women (387)
%
Women with children
(388)
%
Alcohol pregnancy warning labels 9 16 10
Don't drink while pregnant 4 4 4
Warning...Drinking while pregnant is not recommended/risky/may cause harm 3 5 2
A picture of a pregnant lady with a diagonal line through it 2 4 3
Drinking while pregnant can/will harm your unborn baby/foetus 1 1 *
Picture of a pregnant lady drinking - no mention of diagonal line through it 1 2 2
Drink responsibly/in moderation 7 8 5
Drink responsibly 6 7 4
Warning about excessive consumption/drinking 1 1 1
Drink in moderation/sensibly * * *
Information about alcohol content 3 2 2
The number of standard drinks in that bottle 3 2 2
The alcohol percentage 1 - *
The amount of standard units you are consuming * * -
Drink driving warnings/messages 2 3 1
Don't drink and drive 1 3 1
Picture of a car with a line through it * - -
Drinking limits for driving * * -
Other 4 3 3
Other 2 2 1
I saw on TV/TV ad/newspaper article/road sign/radio 1 - 1
Warning in small print 1 1 *
Alcohol is not good for your health/too much harms health 1 11 *
Under 18 not allowed to drink alcohol * 1 *
Don’t know/Nothing 14 12 16
Don’t know 14 12 16
No/nothing * - -
Do not recall any warnings or messages on alcohol products 66 60 66 Base: Those who have seen a message or warning on an alcohol product itself.
Source: Q1e
*denotes % between 0.0 and 0.5%
denotes % that is significantly higher than in the total sample
Totals may not add to 100% due to multiple responses
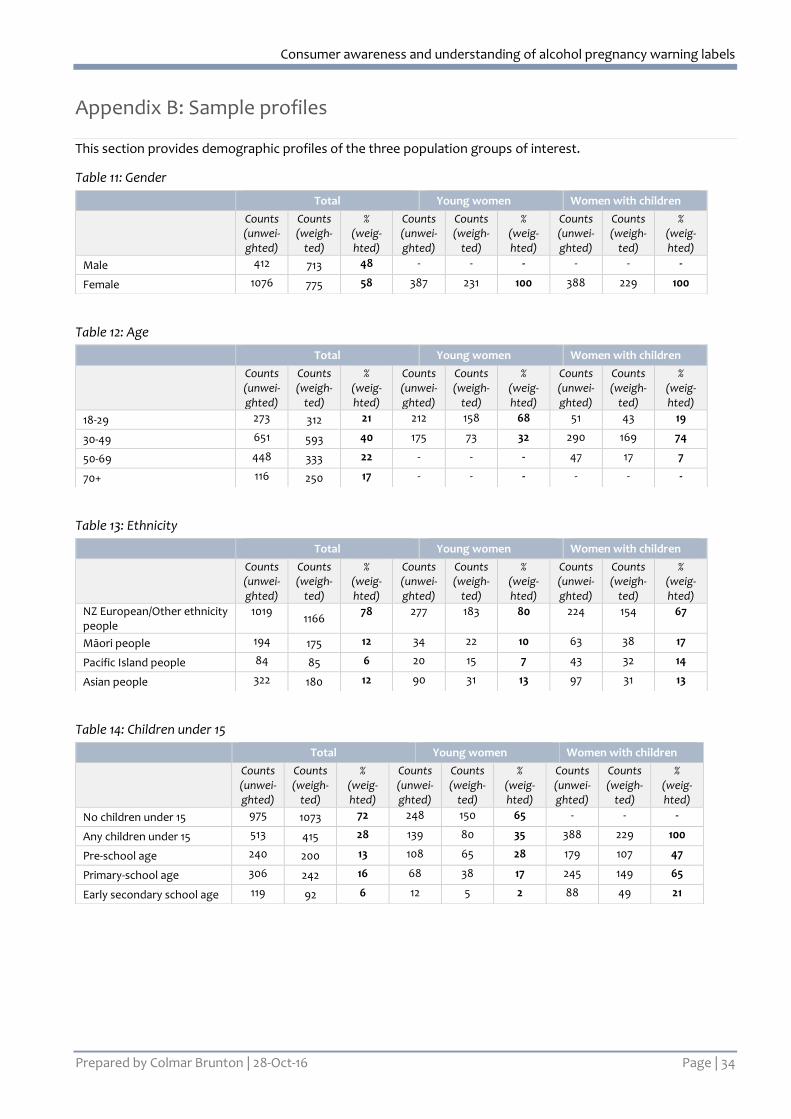
Consumer awareness and understanding of alcohol pregnancy warning labels
Prepared by Colmar Brunton | 28-Oct-16 Page | 34
Appendix B: Sample profiles
This section provides demographic profiles of the three population groups of interest.
Table 11: Gender
Table 12: Age
Table 13: Ethnicity
Table 14: Children under 15
Total Young women Women with children
Counts (unwei-ghted)
Counts (weigh-
ted)
% (weig-hted)
Counts (unwei-ghted)
Counts (weigh-
ted)
% (weig-hted)
Counts (unwei-ghted)
Counts (weigh-
ted)
% (weig-hted)
Male 412 713 48 - - - - - -
Female 1076 775 58 387 231 100 388 229 100
Total Young women Women with children
Counts (unwei-ghted)
Counts (weigh-
ted)
% (weig-hted)
Counts (unwei-ghted)
Counts (weigh-
ted)
% (weig-hted)
Counts (unwei-ghted)
Counts (weigh-
ted)
% (weig-hted)
18-29 273 312 21 212 158 68 51 43 19
30-49 651 593 40 175 73 32 290 169 74
50-69 448 333 22 - - - 47 17 7
70+ 116 250 17 - - - - - -
Total Young women Women with children
Counts (unwei-ghted)
Counts (weigh-
ted)
% (weig-hted)
Counts (unwei-ghted)
Counts (weigh-
ted)
% (weig-hted)
Counts (unwei-ghted)
Counts (weigh-
ted)
% (weig-hted)
NZ European/Other ethnicity people
1019 1166
78 277 183 80 224 154 67
Māori people 194 175 12 34 22 10 63 38 17
Pacific Island people 84 85 6 20 15 7 43 32 14
Asian people 322 180 12 90 31 13 97 31 13
Total Young women Women with children
Counts (unwei-ghted)
Counts (weigh-
ted)
% (weig-hted)
Counts (unwei-ghted)
Counts (weigh-
ted)
% (weig-hted)
Counts (unwei-ghted)
Counts (weigh-
ted)
% (weig-hted)
No children under 15 975 1073 72 248 150 65 - - -
Any children under 15 513 415 28 139 80 35 388 229 100
Pre-school age 240 200 13 108 65 28 179 107 47
Primary-school age 306 242 16 68 38 17 245 149 65
Early secondary school age 119 92 6 12 5 2 88 49 21
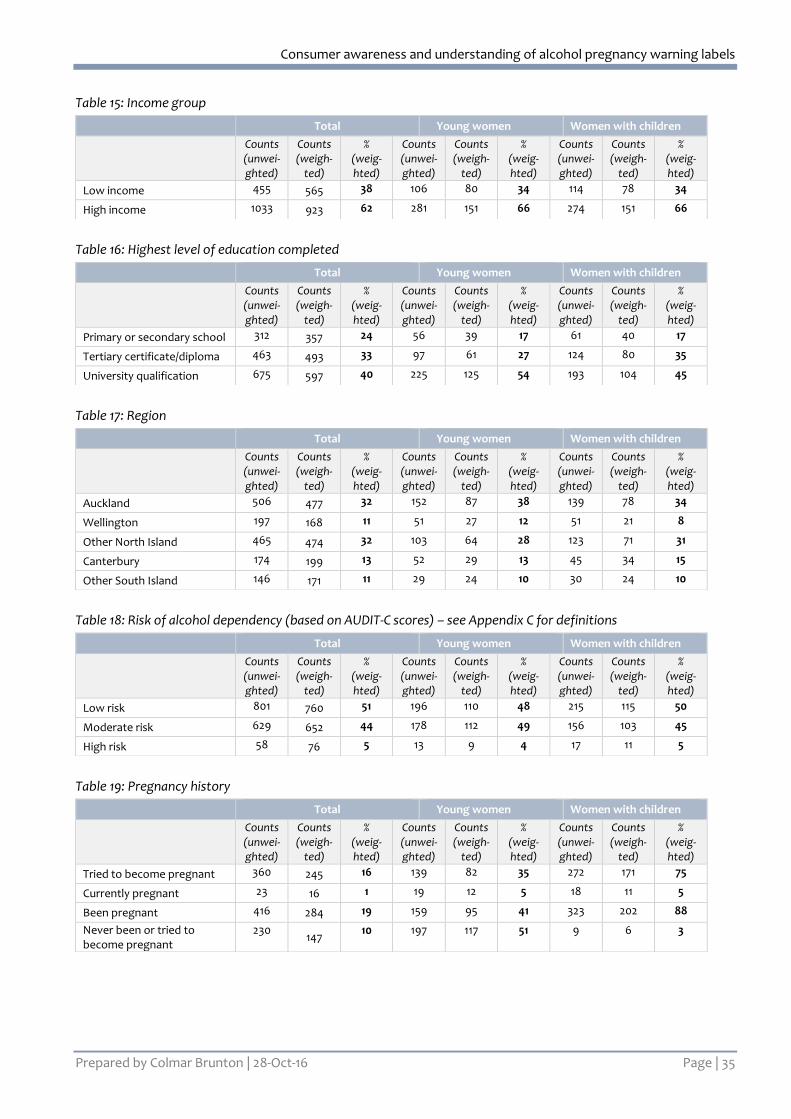
Consumer awareness and understanding of alcohol pregnancy warning labels
Prepared by Colmar Brunton | 28-Oct-16 Page | 35
Table 15: Income group
Table 16: Highest level of education completed
Table 17: Region
Table 18: Risk of alcohol dependency (based on AUDIT-C scores) – see Appendix C for definitions
Table 19: Pregnancy history
Total Young women Women with children
Counts (unwei-ghted)
Counts (weigh-
ted)
% (weig-hted)
Counts (unwei-ghted)
Counts (weigh-
ted)
% (weig-hted)
Counts (unwei-ghted)
Counts (weigh-
ted)
% (weig-hted)
Low income 455 565 38 106 80 34 114 78 34
High income 1033 923 62 281 151 66 274 151 66
Total Young women Women with children
Counts (unwei-ghted)
Counts (weigh-
ted)
% (weig-hted)
Counts (unwei-ghted)
Counts (weigh-
ted)
% (weig-hted)
Counts (unwei-ghted)
Counts (weigh-
ted)
% (weig-hted)
Primary or secondary school 312 357 24 56 39 17 61 40 17
Tertiary certificate/diploma 463 493 33 97 61 27 124 80 35
University qualification 675 597 40 225 125 54 193 104 45
Total Young women Women with children
Counts (unwei-ghted)
Counts (weigh-
ted)
% (weig-hted)
Counts (unwei-ghted)
Counts (weigh-
ted)
% (weig-hted)
Counts (unwei-ghted)
Counts (weigh-
ted)
% (weig-hted)
Auckland 506 477 32 152 87 38 139 78 34
Wellington 197 168 11 51 27 12 51 21 8
Other North Island 465 474 32 103 64 28 123 71 31
Canterbury 174 199 13 52 29 13 45 34 15
Other South Island 146 171 11 29 24 10 30 24 10
Total Young women Women with children
Counts (unwei-ghted)
Counts (weigh-
ted)
% (weig-hted)
Counts (unwei-ghted)
Counts (weigh-
ted)
% (weig-hted)
Counts (unwei-ghted)
Counts (weigh-
ted)
% (weig-hted)
Low risk 801 760 51 196 110 48 215 115 50
Moderate risk 629 652 44 178 112 49 156 103 45
High risk 58 76 5 13 9 4 17 11 5
Total Young women Women with children
Counts (unwei-ghted)
Counts (weigh-
ted)
% (weig-hted)
Counts (unwei-ghted)
Counts (weigh-
ted)
% (weig-hted)
Counts (unwei-ghted)
Counts (weigh-
ted)
% (weig-hted)
Tried to become pregnant 360 245 16 139 82 35 272 171 75
Currently pregnant 23 16 1 19 12 5 18 11 5
Been pregnant 416 284 19 159 95 41 323 202 88
Never been or tried to become pregnant
230 147
10 197 117 51 9 6 3
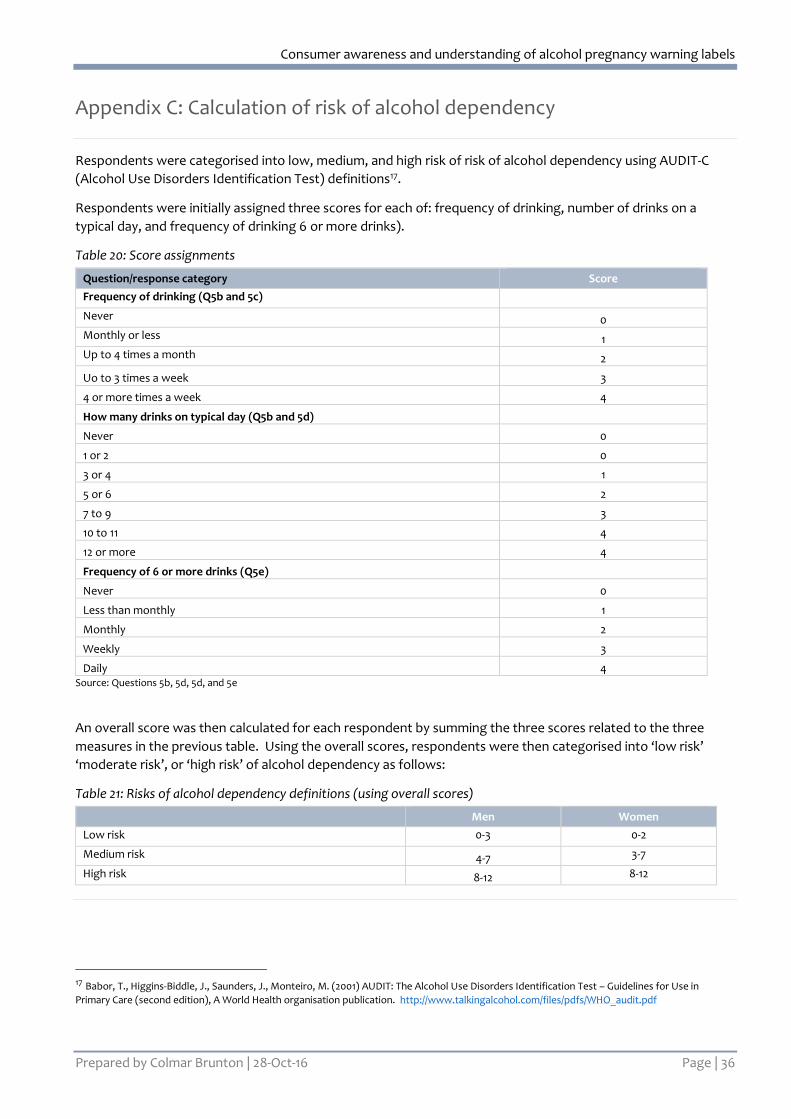
Consumer awareness and understanding of alcohol pregnancy warning labels
Prepared by Colmar Brunton | 28-Oct-16 Page | 36
Appendix C: Calculation of risk of alcohol dependency
Respondents were categorised into low, medium, and high risk of risk of alcohol dependency using AUDIT-C
(Alcohol Use Disorders Identification Test) definitions17.
Respondents were initially assigned three scores for each of: frequency of drinking, number of drinks on a
typical day, and frequency of drinking 6 or more drinks).
Table 20: Score assignments
Question/response category Score
Frequency of drinking (Q5b and 5c)
Never 0
Monthly or less 1
Up to 4 times a month 2
Uo to 3 times a week 3
4 or more times a week 4
How many drinks on typical day (Q5b and 5d)
Never 0
1 or 2 0
3 or 4 1
5 or 6 2
7 to 9 3
10 to 11 4
12 or more 4
Frequency of 6 or more drinks (Q5e)
Never 0
Less than monthly 1
Monthly 2
Weekly 3
Daily 4 Source: Questions 5b, 5d, 5d, and 5e
An overall score was then calculated for each respondent by summing the three scores related to the three
measures in the previous table. Using the overall scores, respondents were then categorised into ‘low risk’
‘moderate risk’, or ‘high risk’ of alcohol dependency as follows:
Table 21: Risks of alcohol dependency definitions (using overall scores)
Men Women
Low risk 0-3 0-2
Medium risk 4-7 3-7
High risk 8-12 8-12
17 Babor, T., Higgins-Biddle, J., Saunders, J., Monteiro, M. (2001) AUDIT: The Alcohol Use Disorders Identification Test – Guidelines for Use in
Primary Care (second edition), A World Health organisation publication. http://www.talkingalcohol.com/files/pdfs/WHO_audit.pdf
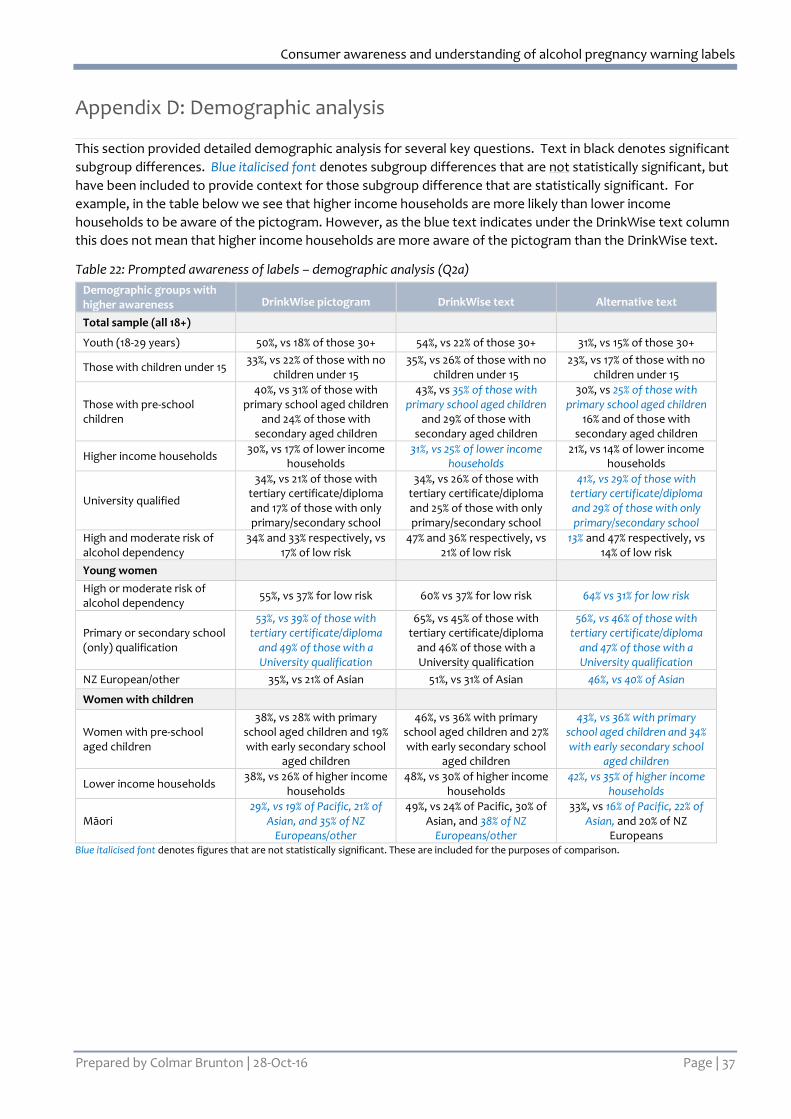
Consumer awareness and understanding of alcohol pregnancy warning labels
Prepared by Colmar Brunton | 28-Oct-16 Page | 37
Appendix D: Demographic analysis
This section provided detailed demographic analysis for several key questions. Text in black denotes significant
subgroup differences. Blue italicised font denotes subgroup differences that are not statistically significant, but
have been included to provide context for those subgroup difference that are statistically significant. For
example, in the table below we see that higher income households are more likely than lower income
households to be aware of the pictogram. However, as the blue text indicates under the DrinkWise text column
this does not mean that higher income households are more aware of the pictogram than the DrinkWise text.
Table 22: Prompted awareness of labels – demographic analysis (Q2a)
Demographic groups with higher awareness DrinkWise pictogram DrinkWise text Alternative text
Total sample (all 18+)
Youth (18-29 years) 50%, vs 18% of those 30+ 54%, vs 22% of those 30+ 31%, vs 15% of those 30+
Those with children under 15 33%, vs 22% of those with no
children under 15 35%, vs 26% of those with no
children under 15 23%, vs 17% of those with no
children under 15
Those with pre-school children
40%, vs 31% of those with primary school aged children
and 24% of those with secondary aged children
43%, vs 35% of those with primary school aged children
and 29% of those with secondary aged children
30%, vs 25% of those with primary school aged children
16% and of those with secondary aged children
Higher income households 30%, vs 17% of lower income
households 31%, vs 25% of lower income
households 21%, vs 14% of lower income
households
University qualified
34%, vs 21% of those with tertiary certificate/diploma and 17% of those with only primary/secondary school
34%, vs 26% of those with tertiary certificate/diploma and 25% of those with only primary/secondary school
41%, vs 29% of those with tertiary certificate/diploma and 29% of those with only primary/secondary school
High and moderate risk of alcohol dependency
34% and 33% respectively, vs 17% of low risk
47% and 36% respectively, vs 21% of low risk
13% and 47% respectively, vs 14% of low risk
Young women
High or moderate risk of alcohol dependency
55%, vs 37% for low risk 60% vs 37% for low risk 64% vs 31% for low risk
Primary or secondary school (only) qualification
53%, vs 39% of those with tertiary certificate/diploma
and 49% of those with a University qualification
65%, vs 45% of those with tertiary certificate/diploma
and 46% of those with a University qualification
56%, vs 46% of those with tertiary certificate/diploma
and 47% of those with a University qualification
NZ European/other 35%, vs 21% of Asian 51%, vs 31% of Asian 46%, vs 40% of Asian
Women with children
Women with pre-school aged children
38%, vs 28% with primary school aged children and 19% with early secondary school
aged children
46%, vs 36% with primary school aged children and 27% with early secondary school
aged children
43%, vs 36% with primary school aged children and 34% with early secondary school
aged children
Lower income households 38%, vs 26% of higher income
households 48%, vs 30% of higher income
households 42%, vs 35% of higher income
households
Māori 29%, vs 19% of Pacific, 21% of
Asian, and 35% of NZ Europeans/other
49%, vs 24% of Pacific, 30% of Asian, and 38% of NZ
Europeans/other
33%, vs 16% of Pacific, 22% of Asian, and 20% of NZ
Europeans Blue italicised font denotes figures that are not statistically significant. These are included for the purposes of comparison.
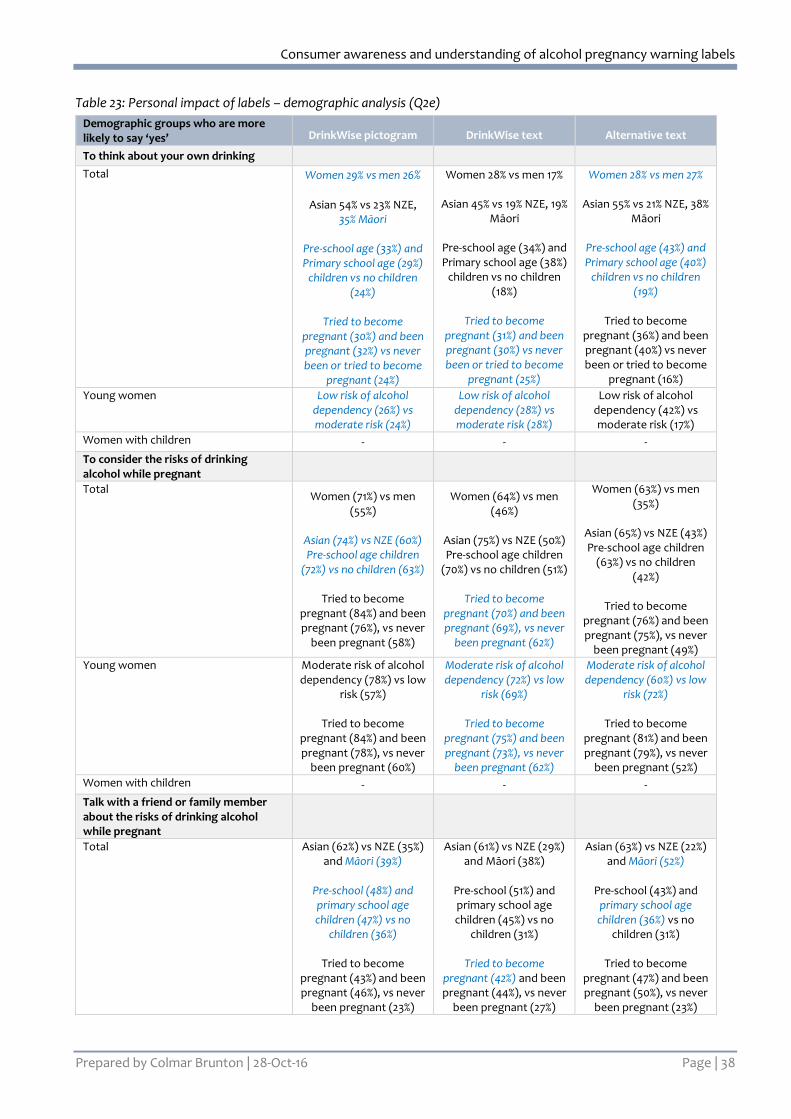
Consumer awareness and understanding of alcohol pregnancy warning labels
Prepared by Colmar Brunton | 28-Oct-16 Page | 38
Table 23: Personal impact of labels – demographic analysis (Q2e)
Demographic groups who are more likely to say ‘yes’ DrinkWise pictogram DrinkWise text Alternative text
To think about your own drinking
Total Women 29% vs men 26%
Asian 54% vs 23% NZE,
35% Māori
Pre-school age (33%) and Primary school age (29%)
children vs no children (24%)
Tried to become
pregnant (30%) and been pregnant (32%) vs never been or tried to become
pregnant (24%)
Women 28% vs men 17%
Asian 45% vs 19% NZE, 19% Māori
Pre-school age (34%) and Primary school age (38%)
children vs no children (18%)
Tried to become
pregnant (31%) and been pregnant (30%) vs never been or tried to become
pregnant (25%)
Women 28% vs men 27%
Asian 55% vs 21% NZE, 38% Māori
Pre-school age (43%) and Primary school age (40%)
children vs no children (19%)
Tried to become
pregnant (36%) and been pregnant (40%) vs never been or tried to become
pregnant (16%)
Young women Low risk of alcohol dependency (26%) vs moderate risk (24%)
Low risk of alcohol dependency (28%) vs moderate risk (28%)
Low risk of alcohol dependency (42%) vs moderate risk (17%)
Women with children - - -
To consider the risks of drinking alcohol while pregnant
Total Women (71%) vs men
(55%)
Asian (74%) vs NZE (60%) Pre-school age children
(72%) vs no children (63%)
Tried to become pregnant (84%) and been pregnant (76%), vs never
been pregnant (58%)
Women (64%) vs men (46%)
Asian (75%) vs NZE (50%) Pre-school age children
(70%) vs no children (51%)
Tried to become pregnant (70%) and been pregnant (69%), vs never
been pregnant (62%)
Women (63%) vs men (35%)
Asian (65%) vs NZE (43%) Pre-school age children
(63%) vs no children (42%)
Tried to become
pregnant (76%) and been pregnant (75%), vs never
been pregnant (49%)
Young women Moderate risk of alcohol dependency (78%) vs low
risk (57%)
Tried to become pregnant (84%) and been pregnant (78%), vs never
been pregnant (60%)
Moderate risk of alcohol dependency (72%) vs low
risk (69%)
Tried to become pregnant (75%) and been pregnant (73%), vs never
been pregnant (62%)
Moderate risk of alcohol dependency (60%) vs low
risk (72%)
Tried to become pregnant (81%) and been pregnant (79%), vs never
been pregnant (52%)
Women with children - - -
Talk with a friend or family member about the risks of drinking alcohol while pregnant
Total Asian (62%) vs NZE (35%) and Māori (39%)
Pre-school (48%) and primary school age children (47%) vs no
children (36%)
Tried to become pregnant (43%) and been pregnant (46%), vs never
been pregnant (23%)
Asian (61%) vs NZE (29%) and Māori (38%)
Pre-school (51%) and primary school age children (45%) vs no
children (31%)
Tried to become pregnant (42%) and been pregnant (44%), vs never
been pregnant (27%)
Asian (63%) vs NZE (22%) and Māori (52%)
Pre-school (43%) and
primary school age children (36%) vs no
children (31%)
Tried to become pregnant (47%) and been pregnant (50%), vs never
been pregnant (23%)
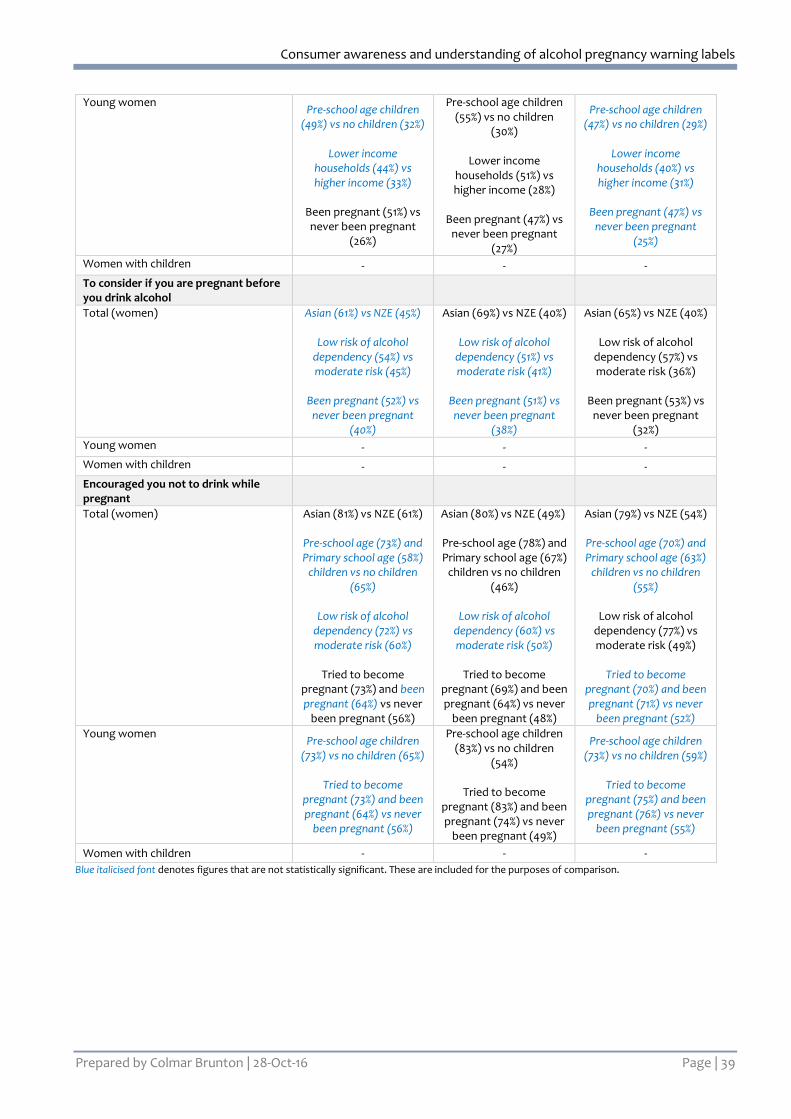
Consumer awareness and understanding of alcohol pregnancy warning labels
Prepared by Colmar Brunton | 28-Oct-16 Page | 39
Young women Pre-school age children
(49%) vs no children (32%)
Lower income households (44%) vs higher income (33%)
Been pregnant (51%) vs never been pregnant
(26%)
Pre-school age children (55%) vs no children
(30%)
Lower income households (51%) vs higher income (28%)
Been pregnant (47%) vs
never been pregnant (27%)
Pre-school age children (47%) vs no children (29%)
Lower income
households (40%) vs higher income (31%)
Been pregnant (47%) vs
never been pregnant (25%)
Women with children - - -
To consider if you are pregnant before you drink alcohol
Total (women) Asian (61%) vs NZE (45%)
Low risk of alcohol dependency (54%) vs moderate risk (45%)
Been pregnant (52%) vs
never been pregnant (40%)
Asian (69%) vs NZE (40%)
Low risk of alcohol dependency (51%) vs moderate risk (41%)
Been pregnant (51%) vs never been pregnant
(38%)
Asian (65%) vs NZE (40%)
Low risk of alcohol dependency (57%) vs moderate risk (36%)
Been pregnant (53%) vs
never been pregnant (32%)
Young women - - -
Women with children - - -
Encouraged you not to drink while pregnant
Total (women) Asian (81%) vs NZE (61%)
Pre-school age (73%) and Primary school age (58%)
children vs no children (65%)
Low risk of alcohol
dependency (72%) vs moderate risk (60%)
Tried to become
pregnant (73%) and been pregnant (64%) vs never
been pregnant (56%)
Asian (80%) vs NZE (49%)
Pre-school age (78%) and Primary school age (67%)
children vs no children (46%)
Low risk of alcohol
dependency (60%) vs moderate risk (50%)
Tried to become
pregnant (69%) and been pregnant (64%) vs never
been pregnant (48%)
Asian (79%) vs NZE (54%)
Pre-school age (70%) and Primary school age (63%)
children vs no children (55%)
Low risk of alcohol
dependency (77%) vs moderate risk (49%)
Tried to become
pregnant (70%) and been pregnant (71%) vs never
been pregnant (52%)
Young women Pre-school age children
(73%) vs no children (65%)
Tried to become pregnant (73%) and been pregnant (64%) vs never
been pregnant (56%)
Pre-school age children (83%) vs no children
(54%)
Tried to become pregnant (83%) and been pregnant (74%) vs never
been pregnant (49%)
Pre-school age children (73%) vs no children (59%)
Tried to become
pregnant (75%) and been pregnant (76%) vs never
been pregnant (55%)
Women with children - - -
Blue italicised font denotes figures that are not statistically significant. These are included for the purposes of comparison.
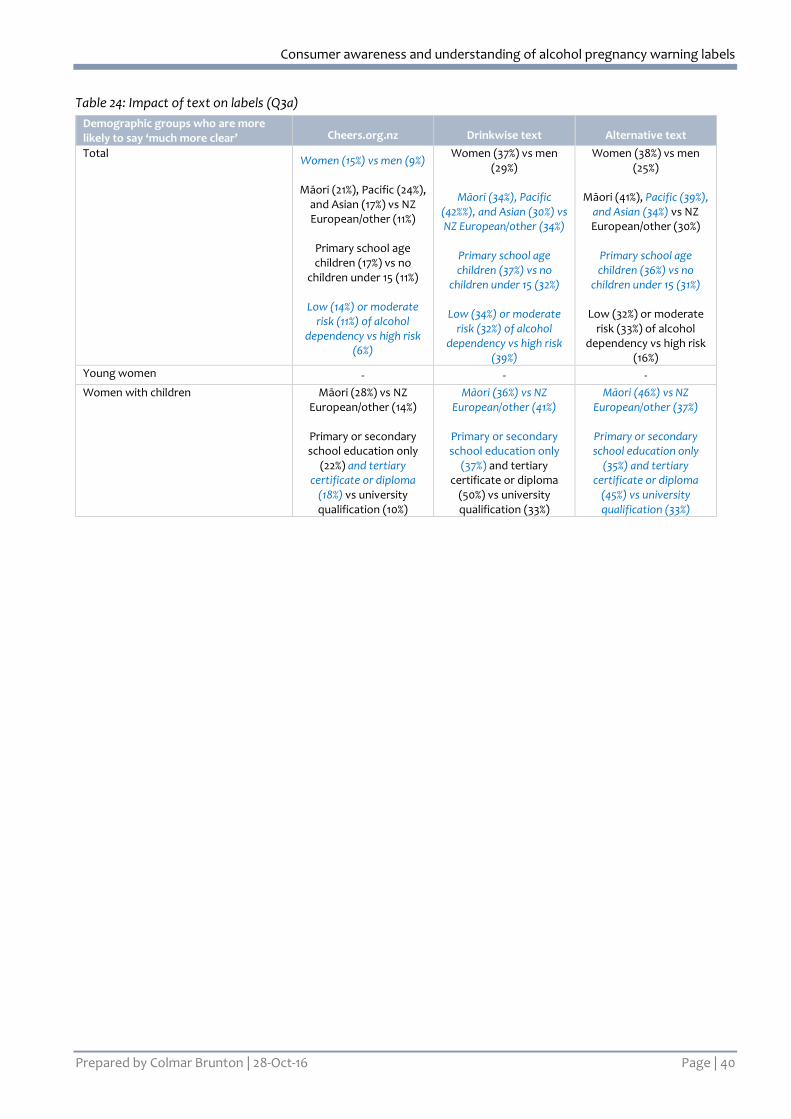
Consumer awareness and understanding of alcohol pregnancy warning labels
Prepared by Colmar Brunton | 28-Oct-16 Page | 40
Table 24: Impact of text on labels (Q3a)
Demographic groups who are more likely to say ‘much more clear’ Cheers.org.nz Drinkwise text Alternative text
Total Women (15%) vs men (9%)
Māori (21%), Pacific (24%),
and Asian (17%) vs NZ European/other (11%)
Primary school age children (17%) vs no
children under 15 (11%)
Low (14%) or moderate risk (11%) of alcohol
dependency vs high risk (6%)
Women (37%) vs men (29%)
Māori (34%), Pacific
(42%%), and Asian (30%) vs NZ European/other (34%)
Primary school age children (37%) vs no
children under 15 (32%)
Low (34%) or moderate risk (32%) of alcohol
dependency vs high risk (39%)
Women (38%) vs men (25%)
Māori (41%), Pacific (39%),
and Asian (34%) vs NZ European/other (30%)
Primary school age children (36%) vs no
children under 15 (31%)
Low (32%) or moderate risk (33%) of alcohol
dependency vs high risk (16%)
Young women - - -
Women with children Māori (28%) vs NZ European/other (14%)
Primary or secondary school education only
(22%) and tertiary certificate or diploma
(18%) vs university qualification (10%)
Māori (36%) vs NZ European/other (41%)
Primary or secondary school education only
(37%) and tertiary certificate or diploma
(50%) vs university qualification (33%)
Māori (46%) vs NZ European/other (37%)
Primary or secondary school education only
(35%) and tertiary certificate or diploma
(45%) vs university qualification (33%)
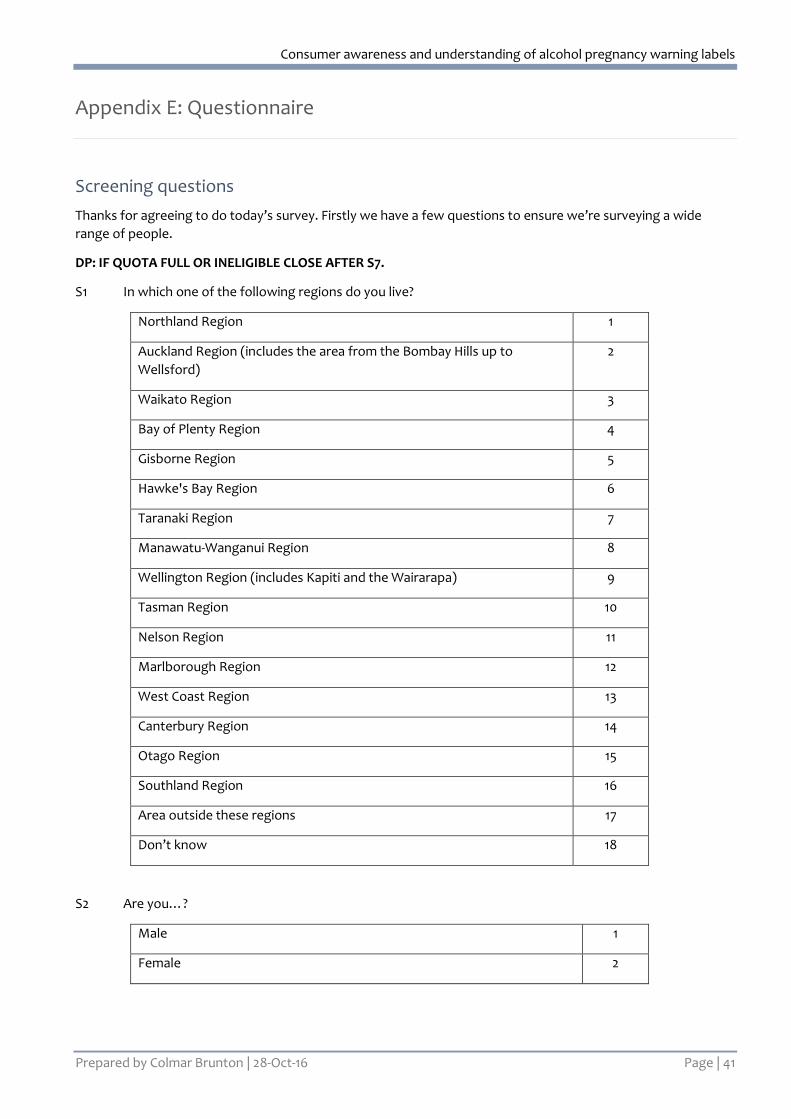
Consumer awareness and understanding of alcohol pregnancy warning labels
Prepared by Colmar Brunton | 28-Oct-16 Page | 41
Appendix E: Questionnaire
Screening questions
Thanks for agreeing to do today’s survey. Firstly we have a few questions to ensure we’re surveying a wide
range of people.
DP: IF QUOTA FULL OR INELIGIBLE CLOSE AFTER S7.
S1 In which one of the following regions do you live?
Northland Region 1
Auckland Region (includes the area from the Bombay Hills up to
Wellsford)
2
Waikato Region 3
Bay of Plenty Region 4
Gisborne Region 5
Hawke's Bay Region 6
Taranaki Region 7
Manawatu-Wanganui Region 8
Wellington Region (includes Kapiti and the Wairarapa) 9
Tasman Region 10
Nelson Region 11
Marlborough Region 12
West Coast Region 13
Canterbury Region 14
Otago Region 15
Southland Region 16
Area outside these regions 17
Don’t know 18
S2 Are you…?
Male 1
Female 2
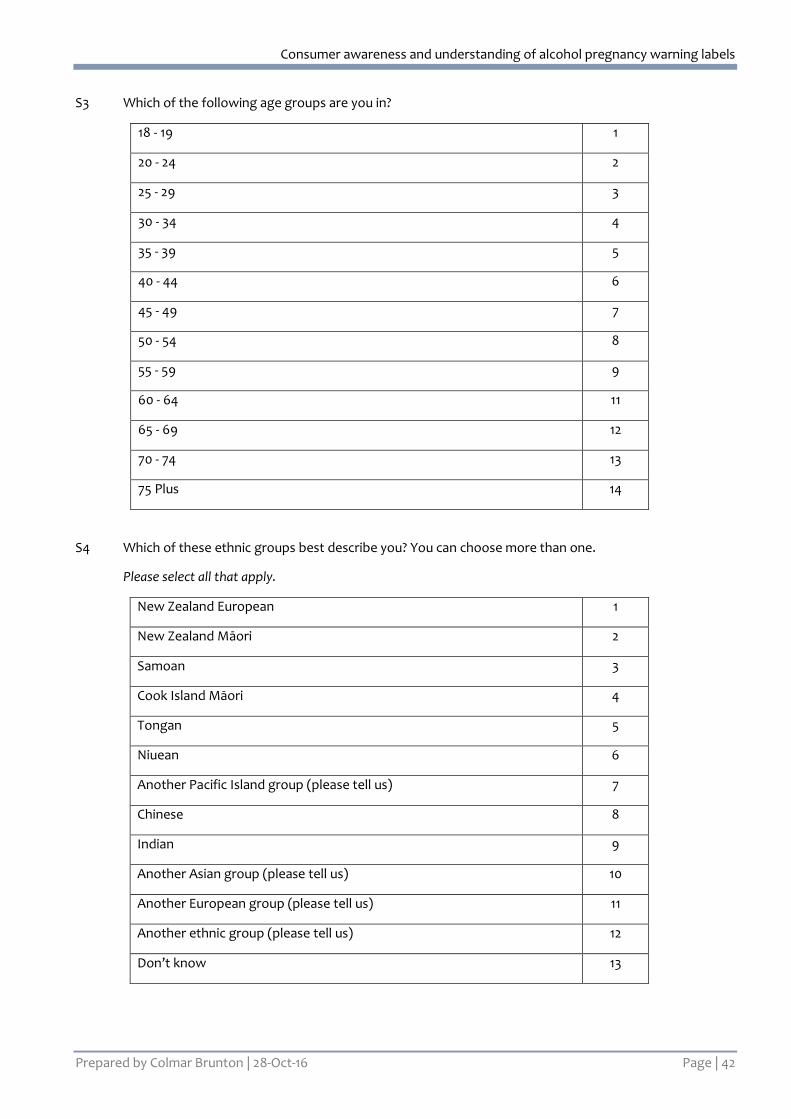
Consumer awareness and understanding of alcohol pregnancy warning labels
Prepared by Colmar Brunton | 28-Oct-16 Page | 42
S3 Which of the following age groups are you in?
18 - 19 1
20 - 24 2
25 - 29 3
30 - 34 4
35 - 39 5
40 - 44 6
45 - 49 7
50 - 54 8
55 - 59 9
60 - 64 11
65 - 69 12
70 - 74 13
75 Plus 14
S4 Which of these ethnic groups best describe you? You can choose more than one.
Please select all that apply.
New Zealand European 1
New Zealand Māori 2
Samoan 3
Cook Island Māori 4
Tongan 5
Niuean 6
Another Pacific Island group (please tell us) 7
Chinese 8
Indian 9
Another Asian group (please tell us) 10
Another European group (please tell us) 11
Another ethnic group (please tell us) 12
Don’t know 13
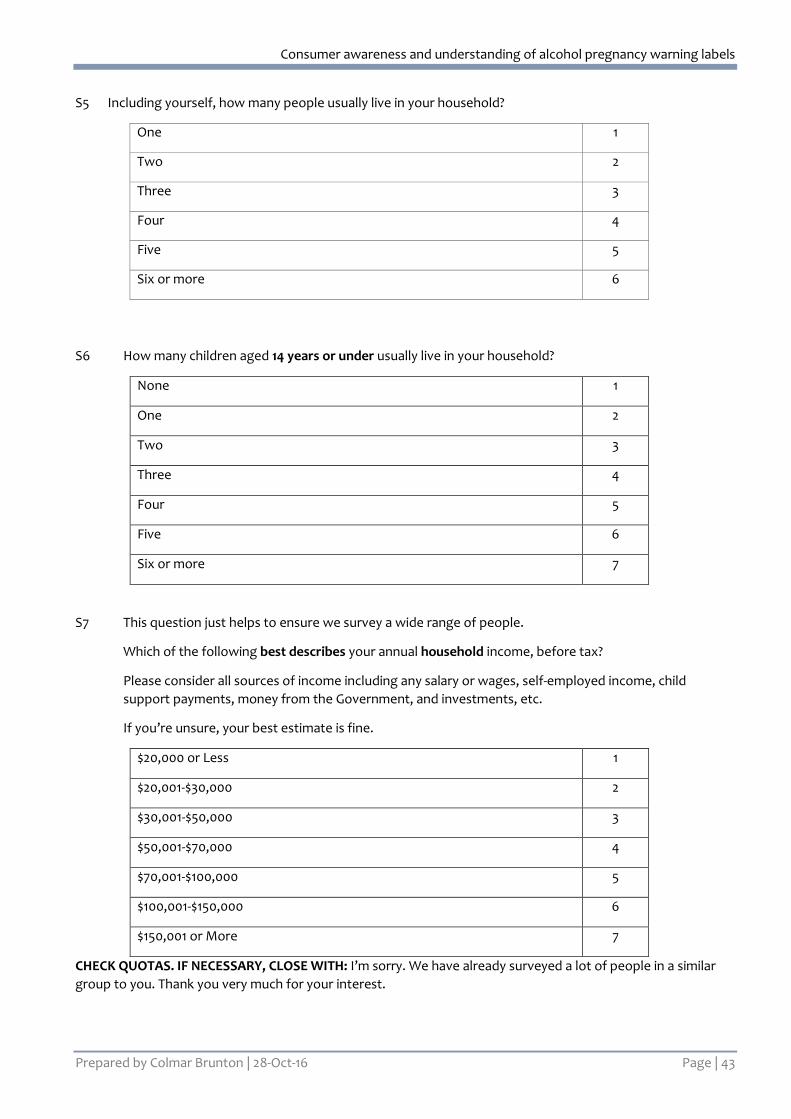
Consumer awareness and understanding of alcohol pregnancy warning labels
Prepared by Colmar Brunton | 28-Oct-16 Page | 43
S5 Including yourself, how many people usually live in your household?
One 1
Two 2
Three 3
Four 4
Five 5
Six or more 6
S6 How many children aged 14 years or under usually live in your household?
None 1
One 2
Two 3
Three 4
Four 5
Five 6
Six or more 7
S7 This question just helps to ensure we survey a wide range of people.
Which of the following best describes your annual household income, before tax?
Please consider all sources of income including any salary or wages, self-employed income, child
support payments, money from the Government, and investments, etc.
If you’re unsure, your best estimate is fine.
$20,000 or Less 1
$20,001-$30,000 2
$30,001-$50,000 3
$50,001-$70,000 4
$70,001-$100,000 5
$100,001-$150,000 6
$150,001 or More 7
CHECK QUOTAS. IF NECESSARY, CLOSE WITH: I’m sorry. We have already surveyed a lot of people in a similar
group to you. Thank you very much for your interest.
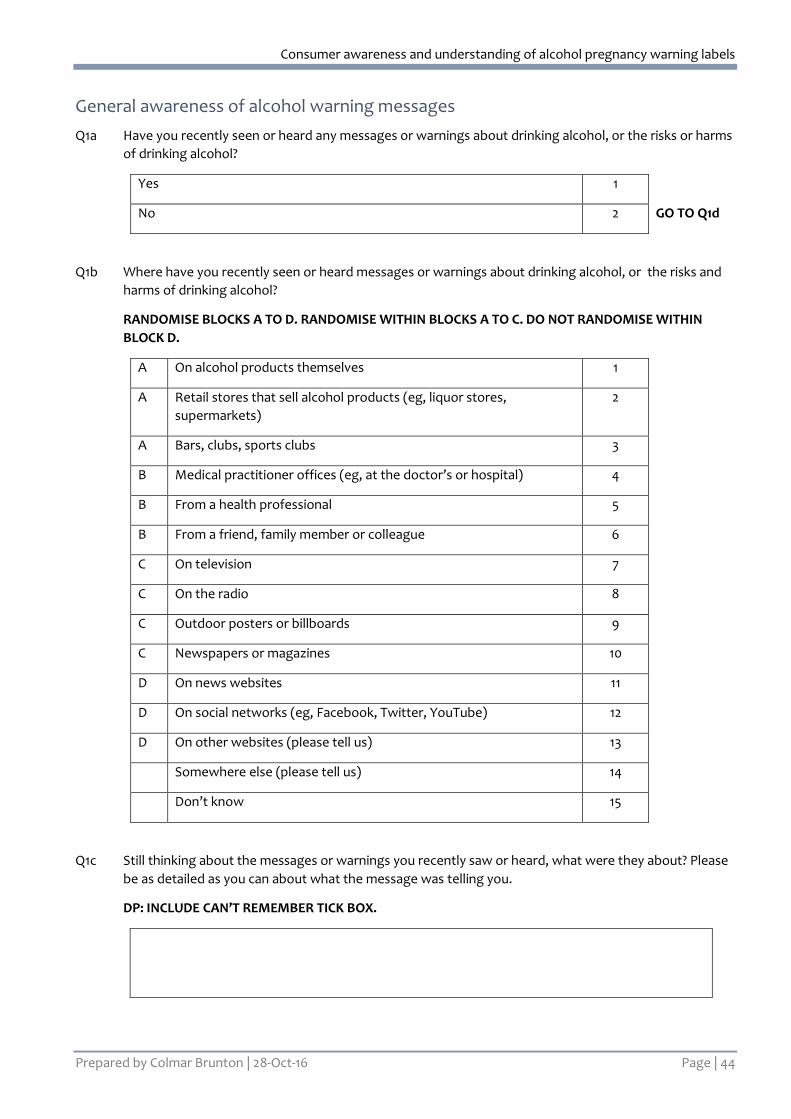
Consumer awareness and understanding of alcohol pregnancy warning labels
Prepared by Colmar Brunton | 28-Oct-16 Page | 44
General awareness of alcohol warning messages
Q1a Have you recently seen or heard any messages or warnings about drinking alcohol, or the risks or harms
of drinking alcohol?
Yes 1
No 2 GO TO Q1d
Q1b Where have you recently seen or heard messages or warnings about drinking alcohol, or the risks and
harms of drinking alcohol?
RANDOMISE BLOCKS A TO D. RANDOMISE WITHIN BLOCKS A TO C. DO NOT RANDOMISE WITHIN
BLOCK D.
A On alcohol products themselves 1
A Retail stores that sell alcohol products (eg, liquor stores,
supermarkets)
2
A Bars, clubs, sports clubs 3
B Medical practitioner offices (eg, at the doctor’s or hospital) 4
B From a health professional 5
B From a friend, family member or colleague 6
C On television 7
C On the radio 8
C Outdoor posters or billboards 9
C Newspapers or magazines 10
D On news websites 11
D On social networks (eg, Facebook, Twitter, YouTube) 12
D On other websites (please tell us) 13
Somewhere else (please tell us) 14
Don’t know 15
Q1c Still thinking about the messages or warnings you recently saw or heard, what were they about? Please
be as detailed as you can about what the message was telling you.
DP: INCLUDE CAN’T REMEMBER TICK BOX.
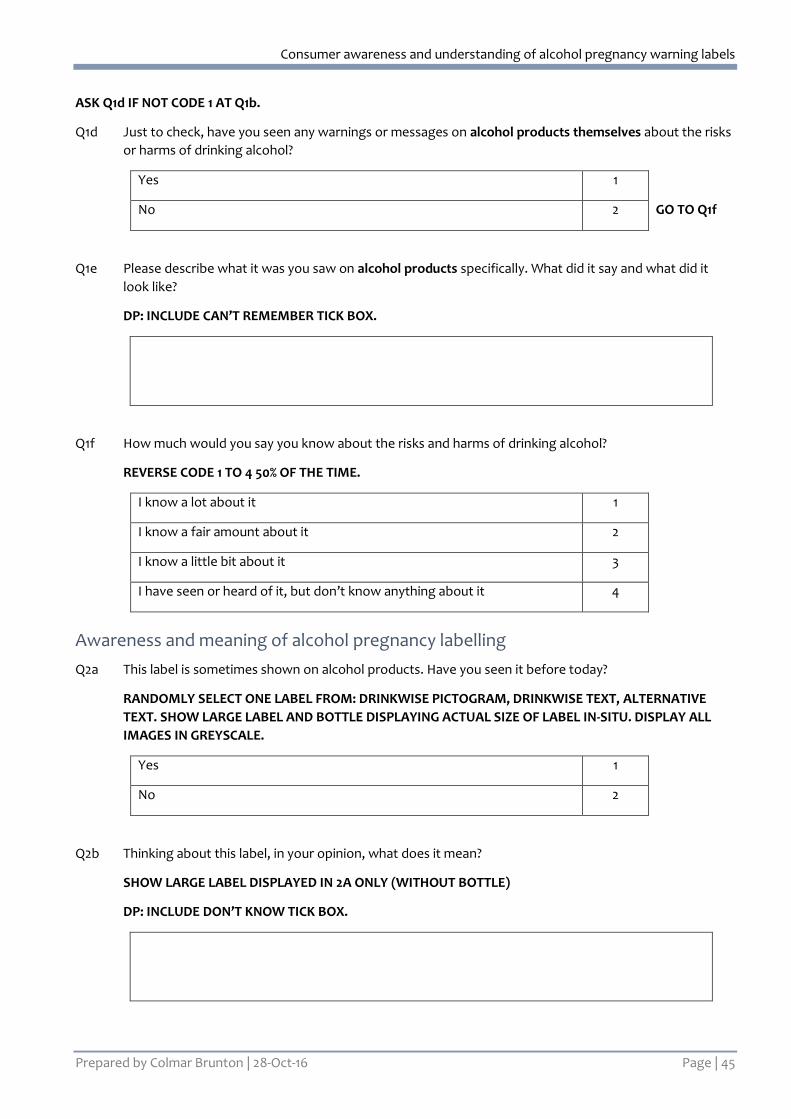
Consumer awareness and understanding of alcohol pregnancy warning labels
Prepared by Colmar Brunton | 28-Oct-16 Page | 45
ASK Q1d IF NOT CODE 1 AT Q1b.
Q1d Just to check, have you seen any warnings or messages on alcohol products themselves about the risks
or harms of drinking alcohol?
Yes 1
No 2 GO TO Q1f
Q1e Please describe what it was you saw on alcohol products specifically. What did it say and what did it
look like?
DP: INCLUDE CAN’T REMEMBER TICK BOX.
Q1f How much would you say you know about the risks and harms of drinking alcohol?
REVERSE CODE 1 TO 4 50% OF THE TIME.
I know a lot about it 1
I know a fair amount about it 2
I know a little bit about it 3
I have seen or heard of it, but don’t know anything about it 4
Awareness and meaning of alcohol pregnancy labelling
Q2a This label is sometimes shown on alcohol products. Have you seen it before today?
RANDOMLY SELECT ONE LABEL FROM: DRINKWISE PICTOGRAM, DRINKWISE TEXT, ALTERNATIVE
TEXT. SHOW LARGE LABEL AND BOTTLE DISPLAYING ACTUAL SIZE OF LABEL IN-SITU. DISPLAY ALL
IMAGES IN GREYSCALE.
Yes 1
No 2
Q2b Thinking about this label, in your opinion, what does it mean?
SHOW LARGE LABEL DISPLAYED IN 2A ONLY (WITHOUT BOTTLE)
DP: INCLUDE DON’T KNOW TICK BOX.
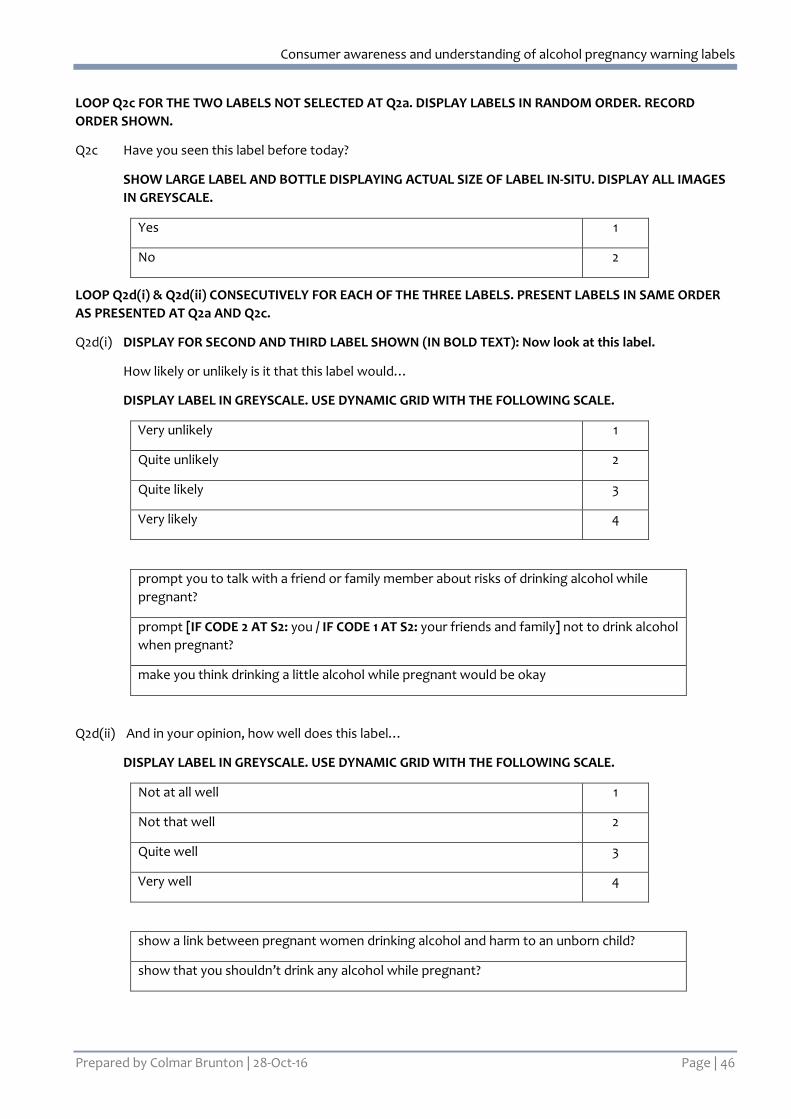
Consumer awareness and understanding of alcohol pregnancy warning labels
Prepared by Colmar Brunton | 28-Oct-16 Page | 46
LOOP Q2c FOR THE TWO LABELS NOT SELECTED AT Q2a. DISPLAY LABELS IN RANDOM ORDER. RECORD
ORDER SHOWN.
Q2c Have you seen this label before today?
SHOW LARGE LABEL AND BOTTLE DISPLAYING ACTUAL SIZE OF LABEL IN-SITU. DISPLAY ALL IMAGES
IN GREYSCALE.
Yes 1
No 2
LOOP Q2d(i) & Q2d(ii) CONSECUTIVELY FOR EACH OF THE THREE LABELS. PRESENT LABELS IN SAME ORDER
AS PRESENTED AT Q2a AND Q2c.
Q2d(i) DISPLAY FOR SECOND AND THIRD LABEL SHOWN (IN BOLD TEXT): Now look at this label.
How likely or unlikely is it that this label would…
DISPLAY LABEL IN GREYSCALE. USE DYNAMIC GRID WITH THE FOLLOWING SCALE.
Very unlikely 1
Quite unlikely 2
Quite likely 3
Very likely 4
prompt you to talk with a friend or family member about risks of drinking alcohol while
pregnant?
prompt [IF CODE 2 AT S2: you / IF CODE 1 AT S2: your friends and family] not to drink alcohol
when pregnant?
make you think drinking a little alcohol while pregnant would be okay
Q2d(ii) And in your opinion, how well does this label…
DISPLAY LABEL IN GREYSCALE. USE DYNAMIC GRID WITH THE FOLLOWING SCALE.
Not at all well 1
Not that well 2
Quite well 3
Very well 4
show a link between pregnant women drinking alcohol and harm to an unborn child?
show that you shouldn’t drink any alcohol while pregnant?
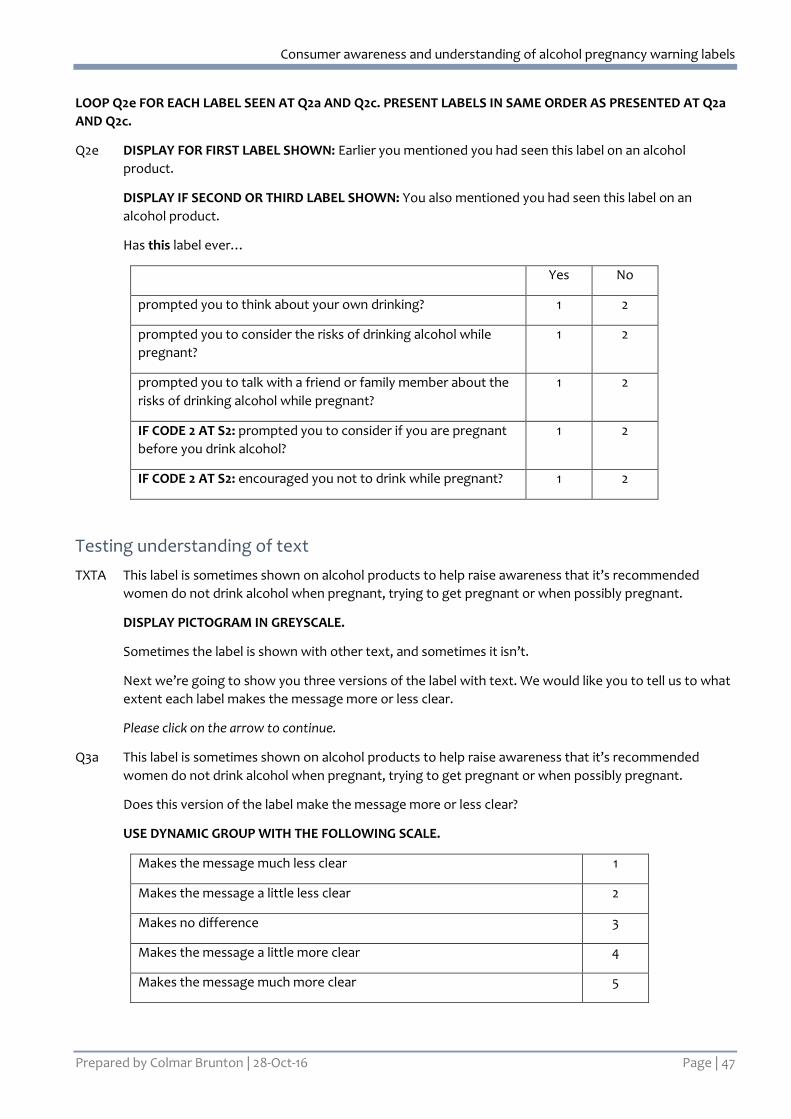
Consumer awareness and understanding of alcohol pregnancy warning labels
Prepared by Colmar Brunton | 28-Oct-16 Page | 47
LOOP Q2e FOR EACH LABEL SEEN AT Q2a AND Q2c. PRESENT LABELS IN SAME ORDER AS PRESENTED AT Q2a
AND Q2c.
Q2e DISPLAY FOR FIRST LABEL SHOWN: Earlier you mentioned you had seen this label on an alcohol
product.
DISPLAY IF SECOND OR THIRD LABEL SHOWN: You also mentioned you had seen this label on an
alcohol product.
Has this label ever…
Yes No
prompted you to think about your own drinking? 1 2
prompted you to consider the risks of drinking alcohol while
pregnant?
1 2
prompted you to talk with a friend or family member about the
risks of drinking alcohol while pregnant?
1 2
IF CODE 2 AT S2: prompted you to consider if you are pregnant
before you drink alcohol?
1 2
IF CODE 2 AT S2: encouraged you not to drink while pregnant? 1 2
Testing understanding of text
TXTA This label is sometimes shown on alcohol products to help raise awareness that it’s recommended
women do not drink alcohol when pregnant, trying to get pregnant or when possibly pregnant.
DISPLAY PICTOGRAM IN GREYSCALE.
Sometimes the label is shown with other text, and sometimes it isn’t.
Next we’re going to show you three versions of the label with text. We would like you to tell us to what
extent each label makes the message more or less clear.
Please click on the arrow to continue.
Q3a This label is sometimes shown on alcohol products to help raise awareness that it’s recommended
women do not drink alcohol when pregnant, trying to get pregnant or when possibly pregnant.
Does this version of the label make the message more or less clear?
USE DYNAMIC GROUP WITH THE FOLLOWING SCALE.
Makes the message much less clear 1
Makes the message a little less clear 2
Makes no difference 3
Makes the message a little more clear 4
Makes the message much more clear 5
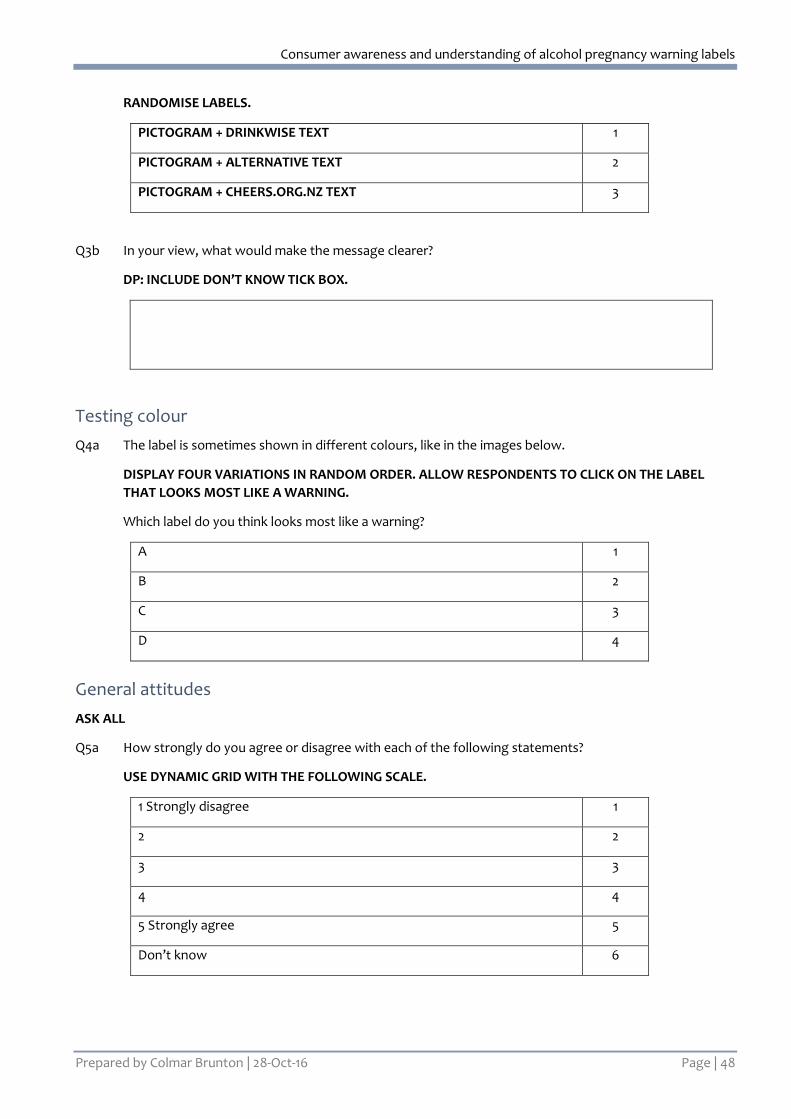
Consumer awareness and understanding of alcohol pregnancy warning labels
Prepared by Colmar Brunton | 28-Oct-16 Page | 48
RANDOMISE LABELS.
PICTOGRAM + DRINKWISE TEXT 1
PICTOGRAM + ALTERNATIVE TEXT 2
PICTOGRAM + CHEERS.ORG.NZ TEXT 3
Q3b In your view, what would make the message clearer?
DP: INCLUDE DON’T KNOW TICK BOX.
Testing colour
Q4a The label is sometimes shown in different colours, like in the images below.
DISPLAY FOUR VARIATIONS IN RANDOM ORDER. ALLOW RESPONDENTS TO CLICK ON THE LABEL
THAT LOOKS MOST LIKE A WARNING.
Which label do you think looks most like a warning?
A 1
B 2
C 3
D 4
General attitudes
ASK ALL
Q5a How strongly do you agree or disagree with each of the following statements?
USE DYNAMIC GRID WITH THE FOLLOWING SCALE.
1 Strongly disagree 1
2 2
3 3
4 4
5 Strongly agree 5
Don’t know 6
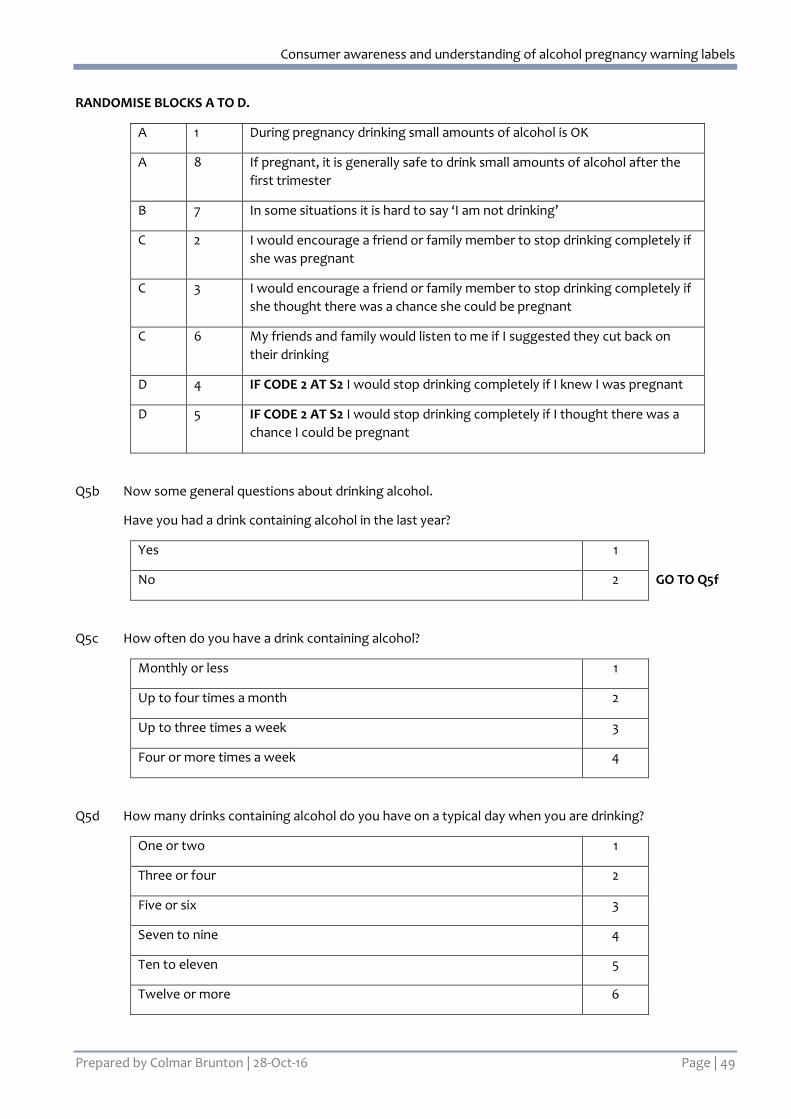
Consumer awareness and understanding of alcohol pregnancy warning labels
Prepared by Colmar Brunton | 28-Oct-16 Page | 49
RANDOMISE BLOCKS A TO D.
A 1 During pregnancy drinking small amounts of alcohol is OK
A 8 If pregnant, it is generally safe to drink small amounts of alcohol after the
first trimester
B 7 In some situations it is hard to say ‘I am not drinking’
C 2 I would encourage a friend or family member to stop drinking completely if
she was pregnant
C 3 I would encourage a friend or family member to stop drinking completely if
she thought there was a chance she could be pregnant
C 6 My friends and family would listen to me if I suggested they cut back on
their drinking
D 4 IF CODE 2 AT S2 I would stop drinking completely if I knew I was pregnant
D 5 IF CODE 2 AT S2 I would stop drinking completely if I thought there was a
chance I could be pregnant
Q5b Now some general questions about drinking alcohol.
Have you had a drink containing alcohol in the last year?
Yes 1
No 2 GO TO Q5f
Q5c How often do you have a drink containing alcohol?
Monthly or less 1
Up to four times a month 2
Up to three times a week 3
Four or more times a week 4
Q5d How many drinks containing alcohol do you have on a typical day when you are drinking?
One or two 1
Three or four 2
Five or six 3
Seven to nine 4
Ten to eleven 5
Twelve or more 6
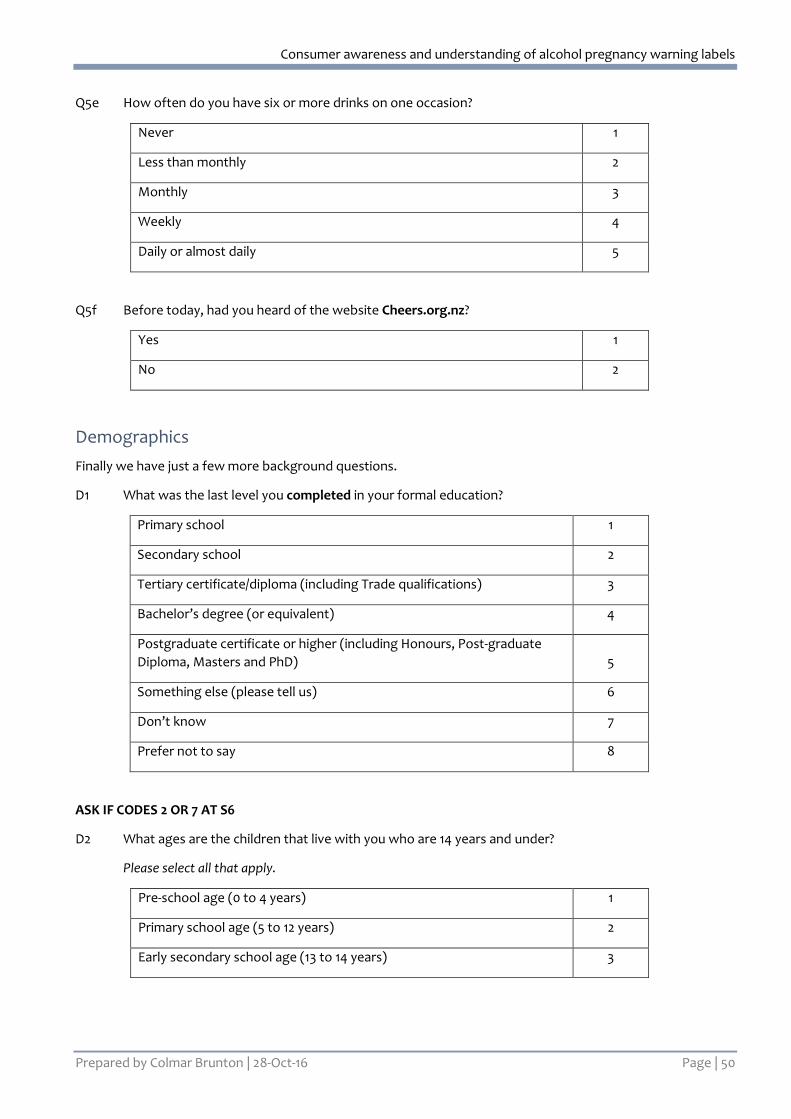
Consumer awareness and understanding of alcohol pregnancy warning labels
Prepared by Colmar Brunton | 28-Oct-16 Page | 50
Q5e How often do you have six or more drinks on one occasion?
Never 1
Less than monthly 2
Monthly 3
Weekly 4
Daily or almost daily 5
Q5f Before today, had you heard of the website Cheers.org.nz?
Yes 1
No 2
Demographics
Finally we have just a few more background questions.
D1 What was the last level you completed in your formal education?
Primary school 1
Secondary school 2
Tertiary certificate/diploma (including Trade qualifications) 3
Bachelor’s degree (or equivalent) 4
Postgraduate certificate or higher (including Honours, Post-graduate
Diploma, Masters and PhD) 5
Something else (please tell us) 6
Don’t know 7
Prefer not to say 8
ASK IF CODES 2 OR 7 AT S6
D2 What ages are the children that live with you who are 14 years and under?
Please select all that apply.
Pre-school age (0 to 4 years) 1
Primary school age (5 to 12 years) 2
Early secondary school age (13 to 14 years) 3
Consumer awareness and understanding of alcohol pregnancy warning labels
Prepared by Colmar Brunton | 28-Oct-16 Page | 51
ASK D3 TO D5 IF [CODE 2 AT S2] AND [CODE 1 TO 7 AT S3]. OTHERWISE GO TO CLOSE TEXT.
D3 We have just three more questions so we can look at the results of this survey among people with
different kinds of experiences.
Have you ever tried to become pregnant?
Yes 1
No 2
Don’t wish to answer 3
D4 Are you currently pregnant?
Yes 1
No 2
Don’t wish to answer 3
D5 Have you ever been pregnant?
Yes 1
No 2
Don’t wish to answer 3