Embed Size (px)
Citation preview
Consumer Action Response Team (CART) OF ALLEGHENY COUNTY
A Program of the National Alliance on Mental Illness (NAMI) Keystone Pennsylvania
2017 ANNUAL REPORT
TABLE OF CONTENTS
CART Vision, Purpose and Methodology .............................................................. 1
FEATURE ARTICLE – Patient-Centered Care and Recovery ............................... 2-3
Adults’ & Parents’ Responses to Recovery Questions ......................................... 4
Adolescent and Young Adult Responses to Recovery Questions .......................... 5
Key Findings for Recovery Question Responses ................................................... 6
CART Interview Totals .......................................................................................... 7
Satisfaction Survey Responses by Population ...................................................... 8
Trends in Satisfaction Survey Findings ................................................................. 9
Former Mayview Residents’ Interview Responses for 3 Years ...................... 10-11
CART Staff and Advisory Board .......................................................................... 12
Page 1
CONSUMER ACTION AND RESPONSE TEAM OF ALLEGHENY COUNTY
Vision
CART’s vision is that consumers and providers will dialogue regularly about improvements that could be made in existing behavioral health services. This dialogue will result in the best possible services for consumers who will become empowered to make choices and participate in their own recovery.
CART is designed to provide: Processes for consumers and families to dialogue with their providers.
Structured process for providers to respond to consumer dissatisfactions.
Aggregate reports of response frequencies to Health Choices Appendix L Areas of Observation and Discussion as a means of looking at system trends.
Reports that identify satisfaction and dissatisfaction themes for various levels of care in the provider system.
Feedback from CSP and CHIPP consumers to Allegheny County Office of Behavioral Health and providers about their satisfactions with services and adjustment to living in the community.
Information about under-served groups in order to supply consumer feedback to system planners and policy makers.
Advantages of CART:
Independence from provider organizations.
Interviewers are former recipients of services and family members.
Conducts face-to-face interviews.
Consumers who wish to be identified can use the CART process as an occasion to meet with their provider to dialogue about their concerns about their services.
Consumers provide more detailed responses because of the semi-structured format of CART interviews.
Provider organizations can demonstrate their commitment to quality improvement by using CART reports.
Summary of CART Methodology The Consumer Action Response Team (CART) conducts face-to-face interviews with willing consumers of behavioral health services. In some cases telephone interviews are done with family members and consumers who do not utilize site-based services. A survey/interview tool is utilized to obtain quantitative information about Appendix L. Areas of Concern, as well as, qualitative information obtained by asking consumers a number of open-ended questions about services received. Consumers at all known provider sites are surveyed via scheduled site visits twice a year. The interview findings for each service site are summarized into a report and mailed to the provider for their written response, or the provider may choose to discuss the report during a scheduled Quality Improvement Meeting with CART staff. Aggregate data reports are submitted to CCBH quarterly and annually. In addition, an annual report is distributed to all stakeholders.
Page 2
FEATURE ARTICLE –
PATIENT–CENTERED CARE AND RECOVERY
Since the turn of the 21st century “Patient-Centered Care” has gradually become the standard for
all health care. A report by the Institute of Medicine in 2001 defined Patient-Centered Care as:
“respecting and responding to patients’ wants, needs and preferences, so that they can make
choices in their care that best fit their individual circumstances.” 1
Patient-Centered Care, at a basic level, is a healing relationship that includes:
1) Shared understanding, (2) informed choices and (3) patient activation in the treatment process.2
CART, the Consumer Action and Response Team of Allegheny County, has been promoting
Patient/Consumer-Centered Care in the behavioral health system since 1999. Specifically, the CART
process encourages patients to become active consumers of their behavioral health care. CART
interviews with patient-consumers empower them to have their voices heard by their providers via
written reports of their feedback about services. They are given the opportunity to provide
feedback about the degree of respect, hopefulness and collaboration experienced during their
treatment course.
Patient-Centered providers give clear, understandable information so individuals are able to
dialogue about their condition with them. This allows an informed conversation to occur, where
treatment and recovery plans are developed that address not only medical issues, but also the
constraints and barriers patient-consumers face in following through on treatment
recommendations. “Shared decision-making”3 is the result of specific conversations about the real
life situations where treatment and recovery occur. Community health care practitioners take this
information into consideration so that realistic treatment plans can be developed, with goals that
are compatible with the individuals’ life world, which includes cultural beliefs and community
norms. Ideally, Patient-Centered Care for medical conditions will intersect with person-centered
recovery as treatment moves into the community from a hospital or clinic.
1National Research Council. Crossing the quality chasm: a new health system for the 21
st century. Washington, DC:
National Academics Press, 2001. 2 Epstein RM, Street RL. Patient-centered communication in cancer care: promoting healing and reducing suffering.
Bethesda (MD) National Cancer Institute: 2007 3 Barry MJ, Edgman-Levitan S. Shared decision making-The pinnacle of patient-centered care. The New England
Journal of Medicine 2012: 366: 9, pgs. 780-781.
Page 3
Recovery and Resiliency
Recovery is a person-centered process of healing the whole person after a physical illness, a mental
health condition, a substance use disorder (or any combination of these); where individuals
discover ways to re-connect with social, work and/or family life. In 2005 the Office of Mental
Health and Substance Abuse Services of Pennsylvania convened a large group of stakeholders with
lived experience of recovery to identify catalysts of recovery and resiliency. They agreed that:
“Recovery is facilitated by relationships and environments that provide hope, choices,
empowerment and opportunities that promote people to reach their full potential as individuals and
community members.”4
Patient-Centered Care and Recovery intersect at many levels. Relationships create the possibilities
for healing whether in a medical clinic or in a peer-support group at a coffee shop. The recovering
person or patient becomes active when he/she realizes that he/she is making all of the decisions,
thereby feeling a sense of ownership. Health care providers can do a lot to orient their services to
maximize patient choices and ownership of their treatment and recovery.
What follows is a report of patient-consumer feedback about the degree to which behavioral
health providers in Allegheny County orient their services to address various aspects of recovery
identified by recovering persons and other stakeholders.
4 A Call For Change: Toward A Recovery-Oriented Mental Health Service System for Adults. A Publication of the
Pennsylvania Office of Mental and Substance Abuse Services, Department of Public Welfare: Harrisburg, PA.
May 2006.
Page 4
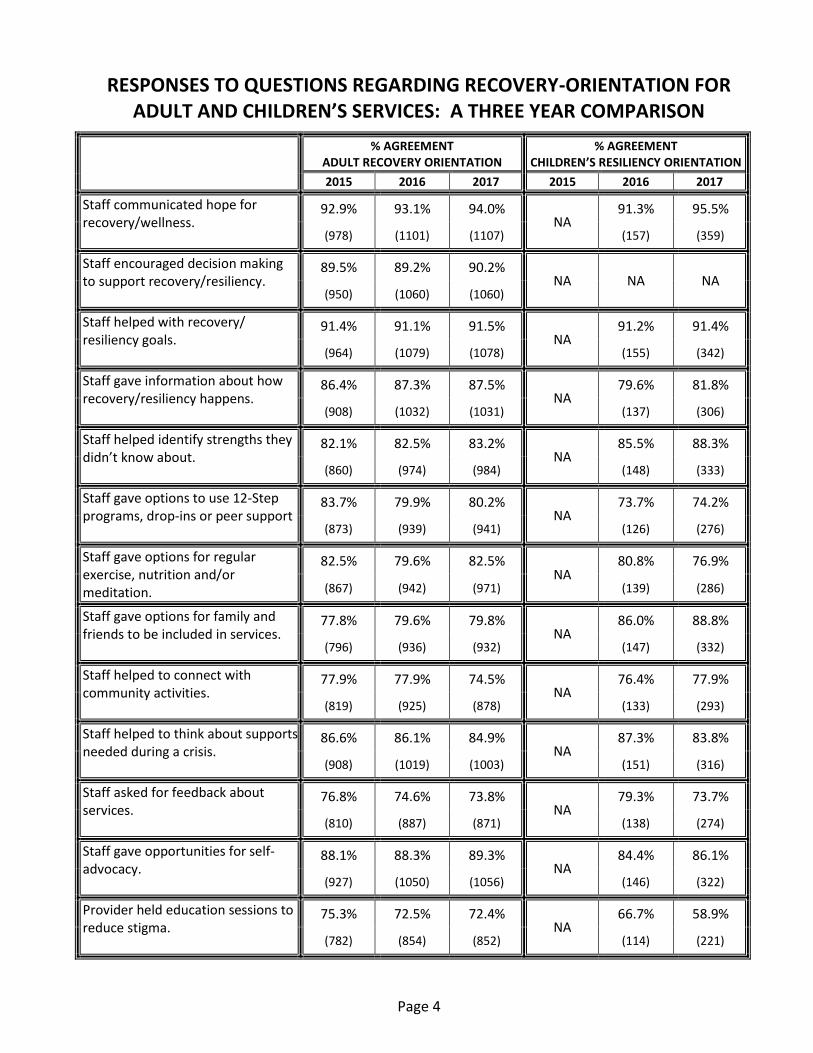
RESPONSES TO QUESTIONS REGARDING RECOVERY-ORIENTATION FOR ADULT AND CHILDREN’S SERVICES: A THREE YEAR COMPARISON
% AGREEMENT
ADULT RECOVERY ORIENTATION % AGREEMENT
CHILDREN’S RESILIENCY ORIENTATION
2015 2016 2017 2015 2016 2017
Staff communicated hope for recovery/wellness.
92.9% 93.1% 94.0% NA
91.3% 95.5%
(978) (1101) (1107) (157) (359)
Staff encouraged decision making to support recovery/resiliency.
89.5% 89.2% 90.2% NA NA NA
(950) (1060) (1060)
Staff helped with recovery/ resiliency goals.
91.4% 91.1% 91.5% NA
91.2% 91.4%
(964) (1079) (1078) (155) (342)
Staff gave information about how recovery/resiliency happens.
86.4% 87.3% 87.5% NA
79.6% 81.8%
(908) (1032) (1031) (137) (306)
Staff helped identify strengths they didn’t know about.
82.1% 82.5% 83.2% NA
85.5% 88.3%
(860) (974) (984) (148) (333)
Staff gave options to use 12-Step programs, drop-ins or peer support
83.7% 79.9% 80.2% NA
73.7% 74.2%
(873) (939) (941) (126) (276)
Staff gave options for regular exercise, nutrition and/or meditation.
82.5% 79.6% 82.5% NA
80.8% 76.9%
(867) (942) (971) (139) (286)
Staff gave options for family and friends to be included in services.
77.8% 79.6% 79.8% NA
86.0% 88.8%
(796) (936) (932) (147) (332)
Staff helped to connect with community activities.
77.9% 77.9% 74.5% NA
76.4% 77.9%
(819) (925) (878) (133) (293)
Staff helped to think about supports needed during a crisis.
86.6% 86.1% 84.9% NA
87.3% 83.8%
(908) (1019) (1003) (151) (316)
Staff asked for feedback about services.
76.8% 74.6% 73.8% NA
79.3% 73.7%
(810) (887) (871) (138) (274)
Staff gave opportunities for self-advocacy.
88.1% 88.3% 89.3% NA
84.4% 86.1%
(927) (1050) (1056) (146) (322)
Provider held education sessions to reduce stigma.
75.3% 72.5% 72.4% NA
66.7% 58.9%
(782) (854) (852) (114) (221)
Page 5
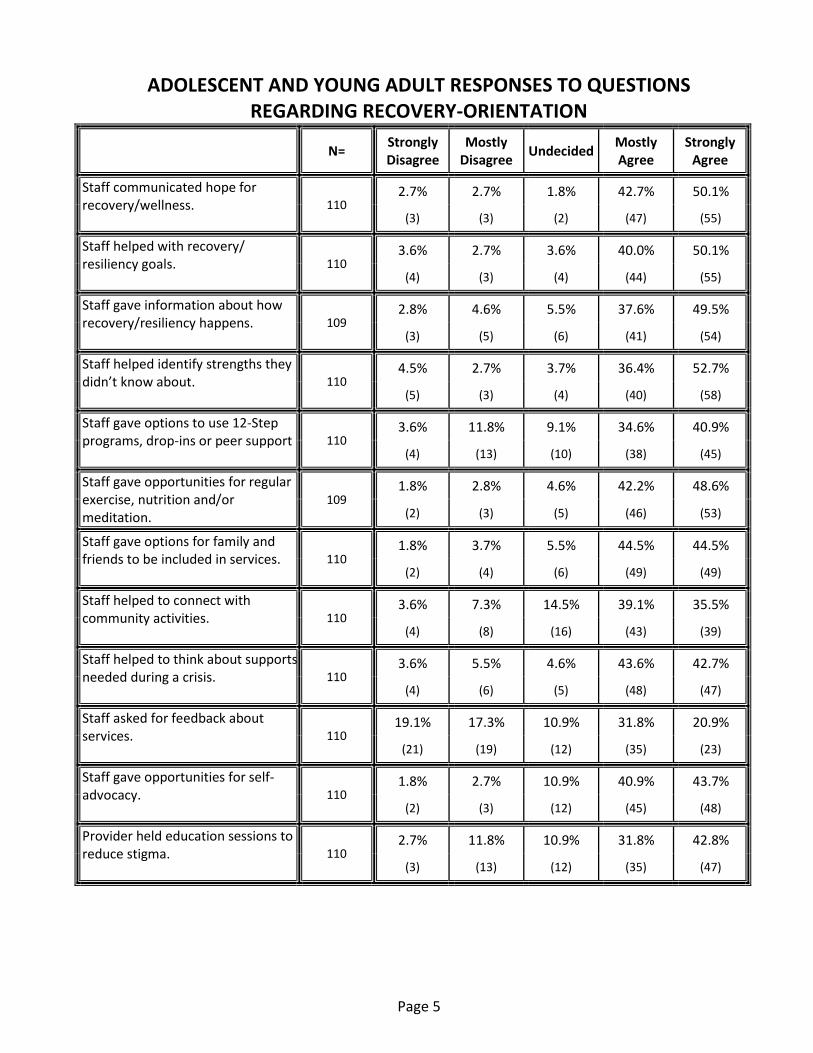
ADOLESCENT AND YOUNG ADULT RESPONSES TO QUESTIONS REGARDING RECOVERY-ORIENTATION
N= Strongly Disagree
Mostly Disagree
Undecided Mostly Agree
Strongly Agree
Staff communicated hope for recovery/wellness. 110
2.7% 2.7% 1.8% 42.7% 50.1%
(3) (3) (2) (47) (55)
Staff helped with recovery/ resiliency goals. 110
3.6% 2.7% 3.6% 40.0% 50.1%
(4) (3) (4) (44) (55)
Staff gave information about how recovery/resiliency happens. 109
2.8% 4.6% 5.5% 37.6% 49.5%
(3) (5) (6) (41) (54)
Staff helped identify strengths they didn’t know about. 110
4.5% 2.7% 3.7% 36.4% 52.7%
(5) (3) (4) (40) (58)
Staff gave options to use 12-Step programs, drop-ins or peer support 110
3.6% 11.8% 9.1% 34.6% 40.9%
(4) (13) (10) (38) (45)
Staff gave opportunities for regular exercise, nutrition and/or meditation.
109 1.8% 2.8% 4.6% 42.2% 48.6%
(2) (3) (5) (46) (53)
Staff gave options for family and friends to be included in services. 110
1.8% 3.7% 5.5% 44.5% 44.5%
(2) (4) (6) (49) (49)
Staff helped to connect with community activities. 110
3.6% 7.3% 14.5% 39.1% 35.5%
(4) (8) (16) (43) (39)
Staff helped to think about supports needed during a crisis. 110
3.6% 5.5% 4.6% 43.6% 42.7%
(4) (6) (5) (48) (47)
Staff asked for feedback about services. 110
19.1% 17.3% 10.9% 31.8% 20.9%
(21) (19) (12) (35) (23)
Staff gave opportunities for self-advocacy. 110
1.8% 2.7% 10.9% 40.9% 43.7%
(2) (3) (12) (45) (48)
Provider held education sessions to reduce stigma. 110
2.7% 11.8% 10.9% 31.8% 42.8%
(3) (13) (12) (35) (47)
Page 6
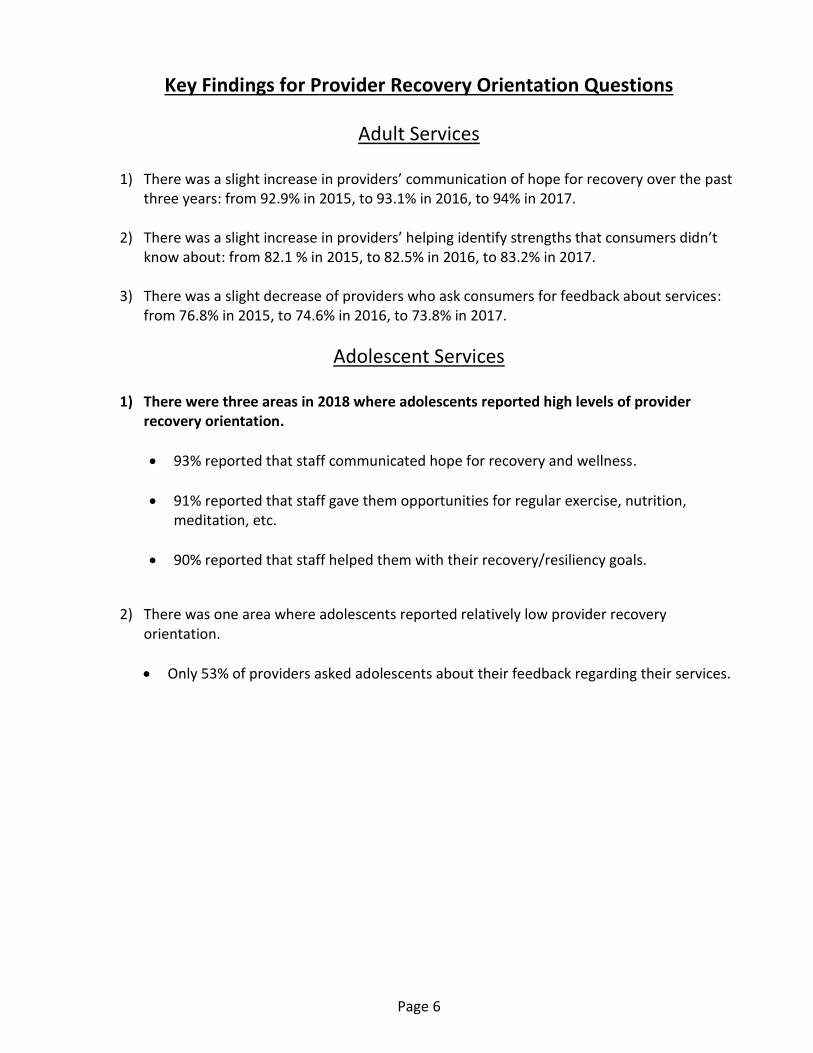
Key Findings for Provider Recovery Orientation Questions
Adult Services
1) There was a slight increase in providers’ communication of hope for recovery over the past three years: from 92.9% in 2015, to 93.1% in 2016, to 94% in 2017.
2) There was a slight increase in providers’ helping identify strengths that consumers didn’t know about: from 82.1 % in 2015, to 82.5% in 2016, to 83.2% in 2017.
3) There was a slight decrease of providers who ask consumers for feedback about services: from 76.8% in 2015, to 74.6% in 2016, to 73.8% in 2017.
Adolescent Services
1) There were three areas in 2018 where adolescents reported high levels of provider recovery orientation.
93% reported that staff communicated hope for recovery and wellness.
91% reported that staff gave them opportunities for regular exercise, nutrition, meditation, etc.
90% reported that staff helped them with their recovery/resiliency goals.
2) There was one area where adolescents reported relatively low provider recovery orientation.
Only 53% of providers asked adolescents about their feedback regarding their services.
Page 7
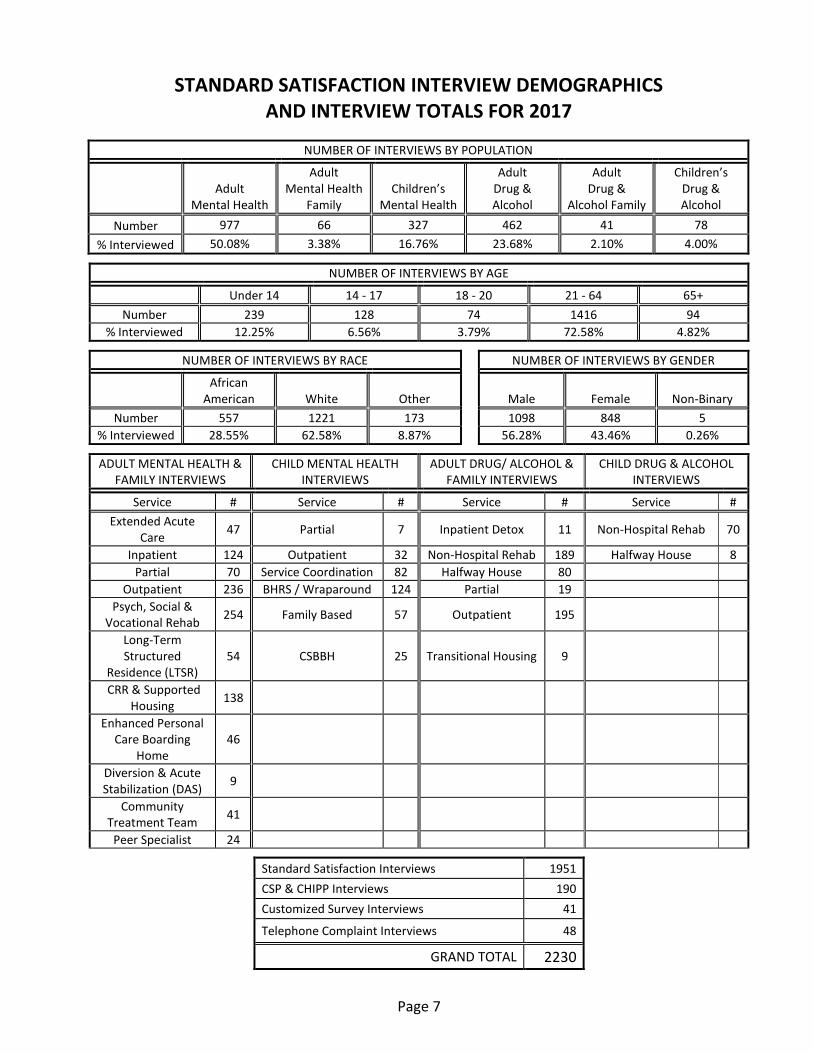
STANDARD SATISFACTION INTERVIEW DEMOGRAPHICS AND INTERVIEW TOTALS FOR 2017
NUMBER OF INTERVIEWS BY POPULATION
Adult
Mental Health
Adult Mental Health
Family Children’s
Mental Health
Adult Drug & Alcohol
Adult Drug &
Alcohol Family
Children’s Drug & Alcohol
Number 977 66 327 462 41 78
% Interviewed 50.08% 3.38% 16.76% 23.68% 2.10% 4.00%
NUMBER OF INTERVIEWS BY AGE
Under 14 14 - 17 18 - 20 21 - 64 65+
Number 239 128 74 1416 94
% Interviewed 12.25% 6.56% 3.79% 72.58% 4.82%
NUMBER OF INTERVIEWS BY RACE NUMBER OF INTERVIEWS BY GENDER
African American White Other
Male Female Non-Binary
Number 557 1221 173 1098 848 5
% Interviewed 28.55% 62.58% 8.87% 56.28% 43.46% 0.26%
ADULT MENTAL HEALTH & FAMILY INTERVIEWS
CHILD MENTAL HEALTH INTERVIEWS
ADULT DRUG/ ALCOHOL & FAMILY INTERVIEWS
CHILD DRUG & ALCOHOL INTERVIEWS
Service # Service # Service # Service #
Extended Acute Care
47 Partial 7 Inpatient Detox 11 Non-Hospital Rehab 70
Inpatient 124 Outpatient 32 Non-Hospital Rehab 189 Halfway House 8
Partial 70 Service Coordination 82 Halfway House 80
Outpatient 236 BHRS / Wraparound 124 Partial 19
Psych, Social & Vocational Rehab
254 Family Based 57 Outpatient 195
Long-Term Structured
Residence (LTSR) 54 CSBBH 25 Transitional Housing 9
CRR & Supported Housing
138
Enhanced Personal Care Boarding
Home 46
Diversion & Acute Stabilization (DAS)
9
Community Treatment Team
41
Peer Specialist 24
Standard Satisfaction Interviews 1951
CSP & CHIPP Interviews 190
Customized Survey Interviews 41
Telephone Complaint Interviews 48
GRAND TOTAL 2230
Page 8
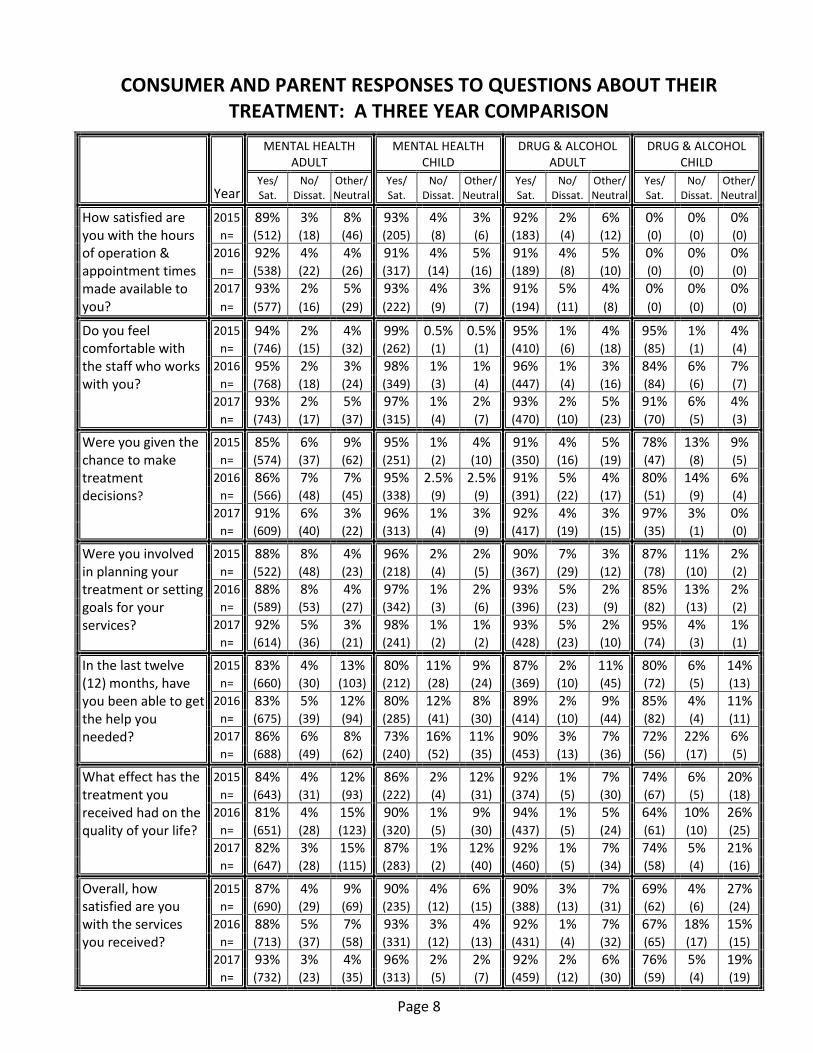
CONSUMER AND PARENT RESPONSES TO QUESTIONS ABOUT THEIR TREATMENT: A THREE YEAR COMPARISON
Year
MENTAL HEALTH ADULT
MENTAL HEALTH CHILD
DRUG & ALCOHOL ADULT
DRUG & ALCOHOL CHILD
Yes/ Sat.
No/ Dissat.
Other/ Neutral
Yes/ Sat.
No/ Dissat.
Other/ Neutral
Yes/ Sat.
No/ Dissat.
Other/ Neutral
Yes/ Sat.
No/ Dissat.
Other/ Neutral
How satisfied are you with the hours of operation & appointment times made available to you?
2015 89% 3% 8% 93% 4% 3% 92% 2% 6% 0% 0% 0%
n= (512) (18) (46) (205) (8) (6) (183) (4) (12) (0) (0) (0)
2016 92% 4% 4% 91% 4% 5% 91% 4% 5% 0% 0% 0%
n= (538) (22) (26) (317) (14) (16) (189) (8) (10) (0) (0) (0)
2017 93% 2% 5% 93% 4% 3% 91% 5% 4% 0% 0% 0%
n= (577) (16) (29) (222) (9) (7) (194) (11) (8) (0) (0) (0)
Do you feel comfortable with the staff who works with you?
2015 94% 2% 4% 99% 0.5% 0.5% 95% 1% 4% 95% 1% 4%
n= (746) (15) (32) (262) (1) (1) (410) (6) (18) (85) (1) (4)
2016 95% 2% 3% 98% 1% 1% 96% 1% 3% 84% 6% 7%
n= (768) (18) (24) (349) (3) (4) (447) (4) (16) (84) (6) (7)
2017 93% 2% 5% 97% 1% 2% 93% 2% 5% 91% 6% 4%
n= (743) (17) (37) (315) (4) (7) (470) (10) (23) (70) (5) (3)
Were you given the chance to make treatment decisions?
2015 85% 6% 9% 95% 1% 4% 91% 4% 5% 78% 13% 9%
n= (574) (37) (62) (251) (2) (10) (350) (16) (19) (47) (8) (5)
2016 86% 7% 7% 95% 2.5% 2.5% 91% 5% 4% 80% 14% 6%
n= (566) (48) (45) (338) (9) (9) (391) (22) (17) (51) (9) (4)
2017 91% 6% 3% 96% 1% 3% 92% 4% 3% 97% 3% 0%
n= (609) (40) (22) (313) (4) (9) (417) (19) (15) (35) (1) (0)
Were you involved in planning your treatment or setting goals for your services?
2015 88% 8% 4% 96% 2% 2% 90% 7% 3% 87% 11% 2%
n= (522) (48) (23) (218) (4) (5) (367) (29) (12) (78) (10) (2)
2016 88% 8% 4% 97% 1% 2% 93% 5% 2% 85% 13% 2%
n= (589) (53) (27) (342) (3) (6) (396) (23) (9) (82) (13) (2)
2017 92% 5% 3% 98% 1% 1% 93% 5% 2% 95% 4% 1%
n= (614) (36) (21) (241) (2) (2) (428) (23) (10) (74) (3) (1)
In the last twelve (12) months, have you been able to get the help you needed?
2015 83% 4% 13% 80% 11% 9% 87% 2% 11% 80% 6% 14%
n= (660) (30) (103) (212) (28) (24) (369) (10) (45) (72) (5) (13)
2016 83% 5% 12% 80% 12% 8% 89% 2% 9% 85% 4% 11%
n= (675) (39) (94) (285) (41) (30) (414) (10) (44) (82) (4) (11)
2017 86% 6% 8% 73% 16% 11% 90% 3% 7% 72% 22% 6%
n= (688) (49) (62) (240) (52) (35) (453) (13) (36) (56) (17) (5)
What effect has the treatment you received had on the quality of your life?
2015 84% 4% 12% 86% 2% 12% 92% 1% 7% 74% 6% 20%
n= (643) (31) (93) (222) (4) (31) (374) (5) (30) (67) (5) (18)
2016 81% 4% 15% 90% 1% 9% 94% 1% 5% 64% 10% 26%
n= (651) (28) (123) (320) (5) (30) (437) (5) (24) (61) (10) (25)
2017 82% 3% 15% 87% 1% 12% 92% 1% 7% 74% 5% 21%
n= (647) (28) (115) (283) (2) (40) (460) (5) (34) (58) (4) (16)
Overall, how satisfied are you with the services you received?
2015 87% 4% 9% 90% 4% 6% 90% 3% 7% 69% 4% 27%
n= (690) (29) (69) (235) (12) (15) (388) (13) (31) (62) (6) (24)
2016 88% 5% 7% 93% 3% 4% 92% 1% 7% 67% 18% 15%
n= (713) (37) (58) (331) (12) (13) (431) (4) (32) (65) (17) (15)
2017 93% 3% 4% 96% 2% 2% 92% 2% 6% 76% 5% 19%
n= (732) (23) (35) (313) (5) (7) (459) (12) (30) (59) (4) (19)
Page 9
Trends by Population Group
Adult Mental Health
1) Individuals reported increased satisfaction with hours of operation and appointment times: from 89% in 2015, to 92% in 2016, to 93% in 2017.
2) Increased involvement in making treatment decisions was reported: from 85% in 2015, to 86%
in 2016, to 91% in 2017.
3) Individuals reported increased overall satisfaction: from 87% in 2015, to 88% in 2016, to 93% in 2017.
Children’s Mental Health
1) Individuals reported a slight decrease in comfort level with staff with whom they worked: from 99% in 2015, to 98% in 2016, to 97% in 2017.
2) Individuals reported increased involvement in planning treatment and goal setting: from 96% in
2015, to 97% in 2016, to 98% in 2017.
3) Individuals reported increased overall satisfaction: from 90% in 2015, to 93% in 2016, to 96% in 2017.
Adult Drug and Alcohol
Individuals reported increased access to services: from 87% in 2015, to 89% in 2016, to 90% in 2017.
Child/Adolescent Drug and Alcohol
Individuals reported increasing involvement in treatment decisions: from 78% in 2015, to 80% in 2016, to 97% in 2017.
Page 10
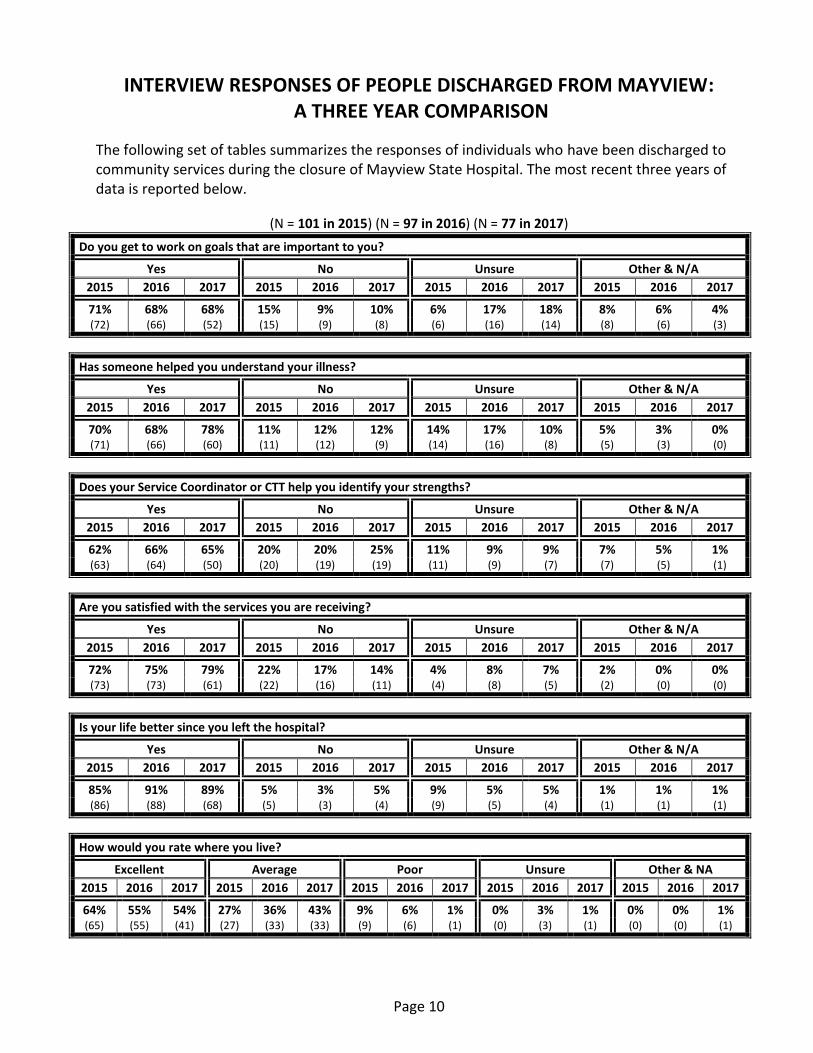
INTERVIEW RESPONSES OF PEOPLE DISCHARGED FROM MAYVIEW: A THREE YEAR COMPARISON
The following set of tables summarizes the responses of individuals who have been discharged to community services during the closure of Mayview State Hospital. The most recent three years of data is reported below.
(N = 101 in 2015) (N = 97 in 2016) (N = 77 in 2017)
Do you get to work on goals that are important to you?
Yes No Unsure Other & N/A
2015 2016 2017 2015 2016 2017 2015 2016 2017 2015 2016 2017
71% 68% 68% 15% 9% 10% 6% 17% 18% 8% 6% 4% (72) (66) (52) (15) (9) (8) (6) (16) (14) (8) (6) (3)
Has someone helped you understand your illness?
Yes No Unsure Other & N/A
2015 2016 2017 2015 2016 2017 2015 2016 2017 2015 2016 2017
70% 68% 78% 11% 12% 12% 14% 17% 10% 5% 3% 0% (71) (66) (60) (11) (12) (9) (14) (16) (8) (5) (3) (0)
Does your Service Coordinator or CTT help you identify your strengths?
Yes No Unsure Other & N/A
2015 2016 2017 2015 2016 2017 2015 2016 2017 2015 2016 2017
62% 66% 65% 20% 20% 25% 11% 9% 9% 7% 5% 1% (63) (64) (50) (20) (19) (19) (11) (9) (7) (7) (5) (1)
Are you satisfied with the services you are receiving?
Yes No Unsure Other & N/A
2015 2016 2017 2015 2016 2017 2015 2016 2017 2015 2016 2017
72% 75% 79% 22% 17% 14% 4% 8% 7% 2% 0% 0% (73) (73) (61) (22) (16) (11) (4) (8) (5) (2) (0) (0)
Is your life better since you left the hospital?
Yes No Unsure Other & N/A
2015 2016 2017 2015 2016 2017 2015 2016 2017 2015 2016 2017
85% 91% 89% 5% 3% 5% 9% 5% 5% 1% 1% 1% (86) (88) (68) (5) (3) (4) (9) (5) (4) (1) (1) (1)
How would you rate where you live?
Excellent Average Poor Unsure Other & NA
2015 2016 2017 2015 2016 2017 2015 2016 2017 2015 2016 2017 2015 2016 2017
64% 55% 54% 27% 36% 43% 9% 6% 1% 0% 3% 1% 0% 0% 1% (65) (55) (41) (27) (33) (33) (9) (6) (1) (0) (3) (1) (0) (0) (1)
Page 11
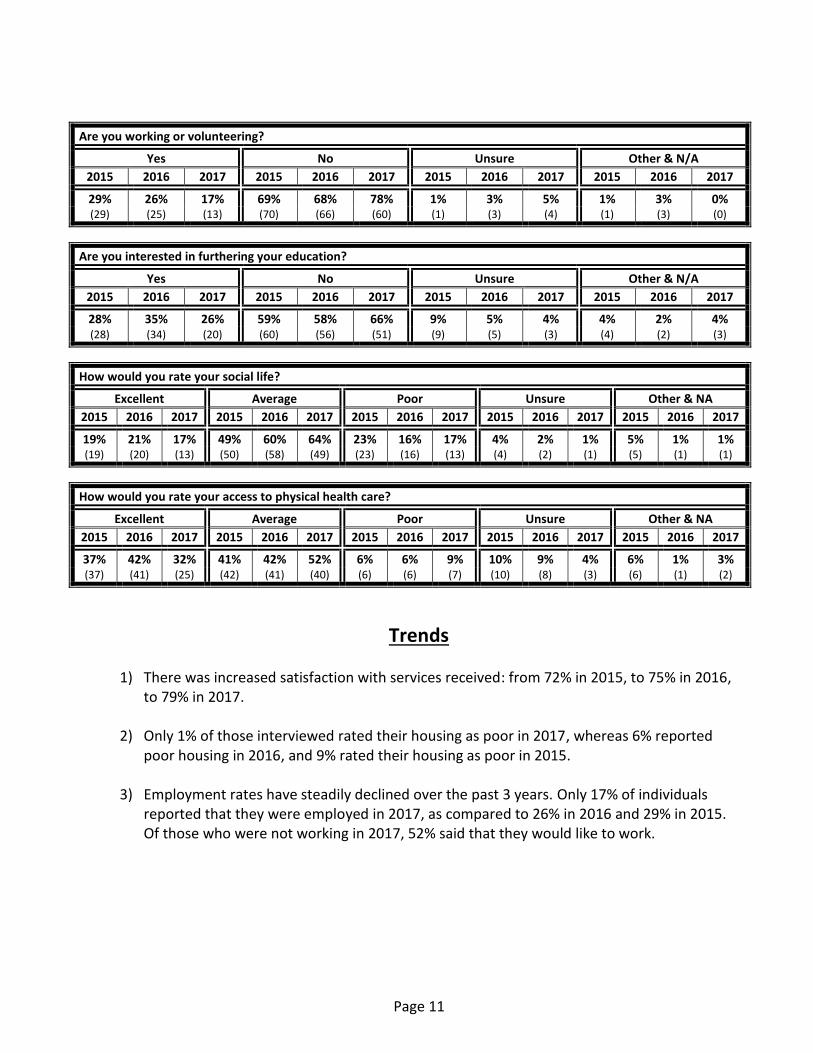
Are you working or volunteering?
Yes No Unsure Other & N/A
2015 2016 2017 2015 2016 2017 2015 2016 2017 2015 2016 2017
29% 26% 17% 69% 68% 78% 1% 3% 5% 1% 3% 0% (29) (25) (13) (70) (66) (60) (1) (3) (4) (1) (3) (0)
Are you interested in furthering your education?
Yes No Unsure Other & N/A
2015 2016 2017 2015 2016 2017 2015 2016 2017 2015 2016 2017
28% 35% 26% 59% 58% 66% 9% 5% 4% 4% 2% 4% (28) (34) (20) (60) (56) (51) (9) (5) (3) (4) (2) (3)
How would you rate your social life?
Excellent Average Poor Unsure Other & NA
2015 2016 2017 2015 2016 2017 2015 2016 2017 2015 2016 2017 2015 2016 2017
19% 21% 17% 49% 60% 64% 23% 16% 17% 4% 2% 1% 5% 1% 1% (19) (20) (13) (50) (58) (49) (23) (16) (13) (4) (2) (1) (5) (1) (1)
How would you rate your access to physical health care?
Excellent Average Poor Unsure Other & NA
2015 2016 2017 2015 2016 2017 2015 2016 2017 2015 2016 2017 2015 2016 2017
37% 42% 32% 41% 42% 52% 6% 6% 9% 10% 9% 4% 6% 1% 3% (37) (41) (25) (42) (41) (40) (6) (6) (7) (10) (8) (3) (6) (1) (2)
Trends
1) There was increased satisfaction with services received: from 72% in 2015, to 75% in 2016, to 79% in 2017.
2) Only 1% of those interviewed rated their housing as poor in 2017, whereas 6% reported poor housing in 2016, and 9% rated their housing as poor in 2015.
3) Employment rates have steadily declined over the past 3 years. Only 17% of individuals reported that they were employed in 2017, as compared to 26% in 2016 and 29% in 2015. Of those who were not working in 2017, 52% said that they would like to work.
Page 12
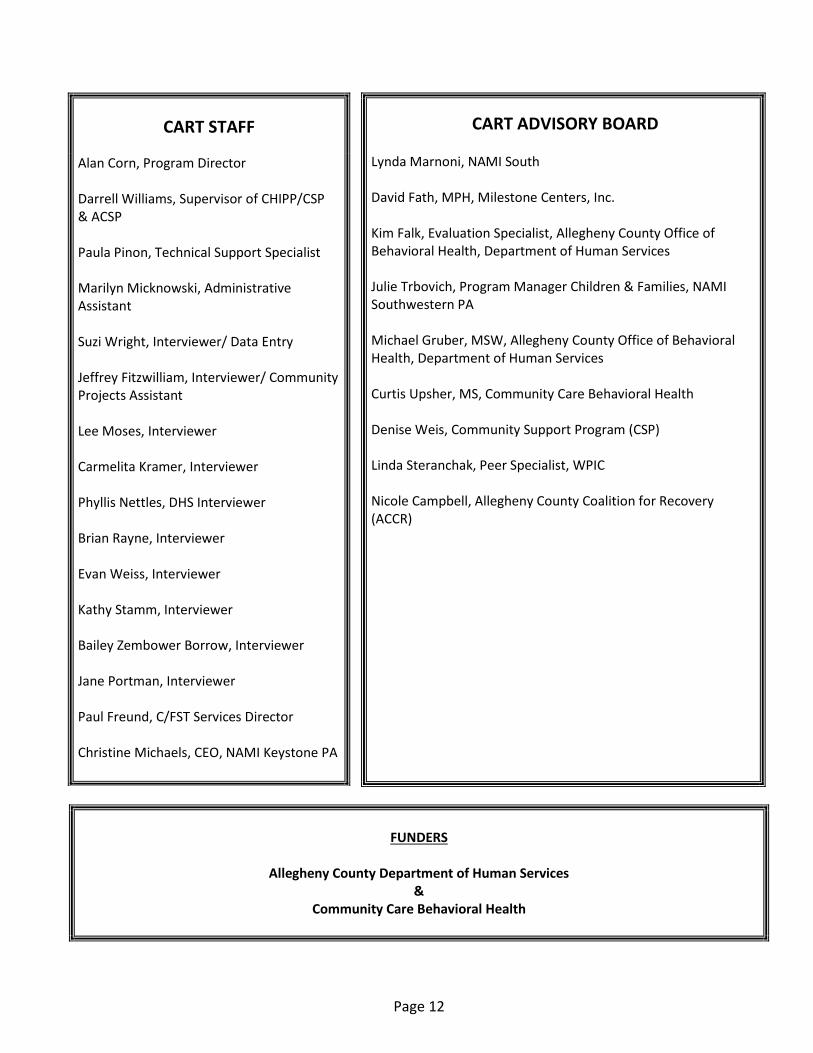
FUNDERS
Allegheny County Department of Human Services
& Community Care Behavioral Health
CART STAFF
Alan Corn, Program Director Darrell Williams, Supervisor of CHIPP/CSP & ACSP Paula Pinon, Technical Support Specialist Marilyn Micknowski, Administrative Assistant Suzi Wright, Interviewer/ Data Entry Jeffrey Fitzwilliam, Interviewer/ Community Projects Assistant Lee Moses, Interviewer Carmelita Kramer, Interviewer Phyllis Nettles, DHS Interviewer Brian Rayne, Interviewer Evan Weiss, Interviewer Kathy Stamm, Interviewer Bailey Zembower Borrow, Interviewer Jane Portman, Interviewer Paul Freund, C/FST Services Director Christine Michaels, CEO, NAMI Keystone PA
CART ADVISORY BOARD Lynda Marnoni, NAMI South David Fath, MPH, Milestone Centers, Inc. Kim Falk, Evaluation Specialist, Allegheny County Office of Behavioral Health, Department of Human Services Julie Trbovich, Program Manager Children & Families, NAMI Southwestern PA Michael Gruber, MSW, Allegheny County Office of Behavioral Health, Department of Human Services Curtis Upsher, MS, Community Care Behavioral Health Denise Weis, Community Support Program (CSP) Linda Steranchak, Peer Specialist, WPIC Nicole Campbell, Allegheny County Coalition for Recovery (ACCR)