Embed Size (px)
Citation preview

© A
BB In
c. -
1-
5/28
/200
3
Transmission Planning
An IntroductionConsulting

© A
BB In
c. -
2-
Transmission Planning
• Primary Purpose of Transmission Planning - to determine the lowest possible cost, transmission and substation additions which render the transmission network to be able to supply the loads and facilitate wholesale power marketing with a given criteria
• Issues & Factors in A Transmission Planning Study• Planning Period• Load Forecast and transmission usage projection• Generation Resources (Location, Type, etc.)• Discrete Transmission Capacities• Different Alternatives• End Effects• Economy of Scale• Economic and Financial Constraints• R-O-W Limitations• New and Emerging Technology• Various Uncertainties and Risks• Service Reliability and Cost Considerations

© A
BB In
c. -
3-
Transmission Planning Section
• Forecasts and consideration of uncertainties:• Load forecasting• Forecasts of generation patterns and other factors that may influence transmission
needs
• Postulation of reinforcement alternatives
• Analysis and reliability testing of reinforcement alternatives• Load flow studies for flow, voltage, and transmission loss evaluations• Contingency load flow analysis for alternatives to meet reliability criteria• Stability analysis to verify that alternatives meet reliability criteria.• Short circuit tests to verify that existing or new breakers will be able to interrupt
faults within their ratings.• Other studies including voltage sag studies.• Alternative methods
• Prioritization and tentative timing of transmission reinforcements

© A
BB In
c. -
4-
WHAT IS A WELL PLANNED SYSTEM
ADEQUACY -- Normal and Contingency
BALANCE -- Size & Strength
Provide Proper Economic Signals to the Competitive Market Place
MAINTAINANCE -- Effective, Efficient, Suitable & Flexible
SAFETY & PROTECTION
RECOVERY -- Restoration

© A
BB In
c. -
5-
Planning MethodologyDevelop Base Cases
AlternatePlant Site
Define Generation Scenarios
Develop Horizon Year Alternatives
Test with Planning Criteria
Technical Evaluation of Alternatives
Costing & Market response of Alternatives
Detailed Analysis of Preferred Alternative - MADM
Revision
Selection of Preferred Alternatives

© A
BB In
c. -
6-
Transmission Plan Development – Tech Studies
FailedCases
Horizon Year Base Case
Design for Voltage/ReactiveCriteria
Design for Thermal Capacity – Transfer Limits, etc.
Transmission Additions
Reactive Compensation/Controls
Test with Steady-State Criteria
Design for Stability
Test with Dynamic Criteria
Stability Measures
Expansion Planning
Decoupled Thermal & Voltage Planning
Transmission Alternative

© A
BB In
c. -
7-
Base Case
Evaluate ThermalCapacity
Requirements
Evaluate VoltageControl
Requirements
ContingencyAnalysis
SkeletonNetwork
FutureGeneration
FutureLoad
AvailableROW
LineDesigns
AvailableVoltage Control
Equipment
TransmissionReinforcements
Capacitor/reactorAdditions; e.g. SVC, etc.
StabilityEvaluation
Decoupled Thermal & Voltage Studies

© A
BB In
c. -
8-
Simplified Flow Chart for Contingency Analysis
Normal Condition, SolvedPower Flow
ContingencyList
No Problem
Local ProblemsOverload
Low VoltageHigh Voltage
IslandingLoad Shed
System ProblemsVoltage Collapse
Cascading Outage
Evaluate EachContingency
Classify Results
Calculate Costof Load
Curtailment
Define:Operating Limits
Remedial Schemes:IslandingTrip sequencesGeneration Re-dispatchLoad Shedding
Input:Specified ContingenciesRanking TypeSub-system for automatic
Contingency TestingContingency Levels
EliminateTroubles Using
Optimization
InputCustomer Or LoadInterruption Costs
Input:OutageStatistics
Adjust solution steps forDivergence
Calculate
IndicesProbabilistic
© A
BB In
c. -
9-
Approaches to Transmission Planning
Alternatives Approach
Optimization Methods
Horizon Year & Staging
Scenario Method
Ranking Options / Decision Functions
Trade-Off / Risk Analysis

© A
BB In
c. -
10-
Steps in Alternatives Approach
Identify Basic Alternatives ⇓ Engineer Alternatives to Functional Equivalency (Screening) ⇓ Select Prime Alternatives ⇓ Optimize Prime Alternatives ⇓ Select Final Plan
© A
BB In
c. -
11-
Steps in Optimization Approach
• The two items specific to optimization procedure are:
- Determination of effective alternatives which are technically feasible,
- The optimization process and selection of the "optimum" plan.
• Techniques of optimization procedures commonly used:
- Gradient techniques
- Linear programming
- Integer programming
- Dynamic programming
- Branch and bound algorithms

© A
BB In
c. -
12-
Horizon Year & Staging Approach
• A lowest cost transmission plan for the horizon year (20th year in a 20 year planning study) is developed (Note that if necessary and proper, an
optimization method may be applied to this horizon year plan).
• Once an optimized horizon year plan is available, several transmission staging plans may be developed for the planning period:
• The staging intervals may be different from one stage to the next.
• Staging at every 5 years is usually considered appropriate. • In a high growth system, staging at say 3 or annual plans may be required.
• Keeps in focus the long-term needs of the system in proper perspective• Once the staging plans are complete, the present worth or other types
of analysis may be performed for different horizon year and corresponding staging year plans (the selection of the most suitable plan
among the low cost plans may be accomplished, via the alternative approach).

© A
BB In
c. -
13-
Scenario Approach to Address Uncertainties
Uncertainties:
• Competitions,
• Load Growth (power and energy),
• IPPs
• Fuel and Hydro Resources,
• Construction,
• Environmental Issues,
• New Technology,
• Capital and Financial Factors,
• Institutional and Government
Regulations.
In Concept, it involves:• develop alternate scenario,• analyze each scenario,• select the best plan(s).(The scenarios may be based on a set of
likely possibilities or selected on the basis of reasonable extremes)
This master transmission plan may be in the form of1.a robust plan or
2.one of the scenario plans, but with a
strategy to cope with the undesirable
events.

© A
BB In
c. -
14-
Multiple Objective Evaluation Approach• Some of the multiple attenuates, depends upon particular
project, location and situations, include - Net present value, Right-of-Way and terrain, Environmental impact (EMF), habitat, urban and rural life impacts, etc., Reliability, Financing, Operation flexibility, Dependence on outside sources, construction feasibility.
• To evaluate, use either of the two different approaches, ranking and decision functions: single objective function = a * COST + b * Reliability Index + C * R-O-W + ......or RANKING OF SYSTEM EXPANSION ALTERNATIVES
System Expansion Alternative
A B C
1. Smallest net present worth (NPV) 2 3 1
2. Least environmental impact 1 2 3
3. Least interference with operations 2 2 1
4. Least impact on neighbors 2 2 1
5. Highest transmission strength 3 2 1
6. Most favorable financing requirements 1 2 3

© A
BB In
c. -
15-
Trade off and Risk Analysis Approach• Trade-off analysis assumes that consideration of more than
one single scaler criterion is necessary for determining an optimum plan (That is, any time a plan has to be optimized with additional
considerations beyond NPV criterion, conflicts may arise and reasonable compromises are necessary. With the use of trade off method, planners are able to consider a wide variety of options in an organized manner. The method permits the planner to eliminate unacceptable or inferior plans, based on multiple objectives and focus on a small set of plans (referred to as decision set) which represents reasonable compromises).
• A trade-off risk analysis essentially has four steps:• Perform trade-off risk analysis for each future and find a global decision set.• Measure the robustness of each plan in the global decision set.• If no plan is completely robust, measure exposure.• Develop hedges (new options) to protect against adverse futures.
© A
BB In
c. -
16-
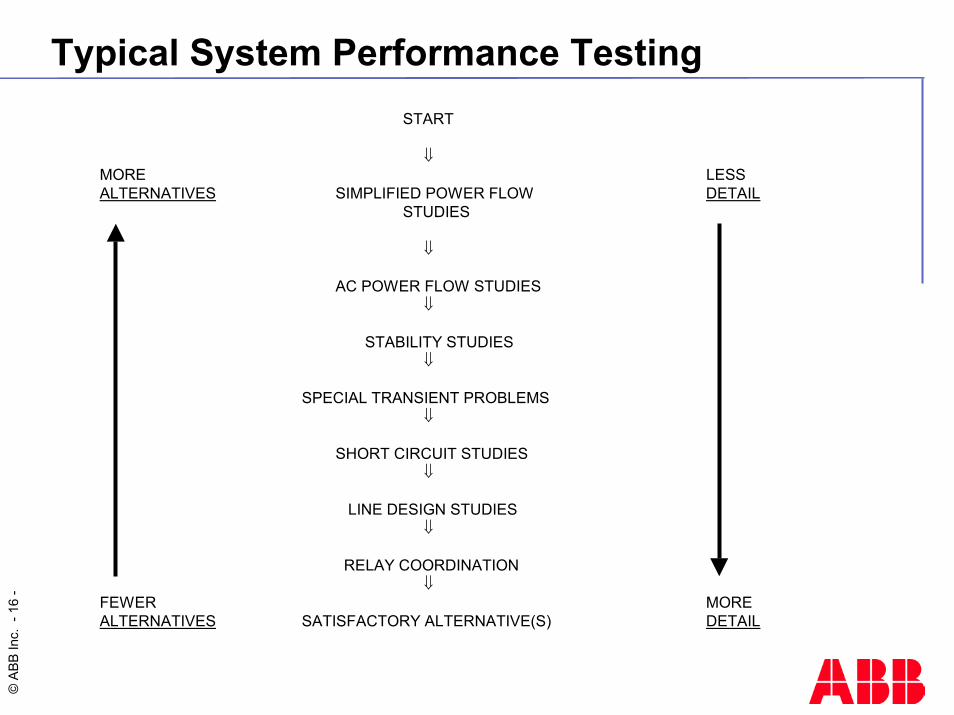
Typical System Performance TestingSTART
⇓MORE LESSALTERNATIVES SIMPLIFIED POWER FLOW DETAIL
STUDIES
⇓
AC POWER FLOW STUDIES⇓
STABILITY STUDIES⇓
SPECIAL TRANSIENT PROBLEMS⇓
SHORT CIRCUIT STUDIES⇓
LINE DESIGN STUDIES⇓
RELAY COORDINATION⇓
FEWER MOREALTERNATIVES SATISFACTORY ALTERNATIVE(S) DETAIL

© A
BB In
c. -
17-
Four Hierarchies in Reliability Analysis
1 . D ETER M IN ISTIC
2. PR O BABILISTIC – SY STEM PR O BLEM S
3. PR O BA BILISTIC – LO A D C U R T A ILM EN T, TLR etc.
4. C O ST EFFEC TIV EN ESS
CO N TIN G EN C Y A N A LY SIS
O U TA G E STA TISTICS
O PERA TO R A CTIO N S
V A LU E, CO ST, U TILIZA TIO N FA CTO R, PRICE
PR O BLEM S N U M BER & D EG REE
PROBA B ILISTIC IN D ICES for PRO BLEM S
PRO BAB ILISTIC IN D ICES FOR D ELIV ERY PO INT S
ECO N O M IC M EA SU RE

© A
BB In
c. -
18-
DETERMINISTIC CRITERIA
“UMBRELLA APPROACH” – Normal Conditions
N-1, Probable contingencies or most frequent contingencies (repair
time is not a concern)
N-2, Possible and less likely with low probability
N-3, Extreme contingencies (including S/S failure) or Possible but
least likely with very low probability contingencies - resolution
dependent on affected elements; severity of problems
Consequence of the Criteria to the Industry
MAY BE COSTLIER
DIFFICULT TO JUSTIFY IN OPEN MARKET

© A
BB In
c. -
19-
I. Normal conditions - the state of the transmission system:
All circuit in-service,Any load level,No conductor loaded above 100 percent of normal rating,No equipment loaded above 100 percent of normal rating,Voltage in the transmission system in the range of 97 to 105 percent of 69, 138, and 345 kV.

© A
BB In
c. -
20-
II. Probable stress conditions - any of the single point failures
Loss of any transmission tower and all the circuits on that tower,An internal fault on any circuit breaker,A fault on any substation in the system,Loss of any generating unit,Failure of any other single component in the system.
For the full range of possible load levels, generation schedules, sales and purchases to other utilities, and assuming proper operation of system protection devices, the transmission system will be tested to insure:
Voltage throughout the system remain within the range of 93 to 105 percent of 69 kV, 138 kV, or 345 kV,No conductor loading shall exceed 110 percent of normal rating,No equipment loading shall exceed 110 percent of normal rating,A system cascade and blackout will not occur.

© A
BB In
c. -
21-
III. Brief Outage Conditions - as contingencies that occur due to correct, or incorrect, system protection device operation and are in addition to any Probable Stress Condition
For these conditions the transmission system will be tested to insure: No conductor loading shall exceed 140 percent of normal rating,No equipment loading shall exceed 140 percent of normal rating,Voltage throughout the system shall remain within the range of 93 to 105 percent of 69, 138 or 345 kV.

© A
BB In
c. -
22-
IV. Extreme Disturbances - potential of resulting in an uncontrolled breakup of the system / excessively long outage of service
Loss of all lines emanating from a generating station, switching station, or substation,Loss of all circuits on a common right-of-way,Any Probable Stress Condition in addition to another transmission component out-of-service for an extended period of time,Any other credible contingency which might lead to a system collapse.

© A
BB In
c. -
23-
Summary of Deterministic Reliability Test
Test Conditions Analysis Acceptable System ConditionsNormal Steady
State1
Conditions
Steady StateLoad Flow
System within normal loading and voltage limits
SingleContingenciesSteady State
Steady StateLoad Flow
System within emergency loading and voltagelimits immediately after outage and within normal
limitsafter system adjustments
DoubleContingenciesSteady State
Steady StateLoad Flow
System within emergency loading and voltagelimits after system adjustments
Steady StateAnalysis
No voltage collapse or overload cascading
Basic ReliabilityTests
DynamicContingencies2 Dynamic
AnalysisTransiently and dynamically
stable
SupplementaryTest to Assess
SystemReliability
ExtremeContingencies
Steady Stateand Dynamic
Analyses
Avoidance of widespread load interruptions,uncontrolled cascading, system blackouts

© A
BB In
c. -
24-
Comparison of Contingency Testing: No Emergency Limit Violations
Precontingency Conditions(System Adjusted after Outage)
Contingency Normal One LineOut
OneTransformer
Out
OneGenerator Unit Out
Loss of Load W W WOne Transformer C P N S W C P N S W P N S P N S WOne Line C P N S W C P N S W P N S P N S WOne Generator Unit* C P N S W C P N S W P N S P N S WCommon Tower Line** P N S P N S P N S P N S
Legend: NPCC(N), MAPP(P), MACC(C), SPP(S), WSCC(W)

© A
BB In
c. -
25-
Contingency Testing - Dynamic Simulations Must Remain Stable without Load Shedding or Generator Dropping Comparison of Criteria
Element Faulted Normal
One Line Out
One Transformer Out
One Generator Unit Out*
3-PHASE FAULT NORMAL CLEARING Transformer C P N S W P N S W P N S P N S W Line C P N S W P N S P N S C P N S W Bus Section C P N S P N S P N S P N S Special Double P N S Double Ckt Line C P N S P N S P N S P N S SINGLE LINE-TO-GROUND DELAYED CLEARING Transformer C P N S W P N S P N S P N S Line C P N S W P N S C P N S C P N S Bus Section C P N S P N S P N S P N S Double Ckt Line CP P P P SINGLE LINE-TO-GROUND NORMAL CLEARING Circuit Breaker N N N N Transformer Line Bus Section Double Ckt Line N S N S N S N S

© A
BB In
c. -
26-
PROBABILISTIC INDICES
FREQUENCY OF OVERLOAD, LOW VOLTAGE,
VOLTAGE COLLAPSE, LOAD CURTAILED etc.
(events/year)
AVERAGE DURATION (Hours)
PROBABILITY
UNSERVED ENERGY (EUE or ENS)

© A
BB In
c. -
27-
Modeling and Index Calculations
There is no absolute level of reliability requirement
but,
Can provide a superior measure of relative strength
of different options
Required Inputs - System data in terms of network
topology, configuration, and component Failure
rates and Repair times

© A
BB In
c. -
28-
MOST COMMON COMPONENT RELIABILITY PARAMETERS
Permanent Short Circuit Failure Rate — events per year
Temporary Short Circuit Failure Rate — events per year
Open Circuit Failure Rate
Mean Time To Repair — hours
Mean Time To Switch — hours
Scheduled Maintenance Frequency - number/yr
Mean Time To Maintain — hours

© A
BB In
c. -
29-
BASIC RELATIONSHIP
probability of outage
Expectation = Sum(probi*Value)
8760durationfrequencyyprobabilit ×
=
frequency is in number of outages per year duration is in hours

© A
BB In
c. -
30-
Reliability Index CalculationsOutageScenario
Load>85%
Load>90%
Load>95%
Load>100%
Load>105%
Generator 1277.838 764.277 415.163 195.450 84.920Underground Line 288.096 172.311 93.601 44.065 19.146Overhead Line 68.687 41.082 22.316 10.506 4.565Transformer 56.120 33.565 18.233 8.584 3.729Generator & Generator 148.868 89.038 48.366 22.770 9.893Generator + Underground Line 33.563 20.074 10.904 5.134 2.230Generator + Generator + Generator 17.343 10.373 5.635 2.653 1.153Generator + Overhead Line 8.002 4.786 2.600 1.224 0.532Generator + Transformer 6.538 3.910 2.124 1.000 0.434Underground Line + Underground Line 7.567 4.526 2.458 1.157 0.503Underground Line + Overhead Line 1.804 1.079 0.586 0.276 0.120Underground Line + Transformer 1.474 0.882 0.479 0.225 0.098Overhead Line + Overhead Line 0.430 0.257 0.140 0.066 0.029Overhead Line + Transformer 0.351 0.210 0.114 0.054 0.023Transformer + Transformer 0.287 0.172 0.093 0.044 0.019

© A
BB In
c. -
31-
PROBABILISTIC - INDICES
UNACCEPTABLE EVENTS
FREQUENCY (OCC/YR) DURATION (HRS)
SEVERITY
INDICES
SYSTEM PROBLEMS SYSTEM STATE
LOAD CURTAILED

© A
BB In
c. -
32-
LOLPLOLP – A Typical Reliability Measure for A Power System
Consider three independent generating units of 100 MW each, whose outages are independent.
Calculate the probability of each state given that each unit has
an operating probability of 0.8 and failure probability of 0.2.
The generating units have to supply a load of 200 MW.
Calculate the Expected Unserved Energy (EUE) and the Loss of
Load Probability (LOLP) for one year.
~~~200 MW 3 x 100 MW

© A
BB In
c. -
33-
LOLPLOLPNumber of units out: 0 1 2 3
Capacity loss (MW) 0 100 200 300
Unserved Demand (MW) 0 0 100 200
State Probability 0.83 = 0.51 (3)(0.2)(0.82) = 0.384 (3)(0.8)(0.22) = 0.096 0.23 = 0.008
LOLP 0 0 0.096 0.008
EUE (MWh) 0 0 84,096 14,016
where
LOLP = P{Unserved Demand > 0} = 0.104 day/yr
EUE = (Probability)(Unserved Demand)(Time period) = 98,112 MWh.
This risk model assumes a constant demand of 200 MW. The long-run probability of residing each state can be determined by using a Markov probabilistic model or the binomial method. In this example, the binomial method was used.

© A
BB In
c. -
34-
Northeast Control Area – Control and Operations
Ontario Quebec
New York
NewEngland
Maritime Area
PJM
2500 MW
2400 MW
1000 MW 1500
MW
1600 MW

© A
BB In
c. -
35-
Market Based Planning/EvaluationsScenario Definition, Likelihood of scenarios, Database and system model development – IPP location and time, Old unit retirement, Load growth, Power wheelings, etc.
Next Year?
System Reinforcement Options
Chronological Market SimulationsProbabilistic Reliability Assessment,
with Remedial Actions
Reliability Constraints
Snapshot of market Simulated operating conditions
Economic Benefits Reliability Measure Calculations
System Risk, Reliability Cost, and Expected LMPs
The Transmission Alternative
Probabilistic Multi-Attribute Decision Making