Embed Size (px)
Citation preview
Constructivist
I
1 Case Studies in Instructional Design 1 I !
Brent G. Wilson University of Colorado at Denver
EDITOR
FOREWORD David N. P e h s Ha ward Universrty
Educational Tmhnology Publications Englewood Clifk, New Jersey 07632
Library of Congress Cataloging-in-Publication Data
Constructivist learning environments : case studies in instructional design / Brent G. Wilson, editor ; foreword by David N. Perkins.
p. cm. Includes bibliographical references and indexes. ISBN 0-87778-290-3 1. Instructional systems--Design--Case studies. 2. Constructivism
(Education)--Case studies. 3. Classroom environment--Case studies. I. Wilson, Brent G. (Brent Gale) LB1028.38.C66 1996 371.3'078 --dc20 95-30145
CIP
Copyright O 1996 by Educational Technology Publica- tions, Inc., Englewood Cliffs, New Jersey 07632. All rights reserved. No part of this book may be reproduced or transmitted, in any form or by any means, electronic or mechanical, including photo- copying, recording, or by any information storage and retrieval system, without permission in writing from the Publisher.
Printed in the United States of America.
Library of Congress Catalog Card Number: 95-30145.
International Standard Book Number: 0-87778-290-3.
First Printing: Janua y, 1296
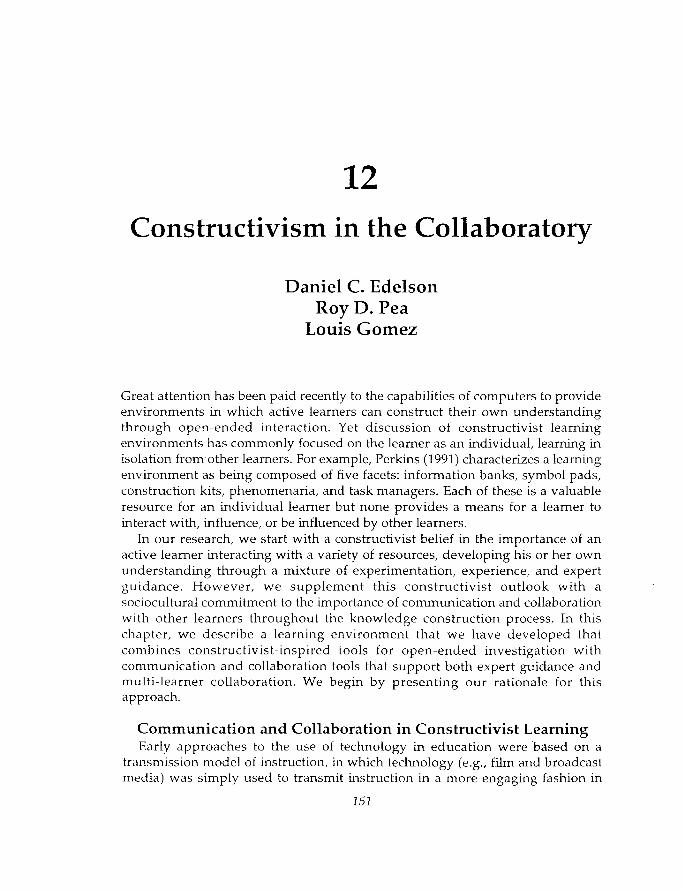
Constructivism in the Collaboratory
Daniel C. Edelson Roy D. Pea
Louis Gomez
Great attention has been paid recently to the capabilities of computers to provide environments in which active learners can construct their own understanding through open-ended interaction. Yet discussion of constructivist learning environments has commonly focused on the learner as an individual, learning in isolation from other learners. For example, Perkins (1991) characterizes a learning environment as being composed of five facets: information banks, symbol pads, construction kits, phenomenaria, and task managers. Each of these is a valuable resource for an individual learner but none provides a means for a learner to interact with, influence, or be influenced by other learners.
In our research, we start with a constructivist belief in the importance of an active learner interacting with a variety of resources, developing his or her own understanding through a mixture of experimentation, experience, and expert guidance. However, we supplement this constructivist outlook with a sociocultural commitment to the importance of communication and collaboration with other learners throughout the knowledge construction process. In this chapter, we describe a learning environment that we have developed that combines constructivist-inspired tools for open-ended investigation with communication and collaboration tools that support both expert guidance and multi-learner collaboration. We begin by presenting our rationale for this approach.
Communication and Collaboration in Constructivist Learning Early approaches to the use of technology in education were 'based on a
transmission model of instruction, in which technology (e.g., film and broadcast media) was simply used to transmit instruction in a more engaging fashion in
152 Constrtlctivist Learning Environments
some cases, and to larger numbers of students in others. This practice continues today in the form of distance education that uses phone lines, satellite links, and microwave to transmit static knowledge to wider audiences, with minimal opportunities for highly interactive conversations with instructors or other learners (Pea & Gomez, 1992). With the advent of the personal computer, technology took on new roles in learning, including, in the best cases, permitting students to interact with responsive, dynamic environments that support compelling, active learning. However, in many workplaces and other environments not specifically designed for education, computers have shown their greatest value to be in support of communication and collaboration, as in electronic mail and in groupware applications such as Lotus Notes. Increasingly, technology has assisted in broadening the form that collaboration takes to include not just discussion but the sharing of artifacts and cooperative work across time and distance. We believe that technologies with similar emphases can play a revolutionary role in supporting new forms of learning conversations in educational settings.
In thinking about educational reform, it is important to recognize that the math and science reforms of the 1960's that were most successful were not just those that emphasized the active nature of the learner through manipulables and hands-on inquiry, but also those that provided opportunities for students to talk, while they were engaged in leaming interactions, about what they were learning, what they believed, and what they had difficulty understanding (Bruner, 1966; Bredderman, 1983; Shymansky, Kyle, & Alport, 1983). With that experience, it would be a mistake to be satisfied in the current era of reform with constructivist learning environments that only provide for solitary interaction.
The act of communication during learning can enhance the quality of the leaming. Our view of communication is that it is more than simply passing static knowledge back and forth between participants. The act of communication transforms all the parties involved (Pea, 1994). In a conversation, the act of speaking requires an individual to place a structure and a coherency on his or her understanding that may lead the individual to recognize gaps in that understanding or forge new connections between formerly disconnected knowledge. The interaction between speaker and listener(s) in a conversation amplifies this process as they attempt to reconcile the differences in their perspectives, opinions, and experiences. The result of such conversations for the participants can be new knowledge, reorganized knowledge, or simply the awareness of a need for additional understanding. In each case, however, the social act of attempting to share and reconcile the knowledge of different individuals motivates learning in a way that is much rarer (although not unheard of, e.g., Chi et al., 1989) among solitary learners.
In addition to this emphasis on the transformative nature of communication, we have been influenced in our approach by the belief that an important goal of learning is to gain entrance to or understanding of communities of practice (Lave & Wenger, 1991). In the research we describe here, we view the scientific community as a community of practice, shaped by shared language, activities, and values (D'Amico et al . , 1994). Lave and Wenger characterize the learning process associated with becoming a member of a community of practice as legitimate peripheral participation. This form of learning, closely allied to Brown,
Constructivism in the Collaboratoy 153
Collins, and Duguid's (1989) cognitive apprenticeship learning, consists of authentic participation in the activities of the community at a level appropriate to the learner's current competency. As the learner's understanding and competence increase, he or she is able to participate in more central, and therefore less peripheral, practice until eventually the learner becomes an acculturated member of the community. In the research we describe here, we provide learners with the ability to join a scientific community of practice by providing them with access to the tools and activities employed by scientists and by providing them with the means to communicate and develop relationships with practicing scientists in the context of authentic scientific inquiry.
This orientation toward learning alters the role of the teacher significantly. Where some forms of solitary constructivist learning threaten to remove the teacher from active participation in students' learning, the form of constructivist learning in a collaborative social context that we are advocating places the teacher in a role of central importance. The teacher must be able to guide students as they engage in open-ended activities, but more importantly must be able to help students establish and maintain transformative learning conversations about these activities. To do so requires the teacher to establish a culture of communication about matters of substance in the classroom that includes the teacher as both participant and facilitator. The teacher as participant brings an expertise in the content area and in the learning process that he or she can share with students at appropriate moments. The teacher as facilitator must bring an expertise in fostering and even guiding learning conversations that ideally involves a diversity of participants and that includes not just students but members of relevant extramural communities.
The CoVis Collaboratory Over the past two years, we have been attempting to place the approach
described above into practice in high school science classrooms under the auspices of the Learning Through Collaborative Visualization (CoVis) Pr0ject.l The CoVis project is an NSF-funded educational networking testbed that is establishing a scientific learning collaboratory (Lederberg & Uncapher, 1989) that includes students, teachers, scientists, informal science educators, and educational researchers. In its approach to transforming science learning the CoVis Project has focused on three areas: (1) a project-enhanced science learning pedagogy (Ruopp et al., 1993), ( 2 ) scientific visualization tools for open-ended inquiry, and (3) networked environments for communication and collaboration. The project's classroom innovation efforts in these three areas are being accompanied by an evaluative research effort aimed at both formative and summative evaluation.
The CoVis project began working with six earth and environmental science teachers at two Chicago-area high schools in the summer of 1992. In the fall of 1993, these teachers and their nearly 300 students began the school year with a new suite of applications that included scientific visualization tools for atmospheric sciences and an asynchronous collaboration environment, both
'Information about the CoVis Project is available via the world-wide web at the U R L "http://www.covis.nwu.edu."
154 Constrtlctivisf Learning Eizvironments
developed by the CoVis project, as well as desktop video teleconferencing, and a full set of Internet tools including e-mail, Usenet news, and Gopher. These applications are accessed using six Macintosh Quadra workstations in each classroom connected to a high-speed video and data network running over Primary Rate ISDN digital phone lines. As an ensemble, these applications provide a "collaboratory" environment that couples open-ended scientific inquiry tools with tools to support communication and collaboration.
Visualization Tools for Open-Ended Inquiry A wide, and growing, range of microcomputer-based tools that support
constructivist learning have been developed over the past decade, from microworlds, to modeling and simulation environments, to programming languages (see, for example, Hancock, Kaput, and Goldsmith, 1992; Hare1 & Papert, 1993; Lewis, Stern, & Linn, 1993; Papert, 1980; Resnick & Ocko, 1994; Roschelle, 1992; Smith, Snir, & Grosslight, 1992; Stewart et al., 1992; White, 1993). We have been exploring yet an additional type of software environment for constructivist learning, scientific visualization environments. Scientific visualization is a technique for data analysis that has revolutionized several fields of science. Scientific visualization received its definition from a landmark NSF report (McCormick, DeFanti, & Brown, 1987) that brought together diverse representatives from the disciplines of science, computer science, and the visual arts. While scientific visualizations from different disciplines of science vary dramatically, they generally share the use of color, shape, and motion to provide a visual window into the patterns and structure to be found in large, complex data. Scientific visualizations can generally be characterized by the following traits adapted from Gordin and Pea, 1994):
They incorporate massive amounts of quantitative data. They aim for verisimilitude with the phenomena they represent. They attempt to represent entire phenomena holistically by interpolating from data. They employ color and shape to encode the magnitude of variables. They use animated sequences to show progression over time. They rely on high speed computation to generate images.
Scientific visualizations are often similar to digital photographs in that they contain a set of values that can be rendered by mapping each number to a particular color. However, unlike a digital photograph, the values composing a scientific visualization do not necessarily represent the intensities of visible light. Instead, they can represent any measured or derived quantities of scientific interest. For example, the data set might be collected from temperatures all over the world. These temperatures are then viewed as a digital image, where each number is mapped to a specific color. The variations and patterns of color allow a viewer to observe underlying processes. Through this strategic use of color and motion, scientific visualizations exploit the strengths of the human visual system.
We conjecture that the same advantages that scientific visualization holds for scientists also hold for students of science. Many of the troubles that students experience in science stem from difficulty in understanding the abstractions, formalisms, and quantitative terms of equation-based data representations. In taking advantage of powerful human visual perceptual capabilities, scientific
Construct iv ism i n the Collaboratory 155
visualization offers a different route to scientific understanding, and thus the possibility of reaching a group of students that have not been well-served by traditional science teaching. Scientific visualization also offers the possibility of opening up new domains for study that have been considered too complex for high school students because of their heavy reliance on formulae and abstract representations. Similarly, scientific visualizations can give students the ability to conduct direct investigations in areas to which they have only had indirect access before (e.g., global climate data; planetary biomass distribution; ocean temperature).
From the point of view of socioculturally-based constructivist learning, scientific visualization has three additional important characteristics. The first is that scientific visualization allows students to pose their own research questions, investigate them through direct manipulation of data, and create their own graphical images to first generate and then demonstrate their conclusions. Scientific visualization tools can, therefore, provide the active, open-ended exploration that characterizes constructivist learning. Second, the images produced by scientific visualization provide a basis for discussion among learners. Learners can engage in dialogues about the meaning and interpretation of visualization images that can help them to extend their understanding and reveal their partial understandings. Third, inquiry using scientific visualizations can link students with the actual practice of scientists. This step toward reducing the distance between the practices of scientists and those of students in the classroom gives students a valuable common ground with scientists. In a situation where students have direct access to practicing scientists, this common ground can support effective communication and scientist-student relationships. In this manner, the construction of scientific visualizations becomes a form of legitimate peripheral participation in the community of scientific practice.
A primary challenge of employing scientific visualization in educational settings is that visualization tools as now employed by scientists are difficult to use and rely on a great deal of expertise on the part of the user. In the CoVis project, we have worked very closely with researchers in the atmospheric sciences to adapt the tools they use in their research for use in high school science classrooms by creating "front-ends," novice scaffolds for working with the challenges of complexity. We have developed a four-step process for this purpose:
1. Investigate science practice. We observe the use of visualization tools and data sets by scientists. This step requires our development group to become reasonably expert, with the support of scientific advisors, in the content area and its research questions. The result of this step is a characterization of the sorts of questions the visualization tools and data sets can be used to investigate, and the ways in which the tools are employed in the course of inquiry.
2. Identijij tacit knowledge used i n science practice. We seek to articulate the tacit knowledge employed by scientists in their use of the visualization tools. This knowledge includes scientific principles, understanding of the limitations of the data collection process and the models used to enhance the data, and how-to knowledge concerning the use of the tools.
Constructivist Learning Environments
3. Scaffold the science practice for students by making the tacit explicit. We adapt these visualization tools so as to make the tacit knowledge exposed in the second step explicit, structuring the software interface and affiliated pedagogical activities to assist students to pursue meaningful questions.
4. Refine the visualization tools in response toformative evaluations. Through a combination of observation and direct user feedback, evaluate the patterns of use that emerge and use these evaluations to inform the redesign of the software.
As part of the CoVis Project, we have developed three visualization environments using this four-step process for building "front-ends" to scientific visualization tools and data sets, and we are about to embark on the development of a tool that will partially automate the development of these environments for a certain range of data sets. The visualization environments we have developed cover three aspects of atmospheric science and are called the Weather Visualizer (Fishman & D'Amico, 1994), the Climate Visualizer (Gordin & Pea, 1994; Gordin, Polman, & Pea, 1994), and the Greenhouse Effect Visualizer (Gordin, Edelson, & Pea, 1995). Each of these is built on top of a scientific visualization tool used by researchers (e.g., Transform from Spyglass, Inc.) and provides learners with a more structured and more supportive user interface.
The Weather Visualizer is an interface to the most recent hour's weather data for the United States. I t enables students to view satellite images in both the visual and infrared spectrum, weather maps displaying graphical symbols corresponding to atmospheric conditions and local station reports, and six-panel, false-color images showing such variables as temperature, wind speed and direction, atmospheric pressure, dew point, and moisture convergence. This visual information is supplemented by textual reports and forecasts for all National Weather Service reporting stations in the country. All the data used by the Weather Visualizer are provided via the Internet from the Department of Atmospheric Sciences at the University of Illinois at Urbana-Champaign.
The major feature of this environment is that it enables students to construct their own weather maps, displaying the variables that they are interested in, for whatever portion of the country and at whatever altitude they desire. This graphical representation can then be compared to the pre-constructed satellite images and six-panel visualizations that the Weather Visualizer also provides.
The most common use of the Weather Visualizer by students has been for conducting "nowcasts" and forecasts. Nowcasting is an activity usually used by teachers to introduce students to the interpretation of weather maps and symbols. Students use the graphical representations to construct descriptions of the current weather in a particular location. Performing forecasts is a great deal more open-ended and gives students the opportunity to share hypotheses, discuss the processes by which they came to those hypotheses, and engage in scientific disputes. In addition, they have the ability to compare their own thought processes with more expert practitioners both through the CoVis network or by watching meteorologists on TV. Using a companion program to the Weather Visualizer called the Weather Graphics Tool (Fishman & D'Amico, 1994), students are able to express their forecasts in the form of weather maps they draw themselves. The Weather Graphics tool, a plug-in module for Aldus
Superpaint, gives students the abilit) to draw weather maps almost identical to those produced by the Weather Visualizer by "stamping" weather symbols from an electronic stamp pad onto blank maps. In addition to nowcasting and forecasting, students have used the weather maps and satellite images for research into weather-related topics. For example, one student used archived weather maps as part of an investigation of the conditions that led to the disastrous wild fires in the Los Angeles area in the late fall of 1993.
Like the Weather Visualizer, the Climate Visualizer provides students with access to weather data. However, the Climate Visualizer draws from a data set that contains twenty-five years of data from the early 1960's to the late 1980's for most of the Northern Hemisphere. The Climate Visualizer allows students to display temperature as color, wind as vectors and atmospheric pressure as contours. It has been augmented from the tool that climatologists use to examine the same data by adding several features. These features include: (1) geographic references such as latitude and longitude markings and a continent overlay, (2) the addition of units to all numerical values, e.g., degrees Fahrenheit or Celsius, and (3) an interactive color palette that displays the direct mapping between colors or symbols displayed in a visualization and the quantities they represent. It is a measure of the success of the tool's adaptation process that students are most often able to begin to make sense of visualizations in the Climate Visualizer immediately, without the extensive assistance that would have been required for them to look at the same variables using the scientists' tool. The Climate Visualizer provides students with the ability to modify the mappings from values to colors in order to accentuate features of interest, and it provides them with the ability to create new data by subtracting one image from another. Subtraction allows students to track trends over time, e.g., diurnal, seasonal, and annual. Because the data set includes monthly averages and averages for the same date over twenty-five years, students are also able to use subtraction to investigate anomalies.
Students have used the Climate Visualizer to conduct investigations into topics of their own choosing that include the effect of coastlines on local temperatures, the impact of volcanoes on weather, and what the climate will be like in California in 50 million years (taking into account geologists' predictions that it will separate from the mainland). One of the most interesting discoveries by students using the Climate Visualizer is an apparent flaw in the model used to generate the data that the students are using. This dataset has been created using a complex mathematical model to interpolate from sparse measurements. Students first observed that temperature values in the Himalayas in some years were surprisingly cold. Upon consideration, they realized that in that part of the world, there are mountains at the height in the atmosphere they were viewing. The values they were seeing, therefore, had to have been generated by a model, since it is impossible to measure atmospheric temperature in the interior of a mountain. The fact that these areas were so much colder than surrounding areas indicated that the model was probably flawed. This hypothesis gained more strength from the fact that the temperatures in that part of the world were only anomalous in certain years. This process of examining the source and reliability of the data they were working with was a valuable opportunity for the students to expand their understanding of the scientific process.
158 Constructivist Learning Environments
The Greenhouse Effect Visualizer is the newest visualization environment in the CoVis software suite. It allows students to visualize and manipulate data having to do with the balance of incoming and outgoing solar radiation in the earth's atmosphere. The Greenhouse Effect Visualizer is constructed around three alternative models of the earth-sun system. The first model treats the earth as a body with no atmosphere, the second treats the earth as a body with an atmosphere but no clouds, and the third includes the earth, the atmosphere, and clouds. The Greenhouse Effect Visualizer combines measured with derived data and provides students with access to variables such as incoming solar radiation (insolation), reflectance of the earth's surface (albedo), and surface temperatures of the earth. In pilot usage, students have used the Greenhouse Effect Visualizer to try to understand and demonstrate possible sources of global warming.
In using all of the CoVis visualizers, students have had the opportunity to generate their own questions, develop their own plans for identifying and exploring appropriate data, and create their own artifacts to generate and demonstrate findings. Both the visualization process and the visualizations themselves then become the topic of a scientific dialogue in which students, together with teachers, scientists, and other students, try to make sense of what they have done. While many dialogues lead to increased understanding of scientific concepts, others involve the sharing and even growth of significant misconceptions. To the extent that a teacher or scientist can help shape these dialogues, students' understanding of the underlying science can be improved. Regardless, the sharing of viewpoints and the examination of the inquiry process invariably brings students closer to an understanding of the practice of science in a social context.
Using Tools for Communication and Collaboration The practice of science takes place mostly in communities, and relies
increasingly on collaborations that span widely distributed institutions through the use of networking technologies to form "collaboratories" (e.g., Lederberg & Uncapher, 1989; Office of Science and Technology Policy, 1994). In developing collaborative learning environments, the CoVis project has taken technologies developed primarily to support collaboration in industrial and research settings and adapted them to high schools. These technologies enable students and others to work together within classrooms and across the country, at the same time (synchronously) or at different times (asynchronously).
To participate in synchronous collaboration, several individuals can sit together at the same computer, or-using CoVis-provided tools-work together at a distance as if they were sitting at the same computer. The functionality for establishing such "media spaces" is achieved through desktop video telecon- ferencing coupled with remote screensharing2 In the desktop videoconferencing set-up used by CoVis participants, a video monitor, camera, microphone, and speaker adjacent to a computer workstation allow an individual or group at one end to see and talk to partners at the other. Remote screensharing allows
*Desktop videoconferencing is conducted using the Cruiser and Touring Machine applications developed at Bellcore, and remote screensharing is performed using Timbuktu and Timbuktu Pro from Farallon Computing.
Constructirisn~ in the Collaboratory 159
individuals at one end to view the contents of their partners' computer screen and to control the remote computer with their own keyboard and mouse. The result is the ability to have parties in two locations viewing and controlling the same computer as if they were in the same place. Combined with the ability to see and speak with each other, remote screensharing supports an interaction that is very similar to working together at the same computer. In the first year of CoVis operations in the schools, this synchronous collaboration environment was primarily used as a means for students to work with graduate students at Northwestern University playing mentoring roles for students' investigations.
Asynchronous collaboration in CoVis classrooms is supported both by conventional communication applications like e-mail and newsgroup discussions, and by a novel groupware application we have developed called the Collaboratory Notebook (Edelson & O'Neill, 1994a; Edelson & O'Neill, 1994b). Individual students or project teams use e-mail and newsgroups to contact remote experts and to post queries for information from both the CoVis community and the Internet community at large. They use the Collaboratory Notebook to record their activities, and to share their work with others. The Collaboratory Notebook is a networked, multimedia database that is structured to support learners through the inquiry process and provides them with a mechanism for working cooperatively with others. It is also designed to provide teachers and other mentors with a window into the thinking processes and activities of students. In its structure and goals, the Collaboratory Notebook shares attributes with other hypermedia collaboration environments designed for educational and research use, such as CSILE (Scardamalia & Bereiter, 1991), Project INQUIRE (Brunner, 1990; Hawkins & Pea, 1987), Groupwrite (Schank & Osgood, 1993) and the Virtual Notebook System (Gorry et al., 1991).
In a prototypical use of the Collaboratory Notebook, a group of students might develop an idea for an investigation and begin by recording some questions and hypotheses. These may be followed by a plan for how to pursue these issues. A teacher or other mentor could read the students' questions, hypotheses and plans and add comments to help them focus their efforts or to alert them to resources that they might find useful. In the next stage, students might engage in separate research activities that they could individually record for the others to view. In doing so, they might store both data and analyses within the Notebook. Without needing to meet in person, students could exchange questions and comments on their findings. Once they have conducted their investigations, they could get further guidance from an instructor or a scientist mentor, and then use the information they have recorded to draw conclusions or initiate further investigations.
Loosely modeled on the metaphor of a scientists' notebook, the Collaboratory Notebook provides users with the ability to author pages individually or in groups and to read the pages authored by others. Pages are labeled according to the role they play in the inquiry process (e.g., question, plan, conjecture, evidence-for, evidence-against, commentary) and may be linked via a hypermedia interface to other pages according to the relationship between them. Thus, a conjecture may be linked to the question it answers, and evidence-against may be linked to a conjecture it contradicts. The limited set of pre-defined page and link types are designed to provide students with a helpful supporting
160 Constructivist Learning Environments
structure in recording their thought processes and actions as they engage in open-ended inquiry and to help them to develop a model of the inquiry process. The page- and link-types serve a second role, which is to help establish reliable conventions within a community of contributors that help readers to navigate through the hypermedia database more efficiently.
The Collaboratory Notebook database is divided into individual notebooks that students and teachers may create to serve specific purposes. Thus, a student may create a private journal, a group of students might create a shared project notebook, and a teacher may create a discussion notebook in which all of his or her students can participate. Because the Collaboratory Notebook is a multimedia database, students are able to record text as well as tables, graphics, sound, video, and animation within their notebooks. The Notebook is implemented as a networked client connected to a central database, so it may be used from any location on the Internet. Taking advantage of this capability in the past year, one teacher at a Chicago-area school set up an activity using the Collaboratory Notebook in which students in his class entered information about topics in mineralogy, and scientist mentors at the University of Illinois at Urbana- Champaign and the Exploratorium museum in San Francisco interceded with questions designed to impel students to probe more deeply.
In the integrated CoVis software environment, the Collaboratory Notebook provides a mechanism for constructivist activities in a social context. It provides the mechanism for recording activities, storing artifacts, and sharing the working process with others. Its structure helps to make the inquiry process explicit and even to make it a topic of discussion. Coupled with the scientific visualization tools and other Internet investigation tools provided by the CoVis project, the Notebook supports the social process of constructing knowledge.
As an example of the integration of inquiry tools and collaboration tools, consider the following activity conducted by a CoVis teacher. Rather than directly instructing students about weather phenomena, he chose to let them learn about them through the process of making weather predictions. To do so, he created a discussion notebook using the Collaboratory Notebook software and instructed students to make 48-hour weather predictions and place them within that shared notebook. His students used the Weather Visualizer to create weather maps and satellite images of the current weather, which they could then store in the notebook as data. Working from these visualizations, they attempted to project forward forty-eight hours using their limited understanding of meteorology to make predictions. Their predictions could be expressed in the form of weather maps that they drew themselves with the Weather Graphics Tool.
Once student groups had entered their predictions and the rationale for them, they were able to view the predictions of the other groups and to argue for or against competing forecasts. Taking advantage of the teacher, each other, and other sources of information, students were able to improve their understanding of the underlying scientific processes through social interaction. One of the most compelling incidents that occurred in this relatively brief process took the form of a "hint" posted by one group of students. These students encouraged the other
Constructivisn~ in the Collaboratory 161
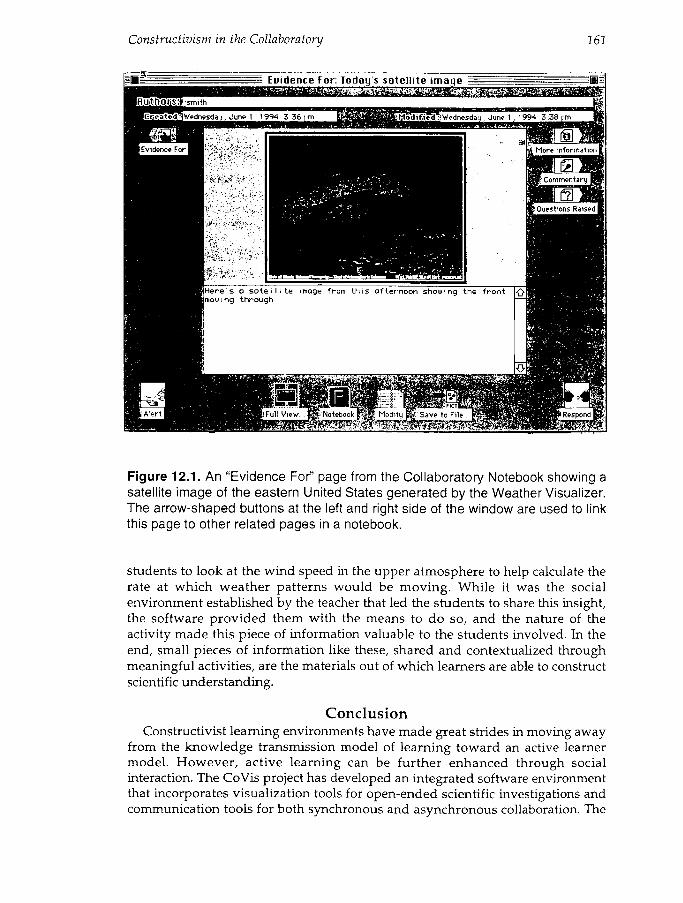
Figure 12.1. An "Evidence For" page from the Collaboratory Notebook showing a satellite image of the eastern United States generated by the Weather Visualizer. The arrow-shaped buttons at the left and right side of the window are used to link this page to other related pages in a notebook.
students to look at the wind speed in the upper atmosphere to help calculate the rate at which weather patterns would be moving. While it was the social environment established by the teacher that led the students to share this insight, the software provided them with the means to do so, and the nature of the activity made this piece of information valuable to the students involved. In the end, small pieces of information like these, shared and contextualized through meaningful activities, are the materials out of which learners are able to construct scientific understanding.
Conclusion Constructivist learning environments have made great strides in moving away
from the knowledge transmission model of learning toward an active learner model. However, active learning can be further enhanced through social interaction. The CoVis project has developed an integrated software environment that incorporates visualization tools for open-ended scientific investigations and communication tools for both synchronous and asynchronous collaboration. The
162 Cons tructiuist Learning Enuironmen ts
visualization tools, modif ied versions of scientists' tools, enab le s tuden t s to participate in authentic scientific practice. The collaboration tools enable students to engage in this scientific practice in a social context that includes other students, teachers, and scientists. T h e result ing social interactions enhance the learning that s tudents achieve th rough the transformative process of communication. Over the next several years, as the project grows to include more schools, we will be conducting in-depth s tudies wi th in the participating classrooms to evaluate the character of the learning a n d the social interactions that take place there. O u r experiences to date offer encouragement that practicing teachers a re able to take advantage of these sor ts of n e w technologies to p rov ide their s tuden t s wi th oppor tuni t ies for ac t ive l ea rn ing a n d mean ingfu l social in terac t ion a b o u t scientific subjects.
References
Bredderman, T. (1983). Effects of activity-based elementary science on student outcomes: A quantitative synthesis. Review of Ed~icational Research, 53,499-518.
Brown, J. S., Collins, A., & Duguid, P. (1989). Situated cognition and the culture of learning. Educntional Researcher, 18(1), 3242.
Bruner, J. S. (1966). Toward n theory of instrziction. Cambridge, MA: Harvard University Press.
Brunner, C. (1990). Designing INQUIRE. New York: Bank Street College, Center for Children and Technology.
Chi, M. T. H., Bassok, M., Lewis, M. W., Reimann, P., & Glaser, R. (1989). Self- explanations: How students study and use examples in learning to solve problems. Cognitive Science, 13, 145-182.
D'Amico, L., Fishman, B., Gordin, D. N., McGee, S., O'Neill, K., & Polman, J. (1994). The atmospheric sciences: Six views into a community of practice. Unpublished manuscript.
Edelson, D. C., & O'Neill, D. K. (1994a). The CoVis collaboratory notebook: Computer support for scientific inquiry. Paper presented at the annual meeting of the American Educational Research Association, New Orleans.
Edelson, D. C., & O'Neill, D. K. (199413). The CoVis collaboratory notebook: Supporting collaborative scientific inquiry. In Recreating the revolzition: Proceedings of the National Educntional Computing Conference (pp. 146-152). Eugene, OR: International Society for Technology in Education.
Fishman, B., & D'Amico, L. (1994). Which way will the wind blow? Networked computer tools for studying the weather. In T. Ottmann & I. Tomek (Eds.), Educational rnliltimedin and hypermedia, 1994: Proceedings of ED-MEDIA 9 P W o r l d Conference on Edlicational mliltimedia and hypermedia (pp. 209-216). Charlottesville, VA: Association for the Advancement of Computing in Education.
Gordin, D., & Pea, R. (1994). Prospects for scientific visualization as an educational technology. lolirnnl of the Lenrning Sciences.
Gordin, D. N., Edelson, D. C., & Pea, R. D. (1995). The Greenhouse Effect Visualizer: A tool for the science classroom. Proceedings of the Annun1 Meeting of the American Meteorological Society, January, 1995.
Gordin, D., Polman, J., & Pea, R. (1994). The Climate Visualizer: Sense-making through scientific visualization. Jo~~rnal of Science Education and Technology, 3(4), 203-325.
Cons t r z~ t iu i s~n iiz the Collaboratory 163
Gorry, A. G., Long, K. B., Burger, A. M., Jung, C. P., & Meyer, B. D. (1991). The Virtual Notebook System: An architecture for collaborative work. Journal of Organizational Compllting, 1(3), 233-250.
Hancock, C., Kaput, J. J., & Goldsmith, L. T. (1992). Authentic inquiry with data: Critical barriers to classroom implementation. Ed~~cational Psychologist, 27(3), 337-364.
Hawkins, J., & Pea, R. D. (1987). Tools for bridging the cultures of everyday and scientific thinking. lo~rrnal of Research in Science Teaching, 24(1), 291-307.
Harel, I., & Papert, S. (1993). Software design as a learning environment. interactive Learning Environments, 1(1), 1-32.
Lave, J., & Wenger, E. (1991). Situated learning: Legitimate peripheral participation. Cambridge: Cambridge University Press.
Lederberg, J., & Uncapher, K. (Co-Chairs). (1989). Towards a national collaborate y: Report of an invitational iuorksllop at the Rockefeller University, March 17-18. Washington DC: National Science Foundation Directorate for Computer and Information Science.
Lewis, E. L., Stern, J. L., & Linn, M. C. (1993). The effect of computer simulations on introductory thermodynamics understanding. E~i~lcational Technology, 33(1), 15-58.
McCormick, B. H., DeFanti, T. A., & Brown, M. D. (Eds.) (1987). Visualization in scientific computing. Computer Graphics, 21 (6).
Office of Science and Technology Policy. (1994). High performance comput ing and commtmications: Toward a national infornmtion infrastructure: The FY 1994 U . S. research and dez~elopment program. A Report by the Committee on Physical, Mathematical, and Engineering Sciences, Federal Coordinating Council for Science, Engineering, and Technology. Washington, DC: Executive Office of the President.
Papert, S. (1980). Mindstornzs. New York: Basic Books. Pea, R. D. (1994). Seeing what we build together: Distributed multimedia learning
environments for transformative communications. l o ~ ~ r n a l of tlle Learning Sciences, 3(3), 285-299.
Pea, R. D., & Gomez, L. (1992). Distributed multimedia learning environments: Why and how? Interactive Learning Environments, 2(2), 73-109.
Perkins, D. N. (1991, May). Technology meets constructivism: Do they make a marriage? Ed~~cntional Technology, 31 (5), 18-23.
Resnick, M., & Ocko, S. (1994). LEGO/Logo: Learning through and about design. In S. Papert (Ed.), Constructionism (pp. 141-150). Norwood, NJ: Ablex.
Roschelle, J. (1992). Learning by collaboration: Convergent conceptual change. The lonrnal of the Learning Sciences, 2(3), 235-276.
Ruopp, R., Gal, S., Drayton, B., & Pfister, IM. (Eds.) (1993). LabNet: Tozuard a cornn~llnity of practice. Hillsdale, NJ: Lawrence Erlbaum Associates.
Scardamalia, M., & Bereiter, C. (1991). Higher levels of agency for children in knowledge building: A challenge for the design of new knowledge media. The journal of the Learning Sciences, 1 (I), 7-68.
Schank, R. C., & Osgood, R. (1993). The cornmunlcations story. Evanston, 1L: Institute for the Learning Sciences, Northwestern University.
Shymansky, J. A., Kyle, W. C., Jr., & Alport, J. M. (1983). The effects of new science curricula on student performance. journal of Research in Science Tmchirly, 20(5), 387404.
Smith, C., Snir, J., & Grosslight, L. (1992). Using conceptual models to facilitate conceptual change: The case of weight-density differentiation. Cognitioll and Instrzrction, 9(3), 221- 283.
Stewart, J., Hafner, R., Johnson, S., & Finkel, E. (1992). Science as model building: Computers and high-school genetics. Ed~rcational Psycl~ologlst, 27(3), 317-336.
White, B. Y. (1993). Intermediate abstractions and causal models: A microworld-based approach to science education. In Al-ED 93: World Conference on Artificial Intelligence nnd Education (pp. 26-33). Charlottesville, VA: Association for the Advancement of Computing in Education.
Acknowledgment This material is based upon work supported by the National Science Foundation's
Programs for Applications of Advanced Technology and Informal Science Education under Grant No. MDR-9253462. The CoVis project receives additional support from its industrial partners, including Ameritech, Bellcore, Apple Computer, Sony Corporation, Spyglass, Inc., Sun Microsystems, Aldus, and Farallon Computing.
The authors would like to thank Joe Polman for his assistance in preparing this chapter. In addition, we would like to acknowledge the major contributions to-this research made by the entire CoVis project team at Northwestern: Laura D'Amico, Barry Fishman, Douglas Gordin, Stephen McGee, Kevin O'Neill, Joseph Polman, Phoebe Peng, Joey Gray, and Susan Rand. The Weather Visualizer was developed in cooperation with our collaborators at UIUC: Mohan Ramamurthy, Robert Wilhelmson, Steve Hall, and John Kemp. The Climate Visualizer was developed with assistance from Ray Pierrehumbert at the University of Chicago. Paul Forward and Ray Pierrehumbert assisted with the development of the Greenhouse Effect Visualizer. The CoVis teachers, Patty Carlson, George Dervis, Larry Geni, Mary Beth Hoffman, Ken Lewandowski, and Rory Wagner, have all provided valuable feedback in the development of the software described here and have been exceptional partners in innovation.
Daniel C. Edelson is Assistant Professor of Education and Computer Science, Roy D. Pea is Dean of the School of Education and Social Policy and John Evans Professor of Education and the Learning Sciences, and Louis Gomez is Associate Professor of Education and Computer Science, at the School of Education and Social Policy and Institute for the Learning Sciences, Northwestern University, Evanston, Illinois.