Embed Size (px)
Citation preview

FINAL
Volume I
CONSTRUCTION DOCUMENTATION REPORT
Three Rivers Levee Improvement Authority Marysville, California
June 2007
2365 Iron Point Road, Suite 300
Folsom, CA 95630

� ����������
���
Table of Contents
Executive Summary................................................................................................................. 1
1. Introduction.......................................................................................................................... 2 1.1 Report Overview ................................................................................................................................. 2 1.2 Basin Description................................................................................................................................ 2 1.3 Project Overview................................................................................................................................. 3
1.3.1 Goals and Objectives .................................................................................................................. 3 1.3.2 Background ................................................................................................................................. 3 1.3.3 Design Criteria............................................................................................................................. 4
1.3.3.1 USACE Levee Design Criteria ............................................................................................. 4 1.3.3.1.1 USACE Engineer Regulations .................................................................................. 4 1.3.3.1.2 USACE Engineer Manuals ........................................................................................ 4 1.3.3.1.3 USACE Engineer Technical Letters .......................................................................... 4 1.3.3.1.4 USACE CESPK Internal Guidelines.......................................................................... 5 1.3.3.1.5 Other References ...................................................................................................... 5
1.3.3.2 The Reclamation Board ....................................................................................................... 5 1.3.3.3 Requirements for FEMA Certification .................................................................................. 5 1.3.3.4 Site-Specific Criteria ............................................................................................................ 6
1.3.4 Project Description ...................................................................................................................... 7 1.3.4.1 Phase 1 ................................................................................................................................ 7
1.3.4.1.1 Phase 1 Design Changes.......................................................................................... 8 1.3.4.1.2 Phase 1 Contractors and Subcontractors ................................................................. 8
1.3.4.2 Phase 2 ................................................................................................................................ 8 1.3.4.2.1 Phase 2 Design Changes.......................................................................................... 9 1.3.4.2.2 Phase 2 Contractors and Subcontractors ............................................................... 11
1.3.4.3 Phase 3 .............................................................................................................................. 11 1.3.4.4 Phase 4 .............................................................................................................................. 11
1.3.4.4.1 Phase 4 Design Changes........................................................................................ 12 1.3.4.4.2 Phase 4 Contractors and Subcontractors ............................................................... 12
1.3.5 Project Delivery Team ............................................................................................................... 12
2. Construction Management .................................................................................................14 2.1 Quality Assurance and Quality Control............................................................................................. 14 2.2 Permits.............................................................................................................................................. 14 2.3 Environmental Considerations.......................................................................................................... 15
2.3.1 Environmental Resource Considerations.................................................................................. 15 2.4 Utilities .............................................................................................................................................. 16 2.5 Real Estate Considerations .............................................................................................................. 18 2.6 Surveying: Construction Control....................................................................................................... 18 2.7 As-Built Drawings ............................................................................................................................. 18 2.8 Lessons Learned .............................................................................................................................. 18
3. Levee Strengthening...........................................................................................................20 3.1 Import Material.................................................................................................................................. 20
3.1.1 Select Fill ................................................................................................................................... 20 3.1.1.1 Description ......................................................................................................................... 20 3.1.1.2 Acceptance Criteria............................................................................................................ 20 3.1.1.3 Summary of Test Results................................................................................................... 21
3.1.1.3.1 Phase 2 ................................................................................................................... 21 3.1.1.3.2 Phase 4 ................................................................................................................... 24
3.1.1.4 Analysis.............................................................................................................................. 24 3.1.1.5 Conclusions........................................................................................................................ 24
3.1.2 Impervious Fill ........................................................................................................................... 25 3.1.2.1 Description ......................................................................................................................... 25 3.1.2.2 Acceptance Criteria............................................................................................................ 25 3.1.2.3 Summary of Test Results................................................................................................... 25
3.1.2.3.1 Phase 1 ................................................................................................................... 25 3.1.2.3.2 Phase 2 ................................................................................................................... 27 3.1.2.3.3 Phase 4 ................................................................................................................... 30
3.1.2.4 Analysis.............................................................................................................................. 33
� ����������
����
3.1.2.5 Conclusions........................................................................................................................ 34 3.1.3 Random Fill ............................................................................................................................... 34
3.1.3.1 Description ......................................................................................................................... 34 3.1.3.2 Acceptance Criteria............................................................................................................ 34
3.1.4 Sand Fill..................................................................................................................................... 34 3.1.4.1 Description ......................................................................................................................... 34 3.1.4.2 Acceptance Criteria............................................................................................................ 35 3.1.4.3 Summary of Test Results................................................................................................... 35
3.1.4.3.1 Phase 2 ................................................................................................................... 35 3.1.4.3.2 Phase 4 ................................................................................................................... 36
3.1.4.4 Analysis.............................................................................................................................. 36 3.2 Features of Work .............................................................................................................................. 36
3.2.1 Cutoff Walls ............................................................................................................................... 36 3.2.1.1 Description ......................................................................................................................... 36 3.2.1.2 Locations............................................................................................................................ 38
3.2.1.2.1 Phase 1 ................................................................................................................... 38 3.2.1.2.2 Phase 2 ................................................................................................................... 38 3.2.1.2.3 Phase 4 ................................................................................................................... 38
3.2.1.3 Acceptance Criteria............................................................................................................ 39 3.2.1.4 Test Data Summary – Phase 1.......................................................................................... 39
3.2.1.4.1 Compressive Strength............................................................................................. 39 3.2.1.4.2 Permeability............................................................................................................. 40
3.2.1.5 Test Data Summary – Phase 2.......................................................................................... 41 3.2.1.5.1 Compressive Strength............................................................................................. 41 3.2.1.5.2 Permeability............................................................................................................. 42
3.2.1.6 Test Data Summary – Phase 4.......................................................................................... 43 3.2.1.6.1 Compressive Strength............................................................................................. 43 3.2.1.6.2 Permeability............................................................................................................. 44
3.2.1.7 Analysis – Phase 4 ............................................................................................................ 45 3.2.1.7.1 Compressive Strength............................................................................................. 45 3.2.1.7.2 Permeability............................................................................................................. 46
3.2.1.8 Conclusions........................................................................................................................ 46 3.2.2 Berms ........................................................................................................................................ 47
3.2.2.1 Description ......................................................................................................................... 47 3.2.2.2 Locations............................................................................................................................ 47
3.2.2.2.1 Phase 2 ................................................................................................................... 48 3.2.2.2.2 Phase 4 ................................................................................................................... 49
3.2.2.3 Test Data............................................................................................................................ 49 3.2.3 Levee Reconstruction................................................................................................................ 49
3.2.3.1 Levee Raise ....................................................................................................................... 49 3.2.3.1.1 Locations ................................................................................................................. 49 3.2.3.1.2 Analysis ................................................................................................................... 50
3.2.3.2 Levee Degrade and Restoration ........................................................................................ 51 3.2.3.3 Waterside Impervious Zone ............................................................................................... 51
3.2.3.3.1 Locations ................................................................................................................. 51 3.2.3.3.2 Acceptance Criteria ................................................................................................. 51
3.2.3.4 Field Density ...................................................................................................................... 51 3.2.3.4.1 Description .............................................................................................................. 51 3.2.3.4.2 Acceptance Criteria ................................................................................................. 52 3.2.3.4.3 Summary of Test Reports ....................................................................................... 52
3.2.3.5 Optimum Moisture Content ................................................................................................ 59 3.2.3.5.1 Description .............................................................................................................. 59 3.2.3.5.2 Acceptance Criteria ................................................................................................. 59 3.2.3.5.3 Summary of Test Reports ....................................................................................... 60 3.2.3.5.4 Analysis ................................................................................................................... 63 3.2.3.5.5 Conclusion............................................................................................................... 63
3.2.4 Miscellaneous Project Features ................................................................................................ 63 3.2.4.1 Pump Stations.................................................................................................................... 63 3.2.4.2 Aggregate Base ................................................................................................................. 64 3.2.4.3 Asphalt Concrete Pavement .............................................................................................. 64 3.2.4.4 Monitoring Wells................................................................................................................. 64
3.2.4.4.1 Phase 2 ................................................................................................................... 64

� ����������
����
3.2.4.4.2 Phase 4 ................................................................................................................... 65 3.2.4.5 South Olivehurst Detention Basin ...................................................................................... 65 3.2.4.6 Stone Protection................................................................................................................. 65
3.2.4.6.1 Description .............................................................................................................. 65 3.2.4.6.2 Locations ................................................................................................................. 66 3.2.4.6.3 Acceptance Criteria ................................................................................................. 66 3.2.4.6.4 Conclusions............................................................................................................. 66
3.2.4.7 CalTrans Maintenance Yard .............................................................................................. 67
4. Conclusion ..........................................................................................................................68

� ����������
����
LIST OF FIGURES
Figure 1-1 State and Regional Location Maps.............................................................................................. 2 Figure 3-1 Bear River Raise........................................................................................................................ 20 Figure 3-2 Histogram for Phase 2 Select Fill - Percent Fines..................................................................... 22 Figure 3-3 Histogram for Phase 2 Select Fill – Liquid Limit........................................................................ 23 Figure 3-4 Histogram for Phase 2 Select Fill - Plasticity Index................................................................... 24 Figure 3-5 Histogram for Phase 2 Impervious Fill - Liquid Limit ................................................................. 28 Figure 3-6 Histogram for Phase 2 Impervious Fill - Plasticity Index ........................................................... 29 Figure 3-7 Histogram for Percent Fines for Phase 2 Impervious Fill .......................................................... 30 Figure 3-8 Percent Fines Histogram for Phase 4 Impervious Fill ............................................................... 31 Figure 3-9 Histogram for Phase 4 Impervious Fill - Liquid Limit ................................................................. 32 Figure 3-10 Histogram for Phase 4 Impervious Fill - Plasticity Index ......................................................... 33 Figure 3-11 Phase 2 Seepage Berm Construction ..................................................................................... 35 Figure 3-12 Histogram for Phase 2 Sand Fill - Percent Fines .................................................................... 36 Figure 3-13 WPIC Slurry Wall Construction................................................................................................ 37 Figure 3-14 Histogram for Phase 1 Slurry Wall - Compressive Strength ................................................... 40 Figure 3-15 Histogram of Phase 1 Slurry Wall - Permeability .................................................................... 41 Figure 3-16 Histogram for Phase 2 Slurry Wall - Compressive Strength ................................................... 42 Figure 3-17 Histogram for Phase 2 Slurry Wall - Permeability ................................................................... 43 Figure 3-18 Histogram for Phase 4 Slurry Wall - Compressive Strength ................................................... 44 Figure 3-19 Histogram for Phase 4 Slurry Wall - Permeability ................................................................... 45 Figure 3-20 Bear River Inspection Trench Excavation .............................................................................. 52 Figure 3-21 Histogram for Phase 1 Relative Compaction - Levee Crown.................................................. 53 Figure 3-22 Histogram for Phase 1 Relative Compaction - Embankment Fill ............................................ 54 Figure 3-23 Histogram for Phase 2 Relative Compaction - Levee Crown.................................................. 55 Figure 3-24 Histogram for Phase 2 Relative Compaction - Toe Ditch........................................................ 56 Figure 3-25 Histogram for Phase 2 Relative Compaction - Embankment Fill ............................................ 57 Figure 3-26 Histogram for Phase 2 Relative Density - Seepage Berm ...................................................... 58 Figure 3-27 Histogram for Phase 4 Relative Compaction .......................................................................... 59 Figure 3-28 Histogram for Phase 1 Moisture Variation............................................................................... 61 Figure 3-29 Histogram for Phase 2 Moisture Variation............................................................................... 62 Figure 3-30 Histogram for Phase 4 Moisture Variation............................................................................... 63
LIST OF TABLES
Table 1-1 Phase 1 Contractor Information.................................................................................................... 8 Table 1-2 Phase 2 Levee Repair Summary.................................................................................................. 8 Table 1-3 Phase 2 Contractor Information.................................................................................................. 11 Table 1-4 Phase 4 Contractor Information.................................................................................................. 12 Table 1-5 Levee Repairs Project Team ...................................................................................................... 13 Table 2-1 Reclamation Board and Caltrans Encroachment Permits .......................................................... 15 Table 2-2 Environmental Permits................................................................................................................ 15 Table 2-3 Utilities Without Documentation.................................................................................................. 16 Table 2-4 Abandoned Utilities ..................................................................................................................... 17 Table 2-5 New Utilities ................................................................................................................................ 18 Table 3-1 Percent Fines Data Summary for Phase 2 Select Fill ................................................................ 21 Table 3-2 Liquid Limit Data Summary for Phase 2 Select Fill .................................................................... 22 Table 3-3 Plasticity Index Data Summary for Phase 2 Select Fill............................................................... 23 Table 3-4 Liquid Limit Data Summary for Phase 1 Impervious Fill............................................................. 26 Table 3-5 Plasticity Index Data Summary for Phase 1 Impervious Fill ....................................................... 26 Table 3-6 Percent Fines Data Summary for Phase 1 Impervious Fill......................................................... 27 Table 3-7 Liquid Limit Data Summary for Phase 2 Impervious Fill............................................................. 27 Table 3-8 Plasticity Index Data Summary for Phase 2 Impervious Fill ....................................................... 28 Table 3-9 Percent Fines Data Summary for Phase 2 Impervious Fill......................................................... 29 Table 3-10 Percent Fines Data Summary for Phase 4 Impervious Fill....................................................... 30 Table 3-11 Liquid Limit Data Summary for Phase 4 Impervious Fill........................................................... 31 Table 3-12 Plasticity Index Data Summary for Phase 4 Impervious Fill ..................................................... 32 Table 3-13 Percent Fines Data Summary for Phase 2 Sand Fill ................................................................ 35 Table 3-14 Compressive Strength Data Summary for Phase 1 Slurry Wall ............................................... 39

� ����������
���
Table 3-15 Permeability Data Summary for Phase 1 Slurry Wall ............................................................... 40 Table 3-16 Compressive Strength Data Summary for Phase 2 Slurry Walls ............................................. 41 Table 3-17 Permeability Data Summary for Phase 2 Slurry Walls ............................................................. 42 Table 3-18 Compressive Strength Data Summary for Phase 4 Slurry Wall ............................................... 43 Table 3-19 Permeability Data Summary for Phase 4 Slurry Wall ............................................................... 44 Table 3-20 Phase 4 Summary of Failing QC Tests .................................................................................... 46 Table 3-21 Phase 4 Summary of Failing QA Tests .................................................................................... 46 Table 3-22 Phase 4 Summary of Failing Permeability Tests...................................................................... 46 Table 3-23 Locations of Seepage and Stability Berms............................................................................... 48 Table 3-24 Summary of Bear River Levee Raises ..................................................................................... 50 Table 3-25 Summary of WPIC Levee Raises ............................................................................................. 50 Table 3-26 Summary of Yuba River Levee Raises..................................................................................... 50 Table 3-27 Relative Compaction Data Summary for Phase 1 Levee Crown.............................................. 53 Table 3-28 Relative Compaction Data Summary for Phase 1 Embankment Fill ........................................ 54 Table 3-29 Relative Compaction Data Summary for Phase 2 Levee Crown.............................................. 55 Table 3-30 Relative Compaction Data Summary for Phase 2 Toe Ditch ................................................... 56 Table 3-31 Relative Compaction Data Summary for Phase 2 Embankment Fill ........................................ 57 Table 3-32 Relative Density Data Summary for Phase 2 Seepage Berm .................................................. 58 Table 3-33 Relative Compaction Data Summary for Phase 4 Embankment Fill ........................................ 59 Table 3-34 Data Summary for Phase 1 Moisture Variation Data................................................................ 60 Table 3-35 Data Summary for Phase 2 Moisture Variation ........................................................................ 61 Table 3-36 Data Summary for Phase 4 Moisture Variation ........................................................................ 62 Table 3-37 Phase 2 Stone Protection ......................................................................................................... 66
PLATES
PLATE 1 – RECLAMATION DISTRICT 784 BASIN MAP (1 SHEET) PLATE 2 – CONSTRUCTION PLAN AND PROFILE DRAWINGS PLATE 2-1 – PHASE 1 (3 SHEETS) PLATE 2-2 – PHASE 2 (38 SHEETS) PLATE 2-3 – PHASE 4 (7 SHEETS) PLATE 3 – CONSTRUCTION SURVEY CONTROL DRAWINGS PLATE 3-1 – PHASE 1 (1 SHEET) PLATE 3-2 – PHASE 2 (3 SHEETS) PLATE 3-3 – PHASE 4 (1 SHEET) PLATE 4 – SLURRY CUTOFF WALL AS-CONSTRUCTED PROFILES PLATE 4-1 – PHASE 1 PROFILE (1 SHEET) PLATE 4-2 – PHASE 2 PROFILE (2 SHEETS) PLATE 4-3 – PHASE 4 PROFILE (16 SHEETS) APPENDICES
APPENDIX A. REFERENCE LIST APPENDIX B. CONTACT INFORMATION APPENDIX C. QA / QC TEST DATA SUMMARY SHEETS APPENDIX D. UTILITY TABLE APPENDIX E. AS-BUILT DRAWINGS – SEE VOLUME II APPENDIX F. AFTER ACTION REPORT APPENDIX G. TECHNICAL MEMORANDA

Three R iv er s L ev ee Impro v emen t Au thor i t y F ina l Con s truc t ion Do cume nta t ion R epor t
� ����������
���
���������� � ����
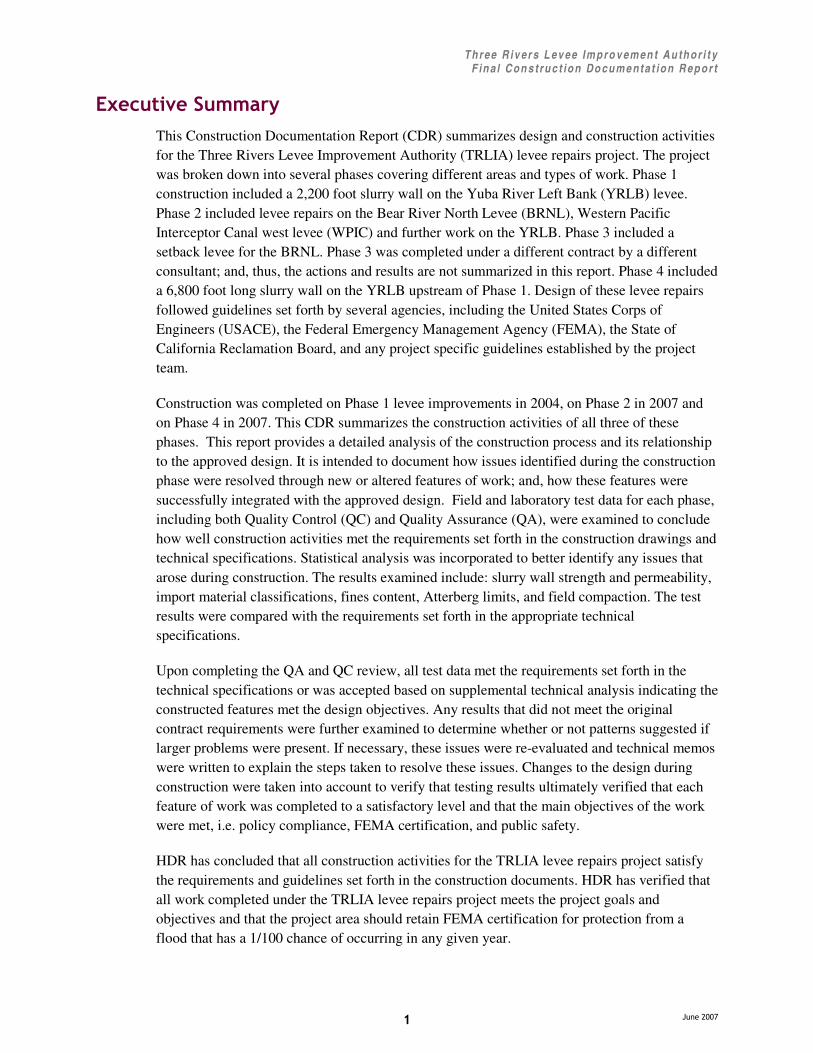
This Construction Documentation Report (CDR) summarizes design and construction activities for the Three Rivers Levee Improvement Authority (TRLIA) levee repairs project. The project was broken down into several phases covering different areas and types of work. Phase 1 construction included a 2,200 foot slurry wall on the Yuba River Left Bank (YRLB) levee. Phase 2 included levee repairs on the Bear River North Levee (BRNL), Western Pacific Interceptor Canal west levee (WPIC) and further work on the YRLB. Phase 3 included a setback levee for the BRNL. Phase 3 was completed under a different contract by a different consultant; and, thus, the actions and results are not summarized in this report. Phase 4 included a 6,800 foot long slurry wall on the YRLB upstream of Phase 1. Design of these levee repairs followed guidelines set forth by several agencies, including the United States Corps of Engineers (USACE), the Federal Emergency Management Agency (FEMA), the State of California Reclamation Board, and any project specific guidelines established by the project team.
Construction was completed on Phase 1 levee improvements in 2004, on Phase 2 in 2007 and on Phase 4 in 2007. This CDR summarizes the construction activities of all three of these phases. This report provides a detailed analysis of the construction process and its relationship to the approved design. It is intended to document how issues identified during the construction phase were resolved through new or altered features of work; and, how these features were successfully integrated with the approved design. Field and laboratory test data for each phase, including both Quality Control (QC) and Quality Assurance (QA), were examined to conclude how well construction activities met the requirements set forth in the construction drawings and technical specifications. Statistical analysis was incorporated to better identify any issues that arose during construction. The results examined include: slurry wall strength and permeability, import material classifications, fines content, Atterberg limits, and field compaction. The test results were compared with the requirements set forth in the appropriate technical specifications.
Upon completing the QA and QC review, all test data met the requirements set forth in the technical specifications or was accepted based on supplemental technical analysis indicating the constructed features met the design objectives. Any results that did not meet the original contract requirements were further examined to determine whether or not patterns suggested if larger problems were present. If necessary, these issues were re-evaluated and technical memos were written to explain the steps taken to resolve these issues. Changes to the design during construction were taken into account to verify that testing results ultimately verified that each feature of work was completed to a satisfactory level and that the main objectives of the work were met, i.e. policy compliance, FEMA certification, and public safety.
HDR has concluded that all construction activities for the TRLIA levee repairs project satisfy the requirements and guidelines set forth in the construction documents. HDR has verified that all work completed under the TRLIA levee repairs project meets the project goals and objectives and that the project area should retain FEMA certification for protection from a flood that has a 1/100 chance of occurring in any given year.


Three R iv er s L ev ee Impro v emen t Au thor i t y F ina l Con s truc t ion Do cume nta t ion R epor t
� ����������
���
��� ����������
���� ������� ������� �This Construction Documentation Report (CDR) serves to summarize construction activities completed during Phases I, II, and IV of the levee improvement program initiated by the Three Rivers Levee Improvement Authority (TRLIA) in 2003. This report provides a detailed analysis of the construction process and its relationship to the approved design. It is intended to document how issues identified during the construction phase were resolved through new or altered features of work; and, how these features were successfully integrated with the approved design.
Section 1 of the CDR provides an overview of the levee improvement program including the flood protection goals and objectives, a description of the basin, and the design criteria established for the project. Section 2 summarizes the construction management activities of the completed levee repairs including an analysis of the Quality Control (QC) and Quality Assurance (QA) methods, a description of utilities, both those that were researched prior to construction and those encountered during construction, and a summary of permits acquired for the construction process. Section 3 describes each feature of work, the acceptance criteria for each feature, the laboratory and field test reports, deviations from the proposed design, and explanations of how those deviations were handled.
���� � ���������������The Three Rivers Levee Improvement Authority (TRLIA) has undertaken a comprehensive levee improvement program of the levees surrounding Reclamation District 784 (RD 784), located in Yuba County, California. Figure 1-1 shows a state map denoting the project location.
���������������� ������� ���������� �� ����
RD 784 is comprised of approximately 30-miles of levees originally authorized as part of the Sacramento River Flood Control Project. It is bounded to the north by the Yuba River Left Bank levee (YRLB), to the south by the Bear River North Levee (BRNL), to the West by the

Three R iv er s L ev ee Impro v emen t Au thor i t y F ina l Con s truc t ion Do cume nta t ion R epor t
� ����������
���
Feather River Left Bank levee (FRLB) and to the east by the Western Pacific Interceptor Canal western levee (WPIC). These levees are broken down into 4 Units for RD 784. Unit 1 includes the YRLB, Unit 2 includes the FRLB, Unit 3 includes the BRNL and Unit 4 includes the WPIC. A basin location map that shows all levee work completed or planned for completion under the TRLIA levee repairs project is included as Plate 1. Please note that Plate 1 has been included as a general reference. The drawings contained in Plate 2 should be referenced for information regarding specific project features and their associated locations.
The levees surrounding RD 784 have historically performed poorly during flood events. Some levees were constructed by farmers and other landowners, resulting in levees that did not meet design criteria and subsequently failed during times of high water. From 1920 to 1964 the USACE took control of the levee system and constructed upgrades, either through reconstruction of existing levees or construction of new setback levees. Once the levees were built to a satisfactory standard, the USACE returned control to the State, who in turn assigned the maintenance duties to RD 784. The construction of two reservoirs, Oroville and New Bullards Bar, helped alleviate the threat of high water to the RD 784 levee system. Even with these improvements, the levees still failed along the Yuba River in 1986 and the Feather River in 1997. Both breaches resulted in Federal emergency assistance, expanded authorizations, and appropriations for the USACE to assist the State of California and RD 784 with additional levee strengthening.
���� �������� ������� �1.3.1 Goals and Objectives
The primary project objective is to retain Federal Emergency Management Agency (FEMA) certification for protection from a flood that has a 1/100 chance of occurring in any given year. The secondary project objective of this program is to identify and construct the levee improvements necessary to protect RD 784 from a flood that has a 1/200 chance of occurring in any given year.
1.3.2 Background RD 784 lies in a region of Northern California that is experiencing large amounts of commercial and residential growth. New homes and developments are being built in areas protected by levees in desperate need of repairs and upgrades. Due to the anticipated increase in population and the associated threats to public safety, Yuba County and RD 784 combined to form TRLIA in order to more effectively and efficiently complete the required levee improvements.
The process of identifying, analyzing, evaluating, and recommending solutions for flood protection improvements was completed through the involvement of multiple architect-engineer firms and the publication of numerous reports. In general, the planning phase was documented through the preparation of a Problem Identification Report and an Alternatives Analysis Report. The design phase was documented through a Basis of Design Report and the development of construction plans and specifications. A complete listing of these documents, as well as other reference material, has been included in Appendix A.

Three R iv er s L ev ee Impro v emen t Au thor i t y F ina l Con s truc t ion Do cume nta t ion R epor t
� ����������
� �
1.3.3 Design Criteria All levee repairs have been designed and constructed according to then current design criteria for levee construction established by USACE, the Reclamation Board, and FEMA. The regulations and requirements of each agency are listed in the following sections. In addition, project specific design criteria were established to clearly describe how specific analyses (e.g., hydraulic exit gradients and wind-generated waves) were evaluated.
1.3.3.1 USACE Levee Design Criteria Designs for the each phase of the levee repairs conformed to the design criteria established by USACE for levee construction. USACE design criteria contained in the following references were followed:
1.3.3.1.1 USACE Engineer Regulations Regulation No. Publication Date Title
ER 1110-1-12 01 Jun 93 Quality Management
ER 1110-2-1150 31 Aug 99 Engineering and Design for Civil Works Projects
1.3.3.1.2 USACE Engineer Manuals
Manual No. Publication Date Title
EM 1110-2-1110 30 Apr 02 Coastal Engineering Manual, Part 2
EM 1110-2-1204 10 Jul 89 Environmental Engineering for Coastal Shore Protection
EM 1110-2-1205 31 Mar 98 Environmental Engineering for Engineering and Flood Control Channels
EM 1110-2-1416 15 Oct 93 River Hydraulics
EM 1110-2-1419 31 Jan 95 Hydrologic Engineering Requirements for Flood Damage Reduction Studies
EM 1110-2-1601 30 Jun 94 Hydraulic Design of Flood Control Channels, Change 1
EM 1110-2-1614 30 Jun 95 Design of Coastal Revetments, Seawalls, and Bulkheads
EM 1110-1-1804 1 Jan 01 Geotechnical Investigations
EM 1110-2-1902 31 Oct 03 Slope Stability
EM 1110-2-1913 30 Apr 00 Design & Construction of Levees
EM1110-2-1914 29 May 92 Design, Construction and Maintenance of Relief Wells
EM 1110-2-2705 31 Mar 94 Structural Design of Closure Structures for Local Flood Protection Projects
EM 1110-2-2902 31 Oct 97 Conduits, Culverts, and Pipes
EM 1110-2-3102 28 Feb 95 General Principles of Pumping Station Design and Layout
EM 1110-2-3104 30 Jun 89 Structural and Architectural Design of Pumping Stations
1.3.3.1.3 USACE Engineer Technical Letters
TL No. Publication Date Title
ETL 1110-1-185 1 Feb 99 Guidelines on Ground Improvement for Structures and Facilities
ETL 1110-2-221 29 Nov 76 Wave Run-up and Wind Setup on Reservoir Embankments
ETL 1110-2-286 25 Jul 84 Use of Geotextiles Under Riprap
ETL 1110-2-299 22 Aug 86 Overtopping of Flood Control Levees and Floodwalls
ETL 1110-2-305 16 Feb 84 Determining Sheltered Water Wave Characteristics
ETL 1110-2-367 31 Mar 95 Interior Flood Hydrology
ETL 1110-2-569 01 May 05 Design Guidance for Levee Underseepage

Three R iv er s L ev ee Impro v emen t Au thor i t y F ina l Con s truc t ion Do cume nta t ion R epor t
� ����������
�!�
1.3.3.1.4 USACE CESPK Internal Guidelines Publication Date Title
7 July 2004 Geotechnical Levee Practice, SOP EDG-03
2003 USACE CESPK Levee Task Force, Recommendations for Seepage Design Criteria, Evaluation and Design Practices
1.3.3.1.5 Other References
Publication Date Title
1967 Terzaghi, K. and Peck, R. B. “Soil Mechanics in Engineering Practice,” Wiley, New York
1986 NAVFAC. “Soil Mechanics,” Design Manual 7.01, September, Department of the Navy, Naval Facilities Engineering Command, Alexandria, Virginia
1979 Freeze, R.A. and Cherry, J.A., “Groundwater,” Prentice-Hall, New Jersey
1.3.3.2 The Reclamation Board
The following information is taken from the Report on Feasibility Yuba-Feather Supplemental Flood Control Project, Appendix E: Preliminary Design, Volume 1 of 3, Section 4.
The California Reclamation Board has primary jurisdiction for approval of levee design and construction. The Reclamation Board standards are found in Title 23, Division 1, Article 8 (Sections 111 through 137) of the California Code of Regulations (CCR), and constitute the primary state standard.
All of the levee work described in this report fell under the authority of the Reclamation Board and was constructed according to the criteria contained in the encroachment permits listed in Table 2-1.
1.3.3.3 Requirements for FEMA Certification For levees to be recognized by FEMA, evidence must be provided that adequate design and operation and maintenance systems are in place to provide reasonable assurance that protection from the base flood (1-percent or 100-year flood) exists. These requirements are outlined in the Code of Federal Regulations (CFR), Title 44, Volume 1, Chapter I, Section 65.10 and are summarized below.
���� Freeboard – Riverine levees must provide a minimum freeboard of three (3) feet above the water-surface level of the base flood. An additional 1 foot above the minimum is required within 100 feet either side of structures (such as bridges) riverward of the levee or wherever the flow is constricted. An additional one-half foot above the minimum at the upstream end of the levee, tapering to not less than the minimum at the downstream end of the levee, is also required.
���� Closures – All openings must be provided with closure devices that are structural parts of the system during operation and designed according to sound engineering practice.
���� Embankment Protection – Engineering analyses must be submitted that demonstrate that no appreciable erosion of the levee embankment can be expected during the base flood, as a result of either currents or waves, and that anticipated erosion will not result in failure of the levee embankment or foundation directly or indirectly through reduction of the seepage path and subsequent instability.

Three R iv er s L ev ee Impro v emen t Au thor i t y F ina l Con s truc t ion Do cume nta t ion R epor t
� ����������
�"�
���� Embankment and Foundation Stability – Engineering analyses that evaluate levee embankment stability must be submitted. The analyses provided shall evaluate expected seepage during loading conditions associated with the base flood and shall demonstrate that seepage into or thorough the levee foundation and embankment will not jeopardize embankment or foundation stability.
���� Settlement – Engineering analyses must be submitted that assess the potential and magnitude of future losses of freeboard as a result of levee settlement and demonstrate that freeboard will be maintained within the minimum standards.
���� Interior Drainage – An analysis must be submitted that identifies the source(s) of such flooding, the extent of the flooded area, and, if the average depth is greater than 1 foot, the water-surface elevation(s) of the base flood.
���� Operation Plans – For a levee system to be recognized, a formal plan of operation must be provided to FEMA. All closure devices or mechanical systems for internal drainage, whether manual or automatic, must be operated in accordance with an officially adopted operational manual, a copy of which must be provided to FEMA.
���� Maintenance Plans – For levee systems to be recognized as providing protection from the base flood, they must be maintained in accordance with an officially adopted maintenance plan. All maintenance activities must be under the jurisdiction of a Federal or State agency, an agency created by Federal or State law, or an agency of a community participating in the NFIP that must assume ultimate responsibility for maintenance. The plan must document the formal procedure that ensures that the stability, height, and overall integrity of the levee and its associated structures and systems are maintained. At a minimum, maintenance plans shall specify the maintenance activities to be performed, the frequency of their performance, and the person by name or title responsible for their performance.
���� The information submitted to support that the levee complies with the above requirements must be certified by a registered professional engineer. Certified as-built plans of the levee must also be submitted.
1.3.3.4 Site-Specific Criteria Based on the requirements described in Section 1.3.3, design criteria were established for the RD 784 levee improvements project. The following list of design criteria were reviewed and approved by the design team and their independent technical reviewers:
���� For groundwater seepage analyses, hydraulic conductivities were estimated using material descriptions and laboratory gradation test results, along with typical values and correlations presented by Terzaghi and Peck (1967), Freeze and Cherry (1979), and NAVFAC (1986), and by using the Hazen Equation (1911):
k = CD102
where: k = hydraulic conductivity (cm/s)
C = Constant (varies between 0.4 to 1.2)
D10 = effective grain size (where10-percent passes)
Three R iv er s L ev ee Impro v emen t Au thor i t y F ina l Con s truc t ion Do cume nta t ion R epor t
� ����������
�#�
���� When designing levee modifications to control underseepage, USACE criteria were used to determine maximum hydraulic exit gradients. For an existing flood-tested levee, a maximum hydraulic gradient of 0.5 was used.
���� For through and underseepage analyses, the design water surface profiles (200-year conditions) developed for RD 784 by MBK Engineers (2004) were used. Steady state seepage conditions were used in the analyses.
���� In establishing the design levee crown elevation, a freeboard of 3 feet above the design water surface (200-year conditions) or the existing levee crown elevation profile (whichever was higher) was used. An additional one foot of freeboard at channel crossings was not considered, as the FEMA requirement of additional freeboard is required above the 100-year water surface elevation only.
���� Wind and wave run-up and setup evaluations were completed considering the 100-year water surface elevation. Wave run-up/setup was contained within freeboard above the 100-year water surface.
1.3.4 Project Description The TRLIA levee improvement program for the levees surrounding the RD 784 basin was broken down into four phases. Phase 1 levee repairs included the left bank of the Yuba River between Highway 70 and the Southern Pacific Railroad (SPRR). Phase 2 levee repairs included improvements to the north levee of the Bear River, the western levees along the Western Pacific Interceptor Canal, and additional improvements along the left bank of the Yuba River. Phase 3 repairs also included the north levee of the Bear River and a portion of the left bank of the Feather River. Phase 4 (also referred to as Phase 2B) included repairs along the left bank of the Yuba River between the UPRR and Simpson Lane, in Linda, California.
For the purposes of this report, the levee improvements constructed during Phases 1, 2, and 4 have been grouped according to the feature of work, i.e.; slurry cutoff walls, stability berms, etc. This organization allows for an efficient discussion of standard acceptance criteria, summarization of test data, and technical analysis of any issues as it applies to all locations where a particular feature was installed.
1.3.4.1 Phase 1 Phase 1 levee repairs originally encompassed the WPIC, the BRNL and YRLB. Accordingly, the design team prepared an Alternatives Analysis (March 2004) and a draft Basis of Design Report for repairs to the YRLB, BRNL and WPIC levees. These reports included analysis of several alternatives for levee repairs and recommended methods of levee improvement that were reviewed by project stakeholders. Preferred levee repair alternatives were identified and recommended for construction. The design of Phase 1 repairs for the Bear River and WPIC levees was developed to the 90% level, at which time the project was discontinued in order to redirect focus to the Yuba River levee after significant seepage problems were identified. A fast-track project was implemented to construct a slurry cutoff wall along the YRLB during the summer of 2004. This fast-track project became Phase 1; and, the remainder of the analysis along the YRLB, BRNL, and WPIC became Phase 2.
Flood protection improvements recommended under Phase 1 of the TRLIA levee improvement project were constructed through Contract No. CON0005206. This contract consisted of a
Three R iv er s L ev ee Impro v emen t Au thor i t y F ina l Con s truc t ion Do cume nta t ion R epor t
� ����������
�$�
slurry cutoff wall installed along the left bank of the Yuba River from Station 4+00 to 26+00 to an average depth of 50 feet. The basis of design for this cutoff wall is included in the Basis of Design Report for Phase 2. Construction of the 2,200 foot long cutoff wall was completed by November 1, 2004. The location of the cutoff wall is shown on the three plan and profile drawings included as Plate 2-1.
1.3.4.1.1 Phase 1 Design Changes During construction, one change was made to the original design. After field investigations, it was discovered that the waterside slopes of the levee did not meet USACE criteria of 3:1 (H:V). The contractor was directed to construct the levee to the original grade. The waterside slopes varied from approximately 2.72:1 to 3:1 or flatter.
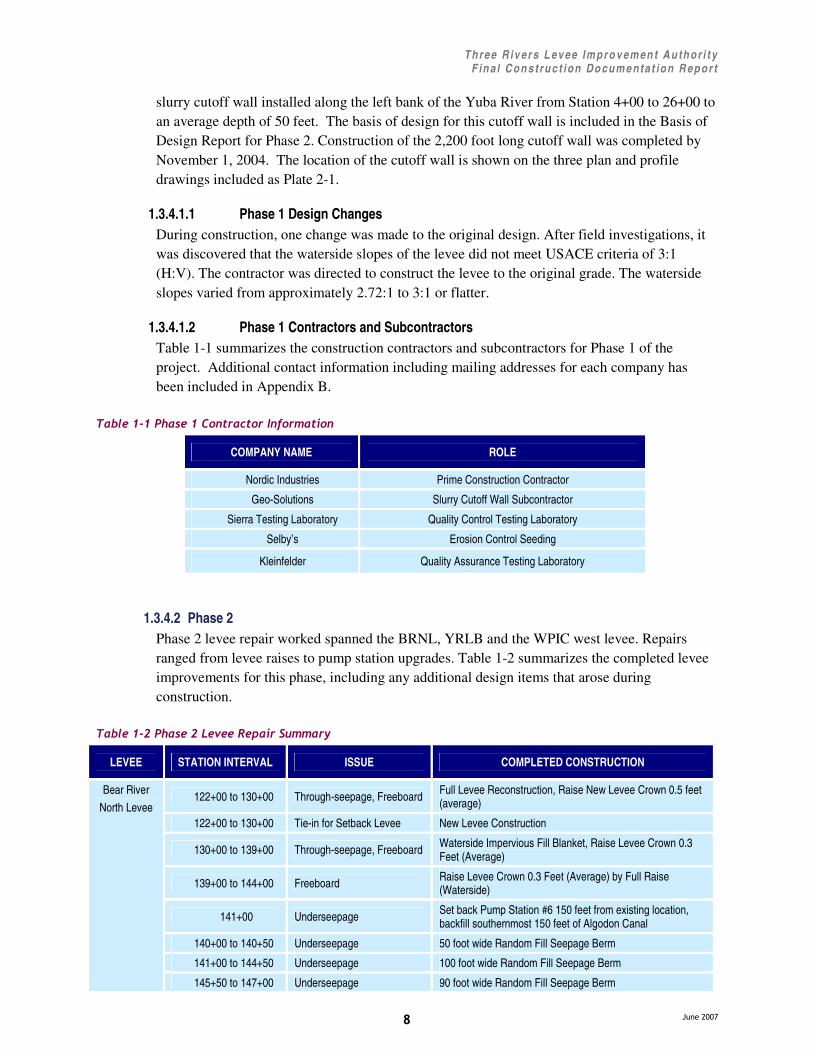
1.3.4.1.2 Phase 1 Contractors and Subcontractors Table 1-1 summarizes the construction contractors and subcontractors for Phase 1 of the project. Additional contact information including mailing addresses for each company has been included in Appendix B.
� ������������������ ��������� ���� ���� �
1.3.4.2 Phase 2 Phase 2 levee repair worked spanned the BRNL, YRLB and the WPIC west levee. Repairs ranged from levee raises to pump station upgrades. Table 1-2 summarizes the completed levee improvements for this phase, including any additional design items that arose during construction.
� ������������������ ������������ � ��!�
LEVEE STATION INTERVAL ISSUE COMPLETED CONSTRUCTION
122+00 to 130+00 Through-seepage, Freeboard Full Levee Reconstruction, Raise New Levee Crown 0.5 feet (average)
122+00 to 130+00 Tie-in for Setback Levee New Levee Construction
130+00 to 139+00 Through-seepage, Freeboard Waterside Impervious Fill Blanket, Raise Levee Crown 0.3 Feet (Average)
139+00 to 144+00 Freeboard Raise Levee Crown 0.3 Feet (Average) by Full Raise (Waterside)
141+00 Underseepage Set back Pump Station #6 150 feet from existing location, backfill southernmost 150 feet of Algodon Canal
140+00 to 140+50 Underseepage 50 foot wide Random Fill Seepage Berm
141+00 to 144+50 Underseepage 100 foot wide Random Fill Seepage Berm
Bear River North Levee
145+50 to 147+00 Underseepage 90 foot wide Random Fill Seepage Berm
COMPANY NAME ROLE
Nordic Industries Prime Construction Contractor
Geo-Solutions Slurry Cutoff Wall Subcontractor
Sierra Testing Laboratory Quality Control Testing Laboratory
Selby’s Erosion Control Seeding
Kleinfelder Quality Assurance Testing Laboratory

Three R iv er s L ev ee Impro v emen t Au thor i t y F ina l Con s truc t ion Do cume nta t ion R epor t
� ����������
�%�
LEVEE STATION INTERVAL ISSUE COMPLETED CONSTRUCTION
147+25 to 150+00 Underseepage 100 foot wide Random Fill Seepage Berm
147+70 to 150+00 Freeboard Raise Crown 1 foot (average) by Crown Raise
150+00 to 165+00 Freeboard Raise Crown 2 feet (average) by Crown Raise
165+00 to 168+50 Freeboard Raise Crown 2 feet (average) by Mid-Slope Levee Raise (Landside) and Full Levee Raise (Waterside)
165+00 to 168+50 Through seepage Waterside Keyway Excavation and Impervious Fill Placement
164+00 to 168+80 Slope Erosion, Levee Slope Scour Protection
Riverbank Slope Erosion Protection (Rock); Levee Waterside Toe Rock Berm
0+00 to 130+00 Underseepage Fill Ditch at Landside Toe
0+00 to 137+50 Freeboard Raise Crown by 0.8 feet (average) by Full Levee Raise (Waterside)
255+00 to 308+00 Slope Erosion Riverbank Slope Erosion Protection (Rock)
205+00 to 275+70 Freeboard Raise Crown-only by <0.5 feet (average); (~1200 feet requires full levee raise of 0.9 feet (waterside)
254+65 to 260+00 Underseepage Cutoff Wall 35 feet deep
276+56 to 287+50 Underseepage Cutoff Wall 44 feet deep
284+10 to 305+00 Freeboard Raise Crown 0.3 foot (average) by Full Levee Raise (Waterside)
305+00 to 311+58 Freeboard Raise Crown 1.3 feet (average) by Full Levee Raise (Landside)
WPIC West Levee
312+00 to 315+00 Freeboard Raise Crown 0.7 feet (average) by Full Levee Raise (Landside) and Ditch Fill
1+00 to 1+40 Underseepage and Through-seepage 90 foot Wide Seepage Berm and Stability Berm
9+00 to 26+00 Underseepage 90 foot Wide Seepage Berm Yuba River
South Levee
26+00 to 32+00 Underseepage and Through-seepage 300 foot Wide Seepage Berm and Stability Berm
N/A Interior Drainage Olivehurst Detention Basin Pump Station
N/A Interior Drainage Olivehurst Detention Basin Olivehurst Drainage Facility
0+00 to 2+77 Interior Drainage Clark Lateral Ring Levee
The locations of all levee improvements completed during Phase 2 are shown on the 38 plan and profile drawings included as Plate 2-2. Construction was initiated in May 2005 and continued through March 2007.
1.3.4.2.1 Phase 2 Design Changes During construction, several changes were made to the original design. Through conversations with the USACE and further analyses, the following additions were made;
Bear River
1) Additional hydraulic modeling was completed in late 2005. This analysis increased the water surface elevation from approximate Station 122+00 to Station 143+50. The analysis decreased the water surface from approximate Station 148+00 to Station

Three R iv er s L ev ee Impro v emen t Au thor i t y F ina l Con s truc t ion Do cume nta t ion R epor t
� ����������
��&�
168+50. The levee was modified to meet this new water surface elevation plus freeboard.
2) In 2005 from station 165+00 to 168+50 a 13’ deep waterside keyway trench was excavated due to the presence of an inordinate amount of fine sand. Select fill was used to fill in the trench.
3) In 2006 from station 130+00 to 139+00 the waterside keyway trench was excavated to depths of 3 feet to 10 feet due to the presence of a layer of sand. Select and impervious fill were used to backfill the trench.
4) In 2006 four small seepage berms were designed along the landside of the BRNL from west of Pump Station #6 to east of Highway 70. Design drawings for these berms are included in Plate 2-2.
Pump Station #6
1) The pumping capacity of Pump Station #6 was increased from 60 cfs to 200 cfs based on an agreement between TRLIA and a land developer. This led to the enlargement of both the pump station and outlet structures.
2) In 2006 during testing of the pumps, erosion was noted at the outlet structure. Stone revetment was placed along the slopes to help mitigate the erosion concerns.
WPIC
1) In 2006 the rip rap on the WPIC was expanded. Additional rock from the waterside toe to the hinge point of the levee was placed from station 255+00 to 308+00. In the original design drawings for the WPIC levee, rock slope protection (rip rap) was to be removed and replaced on the WPIC levee waterside slope at Plumas Lake between Stations 250+00 to 297+00 due to the construction of two slurry walls and the raising of the levee. This was based on (1) wind/wave analyses considering the wide fetch of Plumas Lake and (2) the location of existing rip rap. The existing rip rap, as shown on the USACE Comprehensive Study topography, reportedly extended from Station 250+00 to 297+00. During construction, it was found that the existing rip rap extended from Station 275+00 to 308+00, and that it covered the upper half of the waterside slope. Following additional analyses and discussions with USACE, it was determined that additional rip rap on the WPIC should be placed from the hinge point of the levee to the toe of the levee. Much larger rip rap than that which already existed was placed to provide wave erosion protection. The existing rip rap was placed in the water so that a bench could be established for the placement of the new levee slope and accompanying rip rap.
2) In 2006 it was noted that the original topography used for design did not include the expanded Highway 70. Upon further review it was found that the elevation of the new Highway 70 was lower than that of the design, so the WPIC embankment was shifted to the north to tie into the Highway 70 embankment. Design drawings are included in Plate 2-2.

Three R iv er s L ev ee Impro v emen t Au thor i t y F ina l Con s truc t ion Do cume nta t ion R epor t
� ����������
����
Olivehurst
1) There were no significant design changes to the Olivehurst ring levee and pump station. Additional fill was placed above the pipes as they sloped down into the outlet structure to ensure proper cover for the pipes.
Yuba River
1) During construction of the toe trench there was a larger quantity of cobbles than previously expected.
2) It was found during construction that some of the cross sections were not correct, resulting in modified construction directives.
3) The Caltrans Maintenance Yard Detention Pond was included as part of Phase 2 work.
1.3.4.2.2 Phase 2 Contractors and Subcontractors Table 1-3 summarizes the construction contractors and subcontractors for Phase 2 of the project. Additional contact information including mailing addresses for each company has been included in Appendix B.
� ������"����������� ��������� ���� ���� �
COMPANY NAME ROLE
Nordic Industries Prime Construction Contractor
Envirocon Slurry Cutoff Wall Subcontractor
Auburn Constructors Pump Station Subcontractor
Restoration Resource Detention Basin Planting
Sierra Testing Laboratory Quality Control Testing Laboratory
Vector Quality Control Testing Laboratory
Kleinfelder Quality Assurance Testing Laboratory
Selby’s Erosion Control Seeding
1.3.4.3 Phase 3 Phase 3 included the construction of a setback levee along the BRNL. The setback levee alignment included the installation of a slurry cutoff wall in the new levee foundation. Approximately 10,000 feet of setback levee was constructed to replace approximately 13,000 feet of levee along the right bank of the Bear River and roughly 4,000 feet of levee along the left bank of the Feather River. GEI, Inc. completed the design and construction management for this phase during the 2005 and 2006 construction seasons. Details of this Phase can be found in the report titled “Bear River Setback Levee Project, Construction Completion Report, February 2007”, by GEI Consultants, Inc.
1.3.4.4 Phase 4 Phase 4 repairs, also referred to as Phase 2B, included a slurry cutoff wall along the YRLB from the UPRR to Simpson Lane in combination with various levee raises along this project reach. A seepage berm was also constructed between approximately Stations 35+50 to 37+50
Three R iv er s L ev ee Impro v emen t Au thor i t y F ina l Con s truc t ion Do cume nta t ion R epor t
� ����������
����
under this phase of the project. The cutoff wall was installed to an average depth of 80 feet from Station 35+00 to 103+50. The Basis of Design Report was completed by HDR and construction commenced in August 2006. Slurry wall construction and levee restoration were completed by November 2006. The location of the cutoff wall is shown on the seven plan and profile drawings included as Plate 2-3.
1.3.4.4.1 Phase 4 Design Changes During construction, two changes were made to the original design. Through conversations with the USACE and further analyses, the following additions were made:
1) The original design levee surface was changed to comply with Reclamation Board standards of not exceeding the 1957 design profile or the existing grade. The design surface was changed to incorporate both the 1957 design profile and the existing grade.
2) During the bid process, the corner seepage berm between the UPRR embankment and the YRLB was included as an option because analysis had not yet been completed. Upon completion of the analysis, a semi-pervious berm was constructed.
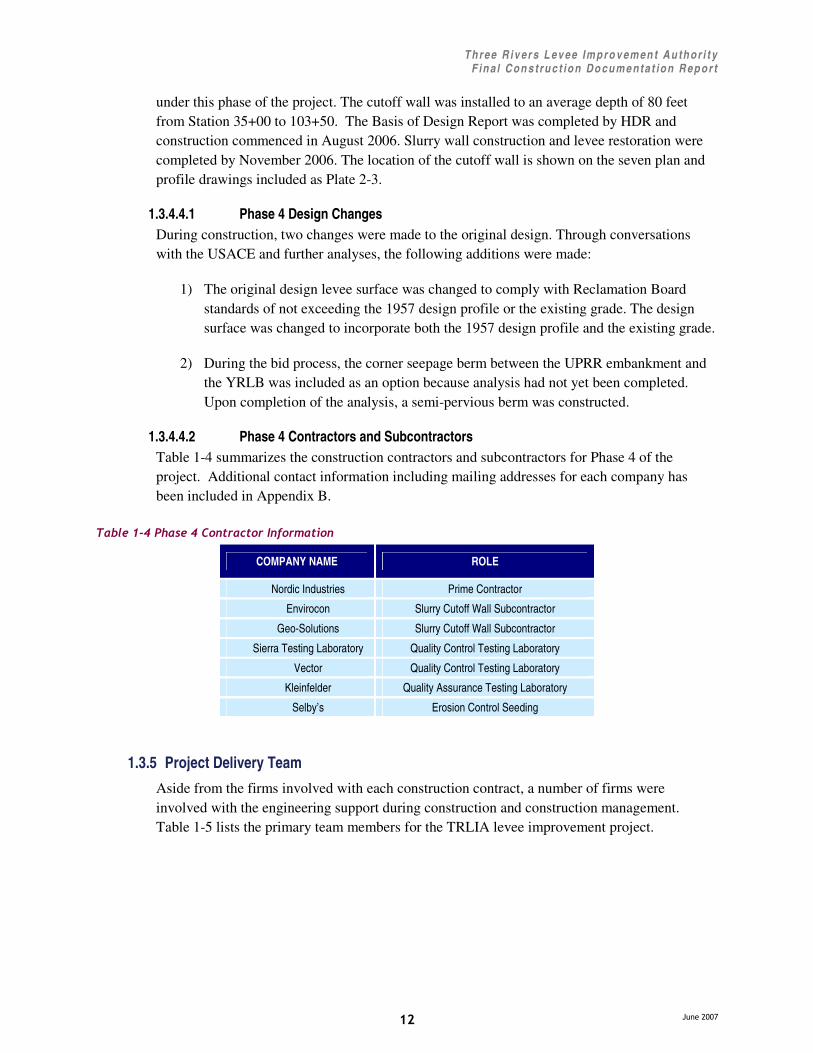
1.3.4.4.2 Phase 4 Contractors and Subcontractors Table 1-4 summarizes the construction contractors and subcontractors for Phase 4 of the project. Additional contact information including mailing addresses for each company has been included in Appendix B.
� ������#�������#��� ��������� ���� ���� �
COMPANY NAME ROLE
Nordic Industries Prime Contractor
Envirocon Slurry Cutoff Wall Subcontractor
Geo-Solutions Slurry Cutoff Wall Subcontractor
Sierra Testing Laboratory Quality Control Testing Laboratory
Vector Quality Control Testing Laboratory
Kleinfelder Quality Assurance Testing Laboratory
Selby’s Erosion Control Seeding
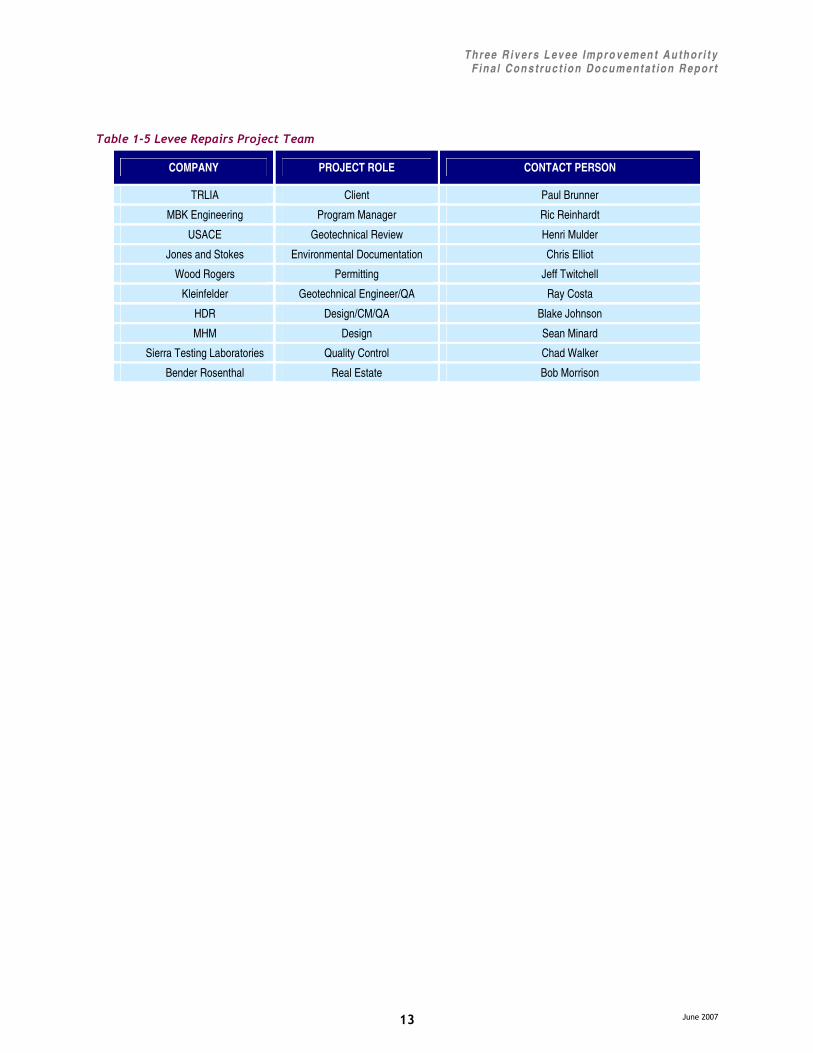
1.3.5 Project Delivery Team Aside from the firms involved with each construction contract, a number of firms were involved with the engineering support during construction and construction management. Table 1-5 lists the primary team members for the TRLIA levee improvement project.
Three R iv er s L ev ee Impro v emen t Au thor i t y F ina l Con s truc t ion Do cume nta t ion R epor t
� ����������
����
� ������$��� ��������������%����� ��� �
COMPANY PROJECT ROLE CONTACT PERSON
TRLIA Client Paul Brunner
MBK Engineering Program Manager Ric Reinhardt
USACE Geotechnical Review Henri Mulder
Jones and Stokes Environmental Documentation Chris Elliot
Wood Rogers Permitting Jeff Twitchell
Kleinfelder Geotechnical Engineer/QA Ray Costa
HDR Design/CM/QA Blake Johnson
MHM Design Sean Minard
Sierra Testing Laboratories Quality Control Chad Walker
Bender Rosenthal Real Estate Bob Morrison
Three R iv er s L ev ee Impro v emen t Au thor i t y F ina l Con s truc t ion Do cume nta t ion R epor t
� ����������
�� �
��� '���������( � )�� ���
���� * +���,��� ���� ���* +���'����+�A primary component of HDR’s corporate philosophy is to ensure the delivery of high quality products and projects through the application of a thorough and consistent Quality Control (QC) and Quality Assurance (QA) Program. For the performance of construction management services during the construction phase, HDR employs QA goals and objectives found in Appendix D of the reference manual titled “Construction Contract Administration and Construction Observation” (October 2003). An outline describing some basic techniques for mainstreaming the QA process is also included in this reference manual. Although each project is different and the specific plans outlined in the manual do not always reflect field conditions, the QA goals and objectives remain the same.
The primary goal of HDR’s QA Program is to ensure that construction activities accurately reflect the objectives for the overall project and that each construction activity follows the design drawings and technical specifications. On a daily basis, field personnel observe construction and testing activities to ensure that the construction plans and specifications are followed. The Resident Engineer (RE) on site acts as a liaison between the contractor and the client, answering technical questions and clarifying construction drawings and technical specifications as needed.
HDR’s RE and field personnel were also responsible to ensure that the construction contractor implements a QC Program in strict accordance with the construction specifications. Using Section 01451 of the contract as a guide, QA Representatives determine if the contractor’s QC Program consists of the plans, procedures, and an organization necessary to produce a product that meets the technical and quality requirements of the contract. Furthermore, the RE and field personnel utilize the submittal procedures described in Section 01330 of the contract specifications to ensure the contractor is properly selecting, reviewing, and approving materials and techniques compliant with the requirements of the contract.
The final critical aspect of ensuring that construction activities meet the technical and quality objectives for the project is through QC and QA testing. Both the construction contractor and HDR were responsible to employ laboratories that met the qualifications set forth in Section 01451 of the contract specifications. A list of the laboratories responsible for each phase of the levee improvement program is contained in Section 1.3.4, PROJECT DESCRIPTION.
���� ���� ���The implementation of a levee improvement program of this scope required the development, coordination, review, and approval of numerous permits with various government agencies. These permits fall within two primary categories, environmental resources and encroachments. A discussion of the coordination and permits necessary to comply with the pertinent environmental laws and regulation is contained in Section 2.3, ENVIRONMENTAL CONSIDERATIONS.
Numerous encroachment permits were required for levee improvements completed in RD 784. There were several encroachments onto Caltrans right-of-way for which permits were obtained.

Three R iv er s L ev ee Impro v emen t Au thor i t y F ina l Con s truc t ion Do cume nta t ion R epor t
� ����������
��!�
Reclamation Board permits were also obtained for all levee work completed under the TRLIA levee improvement program. Table 2-1 lists the encroachment permits acquired and the location of work.
� �������������� ���� �&������ �������� ��' ������� � ������ ����
RECLAMATION BOAR D PERMITS
PERMIT NO LOCATION
17782 Phase 2 -Bear River and WPIC
17828 Phase 1 - Yuba River Slurry Wall
17921 Phase 2 - Yuba River Seepage Berm
17942 Phase 2 - Olivehurst Pump Station
18090 Phase 2 - Pump Station #6
18095 Phase 4 - YRLB Slurry Wall
18123 Phase 2 - Bear River Seepage Berm
CALTRANS ENCROACHMENT PERMITS
PERMIT NO LOCATION
0305-NMC0274 WPIC East of Hwy 70
0305-NMC0424 Olivehurst Ring Levee
0305-NDD0426 Caltrans Flap gate
0306-NMC0686 Bear River Seepage Berm
�
���� �������� �� +�'������� �����2.3.1 Environmental Resource Considerations
The implementation of a levee improvement program of this scope required the development, coordination, review, and approval of numerous environmental compliance permits with various government agencies. These permits address environmental compliance issues with both Federal and State resource agencies. Table 2-2 lists the environmental compliance activities and the agencies with which each action was coordinated and approved.
� ��������' ��� � � �������� ����
ENVIRONMENTAL COMPLIANCE PERMITS
AGENCY PERMIT DESCRIPTION
US Army Corps of Engineers Clean Water Act – Section 404
US Fish and Wildlife Service Biological Opinion
Letter of Concurrence – ESA Compliance
National Oceanic & Atmospheric Agency Letter of Concurrence – ESA Compliance
California Department of Fish & Game Consistency Determination – Section 2080.1
CA Endangered Species Act Authorization
Streambed Alteration Agreement – Section 1600
State Historic Preservation Officer Letter of Concurrence – Section 106
Regional Water Quality Control Board Clean Water Act – Section 401

Three R iv er s L ev ee Impro v emen t Au thor i t y F ina l Con s truc t ion Do cume nta t ion R epor t
� ����������
��"�
All construction activities were completed in accordance with all Federal, State, and local laws and regulations associated with environmental resource management. Furthermore, GENERAL PROVISIONS – Section 010 of the construction specifications was included in the contract documents to establish the environmental controls necessary to avoid impacts associated with the anticipated construction operations. No archaeological remains or artifacts were encountered during the construction phase.
�� � - �+�����A detailed analysis of existing utilities that penetrate or cross the levees comprising RD 784 was completed by TRLIA. A spreadsheet detailing an inventory of all known utility crossings associated with Phases 1, 2, and 4 of the TRLIA levee improvement program has been included in Appendix D.
The USACE has requested documentation confirming that all utility crossings are constructed to current USACE and Reclamation Board standards. Table 2-3 identifies all of the utilities currently in use with no available documentation:
� ������"�( ���������) �������*���� � ����� �
YUBA RIVER SOUTH LEVEE - UNIT 1
OWNER STATION DESCRIPTION
Sprint 1+45 UG Telephone Cable
PG&E 1+45 Gas Line
SBC 2+00 Telephone Line
PG&E 0 to 2+00 Gas Line
Unknown 3+00 Drain Pipe
Kinder Morgan 33+00 Gas Line
SBC 33+00 Communications Line
Sprint 102+60 UG Telephone Cable
Comcast 102+60 Cable
FEATHER RIVER EAST LEVEE - UNIT 2
OWNER STATION DESCRIPTION
PG&E 658+70 Gas Line
BEAR RIVER NORTH LEVEE - UNIT 3
OWNER STATION DESCRIPTION
United Telecon 168+00 Communications Line
SBC 168+00 Telephone Line
WPIC WEST LEVEE - UNIT 4
OWNER STATION DESCRIPTION
Sprint 0+00 Communications Cable
According to levee logs provided by RD 784 and Reclamation Board permit descriptions, all of these utilities cross the levee within the freeboard of the levee except a 4 inch telephone line at

Three R iv er s L ev ee Impro v emen t Au thor i t y F ina l Con s truc t ion Do cume nta t ion R epor t
� ����������
��#�
Station 2+00 along the left bank of the Yuba River. This telephone line crosses approximately 12 feet below the levee crown. This telephone line was not encountered during construction. No seepage issues have been noted at these crossings in the past. TRLIA has sent written requests to each utility company requesting documentation that the crossing meets current USACE and Reclamation Board utility crossing standards or to supply a plan to bring the crossing into compliance with the standards. While this documentation is being developed or new designs for relocation developed, TRLIA will provide information to RD 784 identifying the crossings that are suspect and recommend that RD 784 stockpile additional flood fighting materials near those crossings and provide additional patrols in those locations during high water events.
Table 2-4 identifies all of the utilities removed or abandoned during construction per Reclamation Board standards:
� ������#�+�� �� ���( ���������
YUBA RIVER SOUTH LEVEE - UNIT 1
OWNER STATION DESCRIPTION
SBC 6+26 UG Telephone Cable
Unknown 9+50 to 13+00 Drainage Pipe
SBC 13+64 UG Telephone Cable
Speckert Mill 33+50 Drainage Pipe
PG&E 102+00 Gas Line
BEAR RIVER NORTH LEVEE - UNIT 3
OWNER STATION DESCRIPTION
RD 784 140+75 Drainage Pipes (3)
Unknown 141+20 Drainage Pipes (2)
WPIC WEST LEVEE - UNIT 4
OWNER STATION DESCRIPTION
Unknown 120+30 Drain Pipe
Unknown 132+00 Drain Pipe
During the construction of the seepage berm along the Yuba River levee, PG&E relocated a series of power poles to the toe of the new seepage berm. One PG&E power pole and one Union Pacific Railroad pole was left in its original location to serve power to the railroad. It was later discovered that the railroad no longer needed power at this location. The pole owned by the railroad was removed. TRLIA is currently negotiating the permanent relocation of the one remaining PG&E power pole. The pole will be relocated outside of the seepage berm.
Table 2-5 identifies crossings installed as part of the new pump station construction. These crossings followed USACE and Reclamation Board standards as shown in the plans for construction which have been supplied to the USACE.

Three R iv er s L ev ee Impro v emen t Au thor i t y F ina l Con s truc t ion Do cume nta t ion R epor t
� ����������
��$�
� ������$�, �- �( ���������
BEAR RIVER NORTH LEVEE - UNIT 3
OWNER STATION DESCRIPTION
RD 784 140+75 Discharge Pipes (4)
RD 784 140+75 Concrete Box Culvert
OLIVEHURST RING LEVEE
OWNER STATION DESCRIPTION
Yuba County 313+00 Discharge Pipes (4)
Yuba County 313+00 Concrete Box Culvert
��!� �� +��� ��'������� �����Numerous temporary and permanent real estate acquisitions were necessary to construct the features of work proposed in the overall levee improvements program. Permanent real estate acquisitions are critical in the installation and permanent operations and maintenance requirements for all seepage and stability berms, the setback of Pump Station No. 6 at the Bear River, and the infill of the landside drainage ditch along the WPIC levee. Temporary real estate acquisitions were critical in enabling construction activities to proceed efficiently and on schedule. TRLIA employed the services of Bender-Rosenthal, Inc. to identify, negotiate, and obtain all necessary real estate acquisitions for the project.
��"� �������).�'���������'����+�Each construction contract included the information necessary for survey control for the establishment of all necessary alignments and grades in support of construction operations. PLATE 3, CONSTRUCTION SURVEY CONTROL DRAWINGS, contain the contract drawings from each construction contract that contain the survey control points and locations.
The horizontal control datum is based upon the North American Datum of 1983 (NAD83) 1986 Epoch and originates from the U.S. Army Corps of Engineers control monuments 6-7 and 6-9 located on the top of the Yuba River Levee. The vertical control datum is based upon 1929 Sea Level Datum and originates from control monuments established by the U.S. Army Corps of Engineers Survey File No. 03-25F.
��#� ,�/��+��� � ��)��A complete set of as-built drawings has been prepared for each construction contract, per the requirements set forth in section 01780 of the contract specifications. Volume II of this Final CDR includes color reproductions of the as-built drawings. Full-size color scans can be found on the enclosed CD-ROM.
��$� 0�������0� �����A number of technical, logistical, and administrative issues were encountered during the prosecution of this levee improvement program. In order to capture lessons learned for use by the client, consultants, and participating agencies, a formal after-action review will be
Three R iv er s L ev ee Impro v emen t Au thor i t y F ina l Con s truc t ion Do cume nta t ion R epor t
� ����������
��%�
scheduled prior to completion of the final construction contract. An after-action report will be compiled for review by the participants. Appendix F has been left blank for insertion of this after-action report upon completion and distribution.
Three R iv er s L ev ee Impro v emen t Au thor i t y F ina l Con s truc t ion Do cume nta t ion R epor t
� ����������
��&�
��� 0���������)1����)�
���� �� ����( ��� +�3.1.1 Select Fill
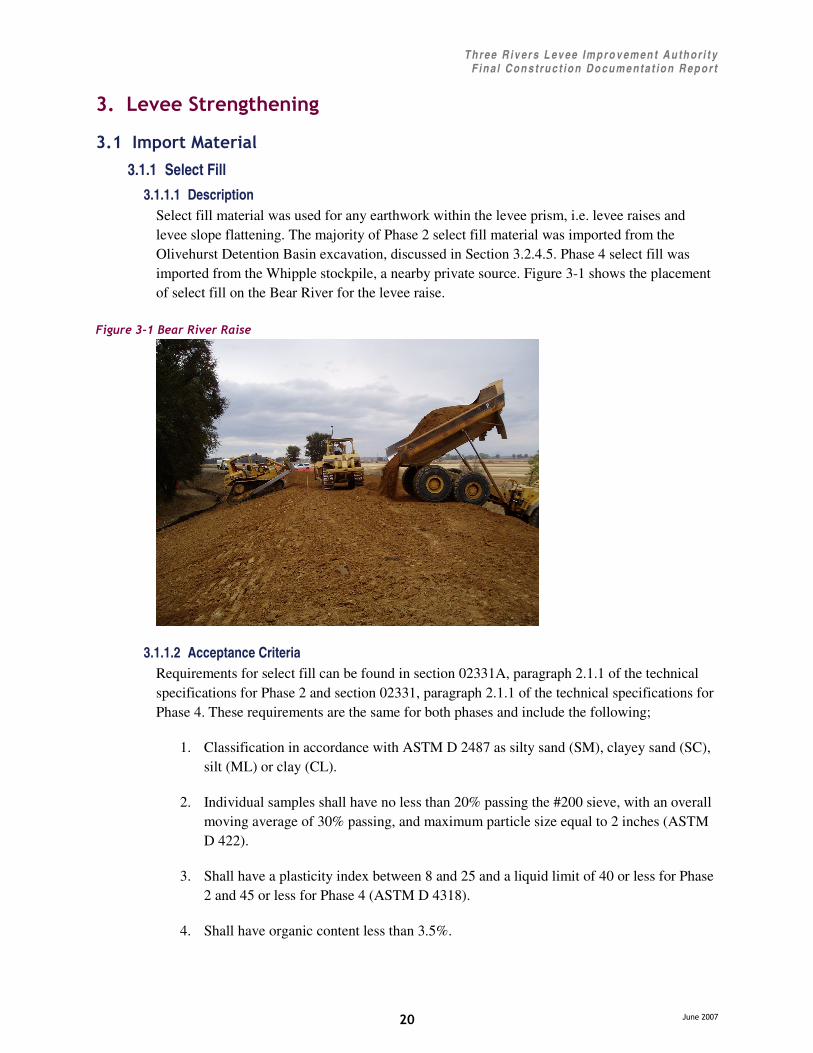
3.1.1.1 Description Select fill material was used for any earthwork within the levee prism, i.e. levee raises and levee slope flattening. The majority of Phase 2 select fill material was imported from the Olivehurst Detention Basin excavation, discussed in Section 3.2.4.5. Phase 4 select fill was imported from the Whipple stockpile, a nearby private source. Figure 3-1 shows the placement of select fill on the Bear River for the levee raise.
�������"��&����� � ���������
3.1.1.2 Acceptance Criteria Requirements for select fill can be found in section 02331A, paragraph 2.1.1 of the technical specifications for Phase 2 and section 02331, paragraph 2.1.1 of the technical specifications for Phase 4. These requirements are the same for both phases and include the following;
1. Classification in accordance with ASTM D 2487 as silty sand (SM), clayey sand (SC), silt (ML) or clay (CL).
2. Individual samples shall have no less than 20% passing the #200 sieve, with an overall moving average of 30% passing, and maximum particle size equal to 2 inches (ASTM D 422).
3. Shall have a plasticity index between 8 and 25 and a liquid limit of 40 or less for Phase 2 and 45 or less for Phase 4 (ASTM D 4318).
4. Shall have organic content less than 3.5%.

Three R iv er s L ev ee Impro v emen t Au thor i t y F ina l Con s truc t ion Do cume nta t ion R epor t
� ����������
����
The requirements for levee reconstruction after installation of the slurry cutoff wall during Phase 1 are contained in Section 02333 of the contract specification. The term “general fill” was used in lieu of “select fill” in the Phase 1 specifications.
3.1.1.3 Summary of Test Results The following sections discuss the QC test results for select fill material, including the percentage of fines passing the #200 sieve, the liquid limits and the plasticity indices for Phases 2 and 4. A summary and analysis of the QA test results for the select fill is located in Appendix G, TECHNICAL MEMORANDA.
3.1.1.3.1 Phase 2 Table 3-1 below shows the sample size, minimum, maximum, mean, and standard deviation of the laboratory testing for gradation of Phase 2 select fill materials for the QC data, included under Tab C-5, C-6 and C-8 of Appendix C. The mean of the QC data is 62.3%, nearly four standard deviations above the minimum requirement of 20%. There were 0 failing tests for gradation. The minimum % passing for the QC data was 21.2%, meeting the requirement. These values represent approximately 160,000 cubic yards of select fill.
� �����"������� ���� ���*������ � ��!������������������������
% FINES – PHASE 2 SELECT FILL
Value QC
Number of Samples 328
Minimum 21.2
Maximum 96.8
Mean 62.3
Standard Deviation 13.9
No. Failing Tests 0
Figure 3-2 shows the distribution of the gradation data. The numbers on the x-axis denote the maximum value of the corresponding interval and the minimum value for the subsequent interval. The numbers on the y-axis denote the total number of samples in each category.

Three R iv er s L ev ee Impro v emen t Au thor i t y F ina l Con s truc t ion Do cume nta t ion R epor t
� ����������
����
�������"��. �������� ������������������������������ ���� ���
% Fines - Phase 2 Select Fill QC
0
10
20
30
40
50
60
20 25 30 35 40 45 50 55 60 65 70 75 80 85 90 95 100 105
% Fines
Cha
rt
Table 3-2 below shows the sample size, minimum, maximum, mean, and standard deviation of the laboratory testing for liquid limits (LL) of Phase 2 select fill materials for the QC data, included under Tab C-5, C-6 and C-8 of Appendix C. The mean of the QC data is 33.4, roughly one standard deviation below the maximum of 40. There were 19 failing LL tests. The maximum LL value for the QC data was 50. These values represent approximately 160,000 cubic yards of select fill.
� �����"����/������� ���*������ � ��!������������������������
LIQUID LIMIT – PHASE 2 SELECT FILL
Value QC
Number of Samples 328
Minimum 21
Maximum 50
Mean 33.4
Standard Deviation 4.7
No. Failing Tests 19
Figure 3-3 shows the distribution of the LL data. The numbers on the x-axis denote the maximum value of the corresponding interval and the minimum value for the subsequent interval. The numbers on the y-axis denote the total number of samples in each category.
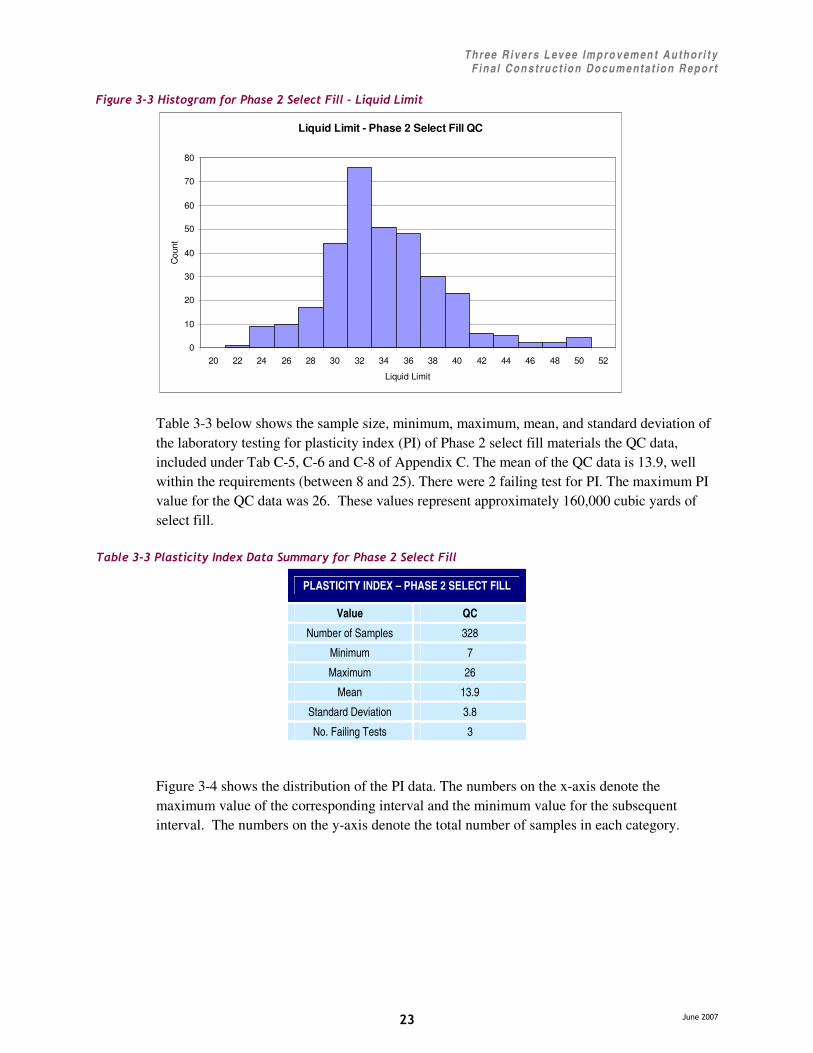
Three R iv er s L ev ee Impro v emen t Au thor i t y F ina l Con s truc t ion Do cume nta t ion R epor t
� ����������
����
�������""�. �������� ������������������������0���/������� ���
Liquid Limit - Phase 2 Select Fill QC
0
10
20
30
40
50
60
70
80
20 22 24 26 28 30 32 34 36 38 40 42 44 46 48 50 52
Liquid Limit
Cou
nt
Table 3-3 below shows the sample size, minimum, maximum, mean, and standard deviation of the laboratory testing for plasticity index (PI) of Phase 2 select fill materials the QC data, included under Tab C-5, C-6 and C-8 of Appendix C. The mean of the QC data is 13.9, well within the requirements (between 8 and 25). There were 2 failing test for PI. The maximum PI value for the QC data was 26. These values represent approximately 160,000 cubic yards of select fill.
� �����""����������!�� ��1�*������ � ��!������������������������
PLASTICITY INDEX – PHASE 2 SELECT FILL
Value QC
Number of Samples 328
Minimum 7
Maximum 26
Mean 13.9
Standard Deviation 3.8
No. Failing Tests 3
Figure 3-4 shows the distribution of the PI data. The numbers on the x-axis denote the maximum value of the corresponding interval and the minimum value for the subsequent interval. The numbers on the y-axis denote the total number of samples in each category.
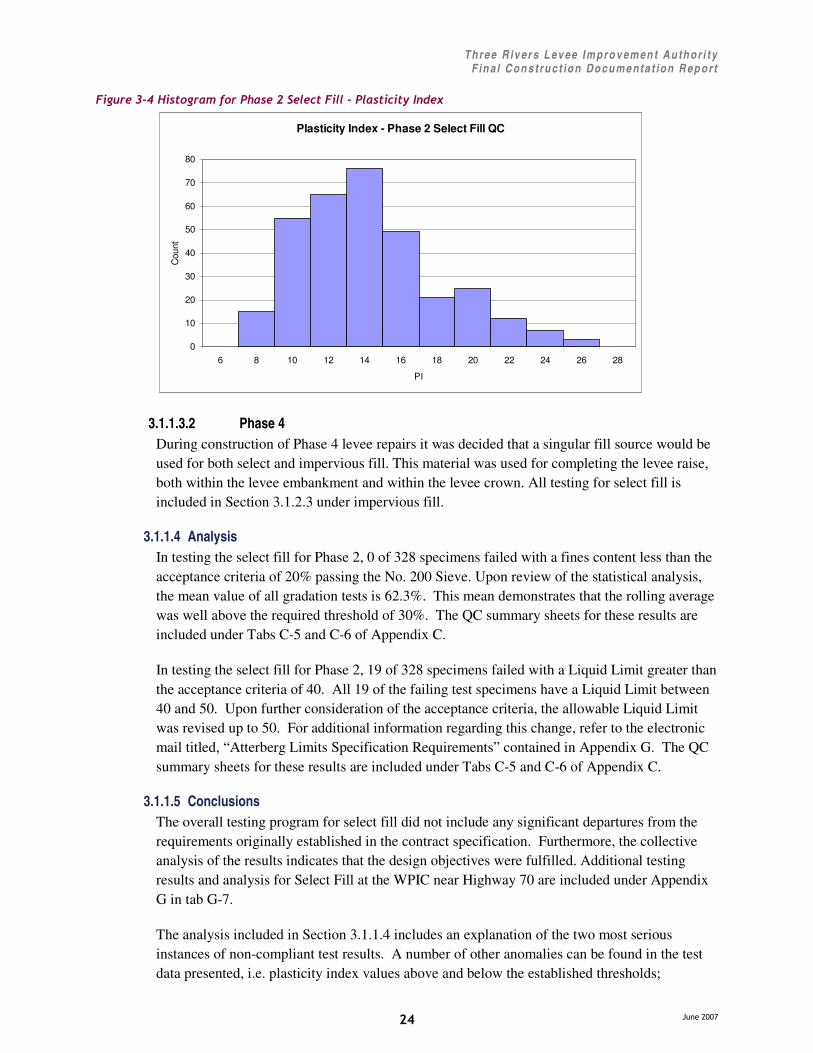
Three R iv er s L ev ee Impro v emen t Au thor i t y F ina l Con s truc t ion Do cume nta t ion R epor t
� ����������
�� �
�������"#�. �������� ����������������������������������!�� ��1�
Plasticity Index - Phase 2 Select Fill QC
0
10
20
30
40
50
60
70
80
6 8 10 12 14 16 18 20 22 24 26 28
PI
Cou
nt
3.1.1.3.2 Phase 4 During construction of Phase 4 levee repairs it was decided that a singular fill source would be used for both select and impervious fill. This material was used for completing the levee raise, both within the levee embankment and within the levee crown. All testing for select fill is included in Section 3.1.2.3 under impervious fill.
3.1.1.4 Analysis In testing the select fill for Phase 2, 0 of 328 specimens failed with a fines content less than the acceptance criteria of 20% passing the No. 200 Sieve. Upon review of the statistical analysis, the mean value of all gradation tests is 62.3%. This mean demonstrates that the rolling average was well above the required threshold of 30%. The QC summary sheets for these results are included under Tabs C-5 and C-6 of Appendix C.
In testing the select fill for Phase 2, 19 of 328 specimens failed with a Liquid Limit greater than the acceptance criteria of 40. All 19 of the failing test specimens have a Liquid Limit between 40 and 50. Upon further consideration of the acceptance criteria, the allowable Liquid Limit was revised up to 50. For additional information regarding this change, refer to the electronic mail titled, “Atterberg Limits Specification Requirements” contained in Appendix G. The QC summary sheets for these results are included under Tabs C-5 and C-6 of Appendix C.
3.1.1.5 Conclusions The overall testing program for select fill did not include any significant departures from the requirements originally established in the contract specification. Furthermore, the collective analysis of the results indicates that the design objectives were fulfilled. Additional testing results and analysis for Select Fill at the WPIC near Highway 70 are included under Appendix G in tab G-7.
The analysis included in Section 3.1.1.4 includes an explanation of the two most serious instances of non-compliant test results. A number of other anomalies can be found in the test data presented, i.e. plasticity index values above and below the established thresholds;

Three R iv er s L ev ee Impro v emen t Au thor i t y F ina l Con s truc t ion Do cume nta t ion R epor t
� ����������
��!�
however, upon further consideration, the frequency of failing tests and their respective values do not warrant further consideration.
3.1.2 Impervious Fill 3.1.2.1 Description
Impervious fill material is used for earthwork within the levee prism designed specifically to hinder permeability, i.e. clay caps or waterside impervious zones. Impervious material was used to cap all of the slurry cutoff walls installed under Phases 1, 2, and 4 as well as along the waterside levee slope of the Bear River north levee and within the levee embankment for Phase 4 on the Yuba River.
3.1.2.2 Acceptance Criteria Requirements for impervious fill can be found in section 02331A, paragraph 2.1.3 of the technical specifications for Phase 2, section 02331, paragraph 2.1.3 of the technical specifications for Phase 4 and section 02333, paragraph 1.3.1 of the technical specifications for Phase 1. These requirements are generally the same for each phase and include the following;
1. Classification in accordance with ASTM D 2487 lean clay (CL) (Phase 2 and 4)
2. Shall have a liquid limit of 45 or less and a plasticity index of 8 (7 for Phase 1) or greater (ASTM D 4318).
3. Shall have no less than 30% passing the #200 sieve and no more than 15% retained on the No. 4 sieve (Phase 1 only) (ASTM D 422).
4. Maximum particle size equal to 1 inch (ASTM 422).
3.1.2.3 Summary of Test Results The following sections discuss the QC test results for the impervious fill material, including the percentage of fines passing the #200 sieve, the liquid limits and the plasticity indices for Phases 1 and 2. A summary and analysis of the QA test results for the select fill is located in Appendix G, TECHNICAL MEMORANDA.
3.1.2.3.1 Phase 1 Table 3-4 below shows the sample size, minimum, maximum, mean, and standard deviation of the laboratory testing for liquid limits (LL) of Phase 1 impervious fill materials for the QC data, included under Tab C-1 of Appendix C. The mean of the QC data is 35.3, well below the maximum of 45. There were no failing LL tests. The maximum LL value for the QC data was 36, well below the limit. These values represent approximately 5,000 cubic yards of impervious fill. A histogram depicting this data was not created due to the limited number of samples tested.

Three R iv er s L ev ee Impro v emen t Au thor i t y F ina l Con s truc t ion Do cume nta t ion R epor t
� ����������
��"�
� �����"#���/������� ���*������ � ��!��������������� ��� ����������
LIQUID LIMIT – PHASE 1 IMPERVIOUS FILL
Value QC
Number of Samples 3
Minimum 34
Maximum 36
Mean 35.3
Standard Deviation 1.16
No. Failing Tests 0
Table 3-5 below shows the sample size, minimum, maximum, mean, and standard deviation of the laboratory testing for plasticity index (PI) of Phase 1 impervious fill materials for the QC data, included under Tab C-1 of Appendix C. The mean of the QC data is 18.3, well within the requirements (between 7 and 25). There were no failing tests for PI. The maximum PI value for the QC data was 20, well within the requirements. These values represent approximately 5,000 cubic yards of impervious fill. A histogram depicting this data was not created due to the limited number of samples tested.
� �����"$����������!�� ��1�*������ � ��!��������������� ��� ����������
PLASTICITY INDEX – PHASE 1 IMPERVIOUS FILL
Value QC
Number of Samples 3
Minimum 17
Maximum 20
Mean 18.3
Standard Deviation 1.53
No. Failing Tests 0
Table 3-6 below shows the sample size, minimum, maximum, mean, and standard deviation of the laboratory testing for gradation of Phase 1 impervious fill materials for the QC data, included under Tab C-1 of Appendix C. The mean of the QC data is 76.1%, well above the requirement of 30%. There were no failing tests for gradation. The minimum % passing for the QC data was 72.1%, well above the requirements. These values represent approximately 5,000 cubic yards of impervious fill. A histogram depicting this data was not created due to the limited number of samples tested.

Three R iv er s L ev ee Impro v emen t Au thor i t y F ina l Con s truc t ion Do cume nta t ion R epor t
� ����������
��#�
� �����"2������ ���� ���*������ � ��!��������������� ��� ����������
% FINES – PHASE 1 IMPERVIOUS FILL
Value QC
Number of Samples 3
Minimum 72.1
Maximum 79.7
Mean 76.1
Standard Deviation 3.82
No. Failing Tests 0
3.1.2.3.2 Phase 2 Table 3-7 below shows the sample size, minimum, maximum, mean, and standard deviation of the laboratory testing for liquid limits (LL) of Phase 2 impervious fill materials for the QC data, included under Tab C-5 and C-6 of Appendix C. The mean of the QC data is 35.4, well below the maximum of 45. There was only one failing LL tests. The maximum LL value for the QC data was 46, barely above the requirement. These values represent approximately 10,000 cubic yards of impervious fill.
� �����"3���/������� ���*������ � ��!��������������� ��� ����������
LIQUID LIMIT – PHASE 2 IMPERVIOUS FILL
Value QC
Number of Samples 19
Minimum 30
Maximum 46
Mean 35.4
Standard Deviation 3.93
No. Failing Tests 1
Figure 3-5 shows the distribution of the LL data. The numbers on the x-axis denote the maximum value of the corresponding interval and the minimum value for the subsequent interval. The numbers on the y-axis denote the total number of samples in each category.
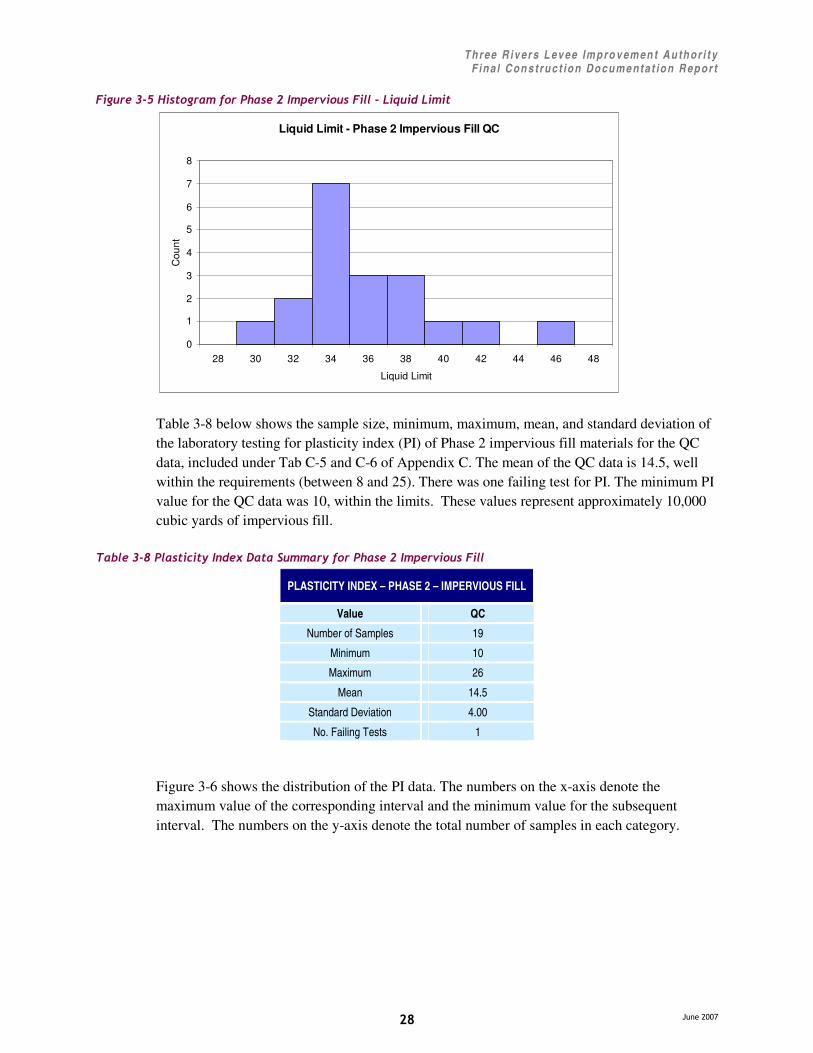
Three R iv er s L ev ee Impro v emen t Au thor i t y F ina l Con s truc t ion Do cume nta t ion R epor t
� ����������
��$�
�������"$�. �������� ��������������� ��� �������������/������� ���
Liquid Limit - Phase 2 Impervious Fill QC
0
1
2
3
4
5
6
7
8
28 30 32 34 36 38 40 42 44 46 48
Liquid Limit
Cou
nt
Table 3-8 below shows the sample size, minimum, maximum, mean, and standard deviation of the laboratory testing for plasticity index (PI) of Phase 2 impervious fill materials for the QC data, included under Tab C-5 and C-6 of Appendix C. The mean of the QC data is 14.5, well within the requirements (between 8 and 25). There was one failing test for PI. The minimum PI value for the QC data was 10, within the limits. These values represent approximately 10,000 cubic yards of impervious fill.
� �����"4����������!�� ��1�*������ � ��!��������������� ��� ����������
PLASTICITY INDEX – PHASE 2 – IMPERVIOUS FILL
Value QC
Number of Samples 19
Minimum 10
Maximum 26
Mean 14.5
Standard Deviation 4.00
No. Failing Tests 1
Figure 3-6 shows the distribution of the PI data. The numbers on the x-axis denote the maximum value of the corresponding interval and the minimum value for the subsequent interval. The numbers on the y-axis denote the total number of samples in each category.
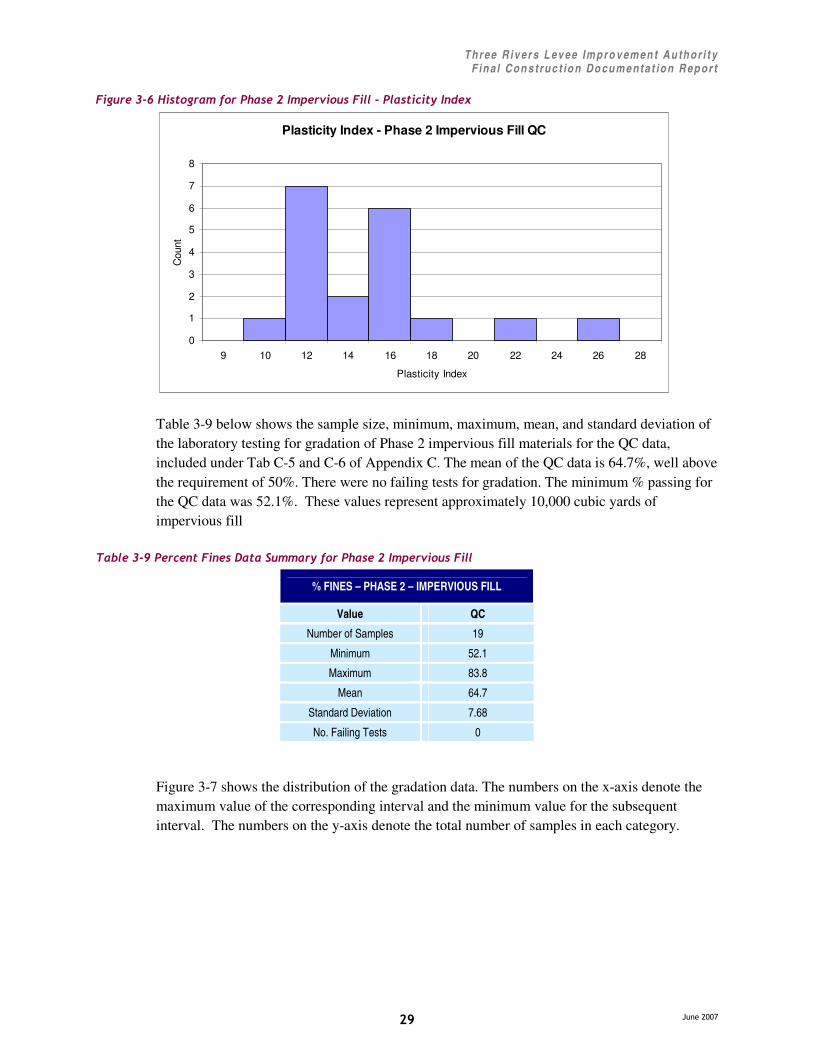
Three R iv er s L ev ee Impro v emen t Au thor i t y F ina l Con s truc t ion Do cume nta t ion R epor t
� ����������
��%�
�������"2�. �������� ��������������� ��� ��������������������!�� ��1�
Plasticity Index - Phase 2 Impervious Fill QC
0
1
2
3
4
5
6
7
8
9 10 12 14 16 18 20 22 24 26 28
Plasticity Index
Cou
nt
Table 3-9 below shows the sample size, minimum, maximum, mean, and standard deviation of the laboratory testing for gradation of Phase 2 impervious fill materials for the QC data, included under Tab C-5 and C-6 of Appendix C. The mean of the QC data is 64.7%, well above the requirement of 50%. There were no failing tests for gradation. The minimum % passing for the QC data was 52.1%. These values represent approximately 10,000 cubic yards of impervious fill
� �����"5������ ���� ���*������ � ��!��������������� ��� ����������
% FINES – PHASE 2 – IMPERVIOUS FILL
Value QC
Number of Samples 19
Minimum 52.1
Maximum 83.8
Mean 64.7
Standard Deviation 7.68
No. Failing Tests 0
Figure 3-7 shows the distribution of the gradation data. The numbers on the x-axis denote the maximum value of the corresponding interval and the minimum value for the subsequent interval. The numbers on the y-axis denote the total number of samples in each category.
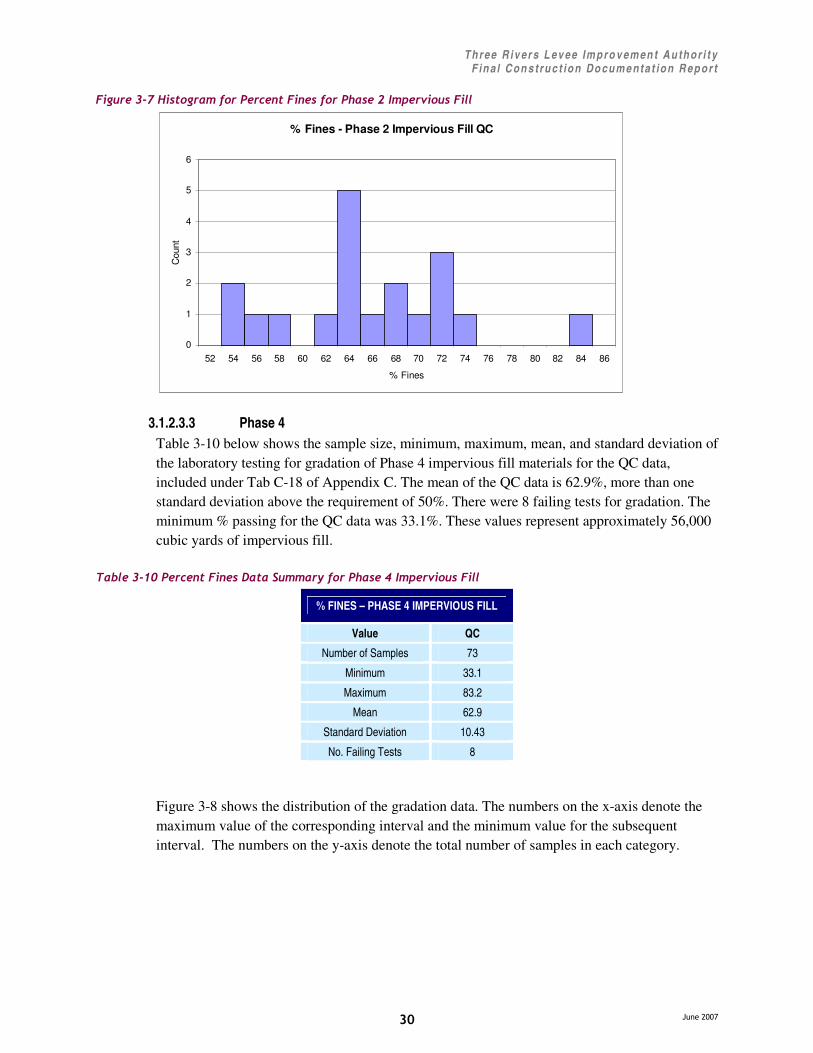
Three R iv er s L ev ee Impro v emen t Au thor i t y F ina l Con s truc t ion Do cume nta t ion R epor t
� ����������
��&�
�������"3�. �������� ���������� ���� ����������������� ��� ����������
% Fines - Phase 2 Impervious Fill QC
0
1
2
3
4
5
6
52 54 56 58 60 62 64 66 68 70 72 74 76 78 80 82 84 86
% Fines
Cou
nt
3.1.2.3.3 Phase 4 Table 3-10 below shows the sample size, minimum, maximum, mean, and standard deviation of the laboratory testing for gradation of Phase 4 impervious fill materials for the QC data, included under Tab C-18 of Appendix C. The mean of the QC data is 62.9%, more than one standard deviation above the requirement of 50%. There were 8 failing tests for gradation. The minimum % passing for the QC data was 33.1%. These values represent approximately 56,000 cubic yards of impervious fill.
� �����"�6������ ���� ���*������ � ��!�����������#��� ��� ����������
% FINES – PHASE 4 IMPERVIOUS FILL
Value QC
Number of Samples 73
Minimum 33.1
Maximum 83.2
Mean 62.9
Standard Deviation 10.43
No. Failing Tests 8
Figure 3-8 shows the distribution of the gradation data. The numbers on the x-axis denote the maximum value of the corresponding interval and the minimum value for the subsequent interval. The numbers on the y-axis denote the total number of samples in each category.
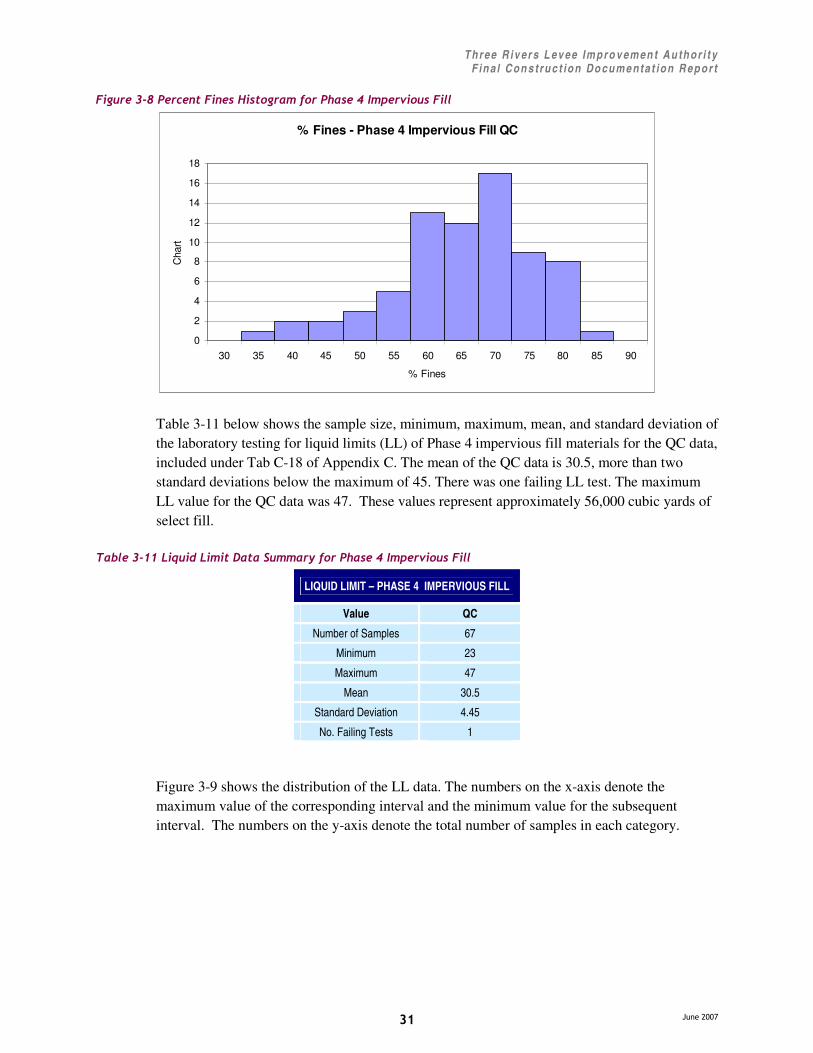
Three R iv er s L ev ee Impro v emen t Au thor i t y F ina l Con s truc t ion Do cume nta t ion R epor t
� ����������
����
�������"4������ ���� ���. �������� �����������#��� ��� ����������
% Fines - Phase 4 Impervious Fill QC
0
2
4
6
8
10
12
14
16
18
30 35 40 45 50 55 60 65 70 75 80 85 90
% Fines
Cha
rt
Table 3-11 below shows the sample size, minimum, maximum, mean, and standard deviation of the laboratory testing for liquid limits (LL) of Phase 4 impervious fill materials for the QC data, included under Tab C-18 of Appendix C. The mean of the QC data is 30.5, more than two standard deviations below the maximum of 45. There was one failing LL test. The maximum LL value for the QC data was 47. These values represent approximately 56,000 cubic yards of select fill.
� �����"�����/������� ���*������ � ��!�����������#��� ��� ����������
LIQUID LIMIT – PHASE 4 IMPERVIOUS FILL
Value QC
Number of Samples 67
Minimum 23
Maximum 47
Mean 30.5
Standard Deviation 4.45
No. Failing Tests 1
Figure 3-9 shows the distribution of the LL data. The numbers on the x-axis denote the maximum value of the corresponding interval and the minimum value for the subsequent interval. The numbers on the y-axis denote the total number of samples in each category.

Three R iv er s L ev ee Impro v emen t Au thor i t y F ina l Con s truc t ion Do cume nta t ion R epor t
� ����������
����
�������"5�. �������� �����������#��� ��� �������������/������� ���
Liquid Limit - Phase 4 Impervious Fill QC
0
2
4
6
8
10
12
14
16
22 24 26 28 30 32 34 36 38 40 42 44 46 48 50
Liquid Limit
Cou
nt
Table 3-12 below shows the sample size, minimum, maximum, mean, and standard deviation of the laboratory testing for plasticity index (PI) of Phase 4 impervious fill materials for the QC data, included under Tab C-18 of Appendix C. The mean of the QC data is 13.1, well within the requirements (between 8 and 25). There were six failing tests for PI. These values represent approximately 56,000 cubic yards of select fill.
� �����"������������!�� ��1�*������ � ��!�����������#��� ��� ����������
PLASTICITY INDEX – PHASE 4 IMPERVIOUS FILL
Value QC
Number of Samples 67
Minimum 6
Maximum 29
Mean 13.1
Standard Deviation 4.32
No. Failing Tests 6
Figure 3-10 shows the distribution of the PI data. The numbers on the x-axis denote the maximum value of the corresponding interval and the minimum value for the subsequent interval. The numbers on the y-axis denote the total number of samples in each category.

Three R iv er s L ev ee Impro v emen t Au thor i t y F ina l Con s truc t ion Do cume nta t ion R epor t
� ����������
����
�������"�6�. �������� �����������#��� ��� ��������������������!�� ��1�
Plasticity Index - Phase 4 Impervious Fill QC
0
2
4
6
8
10
12
14
16
18
4 6 8 10 12 14 16 18 20 22 24 26 28 30 32
Plasticity Index
Cou
nt
3.1.2.4 Analysis In testing the impervious fill for Phase 2, 1 of 19 specimens failed with a Liquid Limit greater than the acceptance criteria of 45. The failing test specimens had a Liquid Limit of 46. Upon a review of the statistical analysis, the mean value of all LL testing is 35.4. This mean demonstrates an average value well within the maximum threshold. The QC summary sheets for these results are included under Tabs C-5, and C-6 of Appendix C.
In testing the impervious fill for Phase 2, 1 of 19 specimens failed with a Plasticity Index greater than the acceptance criteria of 25. The failing test specimen had a PI of 26. Upon a review of the statistical analysis, the mean value of all PI testing is 14.5. This mean demonstrates an average value well within the maximum threshold. The QC summary sheets for these results are included under Tabs C-5, and C-6 of Appendix C.
In testing the impervious fill for Phase 4, 8 of 73 specimens failed with a Percent Fines less than the acceptance criteria of 50%. Two of these tests were taken off the toe of the levee, an area that would generally include select fill. Three of the tests were taken around elevation 75, which would lie in the region outside the impervious cap. Given the location of these 5 tests results and the fact that they meet criteria for select fill (percent passing greater than 20%), it has been determined that the tests pass the acceptance criteria. The remaining result of 45.1% was taken at elevation 79.5, within the limits of the impervious cap. However, the mean value for the percent passing was 62.9%, an average well above the minimum threshold. The QC summary sheets for these results are included under Tab C-18 of Appendix C.
In testing the impervious fill for Phase 4, 1 of 67 specimens failed with a Liquid Limit more than the acceptance criteria of 45. The failing test specimen had an LL of 47. Upon a review of the statistical analysis, the mean value of all LL testing is 30.5. This mean demonstrates an average value well within the maximum threshold. The QC summary sheets for these results are included under Tab C-18 of Appendix C.
In testing the impervious fill for Phase 4, 6 of 67 specimens failed with a Plasticity Index outside the acceptance criteria of between 8 and 25. The failing test specimens ranged from 6
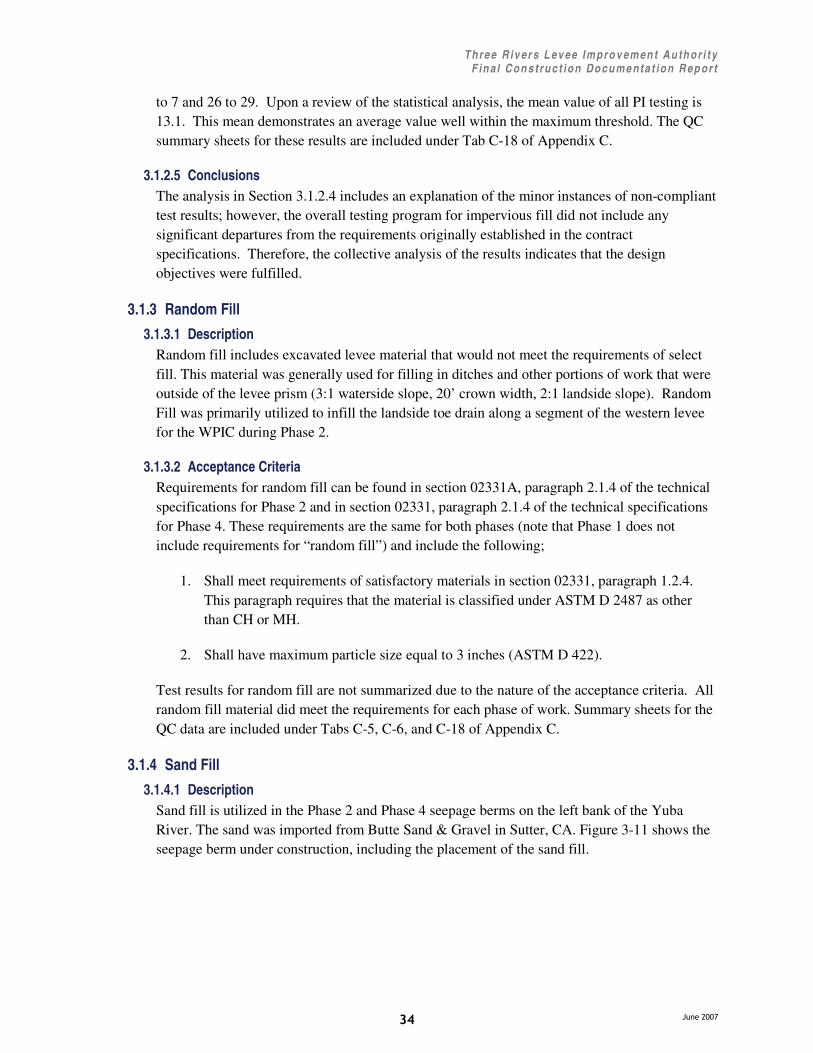
Three R iv er s L ev ee Impro v emen t Au thor i t y F ina l Con s truc t ion Do cume nta t ion R epor t
� ����������
�� �
to 7 and 26 to 29. Upon a review of the statistical analysis, the mean value of all PI testing is 13.1. This mean demonstrates an average value well within the maximum threshold. The QC summary sheets for these results are included under Tab C-18 of Appendix C.
3.1.2.5 Conclusions The analysis in Section 3.1.2.4 includes an explanation of the minor instances of non-compliant test results; however, the overall testing program for impervious fill did not include any significant departures from the requirements originally established in the contract specifications. Therefore, the collective analysis of the results indicates that the design objectives were fulfilled.
3.1.3 Random Fill 3.1.3.1 Description
Random fill includes excavated levee material that would not meet the requirements of select fill. This material was generally used for filling in ditches and other portions of work that were outside of the levee prism (3:1 waterside slope, 20’ crown width, 2:1 landside slope). Random Fill was primarily utilized to infill the landside toe drain along a segment of the western levee for the WPIC during Phase 2.
3.1.3.2 Acceptance Criteria Requirements for random fill can be found in section 02331A, paragraph 2.1.4 of the technical specifications for Phase 2 and in section 02331, paragraph 2.1.4 of the technical specifications for Phase 4. These requirements are the same for both phases (note that Phase 1 does not include requirements for “random fill”) and include the following;
1. Shall meet requirements of satisfactory materials in section 02331, paragraph 1.2.4. This paragraph requires that the material is classified under ASTM D 2487 as other than CH or MH.
2. Shall have maximum particle size equal to 3 inches (ASTM D 422).
Test results for random fill are not summarized due to the nature of the acceptance criteria. All random fill material did meet the requirements for each phase of work. Summary sheets for the QC data are included under Tabs C-5, C-6, and C-18 of Appendix C.
3.1.4 Sand Fill 3.1.4.1 Description
Sand fill is utilized in the Phase 2 and Phase 4 seepage berms on the left bank of the Yuba River. The sand was imported from Butte Sand & Gravel in Sutter, CA. Figure 3-11 shows the seepage berm under construction, including the placement of the sand fill.

Three R iv er s L ev ee Impro v emen t Au thor i t y F ina l Con s truc t ion Do cume nta t ion R epor t
� ����������
��!�
�������"������������������&��� ��� �������� �
3.1.4.2 Acceptance Criteria Requirements for sand fill can be found in section 02331A, paragraph 2.1.5 of the technical specifications for Phase 2.
1. Shall meet requirements of ASTM C 33 grading for fine aggregate.
2. Shall have no more than 5% passing the #200 sieve.
3.1.4.3 Summary of Test Results 3.1.4.3.1 Phase 2
Table 3-13 below shows the sample size, minimum, maximum, mean, and standard deviation of the QC laboratory testing for gradation of Phase 2 sand fill materials. Summary sheets for the QC data are included under Tab C-7 of Appendix C. The mean of the QC data is 4.7%, just below the upper limit of 5%. There were 50 failing QC tests. The maximum % passing for the QC data was 10.5%, well above the requirements. These values represent approximately 86,000 cubic yards of sand fill.
� �����"�"������ ���� ���*������ � ��!�������������� �������
% FINES – PHASE 2 SAND FILL
Value QC
Number of Samples 139
Minimum 0.3
Maximum 10.5
Mean 4.7
Standard Deviation 1.57
No. Failing Tests 50
Figure 3-12 shows the distribution of the gradation data. The numbers on the x-axis denote the maximum value of the corresponding interval and the minimum value for the subsequent interval. The numbers on the y-axis denote the total number of samples in each category.

Three R iv er s L ev ee Impro v emen t Au thor i t y F ina l Con s truc t ion Do cume nta t ion R epor t
� ����������
��"�
�������"���. �������� �������������� ������������� ���� ���
% Fines - Phase 2 Sand Fill
0
5
10
15
20
25
30
35
40
45
0 1 2 3 4 5 6 7 8 9 10 11 12
% Fines
Cou
nt
3.1.4.3.2 Phase 4 The Phase 4 seepage berm was relatively small, resulting in only two samples taken for laboratory testing. Statistical analysis for Phase 4 sand fill was not completed due to the small number of tests. Both samples met the gradation requirements denoted above, at 3.9% and 0.6% fines. The results are included under Appendix G in tab G-7.
3.1.4.4 Analysis During construction of the Phase 2 sand berm, several gradation tests did not meet the requirements noted in section 3.1.4.2. Collaboration between the design and construction team resulted in a revision increasing the allowable limit of fines passing the No. 200 sieve. For more information regarding these issues and the associated engineering analysis, refer to the Technical Memorandum titled, “Evaluation of As-Built Conditions, Yuba River Seepage Berm” in Appendix G. The evaluation of as-built conditions contained in this technical memorandum indicates that the seepage berm meets the original intent of the design and satisfies USACE design criteria.
���� 2� �����3�4 ��5�
3.2.1 Cutoff Walls 3.2.1.1 Description
Slurry cutoff walls are vertical layers of low-permeability material that act as a diffuser for excessive build-up of hydraulic head. These walls help prevent seepage by restricting water from going through the levee or levee foundation, thereby preventing large hydraulic exit gradients on the levee face or at the landside levee toe. All of the slurry cutoff walls installed as part of this levee improvement program were comprised of soil, cement, and bentonite. Figure 3-13 depicts the slurry wall on the WPIC under construction.

Three R iv er s L ev ee Impro v emen t Au thor i t y F ina l Con s truc t ion Do cume nta t ion R epor t
� ����������
��#�
�������"�"�) ��������!�) ������ �������� �
The following steps are required for slurry wall construction;
1. Mix Design – The first step towards slurry wall construction is the creation of a mix design. The contractor uses on-site soils to create a mix design that will meet the specifications for permeability and compressive strength.
2. Site Preparation – This includes clearing and grubbing any trees or shrubs larger than 3 inches in diameter and the stripping of surficial grasses and vegetation to a depth of roughly 6 inches.
3. Degradation of Levee Crown – This includes excavating the upper third of the levee to prevent hydraulic fracturing during placement of the slurry cutoff wall. The material is cast aside for disposal or re-use as backfill for the cutoff wall.
4. Excavation of Lead-in – An excavator with a long-stick boom begins a lead-in trench for the slurry cutoff wall. Bentonite slurry is pumped into the trench for stability purposes.
5. Trench Excavation – The excavator continues digging the trench along the design alignment to the required depths.
6. Backfill – Soil and cement are mixed in a baker tank adjacent to the slurry trench until the mix design is met. A smaller excavator places the backfill into the trench where it mixes with the bentonite slurry to form the slurry cutoff wall.
7. Levee Restoration – No sooner than 7 days after placement of the backfill the levee is built back to design grade.
8. Impervious Cap – A trench is dug into the rebuilt levee along the centerline of the alignment for placement of the impervious fill material.

Three R iv er s L ev ee Impro v emen t Au thor i t y F ina l Con s truc t ion Do cume nta t ion R epor t
� ����������
��$�
9. Final Levee Preparation – Once the levee is built to grade, the aggregate base is placed on the levee crown for the access road and the slopes are hydroseeded for slope protection.
3.2.1.2 Locations A total of four slurry cutoff walls were constructed for Phase 1, 2 and 4. The following is a short description of each slurry wall and any changes that occurred during construction.
3.2.1.2.1 Phase 1 The Phase 1 construction contract included a 2,200 foot long slurry wall from Station 4+00 to 26+00 on the left bank of the Yuba River between Highway 70 and the SPRR. The average depth of the slurry cutoff wall was 50 feet. Construction was completed during the fall of 2004. There were no design changes or outstanding issues from construction. The location of the cutoff wall is shown on the three plan and profile drawings included as Plate 2-1.
3.2.1.2.2 Phase 2 Phase 2 included two slurry walls on the WPIC, a 1,000 foot wall and a 500 foot wall. The two walls were constructed in the fall of 2005. The average depth of the slurry cutoff walls was 35 feet and 44 feet respectively. There were no design changes or outstanding issues from construction. The location of the cutoff wall is shown on the 34 plan and profile drawings included as Plate 2-2.
3.2.1.2.3 Phase 4 The Phase 4 construction contract featured a 6,850 foot long slurry wall from Station 35+00 to 103+50 on the left bank of the Yuba River between the UPRR and just east of Simpson Lane. The average depth of the slurry cutoff wall was 80 feet. Construction was completed in November 2006. The location of the cutoff wall is shown on the seven plan and profile drawings included as Plate 2-3. There were two design changes during construction to this slurry wall.
1. The slurry wall was extended 50 feet to the west to Station 35+00 to decrease the size of the corner seepage berm.
2. At the eastern end of the slurry wall near Simpson Lane the depth was decreased to elevation 40. This was done due to the time requirements set forth in the traffic control plan and the underlying soil stratigraphy.
An issue that arose during the preliminary stages of Phase 4 construction was the method of mixing the backfill material. Conventional methods utilize cement slurry when mixing with excavated soil to ensure consistent mixing. A portion of the Phase 4 cutoff wall used dry cement when mixing backfill. The ultimate differences between these two methods has not been determined; however, portions of the slurry wall that utilized dry cement experienced low compressive strengths that ultimately resulted in the removal and replacement of approximately 200 feet of slurry wall. Additional discussion regarding the replaced section of cutoff wall is contained in Section 3.2.1.7.

Three R iv er s L ev ee Impro v emen t Au thor i t y F ina l Con s truc t ion Do cume nta t ion R epor t
� ����������
��%�
3.2.1.3 Acceptance Criteria Requirements for slurry walls can be found in section 02261A, paragraph 3.8.2 of the technical specifications for Phase 1, section 02261A, paragraph 3.8.2 of the technical specifications for Phase 2, and section 02261, paragraph 3.8.2 of the technical specifications for Phase 4. These requirements are the same for all phases and include the following;
1. Phase 1 and 2 cutoff walls shall have a thickness at least 30 inches. Phase 4 cutoff wall shall have a thickness of at least 36 inches.
2. Shall have minimum unconfined compressive strength of 30 psi at 7 days and a maximum compressive strength of 300 psi at 7 days (ASTM D 4832).
3. Shall have permeability no more than 1x10⁻⁶ cm/sec at 7 days (ASTM D 5084).
3.2.1.4 Test Data Summary – Phase 1 3.2.1.4.1 Compressive Strength
Table 3-14 below shows the sample size, minimum, maximum, mean, and standard deviation of the compressive strength data for Phase 1 QC and QA. The mean of the QC data is 67 psi, more than two standard deviations greater than the minimum of 30 psi. The mean of the QA data is 74 psi, more than three standard deviations greater than the minimum of 30 psi. Summary sheets for the QC data are included under Tab C-3 in Appendix C; and, summary sheets for the QA data are included under Tab C-4 in Appendix C. These values represent approximately 95,000 square feet of slurry cutoff wall.
� �����"�#���� ������ ����� ����*������ � ��!�����������������!�) ����
COMPRESSIVE STRENGTH – PHASE 1
Value QC QA
Number of Samples 45 10
Minimum (psi) 42 54
Maximum (psi) 103 97
Mean (psi) 67 74
Standard Deviation (psi) 15 14
No. Failing Tests 0 0
There were no failing tests for compressive strength as shown in the following histogram. The minimum strength result for the QC data was 42 psi; and, the minimum strength result for the QA data was 54 psi. The maximum values were well within the maximum allowable strength of 300 psi.
Figure 3-14 shows the distribution of the compressive strength data. The numbers on the x-axis denote the maximum value of the corresponding interval and the minimum value for the subsequent interval. The numbers on the y-axis denote the total number of samples in each category.
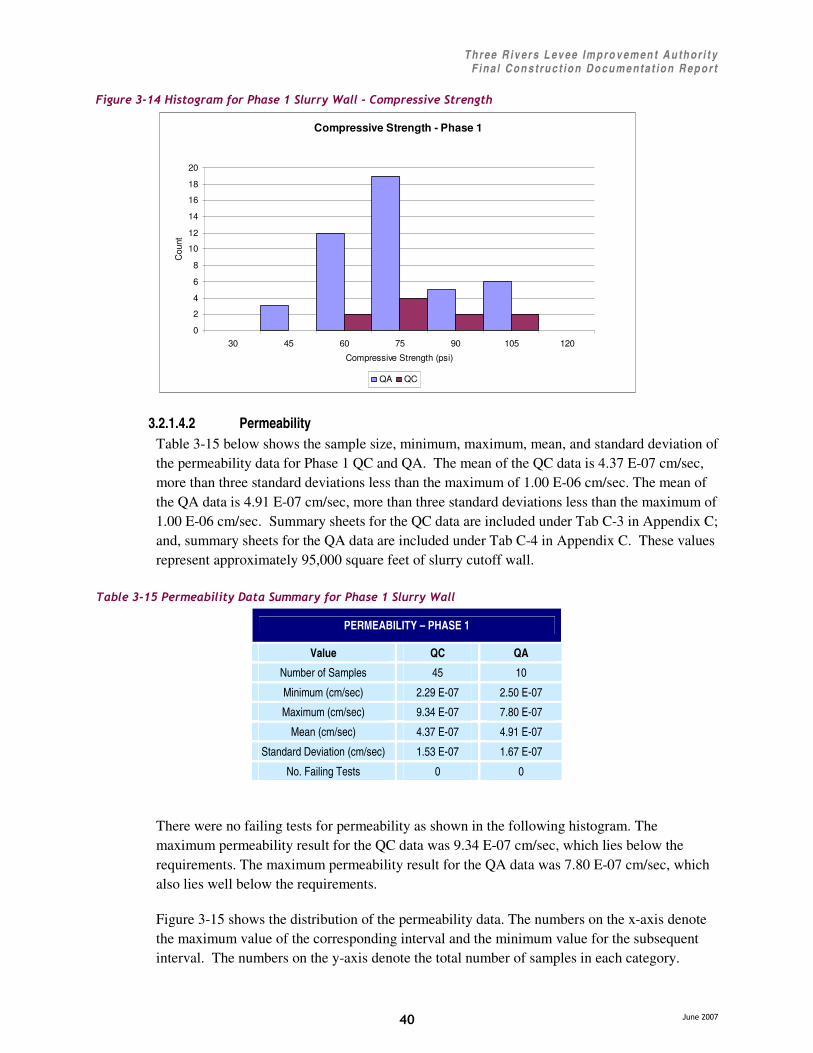
Three R iv er s L ev ee Impro v emen t Au thor i t y F ina l Con s truc t ion Do cume nta t ion R epor t
� ����������
� &�
�������"�#�. �������� �����������������!�) �������� ������ ����� ����
Compressive Strength - Phase 1
0
2
4
6
8
10
12
14
16
18
20
30 45 60 75 90 105 120
Compressive Strength (psi)
Cou
nt
QA QC
3.2.1.4.2 Permeability Table 3-15 below shows the sample size, minimum, maximum, mean, and standard deviation of the permeability data for Phase 1 QC and QA. The mean of the QC data is 4.37 E-07 cm/sec, more than three standard deviations less than the maximum of 1.00 E-06 cm/sec. The mean of the QA data is 4.91 E-07 cm/sec, more than three standard deviations less than the maximum of 1.00 E-06 cm/sec. Summary sheets for the QC data are included under Tab C-3 in Appendix C; and, summary sheets for the QA data are included under Tab C-4 in Appendix C. These values represent approximately 95,000 square feet of slurry cutoff wall.
� �����"�$����� �������!�*������ � ��!�����������������!�) ����
PERMEABILITY – PHASE 1
Value QC QA
Number of Samples 45 10
Minimum (cm/sec) 2.29 E-07 2.50 E-07
Maximum (cm/sec) 9.34 E-07 7.80 E-07
Mean (cm/sec) 4.37 E-07 4.91 E-07
Standard Deviation (cm/sec) 1.53 E-07 1.67 E-07
No. Failing Tests 0 0
There were no failing tests for permeability as shown in the following histogram. The maximum permeability result for the QC data was 9.34 E-07 cm/sec, which lies below the requirements. The maximum permeability result for the QA data was 7.80 E-07 cm/sec, which also lies well below the requirements.
Figure 3-15 shows the distribution of the permeability data. The numbers on the x-axis denote the maximum value of the corresponding interval and the minimum value for the subsequent interval. The numbers on the y-axis denote the total number of samples in each category.

Three R iv er s L ev ee Impro v emen t Au thor i t y F ina l Con s truc t ion Do cume nta t ion R epor t
� ����������
� ��
�������"�$�. �������� ����������������!�) ��������� �������!�
Permeability - Phase 1
0
2
4
6
8
10
12
14
16
2.0E-07 3.0E-07 4.0E-07 5.0E-07 6.0E-07 7.0E-07 8.0E-07 9.0E-07 1.0E-06 1.1E-06
Permeability (cm/sec)
Cou
nt
QC QA
3.2.1.5 Test Data Summary – Phase 2 3.2.1.5.1 Compressive Strength
Table 3-16 below shows the sample size, minimum, maximum, mean, and standard deviation of the compressive strength data for Phase 2 QC and QA. The mean of the QC data is 78 psi, more than two standard deviations greater than the minimum of 30 psi. The mean of the QA data is 69 psi, more than four standard deviations greater than the minimum of 30 psi. Summary sheets for the QC data are included under Tab C-16 in Appendix C; and, summary sheets for the QA data are included under Tab C-17 in Appendix C. These values represent approximately 70,000 square feet of slurry cutoff wall.
� �����"�2���� ������ ����� ����*������ � ��!�����������������!�) �����
COMPRESSIVE STRENGTH – PHASE 2
Value QC QA
Number of Samples 14 5
Minimum (psi) 42 53
Maximum (psi) 125 77
Mean (psi) 78 69
Standard Deviation (psi) 24 9
No. Failing Tests 0 0
There were no failing tests for compressive strength. The minimum strength result for the QC data was 42 psi; and, the minimum strength result for the QA data was 53 psi. The maximum values were well within the maximum allowable strength of 300 psi.
Figure 3-16 shows the distribution of the compressive strength data. The numbers on the x-axis denote the maximum value of the corresponding interval and the minimum value for the subsequent interval. The numbers on the y-axis denote the total number of samples in each category.

Three R iv er s L ev ee Impro v emen t Au thor i t y F ina l Con s truc t ion Do cume nta t ion R epor t
� ����������
� ��
�������"�2�. �������� �����������������!�) �������� ������ ����� ����
Compressive Strength - Phase 2
0
1
2
3
4
5
6
30 45 60 75 90 105 120 135 150
Compressive Strength
Cou
nt
QC QA
3.2.1.5.2 Permeability Table 3-17 below shows the sample size, minimum, maximum, mean, and standard deviation of the permeability data for Phase 2 QC and QA. The mean of the QC data is 3.00 E-07 cm/sec, more than three standard deviations less than the maximum of 1.00 E-06 cm/sec. The mean of the QA data is 3.96 E-07 cm/sec, more than four standard deviations less than the maximum of 1.00 E-06 cm/sec. Summary sheets for the QC data are included under Tab C-16 in Appendix C; and, summary sheets for the QA data are included under Tab C-17 in Appendix C. These values represent approximately 70,000 square feet of slurry cutoff wall.
� �����"�3����� �������!�*������ � ��!�����������������!�) �����
PERMEABILITY – PHASE 2
Value QC QA
Number of Samples 14 5
Minimum (cm/sec) 1.20 E-07 2.70 E-07
Maximum (cm/sec) 9.30 E-07 5.30 E-07
Mean (cm/sec) 3.00 E-07 3.96 E-07
Standard Deviation (cm/sec) 2.12 E-07 1.12 E-07
No. Failing Tests 0 0
There were no failing tests for permeability. The maximum permeability result for the QC data was 9.30 E-07 cm/sec, which lies below the requirements. The maximum permeability result for the QA data was 5.30 E-07 cm/sec, which also lies well below the requirements.
Figure 3-17 shows the distribution of the permeability data. The numbers on the x-axis denote the maximum value of the corresponding interval and the minimum value for the subsequent interval. The numbers on the y-axis denote the total number of samples in each category.

Three R iv er s L ev ee Impro v emen t Au thor i t y F ina l Con s truc t ion Do cume nta t ion R epor t
� ����������
� ��
�������"�3�. �������� �����������������!�) ��������� �������!�
Permeability - Phase 2
0
1
2
3
4
5
6
1.0E-07 2.0E-07 3.0E-07 4.0E-07 5.0E-07 6.0E-07 7.0E-07 8.0E-07 9.0E-07 1.0E-06 1.1E-06
Permeability
Cou
nt
QC QA
3.2.1.6 Test Data Summary – Phase 4 3.2.1.6.1 Compressive Strength
Table 3-18 below shows the sample size, minimum, maximum, mean, and standard deviation of the compressive strength data for Phase 4 QC and QA. The mean of the QC data is 64 psi, nearly one standard deviation greater than the minimum of 30 psi. The mean of the QA data is 65 psi, also nearly one standard deviation greater than the minimum of 30 psi. Summary sheets for the QC data are included under Tab C-21 in Appendix C; and, summary sheets for the QA data are included under Tab C-22 in Appendix C. These values represent approximately 550,000 square feet of slurry cutoff wall.
� �����"�4���� ������ ����� ����*������ � ��!�����������#�����!�) ����
COMPRESSIVE STRENGTH – PHASE 4
Value QC QA
Number of Samples 161 158
Minimum (psi) 13 8
Maximum (psi) 239 290
Mean (psi) 64 65
Standard Deviation (psi) 37 38
No. Failing Tests 10 11
There were 10 failing QC tests and 11 failing QA tests for 7 day compressive strength as shown in the following histogram. The minimum strength result for the QC data was 13 psi, well below the requirements. The minimum strength result for the QA data was 8 psi, also well below the requirements. The maximum strength result for the QC data was 239 psi; and, the maximum strength result for the QA data was 290 psi.
Figure 3-18 shows the distribution of the compressive strength data. The numbers on the x-axis denote the maximum value of the corresponding interval and the minimum value for the

Three R iv er s L ev ee Impro v emen t Au thor i t y F ina l Con s truc t ion Do cume nta t ion R epor t
� ����������
� �
subsequent interval. The numbers on the y-axis denote the total number of samples in each category. Analysis of these results is included in Section 3.2.1.7.
�������"�4�. �������� �����������#�����!�) �������� ������ ����� ����
Compressive Strength - Phase 4
0
10
20
30
40
50
60
0 15 30 45 60 75 90 105 120 135 150 165 180 195 210 225
Compressive Strength
Cou
nt
QC QA
3.2.1.6.2 Permeability Table 3-19 below shows the sample size, minimum, maximum, mean, and standard deviation of the permeability data for Phase 4 QC and QA. The mean of the QC data is 5.41 E-07 cm/sec, more than two standard deviations less than the maximum of 1.00 E-06 cm/sec. The mean of the QA data is 5.33 E-07 cm/sec, nearly one standard deviations less than the maximum of 1.00 E-06 cm/sec. Summary sheets for the QC data are included under Tab C-21 in Appendix C; and, summary sheets for the QA data are included under Tab C-22 in Appendix C. These values represent approximately 550,000 square feet of slurry cutoff wall.
� �����"�5����� �������!�*������ � ��!�����������#�����!�) ����
PERMEABILITY – PHASE 4
Value QC QA
Number of Samples 157 132
Minimum (cm/sec) 1.10 E-07 4.00 E-08
Maximum (cm/sec) 1.00 E-06 3.60 E-06
Mean (cm/sec) 5.41 E-07 5.33 E-07
Standard Deviation (cm/sec) 2.4 E-07 5.00 E-07
No. Failing Tests 0 5
There were 5 failing QA tests; the largest are not shown on the histogram for scaling purposes. The maximum permeability result for the QC data equaled the acceptance threshold of 1.00 E-06 cm/sec. The maximum permeability result for the QA data was 3.60 E-06 cm/sec, above the requirement. Analysis of the QA data is included in Section 3.2.1.7.

Three R iv er s L ev ee Impro v emen t Au thor i t y F ina l Con s truc t ion Do cume nta t ion R epor t
� ����������
� !�
Figure 3-19 shows the distribution of the permeability data. The numbers on the x-axis denote the maximum value of the corresponding interval and the minimum value for the subsequent interval. The numbers on the y-axis denote the total number of samples in each category.
�������"�5�. �������� �����������#�����!�) ��������� �������!�
Permeability - Phase 4
0
5
10
15
20
25
30
35
40
1.0E-07 2.0E-07 3.0E-07 4.0E-07 5.0E-07 6.0E-07 7.0E-07 8.0E-07 9.0E-07 1.0E-06 1.1E-06 1.2E-06 1.3E-06
Permeability
Cou
nt
QC QA
3.2.1.7 Analysis – Phase 4 A number of failing compressive strength and permeability test results were experienced during the installation of the slurry cutoff wall in Phase 4. For compressive strength, 25 out of 319 tests failed to meet the acceptance criteria for minimum strength. For permeability, 7 out of 289 tests failed to meet the acceptance criteria for maximum permeability.
Slurry wall construction associated with Heading 2 between approximately Station 84+20 and 85+05 did not meet compressive strength requirements of 30 psi at 7 days. A majority of the failing tests in this area also failed to meet the minimum acceptance criteria at 28 days. In October 2006, the wall was removed from approximate Station 83+00 to Station 85+00 and rebuilt as Heading 5. There were 7 samples taken from Heading 5. 7 day compressive strengths for Heading 5 ranged from 36 to 112 psi, all passing the requirements. 7 day permeability results for Heading 5 ranged from 1.5 E-07 to 5.5 E-07, also meeting the acceptance criteria.
3.2.1.7.1 Compressive Strength The reconstruction of the portion of slurry cutoff wall between 83+00 and 85+00 leaves 13 total failing compressive strength results (6 QC and 7 QA). 12 of these 13 tests did achieve compressive strengths of greater than 40 psi at 28-days. Table 3-20 identifies the 6 failing QC results according to Station and depicts the 7-day and 28-day test results.
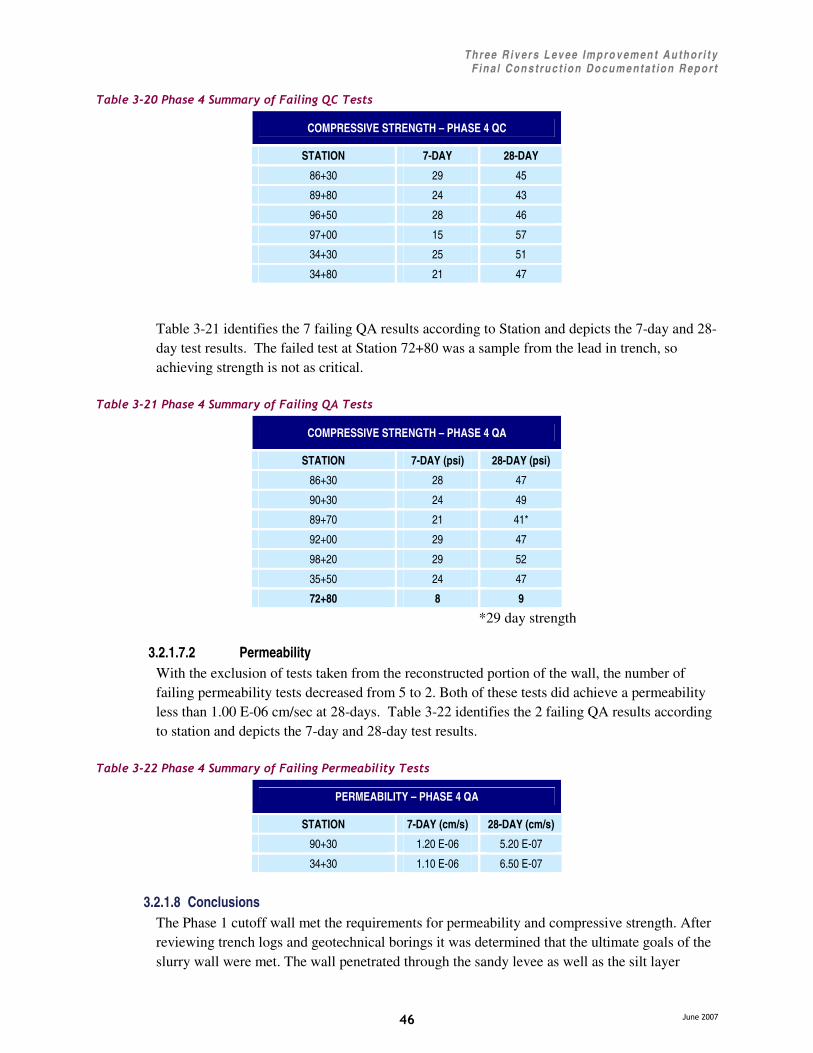
Three R iv er s L ev ee Impro v emen t Au thor i t y F ina l Con s truc t ion Do cume nta t ion R epor t
� ����������
� "�
� �����"�6�������#��� � ��!��������� ��7 ��� �����
COMPRESSIVE STRENGTH – PHASE 4 QC
STATION 7-DAY 28-DAY
86+30 29 45
89+80 24 43
96+50 28 46
97+00 15 57
34+30 25 51
34+80 21 47
Table 3-21 identifies the 7 failing QA results according to Station and depicts the 7-day and 28-day test results. The failed test at Station 72+80 was a sample from the lead in trench, so achieving strength is not as critical.
� �����"���������#��� � ��!��������� ��7 +�� �����
COMPRESSIVE STRENGTH – PHASE 4 QA
STATION 7-DAY (psi) 28-DAY (psi)
86+30 28 47
90+30 24 49
89+70 21 41*
92+00 29 47
98+20 29 52
35+50 24 47
72+80 8 9
*29 day strength
3.2.1.7.2 Permeability With the exclusion of tests taken from the reconstructed portion of the wall, the number of failing permeability tests decreased from 5 to 2. Both of these tests did achieve a permeability less than 1.00 E-06 cm/sec at 28-days. Table 3-22 identifies the 2 failing QA results according to station and depicts the 7-day and 28-day test results.
� �����"���������#��� � ��!��������� ������ �������!�� �����
PERMEABILITY – PHASE 4 QA
STATION 7-DAY (cm/s) 28-DAY (cm/s)
90+30 1.20 E-06 5.20 E-07
34+30 1.10 E-06 6.50 E-07
3.2.1.8 Conclusions
The Phase 1 cutoff wall met the requirements for permeability and compressive strength. After reviewing trench logs and geotechnical borings it was determined that the ultimate goals of the slurry wall were met. The wall penetrated through the sandy levee as well as the silt layer

Three R iv er s L ev ee Impro v emen t Au thor i t y F ina l Con s truc t ion Do cume nta t ion R epor t
� ����������
� #�
between approximate elevations 35 and 45, thereby mitigating the through seepage and shallow underseepage concerns raised in the Problem Identification Report.
The Phase 2 slurry walls met all requirements for permeability and compressive strength. The bottoms of the slurry walls were tied into the underlying clay layer to prevent through seepage as well as shallow underseepage.
The Phase 4 slurry cutoff wall met the requirements for permeability and compressive strength once the failing portion of the wall was removed. After reviewing the trench logs provided by the Contractor’s quality control, it was found that up to 6 locations may not have fully penetrated 5 feet into the underlying clay layer. We have concluded that the as-constructed cutoff wall should meet the intent of the design. Monitoring wells will be placed on the landside of the slurry wall to monitor performance of the cutoff wall. For more information regarding the installation of monitoring wells and the underlying clay layer, reference the Technical Memorandum in Appendix G titled, “Evaluation of As-Built Conditions, Yuba River Cutoff Wall (Phase 4)”. Plate 4 – Slurry Cutoff Wall As-Constructed Profiles includes profiles for each phase of work.
3.2.2 Berms 3.2.2.1 Description
Seepage berms are embankment structures of varying widths that extend outward from the landside levee toe. These embankments are designed to extend the path of through-seepage and underseepage to lower the exit gradients on the landside of the levee. These berms can be made of several different types of material or combinations of material.
Stability berms are embankments constructed on the landside levee slope to buttress or support the slope against failure. The size of these berms varies depending on the severity of the stability issues within the levee embankment and the types of materials used.
Construction of all berms was completed in accordance with Section 02331 of the construction specifications. In general, the following steps were followed for berm construction:
1. Site Preparation – This includes clearing and grubbing any trees or shrubs larger than 3 inches in diameter and the stripping of all surface vegetation to a depth of roughly 6 inches.
2. Material Placement – Once the foundation has been prepared, fill is imported and placed in lifts according to the technical specifications.
3. Revegetation – Once the berm is built to the lines and grades shown in the design drawings the surface is hydroseeded to avoid excess erosion.
3.2.2.2 Locations A total of seven berms were installed during the construction of Phases 1, 2, and 4. There were two seepage/stability berms and two seepage berms proposed for the YRLB in the Basis of Design reports for Phases 2 and 4; however, three seepage berms were added to the BRNL during Phase 2 construction. Table 3-23 summarizes the location and rationale for all berms

Three R iv er s L ev ee Impro v emen t Au thor i t y F ina l Con s truc t ion Do cume nta t ion R epor t
� ����������
� $�
installed as part of the levee improvement program. Following the table is a short description of each berm and any changes that occurred during construction.
� �����"�"�������� ������������� ���������!�&��� ��
LEVEE STATION INTERVAL ISSUE RECOMMENDED PLAN
Yuba River South Levee
1+00 to 1+40 Underseepage & Through-seepage 90 foot wide Seepage & Stability Sand Berm
Yuba River South Levee
9+00 to 26+00 Underseepage 90 foot wide Seepage Sand Berm
Yuba River South Levee
26+00 to 34+00 Underseepage & Through-seepage 300 foot wide Seepage & Stability Sand Berm
Yuba River South Levee
35+00 to 37+50 Underseepage 90 foot wide Seepage Sand Berm
Bear River North Levee
140+00 to 140+50 Underseepage 50 foot wide Random Fill Seepage Berm
Bear River North Levee
141+00 to 144+50 Underseepage 100 foot wide Random Fill Seepage Berm
Bear River North Levee
145+50 to 147+00 Underseepage 90 foot wide Random Fill Seepage Berm
Bear River North Levee
147+25 to 150+00 Underseepage 100 foot wide Random Fill Seepage Berm
3.2.2.2.1 Phase 2 Two seepage and stability berms were constructed primarily of sand along the left bank of the Yuba River. One seepage and stability berm was 40 feet long, 90 feet wide immediately west of Highway 70. The second berm is 2,500 feet long and extends from Shad Pad Road to the SPRR. The western extent is a 90 foot wide seepage berm for 1,700 feet and transitions into a 300 foot wide seepage and stability berm for 800 feet at the eastern extent. Construction was completed during the 2005 and 2006 construction seasons.
During construction of this berm, gradation testing of the sand indicated that the percentage of material passing the No. 200 sieve exceeded the allowable limit of 5%. Summary sheets for the QC data are included under Tab C-7 in Appendix C. Detailed analysis of the test results for the sand fill is included in Section 3.2. Collaboration between the design and construction team results in a revision to the allowable limit. For more information regarding this issues and the associated engineering analysis, refer to the Technical Memorandum in Appendix G titled, “Evaluation of As-Built Conditions, Yuba River Seepage Berms”.
During construction, it was determined that additional seepage berms would be needed along the north levee of the Bear River near Highway 70. Two seepage berms were constructed on

Three R iv er s L ev ee Impro v emen t Au thor i t y F ina l Con s truc t ion Do cume nta t ion R epor t
� ����������
� %�
the eastern side of Highway 70 in order to mitigate potential underseepage. An additional berm was built for the western side of the highway between the highway embankment and the newly constructed Pump Station #6. A small ditch was also filled in on the western side of the pump station to provide continuous seepage protection in this area
3.2.2.2.2 Phase 4 Phase 4 construction included a seepage berm in the transition area between the Phase 2 seepage/stability berm and the Phase 4 cutoff wall. This corner berm was located between the SPRR embankment and the left bank of the Yuba River. Adjacent to this site there is a Cemex Cement plant and the area was littered with debris and deleterious material. The design for the transition zone included the removal of all debris and the placement of the same sand material utilized for Phase 2 work to level the area out to roughly elevation 63 feet. Construction was completed in February 2007.
3.2.2.3 Test Data Construction of both the seepage and stability berms was completed in accordance with Section 02331 of the construction specifications. Tests for gradation, Atterberg Limits, and material classified were performed on the various types of import material used in this construction to ensure strict compliance with the contract requirements. A comprehensive summary of this test data is available in Section 3.2.3.3.
3.2.3 Levee Reconstruction 3.2.3.1 Levee Raise
In order to provide adequate freeboard above the design water surface, many portions of the RD 784 levee system had to be raised. Depending on the amount of additional freeboard needed, the design included either a crown-only raise or a raise of a majority of the levee prism. In general, the design team in cooperation with the independent technical review team has determined that a levee raise less than 0.5 feet will result in a crown-only raise. For freeboard deficiencies greater than 0.5 feet, a crown-only raise is not possible, because it requires an oversteepening of the levee slopes or a narrowing of the crown width. A full levee raise is required in these instances and results in expansion of the levee toe outward in the landside and/or waterside directions as required to maintain the required side slope ratios.
3.2.3.1.1 Locations Due to inadequate freeboard along the Bear River and the WPIC it was concluded that levee raises were required for a significant portion of this project reach. These raises included both full levee raises towards the western project limits and crown-only raises towards the east. The levee raises required for the Bear River are summarized in the Table 3-24.

Three R iv er s L ev ee Impro v emen t Au thor i t y F ina l Con s truc t ion Do cume nta t ion R epor t
� ����������
�!&�
� �����"�#��� � ��!����&����� � ����� ����������
Station Interval Levee Raise
122+00 to 130+00 Raise new levee crown 0.5’ (average)
130+00 to 139+00 Full levee raise 0.3’ (average) with waterside impervious zone
139+00 to 144+00 Raise Levee Crown 0.3 Feet (Average) by Full Raise (Waterside)
147+70 to 150+00 Crown-only raise by 1’ (average)
150+00 to 165+00 Crown-only raise by 2’ (average)
165+00 to 168+50 Full levee raise 2’ (average) by mid-slope landside raise and full-slope waterside raise
The WPIC included full levee raises, both waterside and landside slopes. In addition, some areas along the WPIC the crown were reshaped to meet freeboard requirements and to ensure proper drainage. The levee raises required for the WPIC are summarized in Table 3-25.
� �����"�$��� � ��!����) ������ ����������
Station Interval Levee Raise
0+00 to 137+50 Full levee raise 0.8’ (average)
205+00 to 275+70 Raise levee crown 0.5’ (average), (~1200 feet requires full levee raise of 0.9 feet average)
284+10 to 305+00 Raise crown 0.3’ (average) by full waterside raise
305+00 to 311+58 Raise crown 1.3’ (average) by full landside
312+00 to 315+00 Raise crown 0.7’ (average) by full levee raise and ditch fill
The left bank of the Yuba River required several small levee raises along the slurry wall alignment. During construction the design was changed to match the 1957 levee profile, with a slight raise towards the eastern end at Simpson Lane. In some areas, the original design elevations were as much as 1 foot above the 1957 profile. Where the 1957 profile was less than the existing ground surface, the 1957 profile was used. The location of the final levee raises taken from as-built information are summarized in Table 3-26.
� �����"�2��� � ��!����8 ����� � ����� ����������
Station Interval Levee Raise
35+00 to 42+00 0.5 feet (average)
50+00 to 55+00 0.5 feet (average)
59+00 to 76+00 0.4 feet (average)
95+00 to 104+00 0.2 feet (average)
3.2.3.1.2 Analysis For acceptance criteria, analysis and conclusion for select fill required for a levee raise, refer to Section 3.1.1.

Three R iv er s L ev ee Impro v emen t Au thor i t y F ina l Con s truc t ion Do cume nta t ion R epor t
� ����������
�!��
3.2.3.2 Levee Degrade and Restoration During construction of the slurry cutoff walls for Phases 1, 2 and 4 it was necessary to degrade the levee roughly one third of the levee height. This was done to provide a wide and stable platform for trench excavation and the slurry wall installation. In addition, the levee was degraded to minimize the risk of hydraulic fracturing along the levee slope and toe.
The levee was degraded an average of 7 feet for the construction of each slurry cutoff wall. For Phases 1 and 2, the existing levee material was used to rebuild the levee to design grade, with impervious fill used above the slurry wall create a continuous vertical seepage barrier. For Phase 4, the material was generally discarded and impervious material was placed to restore the levee to the required grade, as discussed in Section 3.1.2.4. Acceptance criteria and testing results for select and impervious fill are included in Section 3.1. Acceptance criteria and testing results for compaction and moisture content is included in sections 3.2.3.4 and 3.2.3.5.
3.2.3.3 Waterside Impervious Zone 3.2.3.3.1 Locations
The north levee of the Bear River from station 130+00 to 139+00 required the installation of a 10 foot wide waterside impervious zone. The waterside slope was excavated and then backfilled to the design grade with impervious fill to create a seepage barrier within the levee prism.
3.2.3.3.2 Acceptance Criteria For acceptance criteria for impervious fill required for waterside impervious zone construction, refer to Section 3.1.2.
3.2.3.4 Field Density 3.2.3.4.1 Description
All levee reconstruction work had requirements for compaction that had to be met according to the location of the fill material. Compaction varied for embankment fill, ditch fill and the upper 12 inches of the levee. Figure 3-20 shows the compaction and placement of fill on the Bear River key trench. Field density measurements were taken in accordance with ASTM D 1556.

Three R iv er s L ev ee Impro v emen t Au thor i t y F ina l Con s truc t ion Do cume nta t ion R epor t
� ����������
�!��
�������"�6��&����� � ���� ������� �� �� ���'1�� ���� �
3.2.3.4.2 Acceptance Criteria Requirements for compaction can be found in section 02333, paragraph 3.3.4 of the technical specifications for Phase 1, section 02331A, paragraphs 3.15.2, 3.15.3 and 3.15.4 of the technical specifications for Phase 2, and section 02331, paragraphs 3.15.2, 3.15.3 and 3.15.4 of the technical specifications for Phase 4. These requirements are outlined below;
Phase 1
1. Fill shall be compacted to 90% relative compaction (ASTM D 1557).
Phase 2 and Phase 4
1. Select Fill and Impervious Fill shall be compacted to 90% relative compaction (ASTM D 1557).
2. Select Fill and Impervious Fill shall be compacted to 95% relative compaction in upper 12 inches of levee fill (ASTM D 1557).
3. Random Fill shall be compacted to 85% relative compaction (ASTM D 1557).
4. Sand Fill shall be compacted to 70% relative density (ASTM D 4253 and ASTM D 4254).
3.2.3.4.3 Summary of Test Reports Phase 1
Table 3-27 below shows the sample size, minimum, maximum, mean, and standard deviation of the relative compaction testing for the Phase 1 levee crown, included under Tab C-2 in Appendix C. A summary and analysis of the QA test results for field density is located in Appendix G, TECHNICAL MEMORANDA. The mean of the QC data is 110%, four standard deviations above the 95% minimum requirement. There were no failing tests for relative compaction.

Three R iv er s L ev ee Impro v emen t Au thor i t y F ina l Con s truc t ion Do cume nta t ion R epor t
� ����������
�!��
� �����"�3������� ����� ������ �*������ � ��!��������������� ������- �
FIELD DENSITY – PHASE 1 LEVEE CROWN
Value QC
Number of Samples 8
Minimum 106%
Maximum 115%
Mean 110%
Standard Deviation 2.59%
No. Failing Tests 0
Figure 3-21 shows the distribution of the relative compaction data. The numbers on the x-axis denote the maximum value of the corresponding interval and the minimum value for the subsequent interval. The numbers on the y-axis denote the total number of samples in each category.
�������"���. �������� ������������������� ����� ������ ���� ������- �
Relative Compaction - Phase 1 Crown Fill
0%
50%
100%
150%
200%
250%
300%
350%
400%
450%
104% 106% 108% 110% 112% 114% 116% 118%
Relative Compaction
Cou
nt
Table 3-28 below shows the sample size, minimum, maximum, mean, and standard deviation of the relative compaction testing for the Phase 1 embankment fill, included under Tab C-2 in Appendix C. The mean of the QC data is 97%, nearly two standard deviations above the 90% minimum requirement. There were no failing tests for relative compaction.

Three R iv er s L ev ee Impro v emen t Au thor i t y F ina l Con s truc t ion Do cume nta t ion R epor t
� ����������
�! �
� �����"�4������� ����� ������ �*������ � ��!�������������'� �� 9� � �������
FIELD DENSITY – PHASE 1 EMBANKMENT FILL
Value QC
Number of Samples 94
Minimum 90%
Maximum 104%
Mean 97%
Standard Deviation 3.6%
No. Failing Tests 0
Figure 3-22 shows the distribution of the relative compaction data. The numbers on the x-axis denote the maximum value of the corresponding interval and the minimum value for the subsequent interval. The numbers on the y-axis denote the total number of samples in each category.
�������"���. �������� ������������������� ����� ������ ��'� �� 9� � �������
Relative Compaction - Phase 1 Embankment Fill
0
5
10
15
20
25
30
88% 90% 92% 94% 96% 98% 100% 102% 104% 106% 108%
Relative Compaction
Cou
nt
Phase 2
Table 3-29 below shows the sample size, minimum, maximum, mean, and standard deviation of the relative compaction testing for the Phase 2 levee crown, included under Tabs C-9, C-10 and C-12 in Appendices C. A summary and analysis of the QA test results for the select fill is located in Appendix G, TECHNICAL MEMORANDA. The mean of the QC data is 97%, over one standard deviation above the 95% minimum requirement. There were no failing tests for relative compaction.

Three R iv er s L ev ee Impro v emen t Au thor i t y F ina l Con s truc t ion Do cume nta t ion R epor t
� ����������
�!!�
� �����"�5������� ����� ������ �*������ � ��!��������������� ������- �
FIELD DENSITY – PHASE 2 LEVEE CROWN
Value QC
Number of Samples 59
Minimum 95%
Maximum 99%
Mean 97%
Standard Deviation 1.39%
No. Failing Tests 0
Figure 3-23 shows the distribution of the relative compaction data. The numbers on the x-axis denote the maximum value of the corresponding interval and the minimum value for the subsequent interval. The numbers on the y-axis denote the total number of samples in each category.
�������"�"�. �������� ������������������� ����� ������ ���� ������- �
Relative Compaction - Phase 2 Crown Fill
0
5
10
15
20
25
30
94% 96% 98% 100% 102%
Relative Compaction
Cou
nt
Table 3-30 below shows the sample size, minimum, maximum, mean, and standard deviation of the relative compaction testing for the Phase 2 toe ditch located along the western landside of the WPIC levee, included under Tabs C-9 and C-10 in Appendix C. The mean of the QC data is 93%, two standard deviations above the 85% minimum requirement. There were no failing tests for relative compaction.
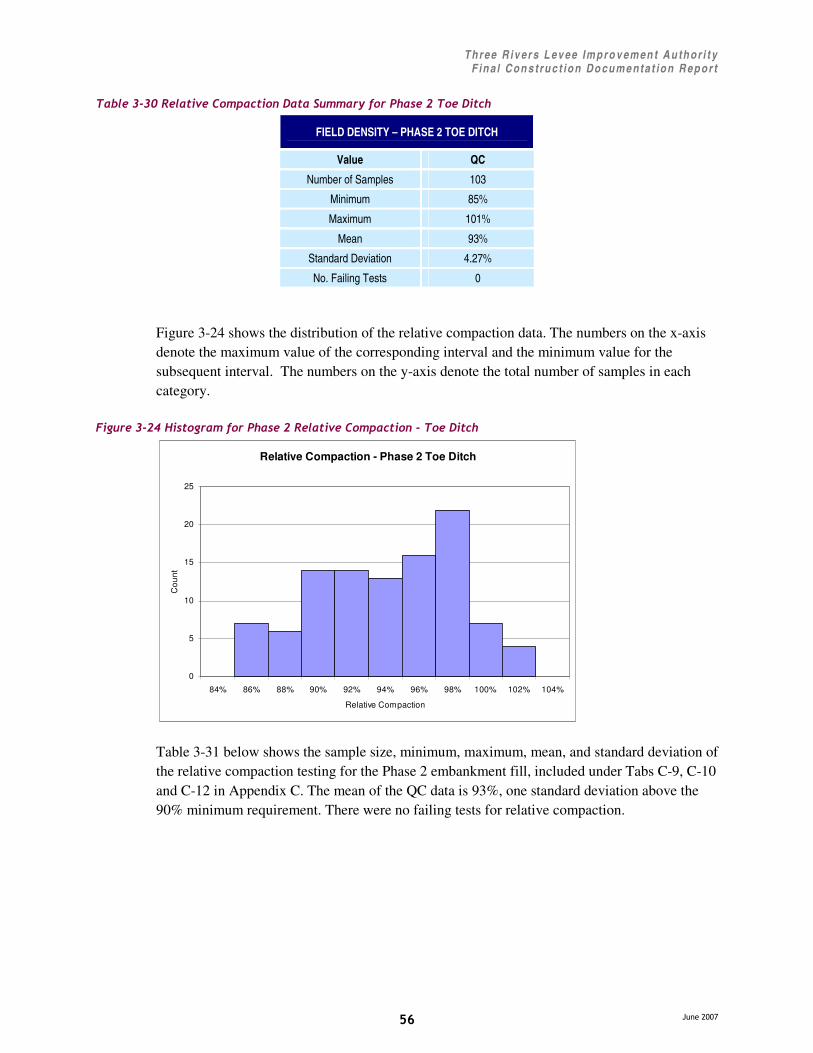
Three R iv er s L ev ee Impro v emen t Au thor i t y F ina l Con s truc t ion Do cume nta t ion R epor t
� ����������
�!"�
� �����""6������� ����� ������ �*������ � ��!�������������� ���* �����
FIELD DENSITY – PHASE 2 TOE DITCH
Value QC
Number of Samples 103
Minimum 85%
Maximum 101%
Mean 93%
Standard Deviation 4.27%
No. Failing Tests 0
Figure 3-24 shows the distribution of the relative compaction data. The numbers on the x-axis denote the maximum value of the corresponding interval and the minimum value for the subsequent interval. The numbers on the y-axis denote the total number of samples in each category.
�������"�#�. �������� ������������������� ����� ������ ��� ���* �����
Relative Compaction - Phase 2 Toe Ditch
0
5
10
15
20
25
84% 86% 88% 90% 92% 94% 96% 98% 100% 102% 104%
Relative Compaction
Cou
nt
Table 3-31 below shows the sample size, minimum, maximum, mean, and standard deviation of the relative compaction testing for the Phase 2 embankment fill, included under Tabs C-9, C-10 and C-12 in Appendix C. The mean of the QC data is 93%, one standard deviation above the 90% minimum requirement. There were no failing tests for relative compaction.

Three R iv er s L ev ee Impro v emen t Au thor i t y F ina l Con s truc t ion Do cume nta t ion R epor t
� ����������
�!#�
� �����""�������� ����� ������ �*������ � ��!�������������'� �� 9� � �������
FIELD DENSITY – PHASE 2 EMBANKMENT FILL
Value QC
Number of Samples 690
Minimum 90%
Maximum 117%
Mean 93%
Standard Deviation 2.76%
No. Failing Tests 0
Figure 3-25 shows the distribution of the relative compaction data. The numbers on the x-axis denote the maximum value of the corresponding interval and the minimum value for the subsequent interval. The numbers on the y-axis denote the total number of samples in each category.
�������"�$�. �������� ������������������� ����� ������ ��'� �� 9� � �������
Relative Compaction - Phase 2 Embankment Fill
0
50
100
150
200
250
88% 90% 92% 94% 96% 98% 100% 102% 104%
Relative Compaction
Cou
nt
Table 3-32 below shows the sample size, minimum, maximum, mean, and standard deviation of the relative density testing for the Phase 2 sand seepage berm, included under Tab C-11 in Appendix C. The mean of the QC data is 91%, nearly two standard deviations above the 70% minimum requirement. There were 2 failing tests for relative density, yet these results were extremely close to passing at 69.6% and 69.9%.
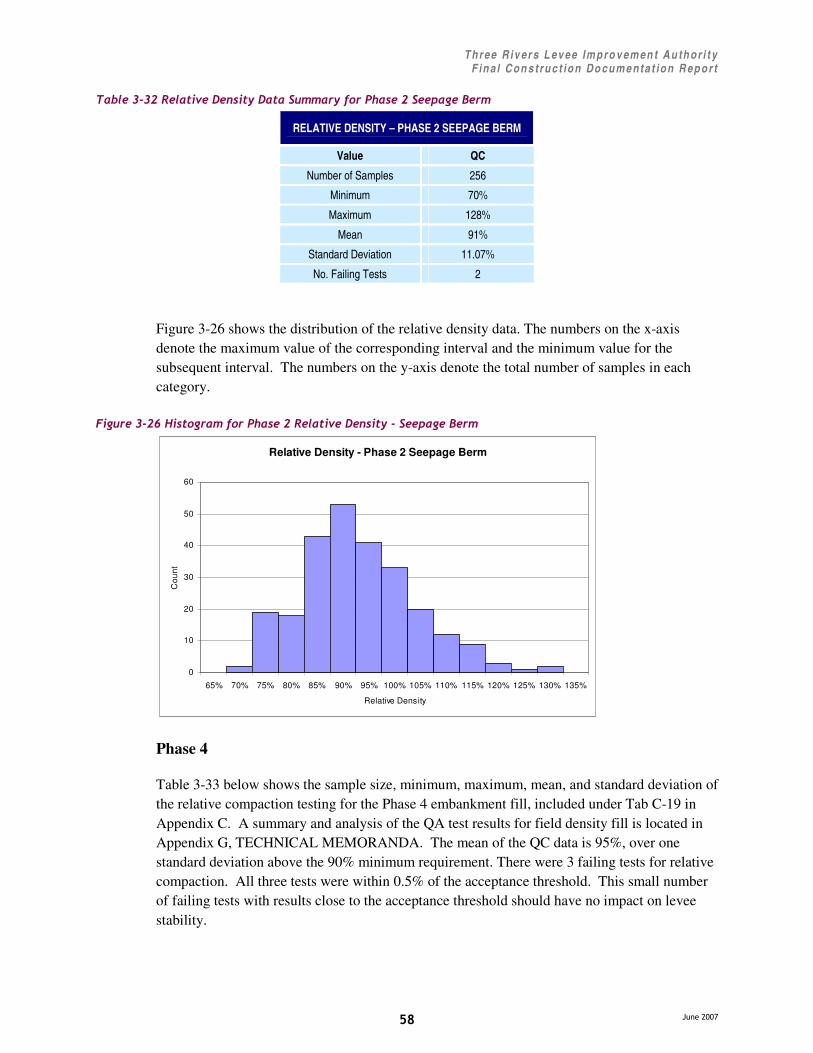
Three R iv er s L ev ee Impro v emen t Au thor i t y F ina l Con s truc t ion Do cume nta t ion R epor t
� ����������
�!$�
� �����""�������� ��*� ���!�*������ � ��!��������������������&��� �
RELATIVE DENSITY – PHASE 2 SEEPAGE BERM
Value QC
Number of Samples 256
Minimum 70%
Maximum 128%
Mean 91%
Standard Deviation 11.07%
No. Failing Tests 2
Figure 3-26 shows the distribution of the relative density data. The numbers on the x-axis denote the maximum value of the corresponding interval and the minimum value for the subsequent interval. The numbers on the y-axis denote the total number of samples in each category.
�������"�2�. �������� ������������������� ��*� ���!���������&��� �
Relative Density - Phase 2 Seepage Berm
0
10
20
30
40
50
60
65% 70% 75% 80% 85% 90% 95% 100% 105% 110% 115% 120% 125% 130% 135%
Relative Density
Cou
nt
Phase 4
Table 3-33 below shows the sample size, minimum, maximum, mean, and standard deviation of the relative compaction testing for the Phase 4 embankment fill, included under Tab C-19 in Appendix C. A summary and analysis of the QA test results for field density fill is located in Appendix G, TECHNICAL MEMORANDA. The mean of the QC data is 95%, over one standard deviation above the 90% minimum requirement. There were 3 failing tests for relative compaction. All three tests were within 0.5% of the acceptance threshold. This small number of failing tests with results close to the acceptance threshold should have no impact on levee stability.

Three R iv er s L ev ee Impro v emen t Au thor i t y F ina l Con s truc t ion Do cume nta t ion R epor t
� ����������
�!%�
� �����"""������� ����� ������ �*������ � ��!�����������#�'� �� 9� � �������
FIELD DENSITY – PHASE 4 EMBANKMENT FILL
Value QC
Number of Samples 194
Minimum 90%
Maximum 105%
Mean 95%
Standard Deviation 3.64%
No. Failing Tests 0
Figure 3-27 shows the distribution of the relative compaction data. The numbers on the x-axis denote the maximum value of the corresponding interval and the minimum value for the subsequent interval. The numbers on the y-axis denote the total number of samples in each category.
�������"�3�. �������� �����������#������� ����� ������ �
Relative Compaction - Phase 4 Fill
0
5
10
15
20
25
30
35
40
45
50
88% 90% 92% 94% 96% 98% 100% 102% 104% 106% 108%
Relative Compaction
Cou
nt
3.2.3.5 Optimum Moisture Content 3.2.3.5.1 Description
All levee reconstruction work that involved select fill and impervious fill had requirements for moisture content that had to be met during compaction. Field moisture content had to be within a set limit from the optimum moisture content calculated in the lab. Field moisture measurements were taken according with ASTM D 2216. The following statistical analysis was performed on the moisture variation of the in-field tests and the optimum moisture (in-field moisture – optimum moisture = moisture variation).
3.2.3.5.2 Acceptance Criteria Requirements for moisture content can be found in section 02333, paragraph 3.3.4 of the technical specifications for Phase 1, section 02331A, paragraph 3.15.2 of the technical

Three R iv er s L ev ee Impro v emen t Au thor i t y F ina l Con s truc t ion Do cume nta t ion R epor t
� ����������
�"&�
specifications for Phase 2, and section 02331, paragraph 3.15.2 of the technical specifications for Phase 4. These requirements are outlined below;
Phase 1
1. Moisture content shall be no more than 3% above optimum and 1% less than optimum.
Phase 2 and Phase 4
1. Moisture content shall be no more than 2% above optimum and 2% less than optimum.
3.2.3.5.3 Summary of Test Reports Phase 1
Table 3-34 below shows the sample size, minimum, maximum, mean, and standard deviation of the moisture variation for Phase 1 impervious fill, included under Tab C-2 in Appendix C. A summary and analysis of the QA test results for moisture variation is located in Appendix G, TECHNICAL MEMORANDA. The mean of the QC data is 1.9% above optimum, within the requirements. However, there were 19 failing tests for moisture variation.
� �����""#�*������ � ��!�������������� ��������: ������� �*����
MOISTURE VARIATION – PHASE 1
Value QC
Number of Samples 47
Minimum -3.3
Maximum 7.6
Mean 1.9
Standard Deviation 2.72
No. Failing Tests 19
Figure 3-28 shows the distribution of the moisture variation data. The numbers on the x-axis denote the maximum value of the corresponding interval and the minimum value for the subsequent interval. The numbers on the y-axis denote the total number of samples in each category.

Three R iv er s L ev ee Impro v emen t Au thor i t y F ina l Con s truc t ion Do cume nta t ion R epor t
� ����������
�"��
�������"�4�. �������� �������������� ��������: ������� �
Phase 1 Moisture Content Variation - Import Material
0
2
4
6
8
10
12
14
16
-4 -2 0 2 4 6 8 10
Moisture Variation
Cou
nt
Phase 2
Table 3-35 below shows the sample size, minimum, maximum, mean, and standard deviation of the moisture variation for Phase 2 impervious fill, included under Tabs C-9 and C-10 in Appendix C. A summary and analysis of the QA test results for moisture variation is located in Appendix G, TECHNICAL MEMORANDA. The mean of the QC data is 2.7% above optimum, outside the limits of the requirements. There were 421 failing tests for moisture variation.
� �����""$�*������ � ��!�������������� ��������: ������� �
MOISTURE VARIATION – PHASE 2
Value QC
Number of Samples 749
Minimum -9.5
Maximum 10.8
Mean 2.7
Standard Deviation 2.4
No. Failing Tests 421
Figure 3-29 shows the distribution of the moisture variation data. The numbers on the x-axis denote the maximum value of the corresponding interval and the minimum value for the subsequent interval. The numbers on the y-axis denote the total number of samples in each category.

Three R iv er s L ev ee Impro v emen t Au thor i t y F ina l Con s truc t ion Do cume nta t ion R epor t
� ����������
�"��
�������"�5�. �������� �������������� ��������: ������� �
Moisture Variation - Phase 2
0
50
100
150
200
250
300
-10 -8 -6 -4 -2 0 2 4 6 8 10 12 14
Moisture Variation
Cou
nt
Phase 4
Table 3-36 below shows the sample size, minimum, maximum, mean, and standard deviation of the moisture variation for Phase 4 impervious fill, included under Tab C-19 in Appendix C. A summary and analysis of the QA test results for moisture variation is located in Appendix G, TECHNICAL MEMORANDA. The mean of the QC data is 1.1% above optimum, within the limits of the requirements. However, there were 57 failing tests for moisture variation.
� �����""2�*������ � ��!�����������#�� ��������: ������� �
MOISTURE VARIATION – PHASE 4
Value QC
Number of Samples 194
Minimum -4.3
Maximum 9.2
Mean 1.1
Standard Deviation 2.60
No. Failing Tests 57
Figure 3-30 shows the distribution of the moisture variation data. The numbers on the x-axis denote the maximum value of the corresponding interval and the minimum value for the subsequent interval. The numbers on the y-axis denote the total number of samples in each category.

Three R iv er s L ev ee Impro v emen t Au thor i t y F ina l Con s truc t ion Do cume nta t ion R epor t
� ����������
�"��
�������""6�. �������� �����������#�� ��������: ������� �
Moisture Variation- Phase 4
0
10
20
30
40
50
60
70
80
-6 -4 -2 0 2 4 6 8 10 12
Moisture Variation
Cou
nt
3.2.3.5.4 Analysis Phase 1 moisture variation had 19 out of 47 samples out of specification: Phase 2 had 421 out of 749 samples out of specification and Phase 4 had 57 out of 194 samples out of specification. During construction, if the material was too wet, compaction could not be achieved. If the compaction requirement was met, it was determined in the field that the material was acceptable. There were few failing compaction tests, so it was determined that moisture content was not a limiting factor in the acceptance of the material as placed. In depth analysis of the moisture variation data can be found under Appendix G in tab G-8.
3.2.3.5.5 Conclusion The large number of failing tests for moisture variation did not adversely affect the compaction efforts for levee fill. Therefore, analysis of the results indicates that the design objectives were fulfilled
3.2.4 Miscellaneous Project Features 3.2.4.1 Pump Stations
Land use within RD 784 includes agricultural, industrial, commercial, and residential. The lands within the southern portion of RD 784 are generally agricultural; however, many land parcels to the west of the WPIC levee and SR 70 are now being developed for residential use. Land use south of the Yuba River is primarily residential but also includes minor commercial and industrial operations. The predominant flow path within RD 784 is north to south.
Drainage south of the Yuba River is primarily collected in urban drainage systems. Drainage between SR 70 and the WPIC drains into Algodon Slough on the west side of the highway. This drainage is pumped into the Bear River over the north levee at Pump Station No. 6. Drainage west of Algodon Slough typically drains to the southern portion of RD 784 at the confluence of the Bear and Feather Rivers. This water drains via agricultural canals to Pump Station No. 2 where it is pumped over the east levee of the Feather River.
Three R iv er s L ev ee Impro v emen t Au thor i t y F ina l Con s truc t ion Do cume nta t ion R epor t
� ����������
�" �
In order to accommodate increased interior drainage due to residential growth, TRLIA has funded a series of pump station relocations, additions, and upgrades. Pump Station No. 2 was relocated 150 feet further from the levee and upgraded in 2003 as part of the Site 7 Extension Contract completed by USACE. Pump Station No. 6 on the Algodon Canal was relocated 100 feet further from the levee and upgraded in 2005 as part of the construction completed during Phase 2. Finally, a new pump station was constructed on the Clark Lateral during Phase 2. This pump station was constructed in conjunction with the new Olivehurst Detention Basin northeast of East Arboga. All of the concrete unconfined compressive strength tests completed in association with the construction of the pump stations met the requirement of 4,000 psi. All earthwork (fill, compaction, etc.) were included in the analysis for the Phase 2 Select fill in Section 3.1.1.3.1. Additional acceptance criteria included shop drawings and field placement for the following: reinforcing steel, pumps, motors, piping, valves, and a variety of miscellaneous metals. All materials were approved in the field and/or by the design engineer.
3.2.4.2 Aggregate Base Aggregate base course was placed on all levee crowns upon the completion of construction to ensure reliable access for all-weather operations and maintenance activities. These roads were generally constructed with a crown sloping at a 2% grade in both directions from the centerline. The aggregate was placed 4 inches deep; and, two foot transition zones were included on both shoulders of the patrol road.
The aggregate base course was placed and tested in accordance with Section 02731 of the contract specifications. This section requires the use of Class 2 Aggregate Base as defined by Section 26 of the Caltrans Standard Specification. Furthermore, this section requires the completion of all field density testing in accordance with ASTM D 2922 to 95% of the laboratory maximum density.
3.2.4.3 Asphalt Concrete Pavement Asphalt concrete pavement was placed in two areas as part of the levee improvement program. During Phase 1, asphalt concrete pavement was placed on the levee crown near Shad Pad Road; and, during Phase 4, it was placed at the over crossing for Simpson Lane. Asphalt density testing was conducted in accordance with Section 02741 of the contract specifications. This paragraph requires the completion of all asphalt density testing in accordance with AASHTO T 230. This testing standard correlates directly with ASTM D 2726 as noted in the QC test data.
3.2.4.4 Monitoring Wells Monitoring wells are passive devices that help measure the hydraulic head within confined aquifers. Holes are drilled through a fine-grained layer (also referred to as a “blanket layer”) and a sand filter is placed within the underlying coarse grained soils. The water level in the well measures the hydrostatic head in the aquifer. Three monitoring wells were placed in two locations for this project. For additional information, reference the Technical Memorandum in Appendix G titled, “Monitoring Well Design”.
3.2.4.4.1 Phase 2 A monitoring well was constructed by Kleinfelder in February of 2007 near a suspected pin boil on the landside toe of the WPIC near Station 216+00. The well was drilled through the levee crown due to high voltage lines along the landside toe. Geotechnical investigations completed in the summer of 2006 did not identify conditions supporting the existence of a pin
Three R iv er s L ev ee Impro v emen t Au thor i t y F ina l Con s truc t ion Do cume nta t ion R epor t
� ����������
�"!�
boil. As a result, a monitoring well was constructed as a positive means to continue evaluation of this area.
3.2.4.4.2 Phase 4 Two monitoring wells were constructed by Kleinfelder in February of 2007 on the corner seepage berm on the landside toe of the left bank of the Yuba River. These wells were built to measure the effectiveness of the seepage berm and ensure that the berm was performing properly.
3.2.4.5 South Olivehurst Detention Basin In order to accommodate increased interior drainage due to residential growth, TRLIA has funded the construction of several features to improve the detention and conveyance of interior drainage. In conjunction with a new pump station constructed on the Clark Lateral, the Olivehurst Detention Basin was constructed south of Olivehurst, CA during Phase 2. The pump station and detention basin was designed by MHM, Inc. The project prevents flooding in Olivehurst through construction of a ring levee just upstream of Highway 70 to block high water from the WPIC. The detention basin stores interior drainage from the developed upstream areas and the pump station discharges this stored water when elevations in the WPIC are high. The completed basin also serves as an ecosystem restoration project for the giant garter snake and the pond turtle.
3.2.4.6 Stone Protection 3.2.4.6.1 Description
During the design analysis of the levees protecting RD 784, the potential for waterside levee slope erosion from wind-generated waves and/or high velocities of parallel flow near the bank were identified as issues that may require mitigation through the placement of stone protection (riprap). Protection measures for the waterside slope of the levees varies depending on differing conditions as described in EM 1110-2-1913. Factors that will have an impact on the levee stability due to stream flow include:
���� The flow velocity adjacent to the bank and/or levee face
���� The length of time that floodwaters are expected to act against a levee
���� The relative susceptibility of the embankment materials to erosion
These factors were considered in addition to the requirements of ETL 1110-2-221 in evaluating the need for stone protection within the project area. As a result of this analysis, stone protection was installed during the Phase 2 construction contract. The rationale for providing erosion control and bank protection is presented as follows:
���� On the Bear River levee between Stations 164+00 to 169+00, riverbank slope protection is needed to address high channel velocities and observed undercutting and erosion. It is anticipated that slope will be protected by placing rock along the entire riverbank slope near the confluence of the Bear River and WPIC.
���� On the WPIC levee between Stations 255+00 and 308+00, the need for erosion control was identified. Rock had been placed on the waterside slope of this segment of levee; however, it has been questioned whether the rock protection is inadequate or in

Three R iv er s L ev ee Impro v emen t Au thor i t y F ina l Con s truc t ion Do cume nta t ion R epor t
� ����������
�""�
disrepair. As part of the levee degrade necessary for construction of a cutoff wall, the existing rock slope protection was removed. During construction, it was noted that the existing rock was placed between Stations 275+00 and 308+00. This rock was placed during emergency actions in 1997 and was determined to be undersized.
3.2.4.6.2 Locations All stone protection was installed during the Phase 2 contract at the locations listed in Table 3-37.
� �����""3����������� ����������� �
LEVEE STATION INTERVAL ISSUE RECOMMENDED PLAN
Bear River North Levee
164+00 to 168+80 Slope Erosion, Levee Slope Scour Protection
Riverbank Slope Erosion Protection (Rock); Levee Waterside Toe Rock Berm
WPIC West Levee
255+00 to 308+00 Slope Erosion Riverbank Slope Erosion Protection (Rock)
3.2.4.6.3 Acceptance Criteria
All of the requirements associated with the quality and installation of stone protection are described in Section 02331A of the construction specifications and Drawing Numbers C-103 and C-106 of the construction plans for Phase 2. These documents require the stone protection to conform to Section 72 of the Caltrans Standard Specifications. Furthermore, they require the stone protection to incorporate the following requirement: Light, 200 lb, Method B Placement.
The contractor’s quality control provided durability reports for the stone protection based on the requirements of Section 72 of the Caltrans Standard Specifications. The coarse durability of the rock from the contractor’s source (Parks Bar Quarry) was 82.0 based on AASHTO T210.
The filter fabric that was placed below the stone protection was Mirafi® 140NC. The filter fabric met or exceeded all requirements set for in Section 02331A of the construction specifications.
3.2.4.6.4 Conclusions After the project design was completed and construction was underway, USACE requested that the design team perform calculations for rock slope protection, specifically for the Plumas Lake area, based on a reference not originally included in the Design Criteria for the project. This reference is the technical manual that accompanies the proprietary software program ACES, which is used by USACE. Calculations were completed in several iterations based on the ACES Technical reference and on Ethan Thompson’s (USACE, Hydraulics Branch) comments and suggestions, resulting in the rock slope protection design distributed as part of a construction Change Order. A number of these suggestions were based on information from USACE’s Wave Runup Analysis for the Yuba River Basin Project, General Reevaluation Phase, Yuba River Basin, CA, January 2005, which was distributed to HDR in June of 2006. Rock slope protection was placed as proposed along the WPIC from Station 255+00 to 308+00, based on these references and suggestions from USACE.

Three R iv er s L ev ee Impro v emen t Au thor i t y F ina l Con s truc t ion Do cume nta t ion R epor t
� ����������
�"#�
3.2.4.7 CalTrans Maintenance Yard As part of the levee improvement project implemented by TRLIA, the drainage for a CalTrans maintenance yard located off of North Beale Road was affected by the design and construction of the seepage berm located along the YRLB. As part of the land purchase agreement with CalTrans, TRLIA was required to design and construct a new drainage facility for Caltrans.
The criteria for the drainage of the Caltrans maintenance yard detention basin were as follows:
• Complies as much as practical with the planning/design principles adopted for drainage and flood control by Yuba County and Reclamation District 784;
• Has minimal impact to the surroundings;
• Meets or exceeds the existing capacity of the detention ponds used by the Caltrans maintenance yard;
Approximately 90% of the Caltrans maintenance yard is drained into two existing detention ponds located near the toe of the Yuba River levee. The remaining 10% of the site drains toward North Beale Road and is discharged into a storm drain pipe or a small detention pond. The volume of the two existing detention ponds located near the toe of the Yuba River levee is approximately 25,000 ft3. There are no outlets for these two ponds. If the ponds overflow, water either overflows and collects against the Yuba levee or backs up onto the maintenance yard parking area.
An approximate three foot tall berm was constructed around the detention pond to prevent water from discharging to the south. The top width is 4 feet with slopes of 2 (horizontal) to 1 (vertical) land side and 3 to 1 water side.
With the acquired property from Caltrans and the adjacent property owner, the detention pond was constructed to hold a volume 73,000 ft3. An overflow weir was installed along the northern side of the detention pond. The depth of the pond is approximately 2 feet deep with a bottom elevation of 57 feet. Due to the grade of the maintenance yard, an asphalt swale approximately 750 feet long was constructed along the northern property line of the maintenance yard to convey runoff from the maintenance yard to the detention pond.
Along with the new detention pond and swale, additional parking for Caltrans was constructed. The new parking is approximately 32 feet wide by 298 feet long extension to the west end of the maintenance yard adjacent to the new detention pond. For more information regarding this design and the associated engineering analysis, refer to the Technical Memorandum in Appendix G titled, “Recommendations for Detention Basin Construction, Yuba River Left Bank Levee”.

Three R iv er s L ev ee Impro v emen t Au thor i t y F ina l Con s truc t ion Do cume nta t ion R epor t
� ����������
�"$�
�� '���+�����HDR has concluded that all construction activities for the TRLIA levee repairs project satisfy the requirements and guidelines set forth in the construction documents. HDR was responsible for construction management during construction and had field personnel in the field during all aspects of construction to verify compliance with the specifications and drawings, as summarized in this Construction Documentation Report. HDR performed a comprehensive review of both Quality Control and Quality Assurance laboratory and field data upon construction completion to verify compliance. Any outstanding issues were resolved by the project team and any required analysis has been completed to ensure that design changes made during construction did not threaten the ultimate goals of the project to retain FEMA certification for protection from a flood that has a 1/100 chance of occurring in any given year.