Embed Size (px)
Citation preview
Construction of California’s School Characteristics Index and Similar Schools Ranks
By the Technical Design Group of the Advisory Committee for the Public Schools Accountability Act
PSAA Technical Report 00-1
APRIL 2000
Further information concerning this report can be obtained by contacting the California Department of Education, Academic Accountability Unit at (916) 319-0863.
April, 2000 PSAA Technical Report 00-1
Report of the Technical Design Group of the Advisory Committee for the
Public Schools Accountability Act of 1999
Construction of California’s 1999 School Characteristics Index (SCI) and
Similar Schools Ranks (SSRs)
This report describes the construction and interpretation of the Academic Performance Index (API) decile ranks relative to schools with similar characteristics required by the Public Schools Accountability Act of 1999 (PSAA). Because the ranking according to growth will not be available until the fall of 2000, the report focuses on the 1999 similar schools ranks (SSRs) published in April 2000. These April ranks report a school’s 1999 “base year” API relative to a selected group of similar schools.
The Technical Design Group (TDG) for the PSAA Advisory Committee is comprised of educational measurement specialists and provides technical support to the Committee. This report, developed by the TDG, is organized into seven sections:
1. A summary of the PSAA legislation pertaining to similar schools.2. The definitions and data sources for the similar characteristics defined in law.3. A description of the review and analyses undertaken by the TDG.4. A description of the approach adopted for determining SSRs.5. A discussion of the interpretation of decile ranks.6. Questions and answers about the SSRs.7. Appendices:
• Listing of TDG members and their affiliations.• Graphic displays illustrating the calculation of the SSRs.• Tables showing the descriptive statistics for elementary, middle, and high schools.• Tables showing the correlations for elementary, middle, and high schools.
Legislation
The PSAA [Section 52056(a)] requires that the system of school ranking based on the API include how growth rates compare in schools with “similar characteristics.” In addition, the API “Framework” recommends that the system of ranking include ranks by API level in comparison with schools with “similar characteristics.” Although the law does not specify what methodology should be used to identify schools with similar characteristics
1
April, 2000 PSAA Technical Report 00-1
for purposes of ranking, during the Senate hearings on SB 1X1 it was suggested that regression models be used in school ranking.
The PSAA specifies that similar characteristics include, but are not limited to, the following characteristics, insofar as data are available from the California Department of Education (CDE):
• Pupil mobility• Pupil ethnicity• Pupil socioeconomic status• Percentage of teachers who are fully credentialed• Percentage of teachers who hold emergency credentials• Percentage of pupils who are English language learners• Average class size per grade level• Whether the schools operate multi-track year-round educational programs
Definitions and Data Sources for Similar Characteristics
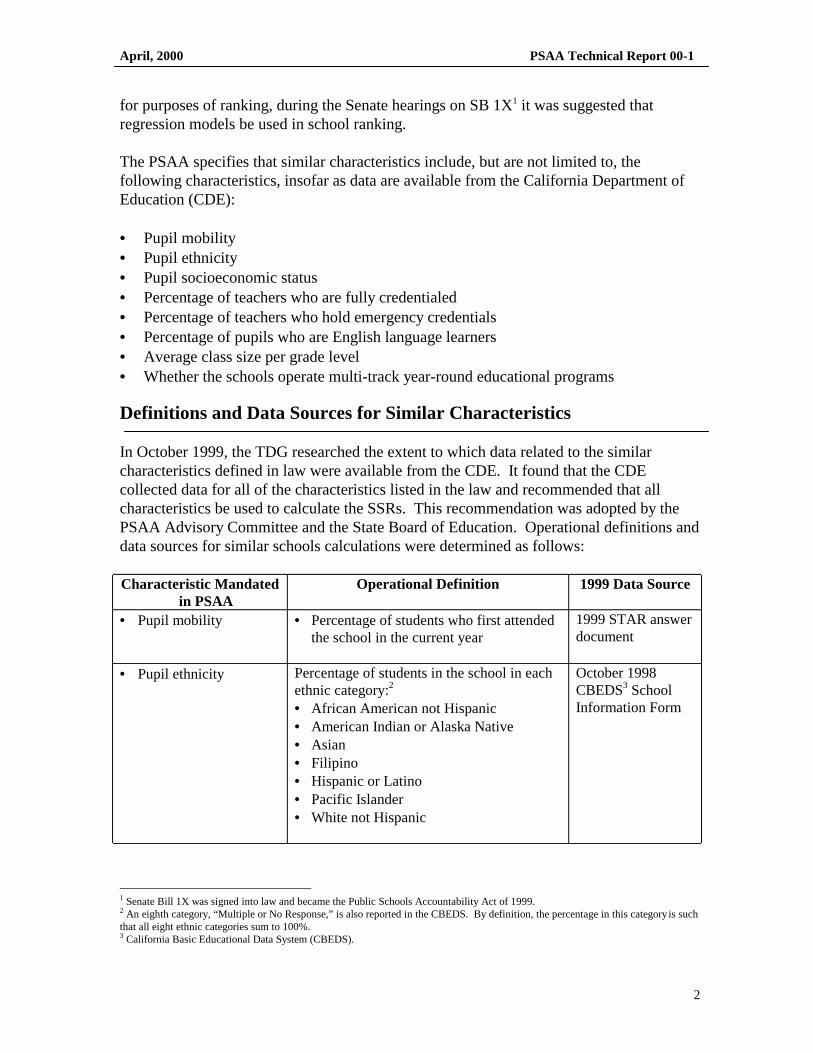
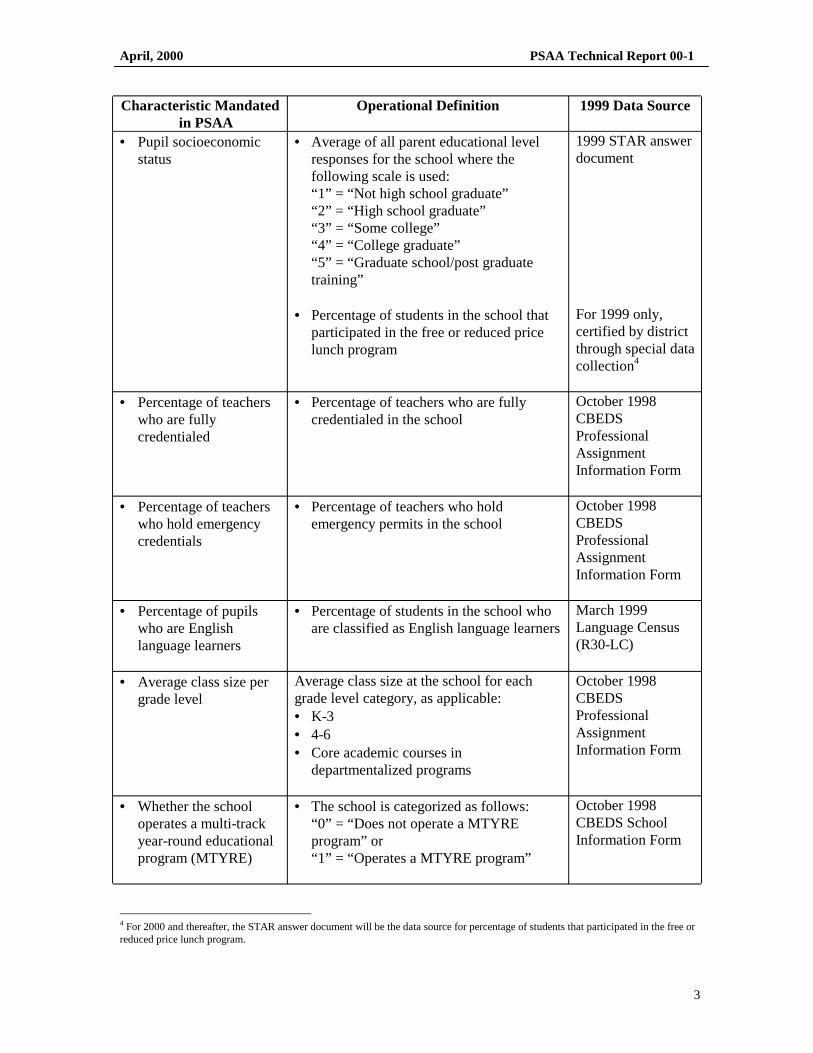
In October 1999, the TDG researched the extent to which data related to the similar characteristics defined in law were available from the CDE. It found that the CDE collected data for all of the characteristics listed in the law and recommended that all characteristics be used to calculate the SSRs. This recommendation was adopted by the PSAA Advisory Committee and the State Board of Education. Operational definitions and data sources for similar schools calculations were determined as follows:
Characteristic Mandated Operational Definition 1999 Data Source in PSAA
• Pupil mobility • Percentage of students who first attendedthe school in the current year
1999 STAR answer document
• Pupil ethnicity Percentage of students in the school in each ethnic category:2
• African American not Hispanic• American Indian or Alaska Native
October 1998 CBEDS3 School Information Form
• Asian• Filipino• Hispanic or Latino• Pacific Islander• White not Hispanic
1 Senate Bill 1X was signed into law and became the Public Schools Accountability Act of 1999.2 An eighth category, “Multiple or No Response,” is also reported in the CBEDS. By definition, the percentage in this category is suchthat all eight ethnic categories sum to 100%.3 California Basic Educational Data System (CBEDS).
2
April, 2000 PSAA Technical Report 00-1
Characteristic Mandated Operational Definition 1999 Data Source in PSAA
• Pupil socioeconomicstatus
• Average of all parent educational levelresponses for the school where thefollowing scale is used:“1” = “Not high school graduate”“2” = “High school graduate”“3” = “Some college”“4” = “College graduate”“5” = “Graduate school/post graduatetraining”
1999 STAR answer document
• Percentage of students in the school thatparticipated in the free or reduced pricelunch program
For 1999 only, certified by district through special data collection4
• Percentage of teacherswho are fullycredentialed
• Percentage of teachers who are fullycredentialed in the school
October 1998 CBEDS Professional Assignment Information Form
• Percentage of teacherswho hold emergencycredentials
• Percentage of teachers who holdemergency permits in the school
October 1998 CBEDS Professional Assignment Information Form
• Percentage of pupilswho are Englishlanguage learners
• Percentage of students in the school whoare classified as English language learners
March 1999 Language Census (R30-LC)
• Average class size pergrade level
Average class size at the school for each grade level category, as applicable: • K-3
October 1998 CBEDS Professional
• 4-6 Assignment • Core academic courses in Information Form
departmentalized programs
• Whether the schooloperates a multi-trackyear-round educational
• The school is categorized as follows:“0” = “Does not operate a MTYREprogram” or
October 1998 CBEDS School Information Form
program (MTYRE) “1” = “Operates a MTYRE program”
4 For 2000 and thereafter, the STAR answer document will be the data source for percentage of students that participated in the free or reduced price lunch program.
3
April, 2000 PSAA Technical Report 00-1
Data from the Standardized Testing and Reporting (STAR) program are for grades 2 through 11. Data from the California Basic Educational Data System (CBEDS) and Language Census are for grades K-12. Where possible, the preference of the TDG was to use schoolwide variables from CBEDS and the Language Census as opposed to variables available through STAR because the schoolwide variables represent the total school population as opposed to the tested population only. This approach best captures the characteristics of the school, which is the intent of the legislation.
Review and Analyses Conducted by Technical Design Group
Any evaluation of the method for determining similar schools should first consider the purpose for conducting the comparison. Some states use comparable schools ranking for rewards or sanctions. However, the PSAA requires such ranking only to provide additional contextual information about a school's performance and progress. It cannot be stated too strongly that the ultimate goal is for all of California's students, and therefore all of California's public schools, to meet the same high achievement standards. The absolute, unadjusted API is of primary importance in showing how well a school is performing, and how much it needs to improve to reach the performance target expected of all schools.
At the same time, it must be recognized that California's public schools serve student populations with different backgrounds and different needs. These students' homes and communities differ in the amounts and kinds of support they are able to provide for school learning. As a result, different schools face different challenges and opportunities in meeting the needs of the learners they serve. For this reason, it is also valuable and informative to examine a school's performance relative to that of other schools similarly situated. There are two broad purposes for comparisons to similar schools. First, they can provide a context for interpreting the absolute level of the API. Second, in developing its local school improvement plan, a school may identify promising practices by looking to higher performing schools with similar characteristics.
There are two parts to the construction of ranks relative to schools with similar characteristics. First, a procedure must be chosen for identifying comparable schools. Second, a procedure must be chosen for comparing the performance of each school to that of its comparison group.
The most obvious way to define "similar schools" would be to match as closely as possible on each separate characteristic specified in the legislation. Thus, two schools would be considered similar if they had the same levels of pupil mobility and socioeconomic status, the same mix of pupil ethnicities, the same percentages of English-language learners, of fully credentialed teachers, of teachers on emergency permits, and so forth. Unfortunately, it is almost never possible to find more than a handful of schools that match in all these ways. In order to form groups of similar schools that are large enough to provide meaningful ranks, it is necessary to allow for trade-offs among the separate characteristics.
4
April, 2000 PSAA Technical Report 00-1
The overall challenge and opportunity faced by one school with relatively more English language learners may be similar to that faced by another school serving students with slightly lower socioeconomic status, for example. Such trade-offs are determined by a well known and widely used statistical procedure known as multiple linear regression. The regression-based approach to forming groups of similar schools will match schools according to predicted scores. It should be noted that if two schools were in fact the same for each separate characteristic, then matching according to predicted scores would always place them in the same group. Matching according to predicted scores allows for, but does not require, trade-offs among different characteristics.
Methods in Common Use for Defining Similar Schools
At the request of the PSAA Advisory Committee, the TDG reviewed various methods of defining similar schools within the context of a statewide accountability system. Various methods have different properties. For example, with some methods but not others, if School B is in School A's comparison group, then School A must also be in School B's comparison group (property of symmetry). With some methods, if School A is comparable to School B and School B is comparable to School C, then School A must be comparable to School C (property of transitivity). These features may make a comparison method easier to understand or more intuitively appealing, but are not otherwise of major importance. For some methods, the comparison groups constructed for different schools will have similar variances. This is desirable because it means that the comparison groups for all schools provide about the same degree of similarity or "closeness." Finally, the available methods differ in their simplicity and ease of explanation.
The Technical Design Group considered the following possible methods.
• Strata defined by demographic characteristics
Perhaps the earliest method of adjusting for school background characteristics was todefine broad strata according to just a few characteristics, such as urbanization. Anillustration would be the norms some publishers provide for large-city schools. Thesemethods create a small number of school categories, and each school is compared toothers in the same category. In the mid-1980s, for example, Massachusetts used asystem with seven strata, including "Urbanized Centers," "Economically DevelopedSuburbs," "Growth Communities," and "Resort/Retirement and Artistic," amongothers. This method could not be used for present purposes in California, because thevariables specified in the legislation are defined at the level of schools, not cities ordistricts.
• Campus comparison groups
The approach currently used in Texas for constructing each school's comparison groupis a linear, step-by-step selection method. The method identifies a unique "campuscomparison group" of 40 campuses for each school. The method begins with the
5
April, 2000 PSAA Technical Report 00-1
definition of a set of characteristics of each school, including percents in various ethnic groups, percent economically disadvantaged, percent mobile, and percent limited-English proficient (LEP). An order of dominance is determined for each school by ranking these characteristics of the school from highest to lowest percent. An initial group of 100 schools is selected on the basis of similarity with respect to the most dominant characteristic of the individual campus. Schools are then discarded from that initial group in a series of steps, on the basis of dissimilarity with respect to successively less dominant characteristics, until just 50 comparison campuses remain. Finally, of these, the 10 campuses with the most dissimilar of the less predominant characteristics are eliminated to bring the group size to 40. Although this method is straightforward procedurally and relatively easy to explain, it has no clear statistical basis. It produces sub-optimal selection, requires assuming a common metric for all variables, and results in varying degrees of heterogeneity of comparison groups.
• Proximate schools in multidimensional space
A more sophisticated matching method was used for reporting similar schools whenthe California Learning Assessment System (CLAS) was initiated in 1993 asCalifornia’s statewide testing program. Each school was located in a multidimensionalspace defined by several background characteristics, including percent mobility,percent LEP, percent Aid to Families with Dependent Children (AFDC), and meansocioeconomic status (measured at grade 4 using parent occupation and at grades 8 and10 using parent education). The Mahalanobis distance from an individual school toeach school in the state was calculated, and the 100 schools with the smallest distancesto an individual school formed its comparison group. The Mahalanobis distance waschosen since the demographic variables used were correlated. Computationallysimpler functions such as the Euclidean distance assume that the variables arerepresented by orthogonal (i.e., right-angled) axes. This occurs only when thevariables in question are independent of one another. For correlated data such asschool background characteristics, this would have been an untenable assumption.Using the Mahalanobis distance overcame this difficulty by incorporating informationon the relationships among the background variables, as represented by the covariancematrix. (If the variables were uncorrelated, then the Mahalanobis distance wouldreduce to the Euclidean distance for standardized variables.) This method has thedisadvantage of being very complex and difficult to explain to the non-technicalreader. In addition, it becomes computationally infeasible as the number ofbackground characteristics increases. With even a moderate number of highlycorrelated variables, the covariance matrix will be poorly conditioned, and the weightsdefining the Mahalanobis distance may become unstable. Note that although thePSAA legislation lists only eight characteristics, some of these, such as ethnicity, arerepresented by multiple variables. For this reason, the total number of variables to beused in defining SSRs is much greater than eight. The method of locating proximateschools in multidimensional space was considered by the TDG, but rejected asinfeasible.
6
April, 2000 PSAA Technical Report 00-1
• Fixed region method
A “fixed region method” was created by the TDG in an effort to produce a moredescriptive set of comparison groups for schools. This method involved a step-by-stepselection/elimination process based upon the characteristics of the individual school.The selection of a pool of similar schools occurred by using fixed-range definitions of“similar” with respect to each background characteristic. In this way, schools wereselected based upon whether the values of their school characteristics matched (withina fixed percentage range) the values of the individual school’s characteristics.
When this method was tried with only two or three variables, it resulted in largevariations in comparison group sizes, with some schools having hundreds of schools intheir comparison group and other schools having very few. To some extent thisproblem was alleviated by incrementally relaxing the criteria for schools that had veryfew comparison schools. However, the resulting comparison groups tended to becomequite dissimilar to the target school. Moreover, as more background characteristicswere introduced into the procedure, the sizes of comparison groups for nearly allschools became very small (less than 10, often zero), even with very broad matchingcriteria. Consequently, after considerable piloting, it was finally eliminated fromfurther consideration by the TDG.
All of the methods discussed so far have attempted to match schools based on separatecharacteristics. As explained at the beginning of this section, another class of methodsallows for trade-offs between the effects of different background characteristics on theoverall educational challenge a school faces. These methods combine variousbackground characteristics into a single index predictive of overall academicperformance. It is important to understand that a school's actual achievement does notenter into the calculation of this index. It is based strictly on measured backgroundcharacteristics. However, the actual achievement of all schools collectively isconsidered at an intermediate point in the calculation of the optimum weights forconstructing the predictive index. This report turns next to these predictive index-based methods.
• Fixed comparison bands
The final two methods considered for constructing comparison groups each begin withthe calculation of a School Characteristics Index (SCI). This index is a compositemeasure of a school’s background characteristics. With the fixed comparison bandsmethod, schools are grouped on the basis of their location within fixed ranges of thevalue of the SCI.
The SCI is computed in several steps. For each school, the value of an indicatorrepresenting overall school performance is determined. In the present instance, this isthe base-year API. This performance value is used as the dependent variable in a
7
April, 2000 PSAA Technical Report 00-1
multiple linear regression, and several school-level demographic variables (background characteristics) are used as the independent variables. In this case, the independent variables are all of the demographic variables listed on pages 2 and 3. After the coefficients of the regression are estimated, an index is created using these coefficients as “weights” for the demographic variables. This statistical procedure yields the unique linear composite measure of background characteristics that is the best possible predictor of overall school performance (“best” in the sense of yielding the smallest sum of squared deviations between actual and predicted scores). It captures all of the variation in school performance that can possibly be attributed to the set of measured background characteristics included in the analysis.
The index for a school can be interpreted as representing that part of performance attributable to, or "explained by," the background variables. Thus, schools with indexes close in numerical value may be described as facing similar overall educational challenges and opportunities. The index should largely reflect variables outside of the control of the school. For example, “hours of homework” should not be included as one of the background characteristics in the model, because it is best regarded as something under the school's control, not as part of the out-of-school context that defines the degree of challenge the school faces. Methods based on a School Characteristics Index can result in sound, stable comparisons across years and academic content areas. However, because no method for comparing schools can include perfect measurements of all of the relevant factors, this method may produce comparison groups that are similar according to the overall impact of those variables used in the model, but very different in other aspects.
Once the SCI is calculated, the fixed comparison bands method proceeds as follows. First, all schools are ranked according to their values of the SCI. Next, fixed cutoffs defining comparison bands are established. For example, the bottom 20 percent of schools according to SCI, the next 20 percent, and so forth might be specified. A school's comparison group consists of all the schools in the same comparison band. One disadvantage of the fixed comparison bands method is that a school near the top of its band is advantaged, because it is compared mainly to schools predicted to have lower performance. Conversely, a school near the bottom of its band is placed at a disadvantage. Also, small year-to-year variations in different schools' background characteristics can cause borderline schools to move back and forth between the top of one band and the bottom of another, resulting in highly unstable ranks for those schools.
• Floating comparison bands
The final approach considered was the floating comparison bands method. It wasadopted in the late 1980s by the California Assessment Program (CAP), California’sstatewide testing program from 1972 to 1992.
8
April, 2000 PSAA Technical Report 00-1
The floating comparison bands method begins with the calculation of a School Characteristics Index, as before. Schools are again rank-ordered according to their values of the SCI. Then, with the floating comparison bands method, rather than setting fixed cutoffs, a comparison group for each school is formed by locating that school at the median of its own group. In the CAP implementation, treating a given school’s index as a median, its comparison group was formed by taking the 10 percent of schools immediately above and the 10 percent of schools immediately below according to their indexes. If there were 1000 schools in the list, for example, the comparison group for the school ranked 247 would include those schools ranked 147 through 246 and 248 through 347. For those schools within 10 percent of either the top or the bottom of the statewide distribution, the comparison group became either the top 20 percent or the bottom 20 percent of all schools, as appropriate.
This approach provides greater equity for schools within each comparison band, and greater stability near boundaries. However, schools at the top and bottom of the statewide distribution still face the possibility that their index values will not be at the center of those for their comparison groups.
Summary and Conclusions
An ideal method would yield, for each individual school, a comparison group that closely resembled it in all respects. Unfortunately, such ideal comparison groups simply cannot be found. After carefully considering the various stratification methods and the method of finding proximate schools in multidimensional space, and after a series of unsuccessful attempts at implementing a fixed region method, the TDG concluded that the intent of the legislation could best be realized using a regression-based approach that allowed for tradeoffs in the effects of different school background characteristics.
The TDG adopted a floating comparison bands method based on ranking according to a regression-based School Characteristics Index (SCI). The actual implementation of this method is explained in detail in the next section of this report.
Approach Adopted for Determining Similar Schools Ranks
A composite index for a school, called its School Characteristics Index (SCI), was computed and used in conjunction with its API to rank the school compared to 100 other schools with the most similar characteristics. True to the intent of the legislation, the floating comparison bands approach combines all of the similar characteristics defined in law in the most statistically efficient way.
9
April, 2000 PSAA Technical Report 00-1
Calculation of Similar Schools Ranks
The calculation of the 1999 SSRs involved four steps.
Step 1: Schools were divided into grade level categories.
Schools that received a 1999 API received a SSR. Several details of the population of schools receiving an API and of the population of students included in those calculations need to be specified. First, the API was calculated for all California public schools except for schools with fewer than 100 valid Stanford 9 test scores, schools under the jurisdiction of a county board of education or a county superintendent of schools, community day schools, and alternative schools, including continuation high schools. All charter schools with 100 or more valid Stanford 9 test scores are included.
Second, in deriving a school’s API, the following exclusion rules were used:
1. A student record was excluded if the test administration accommodation forthe student was more than one grade out of level (e.g., a sixth grader testedlower than 5th grade or higher than 7th grade).
2. A record was excluded if any of the following four test administrationaccommodations were marked “yes” for all content areas:
a. Brailleb. Flexible schedulingc. Revised test formatd. Use of aids and/or aides
3. A particular content area of a record was excluded if the percentile rank forthat content area was not between 1 and 99.
4. A particular content area of a record was excluded if the test administrationaccommodation for that content area was marked “yes” for any of the fourreasons under #2 above.
5. A record was excluded if the student first attended the district in the currentyear as indicated on the STAR header sheet.
For the similar schools ranking, schools receiving an API were divided into three categories: elementary, middle, and high. Steps 2 through 4 were then conducted separately for each category.
Step 2: State level regression coefficients were computed.
The API values for all schools were used as the dependent variable in a multiple linear regression, and the characteristics specified in the PSAA were used as the independent variables. The raw regression coefficients calculated in this step were used in Step 3 to calculate the SCI.
10
April, 2000 PSAA Technical Report 00-1
Several additional details of these analyses need to be specified. First, because schools vary widely in size, each school was weighted in the regression according to the number of pupils for whom valid test scores were provided.
Second, because the sum of the percent of teachers who are fully credentialed plus the percent who hold emergency permits is at or near 100 percent for virtually all schools, these two variables have a very high negative correlation. To improve the accuracy and stability of the regression analyses, the weights given to these two variables were constrained to be of the same magnitude with opposite signs. Operationally, this was accomplished by combining them into a single variable for purposes of analysis, equal to percent fully credentialed minus percent on emergency permits. A single regression coefficient was estimated for this composite of the two variables. A similar operation was conducted for the ethnic percentages, which by definition sum to 100 (see below).
Third, a linear transformation was applied to all API values to express the SCI on a scale of 100 to 200.5 This transformation has no effect whatsoever on school ranks or comparison groups. It is intended to minimize confusion between the API and the SCI, and to discourage misinterpretations based on direct comparison of schools' API and SCI values.
Fourth, because the background characteristics are correlated, it can easily happen that even though the simple correlation of some characteristic with the API is positive (or in the intuitively plausible direction), the partial correlation of that characteristic with API controlling for ("holding constant") all of the other variables in the equation is negative (or opposite the intuitively plausible direction). When this occurs, the sign of the regression coefficient will also be counterintuitive. These occasional counterintuitive coefficients tend to be near zero, and dropping the corresponding variables from the equation has virtually no effect on the calculated SCIs. In effect, the influence of such a variable is fully accounted for through its association with other variables that remain in the equation. Because such small, counterintuitive coefficients are difficult to explain, the TDG recommended dropping variables with counterintuitive coefficients from the equation. This variable elimination was done stepwise so that the maximum possible set of predictors could be included.
Fifth, the regression model was modified to produce more accurate estimates for schools in which the reporting of parent education was seriously incomplete. The TDG took the position that it is the responsibility of schools and districts to assure that reported data are accurate and complete. However, parent education differs from all of the other background characteristics in the sense that some
5 The transformation was (API divided by 8) plus 75.
11
April, 2000 PSAA Technical Report 00-1
parents may have principled objections to providing this information. In order to provide the fairest possible comparisons among schools with different proportions of available information on parent education, two separate regression models were constructed, one with and one without the parent education variable. The regression model including parent education was based solely on schools reporting parent education level for at least 50 percent of the tested students. As will be explained in Step 3 below, the final SCIs for all schools were calculated by taking a weighted average of the SCIs obtained from those separate models.
Finally, as explained in footnote 2 on page 2, the variables giving percents of students in the eight ethnic categories sum to a constant, 100 percent. For that reason, the actual regressions were run omitting one of these categories. The omitted category was in effect absorbed into the constant (intercept) term in the regression equation. To simplify the explanation of how the SCI is calculated and to clarify that percents in all ethnic categories are in fact represented, a simple algebraic reexpression was used to present the equation in a form omitting the constant term but including weights for the percents in all eight ethnic categories. This form of the equation is mathematically identical to the original equation.
Step 3: A School Characteristics Index (SCI) for each school was calculated.
For each school category (elementary, middle, high), Step 2 yielded two sets of coefficients for the various measured background characteristics. One set of coefficients was for a model including parent education, and the other was for a model excluding parent education. These coefficients were used to calculate a School Characteristics Index (SCI) for each individual school as follows. First, two SCI component scores were calculated, separately, using the coefficients from the two separate models. The reported value of each demographic characteristic for the school was multiplied by the corresponding coefficient. The resulting products were then summed to obtain an SCI component. Finally, the two SCI components were combined to obtain the SCI for the school.
The weights for combining the two SCI components were (1) the proportion of pupils for whom parent education was available and (2) the proportion of pupils for whom parent education was not available. These weights vary from school to school, depending on the reported information. Each SCI component was multiplied by its respective weight. The results of these two multiplications were then added together. For example, if a school reported actual parent education for 80 percent of its students, its final SCI would be:
SCI = (.80 multiplied by First SCI Component) plus (.20 multiplied by Second SCI Component)
12
April, 2000 PSAA Technical Report 00-1
Step 4: The similar schools decile rank for each school was generated.
For an individual school, a comparison group of 100 schools was formed by treating that school’s SCI as a median and taking the 50 schools immediately above and the 50 immediately below according to their SCIs. In the event that the individual school’s SCI was within 50 of either the top or the bottom of the statewide distribution, that school’s comparison group was formed by taking either the top 100 or bottom 100 schools (excluding the original school), as appropriate.
Once the schools were chosen, attention turned from their background characteristics to their actual performance. The 100 schools in the comparison group were sorted according to the value of their 1999 APIs, and divided into decile groups. The API of the individual school was then compared to the APIs of the schools in its comparison group. The individual school was assigned the appropriate decile rank based upon the value of its API.
Appendix B beginning on page 21 includes graphic displays illustrating the calculation of the 1999 SSRs.
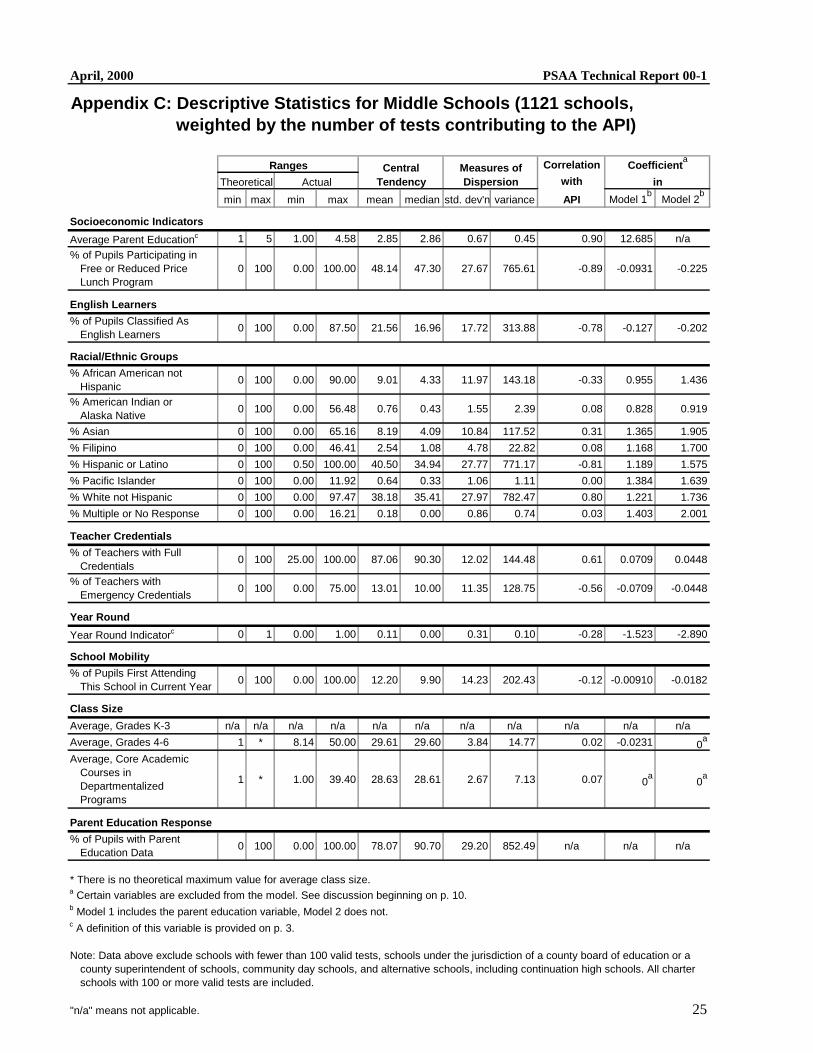
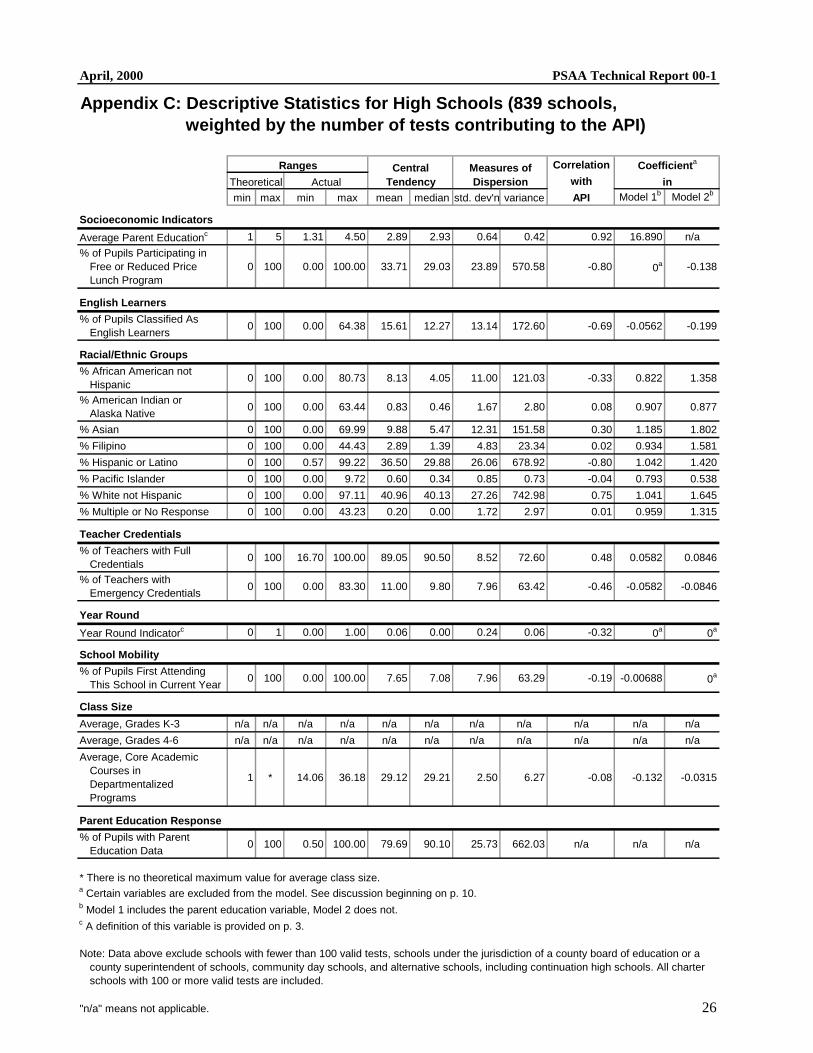
Appendix C beginning on page 24 provides the descriptive statistics for elementary, middle, and high schools.
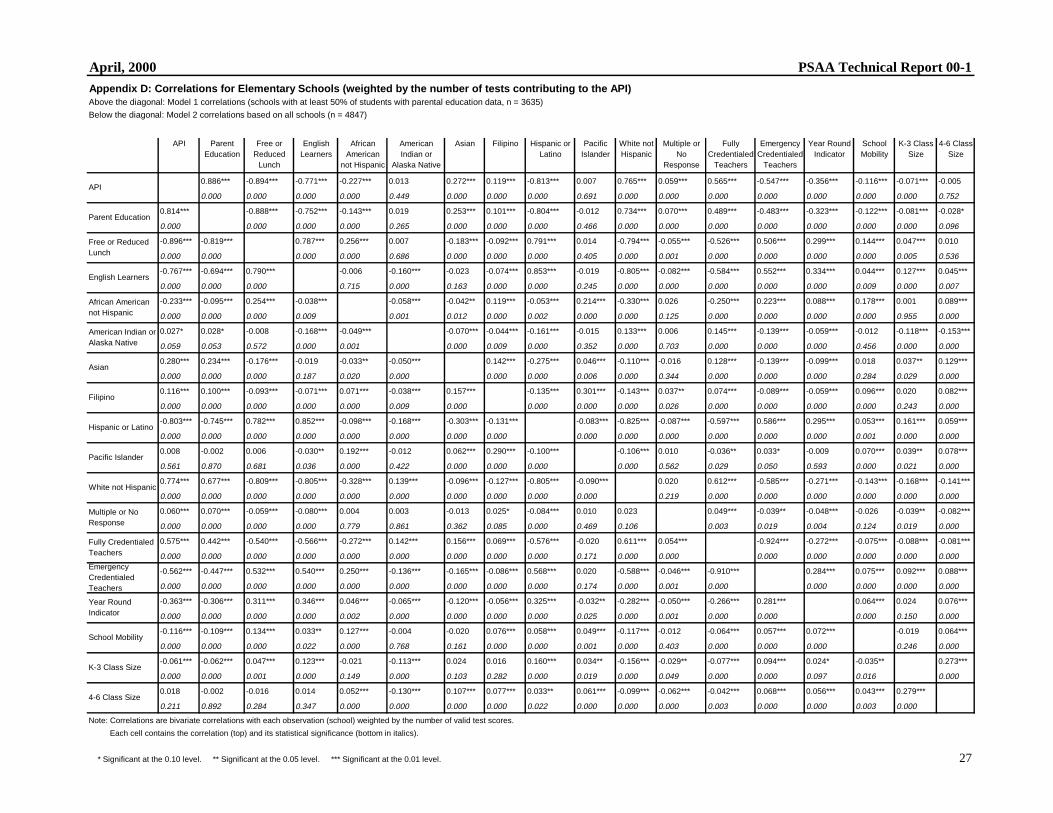
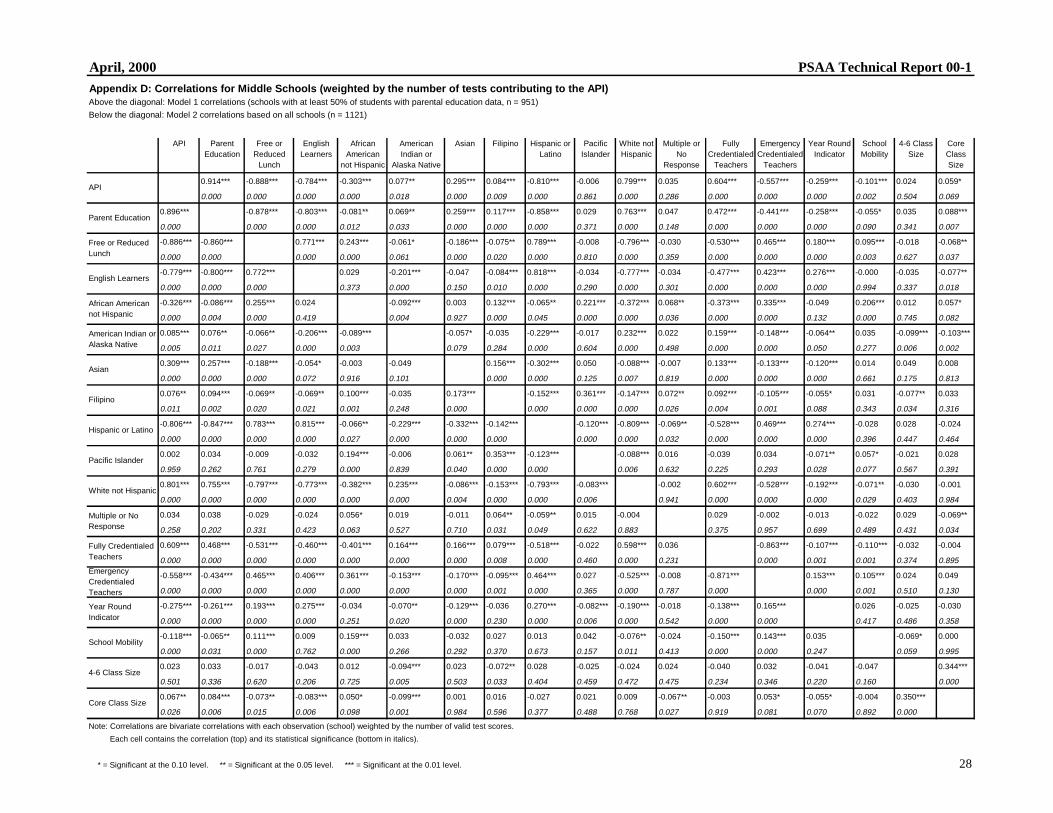
Appendix D beginning on page 27 shows the correlations for elementary, middle, and high schools.
Interpretation of Decile Ranks
Decile Ranks
A decile is one of nine points that divides a frequency distribution into ten equal parts: ten percent of the cases fall below the first decile, 20 percent below the second, and so on. For the PSAA, schools are provided a statewide rank and a similar schools rank. The rank is determined by which deciles the school falls between. Thus, a school below the first decile (i.e., in the bottom ten percent) has a decile rank of one. A school above the ninth decile (i.e., in the top ten percent) has a decile rank of ten. If a school's API is exactly equal to a decile cutpoint, the school is assigned the rank for schools just above that cutpoint.
For the statewide rank, there is a common set of decile cutpoints for all elementary schools, another common set for all middle schools, and another for all high schools.
13
April, 2000 PSAA Technical Report 00-1
These are the deciles of the statewide API distributions for the respective grade level categories. For the similar schools rank, each school has its own set of decile cutpoints, based on the 100 schools in its comparison group. Thus, if a school's API falls somewhere in the bottom ten percent of the APIs for its similar schools, it is assigned a similar schools decile rank of one, and so forth.
Statewide Rank
This ranking compares an individual school’s API to all of the schools in its grade level category statewide. The statewide rank may be interpreted in the following fashion:
Rank Description
This school’s API is:
9 or 10 Well above average for all elementary, middle, or high schools
7 or 8 Above average for all elementary, middle, or high schools
5 or 6 About average for all elementary, middle, or high schools
3 or 4 Below average for all elementary, middle, or high schools
1 or 2 Well below average for all elementary, middle, or high schools
Similar Schools Rank
This ranking compares an individual school’s API to the 100 schools in its comparison group. The similar schools rank may be interpreted in the following fashion:
Rank Description
This school’s API is:
9 or 10 Well above average for elementary, middle, or high schools with background characteristics posing comparable educational challenges and opportunities
7 or 8 Above average for elementary, middle, or high schools with background characteristics posing comparable educational challenges and opportunities
5 or 6 About average for elementary, middle, or high schools with background characteristics posing comparable educational challenges and opportunities
3 or 4 Below average for elementary, middle, or high schools with background characteristics posing comparable educational challenges and opportunities
14
April, 2000 PSAA Technical Report 00-1
1 or 2 Well below average for elementary, middle, or high schools with background characteristics posing comparable educational challenges and opportunities
Contributions of a Background Characteristic
Questions are frequently asked about which background characteristics are the most important in determining the SSR. The answers to these questions can help school personnel to understand the reasons schools are ranked as they are, and the likely effect of a change in the value of one or another background factor on the SCI. A change in the SCI, in turn, could affect the composition of a school's comparison group, and, consequently, its similar schools decile rank. As explained earlier in this report, the calculation of the SCI is a multi-step process. The total influence of any given background variable on the SCI depends on the two coefficients for that variable shown in Appendix C, as well as the weighting of the two SCI components for that particular school. It must be remembered, however, that background characteristics are factors typically outside the school's control. It is the responsibility of each school and district to assure the most accurate possible reporting of background characteristics. The best way to improve the SSR is the same as the best way to improve the statewide rank. Namely, the instructional program should be improved to increase the value of the API itself.
Cautions Regarding Predictability of Background Characteristics
Although they are called “predictor” variables, the background characteristics are used in the statistical sense of establishing relationships rather than in the literal or “dictionary” sense of predicting the future. The “similar schools rank” should not be considered as setting different expectations for different schools. Rather, it describes similar schools in the context of their background factors. Using the existing background characteristics and API scores, relationships are established through multiple regression analysis. From the analyses performed, it is not possible to determine whether background variables cause SSRs to be high or low. It would be erroneous, for example, to conclude that in some schools the percent of students in the free or reduced price lunch program causes the SSR to be high or low. No determination about causal relationships is suggested by the SSRs. Some variables may be powerful predictors not because of any inherent relation to school achievement, but instead because they are associated with many unmeasured characteristics that are in turn related to achievement.
15
April, 2000 PSAA Technical Report 00-1
Questions and Answers About the 1999 Similar Schools Ranks (SSRs)
Q. How are “schools with similar characteristics” determined?
A. The School Characteristics Index (SCI) is a composite of the demographic characteristics of a school. The SCI is derived through a commonly accepted statistical technique called multiple linear regression. This technique yields a single composite index based on all of the school background characteristics defined in the PSAA. Schools with nearly identical SCIs will be “similar” with respect to the overall educational challenge and opportunity presented by their respective constellations of background factors. Although each school has a unique combination of demographic characteristics, different combinations of characteristics may be very similar in their overall effect.
Q. How can I find out which schools are in my school’s comparison group?
A. In April, the SSRs will be updated on the California Department of Education’s web site at <http://www.cde.ca.gov/psaa/api>. Once the ranks are posted, the list of the 100 schools included in each school’s similar schools comparison group will be posted on the web site.
Q. Will the schools in my comparison group look like my school?
A. Because the law specifies so many background characteristics, it is not possible to find schools which match on all aspects of a school. For that reason, background characteristics are combined into a single index, the SCI, that represents how well schools are expected to perform on the API. Within your comparison group, the particular pattern of characteristics may differ across schools.
Q. Another school in my district has similar students and almost exactly the same API score but a different “similar schools” decile rank. How can that be?
A. Even if schools appear quite similar, they may differ with respect to some measured characteristics. Precise levels of the characteristics included in the SCI may not be apparent through observation alone, and small differences in the SCI can result in quite different sets of similar schools. If one school's comparison group had higher or lower API scores, then the two schools' similar schools decile ranks may differ.
Q. Will my school’s comparison group remain the same from year to year?
A. According to current plans, your school will receive a similar schools comparison group for 1999, and this same group will be used to calculate your 1999-2000 growth rank relative to similar schools, which will be available in the fall of 2000.
16
April, 2000 PSAA Technical Report 00-1
You will also receive a new similar schools group in the fall of 2000 that will be used to calculate your 2000 API and 2000-2001 growth ranks relative to similar schools. The new 2000 similar schools rank will be based on the most current background variables.
Q. If my school’s API score remains the same next year, will my statewide rank remain the same?
A. Your statewide rank will not necessarily remain the same next year, even though your API score remains the same. Depending on how the rest of the schools in the state perform, your rank may go up or down.
Q. What can I do to raise my similar schools rank?
A. The SCI is designed to reflect characteristics not under a school’s control. The best way to improve the SSR is the same as the best way to improve the statewide rank. Namely, the instructional program should be improved to increase the value of the API itself. The school should focus on improving student achievement.
Q. How is socioeconomic status measured?
A. Pupil socioeconomic status has been operationally defined as parent educational level and participation in the free or reduced price lunch program. The data source for parent educational level is the STAR answer document. For 1999 only, the data source for participation in the free or reduced price lunch program was a special data collection in which districts provided certified data. For 2000 and thereafter, the data source for participation in the free or reduced price lunch program will be the STAR answer document.
Q. Is a school penalized in any way if parent educational level is not reported for all students?
A. Although there is no penalty for not providing parent educational levels, a school should do its best to obtain accurate information so that its SSR can be as accurate as possible. Reliable parent educational level information is helpful in producing the most appropriate similar schools comparison group for your school.
Q. How can elementary school children, as young as second graders, be expected to report their parents’ educational level?
A. The reporting of parent educational level information is the responsibility of the school and district. The method of collecting these data varies across the state, but schools and districts should ensure that the data are as accurate as possible. There is no expectation that young children will provide this information unassisted.
17
April, 2000 PSAA Technical Report 00-1
Q. My similar schools rank is higher (about the same, lower) than my statewide rank. How should that be interpreted?
A. These ranks are calculated in completely different ways. The statewide API ranking compares your school to many schools statewide. The similar schools ranking compares your school to 100 schools like yours.
18

April, 2000 PSAA Technical Report 00-1
Appendices
A. Members of the Technical Design Group
B. Calculation of 1999 Similar Schools Ranks
C. Descriptive Statistics for Elementary, Middle, and High Schools
D. Correlations for Elementary, Middle, and High Schools
19

April, 2000 PSAA Technical Report 00-1
Appendix A: Members of the Technical Design Group
• Eva BakerDirectorCenter for the Study of Evaluation, University of California, Los Angeles(Co-chair)
• Edward HaertelProfessorStanford University, School of Education(Co-chair)
• Don BarfieldDeputy DirectorWestEd
• Ted BartellDirector, Program Evaluation and Research BranchLos Angeles Unified School District
• Linda KaminskiChief Academic OfficerSanta Ana Unified School District
• Michael E. MartinezAssociate ProfessorUniversity of California, Irvine
• Tej PandeyPrivate Citizen
• Brian StecherSenior Social ScientistRAND
• Mark Wils onProfessorUniversity of California, Berkeley, School of Education
20
April, 2000 PSAA Technical Report 00-1
Appendix B: Calculation of 1999 Similar Schools Ranks
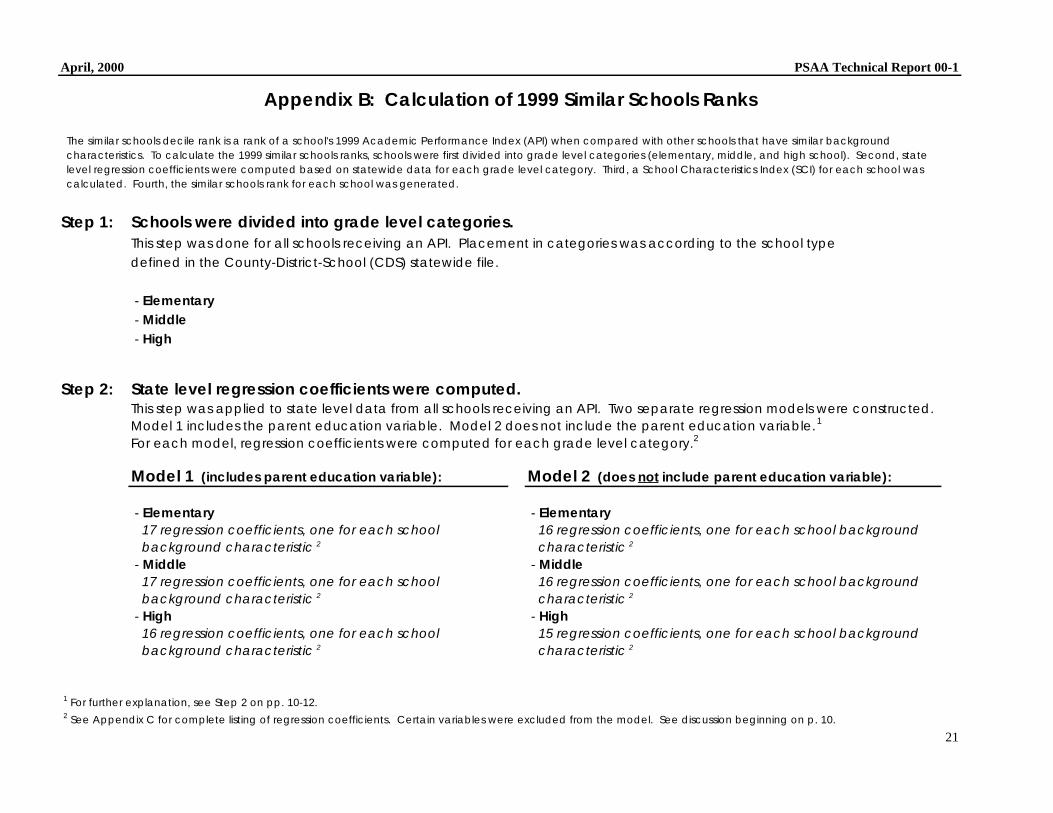
The similar schools decile rank is a rank of a school's 1999 Academic Performance Index (API) when compared with other schools that have similar background characteristics. To calculate the 1999 similar schools ranks, schools were first divided into grade level categories (elementary, middle, and high school). Second, state level regression coefficients were computed based on statewide data for each grade level category. Third, a School Characteristics Index (SCI) for each school was calculated. Fourth, the similar schools rank for each school was generated.
Step 1: Schools were divided into grade level categories. This step was done for all schools receiving an API. Placement in categories was according to the school type defined in the County-District-School (CDS) statewide file.
- Elementary - Middle - High
Step 2: State level regression coefficients were computed. This step was applied to state level data from all schools receiving an API. Two separate regression models were constructed.Model 1 includes the parent education variable. Model 2 does not include the parent education variable.1
For each model, regression coefficients were computed for each grade level category.2
Model 1 (includes parent education variable): Model 2 (does not include parent education variable):
- Elementary - Elementary 17 regression coefficients, one for each school 16 regression coefficients, one for each school background background characteristic 2 characteristic 2
- Middle - Middle 17 regression coefficients, one for each school 16 regression coefficients, one for each school background background characteristic 2 characteristic 2
- High - High 16 regression coefficients, one for each school 15 regression coefficients, one for each school background background characteristic 2 characteristic 2
1 For further explanation, see Step 2 on pp. 10-12.2 See Appendix C for complete listing of regression coefficients. Certain variables were excluded from the model. See discussion beginning on p. 10.
21
April, 2000 PSAA Technical Report 00-1
Appendix B: Calculation of 1999 Similar Schools Ranks (continued)
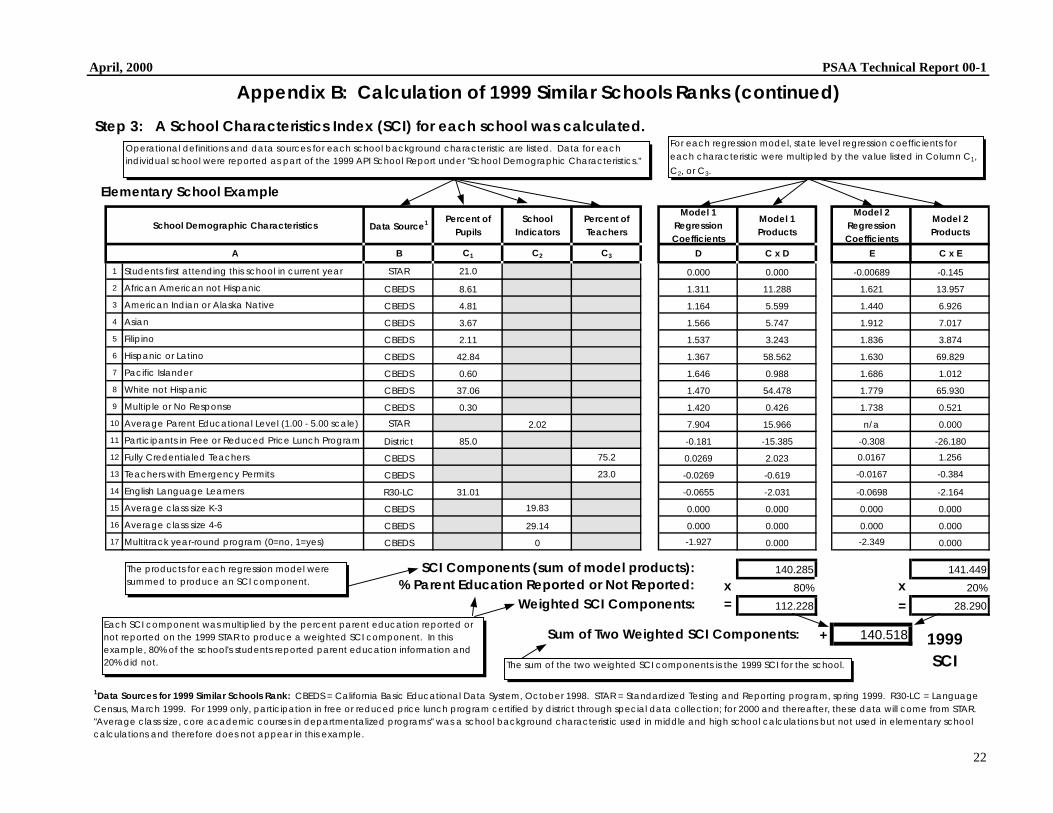
Step 3: A School Characteristics Index (SCI) for each school was calculated.
i i i 1 School Model 1
Coefficients
Model 1 Model 2
Coefficients
Model 2
A B C1 C2 C3 D E C x E
1 i l STAR 0.000 0.000 -0.00689 -0.145
2 i ic CBEDS 11.288 1.621 13.957
3 I CBEDS 5.599 1.440 6.926
4 CBEDS 1.566 5.747 1.912 7.017
5 CBEDS 1.537 3.243 1.836 3.874
6 Hispani CBEDS 42.84 1.367 58.562 1.630 69.829
7 i CBEDS 1.646 0.988 1.686 1.012
8 ic CBEDS 37.06 1.470 54.478 1.779 65.930
9 ipl CBEDS 1.420 0.426 1.738 0.521
10 2.02 7.904 15.966 n/a
11 i 85.0 -0.181 -15.385 -0.308 -26.180
12 CBEDS 75.2 0.0269 2.023 0.0167 1.256
13 i CBEDS 23.0 -0.0269 -0.619 -0.0167 -0.384
14 Engli 31.01 -0.0655 -2.031 -0.0698 -2.164
15 CBEDS 19.83 0.000 0.000 0.000 0.000
16 CBEDS 29.14 0.000 0.000 0.000 0.000
17 i CBEDS 0 -1.927 0.000 -2.349 0.000
80% 20%
140.518 1999SCI
l ii i l i i
ii 1,
C2 3.
I
Ii is
i i
x x
+
= =
School Demograph c Character st cs Data SourcePercent of
Pupils Indicators Percent of Teachers
Regression Products
Regression Products
C x D
Students f rst attending this schoo in current year 21.0
Afr can American not Hispan 8.61 1.311
American ndian or Alaska Native 4.81 1.164
Asian 3.67
Filipino 2.11
c or Latino
Pacif c Islander 0.60
White not Hispan
Mult e or No Response 0.30
Average Parent Educational Level (1.00 - 5.00 scale) STAR 0.000
Participants in Free or Reduced Price Lunch Program Distr ct
Fully Credentialed Teachers
Teachers w th Emergency Permits
sh Language Learners R30-LC
Average class size K-3
Average class size 4-6
Mult track year-round program (0=no, 1=yes)
140.285 141.449
112.228 28.290
Operational definitions and data sources for each schoo background character stic are listed. Data for each nd vidua school were reported as part of the 1999 API School Report under "School Demographic Character st cs."
Elementary School Example
For each regression model, state level regression coeff cients for each character stic were multipled by the value listed in Column C
, or C
The products for each regression model were summed to produce an SC component.
Each SC component was multiplied by the percent parent education reported or not reported on the 1999 STAR to produce a we ghted SCI component. In thexample, 80% of the school's students reported parent education information and 20% did not. The sum of the two we ghted SCI components s the 1999 SCI for the school.
SCI Components (sum of model products): % Parent Education Reported or Not Reported:
Sum of Two Weighted SCI Components:
Weighted SCI Components:
1Data Sources for 1999 Similar Schools Rank: CBEDS = California Basic Educational Data System, October 1998. STAR = Standardized Testing and Reporting program, spring 1999. R30-LC = Language Census, March 1999. For 1999 only, participation in free or reduced price lunch program certified by district through special data collection; for 2000 and thereafter, these data will come from STAR. "Average class size, core academic courses in departmentalized programs" was a school background characteristic used in middle and high school calculations but not used in elementary school calculations and therefore does not appear in this example.
22
April, 2000 PSAA Technical Report 00-1
Appendix B: Calculation of 1999 Similar Schools Ranks (continued)
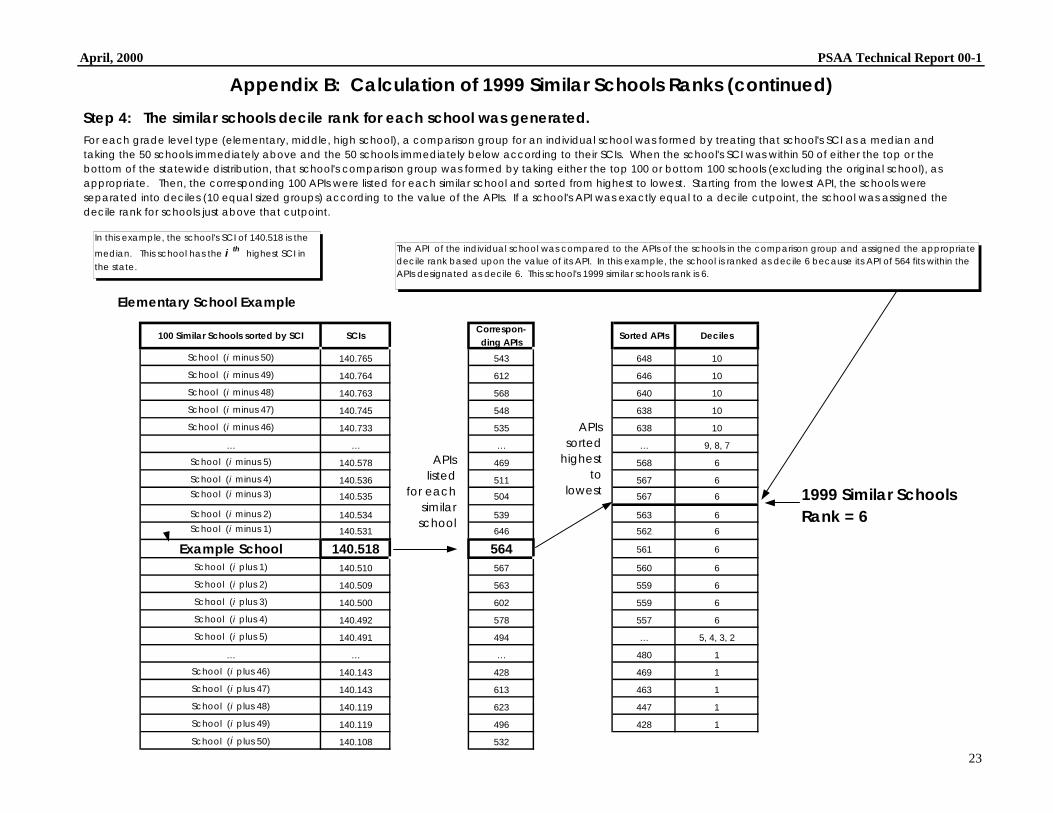
Step 4: The similar schools decile rank for each school was generated. For each grade level type (elementary, middle, high school), a comparison group for an individual school was formed by treating that school's SCI as a median and taking the 50 schools immediately above and the 50 schools immediately below according to their SCIs. When the school's SCI was within 50 of either the top or the bottom of the statewide distribution, that school's comparison group was formed by taking either the top 100 or bottom 100 schools (excluding the original school), as appropriate. Then, the corresponding 100 APIs were listed for each similar school and sorted from highest to lowest. Starting from the lowest API, the schools were separated into deciles (10 equal sized groups) according to the value of the APIs. If a school's API was exactly equal to a decile cutpoint, the school was assigned the decile rank for schools just above that cutpoint.
il l .
(i 140.765
(i 140.764
(i 140.763
(i 140.745
(i 140.733
… …
(i 140.578
(i 140.536
(i 140.535
(i 140.534
(i 140.531
Example School 140.518 (i 140.510
(i 140.509
(i 140.500
(i 140.492
(i 140.491
… …
(i pl 140.143
(i pl 140.143
(i pl 140.119
(i pl 140.119
(i pl 140.108
100 Sim ar Schoo s sorted by SCI SCIs
School minus 50)
School minus 49)
School minus 48)
School minus 47)
School minus 46)
School minus 5)
School minus 4)
School minus 3)
School minus 2)
School minus 1)
School plus 1)
School plus 2)
School plus 3)
School plus 4)
School plus 5)
School us 46)
School us 47)
School us 48)
School us 49)
School us 50)
543 648 10
612 646 10
568 640 10
548 638 10
535 638 10
… … 9, 8, 7
469 568 6
511 567 6
504 567 6
539 563 6
646 562 6
564 561 6
567 560 6
563 559 6
602 559 6
578 557 6
494 …
… 480 1
428 469 1
613 463 1
623 447 1
496 428 1
532
I i Iil l i l i il i
i
1999 Similar Schools Rank = 6
APIs
similar
APIs
to lowest
Correspon-ding APIs
Sorted APIs Deciles
5, 4, 3, 2
The AP of the indiv dual school was compared to the AP s of the schools in the comparison group and assigned the appropriate dec e rank based upon the va ue of its API. In th s examp e, the school s ranked as dec e 6 because ts API of 564 fits within the APIs designated as decile 6. This school's 1999 s milar schools rank is 6.
listed for each
school
sorted highest
i l
i i i th In th s examp e, the school's SCI of 140.518 is the
med an. Th s school has the highest SCI in the state.
Elementary School Example
23
xxxx
xx
xx
xx
xx
xx
xx
xxxxxx
xx
xxxxxxxxxxx
xxxx
April, 2000 PSAA Technical Report 00-1
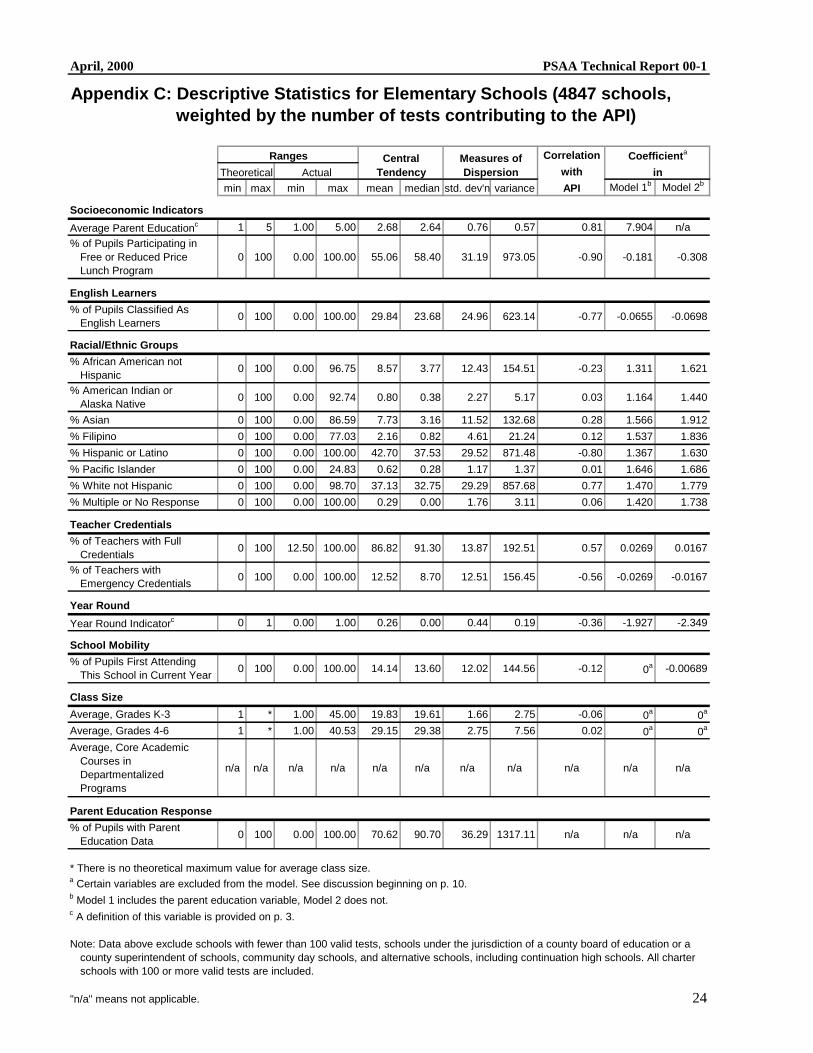
Appendix C: Descriptive Statistics for Elementary Schools (4847 schools, weighted by the number of tests contributing to the API)
Ranges Central Tendency
Measures of Dispersion
Correla tion
wit h Coefficient a
inTheoretical Actual
min max min max mean median std. dev'n variance API Model 1b Model 2b
Socioeconomic Indicators
Average Parent Education c 1 5 1.00 5.00 2.68 2.64 0.76 0.57 0.81 7.904 n/a
% of Pupils Participating in Free or Reduced Price Lunch Program
0 100 0.00 100.00 55.06 58.40 31.19 973.05 -0.90 -0.181 -0.308
English Learners
l ifii
0 100% of Pupi s Class ed As
Engl sh Learners 0.00 100.00 29.84 23.68 24.96 623.14 -0.77 -0.0655 -0.0698
Racial/Ethnic Groups
% African American not Hispanic
0 100 0.00 96.75 8.57 3.77 12.43 154.51 -0.23 1.311 1.621
% American Indian or Alaska Native
0 100 0.00 92.74 0.80 0.38 2.27 5.17 0.03 1.164 1.440
% Asian 0 100 0.00 86.59 7.73 3.16 11.52 132.68 0.28 1.566 1.912
% Filipino 0 100 0.00 77.03 2.16 0.82 4.61 21.24 0.12 1.537 1.836
% Hispanic or Latino 0 100 0.00 100.00 42.70 37.53 29.52 871.48 -0.80 1.367 1.630
% Pacific Islander 0 100 0.00 24.83 0.62 0.28 1.17 1.37 0.01 1.646 1.686
% White not Hispanic 0 100 0.00 98.70 37.13 32.75 29.29 857.68 0.77 1.470 1.779
% Multiple or No Response 0 100 0.00 100.00 0.29 0.00 1.76 3.11 0.06 1.420 1.738
Teacher Credentials
% of Teachers with Full Credentials
0 100 12.50 100.00 86.82 91.30 13.87 192.51 0.57 0.0269 0.0167
% of Teachers with Emergency Credentials
0 100 0.00 100.00 12.52 8.70 12.51 156.45 -0.56 -0.0269 -0.0167
Year Round
0 1 0.00 1.00 0.26 0.00 0.44 0.19 -0.36 -1.927 Year Round Indicatorc
School Mobility
l i
0 100 0a% of Pupi s First Attending This School n Current Year
0.00 100.00 14.14 13.60 12.02 144.56 -0.12 -0.00689
Class Size
Average, Grades K-3 1 * 1.00 45.00 19.83 19.61 1.66 2.75 -0.06 0a 0a
Average, Grades 4-6 1 * 1.00 40.53 29.15 29.38 2.75 7.56 0.02 0a 0a
Average, Core Academic Courses in Departmentalized Programs
n/a n/a n/a n/a n/a n/a n/a n/a n/a n/a n/a
Parent Education Response
l ii
0 100 n/a% of Pupi s w th Parent
Educat on Data 0.00 100.00 70.62 90.70 36.29 1317.11 n/a n/a
* There is no theoretical maximum value for average class size.a Certain variables are excluded from the model. See discussion beginning on p. 10.b Model 1 includes the parent education variable, Model 2 does not.c A definition of this variable is provided on p. 3.
Note: Data above exclude schools with fewer than 100 valid tests, schools under the jurisdiction of a county board of education or a county superintendent of schools, community day schools, and alternative schools, including continuation high schools. All charter schools with 100 or more valid tests are included.
"n/a" means not applicable.
-2.349
24
xxxx
xx
xx
xx
xx
xx
xx
xxxxxx
xx
xxxxxxxxxxx
xxxx
April, 2000 PSAA Technical Report 00-1
Appendix C: Descriptive Statistics for Middle Schools (1121 schools, weighted by the number of tests contributing to the API)
Ranges Central Tendency
Measures of Dispersion
Correl ation
wi th in
Coefficient a
Theoretical Actual
min max min max mean median std. dev'n variance API Model 1b
Model 2b
Socioeconomic Indicators
Average Parent Education c 1 5 1.00 4.58 2.85 2.86 0.67 0.45 0.90 12.685 n/a
% of Pupils Participating in Free or Reduced Price Lunch Program
0 100 0.00 100.00 48.14 47.30 27.67 765.61 -0.89 -0.0931 -0.225
English Learners
l ifii
0 100% of Pupi s Class ed As
Engl sh Learners 0.00 87.50 21.56 16.96 17.72 313.88 -0.78 -0.127 -0.202
Racial/Ethnic Groups
% African American not Hispanic
0 100 0.00 90.00 9.01 4.33 11.97 143.18 -0.33 0.955 1.436
% American Indian or Alaska Native
0 100 0.00 56.48 0.76 0.43 1.55 2.39 0.08 0.828 0.919
% Asian 0 100 0.00 65.16 8.19 4.09 10.84 117.52 0.31 1.365 1.905
% Filipino 0 100 0.00 46.41 2.54 1.08 4.78 22.82 0.08 1.168 1.700
% Hispanic or Latino 0 100 0.50 100.00 40.50 34.94 27.77 771.17 -0.81 1.189 1.575
% Pacific Islander 0 100 0.00 11.92 0.64 0.33 1.06 1.11 0.00 1.384 1.639
% White not Hispanic 0 100 0.00 97.47 38.18 35.41 27.97 782.47 0.80 1.221 1.736
% Multiple or No Response 0 100 0.00 16.21 0.18 0.00 0.86 0.74 0.03 1.403 2.001
Teacher Credentials
% of Teachers with Full Credentials
0 100 25.00 100.00 87.06 90.30 12.02 144.48 0.61 0.0709 0.0448
% of Teachers with Emergency Credentials
0 100 0.00 75.00 13.01 10.00 11.35 128.75 -0.56 -0.0709 -0.0448
Year Round
0 1 0.00 1.00 0.11 0.00 0.31 0.10 -0.28 -1.523 Year Round Indicatorc
School Mobility
l i
0 100% of Pupi s First Attending
This School n Current Year 0.00 100.00 12.20 9.90 14.23 202.43 -0.12 -0.00910 -0.0182
Class Size
Average, Grades K-3 n/a n/a n/a n/a n/a n/a n/a n/a n/a n/a n/a
Average, Grades 4-6 1 * 8.14 50.00 29.61 29.60 3.84 14.77 0.02 -0.0231 0a
Average, Core Academic Courses in Departmentalized Programs
1 * 1.00 39.40 28.63 28.61 2.67 7.13 0.07 0a
0a
Parent Education Response
l ii
0 100 n/a% of Pupi s w th Parent
Educat on Data 0.00 100.00 78.07 90.70 29.20 852.49 n/a n/a
* There is no theoretical maximum value for average class size.a Certain variables are excluded from the model. See discussion beginning on p. 10.b Model 1 includes the parent education variable, Model 2 does not.c A definition of this variable is provided on p. 3.
Note: Data above exclude schools with fewer than 100 valid tests, schools under the jurisdiction of a county board of education or a county superintendent of schools, community day schools, and alternative schools, including continuation high schools. All charter schools with 100 or more valid tests are included.
"n/a" means not applicable.
-2.890
25
xxxx
xx
xx
xx
xx
xx
xx
xxxxxx
xx
xxxxxxxxxxx
xxxx
April, 2000 PSAA Technical Report 00-1
Appendix C: Descriptive Statistics for High Schools (839 schools, weighted by the number of tests contributing to the API)
Ranges Central Tendency
Measures of Dispersion
Correl ation
wi th Coefficient a
inTheoretical Actual
min max min max mean median std. dev'n variance API Model 1b Model 2b
Socioeconomic Indicators
Average Parent Education c 1 5 1.31 4.50 2.89 2.93 0.64 0.42 0.92 16.890 n/a
% of Pupils Participating in Free or Reduced Price Lunch Program
0 100 0.00 100.00 33.71 29.03 23.89 570.58 -0.80 0a -0.138
English Learners
l ifii
0 100% of Pupi s Class ed As
Engl sh Learners 0.00 64.38 15.61 12.27 13.14 172.60 -0.69 -0.0562 -0.199
Racial/Ethnic Groups
% African American not Hispanic
0 100 0.00 80.73 8.13 4.05 11.00 121.03 -0.33 0.822 1.358
% American Indian or Alaska Native
0 100 0.00 63.44 0.83 0.46 1.67 2.80 0.08 0.907 0.877
% Asian 0 100 0.00 69.99 9.88 5.47 12.31 151.58 0.30 1.185 1.802
% Filipino 0 100 0.00 44.43 2.89 1.39 4.83 23.34 0.02 0.934 1.581
% Hispanic or Latino 0 100 0.57 99.22 36.50 29.88 26.06 678.92 -0.80 1.042 1.420
% Pacific Islander 0 100 0.00 9.72 0.60 0.34 0.85 0.73 -0.04 0.793 0.538
% White not Hispanic 0 100 0.00 97.11 40.96 40.13 27.26 742.98 0.75 1.041 1.645
% Multiple or No Response 0 100 0.00 43.23 0.20 0.00 1.72 2.97 0.01 0.959 1.315
Teacher Credentials
% of Teachers with Full Credentials
0 100 16.70 100.00 89.05 90.50 8.52 72.60 0.48 0.0582 0.0846
% of Teachers with Emergency Credentials
0 100 0.00 83.30 11.00 9.80 7.96 63.42 -0.46 -0.0582 -0.0846
Year Round
0a 0a0 1 0.00 1.00 0.06 0.00 0.24 0.06 -0.32 Year Round Indicatorc
School Mobility
l i
0 100 0a% of Pupi s First Attending This School n Current Year
0.00 100.00 7.65 7.08 7.96 63.29 -0.19 -0.00688
Class Size
Average, Grades K-3 n/a n/a n/a n/a n/a n/a n/a n/a n/a n/a n/a
Average, Grades 4-6 n/a n/a n/a n/a n/a n/a n/a n/a n/a n/a n/a
Average, Core Academic Courses in Departmentalized Programs
1 * 14.06 36.18 29.12 29.21 2.50 6.27 -0.08 -0.132 -0.0315
Parent Education Response
l ii
0 100 n/a% of Pupi s w th Parent
Educat on Data 0.50 100.00 79.69 90.10 25.73 662.03 n/a n/a
* There is no theoretical maximum value for average class size.a Certain variables are excluded from the model. See discussion beginning on p. 10.b Model 1 includes the parent education variable, Model 2 does not.c A definition of this variable is provided on p. 3.
Note: Data above exclude schools with fewer than 100 valid tests, schools under the jurisdiction of a county board of education or a county superintendent of schools, community day schools, and alternative schools, including continuation high schools. All charter schools with 100 or more valid tests are included.
"n/a" means not applicable. 26
April, 2000 PSAA Technical Report 00-1
Appendix D: Correlations for Elementary Schools (weighted by the number of tests contributing to the API) Above the diagonal: Model 1 correlations (schools with at least 50% of students with parental education data, n = 3635)
Below the diagonal: Model 2 correlations based on all schools (n = 4847)
API Parent Free or English African American Asian Filipino Hispanic or Pacific White not Multiple or Fully Emergency Year Round School K-3 Class 4-6 Class Education Reduced Learners American Indian or Latino Islander Hispanic No Credentialed Credentialed Indicator Mobility Size Size
Lunch not Hispanic Alaska Native Response Teachers Teachers
0.886*** -0.894*** -0.771*** -0.227*** 0.013 0.272*** 0.119*** -0.813*** 0.007 0.765*** 0.059*** 0.565*** -0.547*** -0.356*** -0.116*** -0.071*** -0.005 API
0.000 0.000 0.000 0.000 0.449 0.000 0.000 0.000 0.691 0.000 0.000 0.000 0.000 0.000 0.000 0.000 0.752
0.814*** -0.888*** -0.752*** -0.143*** 0.019 0.253*** 0.101*** -0.804*** -0.012 0.734*** 0.070*** 0.489*** -0.483*** -0.323*** -0.122*** -0.081*** -0.028* Parent Education
0.000 0.000 0.000 0.000 0.265 0.000 0.000 0.000 0.466 0.000 0.000 0.000 0.000 0.000 0.000 0.000 0.096
Free or Reduced -0.896*** -0.819*** 0.787*** 0.256*** 0.007 -0.183*** -0.092*** 0.791*** 0.014 -0.794*** -0.055*** -0.526*** 0.506*** 0.299*** 0.144*** 0.047*** 0.010 Lunch 0.000 0.000 0.000 0.000 0.686 0.000 0.000 0.000 0.405 0.000 0.001 0.000 0.000 0.000 0.000 0.005 0.536
-0.767*** -0.694*** 0.790*** -0.006 -0.160*** -0.023 -0.074*** 0.853*** -0.019 -0.805*** -0.082*** -0.584*** 0.552*** 0.334*** 0.044*** 0.127*** 0.045*** English Learners
0.000 0.000 0.000 0.715 0.000 0.163 0.000 0.000 0.245 0.000 0.000 0.000 0.000 0.000 0.009 0.000 0.007
African American -0.233*** -0.095*** 0.254*** -0.038*** -0.058*** -0.042** 0.119*** -0.053*** 0.214*** -0.330*** 0.026 -0.250*** 0.223*** 0.088*** 0.178*** 0.001 0.089*** not Hispanic 0.000 0.000 0.000 0.009 0.001 0.012 0.000 0.002 0.000 0.000 0.125 0.000 0.000 0.000 0.000 0.955 0.000
American Indian or 0.027* 0.028* -0.008 -0.168*** -0.049*** -0.070*** -0.044*** -0.161*** -0.015 0.133*** 0.006 0.145*** -0.139*** -0.059*** -0.012 -0.118*** -0.153*** Alaska Native 0.059 0.053 0.572 0.000 0.001 0.000 0.009 0.000 0.352 0.000 0.703 0.000 0.000 0.000 0.456 0.000 0.000
0.280*** 0.234*** -0.176*** -0.019 -0.033** -0.050*** 0.142*** -0.275*** 0.046*** -0.110*** -0.016 0.128*** -0.139*** -0.099*** 0.018 0.037** 0.129*** Asian
0.000 0.000 0.000 0.187 0.020 0.000 0.000 0.000 0.006 0.000 0.344 0.000 0.000 0.000 0.284 0.029 0.000
0.116*** 0.100*** -0.093*** -0.071*** 0.071*** -0.038*** 0.157*** -0.135*** 0.301*** -0.143*** 0.037** 0.074*** -0.089*** -0.059*** 0.096*** 0.020 0.082*** Filipino
0.000 0.000 0.000 0.000 0.000 0.009 0.000 0.000 0.000 0.000 0.026 0.000 0.000 0.000 0.000 0.243 0.000
-0.803*** -0.745*** 0.782*** 0.852*** -0.098*** -0.168*** -0.303*** -0.131*** -0.083*** -0.825*** -0.087*** -0.597*** 0.586*** 0.295*** 0.053*** 0.161*** 0.059*** Hispanic or Latino
0.000 0.000 0.000 0.000 0.000 0.000 0.000 0.000 0.000 0.000 0.000 0.000 0.000 0.000 0.001 0.000 0.000
0.008 -0.002 0.006 -0.030** 0.192*** -0.012 0.062*** 0.290*** -0.100*** -0.106*** 0.010 -0.036** 0.033* -0.009 0.070*** 0.039** 0.078*** Pacific Islander
0.561 0.870 0.681 0.036 0.000 0.422 0.000 0.000 0.000 0.000 0.562 0.029 0.050 0.593 0.000 0.021 0.000
0.774*** 0.677*** -0.809*** -0.805*** -0.328*** 0.139*** -0.096*** -0.127*** -0.805*** -0.090*** 0.020 0.612*** -0.585*** -0.271*** -0.143*** -0.168*** -0.141*** White not Hispanic
0.000 0.000 0.000 0.000 0.000 0.000 0.000 0.000 0.000 0.000 0.219 0.000 0.000 0.000 0.000 0.000 0.000
Multiple or No 0.060*** 0.070*** -0.059*** -0.080*** 0.004 0.003 -0.013 0.025* -0.084*** 0.010 0.023 0.049*** -0.039** -0.048*** -0.026 -0.039** -0.082*** Response 0.000 0.000 0.000 0.000 0.779 0.861 0.362 0.085 0.000 0.469 0.106 0.003 0.019 0.004 0.124 0.019 0.000
Fully Credentialed 0.575*** 0.442*** -0.540*** -0.566*** -0.272*** 0.142*** 0.156*** 0.069*** -0.576*** -0.020 0.611*** 0.054*** -0.924*** -0.272*** -0.075*** -0.088*** -0.081*** Teachers 0.000 0.000 0.000 0.000 0.000 0.000 0.000 0.000 0.000 0.171 0.000 0.000 0.000 0.000 0.000 0.000 0.000 Emergency Credentialed Teachers
-0.562***
0.000
-0.447***
0.000
0.532***
0.000
0.540***
0.000
0.250***
0.000
-0.136***
0.000
-0.165***
0.000
-0.086***
0.000
0.568***
0.000
0.020
0.174
-0.588***
0.000
-0.046***
0.001
-0.910***
0.000
0.284***
0.000
0.075***
0.000
0.092***
0.000
0.088***
0.000
Year Round -0.363*** -0.306*** 0.311*** 0.346*** 0.046*** -0.065*** -0.120*** -0.056*** 0.325*** -0.032** -0.282*** -0.050*** -0.266*** 0.281*** 0.064*** 0.024 0.076*** Indicator 0.000 0.000 0.000 0.000 0.002 0.000 0.000 0.000 0.000 0.025 0.000 0.001 0.000 0.000 0.000 0.150 0.000
-0.116*** -0.109*** 0.134*** 0.033** 0.127*** -0.004 -0.020 0.076*** 0.058*** 0.049*** -0.117*** -0.012 -0.064*** 0.057*** 0.072*** -0.019 0.064*** School Mobility
0.000 0.000 0.000 0.022 0.000 0.768 0.161 0.000 0.000 0.001 0.000 0.403 0.000 0.000 0.000 0.246 0.000
-0.061*** -0.062*** 0.047*** 0.123*** -0.021 -0.113*** 0.024 0.016 0.160*** 0.034** -0.156*** -0.029** -0.077*** 0.094*** 0.024* -0.035** 0.273*** K-3 Class Size
0.000 0.000 0.001 0.000 0.149 0.000 0.103 0.282 0.000 0.019 0.000 0.049 0.000 0.000 0.097 0.016 0.000
0.018 -0.002 -0.016 0.014 0.052*** -0.130*** 0.107*** 0.077*** 0.033** 0.061*** -0.099*** -0.062*** -0.042*** 0.068*** 0.056*** 0.043*** 0.279*** 4-6 Class Size
0.211 0.892 0.284 0.347 0.000 0.000 0.000 0.000 0.022 0.000 0.000 0.000 0.003 0.000 0.000 0.003 0.000
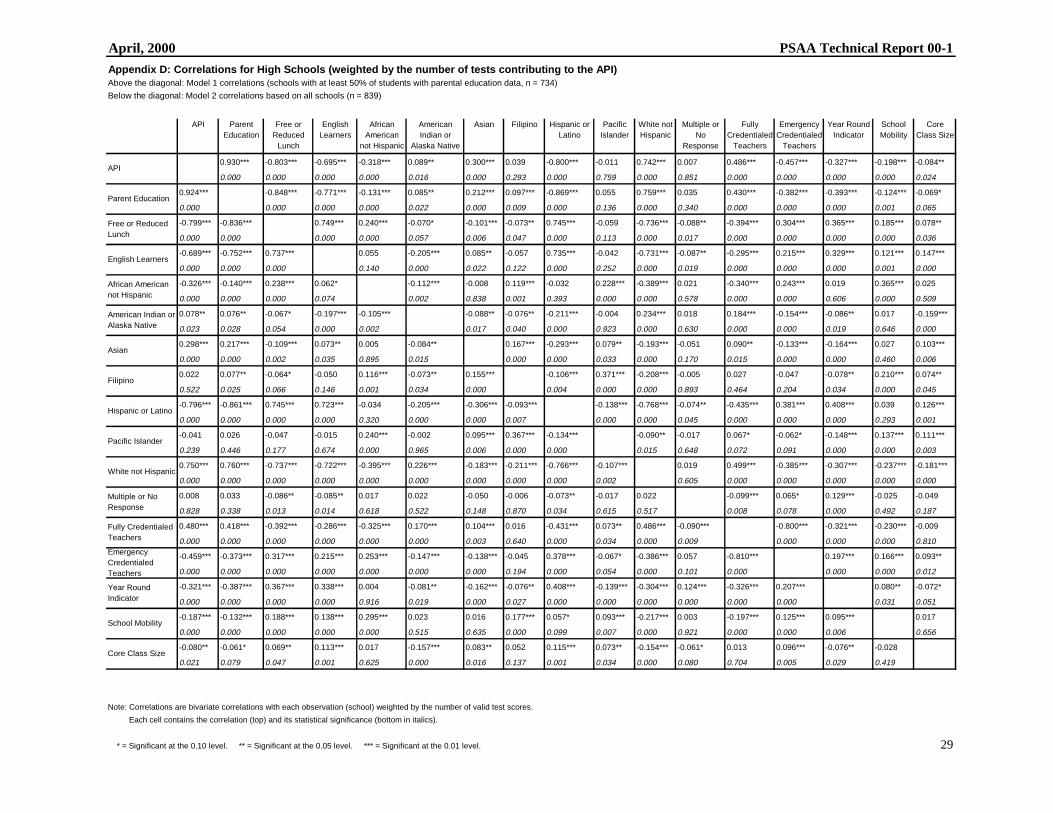
Note: Correlations are bivariate correlations with each observation (school) weighted by the number of valid test scores.
Each cell contains the correlation (top) and its statistical significance (bottom in italics).
* Significant at the 0.10 level. ** Significant at the 0.05 level. *** Significant at the 0.01 level. 27
April, 2000 PSAA Technical Report 00-1
Appendix D: Correlations for Middle Schools (weighted by the number of tests contributing to the API) Above the diagonal: Model 1 correlations (schools with at least 50% of students with parental education data, n = 951)
Below the diagonal: Model 2 correlations based on all schools (n = 1121)
API Parent Free or English African American Asian Filipino Hispanic or Pacific White not Multiple or Fully Emergency Year Round School 4-6 Class Core Education Reduced Learners American Indian or Latino Islander Hispanic No Credentialed Credentialed Indicator Mobility Size Class
Lunch not Hispanic Alaska Native Response Teachers Teachers Size
0.914*** -0.888*** -0.784*** -0.303*** 0.077** 0.295*** 0.084*** -0.810*** -0.006 0.799*** 0.035 0.604*** -0.557*** -0.259*** -0.101*** 0.024 0.059* API
0.000 0.000 0.000 0.000 0.018 0.000 0.009 0.000 0.861 0.000 0.286 0.000 0.000 0.000 0.002 0.504 0.069
0.896*** -0.878*** -0.803*** -0.081** 0.069** 0.259*** 0.117*** -0.858*** 0.029 0.763*** 0.047 0.472*** -0.441*** -0.258*** -0.055* 0.035 0.088*** Parent Education
0.000 0.000 0.000 0.012 0.033 0.000 0.000 0.000 0.371 0.000 0.148 0.000 0.000 0.000 0.090 0.341 0.007
Free or Reduced -0.886*** -0.860*** 0.771*** 0.243*** -0.061* -0.186*** -0.075** 0.789*** -0.008 -0.796*** -0.030 -0.530*** 0.465*** 0.180*** 0.095*** -0.018 -0.068** Lunch 0.000 0.000 0.000 0.000 0.061 0.000 0.020 0.000 0.810 0.000 0.359 0.000 0.000 0.000 0.003 0.627 0.037
-0.779*** -0.800*** 0.772*** 0.029 -0.201*** -0.047 -0.084*** 0.818*** -0.034 -0.777*** -0.034 -0.477*** 0.423*** 0.276*** -0.000 -0.035 -0.077** English Learners
0.000 0.000 0.000 0.373 0.000 0.150 0.010 0.000 0.290 0.000 0.301 0.000 0.000 0.000 0.994 0.337 0.018
African American -0.326*** -0.086*** 0.255*** 0.024 -0.092*** 0.003 0.132*** -0.065** 0.221*** -0.372*** 0.068** -0.373*** 0.335*** -0.049 0.206*** 0.012 0.057* not Hispanic 0.000 0.004 0.000 0.419 0.004 0.927 0.000 0.045 0.000 0.000 0.036 0.000 0.000 0.132 0.000 0.745 0.082
American Indian or 0.085*** 0.076** -0.066** -0.206*** -0.089*** -0.057* -0.035 -0.229*** -0.017 0.232*** 0.022 0.159*** -0.148*** -0.064** 0.035 -0.099*** -0.103*** Alaska Native 0.005 0.011 0.027 0.000 0.003 0.079 0.284 0.000 0.604 0.000 0.498 0.000 0.000 0.050 0.277 0.006 0.002
0.309*** 0.257*** -0.188*** -0.054* -0.003 -0.049 0.156*** -0.302*** 0.050 -0.088*** -0.007 0.133*** -0.133*** -0.120*** 0.014 0.049 0.008 Asian
0.000 0.000 0.000 0.072 0.916 0.101 0.000 0.000 0.125 0.007 0.819 0.000 0.000 0.000 0.661 0.175 0.813
0.076** 0.094*** -0.069** -0.069** 0.100*** -0.035 0.173*** -0.152*** 0.361*** -0.147*** 0.072** 0.092*** -0.105*** -0.055* 0.031 -0.077** 0.033 Filipino
0.011 0.002 0.020 0.021 0.001 0.248 0.000 0.000 0.000 0.000 0.026 0.004 0.001 0.088 0.343 0.034 0.316
-0.806*** -0.847*** 0.783*** 0.815*** -0.066** -0.229*** -0.332*** -0.142*** -0.120*** -0.809*** -0.069** -0.528*** 0.469*** 0.274*** -0.028 0.028 -0.024 Hispanic or Latino
0.000 0.000 0.000 0.000 0.027 0.000 0.000 0.000 0.000 0.000 0.032 0.000 0.000 0.000 0.396 0.447 0.464
0.002 0.034 -0.009 -0.032 0.194*** -0.006 0.061** 0.353*** -0.123*** -0.088*** 0.016 -0.039 0.034 -0.071** 0.057* -0.021 0.028 Pacific Islander
0.959 0.262 0.761 0.279 0.000 0.839 0.040 0.000 0.000 0.006 0.632 0.225 0.293 0.028 0.077 0.567 0.391
0.801*** 0.755*** -0.797*** -0.773*** -0.382*** 0.235*** -0.086*** -0.153*** -0.793*** -0.083*** -0.002 0.602*** -0.528*** -0.192*** -0.071** -0.030 -0.001 White not Hispanic
0.000 0.000 0.000 0.000 0.000 0.000 0.004 0.000 0.000 0.006 0.941 0.000 0.000 0.000 0.029 0.403 0.984
Multiple or No 0.034 0.038 -0.029 -0.024 0.056* 0.019 -0.011 0.064** -0.059** 0.015 -0.004 0.029 -0.002 -0.013 -0.022 0.029 -0.069** Response 0.258 0.202 0.331 0.423 0.063 0.527 0.710 0.031 0.049 0.622 0.883 0.375 0.957 0.699 0.489 0.431 0.034
Fully Credentialed 0.609*** 0.468*** -0.531*** -0.460*** -0.401*** 0.164*** 0.166*** 0.079*** -0.518*** -0.022 0.598*** 0.036 -0.863*** -0.107*** -0.110*** -0.032 -0.004 Teachers 0.000 0.000 0.000 0.000 0.000 0.000 0.000 0.008 0.000 0.460 0.000 0.231 0.000 0.001 0.001 0.374 0.895 Emergency Credentialed Teachers
-0.558***
0.000
-0.434***
0.000
0.465***
0.000
0.406***
0.000
0.361***
0.000
-0.153***
0.000
-0.170***
0.000
-0.095***
0.001
0.464***
0.000
0.027
0.365
-0.525***
0.000
-0.008
0.787
-0.871***
0.000
0.153***
0.000
0.105***
0.001
0.024
0.510
0.049
0.130
Year Round -0.275*** -0.261*** 0.193*** 0.275*** -0.034 -0.070** -0.129*** -0.036 0.270*** -0.082*** -0.190*** -0.018 -0.138*** 0.165*** 0.026 -0.025 -0.030 Indicator 0.000 0.000 0.000 0.000 0.251 0.020 0.000 0.230 0.000 0.006 0.000 0.542 0.000 0.000 0.417 0.486 0.358
-0.118*** -0.065** 0.111*** 0.009 0.159*** 0.033 -0.032 0.027 0.013 0.042 -0.076** -0.024 -0.150*** 0.143*** 0.035 -0.069* 0.000 School Mobility
0.000 0.031 0.000 0.762 0.000 0.266 0.292 0.370 0.673 0.157 0.011 0.413 0.000 0.000 0.247 0.059 0.995
0.023 0.033 -0.017 -0.043 0.012 -0.094*** 0.023 -0.072** 0.028 -0.025 -0.024 0.024 -0.040 0.032 -0.041 -0.047 0.344*** 4-6 Class Size
0.501 0.336 0.620 0.206 0.725 0.005 0.503 0.033 0.404 0.459 0.472 0.475 0.234 0.346 0.220 0.160 0.000
0.067** 0.084*** -0.073** -0.083*** 0.050* -0.099*** 0.001 0.016 -0.027 0.021 0.009 -0.067** -0.003 0.053* -0.055* -0.004 0.350*** Core Class Size
0.026 0.006 0.015 0.006 0.098 0.001 0.984 0.596 0.377 0.488 0.768 0.027 0.919 0.081 0.070 0.892 0.000
Note: Correlations are bivariate correlations with each observation (school) weighted by the number of valid test scores.
Each cell contains the correlation (top) and its statistical significance (bottom in italics).
* = Significant at the 0.10 level. ** = Significant at the 0.05 level. *** = Significant at the 0.01 level. 28
April, 2000 PSAA Technical Report 00-1
Appendix D: Correlations for High Schools (weighted by the number of tests contributing to the API) Above the diagonal: Model 1 correlations (schools with at least 50% of students with parental education data, n = 734)
Below the diagonal: Model 2 correlations based on all schools (n = 839)
API Parent Free or English African American Asian Filipino Hispanic or Pacific White not Multiple or Fully Emergency Year Round School Core Education Reduced Learners American Indian or Latino Islander Hispanic No Credentialed Credentialed Indicator Mobility Class Size
Lunch not Hispanic Alaska Native Response Teachers Teachers
0.930*** -0.803*** -0.695*** -0.318*** 0.089** 0.300*** 0.039 -0.800*** -0.011 0.742*** 0.007 0.486*** -0.457*** -0.327*** -0.198*** -0.084** API
0.000 0.000 0.000 0.000 0.016 0.000 0.293 0.000 0.759 0.000 0.851 0.000 0.000 0.000 0.000 0.024
0.924*** -0.848*** -0.771*** -0.131*** 0.085** 0.212*** 0.097*** -0.869*** 0.055 0.759*** 0.035 0.430*** -0.382*** -0.393*** -0.124*** -0.069* Parent Education
0.000 0.000 0.000 0.000 0.022 0.000 0.009 0.000 0.136 0.000 0.340 0.000 0.000 0.000 0.001 0.065
Free or Reduced -0.799*** -0.836*** 0.749*** 0.240*** -0.070* -0.101*** -0.073** 0.745*** -0.059 -0.736*** -0.088** -0.394*** 0.304*** 0.365*** 0.185*** 0.078** Lunch 0.000 0.000 0.000 0.000 0.057 0.006 0.047 0.000 0.113 0.000 0.017 0.000 0.000 0.000 0.000 0.036
-0.689*** -0.752*** 0.737*** 0.055 -0.205*** 0.085** -0.057 0.735*** -0.042 -0.731*** -0.087** -0.295*** 0.215*** 0.329*** 0.121*** 0.147*** English Learners
0.000 0.000 0.000 0.140 0.000 0.022 0.122 0.000 0.252 0.000 0.019 0.000 0.000 0.000 0.001 0.000
African American -0.326*** -0.140*** 0.238*** 0.062* -0.112*** -0.008 0.119*** -0.032 0.228*** -0.389*** 0.021 -0.340*** 0.243*** 0.019 0.365*** 0.025 not Hispanic 0.000 0.000 0.000 0.074 0.002 0.838 0.001 0.393 0.000 0.000 0.578 0.000 0.000 0.606 0.000 0.509
American Indian or 0.078** 0.076** -0.067* -0.197*** -0.105*** -0.088** -0.076** -0.211*** -0.004 0.234*** 0.018 0.184*** -0.154*** -0.086** 0.017 -0.159*** Alaska Native 0.023 0.028 0.054 0.000 0.002 0.017 0.040 0.000 0.923 0.000 0.630 0.000 0.000 0.019 0.646 0.000
0.298*** 0.217*** -0.109*** 0.073** 0.005 -0.084** 0.167*** -0.293*** 0.079** -0.193*** -0.051 0.090** -0.133*** -0.164*** 0.027 0.103*** Asian
0.000 0.000 0.002 0.035 0.895 0.015 0.000 0.000 0.033 0.000 0.170 0.015 0.000 0.000 0.460 0.006
0.022 0.077** -0.064* -0.050 0.116*** -0.073** 0.155*** -0.106*** 0.371*** -0.208*** -0.005 0.027 -0.047 -0.078** 0.210*** 0.074** Filipino
0.522 0.025 0.066 0.146 0.001 0.034 0.000 0.004 0.000 0.000 0.893 0.464 0.204 0.034 0.000 0.045
-0.796*** -0.861*** 0.745*** 0.723*** -0.034 -0.205*** -0.306*** -0.093*** -0.138*** -0.768*** -0.074** -0.435*** 0.381*** 0.408*** 0.039 0.126*** Hispanic or Latino
0.000 0.000 0.000 0.000 0.320 0.000 0.000 0.007 0.000 0.000 0.045 0.000 0.000 0.000 0.293 0.001
-0.041 0.026 -0.047 -0.015 0.240*** -0.002 0.095*** 0.367*** -0.134*** -0.090** -0.017 0.067* -0.062* -0.148*** 0.137*** 0.111*** Pacific Islander
0.239 0.446 0.177 0.674 0.000 0.965 0.006 0.000 0.000 0.015 0.648 0.072 0.091 0.000 0.000 0.003
0.750*** 0.760*** -0.737*** -0.722*** -0.395*** 0.226*** -0.183*** -0.211*** -0.766*** -0.107*** 0.019 0.499*** -0.385*** -0.307*** -0.237*** -0.181*** White not Hispanic
0.000 0.000 0.000 0.000 0.000 0.000 0.000 0.000 0.000 0.002 0.605 0.000 0.000 0.000 0.000 0.000
Multiple or No 0.008 0.033 -0.086** -0.085** 0.017 0.022 -0.050 -0.006 -0.073** -0.017 0.022 -0.099*** 0.065* 0.129*** -0.025 -0.049 Response 0.828 0.338 0.013 0.014 0.618 0.522 0.148 0.870 0.034 0.615 0.517 0.008 0.078 0.000 0.492 0.187
Fully Credentialed 0.480*** 0.418*** -0.392*** -0.286*** -0.325*** 0.170*** 0.104*** 0.016 -0.431*** 0.073** 0.486*** -0.090*** -0.800*** -0.321*** -0.230*** -0.009 Teachers 0.000 0.000 0.000 0.000 0.000 0.000 0.003 0.640 0.000 0.034 0.000 0.009 0.000 0.000 0.000 0.810 Emergency Credentialed Teachers
-0.459***
0.000
-0.373***
0.000
0.317***
0.000
0.215***
0.000
0.253***
0.000
-0.147***
0.000
-0.138***
0.000
-0.045
0.194
0.378***
0.000
-0.067*
0.054
-0.386***
0.000
0.057
0.101
-0.810***
0.000
0.197***
0.000
0.166***
0.000
0.093**
0.012
Year Round -0.321*** -0.387*** 0.367*** 0.338*** 0.004 -0.081** -0.162*** -0.076** 0.408*** -0.139*** -0.304*** 0.124*** -0.326*** 0.207*** 0.080** -0.072* Indicator 0.000 0.000 0.000 0.000 0.916 0.019 0.000 0.027 0.000 0.000 0.000 0.000 0.000 0.000 0.031 0.051
-0.187*** -0.132*** 0.188*** 0.138*** 0.295*** 0.023 0.016 0.177*** 0.057* 0.093*** -0.217*** 0.003 -0.197*** 0.125*** 0.095*** 0.017 School Mobility
0.000 0.000 0.000 0.000 0.000 0.515 0.635 0.000 0.099 0.007 0.000 0.921 0.000 0.000 0.006 0.656
-0.080** -0.061* 0.069** 0.113*** 0.017 -0.157*** 0.083** 0.052 0.115*** 0.073** -0.154*** -0.061* 0.013 0.096*** -0.076** -0.028 Core Class Size
0.021 0.079 0.047 0.001 0.625 0.000 0.016 0.137 0.001 0.034 0.000 0.080 0.704 0.005 0.029 0.419
Note: Correlations are bivariate correlations with each observation (school) weighted by the number of valid test scores.
Each cell contains the correlation (top) and its statistical significance (bottom in italics).
* = Significant at the 0.10 level. ** = Significant at the 0.05 level. *** = Significant at the 0.01 level. 29