Embed Size (px)
Citation preview

Construction of a Genetic Map and QTL Mapping for Turnip Tuber Traits Using an Recombinant Inbred Line Population from a Cross
between Turnip and Rapid Cycling in Brassica rapa
Minor Thesis Report (PBR-80424)
Temesgen Menamo (Reg. No. 860717-557-050)
Supervisors: Dr. Ningwen Zhang
Dr. Guusje Bonnema
Laboratory of Plant Breeding, Wageningen University
The Netherlands, Wageningen
January, 2013

Construction of a Genetic Map and QTL Mapping for Turnip Tuber Traits Using an Recombinant Inbred Line Population from a Cross
between Turnip and Rapid Cycling in Brassica rapa
Minor Thesis Report (PBR-80424)
Temesgen Menamo (Reg. No. 860717-557-050)
Supervisors: Dr. Ningwen Zhang
Dr. Guusje Bonnema
Examiners: Dr. Guusje Bonnema
Dr. Ningwen Zhang
Laboratory of Plant Breeding, Wageningen University
The Netherlands, Wageningen
October-January, 2013

i
Acknowledgement
I would like to thank the Brassica group leader Guusje Bonnema for giving me this opportunity to join
in this group. I would like to thank Ningwen for support, guidance and encouragement in doing each
part.
I thank to Johan Bucher for his support in lab work.
I would like to acknowledge NFP for financially supporting until finishing of my study.
Last but not least for all Brassica group members for support by ideas.

Abstract This study described on construction of a genetic linkage map based on 110 SNPs and 14 InDels
markers on Brassica rapa. It also described turnip tuber related traits QTLs for the Brassica rapa. An
recombinant inbreed line population consists of 106 F6/7 individual lines derived from a cross
between VT-115 and RC-144 were used for the present study. The Kosambi mapping function was
used for linkage map to convert recombination frequencies into map distances (cM). A total of 61
markers were mapped over 13 newly constructed linkage groups. Linkage group 01, 02 and 09 had
two linkage groups. The alignment and orientation of the newly constructed linkage groups were
agreed with existing B. rapa linkage maps from chiifu genome. The map covered a total of 639.5 cM
of the genome with an average linkage length (coverage) of 49.2 cM and an interval distance of 10.5
cM. The length of linkage groups ranged from 1.0 cM to 183.8 cM for L01_1 and L09_1 respectively.
The turnip tuber related QTLs was made by Kruskal- wallis Mapping. A total of 94 turnip related
QTLs were detected at significant level of ≤0.1 in all newly constructed linkage groups except L01_1
and L04. Out of the total 18 for Brix (total Soluble Sugar), 29 for turnip tuber fresh weight, 26 for
turnip tuber dry weight and 21 for turnip tuber dry mass. Dry weight per turnip tuber, fresh weight
turnip tuber and weight per turnip co-located together on linkage group A02 at flowering QTL loci.
this paper would like to recommend making linkage and QTLs mapping with more number of
individuals and markers. It gives accurate and precise linkage groups and QTLs maps.
Keywords: Brassica rapa, SNPs, InDels, linkage map, QTL

Table of Contents
Acknowledgement .................................................................................................................................... i
Abstract ....................................................................................................................................................ii
1. Introduction ..................................................................................................................................... 1
1.1. Background on Brassica ........................................................................................................... 1
1.2. Economic importance .............................................................................................................. 2
1.3. Morphological description ...................................................................................................... 3
1.4. Brassica rapa breeding Objectives .......................................................................................... 3
1.5. Molecular Markers and Development of Genetic Linkage Maps ............................................ 3
1.6. Scope of the thesis .................................................................................................................. 5
2. Method and Material ...................................................................................................................... 6
2.1. Parental material ..................................................................................................................... 6
2.2. DNA extraction ........................................................................................................................ 6
2.3. LightScanner ............................................................................................................................ 7
2.4. Pre-Screening markers with polymorphism ............................................................................ 8
2.5. Markers and Genotyping ......................................................................................................... 8
2.6. Linkage map construction ....................................................................................................... 9
2.7. Phenotype and QTLs mapping ................................................................................................. 9
3. Results and discussion ................................................................................................................... 10
3.1. Pre-Screening of marker with polymorphism and Genotyping ............................................ 10
3.2. Linkage map construction ..................................................................................................... 12
3.3. Frequency distribution of turnip tuber traits ....................................................................... 17
3.4. QTL analysis ........................................................................................................................... 18
4. Conclusion and recommendation ................................................................................................. 23
References ............................................................................................................................................. 24
Appendixes ............................................................................................................................................ 27

1
1. Introduction
1.1. Background on Brassica
Brassica has a large plant family with 338 genera and 3,700 species, including a wide range of
horticulture crops, which have great economic value and grown as vegetables, fodders, sources of
oils and condiment (Al-Shehbaz et al., 2006; Campo, 1999; Zhao et al., 2010). The model plant
Arabidopsis is also closely related to the genus Brassica (Ostergaard and King, 2008) which can be
exploited to find orthologous genes from Arabidopsis with known function. This is more
advantageous for genetic study for Brassica genus. This Brassica genus has six species including: B.
rapa, B. nigra, B. oleracea, B. juncea, B. napus and B. carinata. The three diploid Brassica (B. rapa, B.
nigra and B. oleracea) species forming the Triangle of U (figure 1), have hybridized in all possible
combinations to produce the three allotetraploid species; B. juncea, B. napus and B. carinata
(Nagaharu, 1935; Ostergaard and King, 2008). Brassica Rapa species has a diploid (2n=20) genotype
and is a morphological diverse including vegetable and oilseed crops ( turnip types, leafy types and
oil types) such as: Chinese cabbage (Brassica Rapa subsp. pekinensis), non-heading pak choi (Brassica
rapa subsp. Chinensis), turnip (Brassica rapa subsp. rapa L.), turnip rape ( Brassica rapa), and Sarson
(Brassica rapa L. var. trilocularis) (Song et al., 1995). Turnip (Brassica rapa subsp. rapa L.) is
domesticated in very ancient time and was used for human consumption and animal feed (Vogl-
Lukasser et al., 2008). It believes that the turnip was the first domesticated Brassica species and
naturally grown from the Western Mediterranean region to central Asia (Campo, 1999). Europe and
Eastern Asia are one of the center of diversity for B. rapa subsp. rapa. It is grown popular in Europe
starting from 2500-2000 BC, the Middle East is starting 1000 BC and Asia starts around 1800 B.C
(Vogl-Lukasser et al., 2008).
2
Figure 1. The "Triangle of U" diagram, showing the genetic relationships of six species in the genus Brassica (Nagaharu, 1935).
1.2. Economic importance
Brassica rapa is one of important crop among the six economically cultivated Brassica species of U’s
triangle. It is cultivated all over the world as a vegetable for food and fodder for animals. Brassica
rapa var. Chinese cabbage and var. chinensis (leaf cabbage) are extensively grown as important
market garden vegetables in China. The main economic important part of the turnip is hypocotyl with
tap root but the leaves are also used for fodder as well as for food. The turnip greens (tops) are
excellent chopped in salads or cooked briefly as a side dish. Turnip also used for flavor in ingredient
soups and a winter salad. It also used in different dishes in some country like India and Pakistan. The
nutrient composition of turnip (USDA, 2011), it has more calcium and sodium mineral, particularly
rich in vitamin C, very low fat and proteins (USDA, 2011). Brassica vegetables are rich in
glucosinolates, a chemical which can block the growth of human cancer cells (He et al., 2012; Kushad
et al., 1999; Rosa et al., 1997).

3
1.3. Morphological description
Flower agronomic traits are important for vegetative as well as for turnip which related to the
quantity and quality of turnip tuber formation. The flowers are small, yellowish color and clustered
at the top of the raceme. It produces pea-like pods which contain seeds. Turnip is a biennial crop but
most commonly grown as an annual. The first year the plants grow to be used for human
consumption in their hypocotyl with tap root and the second year produce flowers and set seed.
Traditionally, turnip is called root crop but actually it is not a root at all. It consists mainly of the
hypocotyl as well as main root. Hypocotyl is plant part that lies between the main root and the first
seedling leaves (cotyledons) which grows below or above the surface of the soil. It also has little or
no neck and a distinct tap root( Brassica group, Wageningen University).
1.4. Brassica rapa breeding objectives
Brassica rapa has a wide genetic variability, it helps to important traits and improvement in this
crop. Recent advanced genetic marker techniques can supplement for improving of the agronomical
important traits of this crop since conventional genetic analyses and breeding also could success in
the improvement of many traits. Genetic analysis and identification of chromosomal regions which
containing agronomic important morphological traits would be helpful in breeding for desired traits.
Many root crops or root like crops can undergo considerable root radial growths which would be
suitable for food. Turnip is one of fleshy and edible hypocotyl crop. So, it is important to improve the
quality and quantity of the turnip yields.
1.5. Molecular Markers and Development of Genetic Linkage Maps
Most of agriculturally important traits (yield, flowering time and some of disease resistance) are
controlled by many genes, called quantitative traits (polygenic) which contain genes associated with
a particular quantitative trait are known as quantitative trait loci (QTLs) (Collard et al., 2005). Brassica
Rapa has a large number of morphological differences including flowering time and turnip tuber
formation. Vegetative turnips have a very high morphological diverse among turnip genotypes
(Yildirim et al., 2010) including; flowering, turnip onset, turnip shape, size and so on.
There are several molecular linkage maps in B. rapa have been developed using RFLP, RAPD,
AFLP, and SSRs molecular markers and mapping populations such as F2, DH, RIL. In Arabidopsis (El-
Assal et al., 2001) and some of Brassica rapa (Lou et al., 2007) studied at the co-location of QTL for
4
floral and other growth-related traits. Several studies are observed in QTL flowering time and turnip
tuber formation in different populations in the Brassica rapa at Wageningen University by Brassica
group members. The genetic of turnip tuber formation studied by SSR and InDel molecular markers
to profile an F2 population derived from a cross between a Vegetable Turnip (VT-115) and a Wutacai
(PC-105) (Wang, 2011). He also studied morphological traits of the corresponding F3 population in
the field and the reliability of InDel markers and LightScanner. He observed phenotypic variation in F3
population even unexpected variation also. For instance, red or purple color in leaves and/or turnips,
since both of the parents (VT-115 and PC-105) didn’t have this type of trait. He found ten markers to
be associated with leaf traits eight of which are associated with leaf number, spreading over linkage
group A01, A02, A03, A05, A09, and A10.
Vernalization caused delays of turnip onsets which unvernalized turnips are caused by the
earlier turnip swelling onset (Visser, 2010). This study also showed that a strong correlation between
turnip traits (diameter and width) and the swelling onset as significantly delayed by vernalization. In
addition to vernalization, the study also had shown the turnip swelling onset different between
genotypes. The study used three turnip growth candidate genes but only one marker (nw_60) was
associated with turnip traits (diameter and width).
A total of 27 QTL detected which were affecting 20 morphological traits from population F2/3
crossing Rapid cycling vs. Chinese cabbage; double haploid from Yellow sarson, Pak choi, and a
Japanese vegetable turnip variety. From those of it, eight linkage groups are detected for flowering
time on R01, R02, R03, R06, R07, R08, and R10 in all populations ( F2/3, DH-38, DH-30, and BC1) in
different growing seasons (Lou et al., 2007). It shows the major flowering time QTL (FLQTL-2)
detected in all populations on linkage group R02 co-localized with BrFLC2. This study also detected a
single QTL for the turnip traits at the top of R02 which co-localizes with the major flowering time QTL
(FLQTL-2).
The major flowering time QTL detected in different Brassica rapa populations on linkage
group R02 co-localized with BrFLC2. FLOWERING LOCUS T (FT) also identified in Arabidopsis as a
main component of the florigen or mobile flowering promoting signal produced in the leaves
(Abelenda et al., 2011). This locus has a homologous gene in Brassica rapa. For instance, BrFLC5 gene
homologous to FLC regions to Arabidopsis (Schranz et al., 2002).

5
1.6. Scope of the thesis
The two parental lines crosses VT-115 x RC-144 originated from Japan (VT-115) and USA (RC-144).
Between these two parental lines there are different flowering time which RC-144 is an early
flowering type than VT-115 (discussion with Ningwen) and they are different morphotype (VT-115
vegetative turnip; RC-144 oil type). The frequency distribution of this population had shown similar
pattern in F2 and F3 progenies (Rémi, 2010). Phenotyping in F2 population could not repeated and
the genotype comes from the combination of two parents while RILs are homozygous lines each
harbours different combination of two parental genome fragments. QTLs mapping using of
dominant F2 population is less accurate when compared to RILs (Ferreira et al., 2006).
The scope of this thesis was:
to construct a genetic map of 106 lines of an RIL population (F6/7)from a cross between VT-
115 and RC-144
to detect turnip tuber related QTLs to the constructed linkage groups

6
2. Method and Material
2.1. Parental material
The mapping population have been consisted of 106 RILs F6/7 populations developed by single-
seed descent from the cross Brassica rapa accessions; Vegetable turnip VT-115 as female and Rapid
cycling line RC-144 as male from a laboratory of Plant breeding, Brassica group, Wageningen
University. VT-115 is vegetable turnip which originated from Japan and RC-144 is rapid cycling which
originated from the USA. Between these accessions, the flowering time is different (discussion with
Ningwen) which RC-144 line has earlier flowering time than VT-115 (Zhao et al., 2005).
This population (36RIL) is flowering time between 30 and 78 days after sowing which it gives
very early turnips formation. During F2 QTLs detection, it showed that all markers the average turnip
size of plants with the “a” genotype (VT-115) was always bigger than the group with the “h”
genotype, “h” heterozygous progenies have been always bigger than the “b” genotype (PC-144) (Vos,
2009). So, this indicates the co-dominance of turnip tuber related genes.
2.2. DNA extraction
The samples of 150 populations RIL36 F6/7 were collected from greenhouse grown condition. The
protocol for DNA isolation (Gert van Arkel & Maarten Nijenhuis) was adapted from laboratory of
plant breeding, Wageningen University. The leaf samples already were collected and put in the 96
micronic tubes with 2 steel balls in a blue holder in liquid nitrogen. Two hundred ml of isolation
buffer was prepared with 4mg/ml of RNase. The isolation buffer was put in water bath with 65OC
until used. The samples were fixed in the RETCH machine with the blue holder without the
transparent lid into a black and white adapter. The samples Milled for 30 seconds at 30 Hz for three
times with the changing of the direction of the holders. After 1 ½ minute the entire blue holder with
the tubes was back into liquid nitrogen. The boxes were Centrifuge briefly in order to get the powder
in the bottom of the tube. The isolation buffer (400 µl) was added to each the tube. For safety
purpose each chemical added in the fumehood. The blue holder with samples and without the
transparent lid placed in the specially designed clamp and tight the 4 nuts (This will prevent that the
lids not pop off after incubation at 65°C) for incubate at 65°C in a water bath for 60 minutes. The
clamp containing the tubes cooled down for 15 minutes on ice-water. Four hundred µl of chloroform:
isoamyalcohol (24: 1) was added to the tubes and mixed by inversion for 5 minutes by machine. The
phases separated by centrifuging at 4600 rpm for 40 minutes. The water phases were Pipettes

7
2X175µl in to the new tubes and 280 µl isopropanol was added. It had mixed carefully by the
inversion blue holder with tubes. The DNA pelleted by centrifuging for 25 minutes at 4600 rpm. The
supernatant was discarded and 300µl of 70% ethanol was added. The samples again centrifuge for 20
minutes at 4600rpm for pellet the DNA. The supernatant was discarded and the pellet dried
overnight in the fumehood. The DNA concentration was checked by NANOdrop. The quality of DNA
was also checked on a 1% agarose gel by putting of the 2µl DNA sample, 8µl MilliQ and 2µl of loading
buffer; total 12µl.
2.3. LightScanner
The LightScanner machine is high-resolution DNA melting curve (HRM) which provides post-PCR
detection of mutations SNPs in genomic DNA. It detects high-density information of the fluorescence
as a function of temperature which contain double-strand DNA binding dye LCGreen Plus. LCGreen
has the ability to detect the presence of heteroduplexes formed during PCR if the sample is
heterozygous for a particular mutation when compared to other DNA dye ( e.g. SYBR Green). The
main advantage is faster (1.5 hour for PCR and half an hour for measuring and analysis) when
compare to Li-Cor procedure (3 hours for PCR and 2 hours Li-Cor) which eliminating the need for
DGGE gels. SNP genotype scoring by high-resolution melting analysis is required only PCR, a DNA dye
(LCGreen), and melting instrumentation which completed within 5 minutes after completion of PCR.
It is simple, rapid, inexpensive and no-need of post PCR reagents. It also detects the SNPs (sequence
variations) without the need for dye-labelled probes.
The Lightscanner has specific master mix and PCR program. The master mix was prepared:
MillQ water 4.5 µl, reaction buffer for phire 2 µl, dNTP 0.4µl, primer (diluted) forward and reverse 0.5
µl, LC-green 1µl, and Phire enzyme 0.1µl per master mix. Finally, 9 µl of master mix, 1 µl DNA and 20
µl mineral oil were added into PCR plate in black-white with 96-wells for amplification of the DNA.
The mineral oil helps to avoid evaporation of the samples during Hi-Res Melting.
Hi-Res Melting is shown a melting curve of the DNA which changes of the shape of the curve
within one marker, it is indicating of the presence of sequence variances in the PCR product. The first
step in the analysis defined subsets which define by DNA markers. Negative filter also was done to
identify any samples that were included on the plate but failed PCR reactions. It helps to avoid the
possibility of generating false positive data during the next step, normalization. Normalization is
important before doing of analysis of the data. The two regions were selected one before and one
after the major transition. The region shouldn’t show any melting curves difference after the selected
region. It should be shown a straight line out of selected regions. The final step is grouping of the
DNA templates according to melting curves. The grouping of genotyping was made to automate

8
clustering when different curve shapes can be clearly distinguished. However, if confusing curve
shapes happen, the automated clustering changed to manually select samples that share similar
curve shapes based on difference temperature of melting peaks .
2.4. Pre-Screening markers with polymorphism
Pre-screening of the markers was made by LightScanner; testing the polymorphism of the markers.
Before starting genotype scoring of the whole RIL36 F6/7 population, pre-screening of the
polymorphic marker test was made on 6 progenies with parents (VT-115 X PC-144). A total of 137
markers were pre-screened. Those markers were developed Dong Xiao to detect flower related QTL
on DH-68 population of Brassica rapa subspp rapa . Simultaneously, genotype scoring of those of 6
progenies was done when they were shown a polymorphic for specific markers.
2.5. Markers and Genotyping
Flowering traits
A total of 137 markers were selected by Xiao Dong for his study on flowering traits of F1 double
haplod from crossing yellow Sarson (YS-143) and Pak Choi (PC-175) population(Xiao et al.,
Unpublished). He develop the markers based on arabidopsis genes which are involved in flowering
time control. He also BLAST the Arabidopsis those genes sequences in Chinese cabbage Chiifu
genome sequence; Brassica genome database; to get paralogues in Brassica rapa. I screened those
137 markers on 144 RILs C36 populations.
InDels and SNPs
Genome-wide Brassica rapa short insertion/deletion length polymorphisms (InDels) (<5 bp) were
detected by comparing whole genome re-sequencing data from two B. rapa accessions, L144 and
Z16, to the reference genome sequence of Chiifu-401-42. Previously tested 14 InDel polymorphisms
(4~5 bp in length) between L144 and Z16 also showed polymorphisms between VT-115 and RC-144,
and therefore included in the map construction of this study. SNPs markers were generated from re-
sequencing data which compared five re-sequenced genomes (Chiifu, DH-VT-117, RC144, DH-YS143
and a Wutaicai DH line) and detected SNPs between each of the two genomes. The genotyping using
these SNP markers was done through KARSPar SNP genotyping system from Kbioscience
(Hoddesdon, Hertfordshire, UK). Genotyping data of the same RIL population with 51 SNPs that
randomly distributed in B. rapa genome was included in the map construction in this study as well.

9
2.6. Linkage map construction
For construction of a genetic linkage map a total of 124 markers (SNPs & InDels) in 106 F6/7
population were used. Before linkage analysis, chi-square tests (X2) were performed on both all
markers for goodness of fit to the expected Mendelian 1:1 segregation ratio of each locus. Linkage
analysis was performed with the Joinmap 4.1 and the Kosambi mapping function (Manly et al., 2001)
was used to convert recombination frequencies into map distances (cM). Initially, the maximum of
0.20 recombination frequency was used to identify linkage groups. Linkage maps were drawn using
MapChart software (Voorrips, 2002). A framework physical map of FT markers was previously
constructed by Xiao dong, which corresponds to the linkage groups of Brassica genome. The 51 SNPs
and 14 InDels markers also incorporated into the frame based on their physical position in the
reference genome of Chiifu-402 retrieved from BRAD database.
2.7. Phenotype and QTLs mapping
Seeds were sown on 30 July 2012 in greenhouse and plants were transplanted into field on 21 August
2012. For each line, three blocks with five plants in each block according to a complete randomized
block design. Harvesting took place in three patches according to their flowering time. Because
turnip growth turns slower after flowering and it might not be fair to harvest plants all in once. So
harvest made in three patches to allow different lines reaching the maximal size while not losing
much of fresh weight and not differ too much for other metabolic changes. First harvest was on 1-oct
2012, second time was on 12-oct and the last harvest was on 31-oct in the same year. The flowering
turnip only harvested the first two harvests. The lastly, all leftover plants harvested, including the
ones that were not flowering yet. QTL map was made, nonparametric mapping method, it uses the
rank sum test of Kruskal- wallis MapQTL6 mapping statically software (Ooien et al., 1996) with 0.1 a
significant level of ≤0.1. Four turnip tuber traits were used for QTLs.

10
3. Results and discussion
3.1. Pre-Screening of marker with polymorphism and Genotyping
Construction of a genetic linkage map using a bi-parental segregating population needs to develop
many molecular markers that show polymorphism between the parents as well as in the progeny. In
laboratory of the plant breeding WUR, Dong Xiao has developed and mapped 137 flowering related
markers using a doubled haploid population DH68 which was derived from a cross between YS-143
(oil type) and PC-175 (leafy type). Those 137 markers were developed from B. rapa sequences with
high homolog (>75% nucleotide sequence identity) to flowering time related genes in Arabidopsis
thaliana (Xiao et al., Unpublished). Polymorphism test was made on those 137 flowering markers on
6lines from F6/7 RIL36 population. The DNA of the real parents was missing. The DNA of a plant from
another accession of the parents was used as references which the parents consider as genetic
similarity. These parents are representative but not really identical with the real parent genotypes.
Therefore, selection of markers was made based on screening of two parents representatives and six
RIL progenies. As a result, 59 markers out of 137 showed polymorphism in the RIL population of a
cross between VT-115 and RC-144 (Appendix 1). The polymorphism was identified when two groups
were formed on those 6 progenies and parents. For instance, BrSPA1P2a was one of marker showed
polymorphic between F6/7 progenies (Figure 2).
Figure 2. pre-screening of BrSPA1P2a marker which shows a polymorphic within 6 progenies and
parents( brown from VT-115 parent and red from RC-144parent ).

11
Genotyping of the polymorphic markers during pre-screen as well as on all RIL population was
made. However, the genotyping was divided into three parts: easy, medium and too difficult to
genotype scoring (Figure 3). The easy and too difficult one was rear but most of the markers were
medium; there were manual scoring of the genotype. The lightScaner give the scoring directly for
the easiest markers. The lightScaner sometimes gives different colour but they look like belong to
one group ( Figure 3B). Figure 3B shows that BrPHYAP1g markers had 3 colours. The green colour was
belong to red colour. This type of marker/s made some correction manually such as making green
colour belong to red colour. Some markers also showed polymorphic but not easy to score e.g.
BrRGAP2c (F9gure 3C).
Figure 3. genotyping style A) easy, B) medium and C) difficult to make genotype scoring.

12
3.2. Linkage map construction
A genetic linkage map was constructed based on 124 markers in 36RILs populations of 106 F6/7
progeny lines. In total, 79 markers (60% of total markers) were scored as 1:1 ratio (5 to 2%
heterozygous loci) with equal contribution from both parents. A total of 11 InDels and 34 SNPs
showed significant distortion from the expected Mendelian gene frequencies. The chi-square tests
confirmed that on those 11 InDels and 34 SNPs markers the frequencies of individual parental alleles
in the F6/7 population indicated a significant deviation (P≤0.05) from the expected 1:1 ratio.
Theoretically, F6 population is considered a RIL and presents an exception of 1:1 ratio for allele
segregation among individuals with 3% of individuals should show as heterozygous. As a result, 9
InDels and 17 SNPs markers were distributed to the skewed segregation with highly significance at P
value 0.0001. In most of Brassica rapa linkage maps skewed segregation of markers is a common
feature (Choi et al., 2007; Xinhua, 2011; Kapoor et al., 2009). Some researchers were reported that
might be due to loss of chromosomes, the presence gene conversion event and homologous
recombination.
The markers which showed distorted segregation were distributed randomly along all the
linkage groups. In total 61 markers were grouped into 13 linkage groups, with the number of markers
per linkage group ranged from 2 (linkage 1,2 and 10) to 12 (linkage 9), and covered a total of 639.5
cM of the genome (Figure 3). This might be due to insufficient linkages and lack of polymorphism
spanning those regions. Lower number of individuals showed higher stress values and higher
distance variances as well as wide deviation from estimates of the genome size(Ferreira et al.,
2006).The thirteen linkage groups had the average interval distance of 10.5 cM. The number of
markers which used for mapping per linkage ranged from 6 (linkage 4) to 24 (linkage 9), with an
average of 11 markers per linkage group. On linkage L02_1, L02_2 and 10 have been shown only 2
markers were found per linkage group. The length of linkage groups ranged from 1.0 cM for group
L01_1 to 184 cM for group L09_1. Markers BrPHYAP1g, BrVRN1P1b and BrRGAP2c showed
polymorphism in the population, but were excluded during mapping analysis as the scoring of light
scanner output was too difficult and not reliable.
All linkage groups contained region which the adjacent marker larger than 15 cM except in
linkage groups L01_1, L06, L09_2and L10 (Table 1). The linkage groups placement and order for 124
of the SNPs and InDels markers were in good agreement with Brassica rapa flowering markers map
(Xiao dong, DH68). However, markers PV_Br_SNP_0125 were placed on linkage group L07, while it
was predicted to locate on A02 in the reference Chiifu genome. It might be many reasons, such as

13
small population size, lack of recombination between the limited number of markers, true inversion
or translocation of between genotypes.
Two linkage group was observed in linkage 1 and 9. However, the first group was only
contained two markers in linkage group L01. On linkage group 2 also showed two linkage groups with
only two markers per linkage group. On linkage groups 3, 4, 6, 8 and 10 were from only SNPs marker.
The two linkage groups on L09 the placement and order were agreed with the physical map of
Brassica rapa physical map which developed from chiifu genome except loci BrSVPP1c and
PV_Br_SNP_0796 ( Figure 3).
Table 1. Summary of a genetic linkage map construction on Brassica rapa using SNPs and InDels
markers.
Linkage group Number of markers assigned
Number of intervala
Number of gapsb
Length of linkage groups(cM)
L01_1 2 0 0 1.0 L01_2 6 6 2 65.3 L02_1 2 2 2 33.5 L02_2 2 2 2 24.8 L03 3 3 3 50.3 L04 3 3 3 63.8 L05 6 6 2 43.4 L06 4 4 0 23.0 L07 6 6 2 56.0 L08 7 7 1 41.8 L09_1 12 12 7 183.8 L09_2 6 6 0 39.2 L10 2 2 0 12.4 aAdjacent markers > 1cM
bDistance between adjacent markers 15cM (Choi et al., 2007; Kapoor et al., 2009b;
Wang et al., 2011)

14
Figure 3. Comparing of newly constructed linkage groups (right side(Lx)) to Brassica rapa physical map(left side(Ax)); The length of each genetic linkage
groups are indicated in centimorgans (cM) and the length for the physical map is in million base pairs (Mbp, A01-A10) .The cM of LX linkage groups was
0.1cM instead of 1CM to make it easy; because the physical map was constructed based on Mbp with maximum 50. The genetic map was greater than
50cM. The colour markers indicate the newly SNPs(rose) and InDels (green) markers.
Bra0110240.0VEL10.9FLP11.4KNAT51.6PV_Br_SNP_00021.9ATH12.1AGL162.5CIB12.6FDP FD3.1PV_Br_SNP_10483.3AP23.6COP33.8T28I19.1603.9CKB2 CKB14.5PHYE4.8JMJ145.8PDF26.3EBS6.5AGL14 AGL196.9AT4G233407.1SLY17.7AGL24 PGI7.9GA20OX1 GA20OX28.3FWA8.4CIP79.6DFL19.7TOR19.8NS110.5HAT410.6FIP2 FCA10.7CKL1311.2FAR112.0ELIP212.2LUX/PCL113.5ARP413.8PV_Br_SNP_005514.0VIP516.6GA20OX4 YAP16916.7PV_Br_SNP_008017.0GA20OX1 GA20OX2PGM
17.4
CKL1318.7TIC19.5AT3G2132020.0FIS320.4ATFYPP320.8HAF2 RTV1VRN1
21.0
PV_Br_SNP_009821.2SPL521.6SPA4 SPA321.7NFYB3/HAP3C21.9TCTP22.2
A01
PV_Br_SNP_0002 0.0PV_Br_SNP_1048 0.1
L01_1
BrPHYEP2c 0.0
BrEBSP1b 1.3
BrNS1P2c 4.0
PV_Br_SNP_0055 5.8PV_Br_SNP_0080 6.0PV_Br_SNP_0098 6.5
L01_2 Bra0283860.0CDF20.3BNQ10.4FLC FLM/MAF1MAF2
1.2
TCP111.5GA20OX4 YAP1691.7CPD1.9HY52.8EMF12.9NFYA1/HAP2A3.1COL13.9TFL24.3NPH45.1CAM15.3MIR172(EAT) TOE25.9AT1G10588 AT5G59845ZAT12
6.0
VIP2 FDPSRR1
6.1
COL56.7VIN36.8FT TSF7.7RGL17.8EMF28.1GA20OX1 GA20OX28.3CAL AP19.0TEM29.2DFL19.5XAL110.1CSTF6410.2TFIIIA10.4HAP2C10.8GASA611.5GA2OX113.0PV_Br_SNP_017213.5PRE13.6GA3ox2 GA3OX413.8CUL416.5NFYB2 RAV117.6HSP88.117.8SEPALLATA418.0ICU218.1FUS319.3PV_Br_SNP_014320.1TEL120.6BR6OX222.8K19B1.17 CDF123.4LFY23.7FLM/MAF1 MAF4MAF5 FLM/MAF1
25.0
RGL225.5ATVGT125.6Bra03202825.7
A02
BrFTP1c 0.0
PV_Br_SNP_0172 3.4
L02_1
BrTSFP2c 0.0
PV_Br_SNP_0143 2.5
L02_2
Bra0056570.0LAC80.2CPD1.0GA20OX4 YAP1691.3CHE1.5FLC1.8EMF12.0NFYA1/HAP2A2.3FY2.5AGL152.6AT5G149202.8BNQ2 GASA42.9SEPALLATA23.0VIP24.7SEF5.0VIN35.2DFL15.9FRI6.8CBF2 FLC7.1SPL38.1NFYB19.4ELF49.8CAM110.1CKB310.9SOC111.0protein_coding11.3ELF4-L111.4TOE111.5ATC11.6pEARLI13.1PDF213.4CLPS3 WNK115.0HAP2B15.2COL915.7FLD16.1SPY16.4PV_Br_SNP_027417.3FADB NFYB3/HAP3C17.5TCTP17.8RTV1 VRN118.2ATFYPP318.5DDL18.6AT3G2132018.8TIC19.2CKB2 CKB120.7TOC122.3PV_Br_SNP_029422.4DFL223.1PDF224.1CBF2 CBF3GA20OX2
25.2
PGI AGL2425.5AT4G2334026.1PV_Br_SNP_030926.2AGL14 AGL1926.4EBS26.7KNAT527.0FLP1 ELF927.3SKB127.4VEL127.8AT4G33280 AGL1629.0ATH129.2FDP FD29.7SNZ AP230.2COP330.4Bra01790531.2
A03
PV_Br_SNP_0274 0.0
PV_Br_SNP_0294 2.7
PV_Br_SNP_0309 5.1
L03

15
Continuo Figure 3. Comparing newly constructed linkage groups (right side(Lx)) to Brassica rapa physical map(left side(Ax)); The length of each genetic
linkage groups are indicated in centimorgans (cM) and the length for the physical map is in million base pairs (Mbp, A01-A10) .The cM of LX linkage groups
was 0.1cM instead of 1CM to make it easy; because the physical map was constructed based on Mbp with maximum 50. The genetic map was greater than
50cM. The colour markers indicate the newly SNPs(rose) and InDels(green) markers.
Bra040431 0.0CAM1 CML24
SPL9 GAr3AT5G28450
0.1
CIP1 CKB1 0.2SOC1 0.8
GA2OX3 0.9CDF2 PIF4 1.0
SHP1 1.4SPL15 1.7
AGL18 INO80 1.9AMP1 3.2
AP3 3.4COP9 5.5
BR6OX2 7.1CKB2 7.3CKB2 7.7
AGL21 9.1PV_Br_SNP_0338 9.5
CBFs 9.6
COP3 11.3
FRI 12.8
PV_Br_SNP_0353 16.2
PV_Br_SNP_0372 18.7Bra040486 18.8
A04
PV_Br_SNP_0338 0.0
PV_Br_SNP_0353 3.2
PV_Br_SNP_0372 6.4
L04
Bra0044090.0RFI20.1CCA1 PRR90.5SPA10.7SPL30.9SPL91.3SHP2 SHP11.5FPA1.7CKB4 CKB32.2HUB12.3SAP18 AGL6SOC1
2.5
ELF42.9NFYB13.3FHY13.8NFYA45.2GA2OX35.4FES1 SPL35.7COP16.1ARR38.2LD9.1PHYC9.3CIR19.6SPA4 SPA3SPL4 PV_Br_SNP_0413
10.2
GA2ox7 PV_Br_SNP_042411.5VIP111.9GA2OX412.4RTV1 VRN113.0TIC15.2PV_Br_SNP_046415.5AT3G2132015.8FIS3 FIS316.8ATFYPP317.3BrTCTPP2b17.5PV_Br_SNP_1051 PHYBPHYD
17.6
PV_Br_SNP_049218.3RTV1 VRN118.7NFYB3/HAP3C FADB19.5SPA4 SPA319.8SPL519.9PIE121.0SPY MYB65MYB33
21.5
PRMT4B PRMT4a21.9COL922.1LCL122.6GAr223.3MBD923.5SEPALLATA223.7Bra03918323.8
A05
PV_Br_SNP_0464 0.0
PV_Br_SNP_0413 1.8PV_Br_SNP_0424 2.1PV_Br_SNP_1051 2.7PV_Br_SNP_0492 2.8
BrTCTPP2b 4.3
L05Bra0379540.0SPL40.5HAP5C NFYC9(NF-YC3)0.8CBFs1.2F14G24.73.1DDF1 DDF24.2ICE14.3RAV14.5AT1G105884.9OTS2 OTS1ARR3
5.0
DRB15.3PHYA PIF35.4PV_Br_SNP_10406.3GA3OX16.6UBC17.1NPH47.4PV_Br_SNP_05458.2UBP269.2NFYC1/HAP5A9.7REF69.9BNQ310.3CDF310.5LUX/PCL1 BOA11.0CAM112.2UBP2613.9LFY14.0NFYC1/HAP5A14.3ALX814.5PV_Br_SNP_056514.9LIP115.0FLM/MAF1 MAF2MAF3 MAF5MAF4
15.1
AT5G6554015.4APRR517.1FKF1 FPF117.3TNY GA317.7GAr2 GAr1AT5G27230
18.3
hst WNK118.4LSH2 LSH118.5BFT18.8YAP16919.0CDF119.2ELF519.4PV_Br_SNP_057819.7PRMT4B PRMT4a21.1ADG121.4HSP88.121.6RAV121.8TEL122.0PKS123.4UBC123.5GAI RGA23.9RPI224.1DOG124.8BIN125.4Bra03375926.2
A06
PV_Br_SNP_1040 0.0
PV_Br_SNP_0545 0.7
PV_Br_SNP_0578 1.8PV_Br_SNP_0565 2.3
L06
Bra036411 0.0
HXK1 0.9LKP2 FKF1 1.1
F17F8.15 2.7VIN3-L 4.1ADG1 5.0
FIP1 5.6SEP3 5.7
GA2OX2 7.0TOE1 7.3
ATC 7.8CAM1 8.0
CYP72B1 8.1ICU2 8.6
PV_Br_SNP_0637 11.6CAM1 12.1
AGL18 12.2SPL15 12.4
NFYC2/HAP5B 12.6SHP2 SHP1 12.7CKB4 CKB3 13.0AT5G28450 13.2
PIL2 13.3GAr3 13.5PRE 13.8NUA 14.0MIF1 15.0
HAP2C 15.4BrID101075 TFIIIA 15.5
CSTF64 15.6XAL1 15.7MMP 15.9CDF5 16.1VIM3 16.6
FT TSF 16.8CML24 CAM1 17.1
PV_Br_SNP_0663 17.8CAL AP1
BrAP3P1b18.1
EFS 18.7BrFTP2b 18.9
HAP2C 20.4XAL1 20.8UBC1 21.6
GA2OX1 21.8NUA 22.1
GA2/KS 22.2Bra035206 22.5
A07
PV_Br_SNP_0125 0.0
PV_Br_SNP_0637 0.7BrAP3P1b 1.1
BrID101075 2.8
BrFTP2b 4.2
PV_Br_SNP_0663 5.6
L07

16
Continue Figure 3...
Bra0362260.0GA10.1APRR51.5FKF1 FPF11.6TNY1.7AT5G272302.1WNK12.2PV_Br_SNP_10832.9K19B1.173.0TOC13.2VIP43.3LIP13.6BrID1010213.7PV_Br_SNP-10714.5BrFDPP2a4.6PV_Br_SNP_07954.9BrSVPP1c ORTH2VIM3
5.0
AAT25.4HXK15.8FVE5.9DDF26.0GA20OX4 YAP1698.5PV_Br_SNP_08268.7OTS18.9ARR39.0ATFYPP39.9ATXR710.3PV_Br_SNP_084813.5HSP88.114.5SEPALLATA414.7PKS1 UBC115.0GAI RGA15.3NFYB215.6AT5G4691015.9CUL416.5DOG116.7AGL14 AGL1916.9pEARLI17.2AGL1517.5PCFS4 BrPDF2a17.7F17F8.15 SUF420.0BrFRL2P1b FRL120.5
GA2OX222.0T22J18.14 BrGIP1dBrGIP2b
22.8
CUL323.8EDF1 TEM2BrPFT1P2c BrPFT1P4f
24.2
AP327.0AMP127.1SNZ SMZ27.3CAM128.1INO80 AGL1828.4SHP2 SHP128.9PIL629.0FPA29.1CKB4 CKB329.4BrID10108329.9PIL230.1BrGAr3P1a30.4ELF330.6ORTH2 BrVIM3P3b30.8AGL17 AGL2131.5PV_Br_SNP_090232.1BrFVEP3a32.3RAV134.1LWD1/ATAN1134.3CBFs34.8HAP5C NFYC9(NF-YC3)PIF3
35.1
STO35.9CKL1336.2PSAT136.3Bra03267036.9
A09
BrID101083 0.0
BrGAr3P1a 0.8
BrVIM3P3b 1.7
BrSVPP1c 2.6
PV_Br_SNP_0902 3.3
BrFVEP3a 3.9
L09_2
PV_Br_SNP_0795 0.0
PV_Br_SNP_1083 2.5
BrID101021 5.3
PV_Br_SNP_1071 7.1
BrFDPP2a 8.7
PV_Br_SNP_0826 11.7
PV_Br_SNP_0848 12.4
BrFRL2P1b 14.1
BrGIP1d 15.5BrGIP2b 15.7
BrPFT1P2c 17.1
BrPFT1P4f 18.4
L09_1
Bra0379250.0PSAT11.5CRY2 CKL131.7UBC12.1STO2.6CO T1N6_23.9LHY SIN14.2GA2OX64.4CCR25.1MYB65 MYB335.7AAT27.0PI7.2NPH47.4CAM17.7MIR172(EAT) TOE2PRR3 AT5G59845
8.6
AT1G10588 VIP28.7SRR18.8SEF9.3COL59.6FRL2 FRL1ELF9
13.1
COL1 COSEPALLATA2
13.3
BNQ213.5AGL1513.9NFYA1/HAP2A14.2HY514.7AT5G1062514.8FLC15.0CPD15.3PV_Br_SNP_098515.7GA20OX4 YAP16915.9HUA2 CHE16.2ELF6 PV_Br_SNP_099616.8TFL116.9LMI117.0LCL1 PRR717.2ELF717.3FHL PNY17.4Bra00964617.6
A10
PV_Br_SNP_0985 0.0
PV_Br_SNP_0996 1.2
L10
Bra030807 0.0ARP6 0.1
PV_Br_SNP_0696 HUB2 0.4MED9 0.6TFL2 1.3RGL2 1.4
GA20OX5 1.8PV_Br_SNP_0709 3.1
RTV1 VRN1 3.6ATFYPP3 4.1
RPI2 4.7PV_Br_SNP_1066 5.1
VIP1 5.6ATR4 5.8
UFO SUF4 6.2PV_Br_SNP_0721 6.3
ESD4 6.7HAF2 7.8
COP9 PV_Br_SNP_0743 9.0SPA2 9.5
AGL14 AGL19 10.0EBS 10.2
PDF2 10.4GA2OX8 10.5GA3OX3 10.6
PV_Br_SNP_0754 11.2FIP2 11.8
VRN2 11.9FLP1 13.2SKB1 13.3VEL1 13.6VIP3 13.7
CBF2 CBF1 14.5FDP FD 14.7
COP3 15.3T28I19.160 AGL17
AGL2115.5
BIN1 15.8PV_Br_SNP_0776 15.9
CKL13 16.1GA2OX2 16.4
SEP3 17.1PFT1 EDF1 17.4
CAL AP1 17.5CUL3 17.6NPH4 18.7
MFT 18.9ATCSTF77 19.0
ICE1 19.6DDF2 19.7CRY2 20.4
HAP5C NFYC9(NF-YC3) 21.2DRB1 Bra030806 21.4
A08
PV_Br_SNP_0696 0.0PV_Br_SNP_0709 0.8PV_Br_SNP_1066 1.0PV_Br_SNP_0743 1.4PV_Br_SNP_0721 1.6
PV_Br_SNP_0754 2.8
PV_Br_SNP_0776 4.2
L08
17
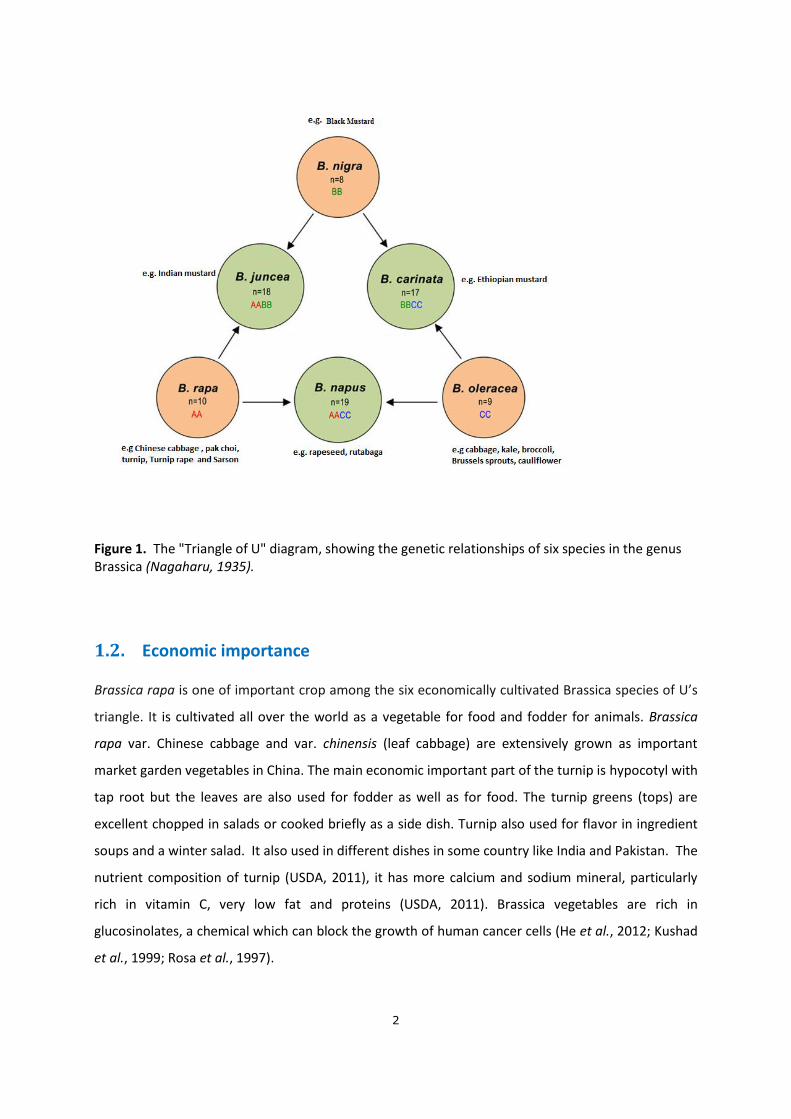
3.3. Frequency distribution of turnip tuber traits
Average turnip tuber fresh weight, dry weight, dry mass and brix ( total soluble sugar) were showed
no normal distribution, the skewedness was shifted to positive ( Figure 4). A distribution has values
of skew which the results were above 0 . This indicates a deviation from normal distributions. The
mean result of turnip tuber fresh weight, dry weight and dry mass were indicated most of progenies
(population F6/7) shifted to VT-115 parent (Appendix 4 ).
Figure 4. Frequency distribution of turnip tuber morphological traits in 36RIL F6/7 population.

18
3.4. QTL analysis
Four turnip tube related traits were evaluated; average turnip tuber fresh weight, dry weight, dry
mass and brix (Total soluble Sugar). Non linkage group also included in QTLs detection. Some markers
were unlinked but they have contribution for QTLs (Figure 5). A total of 94 turnip tuber related traits
QTLs were detected at significant level ≤0.1 on 13 newly constructed brassica rapa linkage groups
except linkage group L01_1 and L04 (Figure 5). As a result, 18 Brix (total soluble sugar) related QTL
was detected on all newly constructed linkage groups except L02_1, L02_2 and L10. Average turnip
tuber fresh weight related QTLs(29) were also detected on all linkage group except L03. Twenty six
turnip tuber dry weight and 21 turnip tuber dry mass percentage QTLs were also detected on all
newly constructed linkage groups except L08. The interesting thing was in linkage group 2, turnip
tuber dry weight and fresh weight co-located together which all were affected by BrFT loci. Turnip
related traits QTLs were detected on the top of A02 in DH-30 and the BC1 population which were co-
located with flowering QTL ((Lou et al., 2007)). In F2 segregation population study, it showed turnip
width and flowering markers correlated each other on linkage groups of A02 and A10 (Vos, 2009).
Average turnip tuber fresh weight, dry weight and dry mass were co-located on linkage group L02,
L05, L06, L07, L09 and L10. F2 population study on linkage group L02 didn’t show any turnip related
traits QTLS but in this study some QTLs were detected. Only linkage groups A01, A05 A06 A08 and
A10 were detected turnip related QTLs F2/3 of this population (RIL 36C) (Rémi, 2010). The explained
variation per QTL was less than 16.5%.
I was working major thesis on turnip tuber traits genes expression in vitro condition. I have
found some genes which differentially expressed related to turnip tuber formation. For instance,
DDF1(delay and dwarf flowering 1), VTuni_02 and VTuni_14 (unique for DHVT-117 turnip) genes
were differentially expressed in turnip tuber induced medium. The physical position of DDF1 and
VTuni_02 is A09 at 34.51Mbp and 36.99Mbp, respectively on Chiifu genome. The newly constructed
L09_2 linkage map had 14 turnip tuber related QTLs. The mega base pair size was not far from DDF1
and VTuni_02 genes. If those genes included in the linkage map, they might be contribute in turnip
tuber QTLs.

19
Figure 5. Turnip tuber related QTLs on Brassica rapa linkage groups on flower time related markers of physical map including SNPs and InDels markers . The
coloured loci shows significantly(<0.001) for correspondence QTL; red colour markers for brix QTLs, brown colour for fresh weight QTLS, blue for dry weight
and green for dry mass percentage; stars with markers indicates the significant different(*=0.1, **=0.05, ***=0.01, ****=0.005, *****=0.001 and ******=
0.0005, *******=0.0001) from hypothesis( no QTLs for linkage group); colour and underline indicates the markers contribute for more than one QTLs; black
colour and underline indicated the markers which didn’t assigned any linkage group but it contribute for correspondence QTL.
Bra0110240.0
PV_Br_SNP_00021.9
PV_Br_SNP_10483.3
Bra04052027.7
L01_1
Bra0110240.0
PV_Br_SNP_10483.3
PHYE**/**/**4.8
EBS**/***6.5
BrID101119**/**/**9.9
PV_Br_SNP_0055*/*14.0
PV_Br_SNP_008017.0
VRN1****21.0PV_Br_SNP_0098*/**21.2
Bra04052027.7
BrixQ
TL1
BrixQ
TL2
FWQTL
FWQTL
FWQTL
FWQTL
FWQTL
DWQTL
DWQTL
DWQTL
DWQTL
DMQTL
DMQTL
L01_2
Bra028386 0.0
FT*****/*****/*** TSF****/***/** 7.7
PV_Br_SNP_0172 13.5
Bra032028 25.7
FWQTL
DWQTL
DMQTL
L02_1
Bra0283860.0
FT*****/*****/*** TSF****/***/**7.7
PV_Br_SNP_017213.5
PV_Br_SNP_014320.1
Bra03202825.7
FWQTL
DWQTL
DMQTL
L02_2

20
Continue Figure 5. ...
Bra005657 0.0
FY* 2.5
PV_Br_SNP_0274 17.3
PV_Br_SNP_0294 22.4
PV_Br_SNP_0309* 26.2
Bra017905 31.2
BrixQ
TLDMQTL
L03
Bra004409 0.0
BrID10131* 2.1BrID10133*/**/** 2.5
FES1****/* 5.7
PV_Br_SNP_0413**** 10.2
PV_Br_SNP_0424*****/* 11.5
PV_Br_SNP_0464**** 15.5
BrTCTPP2b**/* 17.5PV_Br_SNP_1051******/* 17.6
PV_Br_SNP_0492****/* 18.3
Bra039183 23.8
BrixQ
TL
BrixQ
TLBrixQ
TL
BrixQ
TLBrixQ
TL
BrixQ
TL
BrixQ
TLBrixQ
TL
FWQTL
FWQTL
DWQTL
DWQTL
DMQTL
DMQTL
DMQTL
DMQTL
A05
Bra037954 0.0PV_Br_SNP_0517* 0.3
PV_Br_SNP_1040 6.3
PV_Br_SNP_0545* 8.2
PV_Br_SNP_0565***/**/** 14.9
BrID101035 19.0PV_Br_SNP_0578 19.7
RGA 23.9
PV_Br_SNP_1069*** 25.2
Bra033759 26.2
BrixQ
TL
FWQTL
DWQTL
DMQTL
DMQTL
DMQTL
DMQTL
DMQTL
A06

21
Continue Figure 5...
Bra036411 0.0PV_Br_SNP_0125 0.5
FKF1* 1.1
BrID10103** 7.8
PV_Br_SNP_0637****/****/*** 11.6
BrID101075**/** 15.5
FT** 16.8PV_Br_SNP_0663** 17.8
AP3*****/****/**** 18.1
PV_Br_SNP_0691*/* 22.4Bra035206 22.5
BrixQ
TLBrixQ
TL
BrixQ
TL
FWQTL
FWQTL
FWQTL
FWQTL
FWQTL
DWQTL
DWQTL
DWQTL
DWQTL
DMQTL
DMQTL
A07
Bra0308070.0PV_Br_SNP_0696*0.4
PV_Br_SNP_0709*3.1
PV_Br_SNP_10665.1
PV_Br_SNP_07216.3
PV_Br_SNP_07439.0
PV_Br_SNP_075411.2
PV_Br_SNP_077615.9
PV-Br_SNP_1037*20.7Bra03080621.4
BrixQ
TLBrixQ
TL
DWQTL
A08
Bra036226 0.0
PV_Br_SNP_1083* 2.9BrID101021**/**/* 3.7
PV_Br_SNP-1071**/** 4.5FDP**/** 4.6
PV_Br_SNP_0795**/* 4.9BrSVPP1c**/** 5.0
FVE* 5.9
PV_Br_SNP_0826 8.7
PV_Br_SNP_0848 13.5
BrFRL2P1b 20.5
BrGIP1d BrGIP2b 22.8
BrPFT1P2c* BrPFT1P4f 24.2
Bra032670 36.9
BrixQ
TL
FWQTL
FWQTL
FWQTL
FWQTL
FWQTL
FWQTL
DWQTL
DWQTL
DWQTL
DWQTL
DWQTL
DWQTL
DMQTL
DMQTL
L09_1

22
Continue Figure 5...
Bra0362260.0
BrSVPP1c**/**5.0
BrID101083*/*29.9BrGAr3P1a30.4BrVIM3P3b**30.8PV_Br_SNP_0902*/**32.1BrFVEP3a*/*32.3GA3OX133.4
Bra03267036.9
FWQTL
FWQTL
FWQTL
FWQTLFW
QTL
DWQTL
DWQTL
DWQTL
DWQTLDWQTL
L09_2
Bra037925 0.0
CRY2** 1.7
FRL1****/****/*** 13.1
PV_Br_SNP_0985**/** 15.7
PV_Br_SNP_0996 16.8Bra009646 17.6
FWQTL
FWQTL
DWQTL
DWQTL
DMQTL
DMQTL
DMQTL
A10

23
4. Conclusion and recommendation
A genetic linkage map provides the basic and essential information to study the B. rapa genome and
to conduct marker-assisted selection in genetics and breeding. Genotype scoring was not easy for
some of the markers which excluded during mapping. I was able to locate more than ten linkage
groups to ten corresponding Brassica rapa linkage groups. The size of population were reduced from
144 to 106 to make correlation with different markers. Size and number of marker can affect linkage
group and QTLs analysis. If there are more markers included, those loci might be linked. After
running the JoinMap program for each group, a linkage map on each linkage group was determined
based on recombination frequency.
A total 61 markers were grouped into 13 newly constructed linkage groups. The orders and
orientations of the markers on each 13 newly constructed linkage groups were the same as physical
the map map of Brassica rapa from chiifu genome except BrTSFp2c (A02), Pv_Br_SNP_0464 (A05),
PV_Br_0578 (A06), BrID101075 (A07), PV_Br_SNP_0663 (A07), PV_Br_SNP_0743 (A08),
PV_Br_SNP_0795(A09) and BrSVPP1c (A09). Of the 124 markers assigned to the linkage groups, 49
showed a deviation from the expected segregation ratios 1:1. This might be due to common feature
markers skewed segregation Brassica linkage maps. Generally, 90% of loci had homozygous
genotypes, 4% heterozygous and 6% missing values during scoring or unamplified genotypes. I also
observed the differential genes expressed in tuber formation and physical position of those gene to
related to the newly constructed QTLs. It showed some of genes (e.g. VTuni_02) were not far from in
L09 linkage groups. This supported turnip tuber traits are polygenic. A total of 94 turnip related QTLs
were detected in all linkage groups; 18 for brix(Total soluble Sugar), 29 for turnip tuber fresh weight,
26 for turnip tuber dry weight and 21 for tuber dry mass percentage. Dry weight and fresh weight co-
located together on linkage group A02 at flowering QTL loci. The linkage map reported here is
therefore help as a resource in undertaking future linkage mapping on C36 RIL population. Finally, I
would recommend to make linkage and QTLs mapping with higher number of individuals and
markers. It gives accurate and precise linkage groups and QTLs maps.

24
References
Abelenda, J. A., C. Navarro and S. Prat (2011). "From the model to the crop: genes controlling tuber
formation in potato." Current Opinion in Biotechnology 22(2): 287-292.
Al-Shehbaz, I., M. Beilstein and E. Kellogg (2006). "Systematics and phylogeny of the Brassicaceae
(Cruciferae): an overview." Plant Systematics and Evolution 259(2): 89-120.
Campo, C. G.-. (1999). Biology of Brassica Coenospecies. Madrid, ELSEVIER SCIENCE B.V.
Choi, S. R., G. R. Teakle, P. Plaha, J. H. Kim, C. J. Allender, E. Beynon, Z. Y. Piao, P. Soengas, T. H. Han
and G. J. King (2007). "The reference genetic linkage map for the multinational Brassica rapa
genome sequencing project." TAG Theoretical and Applied Genetics 115(6): 777-792.
Collard, B. C. Y., M. Z. Z. Jahufer, J. Brouwer and E. C. K. Pang (2005). "An introduction to markers,
quantitative trait loci (QTL) mapping and marker-assisted selection for crop improvement:
The basic concepts." Euphytica 142(1): 169-196.
El-Assal, S. E. D., C. Alonso-Blanco, A. J. M. Peeters, V. Raz and M. Koornneef (2001). "A QTL for
flowering time in Arabidopsis reveals a novel allele of CRY2." Nature genetics 29(4): 435-440.
Ferreira, A., M. F. da Silva, L. C. Silva and C. D. Cruz (2006). "Estimating the effects of population size
and type on the accuracy of genetic maps." Genet Mol Biol 29(1): 187-192.
He, H., L. Ping, G. Bonnema, M. Dekker and R. Verkerk (2012). "Genetic Variation in Glucosinolate
Content within Brassica rapa Vegetables." Acta Hort.: 944.
Kapoor, R., S. S. Banga and S. K. Banga (2009a). "A microsatellite (SSR) based linkage map of Brassica
rapa." New Biotechnology 26(5): 239-243.
Kapoor, R., S. S. Banga and S. K. Banga (2009b). "A microsatellite (SSR) based linkage map of< i>
Brassica rapa</i>." New biotechnology 26(5): 239-243.
Kushad, M. M., A. F. Brown, A. C. Kurilich, J. A. Juvik, B. P. Klein, M. A. Wallig and E. H. Jeffery (1999).
"Variation of Glucosinolates in Vegetable Crops of Brassica o leracea." Journal of Agricultural
and Food Chemistry 47(4): 1541-1548.
Lou, P., J. Zhao, J. S. Kim, S. Shen, D. P. Del Carpio, X. Song, M. Jin, D. Vreugdenhil, X. Wang and M.
Koornneef (2007). "Quantitative trait loci for flowering time and morphological traits in
multiple populations of Brassica rapa." Journal of Experimental Botany 58(14): 4005-4016.
Manly, K. F., J. Cudmore, R.H. and J. M. Meer (2001). "Map Manager QTX, cross-platform software
for genetic mapping." Mammalian Genome 12(12): 930-932.
Nagaharu, U. (1935). "Genome analysis in Brassica with special reference to the experimental
formation of B. napus and peculiar mode of fertilization." Jap J Bot 7: 389-452.

25
Ooien, J. W., M. Boer, R. Jansen and C. Maliepaard (1996). "MapQTL 4.0. Software for the calculation
Of QTL positions on genetic maps." Order 501: 6204.
Ostergaard, L. and G. J. King (2008). "Standardized gene nomenclature for the Brassica genus." Plant
Methods 4(10): 1-4.
Rémi, R. (2010). Mapping QTL for turnip formation and other morphological traits in Brassica rapa.
Labaratory of Plant Breeding, Wageningen University. MSc.
Rosa, E., R. Heaney, G. Fenwick and C. Portas (1997). "Glucosinolates in crop plants." Horticultural
reviews 19: 99-215.
Schranz, M. E., P. Quijada, S. B. Sung, L. Lukens, R. Amasino and T. C. Osborn (2002).
"Characterization and effects of the replicated flowering time gene FLC in Brassica rapa."
Genetics 162(3): 1457-1468.
Song, K., M. Slocum and T. Osborn (1995). "Molecular marker analysis of genes controlling
morphological variation in Brassica rapa (syn. campestris)." TAG Theoretical and Applied
Genetics 90(1): 1-10.
USDA (2011). Potato, Flesh and Skin, Raw, National Nutrient Database.
Visser, J. d. (2010). Effect of vernalization on turnip formation and other morphological traits in
Brassica rapa. Laboratory of Plant Breeding
Wageningen, Wageningen University. MSc.
Vogl-Lukasser, B., C. R. Vogl and H. Reiner (2008). "The turnip (Brassica rapa L. subsp. rapa) in Eastern
Tyrol (Lienz district; Austria)." Ethnobotany Research & Applications 5(0): 305-317.
Voorrips, R. (2002). "MapChart: software for the graphical presentation of linkage maps and QTLs."
Journal of Heredity 93(1): 77-78.
Vos, P. (2009a). Characterization of Brassica rapa turnip formation in multiple segregating
populations. Laboratory of Plant Breeding,, Wageningen University. Msc.
Vos, P. (2009b). Characterization of Brassica rapa turnip formation
in multiple segregating populations. Laboratory of Plant Breeding. Wageningen, Wageningen
University. MSc.
Wang, S. (2011). Assessment of phenotypic variation in an F3 population from a cross between a
Japanese turnip and a pak-choi, and association to the F2 marker profiles. Laboratory of Plant
Breeding, Wageningen University and Research Centre. Wageningen, Wageningen University.
MSc.
Wang, Y., S. Sun, B. Liu, H. Wang, J. Deng, Y. Liao, Q. Wang, F. Cheng, X. Wang and J. Wu (2011). "A
sequence-based genetic linkage map as a reference for Brassica rapa pseudochromosome
assembly." BMC genomics 12(1): 239.

26
Xiao, D., J. Zhao, R. K. Basnet, N. Zhang, D. P. d. Carpio, J. B. K. Lin, F. Cheng, X. Hou, X. Wang and G.
Bonnema (Unpublished). "Genetic architecture of flowering time regulation in a Brassica
rapa doubled haploid population."
Yildirim, E., N. Yildirim, S. Ercisli, G. Agar and H. Karlidag (2010). "Genetic relationships among turnip
(Brassica rapa var. rapa) genotypes." Genetics and Molecular Research 9(2): 987-993.
Zhao, J., A. Artemyeva, D. P. Del Carpio, R. K. Basnet, N. Zhang, J. Gao, F. Li, J. Bucher, X. Wang and R.
G. F. Visser (2010). "Design of a Brassica rapa core collection for association mapping
studies." Genome 53(11): 884-898.
Zhao, J., X. Wang, B. Deng, P. Lou, J. Wu, R. Sun, Z. Xu, J. Vromans, M. Koornneef and G. Bonnema
(2005). "Genetic relationships within Brassica rapa as inferred from AFLP fingerprints." TAG
Theoretical and Applied Genetics 110(7): 1301-1314.

27
Appendixes
Appendix 1. SNPs FT markers;
Abbreviation
Markers
Polymorphism in RIL36 (VT-115 X PC-144)
estimated position
DH-68 mapped position
C36 mapped position*
Annotation
AGL15 BrAGL15P2a No unassigned A02 unassigned AGL15 (AGAMOUS-Like 15) is a member of the MADS domain family of regulatory factors.
AGL24 BrAGL24P1b No A03 A03 unassigned MADS-box protein
AGL24 BrAGL24P2c No unassigned A03 unassigned MADS-box protein
AP2 BrAP2P1d No A01 A01 unassigned Encodes a floral homeotic gene
AP2 BrAP2P2a No unassigned A03 unassigned Encodes a floral homeotic gene
AP3 BrAP3P1b Yes A07 A07 A07 Floral homeotic gene encoding a MADS domain protein
APRR5 BrAPRR5P1a No A09 A09 unassigned Encodes a pseudo-response regulator whose mutation affects various circadian-associated biological events
APRR5 BrAPRR5P1b No A09 unassigned Encodes a pseudo-response regulator whose mutation affects various circadian-associated biological events
AS1 BrAS1P1c Yes A05 A03 ungrouped Encodes a MYB-domain protein involved in specification of the leaf proximodistal axis
AS1 BrAS1P2a Yes unassigned A03 ungrouped Encodes a MYB-domain protein involved in specification of the leaf proximodistal axis
AT1G18450 Br450P1a No A06 A06 unassigned Encodes a gene similar to actin-related proteins in other organisms
AtBRM BrAtBRMP1d No A03 A03 unassigned Encodes a SWI/SNF chromatin remodeling ATPase
ATVGT1 BrATVGT1P1a No A03 A01 unassigned Encodes a vacuolar membrane-localized glucose transporter
BFT BrBFTP1a No unassigned A02 unassigned brother of FT and TFL1 protein (BFT
BIN1 BrBIN1P2c Yes A08 A08 ungrouped Encodes a plasma membrane localized leucine-rich repeat

28
receptor kinase
CAL BrCALP1g No A07 A02 unassigned encoding a MADS domain protein homologous to AP1
CAL BrCALP2a Yes unassigned A02 ungrouped encoding a MADS domain protein homologous to AP1
CBFs BrCBFsP2b No unassigned A06 unassigned transcription factor activity
CCA1 BrCCA1P1c Yes A03 A09 ungrouped Encodes a transcriptional repressor
CCA1 BrCCA1P3b Yes unassigned A05 ungrouped Encodes a transcriptional repressor
CDF1 BrCDF1P2e Yes unassigned A06 ungrouped Dof-type zinc finger
CO BrCOP1f No A10 A02 unassigned Similar to zinc finger
COL1 BrCOL1P1a No unassigned unassigned Homologous to the flowering-time gene CONSTANS.
COL1 BrCOL1P1c No unassigned A10 unassigned Homologous to the flowering-time gene CONSTANS.
COL2 BrCOL2P3aF Yes unassigned A01 ungrouped homologous to the flowering-time gene CONSTANS (CO) encoding zinc-finger proteins
CPD BrCPDP1a No A10 A10 unassigned Encodes a member of the CP90A family,
CRY1 BrCRY1P2d No unassigned A09 unassigned Blue-light photoreceptor
CRY1 BrCRY1P1c No unassigned A09 unassigned Blue-light photoreceptor
CRY2 BrCRY2P1a Yes A10 A10 ungrouped Blue-light photoreceptor
CRY2 BrCRY2P4b No unassigned A04 unassigned Blue-light photoreceptor
CRY2 BrCRY2P2c Yes unassigned A08 ungrouped Blue-light photoreceptor
CRY2 BrCRY2P3a Yes unassigned A08 ungrouped Blue-light photoreceptor
CUL3 BrCUL3P1a No A08 A08 unassigned Cullin, putative, similar to Cullin homolog 3
DDF1 BrDDF1P3a No unassigned A06 unassigned Encodes a member of the DREB subfamily A-1 of ERF/AP2 transcription factor family (DDF1).
DDF1 BrDDF1P2b No unassigned A09 unassigned Encodes a member of the DREB subfamily A-1 of ERF/AP2 transcription factor family (DDF1).
DRB1 BrDRB1P1d Yes unassigned A06 ungrouped Encodes a nuclear dsRNA binding protein delayed flowering
DRL1 BrDRLP3b Yes unassigned A08 ungrouped Encodes a homolog of the yeast TOT4/KTI12 protein. Yeast TOT4/KTI12
DRL1 BrDRLP1c No A09 A09 unassigned Encodes a homolog of the yeast TOT4/KTI12 protein. Yeast TOT4/KTI12

29
DRL1 BrDRLP2b No A08 A08 unassigned Encodes a homolog of the yeast TOT4/KTI12 protein. Yeast TOT4/KTI12
EBS BrEBSP2d Yes A08 A02 ungrouped Putative plant chromatin remodeling factor
EBS BrEBSP1b Yes A01 A01 A01 Putative plant chromatin remodeling factor
EDF1 BrEDF1P2c No unassigned A08 unassigned Encodes a member of the RAV transcription factor family that contains AP2 and B3 binding domains.
ELF3 BrELF3P1c No A09 A09 unassigned Encodes a novel nuclear protein
ELF5 BrELF5P1a No unassigned A06 unassigned Nuclear targeted protein
ELF8 BrELF8P1b No A03 A03 unassigned Encodes a yeast CTR9 homolog
ESD4 BrESD4P1a Yes A03 A06 ungrouped encodes a SUMO protease
ESD4 BrESD4P2b Yes unassigned A08 ungrouped encodes a SUMO protease
FD BrFDP1g No A01 A01 unassigned bZIP transcription factor
FDP BrFDPP2a Yes unassigned A09 ungrouped bZIP transcription factor
FDP BrFDPP1a No unassigned A07 unassigned bZIP transcription factor
FES1 BrFES1P2c Yes unassigned A05 ungrouped Zinc finger
FES1 BrFES1P3b No unassigned A05 unassigned Zinc finger
FKF1 BrFKF1P1c No unassigned A07 unassigned F-box protein
FKF1 BrFKF1P2d Yes unassigned A07 ungrouped F-box protein
FKF1 BrFKF1P3c Yes unassigned A07 ungrouped F-box protein
FLD BrFLDP1c No A10 A03 unassigned Encodes a plant homolog of a SWIRM domain containing protein
FLK BrFLKP2b No unassigned A03 unassigned Nucleic acid binding
FLM/MAF1 BrFLMP1b Yes A02 A02 ungrouped MADS domain protein
FLM/MAF1 BrFLMP2d No unassigned A02 unassigned MADS domain protein
FPA BrFPAP1c No A09 A09 unassigned regulates flowering time in Arabidopsis via a pathway that is independent of daylength
FPF1 BrFPF1P1d No A02 A06 unassigned Small,12.6kDa protein
FPF1 BrFPF1P2a No unassigned A06 unassigned Small,12.6kDa protein
FRI BrFRIP2c No unassigned A10 unassigned Vernalization response factor
FRL1 BrFRL1P2a Yes unassigned A10 ungrouped FRI-related gene
30
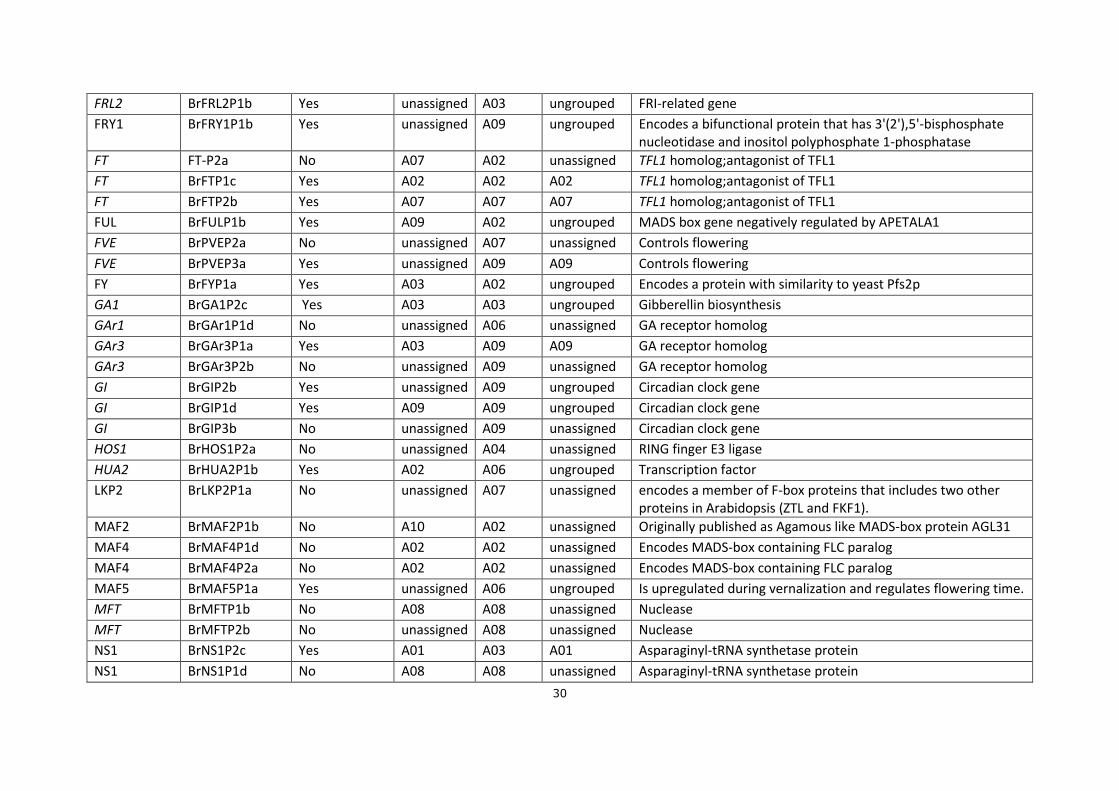
FRL2 BrFRL2P1b Yes unassigned A03 ungrouped FRI-related gene
FRY1 BrFRY1P1b Yes unassigned A09 ungrouped Encodes a bifunctional protein that has 3'(2'),5'-bisphosphate nucleotidase and inositol polyphosphate 1-phosphatase
FT FT-P2a No A07 A02 unassigned TFL1 homolog;antagonist of TFL1
FT BrFTP1c Yes A02 A02 A02 TFL1 homolog;antagonist of TFL1
FT BrFTP2b Yes A07 A07 A07 TFL1 homolog;antagonist of TFL1
FUL BrFULP1b Yes A09 A02 ungrouped MADS box gene negatively regulated by APETALA1
FVE BrPVEP2a No unassigned A07 unassigned Controls flowering
FVE BrPVEP3a Yes unassigned A09 A09 Controls flowering
FY BrFYP1a Yes A03 A02 ungrouped Encodes a protein with similarity to yeast Pfs2p
GA1 BrGA1P2c Yes A03 A03 ungrouped Gibberellin biosynthesis
GAr1 BrGAr1P1d No unassigned A06 unassigned GA receptor homolog
GAr3 BrGAr3P1a Yes A03 A09 A09 GA receptor homolog
GAr3 BrGAr3P2b No unassigned A09 unassigned GA receptor homolog
GI BrGIP2b Yes unassigned A09 ungrouped Circadian clock gene
GI BrGIP1d Yes A09 A09 ungrouped Circadian clock gene
GI BrGIP3b No unassigned A09 unassigned Circadian clock gene
HOS1 BrHOS1P2a No unassigned A04 unassigned RING finger E3 ligase
HUA2 BrHUA2P1b Yes A02 A06 ungrouped Transcription factor
LKP2 BrLKP2P1a No unassigned A07 unassigned encodes a member of F-box proteins that includes two other proteins in Arabidopsis (ZTL and FKF1).
MAF2 BrMAF2P1b No A10 A02 unassigned Originally published as Agamous like MADS-box protein AGL31
MAF4 BrMAF4P1d No A02 A02 unassigned Encodes MADS-box containing FLC paralog
MAF4 BrMAF4P2a No A02 A02 unassigned Encodes MADS-box containing FLC paralog
MAF5 BrMAF5P1a Yes unassigned A06 ungrouped Is upregulated during vernalization and regulates flowering time.
MFT BrMFTP1b No A08 A08 unassigned Nuclease
MFT BrMFTP2b No unassigned A08 unassigned Nuclease
NS1 BrNS1P2c Yes A01 A03 A01 Asparaginyl-tRNA synthetase protein
NS1 BrNS1P1d No A08 A08 unassigned Asparaginyl-tRNA synthetase protein

31
PFT1 BrPFT1P2c Yes unassigned A09 ungrouped Transcription coactivator
PFT1 BrPFT1P4f Yes unassigned A09 ungrouped Transcription coactivator
PFT1 BrPFT1P3b Yes unassigned A08 ungrouped Transcription coactivator
PHYA BrPHYAP1g Yes A08 A09 ungrouped G-protein coupled red/far red photoreceptor
PHYA BrPHYAP3b No unassigned A04 unassigned G-protein coupled red/far red photoreceptor
PHYA BrPHYAP3c No unassigned A04 unassigned G-protein coupled red/far red photoreceptor
PHYE BrPHYEP1b Yes A01 A06 ungrouped G-protein coupled photoreceptor
PHYE BrPHYEP1a No A01 A10 unassigned G-protein coupled photoreceptor
PHYE BrPHYEP2c Yes unassigned A01 A01 G-protein coupled photoreceptor
PI BrPIP2a No unassigned A02 unassigned Floral homeotic gene encoding a MADS domain transcription factor
PI BrPIP1b Yes A10 A02 ungrouped Floral homeotic gene encoding a MADS domain transcription factor
RGA BrRGAP2c Yes A06 A09 ungrouped VHIID/DELLA transcription factor
RGA BrRGAP1a Yes A06 A06 ungrouped VHIID/DELLA transcription factor
RGA BrRGAP1c Yes A06 A06 ungrouped VHIID/DELLA transcription factor
SEP3 BrSEP3P2a Yes unassigned A07 ungrouped Member of the MADs box transcription factor family
SEP3 BrSEP3P1a No A09 A07 unassigned Member of the MADs box transcription factor family
SLY1 BrSLY1-P1b No A01 A01 unassigned F-box protein involved in GA signaling
SNZ BrSNZP2b No unassigned A09 unassigned Encodes a AP2 domain transcription
SOC1 BrSOC1-P1a No A01 A01 unassigned Transcription factor
SPA1 BrSPA1P1a Yes A03 A05 unassigned Encodes a member of the SPA (suppressor of phyA-105) protein family (SPA1-SPA4
SPA1 BrSPA1P2a Yes unassigned A05 ungrouped Encodes a member of the SPA (suppressor of phyA-105) protein family (SPA1-SPA4
SPL5 BrSPL5P1a No A03 A01 unassigned Encodes a member of the SPL
SPL5 BrSPL5P2bF No unassigned A05 unassigned Encodes a member of the SPL
SVP BrSVPP1c Yes A09 A09 A09 Transcription factor
SVP BrSVPP2d Yes unassigned A04 ungrouped Transcription factor
32
T1N6_2 T1N6_2P1c No A09 A09 unassigned Putative role in flower development
T1N6_2 T1N6_2P2a Yes A04 ungrouped Putative role in flower development
TCTP BrTCTPP1b No A03 A03 unassigned Encodes a protein homologous to translationally controlled tumor protein (
TCTP BrTCTPP2b Yes unassigned A05 A05 Encodes a protein homologous to translationally controlled tumor protein (
TFL1 BrTFL1P2c No A02 A02 unassigned Phosphatidylethanolamine binding
TFL2 BrTFL2P4b No unassigned A10 unassigned Chromatin maintenance protein
TFL2 BrTFL2P1c No A02 A10 unassigned Chromatin maintenance protein
TFL2 BrTFL2P2a No unassigned A10 unassigned Chromatin maintenance protein
TOC1 BrTOC1P2b No mapped A09
A09 unassigned Pseudo response regulator involved in the generation of circadian rhythms.
TOC1 BrTOC1P1b No mapped A03
A03 unassigned Pseudo response regulator involved in the generation of circadian rhythms.
TSF BrTSFP2c Yes unassigned A02 A02 FT homolog
VEL1 BrVEL1P1e Yes A01 A08 Ungrouped Encodes a protein with similarity to VRN5 and VIN3.
VIM3 BrVIM3P3b Yes A09 A09 A09 Encodes the VIM3/ORTH1 protein that is similar to VIM1. This protein has an N-terminal PHD domain and two RING
VIN3 BrVIN3P1a A10 A10 unassigned Homeodomain protein
VIN3 BrVIN3P2b No unassigned A02 unassigned Homeodomain protein
VIN3 BrVIN3P3a No unassigned A03 unassigned Homeodomain protein
VIP4 BrVIP4P1b Yes A09 A09 ungrouped Encodes highly hydrophilic protein
VIP4 BrVIP4P2b Yes unassigned A09 ungrouped Encodes highly hydrophilic protein
VRN1 BrVRN1P1b Yes A01 A05 ungrouped Required for vernalization.Essential for the complete vernalized plants.
VRN1 BrVRN1P3b Yes unassigned A03 ungrouped Required for vernalization.Essential for the complete vernalized plants.
VRN2 BrVRN2P4b Yes A08 A08 ungrouped encodes a nuclear-localized zinc finger protein with similarity to Polycomb group (PcG) proteins
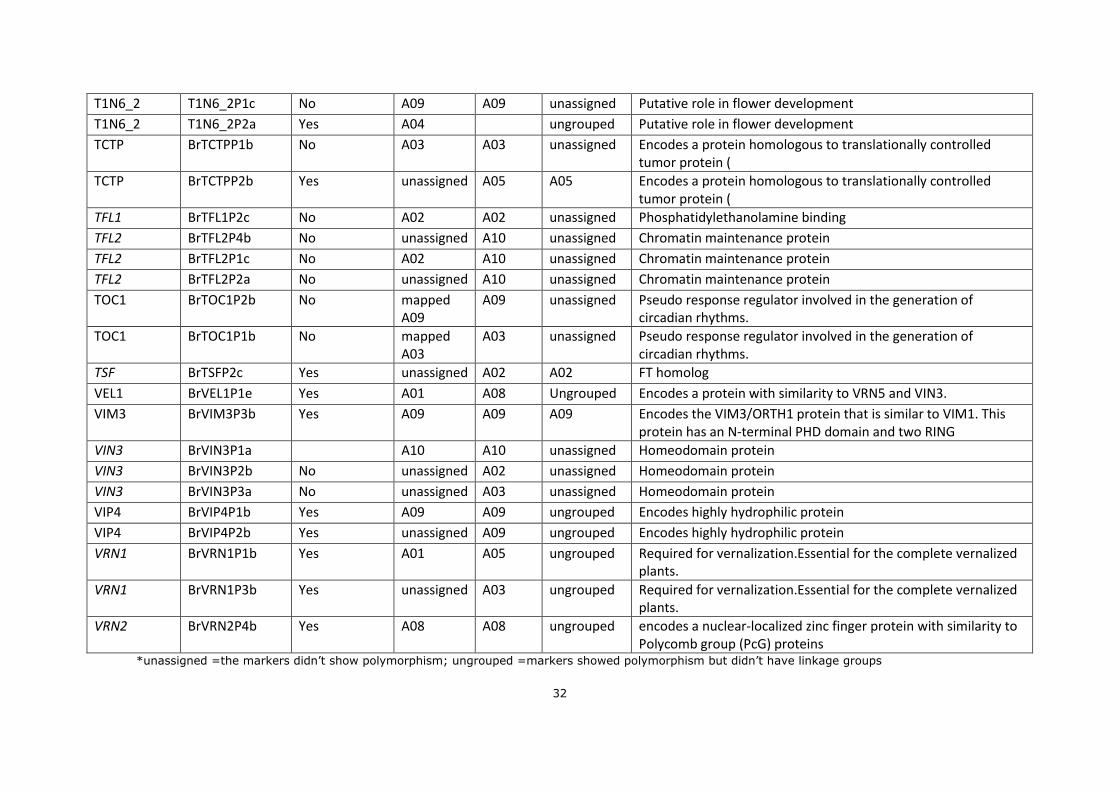
*unassigned =the markers didn’t show polymorphism; ungrouped =markers showed polymorphism but didn’t have linkage groups
33
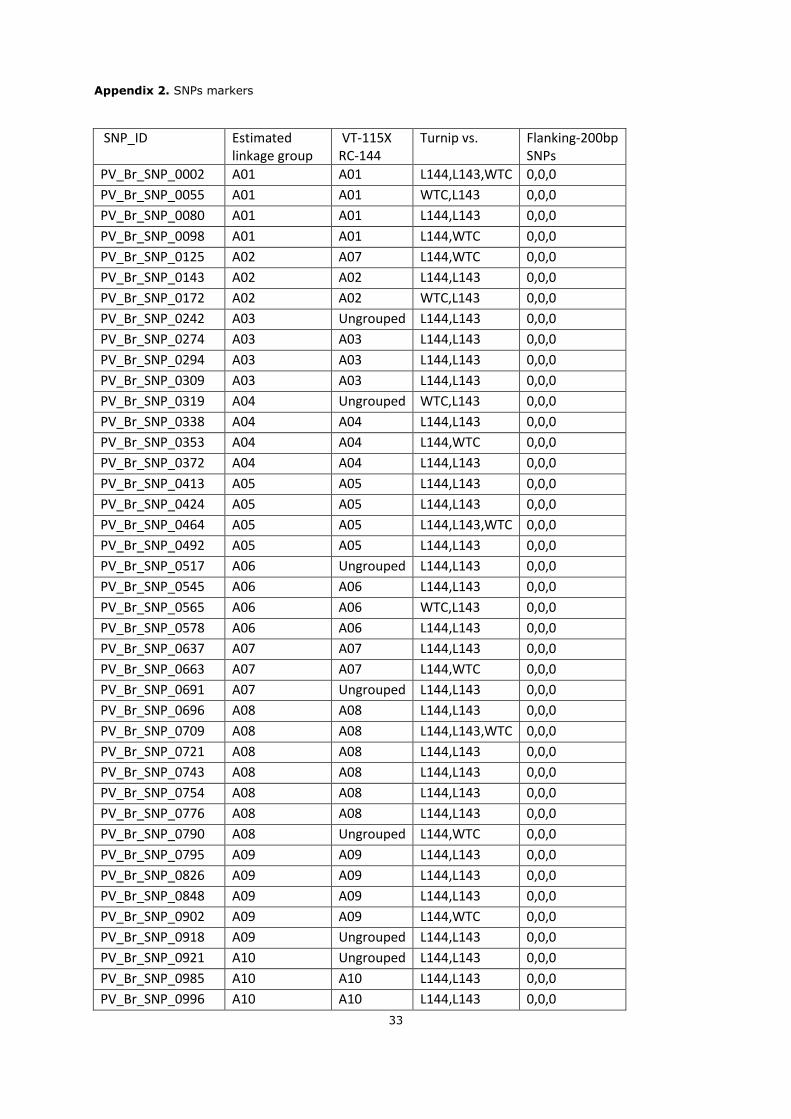
Appendix 2. SNPs markers
SNP_ID Estimated linkage group
VT-115X RC-144
Turnip vs. Flanking-200bp SNPs
PV_Br_SNP_0002 A01 A01 L144,L143,WTC 0,0,0
PV_Br_SNP_0055 A01 A01 WTC,L143 0,0,0
PV_Br_SNP_0080 A01 A01 L144,L143 0,0,0
PV_Br_SNP_0098 A01 A01 L144,WTC 0,0,0
PV_Br_SNP_0125 A02 A07 L144,WTC 0,0,0
PV_Br_SNP_0143 A02 A02 L144,L143 0,0,0
PV_Br_SNP_0172 A02 A02 WTC,L143 0,0,0
PV_Br_SNP_0242 A03 Ungrouped L144,L143 0,0,0
PV_Br_SNP_0274 A03 A03 L144,L143 0,0,0
PV_Br_SNP_0294 A03 A03 L144,L143 0,0,0
PV_Br_SNP_0309 A03 A03 L144,L143 0,0,0
PV_Br_SNP_0319 A04 Ungrouped WTC,L143 0,0,0
PV_Br_SNP_0338 A04 A04 L144,L143 0,0,0
PV_Br_SNP_0353 A04 A04 L144,WTC 0,0,0
PV_Br_SNP_0372 A04 A04 L144,L143 0,0,0
PV_Br_SNP_0413 A05 A05 L144,L143 0,0,0
PV_Br_SNP_0424 A05 A05 L144,L143 0,0,0
PV_Br_SNP_0464 A05 A05 L144,L143,WTC 0,0,0
PV_Br_SNP_0492 A05 A05 L144,L143 0,0,0
PV_Br_SNP_0517 A06 Ungrouped L144,L143 0,0,0
PV_Br_SNP_0545 A06 A06 L144,L143 0,0,0
PV_Br_SNP_0565 A06 A06 WTC,L143 0,0,0
PV_Br_SNP_0578 A06 A06 L144,L143 0,0,0
PV_Br_SNP_0637 A07 A07 L144,L143 0,0,0
PV_Br_SNP_0663 A07 A07 L144,WTC 0,0,0
PV_Br_SNP_0691 A07 Ungrouped L144,L143 0,0,0
PV_Br_SNP_0696 A08 A08 L144,L143 0,0,0
PV_Br_SNP_0709 A08 A08 L144,L143,WTC 0,0,0
PV_Br_SNP_0721 A08 A08 L144,L143 0,0,0
PV_Br_SNP_0743 A08 A08 L144,L143 0,0,0
PV_Br_SNP_0754 A08 A08 L144,L143 0,0,0
PV_Br_SNP_0776 A08 A08 L144,L143 0,0,0
PV_Br_SNP_0790 A08 Ungrouped L144,WTC 0,0,0
PV_Br_SNP_0795 A09 A09 L144,L143 0,0,0
PV_Br_SNP_0826 A09 A09 L144,L143 0,0,0
PV_Br_SNP_0848 A09 A09 L144,L143 0,0,0
PV_Br_SNP_0902 A09 A09 L144,WTC 0,0,0
PV_Br_SNP_0918 A09 Ungrouped L144,L143 0,0,0
PV_Br_SNP_0921 A10 Ungrouped L144,L143 0,0,0
PV_Br_SNP_0985 A10 A10 L144,L143 0,0,0
PV_Br_SNP_0996 A10 A10 L144,L143 0,0,0

34
PV_Br_SNP_1037 A08 L143 0,0,0
PV_Br_SNP_1040 A06 A06 L144 0,0,0
PV_Br_SNP_1041 A08 Ungrouped L144 0,0,0
PV_Br_SNP_1048 A01 A01 L143 0,0,0
PV_Br_SNP_1051 A05 A05 L144 0,0,0
PV_Br_SNP_1066 A08 A08 L144,L143 0,0,0
PV_Br_SNP_1067 A10 Ungrouped L144 0,0,0
PV_Br_SNP_1069 A06 Ungrouped L143 0,0,0
PV_Br_SNP_1071 A09 A09 L144 0,0,0
PV_Br_SNP_1082 A03 Ungrouped L144,WTC 0,0,0
PV_Br_SNP_1083 A09 A09 L143,WTC 0,0,0
Appendix 3. InDels markers
InDel_ID Estimated linkage group
VT-115 X RC-144
Start Stop
BrID10075 A10 Ungrouped 10184370 10184527
BrID10081 A10 Ungrouped 8588747 8588898
BrID10091 A10 Ungrouped 5042697 5042828
BrID101021 A09 Ungrouped 3696434 3696561
BrID101025 A05 Ungrouped 9323883 9324018
BrID10103 A07 Ungrouped 13590527 13590696
BrID101035 A06 Ungrouped 18959379 18959513
BrID101075 A07 A07 15492626 15492755
BrID101083 A09 A09 29890041 29890177
BrID101119 A01 Ungrouped 9895949 9896088
BrID10113 A07 Ungrouped 16124793 16124947
BrID10131 A05 Ungrouped 2101631 2101797
BrID10133 A05 Ungrouped 2506072 2506218
BrID10253 A06 Ungrouped 17658487 17658580
Appendix 4. Average mean of turnip tuber related traits in RIL F6/7 population
brix FW DW DM
No. of lines 94 94 94 94
Mean 4.49 9.36 1.00 0.127
Maximum 6.67 130.97 11.94 0.22
Minimum 2.33 0.24 0.06 0.06
VT-115 4.5 0.26 0.06 0.15
RC-144 5.33 130.97 11.94 0.09
Skewness 0.22 5.73 5.49 0.74
Std. Error of Skewness 0.25 0.25 0.25 0.25


![Genetic Dissection of a Major Anthocyanin QTL Contributing ... · anthocyanin (pink) pigment was estimated as [(R + B)/2] 2 G. QTL affecting anthocyanin concentration in the backcross](https://img.pdfslide.us/doc/110x75/5e6421962a91715ff42dfa60/genetic-dissection-of-a-major-anthocyanin-qtl-contributing-anthocyanin-pink.jpg)


![Identification of a stable major-effect QTL (Parth 2.1 ......Among them, pat, pat4.1, pat4.2, pat5.1 and pat9.1 were mapped on genetic linkage maps [20, 21]. In eggplant, QTL analyses](https://img.pdfslide.us/doc/110x75/5f3ea93c82f289637b2bf80e/identification-of-a-stable-major-effect-qtl-parth-21-among-them-pat.jpg)