Embed Size (px)
Citation preview
Construction IndustrySnapshot Issued: May 2018
(based on April Starts Stats)
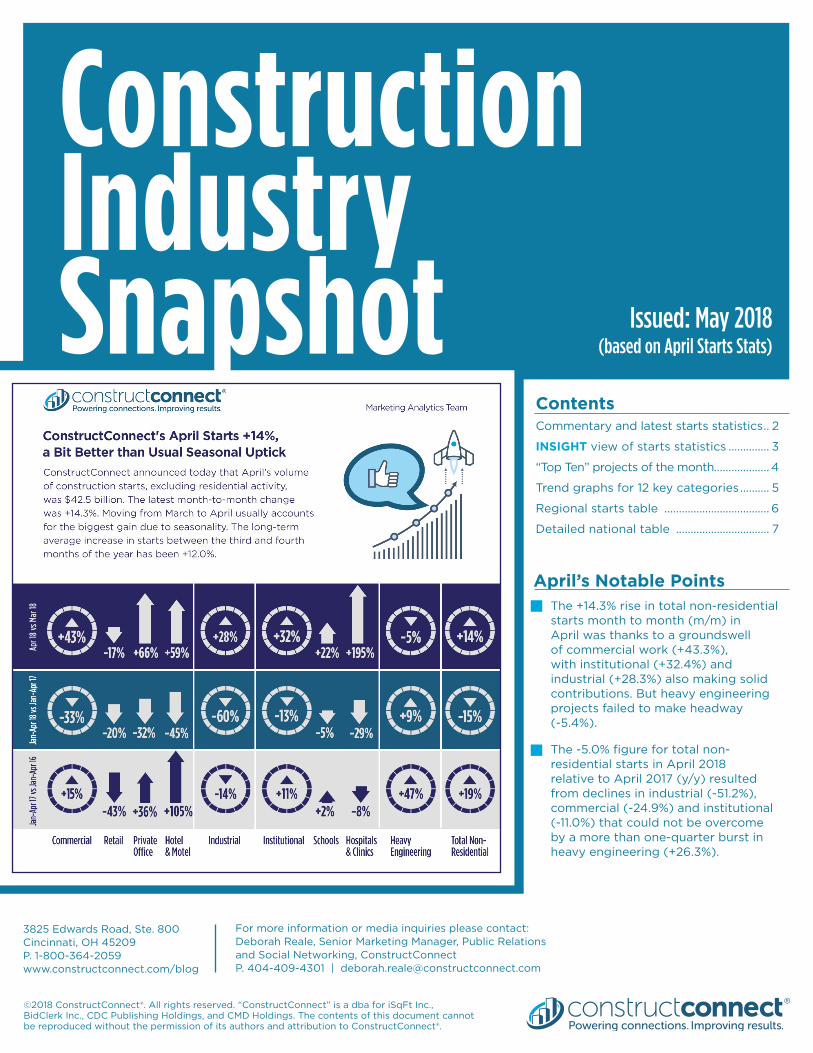
The +14.3% rise in total non-residential starts month to month (m/m) in April was thanks to a groundswell of commercial work (+43.3%), with institutional (+32.4%) and industrial (+28.3%) also making solid contributions. But heavy engineering projects failed to make headway (-5.4%).
The -5.0% figure for total non-residential starts in April 2018 relative to April 2017 (y/y) resulted from declines in industrial (-51.2%), commercial (-24.9%) and institutional (-11.0%) that could not be overcome by a more than one-quarter burst in heavy engineering (+26.3%).
ContentsCommentary and latest starts statistics .. 2
INSIGHT view of starts statistics .............. 3
“Top Ten” projects of the month................... 4
Trend graphs for 12 key categories .......... 5
Regional starts table .................................... 6
Detailed national table ................................ 7
April’s Notable Points
3825 Edwards Road, Ste. 800Cincinnati, OH 45209P. 1-800-364-2059www.constructconnect.com/blog
For more information or media inquiries please contact: Deborah Reale, Senior Marketing Manager, Public Relations and Social Networking, ConstructConnect P. 404-409-4301 | [email protected]
©2018 ConstructConnect®. All rights reserved. “ConstructConnect” is a dba for iSqFt Inc., BidClerk Inc., CDC Publishing Holdings, and CMD Holdings. The contents of this document cannot be reproduced without the permission of its authors and attribution to ConstructConnect®.
Construction Industry Snapshot
©2018 ConstructConnect®. All Rights Reserved. “ConstructConnect” is a dba for CMD Holdings. 2
Alex Carrick is Chief Economist for ConstructConnect. He has delivered presentations throughout North America on the U.S., Canadian and world construction outlooks. Mr. Carrick has been with the company since 1985. Links to his numerous articles are featured on Twitter @ConstructConnx, which has 49,000 followers.
ConstructConnect’s April Starts +14%, A Bit Better than Usual Seasonal Uptick
ConstructConnect announced today that April’s volume of construction starts, excluding residential activity, was $42.5 billion. The latest month-to-month change was +14.3%. Moving from March to April usually accounts for the biggest gain due to seasonality. The long-term average increase in starts between the third and fourth months of the year has been +12.0%.
April of this year versus the same month of last year was -5.0%. April of this year versus the five-year average for April, from 2013 through 2017, however, was a much better +28.8%.
April 2018’s year-to-date performance was -15%. Still, that was an improvement over March’s first-reported pull-back of -22%. The year-to-date percentage changes early in 2018 are being held down by Q1 2017’s exceptional strength in starts. This effect will gradually dissipate.
The starts figures throughout this report are not seasonally adjusted (NSA). Nor are they altered for inflation. They are expressed in what are termed ‘current’ as opposed to ‘constant’ dollars.
‘Non-residential building’ plus ‘engineering/civil’ work accounts for a larger share of total construction than residential activity. The former’s combined proportion of total put-in-place construction in the Census Bureau’s February report was 56%; the latter’s share was 44%.
ConstructConnect’s construction starts are leading indicators for the Census Bureau’s capital investment or put-in-place series. Also, the reporting period for starts (i.e., April 2018) is one month ahead of the reporting period for the investment series (i.e., March 2018.)
Total employment in the U.S. construction sector improved by +17,000 jobs in April, according to the latest Employment Situation report from the Bureau of Labor Statistics (BLS). The average monthly climb in hiring in construction to date this year has been +26,000, slightly faster than the +24,000 increase that was realized from January through April of last year. As for the jobless rate in the sector, it was April 2017 with the better (i.e., lower) level of 6.3% than April 2018, 6.5%.
While total employment in the U.S. is presently +1.6% year over year, construction firms are hiring at a rate that is more than twice as speedy, +3.7%. No other industry in the economy is adding to payrolls as quickly. Transportation and warehousing is in second place, at +3.0%.
Within overall construction, the year-over-year number of jobs undertaking residen-tial work is currently +5.1%. The comparable figures for non-residential building and heavy engineering are +3.1% and +1.2%. The Employment Situation report provides jobs data on three other industrial sub-sectors with close ties to construction. Year-over-year staffing is +3.6% at building material supply stores, +2.1% in real estate and +2.7% with architectural and engineering services firms.
The +14.3% rise in total non-residential starts month to month (m/m) in April was thanks to a groundswell of commercial work (+43.3%), with institutional (+32.4%) and industrial (+28.3%) also making solid contributions. But heavy engineering projects failed to make headway (-5.4%). There were groundbreakings on several large engineering proj-ects in the latest month (see Top 10, page 4). But collectively, they could not match March’s $5.5 billion Atlantic Coast Pipeline.
The -5.0% figure for total non-residential starts in April 2018 relative to April 2017 (y/y) resulted from declines in industrial (-51.2%), commercial (-24.9%) and institutional (-11.0%) that could not be overcome by a more than one-quarter burst in heavy engi-neering (+26.3%).
The sources of the -15.4% year-to-date (i.e., ytd = Jan-Apr 2018 vs Jan-Apr 2017) decline in total non-residential starts were industrial (-60.1%), commercial (-32.9%) and institutional (-13.3%). The only construction sub-category to fight back was heavy engineering/civil (+9.0%).
The major contributors to heavy engineering starts so far in 2018 have been the ‘road/highway’ and ‘miscellaneous civil’ sub-categories, with shares of 35% and 28% respectively. The former in April was -0.3% m/m, +20.0% y/y and +5.9% ytd while the latter was -34.2% m/m, +72.8% y/y and +111.1% ytd. April’s Top 10 had the Mountain Valley Pipeline start for $3.5 billion.
The ‘school/college’ sub-category has accounted for more than half (a 58% slice) of total institutional starts to date in 2018. Such educational facility starts in April were +21.8% m/m; +3.8% y/y; but -4.9% ytd. The ‘hospital/clinic’ and ‘nursing/assisted living’ sub-categories, with shares of 13% and 10%, have accounted for the next largest portions of institutional through April of this year. In the latest month, ‘hospital/clinic’ starts impressed at +195.4% m/m, but were -33.5% y/y and -28.7% ytd. ‘Nursing/assisted living’ starts fluctuated from +33.9% m/m to -32.9% y/y, but on a ytd basis, they settled on neutrality, with virtually no change, -0.4%.
The largest shares of total commercial in the first third of this year were provided by the ‘private office’ (a 24% or nearly one-quarter slice), ‘hotel/motel’ (an 18% slice) and ‘retail/shopping’ (a 15% slice) sub-categories (15%). ‘Private office’ starts in April were upbeat m/m (+66.2%), but were considerably less rosy both y/y (-13.6%) and ytd (-32.1%). ‘Hotel/motel’ starts displayed a similar pattern: +59.3% m/m, but -45.5% y/y and -45.2%
ytd. As for ‘retail/shopping’ starts in April, they were uniformly beleaguered: -16.7% m/m; -23.3% y/y; and -20.4% ytd.
The six graphs on page 5 show 12-month moving-average trend lines of starts for many of the major type-of-construction sub-categories. Except for ‘schools/colleges’, the curves for all the non-residential building sub-categories have been sloping downwards for a while. The tale has been different for the engineering sub-categories, however, with ‘roads/highways’ and ‘bridges’ appearing more robust, and the trend line for ‘miscellaneous civil’ launching into orbit.
Tables B-3 and B-8 of the monthly Employment Situation report record average hourly and average weekly wages for industry sectors. B-3 is for all employees (i.e., including bosses) on non-farm payrolls; B-8 is for ‘production and non-supervisory personnel’ only (i.e., it excludes bosses). For April in both tables, and across all industries, average hourly wages were +2.6% y/y and average weekly wages were +2.9%. Beating the +3.0% bench-mark stayed just out of reach.
Compensation rates for construction workers, though, were much better. From Table B-3, the gains were +3.5% for average hourly earnings and +4.1% for average weekly earn-ings. From Table B-8 (excluding supervisors), they were even healthier at +3.9% hourly and +4.7% weekly.
The value of construction starts each month is summarized from ConstructConnect’s database of all active construction projects in the U.S. Missing project values are estimated with the help of RSMeans’ building cost models.
ConstructConnect’s non-residential construction starts series, because it is comprised of total-value estimates for individual projects, some of which are ultra-large, has a history of being more volatile than many other leading indicators for the economy.
Alex Carrick
ConstructConnect has now moved to a better-targeted and research-assigned ‘start’ date. Prior to January 2017, the ‘start’ date was recorded as occurring within 30 to 60 days of the announced bid date. In concept, a ‘start’ is equivalent to ground being broken for a project to proceed. If work is abandoned or re-bid, the ‘start’ date is revised to reflect the new information.
Source: ConstructConnect Research Group/Table: ConstructConnect.
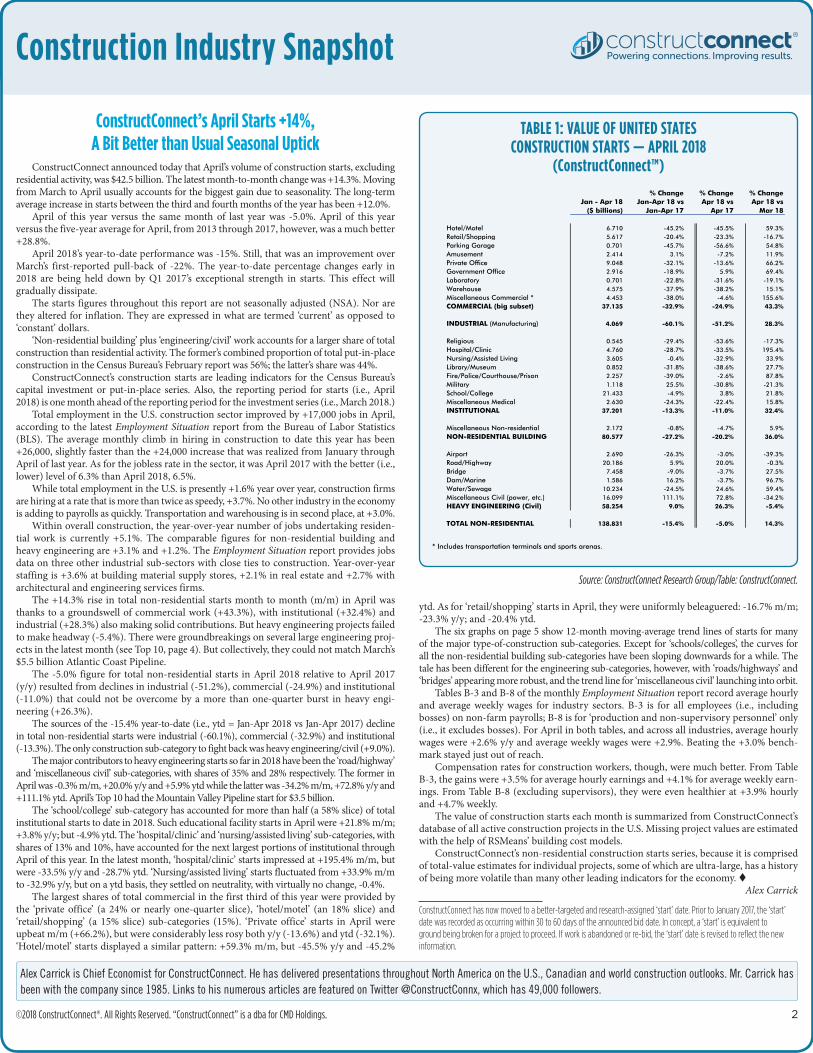
TABLE 1: VALUE OF UNITED STATES CONSTRUCTION STARTS — APRIL 2018
(ConstructConnect™)% Change % Change % Change
Jan - Apr 18 Jan-Apr 18 vs Apr 18 vs Apr 18 vs($ billions) Jan-Apr 17 Apr 17 Mar 18
Hotel/Motel 6.710 -45.2% -45.5% 59.3%Retail/Shopping 5.617 -20.4% -23.3% -16.7%Parking Garage 0.701 -45.7% -56.6% 54.8%Amusement 2.414 3.1% -7.2% 11.9%Private Office 9.048 -32.1% -13.6% 66.2%Government Office 2.916 -18.9% 5.9% 69.4%Laboratory 0.701 -22.8% -31.6% -19.1%Warehouse 4.575 -37.9% -38.2% 15.1%Miscellaneous Commercial * 4.453 -38.0% -4.6% 155.6%COMMERCIAL (big subset) 37.135 -32.9% -24.9% 43.3%
INDUSTRIAL (Manufacturing) 4.069 -60.1% -51.2% 28.3%
Religious 0.545 -29.4% -53.6% -17.3%Hospital/Clinic 4.760 -28.7% -33.5% 195.4%Nursing/Assisted Living 3.605 -0.4% -32.9% 33.9%Library/Museum 0.852 -31.8% -38.6% 27.7%Fire/Police/Courthouse/Prison 2.257 -39.0% -2.6% 87.8%Military 1.118 25.5% -30.8% -21.3%School/College 21.433 -4.9% 3.8% 21.8%Miscellaneous Medical 2.630 -24.3% -22.4% 15.8%INSTITUTIONAL 37.201 -13.3% -11.0% 32.4%
Miscellaneous Non-residential 2.172 -0.8% -4.7% 5.9%NON-RESIDENTIAL BUILDING 80.577 -27.2% -20.2% 36.0%
Airport 2.690 -26.3% -3.0% -39.3%Road/Highway 20.186 5.9% 20.0% -0.3%Bridge 7.458 -9.0% -3.7% 27.5%Dam/Marine 1.586 16.2% -3.7% 96.7%Water/Sewage 10.234 -24.5% 24.6% 59.4%Miscellaneous Civil (power, etc.) 16.099 111.1% 72.8% -34.2%HEAVY ENGINEERING (Civil) 58.254 9.0% 26.3% -5.4%
TOTAL NON-RESIDENTIAL 138.831 -15.4% -5.0% 14.3%
* Includes transportation terminals and sports arenas.Data source: ConstructConnect.
Table: ConstructConnect - CanaData.
Name of file: "U.S. Starts FINAL (Apr 18) - Extra.xlsx" in "U.S." folder
VALUE OF UNITED STATES CONSTRUCTION STARTS (BILLIONS OF CURRENT $S US) − APRIL 2018 − ConstructConnect
% Change % Change % ChangeJan - Apr 18 Jan-Apr 18 vs Apr 18 vs Apr 18 vs
($ billions) Jan-Apr 17 Apr 17 Mar 18
Hotel/Motel 6.710 -45.2% -45.5% 59.3%Retail/Shopping 5.617 -20.4% -23.3% -16.7%Parking Garage 0.701 -45.7% -56.6% 54.8%Amusement 2.414 3.1% -7.2% 11.9%Private Office 9.048 -32.1% -13.6% 66.2%Government Office 2.916 -18.9% 5.9% 69.4%Laboratory 0.701 -22.8% -31.6% -19.1%Warehouse 4.575 -37.9% -38.2% 15.1%Miscellaneous Commercial * 4.453 -38.0% -4.6% 155.6%COMMERCIAL (big subset) 37.135 -32.9% -24.9% 43.3%
INDUSTRIAL (Manufacturing) 4.069 -60.1% -51.2% 28.3%
Religious 0.545 -29.4% -53.6% -17.3%Hospital/Clinic 4.760 -28.7% -33.5% 195.4%Nursing/Assisted Living 3.605 -0.4% -32.9% 33.9%Library/Museum 0.852 -31.8% -38.6% 27.7%Fire/Police/Courthouse/Prison 2.257 -39.0% -2.6% 87.8%Military 1.118 25.5% -30.8% -21.3%School/College 21.433 -4.9% 3.8% 21.8%Miscellaneous Medical 2.630 -24.3% -22.4% 15.8%INSTITUTIONAL 37.201 -13.3% -11.0% 32.4%
Miscellaneous Non-residential 2.172 -0.8% -4.7% 5.9%NON-RESIDENTIAL BUILDING 80.577 -27.2% -20.2% 36.0%
Airport 2.690 -26.3% -3.0% -39.3%Road/Highway 20.186 5.9% 20.0% -0.3%Bridge 7.458 -9.0% -3.7% 27.5%Dam/Marine 1.586 16.2% -3.7% 96.7%Water/Sewage 10.234 -24.5% 24.6% 59.4%Miscellaneous Civil (power, etc.) 16.099 111.1% 72.8% -34.2%HEAVY ENGINEERING (Civil) 58.254 9.0% 26.3% -5.4%
TOTAL NON-RESIDENTIAL 138.831 -15.4% -5.0% 14.3%
* Includes transportation terminals and sports arenas.Data source: ConstructConnect.
Table: ConstructConnect - CanaData.
Name of file: "U.S. Starts FINAL (Apr 18) - Extra.xlsx" in "U.S." folder
VALUE OF UNITED STATES CONSTRUCTION STARTS (BILLIONS OF CURRENT $S US) − APRIL 2018 − ConstructConnect
Construction Industry Snapshot
©2018 ConstructConnect®. All Rights Reserved. “ConstructConnect” is a dba for CMD Holdings. 3
Table 1 conforms to the type-of-structure ordering adopted by many firms and organizations in the industry. Specifically, it breaks non-residential building into ICI work (i.e., industrial, commercial and institutional), since each has its own set of economic and demographic drivers. Table 2 presents an alternative, perhaps more user-friendly and intui-tive type-of-structure ordering that matches how the data appears in ConstructConnect’s on-line product ‘Insight’.
Source: ConstructConnect/Table: ConstructConnect.
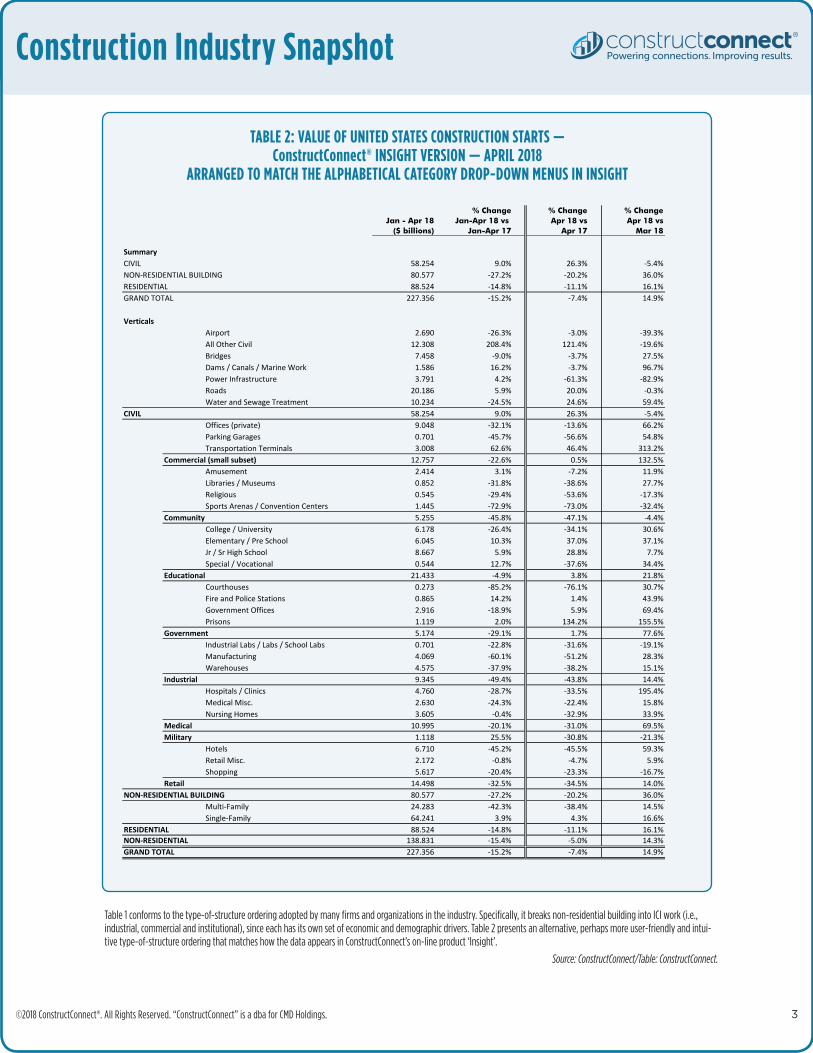
TABLE 2: VALUE OF UNITED STATES CONSTRUCTION STARTS — ConstructConnect® INSIGHT VERSION — APRIL 2018
ARRANGED TO MATCH THE ALPHABETICAL CATEGORY DROP-DOWN MENUS IN INSIGHT
% Change % Change % ChangeJan - Apr 18 Jan-Apr 18 vs Apr 18 vs Apr 18 vs
($ billions) Jan-Apr 17 Apr 17 Mar 18
Summary CIVIL 58.254 9.0% 26.3% -5.4%NON-RESIDENTIAL BUILDING 80.577 -27.2% -20.2% 36.0%RESIDENTIAL 88.524 -14.8% -11.1% 16.1%GRAND TOTAL 227.356 -15.2% -7.4% 14.9%
VerticalsAirport 2.690 -26.3% -3.0% -39.3%All Other Civil 12.308 208.4% 121.4% -19.6%Bridges 7.458 -9.0% -3.7% 27.5%Dams / Canals / Marine Work 1.586 16.2% -3.7% 96.7%Power Infrastructure 3.791 4.2% -61.3% -82.9%Roads 20.186 5.9% 20.0% -0.3%Water and Sewage Treatment 10.234 -24.5% 24.6% 59.4%
CIVIL 58.254 9.0% 26.3% -5.4%Offices (private) 9.048 -32.1% -13.6% 66.2%Parking Garages 0.701 -45.7% -56.6% 54.8%Transportation Terminals 3.008 62.6% 46.4% 313.2%
Commercial (small subset) 12.757 -22.6% 0.5% 132.5%Amusement 2.414 3.1% -7.2% 11.9%Libraries / Museums 0.852 -31.8% -38.6% 27.7%Religious 0.545 -29.4% -53.6% -17.3%Sports Arenas / Convention Centers 1.445 -72.9% -73.0% -32.4%
Community 5.255 -45.8% -47.1% -4.4%College / University 6.178 -26.4% -34.1% 30.6%Elementary / Pre School 6.045 10.3% 37.0% 37.1%Jr / Sr High School 8.667 5.9% 28.8% 7.7%Special / Vocational 0.544 12.7% -37.6% 34.4%
Educational 21.433 -4.9% 3.8% 21.8%Courthouses 0.273 -85.2% -76.1% 30.7%Fire and Police Stations 0.865 14.2% 1.4% 43.9%Government Offices 2.916 -18.9% 5.9% 69.4%Prisons 1.119 2.0% 134.2% 155.5%
Government 5.174 -29.1% 1.7% 77.6%Industrial Labs / Labs / School Labs 0.701 -22.8% -31.6% -19.1%Manufacturing 4.069 -60.1% -51.2% 28.3%Warehouses 4.575 -37.9% -38.2% 15.1%
Industrial 9.345 -49.4% -43.8% 14.4%Hospitals / Clinics 4.760 -28.7% -33.5% 195.4%Medical Misc. 2.630 -24.3% -22.4% 15.8%Nursing Homes 3.605 -0.4% -32.9% 33.9%
Medical 10.995 -20.1% -31.0% 69.5%Military 1.118 25.5% -30.8% -21.3%
Hotels 6.710 -45.2% -45.5% 59.3%Retail Misc. 2.172 -0.8% -4.7% 5.9%Shopping 5.617 -20.4% -23.3% -16.7%
Retail 14.498 -32.5% -34.5% 14.0%NON-RESIDENTIAL BUILDING 80.577 -27.2% -20.2% 36.0%
Multi-Family 24.283 -42.3% -38.4% 14.5%Single-Family 64.241 3.9% 4.3% 16.6%
RESIDENTIAL 88.524 -14.8% -11.1% 16.1%NON-RESIDENTIAL 138.831 -15.4% -5.0% 14.3%GRAND TOTAL 227.356 -15.2% -7.4% 14.9%
VALUE OF UNITED STATES CONSTRUCTION STARTS −ConstructConnect INSIGHT VERSION − APRIL 2018Arranged to match the alphabetical category drop-down menus in INSIGHT
Table 1 conforms to the type-of-structure ordering adopted by many firms and organizations in the industry. Specifically, it breaks non-residential building into ICI work (i.e., industrial, commercial and institutional), since each has its own set of economic and demographic drivers. Table 2 presents an alternative, perhaps more user-friendly and intuitive type-of-structure ordering that matches how the data appears in CMD’s on-line product ‘Insight’.
Construction Industry Snapshot
©2018 ConstructConnect®. All Rights Reserved. “ConstructConnect” is a dba for CMD Holdings. 4
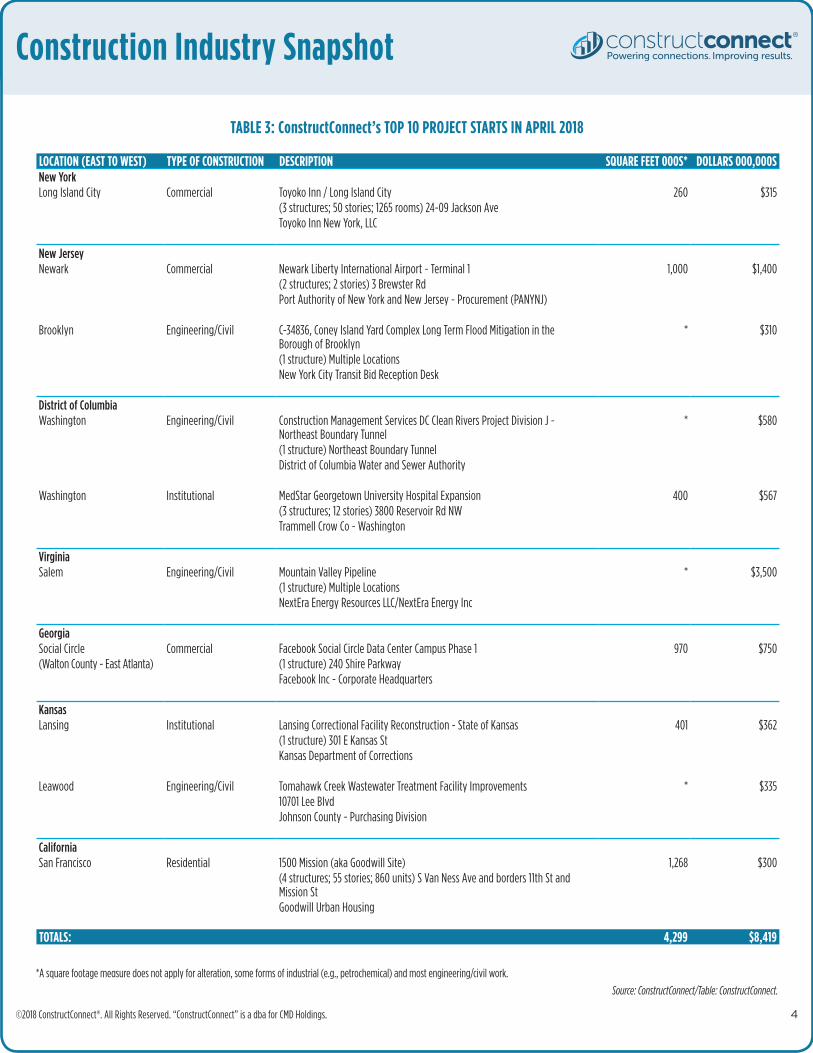
LOCATION (EAST TO WEST) TYPE OF CONSTRUCTION DESCRIPTION SQUARE FEET 000S* DOLLARS 000,000SNew YorkLong Island City Commercial Toyoko Inn / Long Island City 260 $315
(3 structures; 50 stories; 1265 rooms) 24-09 Jackson AveToyoko Inn New York, LLC
New JerseyNewark Commercial Newark Liberty International Airport - Terminal 1 1,000 $1,400
(2 structures; 2 stories) 3 Brewster RdPort Authority of New York and New Jersey - Procurement (PANYNJ)
Brooklyn Engineering/Civil C-34836, Coney Island Yard Complex Long Term Flood Mitigation in the Borough of Brooklyn
* $310
(1 structure) Multiple LocationsNew York City Transit Bid Reception Desk
District of ColumbiaWashington Engineering/Civil Construction Management Services DC Clean Rivers Project Division J -
Northeast Boundary Tunnel * $580
(1 structure) Northeast Boundary TunnelDistrict of Columbia Water and Sewer Authority
Washington Institutional MedStar Georgetown University Hospital Expansion 400 $567(3 structures; 12 stories) 3800 Reservoir Rd NW Trammell Crow Co - Washington
VirginiaSalem Engineering/Civil Mountain Valley Pipeline * $3,500
(1 structure) Multiple LocationsNextEra Energy Resources LLC/NextEra Energy Inc
GeorgiaSocial Circle Commercial Facebook Social Circle Data Center Campus Phase 1 970 $750(Walton County - East Atlanta) (1 structure) 240 Shire Parkway
Facebook Inc - Corporate Headquarters
KansasLansing Institutional Lansing Correctional Facility Reconstruction - State of Kansas 401 $362
(1 structure) 301 E Kansas StKansas Department of Corrections
Leawood Engineering/Civil Tomahawk Creek Wastewater Treatment Facility Improvements * $33510701 Lee BlvdJohnson County - Purchasing Division
CaliforniaSan Francisco Residential 1500 Mission (aka Goodwill Site) 1,268 $300
(4 structures; 55 stories; 860 units) S Van Ness Ave and borders 11th St and Mission StGoodwill Urban Housing
TOTALS: 4,299 $8,419
TABLE 3: ConstructConnect’s TOP 10 PROJECT STARTS IN APRIL 2018
*A square footage measure does not apply for alteration, some forms of industrial (e.g., petrochemical) and most engineering/civil work.
Source: ConstructConnect/Table: ConstructConnect.

Construction Industry Snapshot
©2018 ConstructConnect®. All Rights Reserved. “ConstructConnect” is a dba for CMD Holdings. 5
The last data points in all the graphs are for April, 2018.
GRAPH 1: U.S. NON-RESIDENTIAL CONSTRUCTION STARTS — ConstructConnect®
(12-MONTH MOVING AVERAGES)
GRAPH 3: U.S. RETAIL AND PRIVATE OFFICE BUILDING CONSTRUCTION STARTS — ConstructConnect®
(12-MONTH MOVING AVERAGES)
GRAPH 5: U.S. ROAD/HIGHWAY AND WATER/SEWAGE CONSTRUCTION STARTS — ConstructConnect®
(12-MONTH MOVING AVERAGES)
GRAPH 2: U.S. COMMERCIAL AND INSTITUTIONAL CONSTRUCTION STARTS — ConstructConnect®
(12-MONTH MOVING AVERAGES)
GRAPH 4: U.S. HOSPITAL/CLINIC AND SCHOOL/COLLEGE CONSTRUCTION STARTS — ConstructConnect®
(12-MONTH MOVING AVERAGES)
GRAPH 6: U.S. BRIDGES AND MISCELLANEOUS CIVIL CONSTRUCTION STARTS — ConstructConnect®
(12-MONTH MOVING AVERAGES)
The last data points are for April, 2018.Data source: ConstructConnect.
Graph: ConstructConnect-CanaData.
U.S. Non-residential Construction Starts ‒ ConstructConnect(12-month moving averages)
Name of file: "U.S. Starts FINAL (Apr 18) - Extra.xlsx" in "U.S." folder
$0.0
$5.0
$10.0
$15.0
$20.0
$25.0
$30.0
05-J A J O
06-J A J O
07-J A J O
08-J A J O
09-J A J O
10-J A J O
11-J A J O
12-J A J O
13-J A J O
14-J A J O
15-J A J O
16-J A J O
17-J A J O
18-J A
Cu
rren
t $ b
illion
s
Year and month
Non-residential Building
Heavy Engineering
The last data points are for April, 2018. Data source: ConstructConnect.
Graph: ConstructConnect-CanaData.
U.S. Retail & Private Office Building Construction Starts ‒ ConstructConnect(12-month moving averages)
Name of file: "U.S. Starts FINAL (Apr 18) - Extra.xlsx" in "U.S." folder
$0.0
$0.9
$1.8
$2.7
$3.6
05-J A J O
06-J A J O
07-J A J O
08-J A J O
09-J A J O
10-J A J O
11-J A J O
12-J A J O
13-J A J O
14-J A J O
15-J A J O
16-J A J O
17-J A J O
18-J A
Cu
rren
t $ b
illion
s
Year and month
Retail
Private Office Buildings
The last data points are for April, 2018. Data source: ConstructConnect.
Graph: ConstructConnect-CanaData.
(12-month moving averages)
Name of file: "U.S. Starts FINAL (Apr 18) - Extra.xlsx" in "U.S." folder
U.S. Road/Highway & Water/Sewage Construction Starts ‒ ConstructConnect
$0.0
$1.0
$2.0
$3.0
$4.0
$5.0
05-J A J O
06-J A J O
07-J A J O
08-J A J O
09-J A J O
10-J A J O
11-J A J O
12-J A J O
13-J A J O
14-J A J O
15-J A J O
16-J A J O
17-J A J O
18-J A
Cu
rren
t $ b
illion
s
Year and month
Roads/Highways
Water/Sewage
The last data points are for April, 2018. Data source: ConstructConnect.
Graph: ConstructConnect-CanaData.
U.S. Commercial & Institutional Construction Starts ‒ ConstructConnect(12-month moving averages)
Name of file: "U.S. Starts FINAL (Apr 18) - Extra.xlsx" in "U.S." folder
$4.0
$5.0
$6.0
$7.0
$8.0
$9.0
$10.0
$11.0
$12.0
$13.0
05-J A J O
06-J A J O
07-J A J O
08-J A J O
09-J A J O
10-J A J O
11-J A J O
12-J A J O
13-J A J O
14-J A J O
15-J A J O
16-J A J O
17-J A J O
18-J A
Cu
rren
t $ b
illion
s
Year and month
Institutional
Commercial
The last data points are for April, 2018. Data source: ConstructConnect.
Graph: ConstructConnect-CanaData.
U.S. Hospital/Clinic & School/College Construction Starts ‒ ConstructConnect(12-month moving averages)
Name of file: "U.S. Starts FINAL (Apr 18) - Extra.xlsx" in "U.S." folder
$0.0
$1.0
$2.0
$3.0
$4.0
$5.0
$6.0
$7.0
05-J A J O
06-J A J O
07-J A J O
08-J A J O
09-J A J O
10-J A J O
11-J A J O
12-J A J O
13-J A J O
14-J A J O
15-J A J O
16-J A J O
17-J A J O
18-J A
Cu
rren
t $ b
illion
s
Year and month
Schools/Colleges
Hospitals/Clinics
The last data points are for April, 2018. Data source: ConstructConnect.
Graph: ConstructConnect-CanaData.
(12-month moving averages)
Name of file: "U.S. Starts FINAL (Apr 18) - Extra.xlsx" in "U.S." folder
U.S. Bridges & Miscellaneous Civil Construction Starts ‒ ConstructConnect
$0.0
$0.4
$0.8
$1.2
$1.6
$2.0
$2.4
$2.8
$3.2
05-J A J O
06-J A J O
07-J A J O
08-J A J O
09-J A J O
10-J A J O
11-J A J O
12-J A J O
13-J A J O
14-J A J O
15-J A J O
16-J A J O
17-J A J O
18-J A
Cu
rren
t $ b
illion
s
Year and month
Bridges
Miscellaneous Civil (e.g., Power, Oil and Gas Pipelines, etc.)
Source: ConstructConnect/Charts: ConstructConnect.
Construction Industry Snapshot
©2018 ConstructConnect®. All Rights Reserved. “ConstructConnect” is a dba for CMD Holdings. 6
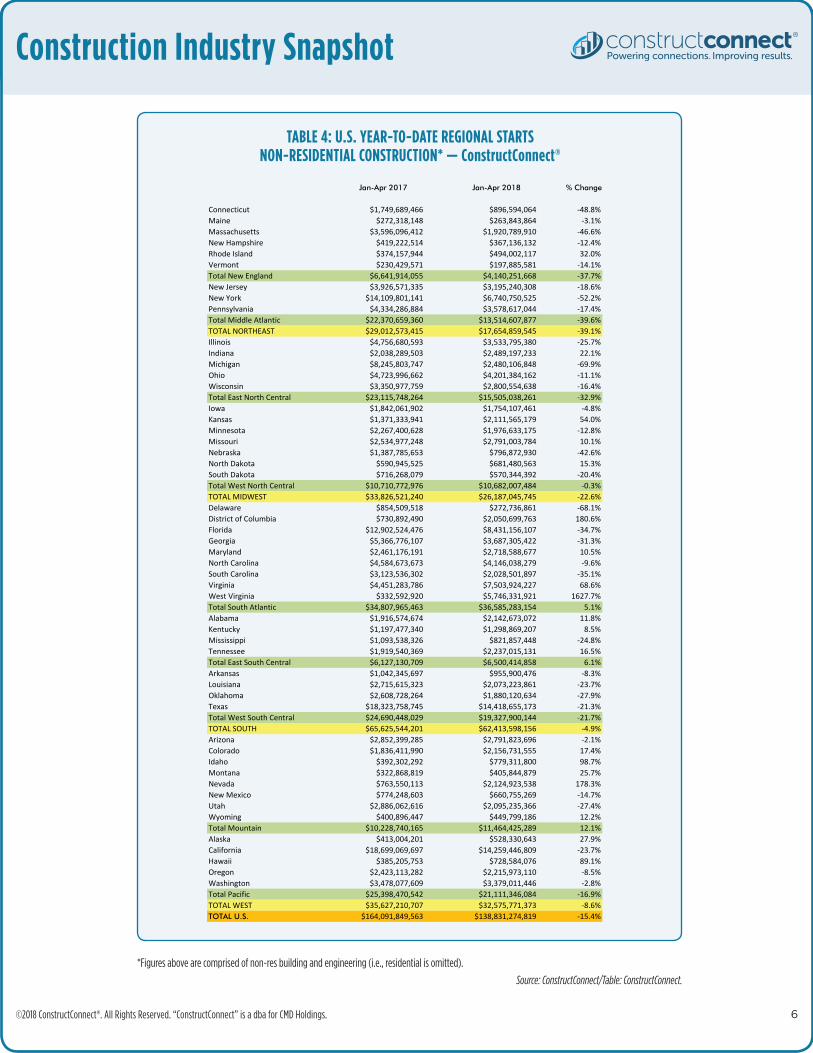
*Figures above are comprised of non-res building and engineering (i.e., residential is omitted).
Source: ConstructConnect/Table: ConstructConnect.
TABLE 4: U.S. YEAR-TO-DATE REGIONAL STARTS NON-RESIDENTIAL CONSTRUCTION* — ConstructConnect®
Jan-Apr 2017 Jan-Apr 2018 % Change
Connecticut $1,749,689,466 $896,594,064 -48.8%Maine $272,318,148 $263,843,864 -3.1%Massachusetts $3,596,096,412 $1,920,789,910 -46.6%New Hampshire $419,222,514 $367,136,132 -12.4%Rhode Island $374,157,944 $494,002,117 32.0%Vermont $230,429,571 $197,885,581 -14.1%Total New England $6,641,914,055 $4,140,251,668 -37.7%New Jersey $3,926,571,335 $3,195,240,308 -18.6%New York $14,109,801,141 $6,740,750,525 -52.2%Pennsylvania $4,334,286,884 $3,578,617,044 -17.4%Total Middle Atlantic $22,370,659,360 $13,514,607,877 -39.6%TOTAL NORTHEAST $29,012,573,415 $17,654,859,545 -39.1%Illinois $4,756,680,593 $3,533,795,380 -25.7%Indiana $2,038,289,503 $2,489,197,233 22.1%Michigan $8,245,803,747 $2,480,106,848 -69.9%Ohio $4,723,996,662 $4,201,384,162 -11.1%Wisconsin $3,350,977,759 $2,800,554,638 -16.4%Total East North Central $23,115,748,264 $15,505,038,261 -32.9%Iowa $1,842,061,902 $1,754,107,461 -4.8%Kansas $1,371,333,941 $2,111,565,179 54.0%Minnesota $2,267,400,628 $1,976,633,175 -12.8%Missouri $2,534,977,248 $2,791,003,784 10.1%Nebraska $1,387,785,653 $796,872,930 -42.6%North Dakota $590,945,525 $681,480,563 15.3%South Dakota $716,268,079 $570,344,392 -20.4%Total West North Central $10,710,772,976 $10,682,007,484 -0.3%TOTAL MIDWEST $33,826,521,240 $26,187,045,745 -22.6%Delaware $854,509,518 $272,736,861 -68.1%District of Columbia $730,892,490 $2,050,699,763 180.6%Florida $12,902,524,476 $8,431,156,107 -34.7%Georgia $5,366,776,107 $3,687,305,422 -31.3%Maryland $2,461,176,191 $2,718,588,677 10.5%North Carolina $4,584,673,673 $4,146,038,279 -9.6%South Carolina $3,123,536,302 $2,028,501,897 -35.1%Virginia $4,451,283,786 $7,503,924,227 68.6%West Virginia $332,592,920 $5,746,331,921 1627.7%Total South Atlantic $34,807,965,463 $36,585,283,154 5.1%Alabama $1,916,574,674 $2,142,673,072 11.8%Kentucky $1,197,477,340 $1,298,869,207 8.5%Mississippi $1,093,538,326 $821,857,448 -24.8%Tennessee $1,919,540,369 $2,237,015,131 16.5%Total East South Central $6,127,130,709 $6,500,414,858 6.1%Arkansas $1,042,345,697 $955,900,476 -8.3%Louisiana $2,715,615,323 $2,073,223,861 -23.7%Oklahoma $2,608,728,264 $1,880,120,634 -27.9%Texas $18,323,758,745 $14,418,655,173 -21.3%Total West South Central $24,690,448,029 $19,327,900,144 -21.7%TOTAL SOUTH $65,625,544,201 $62,413,598,156 -4.9%Arizona $2,852,399,285 $2,791,823,696 -2.1%Colorado $1,836,411,990 $2,156,731,555 17.4%Idaho $392,302,292 $779,311,800 98.7%Montana $322,868,819 $405,844,879 25.7%Nevada $763,550,113 $2,124,923,538 178.3%New Mexico $774,248,603 $660,755,269 -14.7%Utah $2,886,062,616 $2,095,235,366 -27.4%Wyoming $400,896,447 $449,799,186 12.2%Total Mountain $10,228,740,165 $11,464,425,289 12.1%Alaska $413,004,201 $528,330,643 27.9%California $18,699,069,697 $14,259,446,809 -23.7%Hawaii $385,205,753 $728,584,076 89.1%Oregon $2,423,113,282 $2,215,973,110 -8.5%Washington $3,478,077,609 $3,379,011,446 -2.8%Total Pacific $25,398,470,542 $21,111,346,084 -16.9%TOTAL WEST $35,627,210,707 $32,575,771,373 -8.6%TOTAL U.S. $164,091,849,563 $138,831,274,819 -15.4%
Figures above are comprised of non-res building and engineering (i.e., residential is omitted).Data source and Table: ConstructConnect.
U.S. Year-to-Date Regional Non-residential Construction Starts - ConstructConnect
Name of this file: "Regional Starts U.S. for Industry Snapshot (Apr 18).xlsx".
Construction Industry Snapshot
©2018 ConstructConnect®. All Rights Reserved. “ConstructConnect” is a dba for CMD Holdings. 7
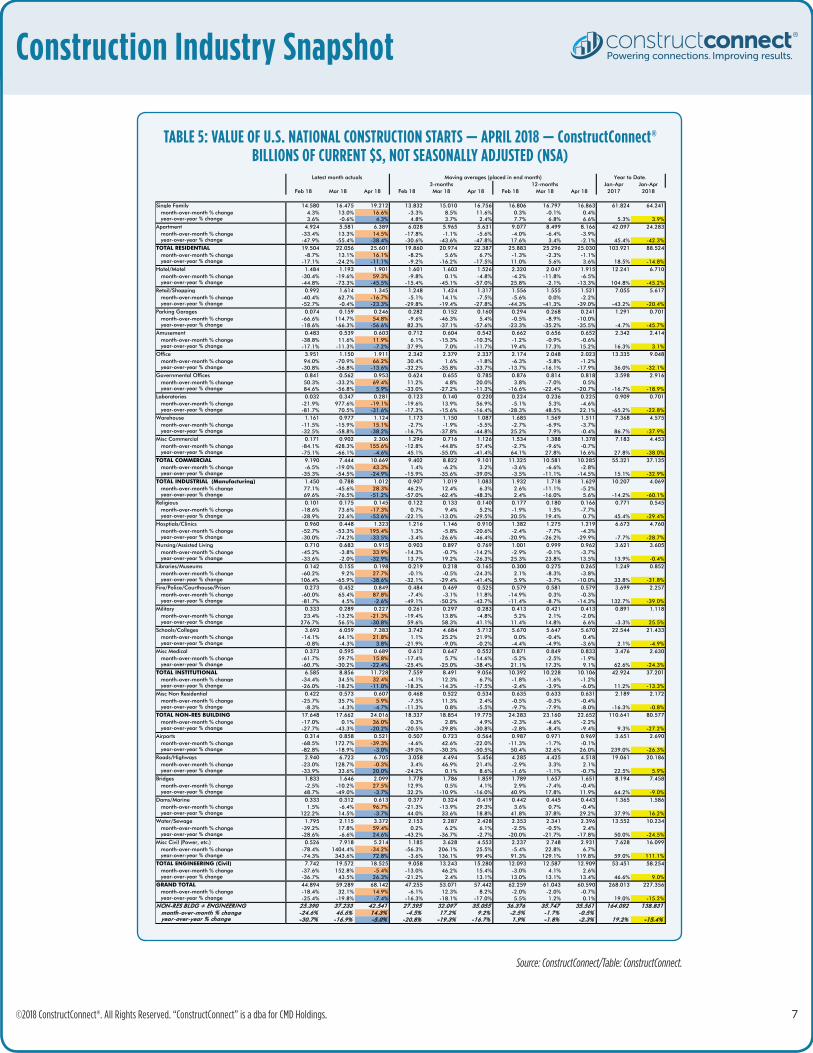
Source: ConstructConnect/Table: ConstructConnect.
TABLE 5: VALUE OF U.S. NATIONAL CONSTRUCTION STARTS — APRIL 2018 — ConstructConnect® BILLIONS OF CURRENT $S, NOT SEASONALLY ADJUSTED (NSA)
Jan-Apr Jan-AprFeb 18 Mar 18 Apr 18 Feb 18 Mar 18 Apr 18 Feb 18 Mar 18 Apr 18 2017 2018
Single Family 14.580 16.475 19.212 13.832 15.010 16.756 16.806 16.797 16.863 61.824 64.241 month-over-month % change 4.3% 13.0% 16.6% -3.3% 8.5% 11.6% 0.3% -0.1% 0.4% year-over-year % change 3.6% -0.6% 4.3% 4.8% 3.7% 2.4% 7.7% 6.8% 6.6% 5.3% 3.9%Apartment 4.924 5.581 6.389 6.028 5.965 5.631 9.077 8.499 8.166 42.097 24.283 month-over-month % change -33.4% 13.3% 14.5% -17.8% -1.1% -5.6% -4.0% -6.4% -3.9% year-over-year % change -47.9% -55.4% -38.4% -30.6% -43.6% -47.8% 17.6% 3.4% -2.1% 45.4% -42.3%TOTAL RESIDENTIAL 19.504 22.056 25.601 19.860 20.974 22.387 25.883 25.296 25.030 103.921 88.524 month-over-month % change -8.7% 13.1% 16.1% -8.2% 5.6% 6.7% -1.3% -2.3% -1.1% year-over-year % change -17.1% -24.2% -11.1% -9.2% -16.2% -17.5% 11.0% 5.6% 3.6% 18.5% -14.8%Hotel/Motel 1.484 1.193 1.901 1.601 1.603 1.526 2.320 2.047 1.915 12.241 6.710 month-over-month % change -30.4% -19.6% 59.3% -9.8% 0.1% -4.8% -4.2% -11.8% -6.5% year-over-year % change -44.8% -73.3% -45.5% -15.4% -45.1% -57.0% 25.8% -2.1% -13.3% 104.8% -45.2%Retail/Shopping 0.992 1.614 1.345 1.248 1.424 1.317 1.556 1.555 1.521 7.055 5.617 month-over-month % change -40.4% 62.7% -16.7% -5.1% 14.1% -7.5% -5.6% 0.0% -2.2% year-over-year % change -52.7% -0.4% -23.3% -29.8% -19.4% -27.8% -44.3% -41.3% -39.0% -43.2% -20.4%Parking Garages 0.074 0.159 0.246 0.282 0.152 0.160 0.294 0.268 0.241 1.291 0.701 month-over-month % change -66.6% 114.7% 54.8% -9.6% -46.3% 5.4% -0.5% -8.9% -10.0% year-over-year % change -18.6% -66.3% -56.6% 82.3% -37.1% -57.6% -23.3% -35.2% -35.5% -4.7% -45.7%Amusement 0.483 0.539 0.603 0.712 0.604 0.542 0.662 0.656 0.652 2.342 2.414 month-over-month % change -38.8% 11.6% 11.9% 6.1% -15.3% -10.3% -1.2% -0.9% -0.6% year-over-year % change -17.1% -11.3% -7.2% 37.9% 7.0% -11.7% 19.4% 17.3% 15.2% 16.3% 3.1%Office 3.951 1.150 1.911 2.342 2.379 2.337 2.174 2.048 2.023 13.335 9.048 month-over-month % change 94.0% -70.9% 66.2% 30.4% 1.6% -1.8% -6.3% -5.8% -1.2% year-over-year % change -30.8% -56.8% -13.6% -32.2% -35.8% -33.7% -13.7% -16.1% -17.9% 36.0% -32.1%Governmental Offices 0.841 0.562 0.953 0.624 0.655 0.785 0.876 0.814 0.818 3.598 2.916 month-over-month % change 50.3% -33.2% 69.4% 11.2% 4.8% 20.0% 3.8% -7.0% 0.5% year-over-year % change 84.6% -56.8% 5.9% -33.0% -27.2% -11.3% -16.6% -22.4% -20.7% -16.7% -18.9%Laboratories 0.032 0.347 0.281 0.123 0.140 0.220 0.224 0.236 0.225 0.909 0.701 month-over-month % change -21.9% 977.6% -19.1% -19.6% 13.9% 56.9% -5.1% 5.3% -4.6% year-over-year % change -81.7% 70.5% -31.6% -17.3% -15.6% -16.4% -28.3% 48.5% 22.1% -65.2% -22.8%Warehouse 1.161 0.977 1.124 1.173 1.150 1.087 1.685 1.569 1.511 7.368 4.575 month-over-month % change -11.5% -15.9% 15.1% -2.7% -1.9% -5.5% -2.7% -6.9% -3.7% year-over-year % change -32.5% -58.8% -38.2% -16.7% -37.8% -44.8% 25.2% 7.9% -0.4% 86.7% -37.9%Misc Commercial 0.171 0.902 2.306 1.296 0.716 1.126 1.534 1.388 1.378 7.183 4.453 month-over-month % change -84.1% 428.3% 155.6% -12.8% -44.8% 57.4% -2.7% -9.6% -0.7% year-over-year % change -75.1% -66.1% -4.6% 45.1% -55.0% -41.4% 64.1% 27.8% 16.6% 27.8% -38.0%TOTAL COMMERCIAL 9.190 7.444 10.669 9.402 8.822 9.101 11.325 10.581 10.285 55.321 37.135 month-over-month % change -6.5% -19.0% 43.3% 1.4% -6.2% 3.2% -3.6% -6.6% -2.8% year-over-year % change -35.3% -54.5% -24.9% -15.9% -35.6% -39.0% -3.5% -11.1% -14.5% 15.1% -32.9%TOTAL INDUSTRIAL (Manufacturing) 1.450 0.788 1.012 0.907 1.019 1.083 1.932 1.718 1.629 10.207 4.069 month-over-month % change 77.1% -45.6% 28.3% 46.2% 12.4% 6.3% 2.6% -11.1% -5.2% year-over-year % change 69.6% -76.5% -51.2% -57.0% -62.4% -48.3% 2.4% -16.0% 5.6% -14.2% -60.1%Religious 0.101 0.175 0.145 0.122 0.133 0.140 0.177 0.180 0.166 0.771 0.545 month-over-month % change -18.6% 73.6% -17.3% 0.7% 9.4% 5.2% -1.9% 1.5% -7.7% year-over-year % change -28.9% 22.6% -53.6% -22.1% -13.0% -29.5% 20.5% 19.4% 0.7% 45.4% -29.4%Hosptials/Clinics 0.960 0.448 1.323 1.216 1.146 0.910 1.382 1.275 1.219 6.673 4.760 month-over-month % change -52.7% -53.3% 195.4% 1.3% -5.8% -20.6% -2.4% -7.7% -4.3% year-over-year % change -30.0% -74.2% -33.5% -3.4% -26.6% -46.4% -20.9% -26.2% -29.9% -7.7% -28.7%Nursing/Assisted Living 0.710 0.683 0.915 0.903 0.897 0.769 1.001 0.999 0.962 3.621 3.605 month-over-month % change -45.2% -3.8% 33.9% -14.3% -0.7% -14.2% -2.9% -0.1% -3.7% year-over-year % change -33.6% -2.0% -32.9% 13.7% 19.2% -26.3% 25.3% 23.8% 13.5% 13.9% -0.4%Libraries/Museums 0.142 0.155 0.198 0.219 0.218 0.165 0.300 0.275 0.265 1.249 0.852 month-over-month % change -60.2% 9.2% 27.7% -0.1% -0.5% -24.3% 2.1% -8.3% -3.8% year-over-year % change 106.4% -65.9% -38.6% -32.1% -29.4% -41.4% 5.9% -3.7% -10.0% 33.8% -31.8%Fire/Police/Courthouse/Prison 0.273 0.452 0.849 0.484 0.469 0.525 0.579 0.581 0.579 3.699 2.257 month-over-month % change -60.0% 65.4% 87.8% -7.4% -3.1% 11.8% -14.9% 0.3% -0.3% year-over-year % change -81.7% 4.5% -2.6% -49.1% -50.2% -43.7% -11.4% -8.7% -14.3% 132.7% -39.0%Military 0.333 0.289 0.227 0.261 0.297 0.283 0.413 0.421 0.413 0.891 1.118 month-over-month % change 23.4% -13.2% -21.3% -19.4% 13.8% -4.8% 5.2% 2.1% -2.0% year-over-year % change 276.7% 56.5% -30.8% 59.6% 58.3% 41.1% 11.4% 14.8% 6.6% -3.3% 25.5%Schools/Colleges 3.693 6.059 7.383 3.742 4.684 5.712 5.670 5.647 5.670 22.544 21.433 month-over-month % change -14.1% 64.1% 21.8% 1.1% 25.2% 21.9% 0.0% -0.4% 0.4% year-over-year % change -0.8% -4.3% 3.8% -21.9% -9.0% -0.2% -4.4% -4.9% -3.6% 2.1% -4.9%Misc Medical 0.373 0.595 0.689 0.612 0.647 0.552 0.871 0.849 0.833 3.476 2.630 month-over-month % change -61.7% 59.7% 15.8% -17.4% 5.7% -14.6% -5.2% -2.5% -1.9% year-over-year % change -60.7% -30.2% -22.4% -25.4% -25.0% -38.4% 21.1% 17.3% 9.1% 62.6% -24.3%TOTAL INSTITUTIONAL 6.585 8.856 11.728 7.559 8.491 9.056 10.392 10.228 10.106 42.924 37.201 month-over-month % change -34.4% 34.5% 32.4% -4.1% 12.3% 6.7% -1.8% -1.6% -1.2% year-over-year % change -26.0% -18.2% -11.0% -18.3% -14.3% -17.5% -2.4% -3.9% -6.0% 11.2% -13.3%Misc Non Residential 0.422 0.573 0.607 0.468 0.522 0.534 0.635 0.633 0.631 2.189 2.172 month-over-month % change -25.7% 35.7% 5.9% -7.5% 11.3% 2.4% -0.5% -0.3% -0.4% year-over-year % change -8.3% -4.3% -4.7% -11.3% 0.8% -5.5% -9.7% -7.9% -8.0% -16.3% -0.8%TOTAL NON-RES BUILDING 17.648 17.662 24.016 18.337 18.854 19.775 24.283 23.160 22.652 110.641 80.577 month-over-month % change -17.0% 0.1% 36.0% 0.3% 2.8% 4.9% -2.3% -4.6% -2.2% year-over-year % change -27.7% -43.3% -20.2% -20.5% -29.8% -30.8% -2.8% -8.4% -9.4% 9.3% -27.2%Airports 0.314 0.858 0.521 0.507 0.723 0.564 0.987 0.971 0.969 3.651 2.690 month-over-month % change -68.5% 172.7% -39.3% -4.6% 42.6% -22.0% -11.3% -1.7% -0.1% year-over-year % change -82.8% -18.9% -3.0% -39.0% -30.3% -50.5% 50.4% 32.6% 26.0% 239.0% -26.3%Roads/Highways 2.940 6.723 6.705 3.058 4.494 5.456 4.285 4.425 4.518 19.061 20.186 month-over-month % change -23.0% 128.7% -0.3% 3.4% 46.9% 21.4% -2.9% 3.3% 2.1% year-over-year % change -33.9% 33.6% 20.0% -24.2% 0.1% 8.6% -1.6% -1.1% -0.7% 22.5% 5.9%Bridges 1.833 1.646 2.099 1.778 1.786 1.859 1.789 1.657 1.651 8.194 7.458 month-over-month % change -2.5% -10.2% 27.5% 12.9% 0.5% 4.1% 2.9% -7.4% -0.4% year-over-year % change 48.7% -49.0% -3.7% 32.2% -10.9% -16.0% 40.9% 17.8% 11.9% 64.2% -9.0%Dams/Marine 0.333 0.312 0.613 0.377 0.324 0.419 0.442 0.445 0.443 1.365 1.586 month-over-month % change 1.5% -6.4% 96.7% -21.3% -13.9% 29.3% 3.6% 0.7% -0.4% year-over-year % change 122.2% 14.5% -3.7% 44.0% 33.6% 18.8% 41.8% 37.8% 29.2% 37.9% 16.2%Water/Sewage 1.795 2.115 3.372 2.153 2.287 2.428 2.353 2.341 2.396 13.552 10.234 month-over-month % change -39.2% 17.8% 59.4% 0.2% 6.2% 6.1% -2.5% -0.5% 2.4% year-over-year % change -28.6% -6.6% 24.6% -43.2% -36.7% -2.7% -20.0% -21.7% -17.8% 50.0% -24.5%Misc Civil (Power, etc.) 0.526 7.918 5.214 1.185 3.628 4.553 2.237 2.748 2.931 7.628 16.099 month-over-month % change -78.4% 1404.4% -34.2% -56.3% 206.1% 25.5% -5.4% 22.8% 6.7% year-over-year % change -74.3% 343.6% 72.8% -3.6% 136.1% 99.4% 91.3% 129.1% 119.8% 59.0% 111.1%TOTAL ENGINEERING (Civil) 7.742 19.572 18.525 9.058 13.243 15.280 12.093 12.587 12.909 53.451 58.254 month-over-month % change -37.6% 152.8% -5.4% -13.0% 46.2% 15.4% -3.0% 4.1% 2.6% year-over-year % change -36.7% 43.5% 26.3% -21.2% 2.4% 13.1% 13.0% 13.1% 13.4% 46.6% 9.0%GRAND TOTAL 44.894 59.289 68.142 47.255 53.071 57.442 62.259 61.043 60.590 268.013 227.356 month-over-month % change -18.4% 32.1% 14.9% -6.1% 12.3% 8.2% -2.0% -2.0% -0.7% year-over-year % change -25.4% -19.8% -7.4% -16.3% -18.1% -17.0% 5.5% 1.2% 0.1% 19.0% -15.2%NON-RES BLDG + ENGINEERING 25.390 37.233 42.541 27.395 32.097 35.055 36.376 35.747 35.561 164.092 138.831 month-over-month % change -24.6% 46.6% 14.3% -4.5% 17.2% 9.2% -2.5% -1.7% -0.5% year-over-year % change -30.7% -16.9% -5.0% -20.8% -19.3% -16.7% 1.9% -1.8% -2.3% 19.2% -15.4%
Data source: ConstructConnect.Table: ConstructConnect - CanaData.
Name of file: "U.S. Starts FINAL (Apr 18) - Extra.xlsx" in "U.S." folder
Latest month actuals Year to Date.
Value of U.S. Construction Starts - April 2018 - ConstructConnectBillions of current $s, not seasonally adjusted (NSA)
3-monthsMoving averages (placed in end month)
12-months
Note that at the start of 2016, year to date is the same as the single month of January.