Embed Size (px)
Citation preview
©2010 BMA Construction Engineers Inc., All rights reserved 1
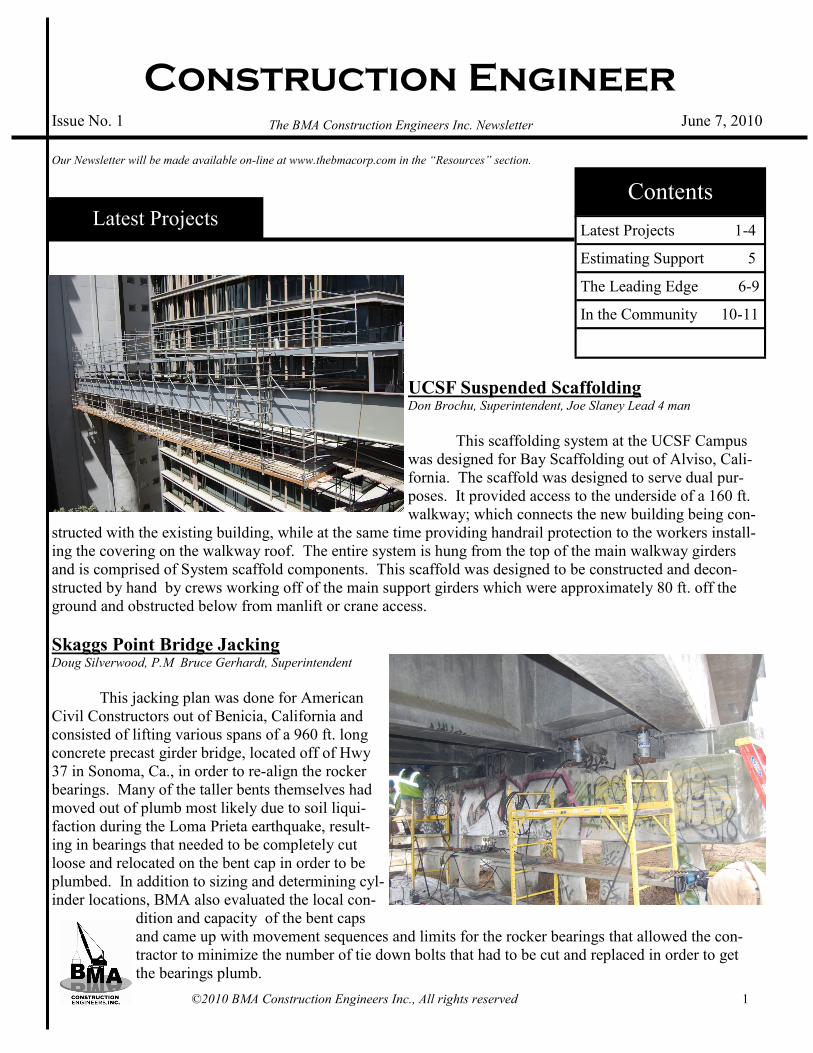
UCSF Suspended Scaffolding Don Brochu, Superintendent, Joe Slaney Lead 4 man
This scaffolding system at the UCSF Campus
was designed for Bay Scaffolding out of Alviso, Cali-
fornia. The scaffold was designed to serve dual pur-
poses. It provided access to the underside of a 160 ft.
walkway; which connects the new building being con-
structed with the existing building, while at the same time providing handrail protection to the workers install-
ing the covering on the walkway roof. The entire system is hung from the top of the main walkway girders
and is comprised of System scaffold components. This scaffold was designed to be constructed and decon-
structed by hand by crews working off of the main support girders which were approximately 80 ft. off the
ground and obstructed below from manlift or crane access.
Skaggs Point Bridge Jacking Doug Silverwood, P.M Bruce Gerhardt, Superintendent
This jacking plan was done for American
Civil Constructors out of Benicia, California and
consisted of lifting various spans of a 960 ft. long
concrete precast girder bridge, located off of Hwy
37 in Sonoma, Ca., in order to re-align the rocker
bearings. Many of the taller bents themselves had
moved out of plumb most likely due to soil liqui-
faction during the Loma Prieta earthquake, result-
ing in bearings that needed to be completely cut
loose and relocated on the bent cap in order to be
plumbed. In addition to sizing and determining cyl-
inder locations, BMA also evaluated the local con-
dition and capacity of the bent caps
and came up with movement sequences and limits for the rocker bearings that allowed the con-
tractor to minimize the number of tie down bolts that had to be cut and replaced in order to get
the bearings plumb.
Construction Engineer
Contents
Issue No. 1 June 7, 2010
Latest Projects 1-4
Estimating Support 5
The Leading Edge 6-9
In the Community 10-11
Latest Projects
The BMA Construction Engineers Inc. Newsletter
Our Newsletter will be made available on-line at www.thebmacorp.com in the “Resources” section.
©2010 BMA Construction Engineers Inc., All rights reserved 2
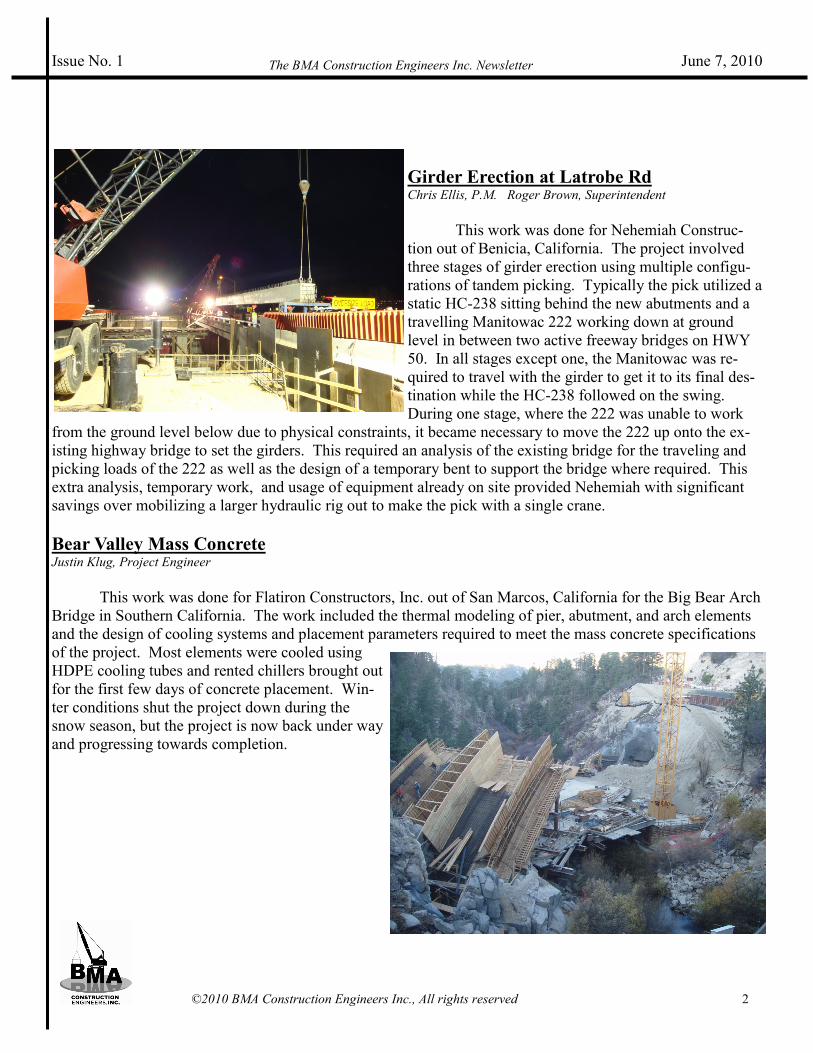
Girder Erection at Latrobe Rd Chris Ellis, P.M. Roger Brown, Superintendent
This work was done for Nehemiah Construc-
tion out of Benicia, California. The project involved
three stages of girder erection using multiple configu-
rations of tandem picking. Typically the pick utilized a
static HC-238 sitting behind the new abutments and a
travelling Manitowac 222 working down at ground
level in between two active freeway bridges on HWY
50. In all stages except one, the Manitowac was re-
quired to travel with the girder to get it to its final des-
tination while the HC-238 followed on the swing.
During one stage, where the 222 was unable to work
from the ground level below due to physical constraints, it became necessary to move the 222 up onto the ex-
isting highway bridge to set the girders. This required an analysis of the existing bridge for the traveling and
picking loads of the 222 as well as the design of a temporary bent to support the bridge where required. This
extra analysis, temporary work, and usage of equipment already on site provided Nehemiah with significant
savings over mobilizing a larger hydraulic rig out to make the pick with a single crane.
Bear Valley Mass Concrete Justin Klug, Project Engineer
This work was done for Flatiron Constructors, Inc. out of San Marcos, California for the Big Bear Arch
Bridge in Southern California. The work included the thermal modeling of pier, abutment, and arch elements
and the design of cooling systems and placement parameters required to meet the mass concrete specifications
of the project. Most elements were cooled using
HDPE cooling tubes and rented chillers brought out
for the first few days of concrete placement. Win-
ter conditions shut the project down during the
snow season, but the project is now back under way
and progressing towards completion.
Issue No. 1 June 7, 2010 The BMA Construction Engineers Inc. Newsletter
©2010 BMA Construction Engineers Inc., All rights reserved 3
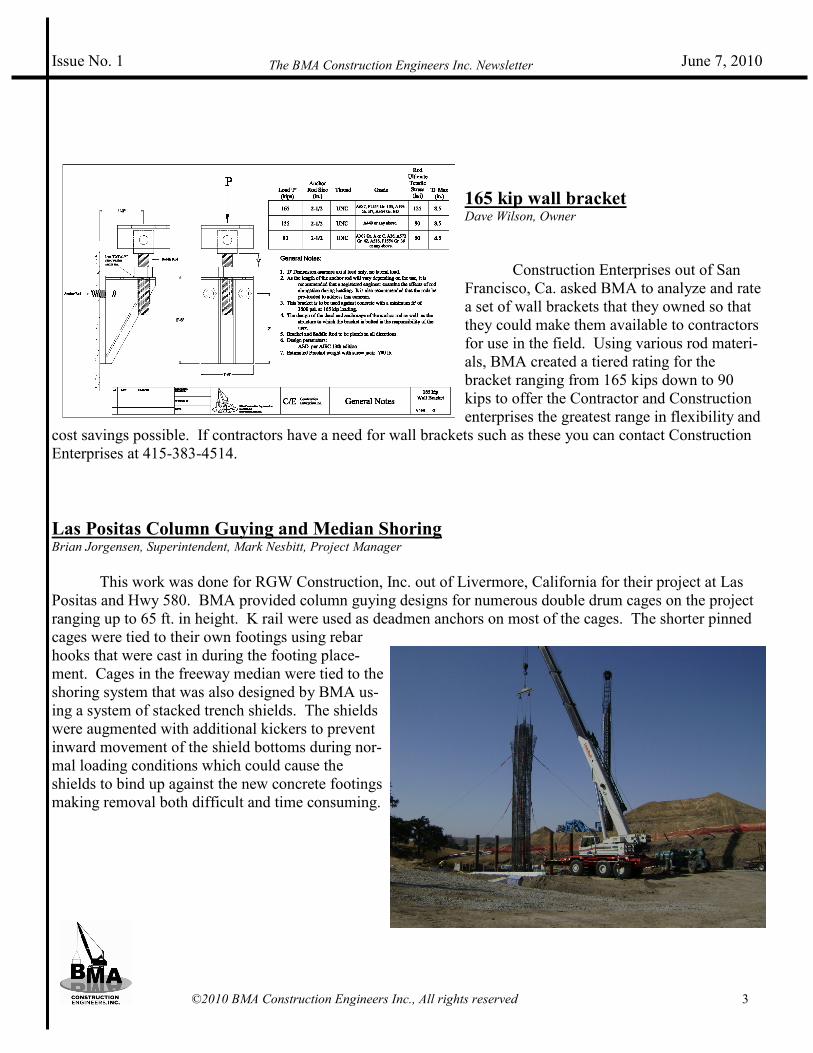
165 kip wall bracket Dave Wilson, Owner
Construction Enterprises out of San
Francisco, Ca. asked BMA to analyze and rate
a set of wall brackets that they owned so that
they could make them available to contractors
for use in the field. Using various rod materi-
als, BMA created a tiered rating for the
bracket ranging from 165 kips down to 90
kips to offer the Contractor and Construction
enterprises the greatest range in flexibility and
cost savings possible. If contractors have a need for wall brackets such as these you can contact Construction
Enterprises at 415-383-4514.
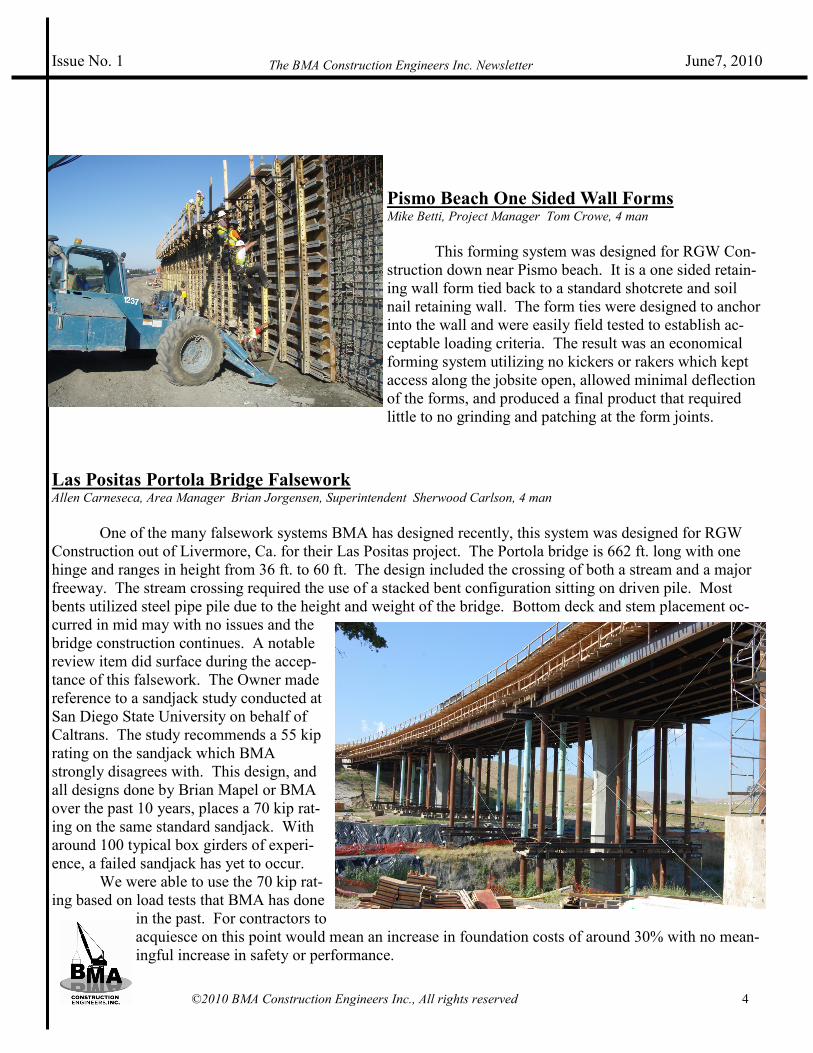
Las Positas Column Guying and Median Shoring Brian Jorgensen, Superintendent, Mark Nesbitt, Project Manager
This work was done for RGW Construction, Inc. out of Livermore, California for their project at Las
Positas and Hwy 580. BMA provided column guying designs for numerous double drum cages on the project
ranging up to 65 ft. in height. K rail were used as deadmen anchors on most of the cages. The shorter pinned
cages were tied to their own footings using rebar
hooks that were cast in during the footing place-
ment. Cages in the freeway median were tied to the
shoring system that was also designed by BMA us-
ing a system of stacked trench shields. The shields
were augmented with additional kickers to prevent
inward movement of the shield bottoms during nor-
mal loading conditions which could cause the
shields to bind up against the new concrete footings
making removal both difficult and time consuming.
Issue No. 1 June 7, 2010 The BMA Construction Engineers Inc. Newsletter
©2010 BMA Construction Engineers Inc., All rights reserved 4
Pismo Beach One Sided Wall Forms Mike Betti, Project Manager Tom Crowe, 4 man
This forming system was designed for RGW Con-
struction down near Pismo beach. It is a one sided retain-
ing wall form tied back to a standard shotcrete and soil
nail retaining wall. The form ties were designed to anchor
into the wall and were easily field tested to establish ac-
ceptable loading criteria. The result was an economical
forming system utilizing no kickers or rakers which kept
access along the jobsite open, allowed minimal deflection
of the forms, and produced a final product that required
little to no grinding and patching at the form joints.
Las Positas Portola Bridge Falsework Allen Carneseca, Area Manager Brian Jorgensen, Superintendent Sherwood Carlson, 4 man
One of the many falsework systems BMA has designed recently, this system was designed for RGW
Construction out of Livermore, Ca. for their Las Positas project. The Portola bridge is 662 ft. long with one
hinge and ranges in height from 36 ft. to 60 ft. The design included the crossing of both a stream and a major
freeway. The stream crossing required the use of a stacked bent configuration sitting on driven pile. Most
bents utilized steel pipe pile due to the height and weight of the bridge. Bottom deck and stem placement oc-
curred in mid may with no issues and the
bridge construction continues. A notable
review item did surface during the accep-
tance of this falsework. The Owner made
reference to a sandjack study conducted at
San Diego State University on behalf of
Caltrans. The study recommends a 55 kip
rating on the sandjack which BMA
strongly disagrees with. This design, and
all designs done by Brian Mapel or BMA
over the past 10 years, places a 70 kip rat-
ing on the same standard sandjack. With
around 100 typical box girders of experi-
ence, a failed sandjack has yet to occur.
We were able to use the 70 kip rat-
ing based on load tests that BMA has done
in the past. For contractors to
acquiesce on this point would mean an increase in foundation costs of around 30% with no mean-
ingful increase in safety or performance.
Issue No. 1 June7, 2010 The BMA Construction Engineers Inc. Newsletter
©2010 BMA Construction Engineers Inc., All rights reserved 5
A couple of the more interesting projects that BMA has provided preliminary designs for in the recent
past.
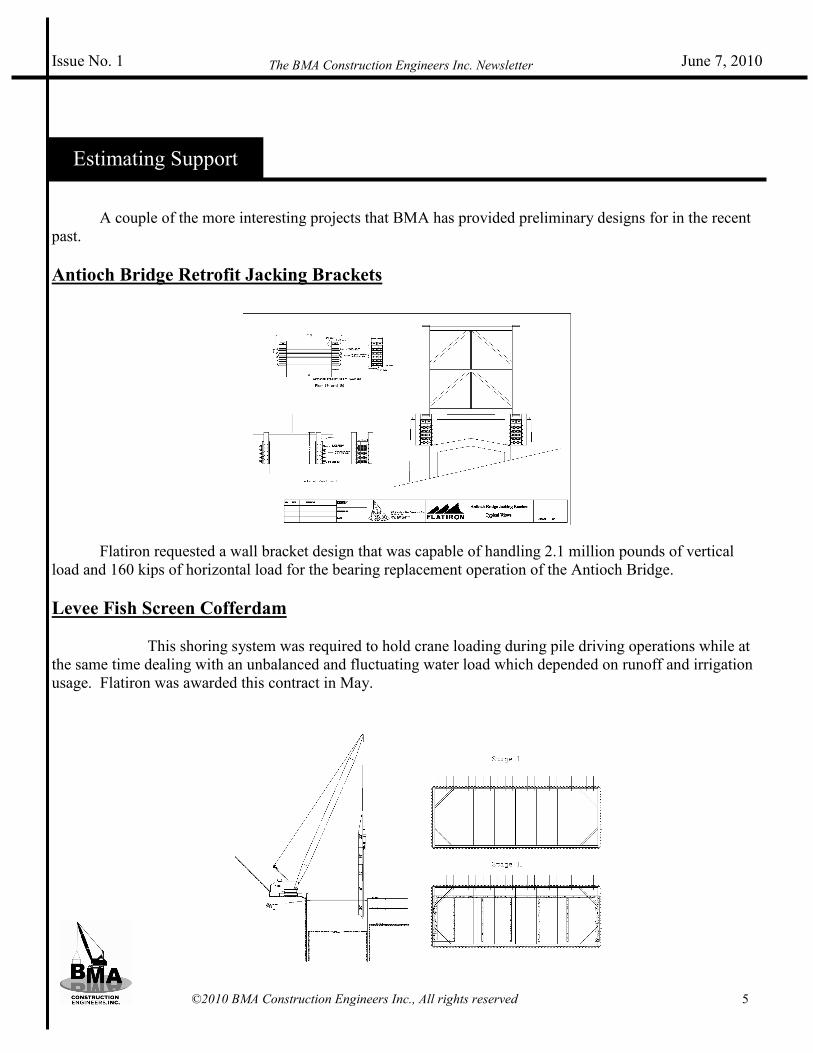
Antioch Bridge Retrofit Jacking Brackets
Flatiron requested a wall bracket design that was capable of handling 2.1 million pounds of vertical
load and 160 kips of horizontal load for the bearing replacement operation of the Antioch Bridge.
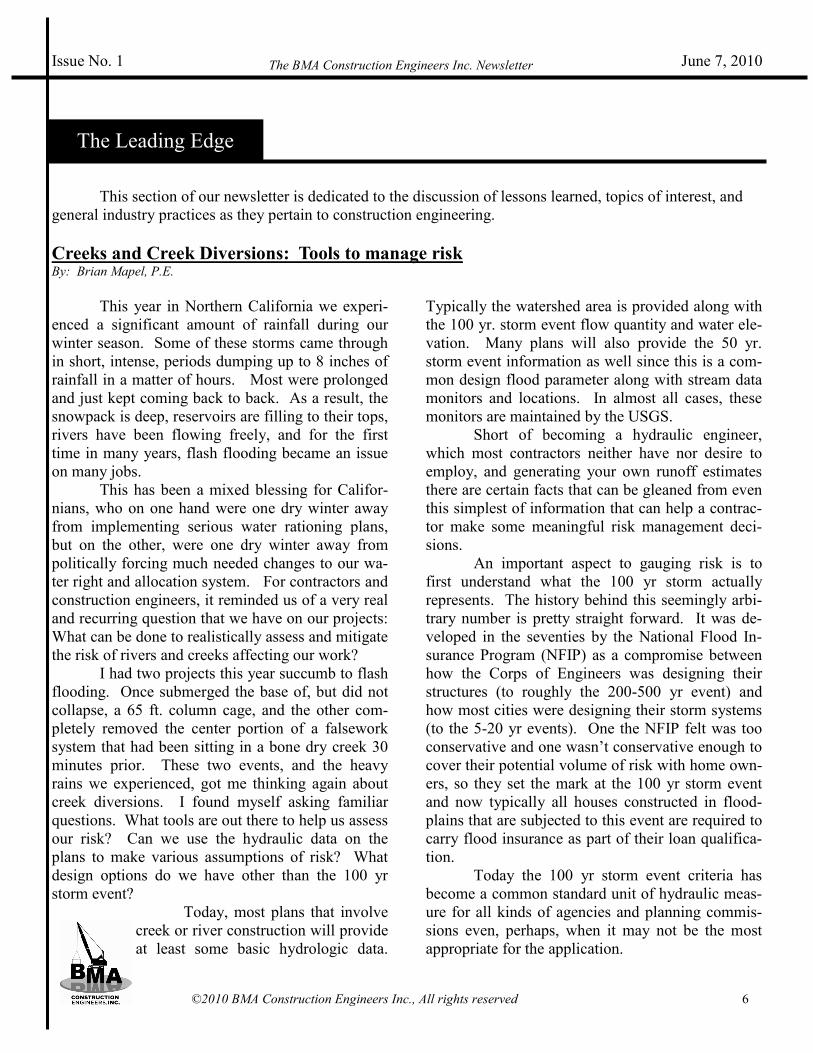
Levee Fish Screen Cofferdam
This shoring system was required to hold crane loading during pile driving operations while at
the same time dealing with an unbalanced and fluctuating water load which depended on runoff and irrigation
usage. Flatiron was awarded this contract in May.
Issue No. 1 June 7, 2010 The BMA Construction Engineers Inc. Newsletter
Estimating Support
©2010 BMA Construction Engineers Inc., All rights reserved 6
This section of our newsletter is dedicated to the discussion of lessons learned, topics of interest, and
general industry practices as they pertain to construction engineering.
Creeks and Creek Diversions: Tools to manage risk By: Brian Mapel, P.E.
This year in Northern California we experi-
enced a significant amount of rainfall during our
winter season. Some of these storms came through
in short, intense, periods dumping up to 8 inches of
rainfall in a matter of hours. Most were prolonged
and just kept coming back to back. As a result, the
snowpack is deep, reservoirs are filling to their tops,
rivers have been flowing freely, and for the first
time in many years, flash flooding became an issue
on many jobs.
This has been a mixed blessing for Califor-
nians, who on one hand were one dry winter away
from implementing serious water rationing plans,
but on the other, were one dry winter away from
politically forcing much needed changes to our wa-
ter right and allocation system. For contractors and
construction engineers, it reminded us of a very real
and recurring question that we have on our projects:
What can be done to realistically assess and mitigate
the risk of rivers and creeks affecting our work?
I had two projects this year succumb to flash
flooding. Once submerged the base of, but did not
collapse, a 65 ft. column cage, and the other com-
pletely removed the center portion of a falsework
system that had been sitting in a bone dry creek 30
minutes prior. These two events, and the heavy
rains we experienced, got me thinking again about
creek diversions. I found myself asking familiar
questions. What tools are out there to help us assess
our risk? Can we use the hydraulic data on the
plans to make various assumptions of risk? What
design options do we have other than the 100 yr
storm event?
Today, most plans that involve
creek or river construction will provide
at least some basic hydrologic data.
Typically the watershed area is provided along with
the 100 yr. storm event flow quantity and water ele-
vation. Many plans will also provide the 50 yr.
storm event information as well since this is a com-
mon design flood parameter along with stream data
monitors and locations. In almost all cases, these
monitors are maintained by the USGS.
Short of becoming a hydraulic engineer,
which most contractors neither have nor desire to
employ, and generating your own runoff estimates
there are certain facts that can be gleaned from even
this simplest of information that can help a contrac-
tor make some meaningful risk management deci-
sions.
An important aspect to gauging risk is to
first understand what the 100 yr storm actually
represents. The history behind this seemingly arbi-
trary number is pretty straight forward. It was de-
veloped in the seventies by the National Flood In-
surance Program (NFIP) as a compromise between
how the Corps of Engineers was designing their
structures (to roughly the 200-500 yr event) and
how most cities were designing their storm systems
(to the 5-20 yr events). One the NFIP felt was too
conservative and one wasn’t conservative enough to
cover their potential volume of risk with home own-
ers, so they set the mark at the 100 yr storm event
and now typically all houses constructed in flood-
plains that are subjected to this event are required to
carry flood insurance as part of their loan qualifica-
tion.
Today the 100 yr storm event criteria has
become a common standard unit of hydraulic meas-
ure for all kinds of agencies and planning commis-
sions even, perhaps, when it may not be the most
appropriate for the application.
Issue No. 1 June 7, 2010 The BMA Construction Engineers Inc. Newsletter
The Leading Edge
©2010 BMA Construction Engineers Inc., All rights reserved 7
In terms of probability, the 100 yr storm is a
storm that has a 1% chance of occurring in any
given year. Likewise, the 50 yr storm has a 2%
chance, the 25 year storm has a 4% chance, the 3 yr
storm has a 33% chance, etc. etc. etc.
When you look at it from that perspective,
maybe designing your creek diversion for the 100 yr
event is not the best allocation of resources vs. risk
for your operation.
Question: Should I build a Creek Diversion, and if
so, how should I size it?
The answer to this question depends on a
few things. What are you going to use the diversion
for? How much would its failure or overtopping
impact your project? How much risk do you want
to assume? How comfortable are you that you can
build to your projected schedule?
You can quantify that risk to a fair degree if
you can obtain historical stream data from the
USGS. This data is free and easy to obtain from
their website; it is just a matter of having a stream
gauge somewhere near your work site. You want
the gauge on the same creek or river that you are
crossing and you typically want at least 8-10 years
of data. The more data in the database, the more
accurate the predictions will be. You can either in-
put the gauge number into the database or go di-
rectly to a map of your State which has a link to
each gauge in the system.
If such data exists, the USGS has created a
free software package called PEAKFQ (PKFQwin).
It’s downloadable from their website and is win-
dows compatible. While the program is relatively
easy to use (read the manual first) the actual statis-
tics and mechanics behind the program are fairly in
depth, so unless you really want to spend time try-
ing to understand hydraulic engineering, statistics,
and all the factors that go into runoff generation,
you will probably not be able to recreate the pro-
grams result data by hand very easily.
What you will get is a statistically weighted
estimate of the maximum annual flow
volume for any given storm event for
that particular water shed, at that par-
ticular station, for a given confidence interval that
you specify (I recommend 90% or 95%). This can
be useful information for a contractor who is trying
to produce a competitive estimate and is willing to
assume a certain level of risk.
Say you needed to provide year round ac-
cess across your creek for earthmoving equipment.
The access getting washed out or flooded would not
cause a catastrophic failure of any kind, but it would
cost you significant money in lost production while
you waited to re-establish access. I would argue
that designing for the 100 yr event, which is the
only data given to you on the plans, would be ex-
tremely conservative. If you have PEAKFQ data,
pick an event that would be more appropriate for a
construction timeframe. If you willing to take a
10% risk, then pick the 10 yr event, if you’re willing
to take a 20% risk, pick the 5 year event. Both are
significantly smaller than the 100 year event and
will result in a more reasonable and cost effective
diversion.
If that same diversion has to support false-
work, perhaps you risk threshold is much smaller.
Typical manufacturing operations run at a 95% con-
fidence interval, meaning that 2.5% of defects are
outside the confidence range on the high side and
2.5% of the defects are outside the confidence range
on the low side. In storm terms that would be
equivalent to a 40 year event. So maybe the 50 yr
event which is commonly shown on the plans is
more appropriate.
This is where monthly stream data can come
in handy. PEAKFQ can estimate your peak storm
event volumes for the year for any given storm
event, while the monthly stream flow data, if avail-
able, can help you determine what months the peak
flow usually occurs. You can then go back to miti-
gating both your risk and need for larger creek di-
version by constructing your bridge in months that
typically produce a certain percentage of the peak
flow.
Again, when working with data like this,
don’t just take the average data for each month and
use that. Create a confidence interval (90%-95%)
and use your high and low values. By not doing
this, and ignoring the standard deviation of the data
Issue No. 1 June 7, 2010 The BMA Construction Engineers Inc. Newsletter
©2010 BMA Construction Engineers Inc., All rights reserved 8
set, you are setting yourself up for under designing
your diversion.
Many contractors choose not to take risks
with structures like falsework, and will typically
build bents on pile to get over the 100 yr storm ele-
vation, and that is certainly a prudent practice if the
soffit is high enough above the water line to allow
the falsework to be built.
I would argue that any falsework or tempo-
rary structure whose collapse can affect the travel-
ing public would almost certainly have to be de-
signed to accommodate the 100 yr. storm if it was
expected to stand over the wet season. I just can’t
see a court agreeing that the contractor had a right to
take a 5% or 10% chance with the lives of the trav-
eling public so they could save money by designing
to a theoretical 20 or 10 yr event. I think they will
treat it more akin to pharmaceuticals, where the ac-
ceptable industry standard is a margin of error of
1% or less in production quality. This is complete
opinion, mind you, and maybe the 50 yr event is
appropriate. Just keep in mind the real costs of an
accident involving the public and I think it becomes
clear that you just flat out don’t want to deal with
that.
But if the travelling public is not involved,
and just the contractor’s assets are at risk, perhaps a
5% chance is not unreasonable. After all, these
peak events are typically prolonged storms, and the
contractor would have ample time to clear the area
of personnel or attempt protective measures if the
event was larger than the designed diversion could
accommodate. All that would be lost, assuming that
protective measure could not be taken, would be
money, time, and material. All are acceptable losses
for an assumed risk of this nature. It all comes
down to how much risk a contractor wants to take
on.
So what happens if there is no gauge data?
If we can’t use PEAKFQ to help us mitigate our
risk, can we draw correlations between the 100 yr
event, the 50 yr, event, the 20 yr event, etc. from
just the 100 yr event data on the plans?
I was skeptical of the possibilities, but
hopeful that it would prove out, so I
conducted some basic trials trying to
find out if it was possible to say, with any confi-
dence, that the smaller events were various percent-
ages of the 100 yr event. What I found was that the
standard deviations for making these kinds of gener-
alization were quite large, and they varied widely
depending on the location of the watershed.
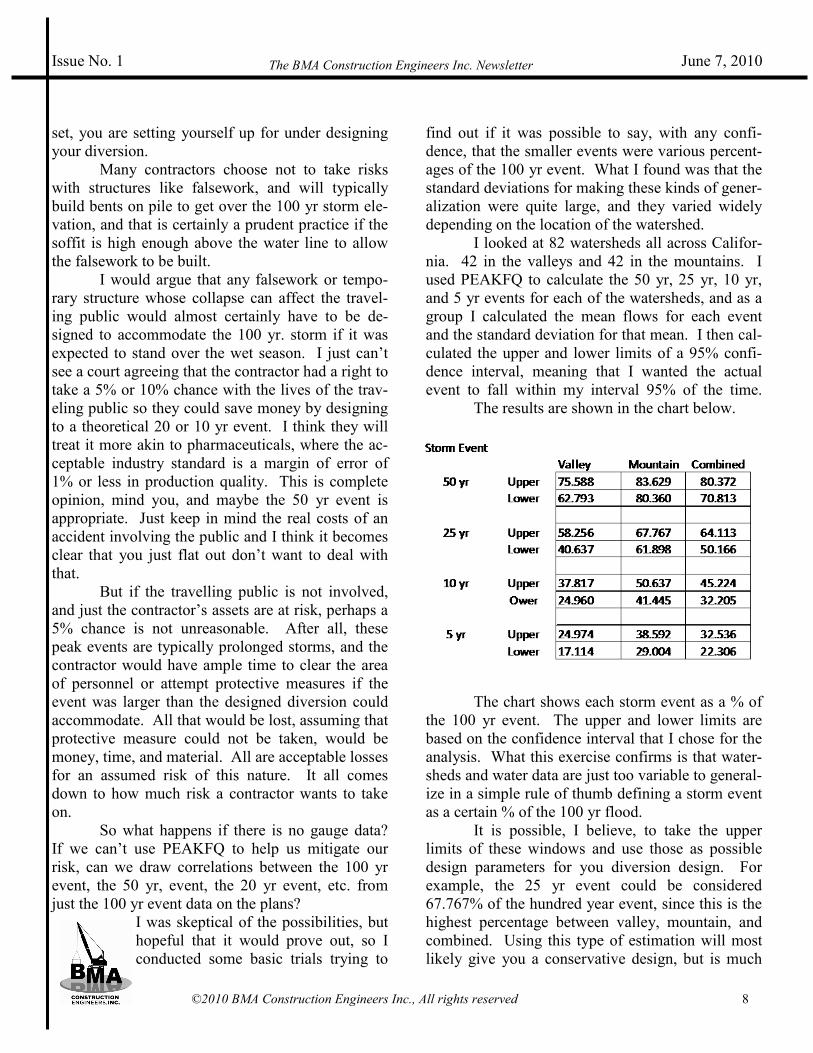
I looked at 82 watersheds all across Califor-
nia. 42 in the valleys and 42 in the mountains. I
used PEAKFQ to calculate the 50 yr, 25 yr, 10 yr,
and 5 yr events for each of the watersheds, and as a
group I calculated the mean flows for each event
and the standard deviation for that mean. I then cal-
culated the upper and lower limits of a 95% confi-
dence interval, meaning that I wanted the actual
event to fall within my interval 95% of the time.
The results are shown in the chart below.
The chart shows each storm event as a % of
the 100 yr event. The upper and lower limits are
based on the confidence interval that I chose for the
analysis. What this exercise confirms is that water-
sheds and water data are just too variable to general-
ize in a simple rule of thumb defining a storm event
as a certain % of the 100 yr flood.
It is possible, I believe, to take the upper
limits of these windows and use those as possible
design parameters for you diversion design. For
example, the 25 yr event could be considered
67.767% of the hundred year event, since this is the
highest percentage between valley, mountain, and
combined. Using this type of estimation will most
likely give you a conservative design, but is much
Issue No. 1 June 7, 2010 The BMA Construction Engineers Inc. Newsletter
©2010 BMA Construction Engineers Inc., All rights reserved 9
more meaningful than just guessing. To follow with
the others, the 50 yr event could be taken as 84% of
the 100 yr event, the 10 yr event could be taken as
51% of the 100 yr event, and the 5 yr event could be
taken as 39% of the 100 yr event.
I think that these numbers are indeed conser-
vative, but in the absence of real stream flow his-
torical data, being conservative may be a prudent
practice.
Keep in mind that I ran these numbers in
California. Analysis of other State’s stream flows
may produce different data, but it would be rela-
tively easy to reproduce this study for any state.
Another good source of hydraulic informa-
tion, should your particular stream lack gauge data,
are nearby streams and rivers. Check to see if they
have gauge data, and then check to see when the
flows start to pick up. The actual flow numbers
themselves will not help you estimate quantities in
your own river or creek, but they can give you an
indication of when the rainy months begin and when
the runoff volumes in spring start to drop off.
Rough data for sure, but when trying to make sched-
uling decisions or determined the effect of delays, it
is better than guessing.
In my opinion, it would be very helpful if
owners would provide some additional information
on the plans. It would be beneficial to have at least
one more, perhaps two more storm events on the
plans. Since they have gone through the trouble of
conducting a hydraulic analysis for the 100 yr and
typically 50 yr event, it would be very beneficial to
them to include the 25 yr event and the 5 yr event.
With this information, contractors would be better
equipped to provide aggressive pricing based on the
amount of risk that they are willing to assume.
Last but not least, and this is going to sound
obvious, if you need to have good hydraulic advice,
hire a hydraulic engineer to give it to you. While I
certainly acknowledge that most contractors do not
do this, especially at bid time, if you need accurate
information and the risk is high, there are engineers
out there than can help you narrow it down and pro-
vide you with accurate assessments of
the flows that you are likely to encoun-
ter for any give watershed. Depending
on the size of your diversion, the few thousand dol-
lars you will pay for the service may be far out-
weighed by the cost of building your diversion
twice as big as it needs to be or too small for the
volume you are most likely to handle.
As you can see there is nothing exact about
this issue. I wrote this article simply to highlight
some of the resources that are out there to help you,
to clarify the actual risk associated with common
storm events, and to provide ideas about how to
minimize costs by assuming a reasonable amount of
risk. The estimates from PEAKFQ are just that, es-
timates, so think of these tools as an “educated
guess” rather than an exact structural analysis.
If you have questions or comments about the infor-
mation in this article, please send them to front-
[email protected]. Comments may be posted
in future newsletters.
If you have a topic of interest that you would
like to discuss or write an article on for inclusion in
the newsletter, please contact us at :
Issue No. 1 June 7, 2010 The BMA Construction Engineers Inc. Newsletter
©2010 BMA Construction Engineers Inc., All rights reserved 10
This section focuses on volunteer efforts, construction outreach programs, and other activities that
benefit communities here and around the world.
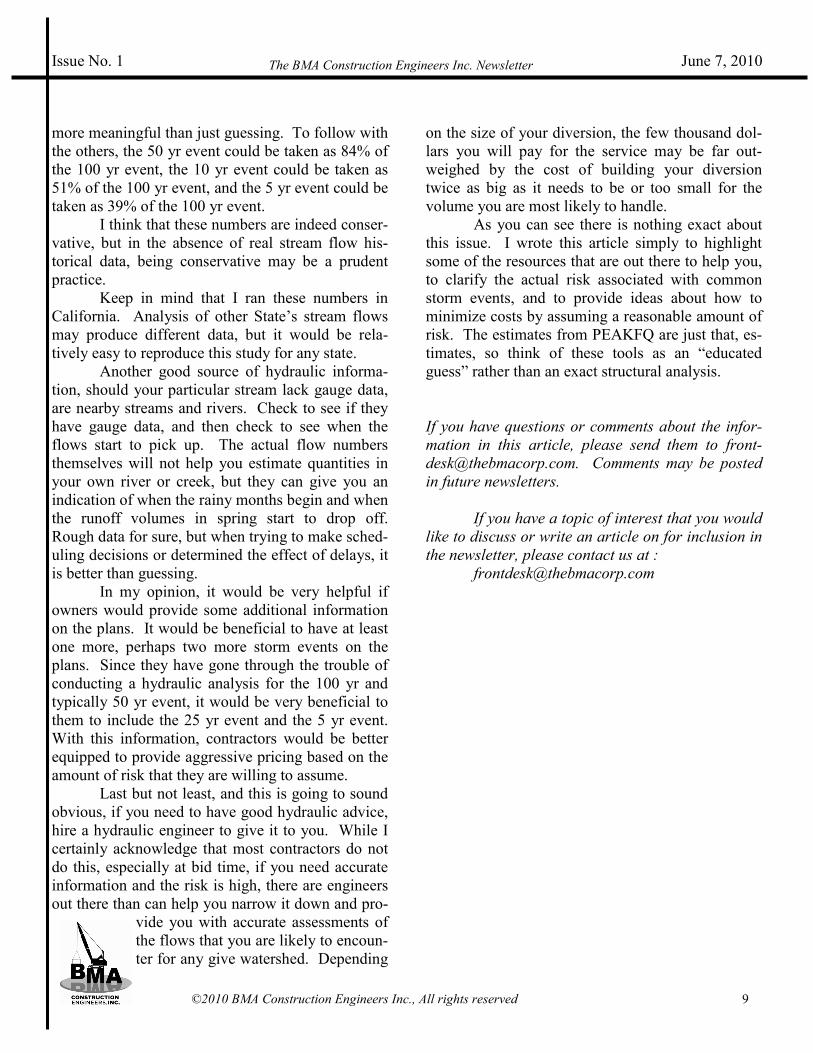
The ACE program wraps up for 2010 By: Brian Mapel, P.E.
If you are looking for a way to get kids involved
with construction, engineering, or architecture, ACE is
the program for you. I did my first tour with ACE this
spring, and found it to be an excellent and worthwhile
use of my time.
The program is national and focuses on getting
high school kids interested in our fields of work
(Architecture Construction Engineering). You spend
one evening a week with the kids, 2 hours at a time.
For the first 13 weeks of the program the men-
tors and guest speakers will give presentations on their
industries and then provide a small project that can be com-
pleted by the class within the 2 hour timeframe.
The last 3 weeks are then spent on the final project. The group, depending on its size, is split up into
different disciplines, and each discipline then creates a model and a presentation for their work. In our group,
we split up into Architectural, Structural, Environmental, Civil, and Transportation. Ironically I ended up be-
ing a mentor in the Architecture group which on one hand was like mixing oil and water, but on the other,
clearly destined them for greatness.
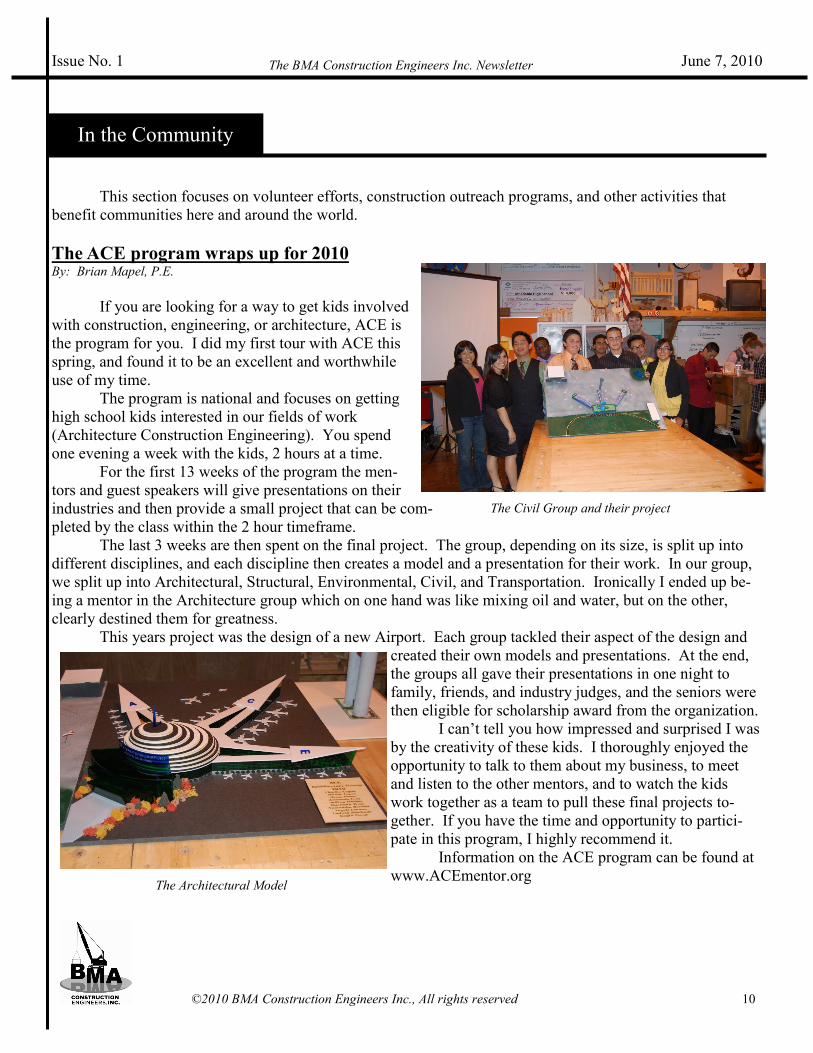
This years project was the design of a new Airport. Each group tackled their aspect of the design and
created their own models and presentations. At the end,
the groups all gave their presentations in one night to
family, friends, and industry judges, and the seniors were
then eligible for scholarship award from the organization.
I can’t tell you how impressed and surprised I was
by the creativity of these kids. I thoroughly enjoyed the
opportunity to talk to them about my business, to meet
and listen to the other mentors, and to watch the kids
work together as a team to pull these final projects to-
gether. If you have the time and opportunity to partici-
pate in this program, I highly recommend it.
Information on the ACE program can be found at
www.ACEmentor.org
Issue No. 1 June 7, 2010 The BMA Construction Engineers Inc. Newsletter
In the Community
The Civil Group and their project
The Architectural Model
©2010 BMA Construction Engineers Inc., All rights reserved 11
Bridges to Prosperity Teams up with Flatiron to Build a Bridge in the Remote Jungles of
Guatemala By: Kent Grisemer, P.E. Design Engineer, Flatiron Constructors Inc.
In one of the most remote and underdeveloped regions of northern
Guatemala lies the small, lush Rio Satan Valley. This beautiful serene val-
ley houses the small villages of La Tana and Tesoro Chuiquito and their
1,600 inhabitants. Cutting through the center of this valley, and between
the two villages, is the River Rio Satan. The river is an integral part of the
local population’s lives, as many must cross it daily to go to school, the
clinic, or to market. Flanked by jungle, cow pastures, and corn fields, this
river is passable in the dry months, being only knee deep, but floods to
chest deep and higher during the rainy months. Locals tell of an incident as
recently as last year when a young mother was washed away with her baby
boy, the boy drowning in the river’s depths before she was pulled ashore.
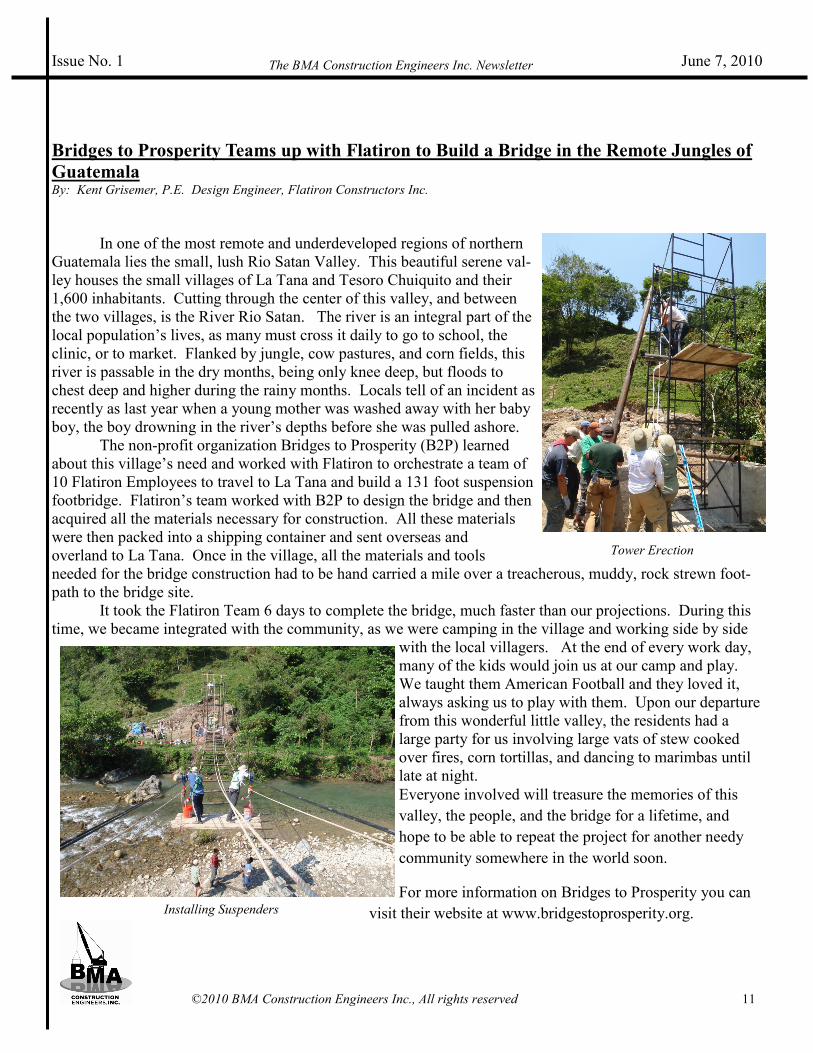
The non-profit organization Bridges to Prosperity (B2P) learned
about this village’s need and worked with Flatiron to orchestrate a team of
10 Flatiron Employees to travel to La Tana and build a 131 foot suspension
footbridge. Flatiron’s team worked with B2P to design the bridge and then
acquired all the materials necessary for construction. All these materials
were then packed into a shipping container and sent overseas and
overland to La Tana. Once in the village, all the materials and tools
needed for the bridge construction had to be hand carried a mile over a treacherous, muddy, rock strewn foot-
path to the bridge site.
It took the Flatiron Team 6 days to complete the bridge, much faster than our projections. During this
time, we became integrated with the community, as we were camping in the village and working side by side
with the local villagers. At the end of every work day,
many of the kids would join us at our camp and play.
We taught them American Football and they loved it,
always asking us to play with them. Upon our departure
from this wonderful little valley, the residents had a
large party for us involving large vats of stew cooked
over fires, corn tortillas, and dancing to marimbas until
late at night.
Everyone involved will treasure the memories of this
valley, the people, and the bridge for a lifetime, and
hope to be able to repeat the project for another needy
community somewhere in the world soon.
For more information on Bridges to Prosperity you can
visit their website at www.bridgestoprosperity.org.
Issue No. 1 June 7, 2010 The BMA Construction Engineers Inc. Newsletter
Tower Erection
Installing Suspenders