Embed Size (px)
Citation preview
Constructing Images Eyes-free: A Grid-based Dynamic Drawing
Tool for the Blind
Hesham M. KamelJames A. Landay
Group for User Interface ResearchEECS Department
University of California, Berkeley
2
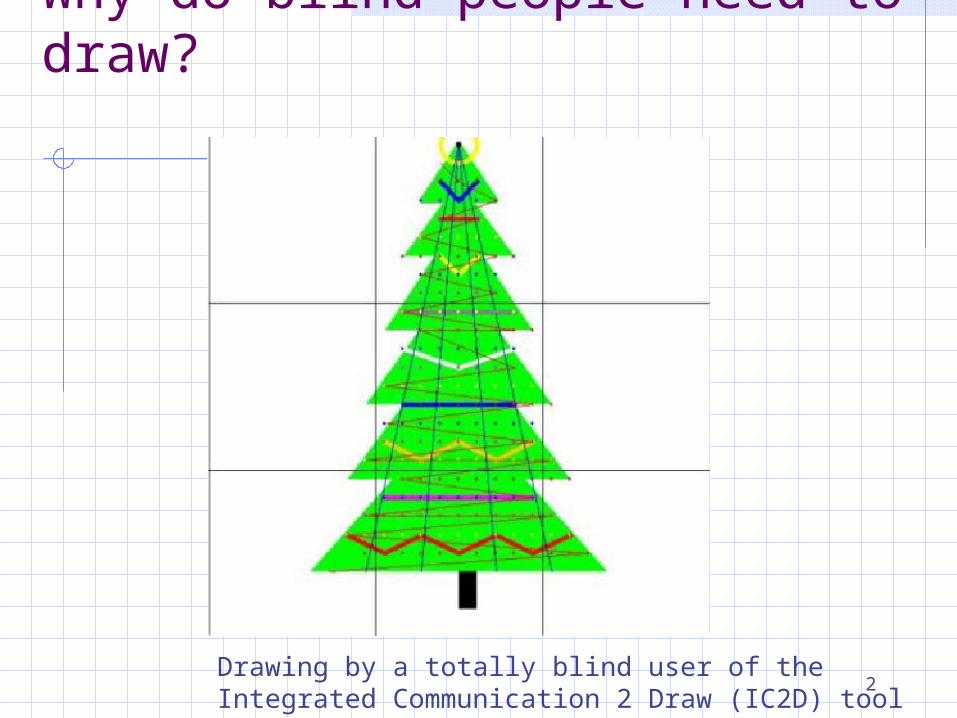
Why do blind people need to draw?
Drawing by a totally blind user of the Integrated Communication 2 Draw (IC2D) tool

3
Presentation Overview
MotivationOther Graphical Systems for the BlindThe Integrated Communication 2 Draw (IC2D)IC2D Usability StudyResults and DiscussionLive DemoConclusions
4
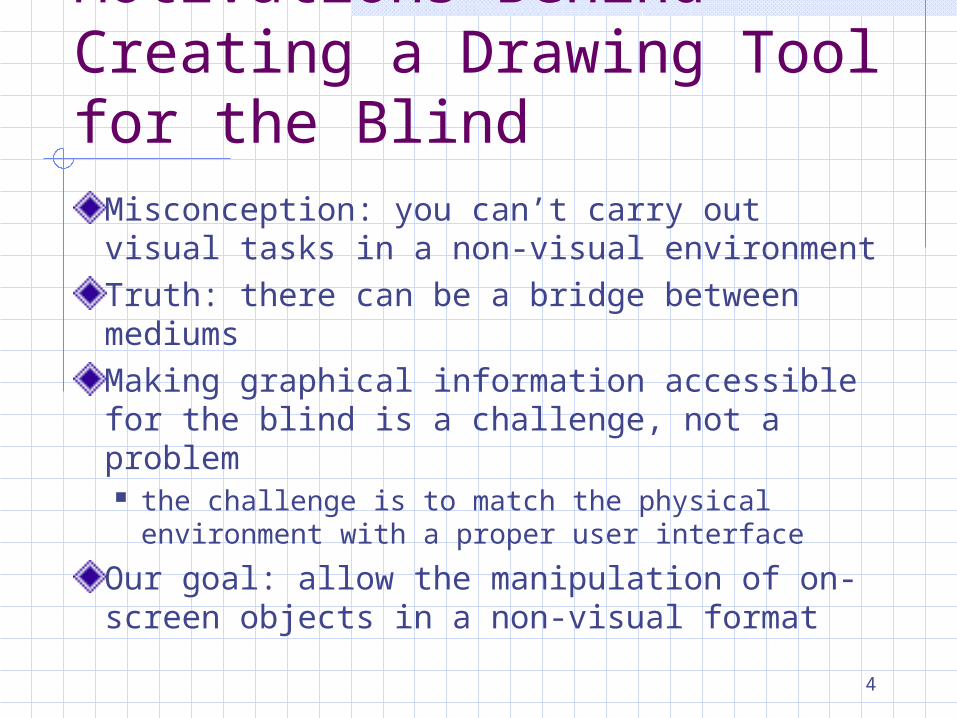
Motivations Behind Creating a Drawing Tool for the Blind
Misconception: you can’t carry out visual tasks in a non-visual environmentTruth: there can be a bridge between mediumsMaking graphical information accessible for the blind is a challenge, not a problem the challenge is to match the physical
environment with a proper user interface
Our goal: allow the manipulation of on-screen objects in a non-visual format

5
Related Work: Creation & Access
Creating graphics TDraw (Kurze ‘96)
Communicating graphics Mercator (Mynatt ‘95)
6
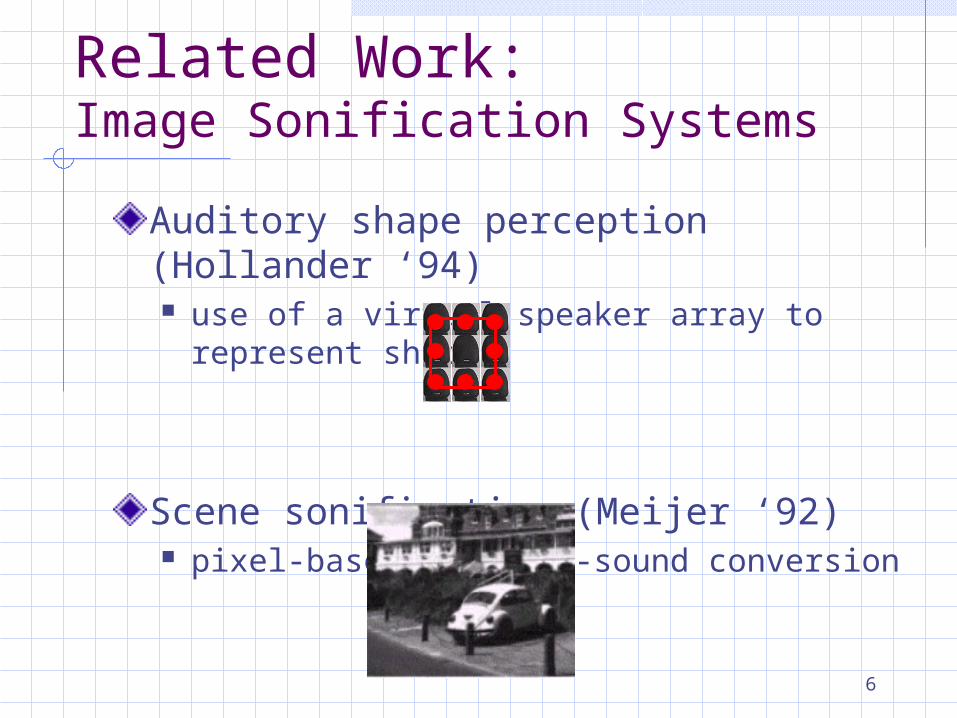
Related Work:Image Sonification Systems
Auditory shape perception (Hollander ‘94) use of a virtual speaker array to represent
shapes
Scene sonification (Meijer ‘92) pixel-based image-to-sound conversion
7
Major Problems with Drawing UIs
Graphical user interfaces total reliance on visual feedback imagine drawing with the monitor off
where is the cursor? what’s on the screen? how do I get back to where I was?
let’s do a little experiment…
Haptic user interfaces hard to carry expensive
8
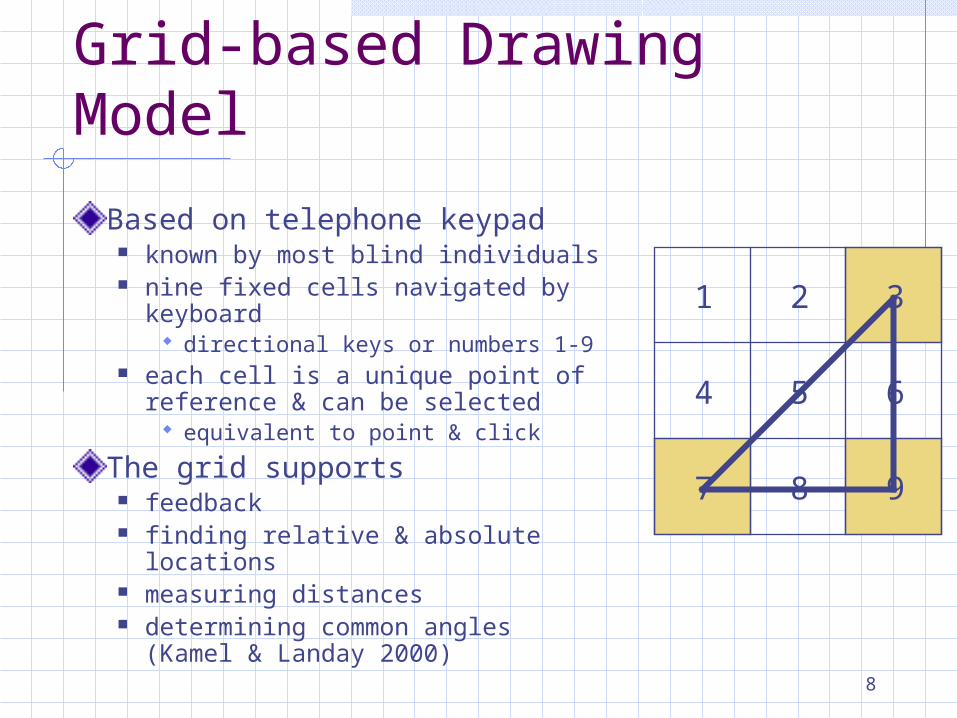
Grid-based Drawing Model
Based on telephone keypad known by most blind individuals nine fixed cells navigated by
keyboard directional keys or numbers 1-9
each cell is a unique point of reference & can be selected
equivalent to point & click
The grid supports feedback finding relative & absolute locations measuring distances determining common angles
(Kamel & Landay 2000)
1 2 3
4 5 6
7 8 9
9
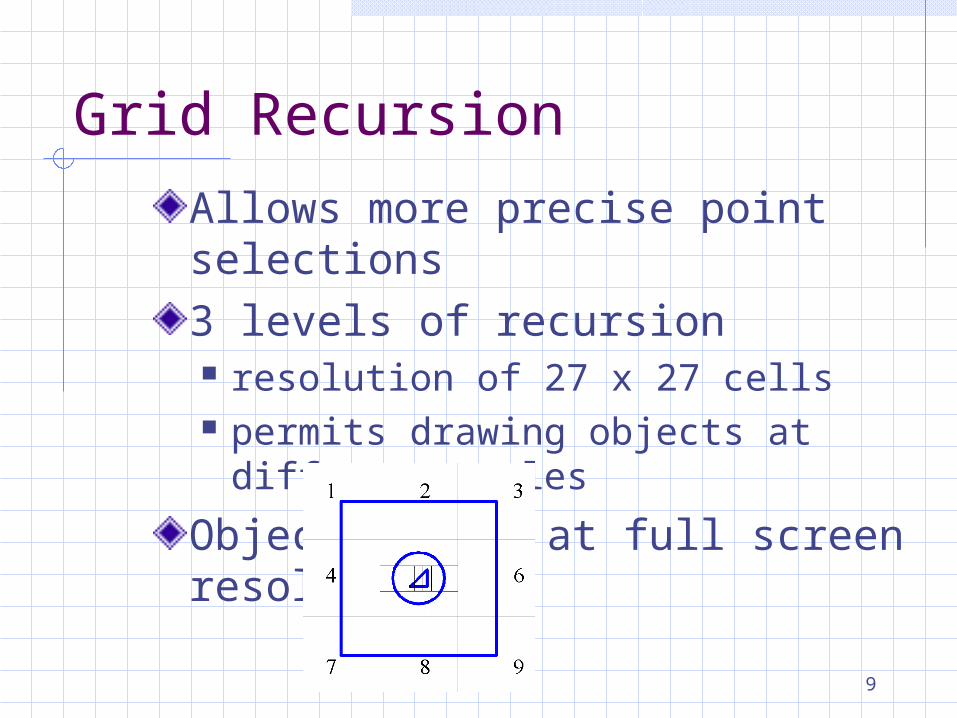
Grid Recursion
Allows more precise point selections3 levels of recursion resolution of 27 x 27 cells permits drawing objects at different
scales
Objects drawn at full screen resolution
10
IC2D Provides a Medium for Accommodation & Collaboration
Blind accustomed to screen readers IC2D outputs voice & non-speech sounds
Users can create & share drawings reflecting self-expressionFacilitates sighted users communicating graphically w/ blind users & vice versa (Kamel & Landay 2001)
Allows users to enhance semanticsof drawings
11
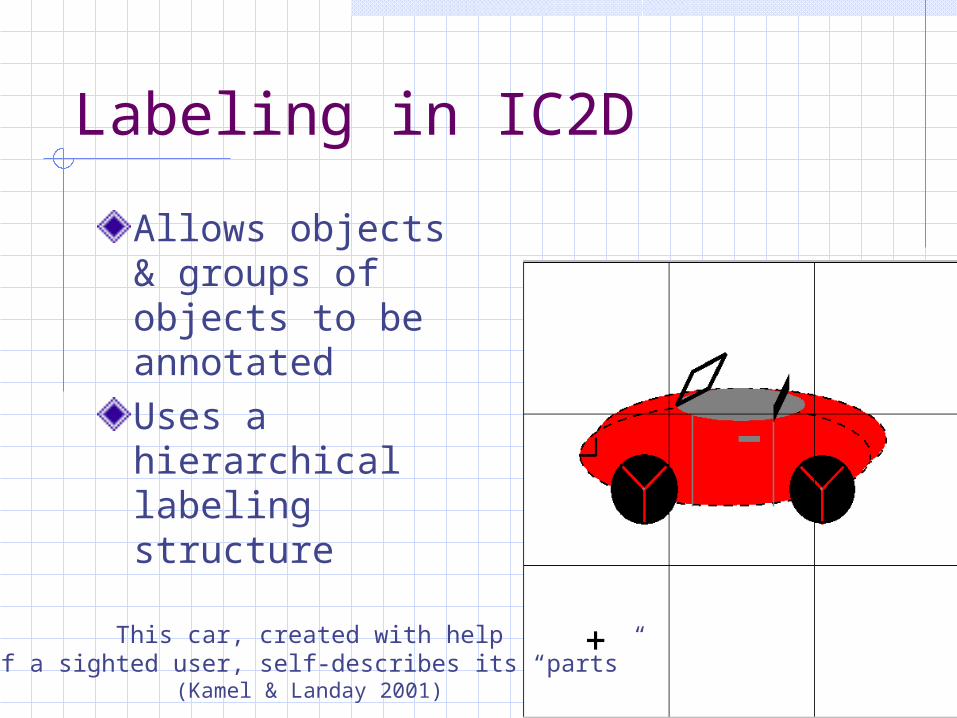
Labeling in IC2D
Allows objects & groups of objects to be annotatedUses a hierarchical labeling structure
This car, created with helpof a sighted user, self-describes its “parts”
(Kamel & Landay 2001)

12
Draw a wheel consists of a circle & two lines
Example of Labeling (Part 1)
Circle LineLine
13
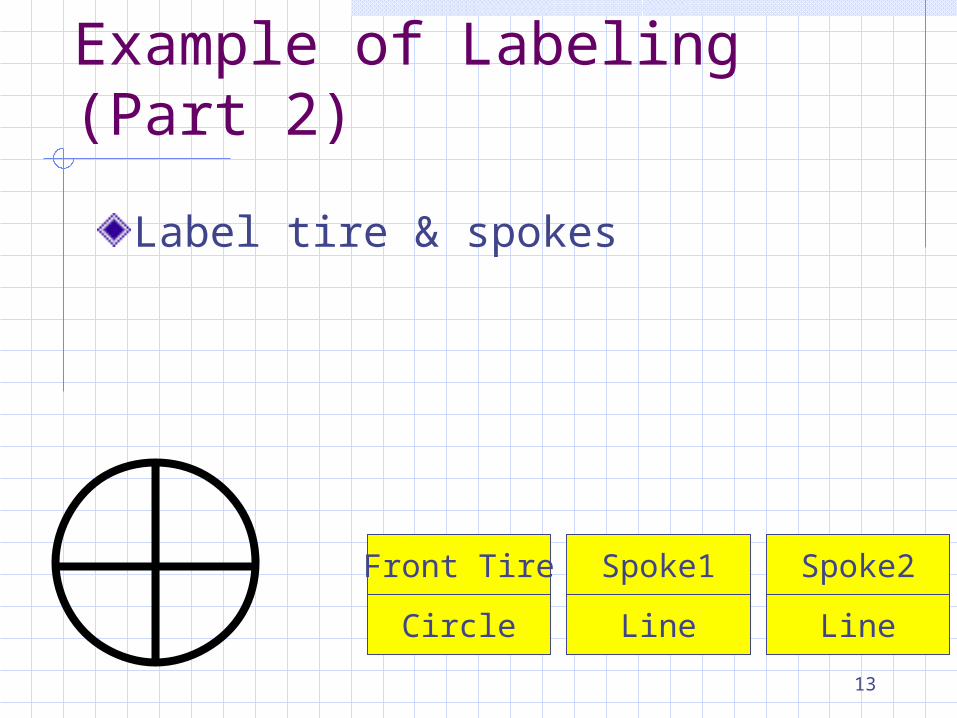
Circle
Label tire & spokes
Example of Labeling (Part 2)
Line Line
Spoke1
Line
Spoke2
Line
Front Tire
Circle

14
Circle
Group individual spokes togetherLabel that group
Example of Labeling (Part 3)
Line Line
Spoke1
Line
Spoke2
Line
Front Tire
Circle
Front Spokes
Group

15
Circle
Group front tire & front spokes togetherLabel that group
Example of Labeling (Part 4)
Line Line
Spoke1
Line
Spoke2
Line
Front Tire
Circle
Front Spokes
Group
Front Wheel
Group
16
Evaluation GoalsTest if users could carry out instructed drawing with precisionTest users’ recognition of interrelational representations of objects recognize objects in relation to grid positions &
to each other
Test labeling as method for understanding drawing via semantic enhancementTest if users could draw representations of real-world objects

17
MethodologyUsed keyboard input & voice synthesizer output16 participants:
8 sighted 8 visually impaired (5 partially sighted, 3 congenitally blind) 19-49 years old sighted & partially sighted participants wore blindfolds
Equal amount of familiarization timeUsed a verbal protocol & recorded along with outputResults evaluated on
task completion time participants’ self-assessed confidence level quality of the drawing, as rated by sighted third-party judge

18
Task 1 - Part ADraw 3 circles, describe spatial arrangementTests interralational drawing 38-year-old congenitally blind participant: “I can
understand the grid concept abstractly, but not in a visual sense, because I have never been able to see.”
21-year-old sighted participant: “I can almost visualize everything on the screen without having to look at it.”
Three circles drawn & described by this participant
19
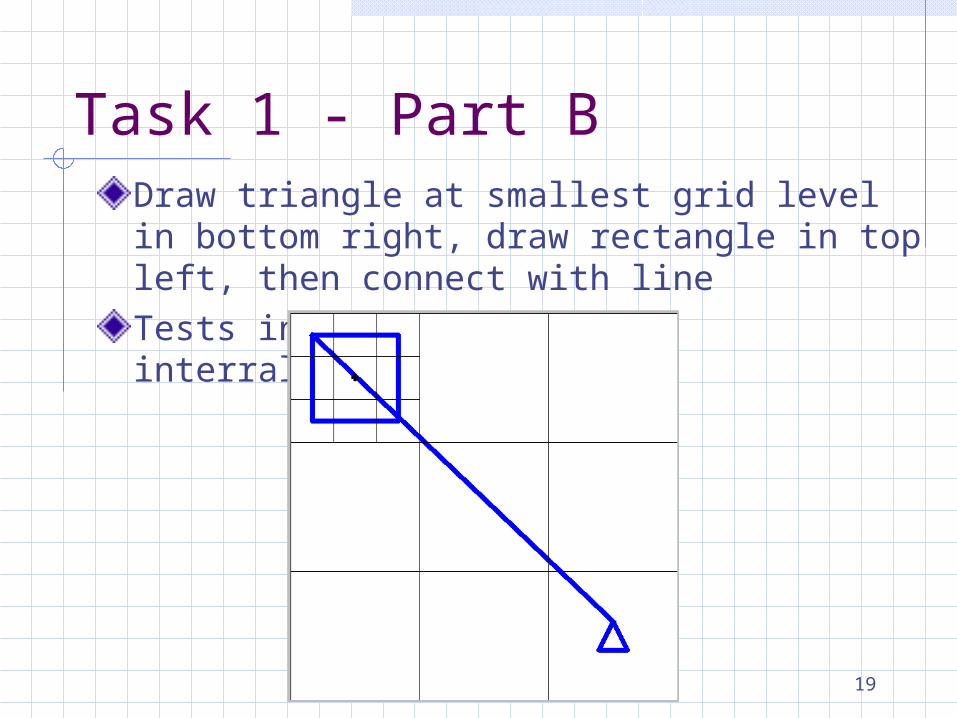
Task 1 - Part BDraw triangle at smallest grid level in bottom right, draw rectangle in top left, then connect with lineTests instructed drawing & interralational reps
20
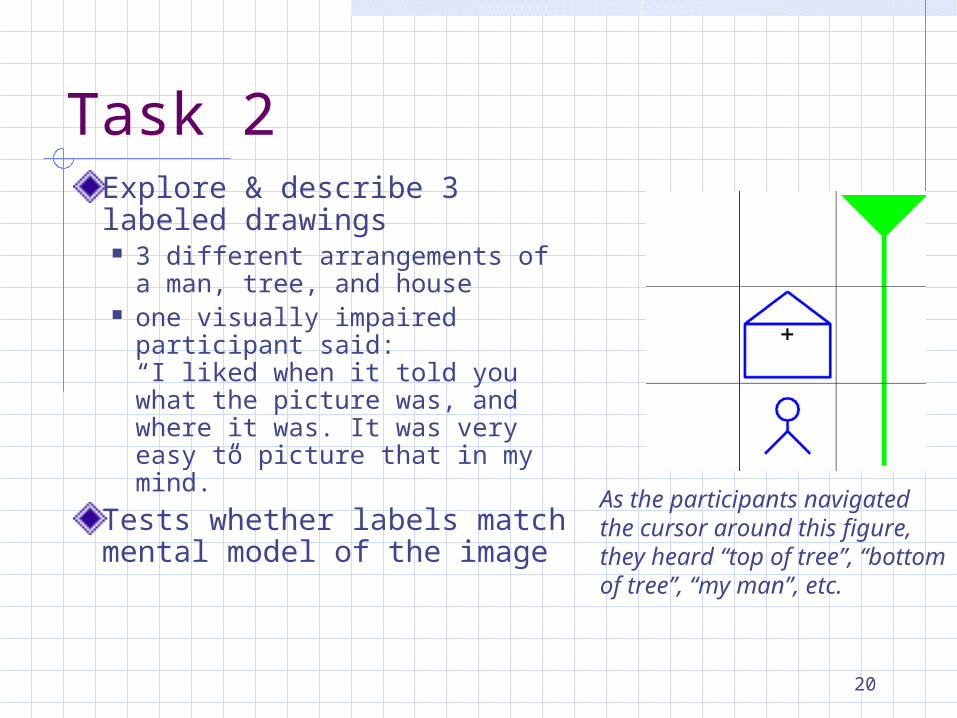
Task 2Explore & describe 3 labeled drawings 3 different arrangements of
a man, tree, and house one visually impaired
participant said: “I liked when it told you what the picture was, and where it was. It was very easy to picture that in my mind.”
Tests whether labels match mental model of the image
As the participants navigated the cursor around this figure, they heard “top of tree”, “bottom of tree”, “my man”, etc.
21
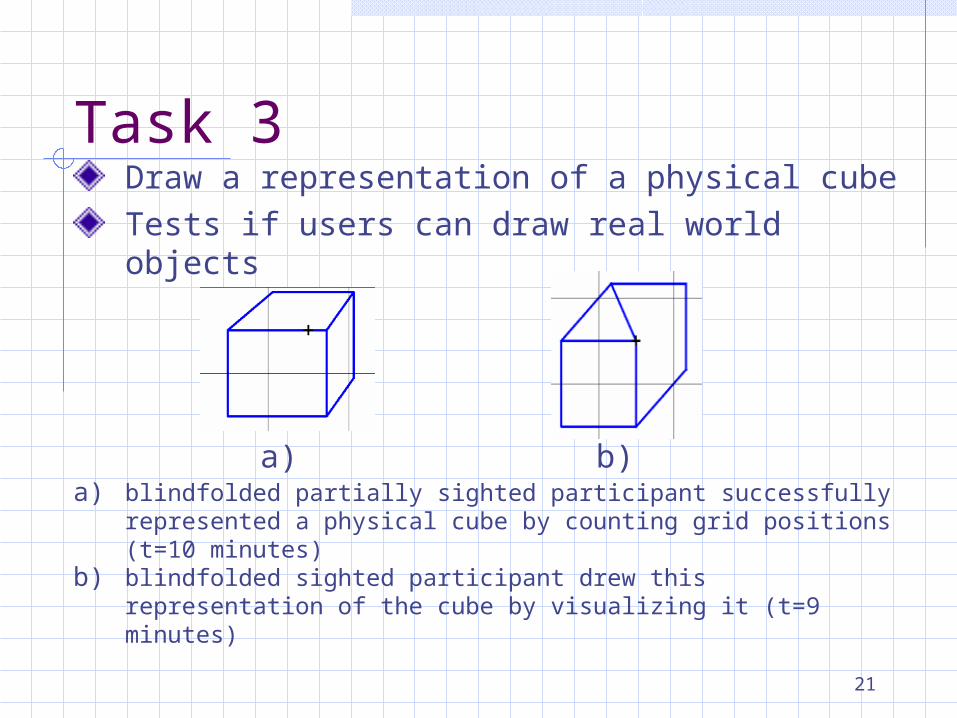
Draw a representation of a physical cubeTests if users can draw real world objects
a) blindfolded partially sighted participant successfully represented a physical cube by counting grid positions (t=10 minutes)
b) blindfolded sighted participant drew this representation of the cube by visualizing it (t=9 minutes)
Task 3
a) b)
22
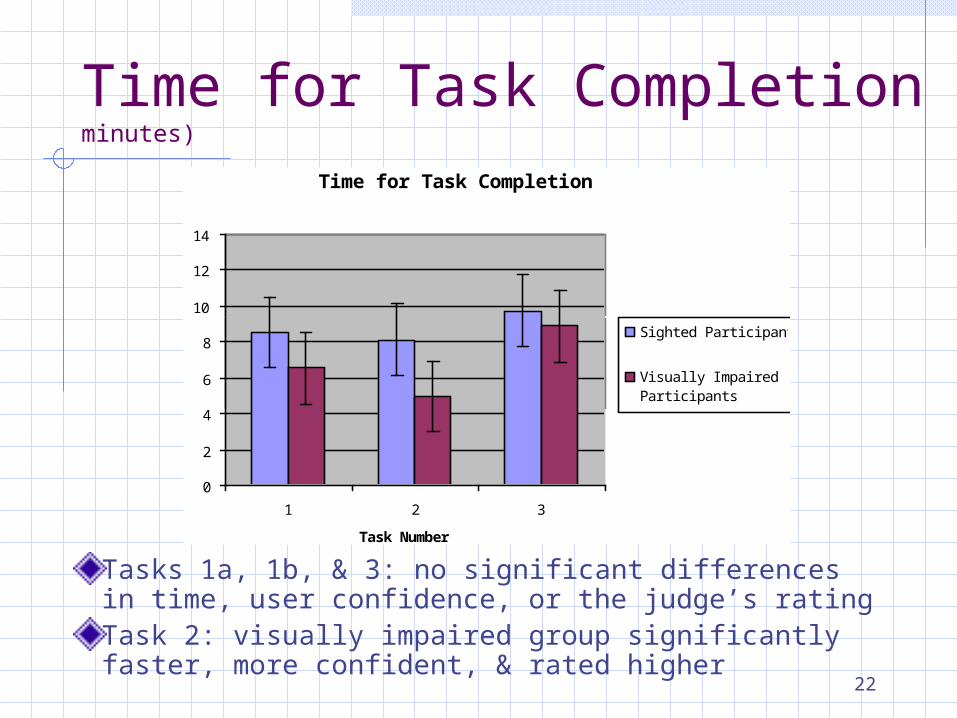
Time for Task Completion (in minutes)
Time for Task Completion
0
2
4
6
8
10
12
14
1 2 3
Task Number
Tim
e in
Min
ute
s
Sighted Participants
Visually ImpairedParticipants
Tasks 1a, 1b, & 3: no significant differences in time, user confidence, or the judge’s ratingTask 2: visually impaired group significantly faster, more confident, & rated higher
23
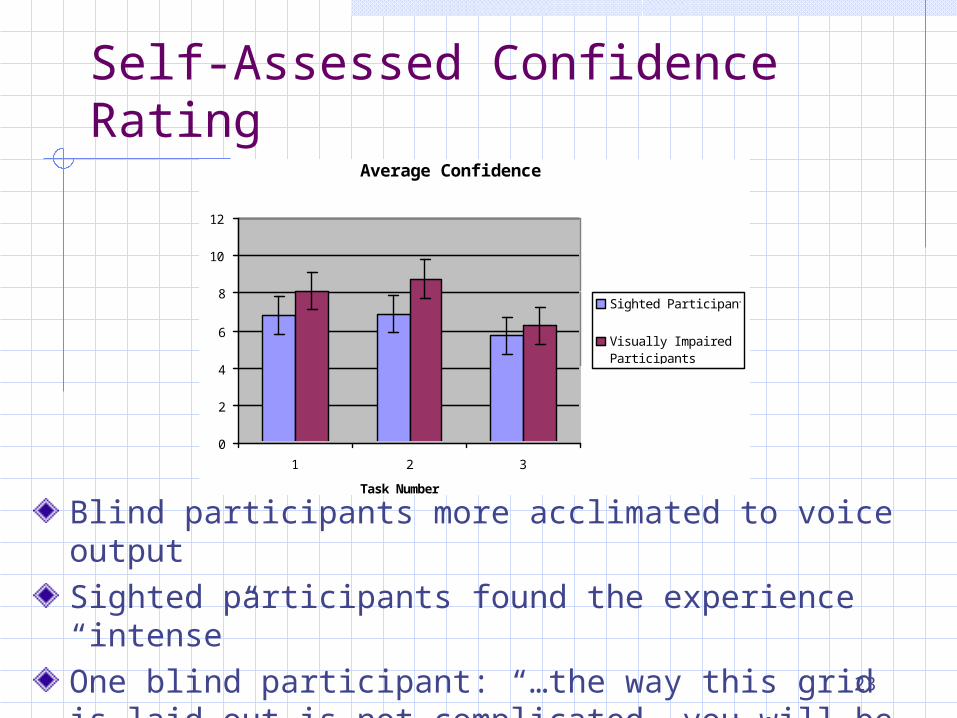
Self-Assessed Confidence RatingAverage Confidence
0
2
4
6
8
10
12
1 2 3
Task Number
Rati
ng
Sighted Participants
Visually ImpairedParticipants
Blind participants more acclimated to voice outputSighted participants found the experience “intense”One blind participant: “…the way this grid is laid out is not complicated, you will be able to know exactly where you are all the time.”
24
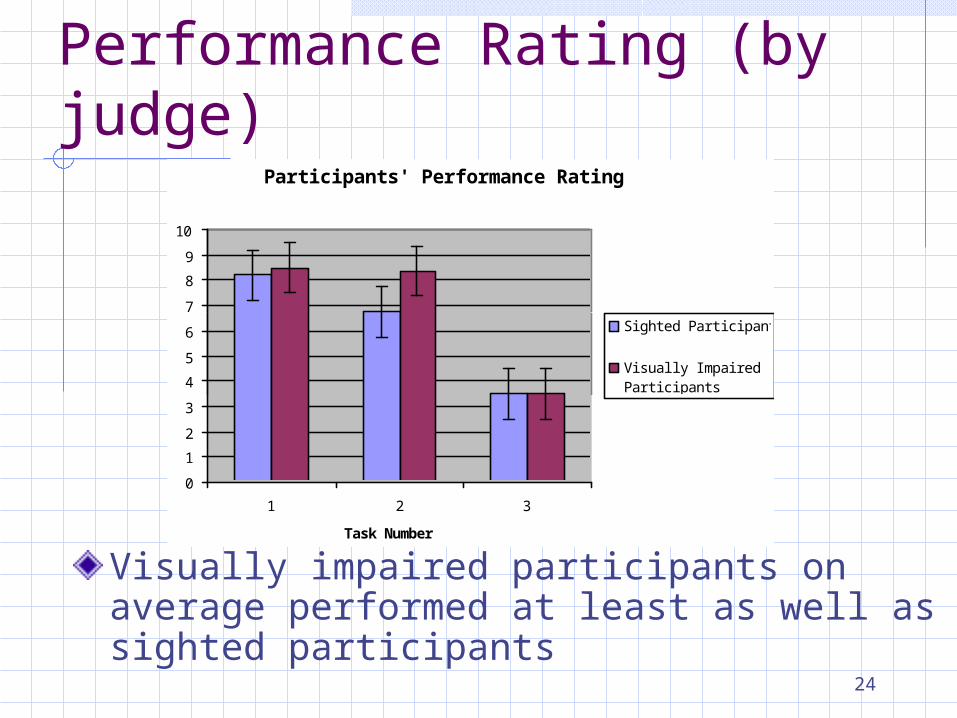
Performance Rating (by judge)
Participants' Performance Rating
0
1
2
3
4
5
6
7
8
9
10
1 2 3
Task Number
Rati
ng
Sighted Participants
Visually ImpairedParticipants
Visually impaired participants on average performed at least as well as sighted participants
25
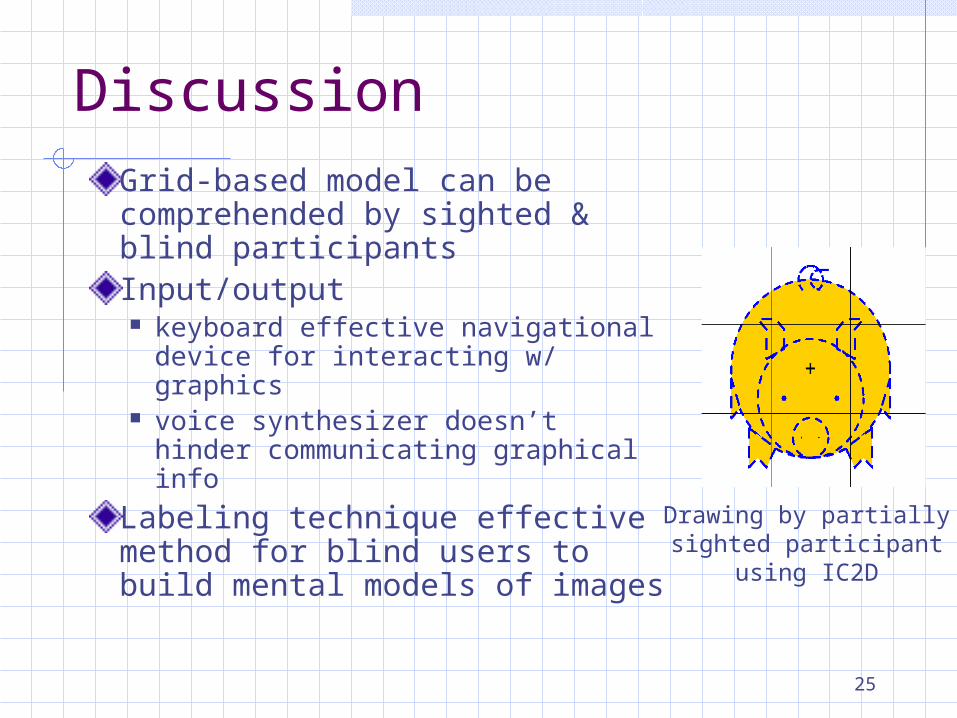
DiscussionGrid-based model can be comprehended by sighted & blind participantsInput/output keyboard effective navigational
device for interacting w/ graphics voice synthesizer doesn’t hinder
communicating graphical info
Labeling technique effective method for blind users to build mental models of images
Drawing by partially sighted participant using
IC2D
26
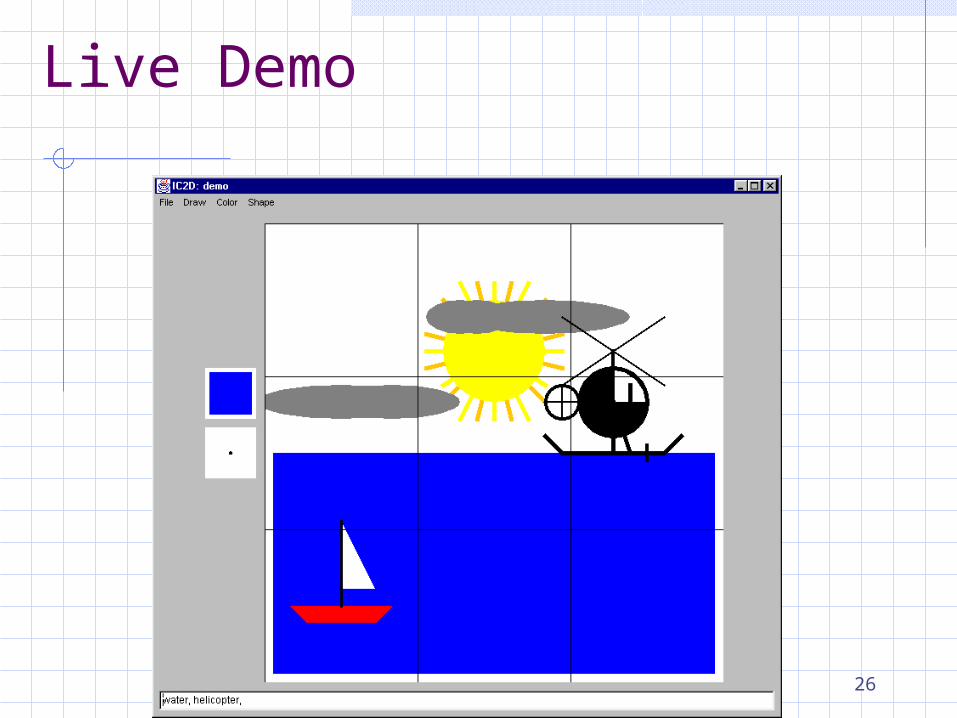
Live Demo

27
ConclusionsDesigned IC2D interface to match users’ abilitiesGrid-based model is a useful schema for creating graphics in a non-visual environmentLabeling technique effective for users building mental models of visual informationIC2D can be used to increase communication between sighted & blindCreating & accessing graphics in a non-visual environment is not a barrier, it is a challenge

28
For More Information
http://guir.berkeley.edu/ic2d

Summary of Statistics(n=16) Visually
ImpairedSighted(blindfolded)
Task1a time 6 (average) 7.3 (average)Task1a confidence 8.1 6.8Task1a performance
8.8 8.8
Task1b time 8.3 8.8Task1b confidence 8.1 6.9Task1b performance
8.3 7.6
Task2 time 5 8.1Task2 confidence 8.8 6.9Task2 performance 8.4 6.8Task3 time 8.9 9.8Task3 confidence 6.3 5.8Task3 performance 3.5 3.5


![Ahmed at Kamel [i.e. Ahmed al Kamel] : the pilgrim of love](https://img.pdfslide.us/doc/110x75/61de3c9a772204095d52c425/ahmed-at-kamel-ie-ahmed-al-kamel-the-pilgrim-of-love-.jpg)