Embed Size (px)
Citation preview
CONSTRUCTING AN OPTIMAL PORTFOLIO USING SHARPE
SINGLE INDEX MODEL
Dr. SAROJ KANTA BISWAL
Assistant Professor (Finance & Control), Institute of Business & Computer Studies, Faculty of
Management Sciences, Siksha „O‟ Anusandhan University, Bhubaneswar 751003, Odisha, India
ABSTRACT
To make wise decisions in investment, there is a need for knowledge on security analysis and
portfolio management. A rational investor aims at attaining maximum return with minimum risk. As
the scope of investment avenues with varying degrees of risk is vast, the scope of the present study is
relating to equity portfolio construction with selected stocks from the BSE. Constructing an optimal
portfolio is a challenging task for the individual as well as the institutional investors. This study is
aimed at creating awareness in the minds of investors regarding the utility of Sharpe‟s Single Index
Model in portfolio construction. The Indian investors also may reap the benefits of Sharpe‟s Single
Index Model (SIM) as the number of companies traded in the stock exchanges is increasing year after
year. 40 S&P 100 BSE Sensex index listed companies having large market capitalization were
selected for the study. Among the 40 sample companies, 23 were selected for optimal portfolio using
SIM. The results of the present study and such micro level studies have more utility value to the fund
managers.
Introduction
Investment in the equity market is a risky and quick way of maximizing returns rather than investing
in the financial instruments at a risk-free rate. The aim of the risk-averse investors is always to
maximize return at a given level of risk or to minimize risk at a given level of return. Risks in the
stock market can be classified into two types: Systematic risk or Non-Diversifiable risk and
Unsystematic risk or Firm-Specific risk. Investment is the employment of funds on assets with the
aim of earning income or capital appreciation. Every investment involves a return and risk. The
possibility of variation in the actual return is known as investment risk. To make wise decisions in
investment, there is a need for knowledge on security analysis and portfolio management. A portfolio
is a combination of securities. Any portfolio constructed, either by an individual investor or a fund
manager is expected to meet the investor‟s goals. A rational investor aims at attaining maximum
return with minimum risk. It is, therefore, important to construct a portfolio using either of the two
popular approaches, namely, traditional and modern. In the traditional approach, investor‟s needs in
terms of income and capital appreciation are evaluated and appropriate securities are selected to meet
the needs of the investor. Investors usually invest in a portfolio of stocks to eliminate non-systematic
risk, but systematic risk cannot be avoided as it arises out of the market factors like GDP, inflation,
exchange rate fluctuations. Portfolio theory was originally proposed by Harry Markowitz who
attempted to quantify the risk of a portfolio and developed a procedure for determining the optimal
portfolio. However, the Markowitz theory was to complex and cumbersome to determine the optimal
portfolio. Markowitz model is used in selection of securities based on to the risk and return analysis.
Markowitz laid foundation for quantifying risk and his contribution is popularly known as „Modern
Portfolio Theory‟. He has provided analytical tools for analysis and selection of optimal portfolio. He
won Nobel Prize for this contribution to portfolio management in 1990.
But, William Sharpe extended the work done by Markowitz. He considered market index while
analyzing the portfolio. He simplified the amount and type of input data required to perform portfolio
analysis. He made the numerous and complex computations easy which were essential to attain the
INTERCONTINENTAL JOURNAL OF BANKING, INSURANCE AND FINANCEISSN:2350-0875 -ONLINE ISSN:2350-0867 -PRINT - IMPACT FACTOR:0.432VOLUME 2, ISSUE 10, OCTOBER 2015
www.researchscripts.org 17 [email protected]

optimal portfolio. He developed the Single Index Model to make these computations easy and
construct an optimal portfolio. Till today, fund managers use this model in portfolio analysis and
construction. Hence, William Sharpe developed the single index model to determine the optimal
portfolio, which made the calculations based on the statistical concept of regression between stock
returns and market returns. Sharpe‟s model expresses the returns on each security as a function of a
return on the market index. Thus this study is fully based on Sharpe index model aiming at
constructing an optimal portfolio of selected stocks by choosing from different sectors in the Indian
economy in the period June 2005 to June 2015. Indian investors also may reap the benefits of
Sharpe‟s Single Index Model as the number of companies traded in the stock exchanges is increasing
year after year. The Bombay Stock Exchange Ltd (BSE) that was established in 1875 is the Asia‟s
First Stock Exchange and one of the leading exchanges in India. Over the past 137 years, the BSE has
facilitated the growth of the Indian corporate sector by providing it an efficient capital-raising
platform. It provides an efficient and transparent market for trading in equity, debt instruments,
derivatives, mutual funds. More than 5000 companies are listed on BSE making it world's No. 1
exchange in terms of listed members. BSE‟s popular equity index - the S&P BSE SENSEX - is India's
most widely tracked stock market benchmark index. As on 25th
June 2015 the total turnover of the
index being Rs. 6,522,378.74 and the index value 27780.83. Bearing these in mind, the present
study was undertaken to facilitate effective decision making by the investors.
Assumptions
All investors have homogeneous expectations.
A uniform holding period is used in estimating risk and return for each security.
The price movements of a security in relation to another do not depend primarily upon the
nature of those two securities alone. They could reflect a greater influence that might have
cropped up as a result of general business and economic conditions.
The relation between securities occurs only through their individual influences along with
some indices of business and economic activities.
The indices, to which the returns of each security are correlated, are likely to be some
securities‟ market proxy.
The random disturbance terms „Ɛi‟ has an expected value zero and a finite variance. It is not
correlated with the rate of return on market portfolio „Rm‟ as well as with the error term of
any other securities.
Objective of the Study
To construct an optimal portfolio empirically using the Sharpe‟s Single Index Model.
To determine return and risk of the optimal portfolio constructed by using Sharpe‟s
Single Index Model.
Review of Literature
Tripathy, Sasikanta (2011) applied the model on selected Indian banks‟ securities. The author
assumed that there is a positive relationship between the banked and individual stocks. Fifteen
securities selected of the banks comprised in BANKEX as a sample. The data is based on secondary
source for the period from 1st April 2011 to 31st march 2012. It was found that there is a linear
relationship between security returns and the common factor that there is no difference among the
return of all the banks from the ANOVA.
INTERCONTINENTAL JOURNAL OF BANKING, INSURANCE AND FINANCEISSN:2350-0875 -ONLINE ISSN:2350-0867 -PRINT - IMPACT FACTOR:0.432VOLUME 2, ISSUE 10, OCTOBER 2015
www.researchscripts.org 18 [email protected]
Varadharajan and Ganesh (2012) applied the SIM on equity portfolio of large caps companies of
selected sectors in India. The main aim of this study is to find out the optimum portfolio from the
selected companies in three major sectors like power sector, shipping sector and textile sector. From
each sector six companies have been selected and so a total of eighteen companies are selected as
samples. The companies with the largest market capitalization in each sector have been selected. Data
for five financial years were used for constructing the portfolio; i.e. from 1st April 2006 to 31st march
2011. All calculations have been done using MS Excel. From the analysis it was found that only five
companies were included in the portfolio constructed out of the eighteen companies.
Varadharajan and Ganesh (2012) applied the SIM on equity portfolio of large caps companies of
selected sectors in India. The main aim of this study is to find out the optimum portfolio from the
selected companies in three major sectors like power sector, shipping sector and textile sector. From
each sector six companies have been selected and so a total of eighteen companies are selected as
samples. The companies with the largest market capitalization in each sector have been selected. Data
for five financial years were used for constructing the portfolio; i.e. from 1st April 2006 to 31st march
2011. All calculations have been done using MS Excel. From the analysis it was found that only five
companies were included in the portfolio constructed out of the eighteen companies. the fifty
companies in S&P CNX Nifty only six securities were selected for the optimal portfolio construction.
The percentage of investment to be made in the selected securities has been calculated using Sharpe‟s
Single Index Model. The study reveals that stock prices and market index move in the same direction.
Sarker, Mokta Rani (2013) conducted a study to construct an optimal portfolio using Sharpe‟s Single
Index Model considering no short sales. The study has been conducted on individual securities listed
in Dhaka Stock Exchange, where short sales are not allowed. The monthly closing prices of one
hundred and sixty four companies listed in Dhaka Stock Exchange and share price index for the
period of July 2007 to June 2012 have been considered in this study. This method formulates a unique
cut-off point, selects stocks having excess return to beta ratio surpassing this cut-off point and
determines the percentage of investment to be made in in each of selected stocks. The optimum
portfolio consists of thirty three stocks selected out of one hundred and sixty four stocks giving the
return of 6.17%. From this empirical analysis to some extent, an investor can forecast individual
securities return through the market movement and can make use of it.
Desai, Radhika and Surti, Manisha (2013) constructed an optimal portfolio using fifty companies
which were listed on the NSE and the time duration of the study is three years. Among the fifty
companies only ten companies were selected for the optimum portfolio. The proportion of investment
made in each security has been calculated using the Sharpe‟s Single Index Model. The volatility of
security has been analysed. The research provides direction to investors regarding performance of
securities. Once the performance is analyzed and optimum portfolio of securities is constructed, it
enables the investor to take appropriate decisions. Gopalakrishna, Muthu (2014) explains the
investment alternatives available for rational investor. A comparison of traditional portfolio theory
with that of modern portfolio theory is made in this study. This study aims to test whether single index
model offers an appropriate explanation of stock returns on IT stocks. The samples included in this
study consists of 13 actively traded securities listed in the National Stock Exchange Limited, Bombay
(NSE).The securities in the sample are selected from NSE IT index. The secondary data for a period
2004-2008 has been used for the study. By applying regression on the market return and excess
security return it is found that IT index has a phenomenal amount of sensitiveness over S&P CNX
Nifty. The study investigated that there are four aggressive stocks having beta coefficient of more
INTERCONTINENTAL JOURNAL OF BANKING, INSURANCE AND FINANCEISSN:2350-0875 -ONLINE ISSN:2350-0867 -PRINT - IMPACT FACTOR:0.432VOLUME 2, ISSUE 10, OCTOBER 2015
www.researchscripts.org 19 [email protected]

than one. It is recommended that among the sample companies all the stocks are undervalued except
one stock and thus the investors can pick these stocks to revise their portfolio.
Methodology
This is a descriptive study on the construction of portfolio of stocks. The data taken for the study is
Secondary in nature. The data has been collected from various websites like BSE India &
MoneyControl.com. Taking the computed return of each security and the market, the proposed
method formulates a unique Cut off Rate and selects those securities whose „Excess Return-to-Beta
Ratio‟ is greater than the cut off rate. Then to arrive at the optimal portfolio, the proportion of
investment in each of the selected securities in the optimal portfolio is computed on the basis of beta
value, unsystematic risk, excess return to beta ratio and the cut off rate of the security concerned.
Different Statistical and Financial tools and techniques, charts and diagrams have been used for the
purpose of analysis and interpretation of data. For this study the following methodology / model is
used to construct an Optimal Portfolio:
Sharpe’s Single Index Model
Sharpe‟s Model proposes that the relationship between each pair of securities can indirectly be
measured by comparing each security to a common factor „market performance index‟ that is shared
amongst all the securities. This helps in reducing the burden of large input requirements and difficult
calculations required in Markowitz‟s mean- variance approach. While Markowitz Model requires n
(n−1)/ 2 data inputs, the Sharpe‟s Model requires only (3n+2) data inputs, namely, the estimates of
returns for each security, estimates for expected return on market index and estimates of variance of
return. This forms the essence of Sharpe‟s Model which has made financial analysts and researchers
to consider it superior to the Markowitz Model. It is based on the assumption that when the market
moves up most of the stock prices also tends to increase and vice versa. Therefore, securities returns
are correlated and there might be co-movement between securities because of common response to
market changes.
This co-movement of stocks with the market index is studied with the help a simple regression
analysis:
R i = αi +βi Rm + ei
Where R I = Return on individual security
αi = Independent of the market performance
βi = Measure of the expected change in individual stock return to the change in market return
Rm = Return of the market index
ei = Error term representing the random disturbance.
Beta
Beta coefficient is the relative measure of systematic risk. Beta of an investment is a measure of the
risk arising from exposure to general market movements as opposed to idiosyncratic factors. The
market portfolio has a beta of exactly one.
βi = COV(I, m) = σi * σm * Correl (I, m)
Var (Rm) σm 2
Return
The total gain or loss experienced on an investment over a given period of time, calculated by
dividing the difference in ending price and beginning Price during the period with the total period of
investment value is termed as return.
INTERCONTINENTAL JOURNAL OF BANKING, INSURANCE AND FINANCEISSN:2350-0875 -ONLINE ISSN:2350-0867 -PRINT - IMPACT FACTOR:0.432VOLUME 2, ISSUE 10, OCTOBER 2015
www.researchscripts.org 20 [email protected]
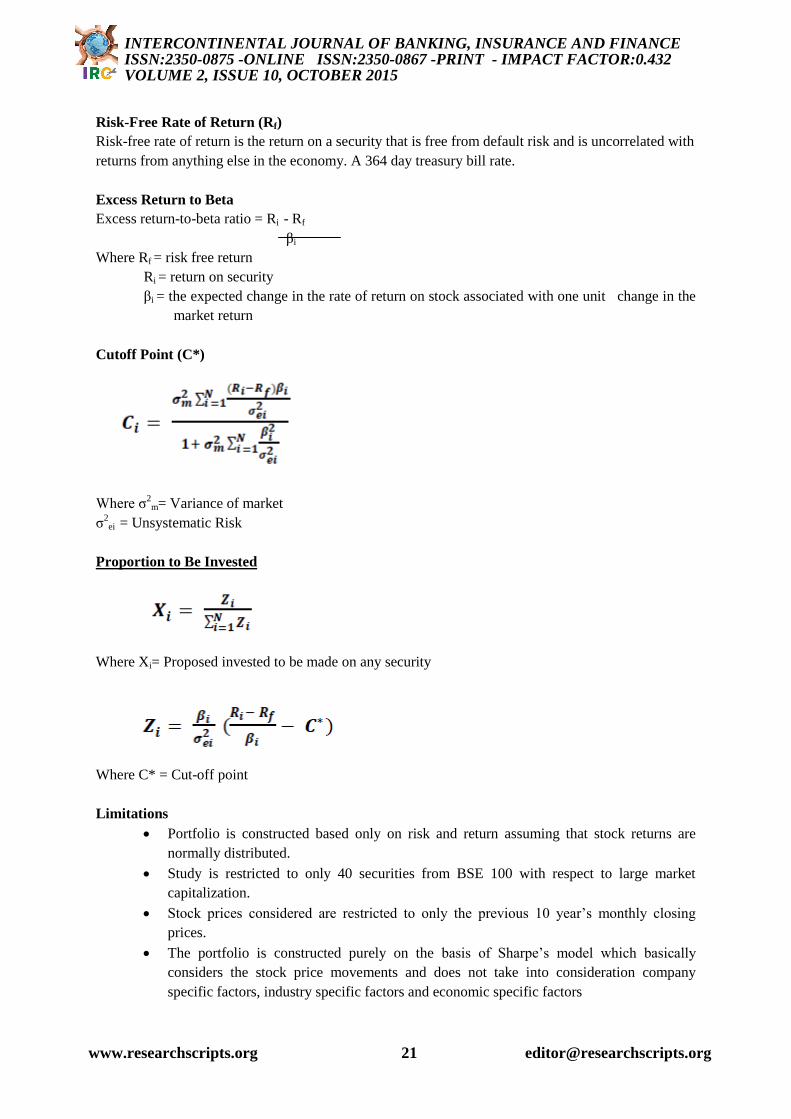
Risk-Free Rate of Return (Rf)
Risk-free rate of return is the return on a security that is free from default risk and is uncorrelated with
returns from anything else in the economy. A 364 day treasury bill rate.
Excess Return to Beta
Excess return-to-beta ratio = Ri - Rf
βi
Where Rf = risk free return
Ri = return on security
βi = the expected change in the rate of return on stock associated with one unit change in the
market return
Cutoff Point (C*)
Where σ2
m= Variance of market
σ2ei = Unsystematic Risk
Proportion to Be Invested
Where Xi= Proposed invested to be made on any security
Where C* = Cut-off point
Limitations
Portfolio is constructed based only on risk and return assuming that stock returns are
normally distributed.
Study is restricted to only 40 securities from BSE 100 with respect to large market
capitalization.
Stock prices considered are restricted to only the previous 10 year‟s monthly closing
prices.
The portfolio is constructed purely on the basis of Sharpe‟s model which basically
considers the stock price movements and does not take into consideration company
specific factors, industry specific factors and economic specific factors
INTERCONTINENTAL JOURNAL OF BANKING, INSURANCE AND FINANCEISSN:2350-0875 -ONLINE ISSN:2350-0867 -PRINT - IMPACT FACTOR:0.432VOLUME 2, ISSUE 10, OCTOBER 2015
www.researchscripts.org 21 [email protected]
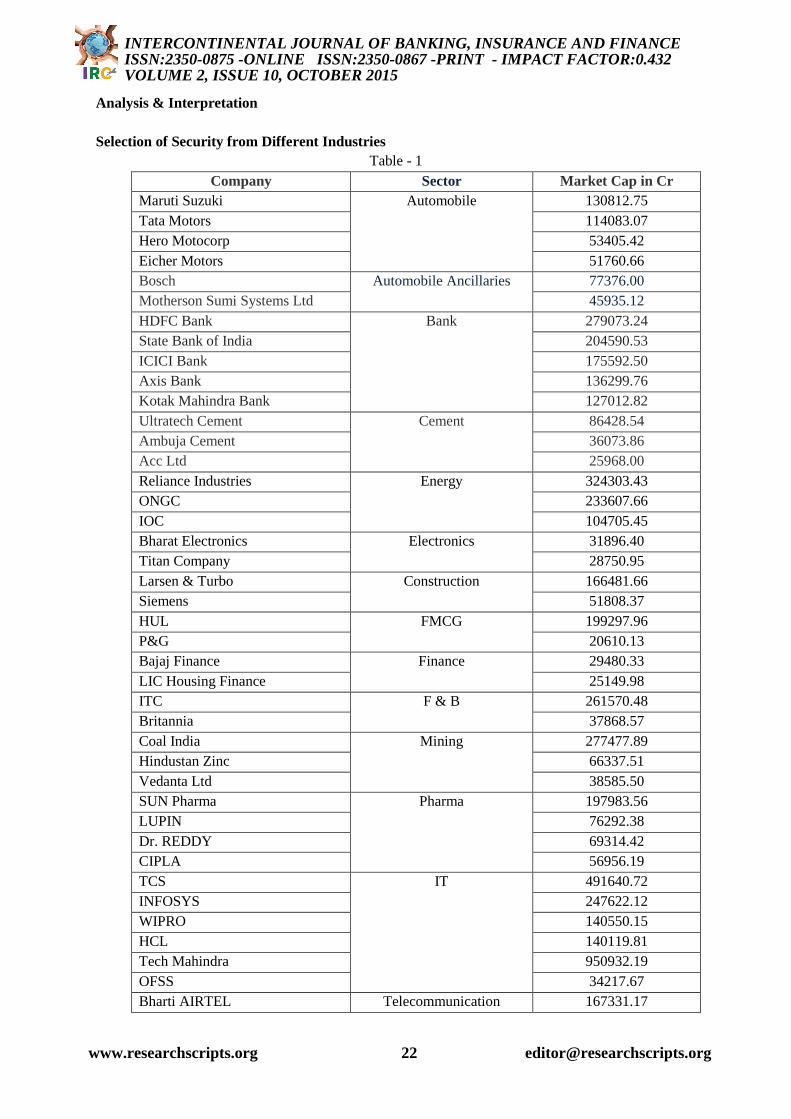
Analysis & Interpretation
Selection of Security from Different Industries
Table - 1
Company Sector Market Cap in Cr
Maruti Suzuki Automobile 130812.75
Tata Motors 114083.07
Hero Motocorp 53405.42
Eicher Motors 51760.66
Bosch Automobile Ancillaries 77376.00
Motherson Sumi Systems Ltd 45935.12
HDFC Bank Bank 279073.24
State Bank of India 204590.53
ICICI Bank 175592.50
Axis Bank 136299.76
Kotak Mahindra Bank 127012.82
Ultratech Cement Cement 86428.54
Ambuja Cement 36073.86
Acc Ltd 25968.00
Reliance Industries Energy 324303.43
ONGC 233607.66
IOC 104705.45
Bharat Electronics Electronics 31896.40
Titan Company 28750.95
Larsen & Turbo Construction 166481.66
Siemens 51808.37
HUL FMCG 199297.96
P&G 20610.13
Bajaj Finance Finance 29480.33
LIC Housing Finance 25149.98
ITC F & B 261570.48
Britannia 37868.57
Coal India Mining 277477.89
Hindustan Zinc 66337.51
Vedanta Ltd 38585.50
SUN Pharma Pharma 197983.56
LUPIN 76292.38
Dr. REDDY 69314.42
CIPLA 56956.19
TCS IT 491640.72
INFOSYS 247622.12
WIPRO 140550.15
HCL 140119.81
Tech Mahindra 950932.19
OFSS 34217.67
Bharti AIRTEL Telecommunication 167331.17
INTERCONTINENTAL JOURNAL OF BANKING, INSURANCE AND FINANCEISSN:2350-0875 -ONLINE ISSN:2350-0867 -PRINT - IMPACT FACTOR:0.432VOLUME 2, ISSUE 10, OCTOBER 2015
www.researchscripts.org 22 [email protected]

TABLE 2: Return on Market Index i.e BSE 100
BSE 100 MARKET INDICES
Mean Return .01443772984
Standard Deviation 0.073963027
Variance 0.005470529
The above table shows the return on Market index being selected that is BSE 100. Monthly data is being
considered and return is being calculated.
Rm = Mean (return)
Table 3: Return on Security
SECURITY αi βi Rm βi*Rm Error term Ri
TCS 2.451234031 0.448897144 0.01443773 0.006481056 0 2.457715087
INFOSYS 1.817751352 1.044335965 0.01443773 0.015077841 0 1.832829193
RELIANCE 1.87619113 1.049073404 0.01443773 0.015146238 0 1.891337368
HDFC BANK 2.806807257 0.645212301 0.01443773 0.009315401 0 2.816122658
SBI 2.220513511 1.232359113 0.01443773 0.017792468 0 2.238305979
SUN PHARMA 3.170838356 0.524741022 0.01443773 0.007576069 0 3.178414425
ICICI 2.303594383 1.526522055 0.01443773 0.022039513 0 2.325633896
LARSEN 3.25517341 1.509290131 0.01443773 0.021790723 0 3.276964134
AXIS 3.428259981 1.393530211 0.01443773 0.020119413 0 3.448379394
ITC 2.089953093 0.467667115 0.01443773 0.006752051 0 2.096705145
TATA MOTORS 2.824642078 1.459165373 0.01443773 0.021067035 0 2.845709113
WIPRO 1.471901452 0.787351949 0.01443773 0.011367575 0 1.483269027
ONGC 1.25334961 0.970491274 0.01443773 0.014011691 0 1.267361301
HCL 2.983352695 0.777932315 0.01443773 0.011231577 0 2.994584271
MARUTI SUZUKI 2.819303236 0.439400067 0.01443773 0.006343939 0 2.825647176
BOSCH 2.588465563 0.310569145 0.01443773 0.004483913 0 2.592949476
HERO MOTO CORP 1.927633752 0.609289733 0.01443773 0.008796761 0 1.936430512
OFSS 2.546216744 0.780873834 0.01443773 0.011274045 0 2.557490789
HUL 2.225700162 0.407560174 0.01443773 0.005884244 0 2.231584406
BHARTI AIRTEL 1.827256971 0.763055176 0.01443773 0.011016784 0 1.838273755
KOTAK MAHINDRA 3.964039724 1.490407195 0.01443773 0.021518096 0 3.98555782
LUPIN 3.860971324 0.46319365 0.01443773 0.006687465 0 3.867658789
Dr. REDDY 2.830317452 0.55573222 0.01443773 0.008023512 0 2.838340963
EICHER MOTORS 5.040621784 0.862577941 0.01443773 0.012453667 0 5.053075452
CIPLA 2.051992928 0.410829285 0.01443773 0.005931442 0 2.05792437
BRITANNIA 3.181048062 0.401861962 0.01443773 0.005801974 0 3.186850036
SIEMENS 3.076748669 1.497617725 0.01443773 0.0216222 0 3.09837087
ULTRA TECH CEMENT 3.050132896 1.030900531 0.01443773 0.014883863 0 3.065016759
P&G 2.7082025 0.3307633 0.01443773 0.004775471 0 2.712977971
BAJAJ FINANCE 4.40748051 1.202054609 0.01443773 0.01735494 0 4.424835449
ACC 1.951868637 0.900389661 0.01443773 0.012999583 0 1.964868219
TITAN 4.03512204 1.017602094 0.01443773 0.014691864 0 4.049813904
BHARAT ELECTRONICS 2.3502451 1.066165894 0.01443773 0.015393015 0 2.365638115
COAL INDIA 0.914262981 0.752528511 0.01443773 0.010864803 0 0.925127785
HINDUSTAN ZINC 3.762820913 1.257420921 0.01443773 0.018154304 0 3.780975217
IOC 1.36149231 0.881188824 0.01443773 0.012722366 0 1.374214676
AMBUJA CEMENT 1.905053808 0.935018772 0.01443773 0.013499548 0 1.918553357
LIC HOUSING FINANCE 3.45279152 1.489796679 0.01443773 0.021509282 0 3.474300802
MOTHERSON SUMI 3.912806205 1.030655294 0.01443773 0.014880323 0 3.927686528
VEDANTA 3.871020026 1.500592035 0.01443773 0.021665142 0 3.892685168
INTERCONTINENTAL JOURNAL OF BANKING, INSURANCE AND FINANCEISSN:2350-0875 -ONLINE ISSN:2350-0867 -PRINT - IMPACT FACTOR:0.432VOLUME 2, ISSUE 10, OCTOBER 2015
www.researchscripts.org 23 [email protected]
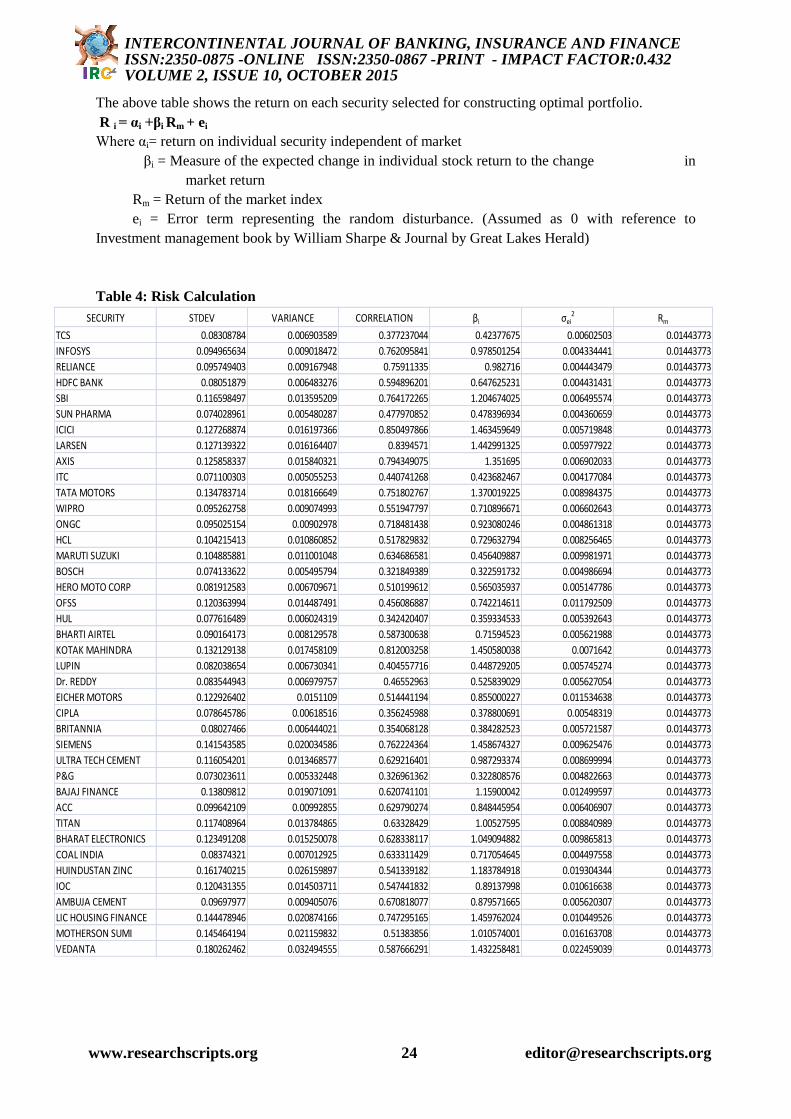
The above table shows the return on each security selected for constructing optimal portfolio.
R i = αi +βi Rm + ei
Where αi= return on individual security independent of market
βi = Measure of the expected change in individual stock return to the change in
market return
Rm = Return of the market index
ei = Error term representing the random disturbance. (Assumed as 0 with reference to
Investment management book by William Sharpe & Journal by Great Lakes Herald)
Table 4: Risk Calculation
SECURITY STDEV VARIANCE CORRELATION βi σei2 Rm
TCS 0.08308784 0.006903589 0.377237044 0.42377675 0.00602503 0.01443773
INFOSYS 0.094965634 0.009018472 0.762095841 0.978501254 0.004334441 0.01443773
RELIANCE 0.095749403 0.009167948 0.75911335 0.982716 0.004443479 0.01443773
HDFC BANK 0.08051879 0.006483276 0.594896201 0.647625231 0.004431431 0.01443773
SBI 0.116598497 0.013595209 0.764172265 1.204674025 0.006495574 0.01443773
SUN PHARMA 0.074028961 0.005480287 0.477970852 0.478396934 0.004360659 0.01443773
ICICI 0.127268874 0.016197366 0.850497866 1.463459649 0.005719848 0.01443773
LARSEN 0.127139322 0.016164407 0.8394571 1.442991325 0.005977922 0.01443773
AXIS 0.125858337 0.015840321 0.794349075 1.351695 0.006902033 0.01443773
ITC 0.071100303 0.005055253 0.440741268 0.423682467 0.004177084 0.01443773
TATA MOTORS 0.134783714 0.018166649 0.751802767 1.370019225 0.008984375 0.01443773
WIPRO 0.095262758 0.009074993 0.551947797 0.710896671 0.006602643 0.01443773
ONGC 0.095025154 0.00902978 0.718481438 0.923080246 0.004861318 0.01443773
HCL 0.104215413 0.010860852 0.517829832 0.729632794 0.008256465 0.01443773
MARUTI SUZUKI 0.104885881 0.011001048 0.634686581 0.456409887 0.009981971 0.01443773
BOSCH 0.074133622 0.005495794 0.321849389 0.322591732 0.004986694 0.01443773
HERO MOTO CORP 0.081912583 0.006709671 0.510199612 0.565035937 0.005147786 0.01443773
OFSS 0.120363994 0.014487491 0.456086887 0.742214611 0.011792509 0.01443773
HUL 0.077616489 0.006024319 0.342420407 0.359334533 0.005392643 0.01443773
BHARTI AIRTEL 0.090164173 0.008129578 0.587300638 0.71594523 0.005621988 0.01443773
KOTAK MAHINDRA 0.132129138 0.017458109 0.812003258 1.450580038 0.0071642 0.01443773
LUPIN 0.082038654 0.006730341 0.404557716 0.448729205 0.005745274 0.01443773
Dr. REDDY 0.083544943 0.006979757 0.46552963 0.525839029 0.005627054 0.01443773
EICHER MOTORS 0.122926402 0.0151109 0.514441194 0.855000227 0.011534638 0.01443773
CIPLA 0.078645786 0.00618516 0.356245988 0.378800691 0.00548319 0.01443773
BRITANNIA 0.08027466 0.006444021 0.354068128 0.384282523 0.005721587 0.01443773
SIEMENS 0.141543585 0.020034586 0.762224364 1.458674327 0.009625476 0.01443773
ULTRA TECH CEMENT 0.116054201 0.013468577 0.629216401 0.987293374 0.008699994 0.01443773
P&G 0.073023611 0.005332448 0.326961362 0.322808576 0.004822663 0.01443773
BAJAJ FINANCE 0.13809812 0.019071091 0.620741101 1.15900042 0.012499597 0.01443773
ACC 0.099642109 0.00992855 0.629790274 0.848445954 0.006406907 0.01443773
TITAN 0.117408964 0.013784865 0.63328429 1.00527595 0.008840989 0.01443773
BHARAT ELECTRONICS 0.123491208 0.015250078 0.628338117 1.049094882 0.009865813 0.01443773
COAL INDIA 0.08374321 0.007012925 0.633311429 0.717054645 0.004497558 0.01443773
HUINDUSTAN ZINC 0.161740215 0.026159897 0.541339182 1.183784918 0.019304344 0.01443773
IOC 0.120431355 0.014503711 0.547441832 0.89137998 0.010616638 0.01443773
AMBUJA CEMENT 0.09697977 0.009405076 0.670818077 0.879571665 0.005620307 0.01443773
LIC HOUSING FINANCE 0.144478946 0.020874166 0.747295165 1.459762024 0.010449526 0.01443773
MOTHERSON SUMI 0.145464194 0.021159832 0.51383856 1.010574001 0.016163708 0.01443773
VEDANTA 0.180262462 0.032494555 0.587666291 1.432258481 0.022459039 0.01443773
INTERCONTINENTAL JOURNAL OF BANKING, INSURANCE AND FINANCEISSN:2350-0875 -ONLINE ISSN:2350-0867 -PRINT - IMPACT FACTOR:0.432VOLUME 2, ISSUE 10, OCTOBER 2015
www.researchscripts.org 24 [email protected]

The above table shows the calculation of standard deviation, variance, systematic risk and
unsystematic risk of each security.
σi = sqrt ((xi-xi)/N)
βi= Cov(I,m)
σei2= σi- βi
2 Rm
2
Table 5: Risk Free Return Or 364 Day T-Bill Rate
YEAR T-BILL RATE
2005 6.17
2006 7.23
2007 7.66
2008 4.78
2009 4.72
2011 7.48
2012 8.68
2013 8.26
2014 7.78
2015 7.56
70.32
Mean 0.07032
The above table shows the risk free return which is being calculating the average of 364 days T Bill
rate to calculate excess return to Beta.
Rf = Avg (10yr T bill)
Table 5: Excess Return to Beta
The above table shows the calculation of excess return to beta. This single value exists in Sharpe‟s
Single Index Model where it is found that the desirability of any security is directly related to its
„excess return to beta ratio‟. This means that the desirability of any security is solely a function of its
excess return-to-beta ratio (Fischer & Jordan Book). If securities are ranked on the basis of excess
return-to-beta ratio (from highest to lowest), the ranking represents the desirability of including a
security in the portfolio.
LUPIN yielded the maximum return among the companies selected and COAL INDIA yielded lower
return. Pharma have shown a higher return in all the companies chosen for the analysis. It shows that
Pharma is the growing sector and it is most preferred investable securities in India. Beta is greater
than 1 in 17 companies, which shows that these securities have more risk and at the same time the
reward per unit of risks is also more. But in case of other companies with regards to beta is less than 1
which shows it is less risky when compared to market risk.
Sharpe has provided a model for the selection of appropriate securities in a portfolio. The excess
return of any stock is directly related to its excess return to beta ratio. It measures the additional return
on a security (excess of the risk less asset return) per unit of systematic risk. The ratio provides a
relationship between potential risk and reward. Ranking of the stocks are done on the basis of their
excess return to beta. Based on the excess return to beta ratio the scrip‟s are ranked from 1 to 40, with
LUPIN being in the first rank and COAL INDIA being in the last. The excess return to beta ratio was
calculated using 7.032% as risk free rate of return.
It is clearly seen that the security of LUPIN, having the highest excess return to beta ratio
(8.198166773) occupies the first place. The security having the second highest excess return to beta
INTERCONTINENTAL JOURNAL OF BANKING, INSURANCE AND FINANCEISSN:2350-0875 -ONLINE ISSN:2350-0867 -PRINT - IMPACT FACTOR:0.432VOLUME 2, ISSUE 10, OCTOBER 2015
www.researchscripts.org 25 [email protected]
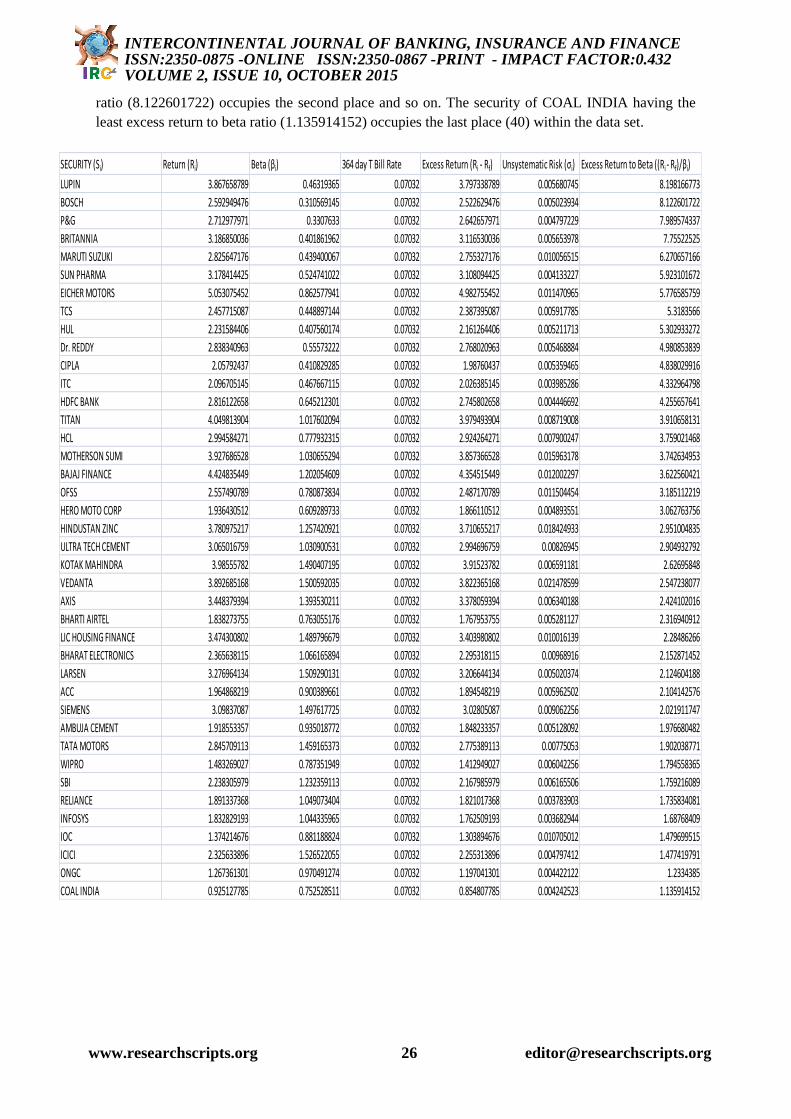
ratio (8.122601722) occupies the second place and so on. The security of COAL INDIA having the
least excess return to beta ratio (1.135914152) occupies the last place (40) within the data set.
SECURITY (Si) Return (Ri) Beta (βi) 364 day T Bill Rate Excess Return (Ri - Rf) Unsystematic Risk (σi) Excess Return to Beta ((Ri - Rf)/βi)
LUPIN 3.867658789 0.46319365 0.07032 3.797338789 0.005680745 8.198166773
BOSCH 2.592949476 0.310569145 0.07032 2.522629476 0.005023934 8.122601722
P&G 2.712977971 0.3307633 0.07032 2.642657971 0.004797229 7.989574337
BRITANNIA 3.186850036 0.401861962 0.07032 3.116530036 0.005653978 7.75522525
MARUTI SUZUKI 2.825647176 0.439400067 0.07032 2.755327176 0.010056515 6.270657166
SUN PHARMA 3.178414425 0.524741022 0.07032 3.108094425 0.004133227 5.923101672
EICHER MOTORS 5.053075452 0.862577941 0.07032 4.982755452 0.011470965 5.776585759
TCS 2.457715087 0.448897144 0.07032 2.387395087 0.005917785 5.3183566
HUL 2.231584406 0.407560174 0.07032 2.161264406 0.005211713 5.302933272
Dr. REDDY 2.838340963 0.55573222 0.07032 2.768020963 0.005468884 4.980853839
CIPLA 2.05792437 0.410829285 0.07032 1.98760437 0.005359465 4.838029916
ITC 2.096705145 0.467667115 0.07032 2.026385145 0.003985286 4.332964798
HDFC BANK 2.816122658 0.645212301 0.07032 2.745802658 0.004446692 4.255657641
TITAN 4.049813904 1.017602094 0.07032 3.979493904 0.008719008 3.910658131
HCL 2.994584271 0.777932315 0.07032 2.924264271 0.007900247 3.759021468
MOTHERSON SUMI 3.927686528 1.030655294 0.07032 3.857366528 0.015963178 3.742634953
BAJAJ FINANCE 4.424835449 1.202054609 0.07032 4.354515449 0.012002297 3.622560421
OFSS 2.557490789 0.780873834 0.07032 2.487170789 0.011504454 3.185112219
HERO MOTO CORP 1.936430512 0.609289733 0.07032 1.866110512 0.004893551 3.062763756
HINDUSTAN ZINC 3.780975217 1.257420921 0.07032 3.710655217 0.018424933 2.951004835
ULTRA TECH CEMENT 3.065016759 1.030900531 0.07032 2.994696759 0.00826945 2.904932792
KOTAK MAHINDRA 3.98555782 1.490407195 0.07032 3.91523782 0.006591181 2.62695848
VEDANTA 3.892685168 1.500592035 0.07032 3.822365168 0.021478599 2.547238077
AXIS 3.448379394 1.393530211 0.07032 3.378059394 0.006340188 2.424102016
BHARTI AIRTEL 1.838273755 0.763055176 0.07032 1.767953755 0.005281127 2.316940912
LIC HOUSING FINANCE 3.474300802 1.489796679 0.07032 3.403980802 0.010016139 2.28486266
BHARAT ELECTRONICS 2.365638115 1.066165894 0.07032 2.295318115 0.00968916 2.152871452
LARSEN 3.276964134 1.509290131 0.07032 3.206644134 0.005020374 2.124604188
ACC 1.964868219 0.900389661 0.07032 1.894548219 0.005962502 2.104142576
SIEMENS 3.09837087 1.497617725 0.07032 3.02805087 0.009062256 2.021911747
AMBUJA CEMENT 1.918553357 0.935018772 0.07032 1.848233357 0.005128092 1.976680482
TATA MOTORS 2.845709113 1.459165373 0.07032 2.775389113 0.00775053 1.902038771
WIPRO 1.483269027 0.787351949 0.07032 1.412949027 0.006042256 1.794558365
SBI 2.238305979 1.232359113 0.07032 2.167985979 0.006165506 1.759216089
RELIANCE 1.891337368 1.049073404 0.07032 1.821017368 0.003783903 1.735834081
INFOSYS 1.832829193 1.044335965 0.07032 1.762509193 0.003682944 1.68768409
IOC 1.374214676 0.881188824 0.07032 1.303894676 0.010705012 1.479699515
ICICI 2.325633896 1.526522055 0.07032 2.255313896 0.004797412 1.477419791
ONGC 1.267361301 0.970491274 0.07032 1.197041301 0.004422122 1.2334385
COAL INDIA 0.925127785 0.752528511 0.07032 0.854807785 0.004242523 1.135914152
INTERCONTINENTAL JOURNAL OF BANKING, INSURANCE AND FINANCEISSN:2350-0875 -ONLINE ISSN:2350-0867 -PRINT - IMPACT FACTOR:0.432VOLUME 2, ISSUE 10, OCTOBER 2015
www.researchscripts.org 26 [email protected]
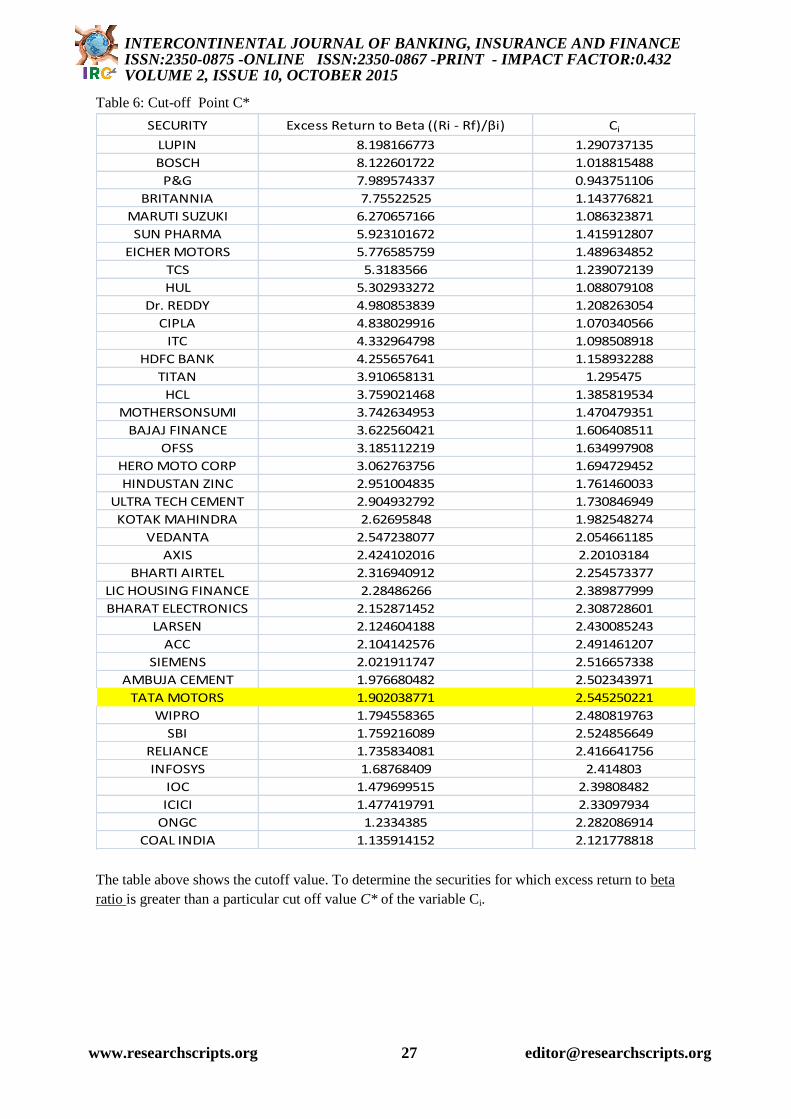
Table 6: Cut-off Point C*
SECURITY Excess Return to Beta ((Ri - Rf)/βi) Ci
LUPIN 8.198166773 1.290737135
BOSCH 8.122601722 1.018815488
P&G 7.989574337 0.943751106
BRITANNIA 7.75522525 1.143776821
MARUTI SUZUKI 6.270657166 1.086323871
SUN PHARMA 5.923101672 1.415912807
EICHER MOTORS 5.776585759 1.489634852
TCS 5.3183566 1.239072139
HUL 5.302933272 1.088079108
Dr. REDDY 4.980853839 1.208263054
CIPLA 4.838029916 1.070340566
ITC 4.332964798 1.098508918
HDFC BANK 4.255657641 1.158932288
TITAN 3.910658131 1.295475
HCL 3.759021468 1.385819534
MOTHERSONSUMI 3.742634953 1.470479351
BAJAJ FINANCE 3.622560421 1.606408511
OFSS 3.185112219 1.634997908
HERO MOTO CORP 3.062763756 1.694729452
HINDUSTAN ZINC 2.951004835 1.761460033
ULTRA TECH CEMENT 2.904932792 1.730846949
KOTAK MAHINDRA 2.62695848 1.982548274
VEDANTA 2.547238077 2.054661185
AXIS 2.424102016 2.20103184
BHARTI AIRTEL 2.316940912 2.254573377
LIC HOUSING FINANCE 2.28486266 2.389877999
BHARAT ELECTRONICS 2.152871452 2.308728601
LARSEN 2.124604188 2.430085243
ACC 2.104142576 2.491461207
SIEMENS 2.021911747 2.516657338
AMBUJA CEMENT 1.976680482 2.502343971
TATA MOTORS 1.902038771 2.545250221
WIPRO 1.794558365 2.480819763
SBI 1.759216089 2.524856649
RELIANCE 1.735834081 2.416641756
INFOSYS 1.68768409 2.414803
IOC 1.479699515 2.39808482
ICICI 1.477419791 2.33097934
ONGC 1.2334385 2.282086914
COAL INDIA 1.135914152 2.121778818
The table above shows the cutoff value. To determine the securities for which excess return to beta
ratio is greater than a particular cut off value C* of the variable Ci.
INTERCONTINENTAL JOURNAL OF BANKING, INSURANCE AND FINANCEISSN:2350-0875 -ONLINE ISSN:2350-0867 -PRINT - IMPACT FACTOR:0.432VOLUME 2, ISSUE 10, OCTOBER 2015
www.researchscripts.org 27 [email protected]
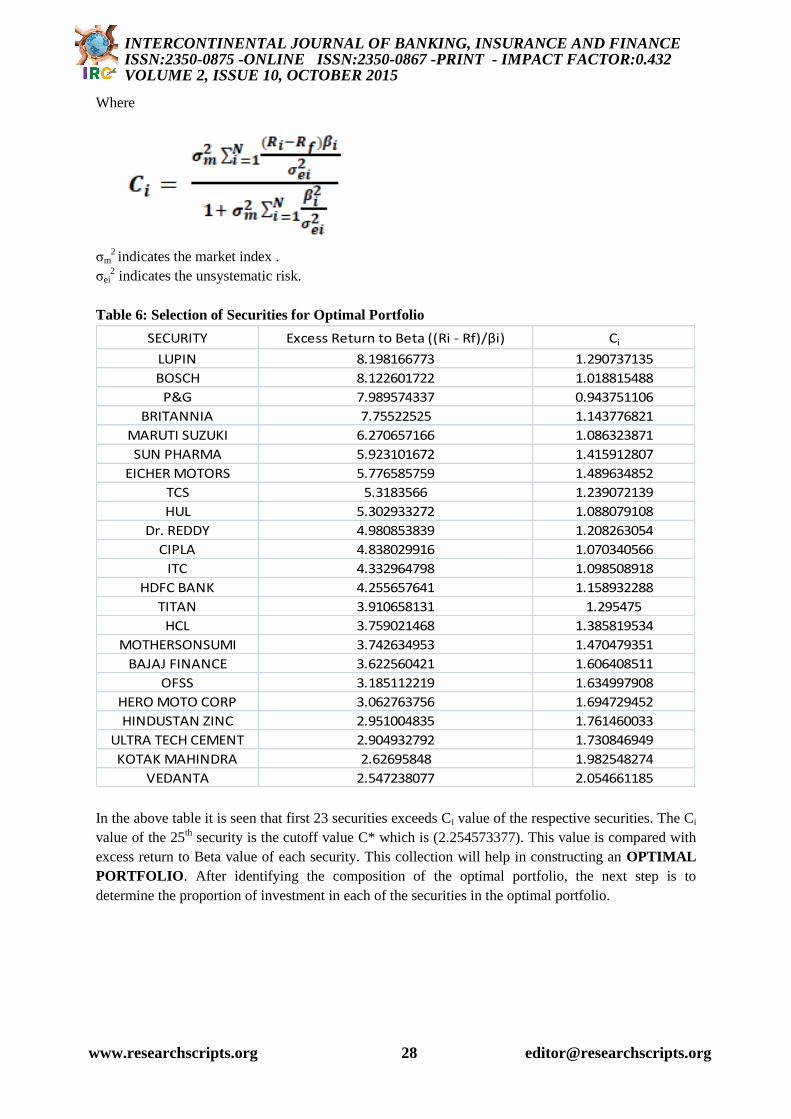
Where
σm
2 indicates the market index .
σei2 indicates the unsystematic risk.
Table 6: Selection of Securities for Optimal Portfolio
SECURITY Excess Return to Beta ((Ri - Rf)/βi) Ci
LUPIN 8.198166773 1.290737135
BOSCH 8.122601722 1.018815488
P&G 7.989574337 0.943751106
BRITANNIA 7.75522525 1.143776821
MARUTI SUZUKI 6.270657166 1.086323871
SUN PHARMA 5.923101672 1.415912807
EICHER MOTORS 5.776585759 1.489634852
TCS 5.3183566 1.239072139
HUL 5.302933272 1.088079108
Dr. REDDY 4.980853839 1.208263054
CIPLA 4.838029916 1.070340566
ITC 4.332964798 1.098508918
HDFC BANK 4.255657641 1.158932288
TITAN 3.910658131 1.295475
HCL 3.759021468 1.385819534
MOTHERSONSUMI 3.742634953 1.470479351
BAJAJ FINANCE 3.622560421 1.606408511
OFSS 3.185112219 1.634997908
HERO MOTO CORP 3.062763756 1.694729452
HINDUSTAN ZINC 2.951004835 1.761460033
ULTRA TECH CEMENT 2.904932792 1.730846949
KOTAK MAHINDRA 2.62695848 1.982548274
VEDANTA 2.547238077 2.054661185
In the above table it is seen that first 23 securities exceeds Ci value of the respective securities. The Ci
value of the 25th security is the cutoff value C* which is (2.254573377). This value is compared with
excess return to Beta value of each security. This collection will help in constructing an OPTIMAL
PORTFOLIO. After identifying the composition of the optimal portfolio, the next step is to
determine the proportion of investment in each of the securities in the optimal portfolio.
INTERCONTINENTAL JOURNAL OF BANKING, INSURANCE AND FINANCEISSN:2350-0875 -ONLINE ISSN:2350-0867 -PRINT - IMPACT FACTOR:0.432VOLUME 2, ISSUE 10, OCTOBER 2015
www.researchscripts.org 28 [email protected]

TABLE 7: Investment Proportion Xi
SECURITY Xi in %
LUPIN 10.58%
SUN PHARMA 9.84%
P&G 8.62%
BRITANNIA 8.50%
BOSCH 7.91%
HDFC BANK 5.70%
Dr. REDDY 5.68%
EICHER MOTORS 5.58%
HUL 4.95%
TCS 4.83%
ITC 4.82%
CIPLA 4.03%
MARUTI SUZUKI 3.74%
TITAN 3.66%
HCL 2.74%
BAJAJ FINANCE 2.48%
MOTHERSONSUMI 1.77%
HERO MOTO CORP 1.48%
ULTRA TECH CEMENT 1.03%
OFSS 1.00%
HINDUSTAN ZINC 0.64%
KOTAK MAHINDRA 0.43%
VEDANTA 0.00%
In the above table it is seen that proportion of Investment for the selected securities in the Optimal
Portfolio of stocks viz Lupin, Sun Pharma, P&G, Britannia, Bosch, HDFC Bank, Dr.Reddy, Eicher
Motors, HUL, TCS, ITC, Cipla, Maruti Suzuki, Titan, HCL, Bajaj Finance, Motherson Sumi, Hero
Moto Corp, Ultratech, OFSS, Hindustan Zinc, Kotak Mahindra, Vedanta are 10.58%, 9.84%, 8.62%,
8.50%,7.91% and so on. This proportion of stocks in the composition of optimal portfolio can be
shown in the following Pie diagram
Return on Portfolio
Rp= ∑i=1N(Ri*Wi)
INTERCONTINENTAL JOURNAL OF BANKING, INSURANCE AND FINANCEISSN:2350-0875 -ONLINE ISSN:2350-0867 -PRINT - IMPACT FACTOR:0.432VOLUME 2, ISSUE 10, OCTOBER 2015
www.researchscripts.org 29 [email protected]

TABLE 8: Return on Portfolio
SECURITY Ri WI Ri*Wi
LUPIN 3.867658789 10.57989969 40.91944201
SUN PHARMA 3.178414425 9.843712937 31.2873992
P&G 2.712977971 8.616346216 23.37595747
BRITANNIA 3.186850036 8.499854055 27.0877602
BOSCH 2.592949476 7.913968534 20.52052056
HDFC BANK 2.816122658 5.697106551 16.04375084
Dr. REDDY 2.838340963 5.681285903 16.1254265
EICHER MOTORS 5.053075452 5.577560653 28.18383481
HUL 2.231584406 4.950218662 11.04683077
TCS 2.457715087 4.828616932 11.86736468
ITC 2.096705145 4.81573338 10.09717295
CIPLA 2.05792437 4.034389685 8.302468853
MARUTI SUZUKI 2.825647176 3.736340241 10.55757925
TITAN 4.049813904 3.658273155 14.81532549
HCL 2.994584271 2.743779543 8.216479064
BAJAJ FINANCE 4.424835449 2.476973883 10.96020185
MOTHERSONSUMI 3.927686528 1.774761744 6.970707793
HERO MOTO CORP 1.936430512 1.479567228 2.865079125
ULTRA TECH CEMENT 3.065016759 1.029795015 3.156338979
OFSS 2.557490789 0.997195736 2.550318909
HINDUSTAN ZINC 3.780975217 0.635917003 2.404386427
KOTAK MAHINDRA 3.98555782 0.425175619 1.694562012
VEDANTA 3.892685168 0.003527637 0.013731982
309.0626397
From the above table it seen that the portfolio return is higher than the average returns of the
individual stocks in the optimal portfolio with the exception of Hindustan Zinc, Kotak Mahindra,
Vedanta.
Findings
It is observed that the Sharpe‟s Single Index model gives an easy mechanism of constructing
an optimal portfolio of stocks for a rational investor by analyzing the reason behind the
inclusion of securities in the portfolio with their respective weights.
From the study, it is observed that only 23 securities out of 40 sampled securities are
allowed to be included in the optimal portfolio using the steps behind its construction under
SIM.
LUPIN has the highest excess return to Beta of 8.18% and VEDANTA has the lowest return
of 2.54%.
If the investor wants to earn a maximum return without considering the risk aspect then
investment can be made on those securities which yield high returns. Even though the return
is high, the risk involved in the stock return should be considered while taking investment
decisions.
The risk can be reduced if the portfolio is diversified. The point of diversity is to achieve a
given level of expected return while bearing the least possible risk.
INTERCONTINENTAL JOURNAL OF BANKING, INSURANCE AND FINANCEISSN:2350-0875 -ONLINE ISSN:2350-0867 -PRINT - IMPACT FACTOR:0.432VOLUME 2, ISSUE 10, OCTOBER 2015
www.researchscripts.org 30 [email protected]
The return from VEDANTA security has the highest beta value of 1.5 which means that it is
highly volatile & a minimum amount should be invested i.e. 0035%.
7 companies out of 40 INCLUDED IN THE PORTFOLIO have the beta values greater than 1
which means that they are also volatile.
The excess return to beta ratio measures the additional return on a security per unit of
systematic risk. This ratio provides the relationship between potential risk and reward
involved in a security's return.
As per the calculation the return on portfolio and the risk on portfolio is
Rp= 309.062 and σp= 95.96.
Risk takers will select this portfolio because having maximum risk it yields 3 times more
return.
Conclusion
Stock markets are more volatile and investment in the stock market depends on the investor‟s
knowledge and reaction to various market factors like GDP, inflation, exchange rate fluctuations,
monetary policies, government policies, etc. Investors always expect higher return on their investment
made in the stock market as compared to riskless securities. Portfolio construction is beneficial in
diversifying risk rather than holding a single stock. An optimal portfolio is efficient when all the risk
is diversified. Investors should hold a portfolio of stocks to minimize their risk and maximize their
return. The above study conducted on the construction of optimal portfolio of stocks by using Sharpe
index model would guide the investors in their investment decisions. Investors can make use of this
study in deciding the stocks to be included in their portfolio as well as they can also determine the
required proportion to be invested in each stock. The study is further left to the coming generation of
the financial world to undertake researches and develop new theories and models to the portfolio
management.
Reference
Fundamentals of Investment by Alexander & Sharpe.
www.wikipedia.com
www.bseindia.com
www.moneycontrol.com
Journal by Great Lakes Herald
International Journal of Financial management.
International Journal of Advanced Research in ISSN: 2278-6236 Management and Social
Sciences
INTERCONTINENTAL JOURNAL OF BANKING, INSURANCE AND FINANCEISSN:2350-0875 -ONLINE ISSN:2350-0867 -PRINT - IMPACT FACTOR:0.432VOLUME 2, ISSUE 10, OCTOBER 2015
www.researchscripts.org 31 [email protected]