Embed Size (px)
Citation preview

JHEP07(2013)167
Published for SISSA by Springer
Received: April 5, 2013
Revised: June 12, 2013
Accepted: July 3, 2013
Published: July 29, 2013
Constraints on the gluon PDF from top quark pair
production at hadron colliders
Michal Czakon,a Michelangelo L. Mangano,b Alexander Mitovb and Juan Rojob
aInstitut fur Theoretische Teilchenphysik und Kosmologie,
RWTH Aachen University, D-52056 Aachen, GermanybPhysics Department, Theory Unit, CERN,
CH-1211 Geneve, Switzerland
E-mail: [email protected], [email protected],
[email protected], [email protected]
Abstract: Using the recently derived NNLO cross sections [1], we provide NNLO+NNLL
theoretical predictions for top quark pair production based on all the available NNLO
PDF sets, and compare them with the most precise LHC and Tevatron data. In this
comparison we study in detail the PDF uncertainty and the scale, mt and αs dependence
of the theoretical predictions for each PDF set. Next, we observe that top quark pair
production provides a powerful direct constraint on the gluon PDF at large x, and include
Tevatron and LHC top pair data consistently into a global NNLO PDF fit. We then explore
the phenomenological consequences of the reduced gluon PDF uncertainties, by showing
how they can improve predictions for Beyond the Standard Model processes at the LHC.
Finally, we update to full NNLO+NNLL the theoretical predictions for the ratio of top
quark cross sections between different LHC center of mass energies, as well as the cross
sections for hypothetical heavy fourth-generation quark production at the LHC.
Keywords: QCD Phenomenology, Hadronic Colliders
ArXiv ePrint: 1303.7215
Open Access doi:10.1007/JHEP07(2013)167

JHEP07(2013)167
Contents
1 Introduction 1
2 Settings 3
3 The top cross-section: measurements, predictions and uncertainties 4
3.1 Comparison between the various PDF sets 5
3.2 Uncertainty due to the value of mt 8
3.3 Uncertainty due to the value of αs 9
4 Top quark data constraints on the gluon PDF 10
4.1 Impact on predictions for BSM particle production 14
5 Cross-section ratios between different LHC beam energies 16
6 Hypothetical fourth-generation heavy quark production at the LHC 19
7 Summary and outlook 20
1 Introduction
The total tt production cross section is an important observable at hadron colliders, which
has been recently computed in full next-to-next-to leading order (NNLO) QCD [1–4].
Thanks to a much improved control over higher order terms, including soft gluon emissions
through next-to-next-to leading log (NNLL) [5–7], scale uncertainties are now controlled
down to the 2.2 (3) percent level at the Tevatron (LHC), enabling a number of precision
phenomenology applications to SM and BSM physics.
In this work we present an in-depth study of the theoretical uncertainties that affect
the total cross section computed with NNLO+NNLL precision. These uncertainties are
the parton distributions of the proton, the value of the strong coupling αs(MZ), the value
of the top quark mass mt and the scale uncertainties from missing higher perturbative
orders. We then compare the theoretical predictions with the most precise available data
from the Tevatron and the LHC at 7 and 8TeV. We also provide predictions for LHC
at 14TeV, as well as for the ratio of cross sections between 7, 8 and 14TeV and for the
production of heavy top-like fermions. Previous phenomenological studies of the total
tt cross sections, based on different approximations to the full NNLO calculation were
presented in refs. [7–17].
As a first phenomenological application of the full NNLO calculation we study the im-
pact of top quark cross section data in the parton distribution analysis. Indeed, top quark
production is directly sensitive to the large-x gluon PDF, which at present is affected by
– 1 –

JHEP07(2013)167
TeVatron LHC 7TeV LHC 8TeV LHC 14TeV
gg 15.4% 84.8% 86.2% 90.2%
qg + qg -1.7% -1.6% -1.1% 0.5%
qq 86.3% 16.8% 14.9% 9.3%
Table 1. The relative contribution of the various partonic sub-channels to the NNLO+NNLL cross
section for different colliders and collider energies, computed with the MSTW2008NNLO PDFs.
We loosely label with qq the sum of all processes without gluons in the initial state.
substantial uncertainties. In turn, large-x gluons play an important role in theoretical pre-
dictions of many BSM scenarios like gluino pair production [18], high-mass Kaluza-Klein
graviton production [19–21], resonances in the tt invariant mass spectrum [22, 23], quark
compositeness in inclusive jet and dijet production [24–27] and many others. The avail-
ability of the full NNLO calculation makes top quark pair production the only hadron
collider process that is both sensitive to the gluon and can be consistently included in
a NNLO PDF fit without any approximations. Hadronic constraints on the gluon PDF
are provided also by inclusive jet and dijet production [28–31] and isolated photon produc-
tion [32, 33], though these two processes are only known to NLO and affected by substantial
scale uncertainties.1
The focus of this paper is, on the one hand, to provide an up-to-date summary of
the theoretical uncertainties on the total tt cross section, and on the other hand, to show
how top quark data can be used to constrain the large-x gluon PDF. Indeed, unlike the
Tevatron, top quark pair production at the LHC is dominated by gg scattering, thus
providing a complementary probe of the gluon PDF. As shown in table 1, at the LHC the
relative contribution of the gg subprocess is between 85% and 90% depending on the beam
energy, with qq being about 10-15%, almost the opposite of the Tevatron.
To illustrate the range of Bjorken-x’s to which the top cross section is sensitive, the
correlation [35] between the top quark production cross section and the gluon and the up
quark PDFs is shown in figure 1 for the various cases that we will discuss in the paper:
Tevatron Run II, LHC 7, 8 and 14TeV. A correlation whose absolute magnitude is close
to 1 indicates that variations of PDFs with a particular value of x will in turn translate
into cross-section variations. It is clear from figure 1 that for the LHC the top quark cross
section directly probes the gluon in the range of x between x = 0.1 and x = 0.5, where
gluon PDF uncertainties are relatively large.
The outline of this paper is as follows. In section 2 we discuss the settings of the
calculation and the treatment of the various theoretical uncertainties. In section 3 we
provide up-to-date predictions for the tt cross section at the Tevatron and LHC and compare
with the most recent experimental data. In section 4 we quantify the impact of the available
top data on the gluon PDF, show how it reduces the gluon PDF’s large-x uncertainties,
and study the phenomenological consequences of this improvement. In section 5 we provide
up-to-date predictions for the ratio of top quark cross sections between 7, 8 and 14TeV
and in section 6 we provide predictions for a heavy top-like fermion T .
– 2 –

JHEP07(2013)167
x -410 -310 -210 -110 1
Cor
rela
tion
coef
ficie
nt
-1
-0.5
0
0.5
1
TeVatron
LHC 7 TeV
LHC 8 TeV
LHC 14 TeV
TeVatron
LHC 7 TeV
LHC 8 TeV
LHC 14 TeV
TeVatron
LHC 7 TeV
LHC 8 TeV
LHC 14 TeV
TeVatron
LHC 7 TeV
LHC 8 TeV
LHC 14 TeV
) )top
(tt), g( x,Q=mσ( ρ
NNPDF2.3 NNLO
Correlation between PDFs and Cross-Section
x -410 -310 -210 -110 1
Cor
rela
tion
coef
ficie
nt
-1
-0.5
0
0.5
1
TeVatron
LHC 7 TeV
LHC 8 TeV
LHC 14 TeV
TeVatron
LHC 7 TeV
LHC 8 TeV
LHC 14 TeV
TeVatron
LHC 7 TeV
LHC 8 TeV
LHC 14 TeV
TeVatron
LHC 7 TeV
LHC 8 TeV
LHC 14 TeV
) )top
(tt), u( x,Q=mσ( ρ
NNPDF2.3 NNLO
Correlation between PDFs and Cross-Section
Figure 1. The correlation between the gluon PDF (left plot) and the up quark PDF (right
plot) from NNPDF2.3 with the total NNLO+NNLL top quark production cross sections at the
Tevatron and the LHC for different center of mass energies. The correlations are computed for
Q = mt = 173.3GeV.
2 Settings
In the following we present the settings of the computation. We use the program Top++,
v2.0 [36] to evaluate the total top quark production cross section at NNLO+NNLL accu-
racy. We use as input the most up-to-date NNLO PDF sets from each PDF collaboration:
ABM11 [37], CT10 [38], HERAPDF1.5 [39], JR09 [40] MSTW08 [41] and NNPDF2.3 [42].
The value of αs(MZ) is set to the preferred value of each group, respectively 0.1134, 0.118,
0.1176, 0.120, 0.1171 and 0.118. For NNPDF2.3 we use the set with a maximum of Nf = 5
active flavors. When providing the predictions for each PDF set, we will use the default
αs in each case, while later in section 3.3 we will explore the dependence of the results on
the strong coupling as αs is varied. A detailed benchmark comparison of these five NNLO
PDF sets was recently presented in [43], where the similarities and differences between each
of the five sets are discussed.
We consider the following sources of theoretical uncertainties in the top quark pair
production cross section:
• Higher perturbative orders.
The central scales of the NNLO+NNLL computation are set to µR = µF = mt. As
customary, we explore the effect of missing higher perturbative orders by varying the
scales independently by a factor of two upwards and downwards, with the constraint
that the ratio of the two scales can never be larger than two. The envelope of the
resulting cross section defines the scale uncertainty of the computation. As shown in
ref. [1], scale variations at the LHC with the full NNLO+NNLL result are substan-
tially smaller that with the NLO or previous approximated NNLO computations.
• Parton Distributions.
We use the corresponding prescription from each group to provide the 68% confidence
level PDF uncertainties. For the Hessian sets, we use the asymmetric expression
for PDF uncertainties [44]. The CT10 errors are rescaled by a factor 1.642 since
– 3 –

JHEP07(2013)167
they are provided as 90% CL. In the case of HERAPDF1.5, we consider only the
experimental uncertainties, but not the model and parametrization uncertainties.2
Parton distributions are accessed through the LHAPDF interface, version 5.8.9 [48].
• Strong coupling constant.
We assume the 68% CL uncertainty on αs(MZ) to be ∆αs = 0.0007, as indicated by
the 2012 PDG average [45]. For each PDF set, we add in quadrature PDF and αs
uncertainties, except for ABM11 and JR09, where αs errors are already part of the
total PDF uncertainty, and thus we avoid double counting. For Hessian PDF sets
the addition in quadrature of PDF and αs uncertainties is known to be exact [46],
while for Monte Carlo sets it is a good approximation [47]. The slope of the cross
section with αs for each PDF set is extracted from a linear fit in a common range
of αs(MZ) between 0.116 and 0.120, close to the PDG average and where all PDF
groups provide predictions.
• Top quark mass.
We take as central value mt = 173.3GeV, with an uncertainty of ∆mt = ±1GeV.
This is consistent both with the latest Tevatron average,3 mt = 173.20 ± 0.87GeV,
as well as with the 2012 PDG average [45] of the top quark mass mt = 173.5 ±0.6± 0.8GeV. These masses are to be understood as pole masses. To determine the
top-mass related uncertainty δmt of the top cross section, we compute the central
value of the cross-section for top masses in a 1GeV range around the central value
mt = 173.3.
Following the recommendations of the Higgs Cross section Working Group [50] re-
garding theoretical uncertainties, we adopt the most conservative method to combine
them: we add all parametric uncertainties (PDFs, αs and mt) in quadrature and then
the total parametric error is added linearly to the scale uncertainty to define the total
theoretical uncertainty.
3 The top cross-section: measurements, predictions and uncertainties
With the settings detailed in the previous section, we have computed the cross sections for
the Tevatron and the LHC and their associated uncertainties. The most precise experi-
mental measurements of the top cross section are collected in table 2, while the theoretical
predictions are collected in tables 3 to 6. In each case, we provide the NNLO+NNLL
predictions for the total top quark cross section, for all the PDFs considered, and with the
various sources of theoretical uncertainties. The default value of αs(MZ) from each PDF
set has been used in the computation of the central predictions. Also included in these
tables are the best available experimental measurements at the various colliders.
2If the HERAPDF1.5 uncertainties for the tt cross section include the model and parametrization un-
certainties the total PDF uncertainty increases to about 20% [43].3See [49], and the update prepared for the 2013 Rencontres de Moriond QCD, presented by G. Petrillo.
– 4 –
JHEP07(2013)167
Measurement σtt (pb) stat. (pb) sys. (pb) lumi. (pb) total (pb)
Tevatron CDF+D0 (Ref. [51]) 7.65 ± 0.20 ± 0.29 ± 0.22 7.65± 0.42 (5.5%)
Atlas 7TeV (Ref. [52]) 177 ± 3 +8−7 ± 7 177+10
−11(+5.6%)
(−6.2%)
CMS 7TeV (Ref. [53]) 160.9 ± 2.5 +5.1−5.0 ± 3.6 160.9± 6.6 (4.0%)
Atlas 8TeV (Ref. [54]) 241 ± 2 ± 31 ± 9 241± 32 (13.0%)
CMS 8TeV (Refs. [55, 56]) 227 ± 3 ± 11 ± 10 227± 15 (6.7%)
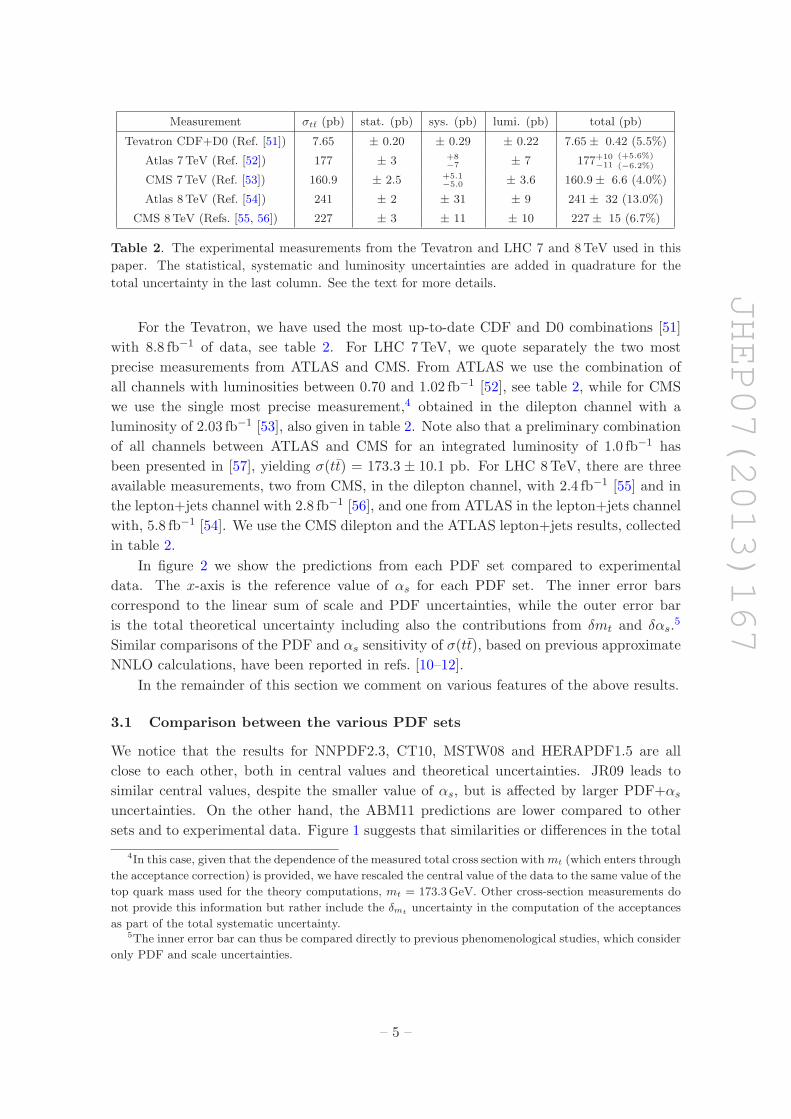
Table 2. The experimental measurements from the Tevatron and LHC 7 and 8TeV used in this
paper. The statistical, systematic and luminosity uncertainties are added in quadrature for the
total uncertainty in the last column. See the text for more details.
For the Tevatron, we have used the most up-to-date CDF and D0 combinations [51]
with 8.8 fb−1 of data, see table 2. For LHC 7TeV, we quote separately the two most
precise measurements from ATLAS and CMS. From ATLAS we use the combination of
all channels with luminosities between 0.70 and 1.02 fb−1 [52], see table 2, while for CMS
we use the single most precise measurement,4 obtained in the dilepton channel with a
luminosity of 2.03 fb−1 [53], also given in table 2. Note also that a preliminary combination
of all channels between ATLAS and CMS for an integrated luminosity of 1.0 fb−1 has
been presented in [57], yielding σ(tt) = 173.3 ± 10.1 pb. For LHC 8TeV, there are three
available measurements, two from CMS, in the dilepton channel, with 2.4 fb−1 [55] and in
the lepton+jets channel with 2.8 fb−1 [56], and one from ATLAS in the lepton+jets channel
with, 5.8 fb−1 [54]. We use the CMS dilepton and the ATLAS lepton+jets results, collected
in table 2.
In figure 2 we show the predictions from each PDF set compared to experimental
data. The x-axis is the reference value of αs for each PDF set. The inner error bars
correspond to the linear sum of scale and PDF uncertainties, while the outer error bar
is the total theoretical uncertainty including also the contributions from δmt and δαs.5
Similar comparisons of the PDF and αs sensitivity of σ(tt), based on previous approximate
NNLO calculations, have been reported in refs. [10–12].
In the remainder of this section we comment on various features of the above results.
3.1 Comparison between the various PDF sets
We notice that the results for NNPDF2.3, CT10, MSTW08 and HERAPDF1.5 are all
close to each other, both in central values and theoretical uncertainties. JR09 leads to
similar central values, despite the smaller value of αs, but is affected by larger PDF+αs
uncertainties. On the other hand, the ABM11 predictions are lower compared to other
sets and to experimental data. Figure 1 suggests that similarities or differences in the total
4In this case, given that the dependence of the measured total cross section withmt (which enters through
the acceptance correction) is provided, we have rescaled the central value of the data to the same value of the
top quark mass used for the theory computations, mt = 173.3GeV. Other cross-section measurements do
not provide this information but rather include the δmtuncertainty in the computation of the acceptances
as part of the total systematic uncertainty.5The inner error bar can thus be compared directly to previous phenomenological studies, which consider
only PDF and scale uncertainties.
– 5 –

JHEP07(2013)167
Tevatron Run II
PDF set σtt (pb) δscale (pb) δPDF (pb) δαs(pb) δmt
(pb) δtot (pb)
ABM11 6.869 +0.104−0.174
(+1.5%)
(−2.5%)+0.157−0.157
(+2.3%)
(−2.3%)+0.000−0.000
(+0.0%)
(−0.0%)+0.207−0.201
(+3.0%)
(−2.9%)+0.364−0.429
(+5.3%)
(−6.2%)
CT10 7.395 +0.116−0.210
(+1.6%)
(−2.8%)+0.270−0.203
(+3.6%)
(−2.7%)+0.136−0.136
(+1.8%)
(−1.8%)+0.235−0.227
(+3.2%)
(−3.1%)+0.499−0.544
(+6.7%)
(−7.4%)
HERA1.5 7.624 +0.116−0.074
(+1.5%)
(−1.0%)+0.134−0.154
(+1.8%)
(−2.0%)+0.098−0.098
(+1.3%)
(−1.3%)+0.241−0.233
(+3.2%)
(−3.1%)+0.409−0.370
(+5.4%)
(−4.9%)
JR09 7.174 +0.099−0.054
(+1.4%)
(−0.8%)+0.326−0.326
(+4.6%)
(−4.6%)+0.000−0.000
(+0.0%)
(−0.0%)+0.215−0.211
(+3.0%)
(−2.9%)+0.490−0.443
(+6.8%)
(−6.2%)
MSTW08 7.164 +0.110−0.200
(+1.5%)
(−2.8%)+0.169−0.122
(+2.4%)
(−1.7%)+0.088−0.088
(+1.2%)
(−1.2%)+0.228−0.220
(+3.2%)
(−3.1%)+0.391−0.475
(+5.5%)
(−6.6%)
NNPDF2.3 7.258 +0.117−0.202
(+1.6%)
(−2.8%)+0.121−0.121
(+1.7%)
(−1.7%)+0.090−0.090
(+1.2%)
(−1.2%)+0.229−0.221
(+3.1%)
(−3.0%)+0.390−0.469
(+5.4%)
(−6.5%)
CDF+D0 7.65 ± 0.42 ( 5.5%)
Table 3. The NNLO+NNLL predictions for the total top quark pair cross-section at the Tevatron
Run II, for all the PDFs considered, and with the various sources of theoretical uncertainties. The
default value of αs(MZ) from each collaboration has been used in the computation of the central
predictions. The four theoretical uncertainties are combined into a total theory error as discussed
in the text. The lower row shows the best available experimental measurement.
cross section can be understood in terms of the large-x behavior of the gluon PDF, together
with the value of αs used by each PDF set.
The agreement between CT, HERAPDF, MSTW and NNPDF can be traced back to
(a) a similar default value of αs used and (b) a similar large-x gluon PDF [43]. On the
other hand, regarding the differences between ABM11 and the other sets, we note (a) the
smaller value of αs used by ABM11 and (b) the softer large-x gluon PDF in the region
relevant for top quark production [43]. As shown below in figure 3, using a value for αs
closer to the PDG average would improve the agreement of the ABM11 set both with other
PDF sets and with experimental data, though the ABM11 predictions at the LHC are still
lower than that of other sets even for a common αs value.
To understand the differences in the large-x gluon in ABM11 as compared to other
sets, refs. [61, 62] have suggested that the reason is that, keeping everything else fixed,
the use of a fixed-flavor number scheme in a fit to deep-inelastic data (such as ABM11)
leads to a softer large-x gluon as compared to the gluon obtained in PDF fits based on
variable-flavor number schemes [58–60]. On the other hand, the differences between the
various implementations of variable-flavor number schemes translate into much reduced
differences in the PDFs [61] and thus into the top cross sections.
In order to quantify the agreement of data and theory, in the absence of theoretical
uncertainties, we compute the χ2 for the central values of the five PDF sets under consid-
eration and for the five available data points of table 2: one for the Tevatron, two for LHC
7TeV and two for LHC 8TeV. For each of the five PDF sets studied, the χ2 is defined as
χ2 =
Ndat∑
i=1
(
σ(exp)tt
− σ(th)tt
)2
δ(exp)2tot
, (3.1)
with Ndat = 5. We consider all five data points as fully uncorrelated.6 In addition,
6This is a necessary approximation, but as discussed in [57] there is some degree of correlation between
– 6 –

JHEP07(2013)167
LHC 7TeV
PDF set σtt (pb) δscale (pb) δPDF (pb) δαs(pb) δmt
(pb) δtot (pb)
ABM11 135.8 +3.5−4.2
(+2.6%)
(−3.1%)+6.4−6.4
(+4.7%)
(−4.7%)+0.0−0.0
(+0.0%)
(−0.0%)+4.3−4.2
(+3.2%)
(−3.1%)+11.2−11.8
(+8.2%)
(−8.7%)
CT10 172.5 +4.6−6.0
(+2.7%)
(−3.5%)+8.0−6.5
(+4.6%)
(−3.8%)+3.7−3.7
(+2.2%)
(−2.2%)+5.3−5.1
(+3.1%)
(−3.0%)+14.9−15.0
(+8.6%)
(−8.7%)
HERA1.5 177.2 +4.8−4.2
(+2.7%)
(−2.3%)+4.0−6.4
(+2.3%)
(−3.6%)+3.0−3.0
(+1.7%)
(−1.7%)+5.4−5.2
(+3.1%)
(−2.9%)+12.2−12.9
(+6.9%)
(−7.3%)
JR09 167.0 +3.9−3.3
(+2.4%)
(−2.0%)+12.6−12.6
(+7.6%)
(−7.6%)+0.0−0.0
(+0.0%)
(−0.0%)+4.5−4.3
(+2.7%)
(−2.6%)+17.3−16.6
(+10.4%)
(−9.9%)
MSTW08 172.0 +4.4−5.8
(+2.6%)
(−3.4%)+4.7−4.7
(+2.7%)
(−2.7%)+2.9−2.9
(+1.7%)
(−1.7%)+5.3−5.1
(+3.1%)
(−3.0%)+12.1−13.4
(+7.0%)
(−7.8%)
NNPDF2.3 172.7 +4.6−6.0
(+2.7%)
(−3.5%)+5.2−5.2
(+3.0%)
(−3.0%)+2.7−2.7
(+1.6%)
(−1.6%)+5.3−5.2
(+3.1%)
(−3.0%)+12.5−13.7
(+7.2%)
(−8.0%)
ATLAS 177 +10−11
(+5.6%)
(−6.2%)
CMS 160.9 ± 6.6 ( 4.0%)
Table 4. Same as table 3 for LHC 7TeV.
LHC 8TeV
PDF set σtt (pb) δscale (pb) δPDF (pb) δαs(pb) δmt
(pb) δtot (pb)
ABM11 198.6 +5.0−6.2
(+2.5%)
(−3.1%)+8.5−8.5
(+4.3%)
(−4.3%)+0.0−0.0
(+0.0%)
(−0.0%)+6.1−5.9
(+3.1%)
(−3.0%)+15.5−16.6
(+7.8%)
(−8.4%)
CT10 246.3 +6.4−8.6
(+2.6%)
(−3.5%)+10.1−8.2
(+4.1%)
(−3.3%)+4.9−4.9
(+2.0%)
(−2.0%)+7.4−7.1
(+3.0%)
(−2.9%)+19.8−20.5
(+8.1%)
(−8.3%)
HERA1.5 252.7 +6.5−5.9
(+2.6%)
(−2.3%)+5.4−8.6
(+2.1%)
(−3.4%)+4.0−4.0
(+1.6%)
(−1.6%)+7.5−7.3
(+3.0%)
(−2.9%)+16.6−17.8
(+6.6%)
(−7.1%)
JR09 238.0 +2.1−4.6
(+0.9%)
(−1.9%)+15.8−15.8
(+6.6%)
(−6.6%)+0.0−0.0
(+0.0%)
(−0.0%)+6.3−6.2
(+2.7%)
(−2.6%)+19.2−21.6
(+8.1%)
(−9.1%)
MSTW08 245.8 +6.2−8.4
(+2.5%)
(−3.4%)+6.2−6.2
(+2.5%)
(−2.5%)+4.0−4.0
(+1.6%)
(−1.6%)+7.4−7.1
(+3.0%)
(−2.9%)+16.6−18.7
(+6.8%)
(−7.6%)
NNPDF2.3 248.1 +6.4−8.7
(+2.6%)
(−3.5%)+6.6−6.6
(+2.7%)
(−2.7%)+3.7−3.7
(+1.5%)
(−1.5%)+7.5−7.2
(+3.0%)
(−2.9%)+17.1−19.1
(+6.9%)
(−7.7%)
ATLAS 241.0 ± 32.0 ( 13.3%)
CMS 227.0 ± 15.0 ( 6.6%)
Table 5. Same as table 3 for LHC 8TeV.
LHC 14TeV
PDF set σtt (pb) δscale (pb) δPDF (pb) δαs(pb) δmt
(pb) δtot (pb)
ABM11 832.0 +18.7−27.4
(+2.2%)
(−3.3%)+25.1−25.1
(+3.0%)
(−3.0%)+0.0−0.0
(+0.0%)
(−0.0%)+23.3−22.5
(+2.8%)
(−2.7%)+52.9−61.1
(+6.4%)
(−7.3%)
CT10 952.8 +23.3−34.5
(+2.4%)
(−3.6%)+22.4−19.9
(+2.3%)
(−2.1%)+14.0−14.0
(+1.5%)
(−1.5%)+26.1−25.2
(+2.7%)
(−2.6%)+60.3−69.5
(+6.3%)
(−7.3%)
HERA1.5 970.5 +22.1−22.0
(+2.3%)
(−2.3%)+15.3−25.7
(+1.6%)
(−2.6%)+12.8−12.8
(+1.3%)
(−1.3%)+26.4−25.6
(+2.7%)
(−2.6%)+55.2−60.5
(+5.7%)
(−6.2%)
JR09 906.5 +16.7−17.0
(+1.8%)
(−1.9%)+35.5−35.5
(+3.9%)
(−3.9%)+0.0−0.0
(+0.0%)
(−0.0%)+24.7−23.9
(+2.7%)
(−2.6%)+60.0−59.8
(+6.6%)
(−6.6%)
MSTW08 953.6 +22.7−33.9
(+2.4%)
(−3.6%)+16.2−17.8
(+1.7%)
(−1.9%)+12.8−12.8
(+1.3%)
(−1.3%)+26.1−25.3
(+2.7%)
(−2.7%)+56.3−66.8
(+5.9%)
(−7.0%)
NNPDF2.3 977.5 +23.6−35.4
(+2.4%)
(−3.6%)+16.4−16.4
(+1.7%)
(−1.7%)+12.2−12.2
(+1.3%)
(−1.3%)+26.9−26.1
(+2.8%)
(−2.7%)+57.4−68.5
(+5.9%)
(−7.0%)
Table 6. Same as table 3 for LHC 14TeV.
to quantify the overall consistency of theoretical predictions with experimental data, we
define a pull estimator as follows,
P =1
Ndat
Ndat∑
i=1
(
σ(exp)tt
− σ(th)tt
)2
δ(exp)2tot + δ
(th)2tot
, (3.2)
the ATLAS and CMS data, as there is between LHC data at different c.m. energies.
– 7 –

JHEP07(2013)167
) Z
( MSα 0.111 0.112 0.113 0.114 0.115 0.116 0.117 0.118 0.119 0.12
(tt)
[pb]
σ
6
6.5
7
7.5
8
8.5
9
TeVatron
Tevatron Run-II
ABM11
CT10
HERAPDF
JR09
MSTW2008
NNPDF2.3
TeVatron
) Z
( MSα 0.111 0.112 0.113 0.114 0.115 0.116 0.117 0.118 0.119 0.12
(tt)
[pb]
σ
120
140
160
180
200
220
LHC 7 TeV
-1ATLAS, 1.0 fb
-1CMS, 2.3 fb
ABM11
CT10
HERAPDF
JR09
MSTW2008
NNPDF2.3
LHC 7 TeV
) Z
( MSα 0.111 0.112 0.113 0.114 0.115 0.116 0.117 0.118 0.119 0.12
(tt)
[pb]
σ
160
180
200
220
240
260
280
300
320
LHC 8 TeV
-1ATLAS, 2.3 fb
-1CMS, 1.1 fb
ABM11
CT10
HERAPDF
JR09
MSTW2008
NNPDF2.3
LHC 8 TeV
) Z
( MSα 0.111 0.112 0.113 0.114 0.115 0.116 0.117 0.118 0.119 0.12
(tt)
[pb]
σ
700
750
800
850
900
950
1000
1050
1100
LHC 14 TeV
ABM11
CT10
HERAPDF
JR09
MSTW2008
NNPDF2.3
LHC 14 TeV
Figure 2. The best predictions from each PDF set compared to experimental data, as a function
of the default αs(MZ) value. The inner error bar corresponds to the linear sum of PDF and scale
uncertainties, while the outer error bar is the total theoretical uncertainty, computed as described
in the text.
where now in the denominator we add in quadrature the experimental and theoretical total
uncertainties. For simplicity we have symmetrized the total theoretical systematic error
for each PDF set.
The results for both the χ2 and the pull are summarized in table 7. We provide both
the total χ2 and the individual contribution from the data at the Tevatron, LHC 7 and
8TeV. As we can see, most PDF sets provide a good description of the total top quark
cross section data, with χ2/Ndat ∼ 1. The pull also shows the good consistency between
experimental data and theory prediction for most of the PDF sets considered.
3.2 Uncertainty due to the value of mt
The uncertainty on the value of the top quark mass is now a substantial fraction of the
overall systematic uncertainty in the total tt cross section. In table 8 we compare, for the
NNPDF2.3 set, the total theory uncertainty with and without including the uncertainty
due to the top quark mass. We see that at the LHC, an uncertainty of δmt = ±1GeV
translates into an increase between 1 and 1.5% of the total theory uncertainty, and into a
somewhat larger increase at the Tevatron. Given that PDFs, scale and mt uncertainties
are all now of similar size, the total theory error would be only slightly reduced if one
assumed that the uncertainty due to mt could be completely neglected, for example after
more precise measurements of this parameter at the LHC.
– 8 –

JHEP07(2013)167
χ2tev χ2
lhc7 χ2lhc8 χ2
tot χ2tot/Ndat P
AMB11 3.5 31.4 5.3 40.2 8.0 3.2
CT10 0.4 3.3 1.7 5.3 1.1 0.3
HERAPDF15 0.0 6.1 3.1 9.2 1.8 0.5
MSTW08 1.3 3.1 1.6 6.0 1.2 0.4
NNPDF2.3 0.9 3.4 2.0 6.3 1.3 0.4
Table 7. The χ2 between data and theory, eq. (3.1), for all the five PDF sets, both for the total
dataset and split into colliders. Let us recall that the standard deviation of the χ2 distribution for
Ndat = 5 data points is√2Ndat = 3.1. The last column show the pull eq. (3.2) between experimental
data and theory predictions.
Collider σtt (pb) δPDF+scales+αs (pb) δtot (pb)
Tevatron 7.258 +0.267−0.352
(+3.7%)(−4.9%)
+0.390−0.469
(+5.4%)(−6.5%)
LHC 7TeV 172.7 +10.4−11.8
(+6.0%)(−6.8%)
+12.5−13.7
(+7.2%)(−8.0%)
LHC 8TeV 248.1 +14.0−16.2
(+5.6%)(−6.5%)
+17.1−19.1
(+6.9%)(−7.7%)
LHC 14TeV 977.5 +44.1−55.8
(+4.5%)(−5.7%)
+57.4−68.5
(+5.9%)(−7.0%)
Table 8. The NNLO+NNLL predictions for the total top quark pair cross-section at the Tevatron
and the LHC, with NNPDF2.3 as input. The third column shows the theoretical uncertainty when
δmt is not taken into account, while the last column is the total theoretical uncertainty (the same
as in tables 3 to 6). At the LHC, an uncertainty of δmt = ±1GeV translates into an increase
between 1 and 1.5% of the total theory uncertainty, and a bit more at the Tevatron.
3.3 Uncertainty due to the value of αs
In figure 3 we show the dependence with αs(MZ) of the NNLO+NNLL cross sections for
each of the various PDF sets.7 We use consistently the same value of αs(MZ) in the
partonic cross sections and in the PDFs, using all the range of varying αs PDFs provided
by each group. We also include for reference the best experimental data. The slope with
αs is similar for each of the PDF sets. One can see that a variation of ∆αs by 0.001
increases the cross section by about 0.13 pb (∼ 1.8%) at the Tevatron, 4 pb (∼ 2.3%) at
LHC 7TeV, 6 pb (∼ 2.4%) at 8TeV and 20 pb (∼ 2.0%) at 14TeV, with small differences
between PDF sets.
It is also worth noticing that the αs dependence of the total cross section reported
in our tables is slightly larger than what one would naively estimate based on the power
counting of the partonic cross section. The reason is that, in the range of x relevant for
top quark production, the value of the gluon density is larger for PDF fits with a larger
αs. This is shown in figure 4, for the specific case of NNPDF2.3, but the behavior is
similar for other sets: larger αs leads to smaller g(x) in the small/medium-x region that
is controlled by deep-inelastic HERA data, while DGLAP evolution and the momentum
7Except for the case of JR09, where no varying-αs PDF sets are provided.
– 9 –

JHEP07(2013)167
sum rule balance this reduction with an increase at larger x. In figure 4 we also show the
corresponding plot for the case of the up quark density, relevant at the Tevatron. In this
case the correlation with αs is rather less marked and of opposite trend as in the case of
the gluon.
The net effect of the positive correlation between the gluon PDF and αs at large-x
is an enhanced sensitivity to αs of the tt cross section, about 20% larger than what one
would have obtained by keeping the PDFs fixed while changing only αs in the partonic
matrix element.8 This fact, together with the small, 2-3%, scale uncertainty of the full
NNLO+NNLL result, suggest that the top production cross section could provide a useful
independent determination of αs(MZ). Such extraction would be analogous to the deter-
minations of mt from the same total cross section [15–17, 63–65]. The strong coupling can
also be determined at the Tevatron and the LHC from jet production [66–68], but results
are affected by sizable scale uncertainties from the lack of a complete NNLO calculation
as well as by non-perturbative corrections. A first determination of αs from the tt cross
section, using previous approximate NNLO predictions, has been performed by the CMS
Collaboration [69].
4 Top quark data constraints on the gluon PDF
The gluon PDF is one of the worse known partonic distributions. Deep-inelastic data
constrain the gluon only indirectly, via scaling violations, and direct information comes only
from collider inclusive jet production data [28–31]. Recently, the use of isolated photon data
has also been advocated to pin down the gluon [32]. However, direct constrains at hadron
collider from photon and jet data are affected by substantial scale uncertainties due to the
missing full NNLO result, and are complicated by various non-perturbative uncertainties.
The availability of a full NNLO calculation makes the total top pair cross section the only
collider observable which, at present, is both directly sensitive to the gluon PDF and can be
consistently included in a NNLO QCD analysis. The fact that non-perturbative corrections
are much reduced in the total top quark production cross-section as compared to photons
and jets is another good motivation to use tops as probes of the gluon PDF. The possibility
of using top cross section data in PDF analysis was already discussed at the qualitative
level in ref. [70]. More recently, ref. [16] provided a first estimate of the impact of top quark
data on the gluon PDF based on approximate NNLO results.
In section 3 we have shown at the qualitative level that available data already discrim-
inates between different PDF sets, that is, between different large-x gluon PDFs. Now we
will be more quantitative and determine if available data can help in reducing the gluon
uncertainties within a single PDF set. In order to quantify this impact, we will use the
8An alternative way to conveying in a more quantitative way the information contained in figure 4 is to
compute the effective αs exponent of the cross section, neff ≡ d lnσ(tt)/d lnαs, in the two cases, varying
the PDF together with αs and keeping the PDFs fixed and varying only αs in the matrix element. At LHC
7TeV, using NNPDF2.3 we find neff ∼ 2.7 in the former and neff ∼ 2.3 in the latter, confirming the effect
of the positive correlation between the gluon and αs in the top quark production region.
– 10 –

JHEP07(2013)167
) Z
( MSα 0.105 0.11 0.115 0.12 0.125
(tt)
[pb]
σ
5.5
6
6.5
7
7.5
8
8.5
9
Tevatron Run-II
ABM11
CT10
HERAPDF
MSTW2008
NNPDF2.3
TeVatron
) Z
( MSα 0.105 0.11 0.115 0.12 0.125
(tt)
[pb]
σ
100
120
140
160
180
200
220
-1ATLAS, 1.0 fb
-1CMS, 2.3 fb
ABM11
CT10
HERAPDF
MSTW2008
NNPDF2.3
LHC 7 TeV
) Z
( MSα 0.105 0.11 0.115 0.12 0.125
(tt)
[pb]
σ
160
180
200
220
240
260
280
300
320
-1ATLAS, 2.3 fb
-1CMS, 1.1 fb
ABM11
CT10
HERAPDF
MSTW2008
NNPDF2.3
LHC 8 TeV
) Z
( MSα 0.105 0.11 0.115 0.12 0.125
(tt)
[pb]
σ
650
700
750
800
850
900
950
1000
1050
1100
1150ABM11
CT10
HERAPDF
MSTW2008
NNPDF2.3
LHC 14 TeV
Figure 3. The theoretical predictions for the various PDF sets studied in this work as a function
of the strong coupling constant αs(MZ), compared to the best available experimental data. From
top to bottom we show Tevatron, LHC 7TeV, 8TeV and 14TeV.
x -310 -210 -110
) [r
ef]
2)
[new
] / g
( x
, Q2
g (
x, Q
0.8
0.85
0.9
0.95
1
1.05
1.1
1.15
1.2
2t = m2 = 0.119), QSαRatio to NNPDF2.3 NNLO (
= 0.119S
α = 0.114
Sα
= 0.115S
α = 0.116
Sα
= 0.117S
α = 0.118
Sα
= 0.120S
α = 0.121
Sα
= 0.122S
α = 0.123
Sα
= 0.124S
α
2t = m2 = 0.119), QSαRatio to NNPDF2.3 NNLO (
x -310 -210 -110
) [r
ef]
2)
[new
] / u
( x
, Q2
u (
x, Q
0.94
0.96
0.98
1
1.02
1.04
1.06
1.08
1.1
2t = m2 = 0.119), QSαRatio to NNPDF2.3 NNLO (
= 0.119S
α = 0.114
Sα
= 0.115S
α = 0.116
Sα
= 0.117S
α = 0.118
Sα
= 0.120S
α = 0.121
Sα
= 0.122S
α = 0.123
Sα
= 0.124S
α
2t = m2 = 0.119), QSαRatio to NNPDF2.3 NNLO (
Figure 4. Left plot: the gluon PDF in the NNPDF2.3 fits obtained for different input values of
αs(MZ), evaluated at Q2 = m2t , shown as the ratio with respect to the gluon PDF obtained for
αs(MZ) = 0.119. Right plot: the same comparison, this time for the up quark PDF.
Bayesian PDF reweighting method of refs. [71, 72] on the NNPDF2.3 set.9 The same study
could be carried out with Hessian PDF sets as discussed in [74]. In principle, one could also
use the top quark differential distributions data from ATLAS and CMS [75, 76]. However,
9An alternative possibility would have been a direct inclusion of the top quark data in the NNPDF
framework using MCFM code together with the fast interface for tt production provided by APPLgrid [73].
This fast interface will be used in future NNPDF releases which will include relevant top quark production
data.
– 11 –

JHEP07(2013)167
x 0.1 0.2 0.3 0.4 0.5 0.6
)2 (
x, Q
(ref
))
/ g2
( x
, Q(n
ew)
g
0.7
0.8
0.9
1
1.1
1.2
1.3 NNPDF2.3
NNPDF2.3 + Top Data
2 = 100 GeV2Q
= 0.118SαRatio to NNPDF2.3 NNLO,
NNPDF2.3
NNPDF2.3 + Top Data
2 = 100 GeV2Q
x 0.1 0.2 0.3 0.4 0.5 0.6
Red
uctio
n of
PD
F e
rror
(%
)
0
5
10
15
20
25
30
2 = 100 GeV2Q
NNPDF2.3 NNLO + TeV,LHC Top Quark Data
Figure 5. Left plot: the ratio of the NNPDF2.3 NNLO gluon PDF at Q2 = 100GeV2 between the
default fit and after including the Tevatron and LHC top quark cross section data. Right plot: the
relative reduction of PDF uncertainties thanks to the inclusion of top data in the PDF fit.
these data are less precise than the total cross section measurement and the corresponding
theoretical predictions are currently only available at NLO.10
Therefore, we have included the Ndat = 5 experimental data points available from
the Tevatron and the LHC into the NNPDF2.3 NNLO fit. The definition of χ2 that we
use is eq. (3.1). The effective number of replicas after reweighting (the exponential of the
Shannon entropy) is Neff = 86, out of the starting sample of 100 replicas, indicating the
moderate constraining power of the data.
The results of adding the top quark data into the gluon PDF are shown in figure 5.
We show the NNPDF2.3 NNLO gluon at Q2 = 100GeV2, in the default fit and after
including the Tevatron and LHC top quark production cross section data. We observe that
the large-x gluon PDF uncertainties decrease. This is expected since in that region the
correlation between the gluon and the top-quark cross section is maximal (see figure 1).
In figure 5 we also show the relative reduction in PDF uncertainties from the addition
of top data. This reduction coincides, within the finite statistics of the original NNPDF
Monte Carlo sample, with the correlation profile of figure 1, and in particular confirms
that the top quark data have a small impact below x ∼ 0.1 or so, as well as for very large
values of x. Therefore, we conclude that the available top data can already help reduce
the uncertainties on the gluon PDF by a factor of up to 20%, and are thus an important
ingredient to future global PDF analyses. On the other hand, the impact of top data on
the quark PDFs is essentially negligible.
It is interesting to study the modifications of the theory predictions after the top
quark data have been added into the NNPDF2.3 fit. In table 9 we show the tt cross
section for NNPDF2.3, comparing the default prediction with the predictions after adding
different subsets of the top quark data. We show only the entries which correspond to pure
predictions. By including top data from lower energy colliders, we can provide arguably
the most accurate theoretical prediction for the total tt cross section at higher energies,
10For some specific differential distributions, results at NLO supplemented by threshold resummation are
available, see [9, 77] and references therein.
– 12 –

JHEP07(2013)167
Collider Ref. Ref+TeV Ref. +TeV+LHC7 Ref+TeV+LHC7+8
Tevatron 7.26 ± 0.12 (7.29 ± 0.12 ) (7.27 ± 0.12 ) (7.27 ± 0.12 )
LHC 7TeV 172.5 ± 5.2 172.7 ± 5.1 (170.5 ± 3.6 ) ( 170.5 ± 3.5 )
LHC 8TeV 247.8 ± 6.6 248.0 ± 6.5 245.0 ± 4.6 (245.2 ± 4.4 )
LHC 14TeV 976.5 ± 16.4 976.2 ± 16.3 969.8 ± 12.0 969.6 ± 11.6
Table 9. The tt cross section σtt, in picobarns, for the NNPDF2.3 NNLO set, together with the
associated PDF uncertainties. We show both the reference predictions with NNPDF2.3, and the
predictions once Tevatron, LHC7 and LHC8 data are added sequentially to the fitted dataset. We
show both the predictions corresponding to beam energies whose data have not been included in
the fit, and the post-dictions (in parenthesis and italics) for the beam energies whose data has been
used in the fit. The fourth column corresponds to the best theory prediction for LHC 8TeV, while
the last column is the best theory prediction for LHC 14TeV.
Collider NNPDF2.3 NNPDF2.3 NNPDF2.3+ TeV, LHC data + TeV, LHC 7TeV data
χ2 (Total, Ndat = 5) 6.28 4.88 4.87
χ2 (LHC 8TeV, Ndat = 2) 1.64 1.24 1.24
Table 10. The NNPDF2.3 χ2 compared to the hadron collider top quark production data, before
adding any data (first column), after adding all Tevatron and LHC data (second column) and adding
only the Tevatron and LHC 7TeV data points (third column). Note that the χ2 is not normalized
by the number of data points.
given that PDF uncertainties will be reduced in the same kinematical range from lower
energy data.11
These predictions are collected in table 9. As an illustration, the NNPDF2.3 prediction
including Tevatron and LHC 7 top data would be the best available theory prediction for
LHC 8TeV. Note that not only PDF uncertainties are reduced, but that also the central
value is shifted to improve the agreement with the experimental data. As can be seen, the
precise 7TeV data carry most of the constraining power, though of course improved power
of the 8TeV data will be provided with the analysis of the full 2012 dataset.
Then in table 10 we provide NNPDF2.3 χ2 compared to the top quark data, before
adding any data, after adding all Tevatron and LHC data and adding only the Tevatron
and LHC 7TeV data points. The slight improvement of an already good quantitative
description can be seen. As expected, the agreement of the prediction with LHC8 data,
when only Tevatron and LHC7 data are used, is a non-trivial consistency check of the
whole procedure.12
11Note that, as shown by figure 1, the typical x ranges covered by the theory predictions at LHC 7, 8
and 14TeV are quite similar, justifying the extrapolation of lower LHC energy data to improve the theory
predictions at higher LHC center of mass energies.12The small change of the χ2 between TEV+LHC data and TEV+LHC7 data is due to statistical fluc-
tuations, reflecting the fact that the 8TeV data are still not precise enough to provide constraints on the
gluon PDF.
– 13 –

JHEP07(2013)167
x 0.1 0.2 0.3 0.4 0.5 0.6
) [r
ef]
2)
[new
] / g
( x
, Q2
g (
x, Q
0.4
0.6
0.8
1
1.2
1.4
1.6 2.1 HERA-only
2.1 Global
= 0.119SαRatio to NNPDF2.1 NNLO HERA-only,
2.1 HERA-only
2.1 Global
x 0.1 0.2 0.3 0.4 0.5 0.6
) [r
ef]
2)
[new
] / g
( x
, Q2
g (
x, Q
0.4
0.6
0.8
1
1.2
1.4
1.6 HERA-only
HERA-only + LHC Top Data
= 0.118SαRatio to NNPDF2.1 NNLO HERA-only,
HERA-only
HERA-only + LHC Top Data
Figure 6. Left plot: the NNPDF2.1 HERA-only gluon PDF, at Q2 = 100GeV2, compared to the
reference global NNPDF2.1 gluon. Right plot: the NNPDF2.1 HERA-only gluon before and after
including the LHC top quark production cross sections.
Given that the constraints from top quark data in a global PDF fit such as NNPDF2.3
are already substantial, we expect even larger constrains in PDF sets based on reduced
datasets. To quantify the impact of top data into a DIS-only PDF fit, we have performed
a similar analysis as the one with NNPDF2.3, but now starting from a PDF set based on a
reduced dataset, the NNPDF2.1 HERA-only set [78, 79]. As the name indicates, this PDF
set includes only HERA data, and thus is affected by larger PDF uncertainties than the
NNPDF global fits, in particular for the large-x gluon.
In figure 6 we compare first of all the gluon from the NNPDF2.1 HERA-only fit with
that of the NNPDF2.1 global fit, to show the large differences in PDF uncertainties due to
the reduced dataset in the former case. Then we show the improvements in the gluon PDF
in the HERA-only fit after the addition of the top quark data. It is clear that the impact
is substantial. Remarkably, the top quark data bring the gluon from the HERA-only fit
closer to the gluon from the global fit.
4.1 Impact on predictions for BSM particle production
Many scenarios of BSM physics predict the production of massive final states in gluon-
initiated processes. The improvement in the large-x gluon PDF uncertainties seen in fig-
ure 5 implies a similar improvement in any cross section that is dominated by initial-state
gluons in a similar kinematical region. Production kinematics determines that any high-
mass final state that is gluon initiated will benefit from the improvement in PDF uncer-
tainties. Therefore, now we explore in two cases the phenomenological implications of the
improved large-x gluon: the production of heavy Kaluza-Klein resonances in warped extra
dimensions scenarios, and the PDF uncertainties in the high invariant mass distribution of
top quark pairs.
To begin with, we have considered Kaluza-Klein massive graviton production in warped
extra dimension scenarios [20], in particular in the so-called bulk models in which the
coupling of the graviton to fermions is suppressed, and thus production is driven by gluon-
gluon annihilation [21]. We have computed the cross sections for Randall-Sundrum graviton
production at the LHC 8TeV at leading order using the MadGraph5 program [80], for a range
– 14 –

JHEP07(2013)167
[ TeV ] G M1 2 3 4 5 6
) [r
ef]
G (
MGσ
) [n
ew] /
G
( M
Gσ
0
0.2
0.4
0.6
0.8
1
1.2
1.4
1.6
1.8
2
2.2NNPDF2.3
NNPDF2.3 + TeV,LHC Top Data
g g > G @ LHC 8 TeVRandall-Sundrum modelMadGraph5
Ratio to NNPDF2.3 NNLO
NNPDF2.3
NNPDF2.3 + TeV,LHC Top Data
g g > G @ LHC 8 TeVRandall-Sundrum modelMadGraph5
Figure 7. The PDF uncertainties for the production of Randall-Sundrum Kaluza-Klein gravitons
at the LHC 8TeV, with NNPDF2.3 before and after including the top quark data, as a function
of the graviton mass MG. We have assumed that the graviton couples only to gluons. The cross
section has been computed at leading order with MadGraph5.
of values of the graviton mass MG. The improvement in theoretical (PDF) uncertainties
in the graviton production cross section thanks to top quark data is shown in figure 7. We
see that, to begin with, PDF uncertainties are large, almost 40% for MG = 3TeV, and
growing as we approach the kinematic threshold, reflecting our lack of knowledge of the
large-x gluon PDF. The top quark data reduce moderately the production uncertainties. Of
course, future, more precise top data will render these constraints more stringent, which in
turn translate into the possibility of better characterizing eventual BSM high mass particles
that the LHC could find. Similar improvements are found for 14TeV.
The second example is the high mass tail of the invariant mass distribution in top-
quark production, relevant for many BSM searches [22, 23], which is also related with
the top quark forward-backward asymmetry measured at the Tevatron. One example is
the searches for heavy resonances that decay into a top-antitop pair [81–84]. To study
the impact of the improvement of gluon PDF uncertainties there, we have computed top
quark pair production with the aMC@NLO program [85–87], at NLO matched to the Herwig6
shower [88]. The renormalization and factorization scales are set equal to the sum of
transverse masses of all final-state particles. Using NNPDF2.3, we have evaluated the
cross section with a cut in the minimum invariant mass of the tt pair, Mtt, before and after
including the top quark data into the PDF fit. We show the results in figure 8, for the
absolute cross section (left) and for the relative scale and PDF uncertainties (right) as a
function of the minimum value of Mtt allowed.
As we can see, the addition of the total tt cross section data reduces the PDF uncer-
tainty in the high-end tail of the tt mass distribution. It must be remarked that the data in
this high-mass tail are only a negligible fraction of the total tt cross section, and therefore
do not play any role in the PDF fit itself. The PDF fit including σ(tt) reduces the gluon
uncertainty at large x only because of the overall constraints on the PDF evolution, which
correlate the x behavior in the x ∼ 0.1 region (which dominates the total production cross
section) and the large-x region, which is relevant to the high-mass behavior.
– 15 –

JHEP07(2013)167
( GeV ) tt,min M1000 1200 1400 1600 1800 2000 2200 2400
) (p
b)tt,
min
>M
tt(M
ttσ
-310
-210
-110
1
10
NNPDF2.3
NNPDF2.3 + Top Data
aMCatNLO + NNPDF2.3Herwig shower
LHC 8 TeV
NNPDF2.3
NNPDF2.3 + Top Data
aMCatNLO + NNPDF2.3Herwig shower
( GeV ) tt,min M1000 1200 1400 1600 1800 2000 2200 2400
) tt,
min
>M
tt(M
tt(ref
)σ
) /
tt,m
in>
Mtt
(Mtt(n
ew)
σ 0.6
0.8
1
1.2
1.4
NNPDF2.3
NNPDF2.3 + Top Data
Scale uncertainties
p p > t t @ LHC 8 TeV
aMCatNLO + NNPDF2.3Herwig shower
Ratio to NNPDF2.3 NNLO
NNPDF2.3
NNPDF2.3 + Top Data
Scale uncertainties
p p > t t @ LHC 8 TeV
aMCatNLO + NNPDF2.3Herwig shower
Figure 8. Left plot: the tt cross section above a minimum value of the tt invariant mass Mtt,
computed with aMCatNLO with the Herwig parton shower, and the NNPDF2.3 as input set, at the
LHC 8TeV. The error band is the PDF uncertainty band. Right plot: the relative scale and PDF
uncertainties for the cross section of top quark pairs with invariant mass above Mtt,min, at LHC
8TeV. In both cases we show the predictions with NNPDF2.3 before and after including the top
quark data into the PDF fit.
As in the case of dijet cross sections, we expect that rate measurements in kinematical
regions where, for example, the tt system has a large rapidity, can be used to further improve
the knowledge of large-x gluons, and improve even more the precision of predictions for
the production of large-mass objects in gg-initiated channels.
5 Cross-section ratios between different LHC beam energies
The measurement of cross-section ratios between different center of mass energies at the
LHC has two main motivations [89]: first, they are interesting for precision SM studies
and second, they have the potential to enhance the possible BSM sensitivity of absolute
cross sections. In ref. [89], results for top quark cross sections based on NLO+NNLL
theory were provided; here we update them to NNLO+NNLL and compare them with
experimental data.
First of all we show the correlations between PDFs and the cross-section ratios in
figure 9. We see that the PDF correlation is approximately the inverse of that of the
absolute cross sections, shown in figure 1. The reason for this anti-correlation at large x is
that when going to higher energies, the average probed values of x are smaller.
Using the same settings as before, we now provide NNLO+NNLL predictions for the
cross-section ratios in tables 11 and 12. We note that all systematic theoretical uncertainties
are small: in the ratio between 8 and 7TeV the total theory uncertainty is at the permille
level, while in the ratio between 14 and 8TeV, the total error on the ratio is at most
around 2%. This is dominated by PDF uncertainty, which is four times larger than the
combined scale, αs and mt uncertainties. Notice the great improvement due to the NNLO
result: in the NLO+NNLL analysis of top cross-section ratios of ref. [89], scale and PDF
uncertainties were of similar size. We note that, as can be seen from table 12, in the
case of the 14 over 8TeV ratios the differences between PDF sets are at the level of 10%.
– 16 –

JHEP07(2013)167
x -410 -310 -210 -110 1
Cor
rela
tion
coef
ficie
nt
-1
-0.5
0
0.5
1
LHC 8 TeV / 7 TeV
LHC 14 TeV / 8 TeV
LHC 8 TeV / 7 TeV
LHC 14 TeV / 8 TeV
) )top
(tt), g( x,Q=mσ( ρNNPDF2.3 NNLO
Correlation between PDFs and Cross-Section
x -410 -310 -210 -110 1
Cor
rela
tion
coef
ficie
nt
-1
-0.5
0
0.5
1
LHC 8 TeV / 7 TeV
LHC 14 TeV / 8 TeV
LHC 8 TeV / 7 TeV
LHC 14 TeV / 8 TeV
) )top
(tt), u( x,Q=mσ( ρNNPDF2.3 NNLO
Correlation between PDFs and Cross-Section
Figure 9. The correlation between the gluon PDF (left plot) and the up quark PDF (right plot)
with the top quark production cross-section ratios between different LHC center of mass energies.
The correlations are computed for Q = mt = 173.3GeV.
LHC 8TeV / 7TeV ratio
PDF set σtt δscale δPDF δαs(pb) δmt
δtot
ABM11 1.463 +0.001−0.002
(+0.1%)
(−0.1%)+0.006−0.006
(+0.4%)
(−0.4%)+0.000−0.000
(+0.0%)
(−0.0%)+0.001−0.001
(+0.1%)
(−0.1%)+0.007−0.008
(+0.5%)
(−0.5%)
CT10 1.428 +0.001−0.001
(+0.1%)
(−0.1%)+0.008−0.010
(+0.5%)
(−0.7%)+0.002−0.002
(+0.2%)
(−0.2%)+0.001−0.001
(+0.1%)
(−0.1%)+0.009−0.011
(+0.6%)
(−0.8%)
HERA1.5 1.426 +0.001−0.002
(+0.0%)
(−0.1%)+0.003−0.003
(+0.2%)
(−0.2%)+0.001−0.001
(+0.1%)
(−0.1%)+0.001−0.001
(+0.1%)
(−0.1%)+0.004−0.005
(+0.3%)
(−0.4%)
JR09 1.426 +0.001−0.001
(+0.0%)
(−0.0%)+0.014−0.014
(+1.0%)
(−1.0%)+0.000−0.000
(+0.0%)
(−0.0%)+0.001−0.001
(+0.1%)
(−0.1%)+0.014−0.014
(+1.0%)
(−1.0%)
MSTW08 1.429 +0.001−0.001
(+0.1%)
(−0.1%)+0.004−0.004
(+0.2%)
(−0.2%)+0.001−0.001
(+0.1%)
(−0.1%)+0.001−0.001
(+0.1%)
(−0.1%)+0.005−0.005
(+0.3%)
(−0.3%)
NNPDF2.3 1.437 +0.001−0.001
(+0.1%)
(−0.1%)+0.006−0.006
(+0.4%)
(−0.4%)+0.001−0.001
(+0.1%)
(−0.1%)+0.001−0.001
(+0.1%)
(−0.1%)+0.007−0.007
(+0.5%)
(−0.5%)
ATLAS 1.36 ± 0.11 ( 8%)
CMS 1.40 ± 0.08 ( 6%)
Table 11. The NNLO+NNLL predictions for the ratio of top quark cross section at the LHC
between 8 and 7TeV, with all the PDFs considered, and with the various sources of theoretical un-
certainties. The default value of αs(MZ) from each collaboration has been used in the computation
of the central predictions. The lower row shows our estimate of the best available experimental mea-
surement. The total theoretical uncertainty is the linear sum of scale and parametric uncertainties,
as discussed in the text.
Therefore, such measurement would provide powerful PDF constraints even within the
foreseeable experimental accuracies.
We have checked that the results computed at NNLO+NNLL with NNPDF2.1 are
fully consistent with the computation of ref. [89], performed at NLO+NNLL accuracy.
This proves the reliability of the theoretical uncertainty on the cross section ratios for
tt production presented in [89], and underscores the stability of this ratio under higher-
order corrections. Indeed, central values and PDF uncertainties are unchanged, while scale
uncertainties are further decreased. For instance, at NLO+NNLL the scale uncertainty
in the 14/8 ratio was about 1%, while with the NNLO+NNLL computation it decreases
down to 0.3%.
While no measurement of the ratio between 8 and 7TeV is available, we can estimate
the expected precision from the absolute cross-section measurements of table 2 by assuming
– 17 –

JHEP07(2013)167
LHC 14TeV / 8TeV ratio
PDF set σtt δscale δPDF δαs(pb) δmt
δtot
ABM11 4.189 +0.008−0.016
(+0.2%)
(−0.4%)+0.057−0.057
(+1.4%)
(−1.4%)+0.000−0.000
(+0.0%)
(−0.0%)+0.012−0.012
(+0.3%)
(−0.3%)+0.067−0.074
(+1.6%)
(−1.8%)
CT10 3.869 +0.006−0.009
(+0.2%)
(−0.2%)+0.068−0.088
(+1.8%)
(−2.3%)+0.020−0.020
(+0.5%)
(−0.5%)+0.010−0.010
(+0.2%)
(−0.2%)+0.077−0.100
(+2.0%)
(−2.6%)
HERA1.5 3.841 +0.005−0.012
(+0.1%)
(−0.3%)+0.033−0.025
(+0.9%)
(−0.7%)+0.010−0.010
(+0.3%)
(−0.3%)+0.009−0.010
(+0.2%)
(−0.2%)+0.041−0.041
(+1.1%)
(−1.1%)
JR09 3.808 +0.005−0.005
(+0.1%)
(−0.1%)+0.117−0.117
(+3.1%)
(−3.1%)+0.000−0.000
(+0.0%)
(−0.0%)+0.012−0.012
(+0.3%)
(−0.3%)+0.122−0.122
(+3.2%)
(−3.2%)
MSTW08 3.880 +0.006−0.009
(+0.2%)
(−0.2%)+0.036−0.036
(+0.9%)
(−0.9%)+0.011−0.011
(+0.3%)
(−0.3%)+0.010−0.010
(+0.2%)
(−0.2%)+0.045−0.048
(+1.2%)
(−1.2%)
NNPDF2.3 3.940 +0.006−0.010
(+0.2%)
(−0.3%)+0.048−0.048
(+1.2%)
(−1.2%)+0.009−0.009
(+0.2%)
(−0.2%)+0.010−0.010
(+0.3%)
(−0.3%)+0.056−0.060
(+1.4%)
(−1.5%)
Table 12. Same as table 11 for the ratio of 14 over 8TeV cross sections at the LHC.
that all systematic uncertainties (but not the luminosity) are fully correlated between 8
and 7TeV. This leads to
σ(Atlas)LHC8/7(tt) = 1.36± 0.11 pb (8%) ,
σ(CMS)LHC8/7(tt) = 1.40± 0.08 pb (6%) . (5.1)
Note that while ATLAS is higher than CMS at 8 and 7TeV, this trend is inverted in the
cross section ratio.
If no such correlation between the systematic uncertainties is assumed we get
σ(Atlas)LHC8/7(tt) = 1.36± 0.20 pb (15%) ,
σ(CMS)LHC8/7(tt) = 1.40± 0.11 pb (8%) , (5.2)
which illustrates the importance of maximizing the cancellation of systematics. This re-
quires a dedicated strategy for the ratio measurement, rather than simply combining data
at two different energies.
We compare graphically the theoretical predictions for the ratios between 8 and 7TeV
and 14 and 8TeV in figure 10. In the first case, we also show the estimate of the ATLAS
and CMS results, assuming full correlation of the systematic uncertainties. Then we show
in figure 11 the dependence on αs(MZ) of the NNLO+NNLL cross-section ratios for each
of the various PDF sets. The slope with αs for the prediction of each of the PDF sets varies
more than for the absolute cross sections, figure 3. However, with the assumed uncertainty
on αs, the contribution δαsto the total theory uncertainty of the cross-section ratios is
much smaller than the PDF uncertainty.
Finally, it is useful to provide predictions for the cross section ratios in the case of
NNPDF2.3 supplemented by the Tevatron and LHC top data, discussed in the previous
section. The results are shown in table 13. As can be seen, while the differences are
non negligible, they are probably well beyond foreseeable experimental accuracies. This
is expected since cross-section ratios are mostly sensitive to more dramatic differences
between PDF sets, such as those between AMB11 and the other sets in the case of the 14
over 8TeV cross-section ratio, as shown in Fig 10.
– 18 –

JHEP07(2013)167
) Z
( MSα 0.111 0.112 0.113 0.114 0.115 0.116 0.117 0.118 0.119 0.12
(tt,
7 Te
V)
σ(t
t, 8
TeV
) /
σ
1.2
1.25
1.3
1.35
1.4
1.45
1.5
1.55
1.6
1.65
LHC 8 over 7 TeV
ATLAS
CMS
ABM11
CT10
HERAPDF
JR09
MSTW2008
NNPDF2.3
LHC 8 over 7 TeV
) Z
( MSα 0.111 0.112 0.113 0.114 0.115 0.116 0.117 0.118 0.119 0.12
(tt,
8 Te
V)
σ(t
t, 14
TeV
) /
σ
3.6
3.7
3.8
3.9
4
4.1
4.2
4.3
4.4
4.5
LHC 14 over 8 TeV
ABM11
CT10
HERAPDF
JR09
MSTW2008
NNPDF2.3
LHC 14 over 8 TeV
Figure 10. The best predictions from each PDF set for the LHC ratios between 8 and 7TeV (left
plot) and 14 and 8TeV (right plot). The error bars correspond to the total theoretical uncertainty.
For the 8/7 ratio, the ATLAS and CMS experimental results have been obtained taking the ratio of
the central data and assuming that experimental systematics (but not luminosity) is fully correlated
between different beam energies.
) Z
( MSα 0.105 0.11 0.115 0.12 0.125
(tt)
(7
TeV
)σ
(tt)
(8
TeV
) /
σ
1.4
1.41
1.42
1.43
1.44
1.45
1.46
1.47
1.48
1.49
1.5ABM11
CT10
HERAPDF
MSTW2008
NNPDF2.3
LHC 8 TeV over LHC 7 TeV
) Z
( MSα 0.105 0.11 0.115 0.12 0.125
(tt)
(8
TeV
)σ
(tt)
(14
TeV
) /
σ
3.8
3.9
4
4.1
4.2
4.3
4.4
4.5 ABM11
CT10
HERAPDF
MSTW2008
NNPDF2.3
LHC 14 TeV over 8 TeV
Figure 11. The theoretical predictions for the cross section ratios between different LHC beam
energies for the the various PDF sets, as a function of the strong coupling constant αs(MZ).
Collider NNPDF2.3 NNPDF2.3 + TeV,LHC top data
σLHC8/7(tt) 1.437 ± 0.006 (0.4 %) 1.439 ± 0.005 (0.3 %)
σLHC14/8(tt) 3.94 ± 0.05 (1.2 %) 3.96 ± 0.04 (1.0 %)
Table 13. The tt cross section ratios for the NNPDF2.3 NNLO set, together with the associated
PDF uncertainties, both in the reference fit and when NNPDF2.3 is supplemented by Tevatron and
LHC top quark production data.
6 Hypothetical fourth-generation heavy quark production at the LHC
Following ref. [8], we provide also the total cross section at NNLO+NNLL accuracy for
a pair of hypothetical heavy fourth-generation quarks, belonging to the fundamental rep-
resentation of SU(3). Such new massive fermions arise naturally in BSM theories with
strongly-coupled dynamics. We denote these hypothetical heavy fourth-generation quarks
by T . Our aim is to assess the scale and PDF uncertainties affecting the QCD contribution
to the production of such heavy fermions using the most up-to-date theoretical inputs. We
– 19 –

JHEP07(2013)167
( GeV ) T M200 400 600 800 1000 1200
(TT
) [p
b]σ
-410
-310
-210
-110
1
10
210
NNLO+NNLL with MSTW2008NNLO
7 TeV
8 TeV
Fourth-Generation Heavy Quark Production at the LHC
( GeV ) T M200 400 600 800 1000 1200
Rat
io to
cen
tral
cro
ss-s
ectio
n
0.9
0.95
1
1.05
1.1
1.15
1.2PDF uncertainties
scale uncertainties
NNLO+NNLL with MSTW2008NNLO
Fourth-Generation Heavy Quark Production at the LHC 8 TeV
PDF uncertainties
scale uncertainties
NNLO+NNLL with MSTW2008NNLO
Figure 12. Left plot: the cross sections for the production of a TT pair of hypothetical
heavy fourth-generation quarks at the LHC 7 and 8TeV, computed at NNLO+NNLL with
MSTW2008NNLO, as a function of the heavy quark mass MT . The uncertainty band is the linear
sum of PDF and scale uncertainties. Right plot: the relative PDF and scale uncertainties as a
function of MT for LHC 8TeV.
have used both MSTW2008 and NNPDF2.3 NNLO PDFs as input in the computation, and
provide predictions for masses MT in the range between 200GeV and 1.3TeV. The PDF
and scale uncertainties are defined as in section 3, with the difference than now the central
renormalization and factorization scales are set to the heavy quark mass, µF = µR = MT .
The numerical results for the total cross sections and associated scale and PDF uncer-
tainties have been tabulated and they are available in the source of the arXiv submission
of this paper.13 In figure 12 (left) we show the production cross sections at LHC 7 and
8TeV as a function of MT , where the uncertainty band is the linear sum of scale and
PDF uncertainties. The MSTW08 PDF set was used as input. In figure 12 (right) we
also show the relative PDF and scale uncertainties, at the LHC 8TeV. We notice that for
large heavy fermion masses MT ≫ mt, PDF uncertainties become the dominant source of
theoretical error.
Another useful comparison is provided by the PDF dependence of the hypothetical
heavy fourth-generation quark production cross section. In figure 13 we compare, as a
function of MT , the predictions for the NNLO+NNLL cross-sections in MSTW08 and
NNPDF2.3. Only PDF uncertainties are shown. While the two uncertainty bands overlap,
the envelope of the two sets is substantially larger than the bands of the individual sets.
The NNPDF2.3 predictions are smaller than the MSTW08 ones, by about 1-sigma, for
MT ≥ 400GeV.
7 Summary and outlook
In this work we have presented a detailed assessment of the theoretical systematic uncer-
tainties that affect the total top quark pair production cross section at hadron colliders.
We have also compared the theoretical predictions with the most recent experimental data
from the Tevatron and the LHC 7 and 8TeV, and provided predictions for LHC 14TeV.
13The data files are heavyfermion 7tev mstw08.data, heavyfermion 8tev mstw08.data, heavyfermion
7tev nnpdf23.data and heavyfermion 7tev nnpdf23.data.
– 20 –

JHEP07(2013)167
( GeV ) T M200 400 600 800 1000 1200
Rat
io to
MS
TW
080.8
0.85
0.9
0.95
1
1.05
1.1
1.15
1.2MSTW08
NNPDF2.3
NNLO+NNLL
Fourth-Generation Heavy Quark Production at the LHC 8 TeV
MSTW08
NNPDF2.3
NNLO+NNLL
Figure 13. Same as figure 12 (right), now comparing the predictions of MSTW08 and NNPDF2.3.
Only PDF uncertainties are shown.
For our analysis we have used the most precise perturbative and non-perturbative
information available, in particular the recently computed NNLO+NNLL cross sections and
the most up-to-date NNLO PDF sets. Thanks to the significantly reduced scale dependence
of the full NNLO calculation, now the three main sources of theoretical uncertainty, scales,
PDFs and the top quark mass, are roughly of the same size, around 2-3%. We find that
most PDF sets agree both in their central values and in the size of their PDF uncertainties.
Given the high accuracy of the perturbative tt cross section, we have demonstrated that
the available data provide a strong constraint on existing NNLO PDF sets, in particular
on the large-x gluon PDF. The inclusion of Tevatron and LHC top quark data in the
NNPDF2.3 set results in a reduction on the large-x gluon PDF uncertainty, which has
further important phenomenological consequences. We have explicitly studied two such
cases, both relevant for BSM searches: high mass graviton production in warped extra
dimensions scenarios, and the high mass tail of the top pair invariant mass distribution.
We have also given updated predictions for the pair production of a hypothetical fourth-
generation heavy quark T , which should be helpful in interpreting the results of ongoing
experimental searches [90–92].
For completeness, we have also provided up-to-date predictions for the cross-section
ratios of σtt at different LHC center-of-mass energies.
To conclude, we emphasize that the availability of the NNLO calculation for the total
tt cross section makes top pair production the first hadron collider process which is both
directly sensitive to the gluon PDF and can be included consistently into a NNLO global
PDF analysis without any approximation. This leads us to believe that top quark data
will be an important ingredient of future PDF fits, especially as more precise data on the
total cross section and on various differential distributions becomes available.
Acknowledgments
We acknowledge Tancredi Carli, Maria Jose Costa, Roberto Tenchini and Roberto Chierici
for information about the LHC top quark cross-section data, and Stefano Forte, Stefano
– 21 –

JHEP07(2013)167
Frixione, Katerina Lipka and Sebastian Naumann-Emme for useful discussions. The work
of M. C. was supported by the Heisenberg and by the Gottfried Wilhelm Leibniz pro-
grammes of the Deutsche Forschungsgemeinschaft, and by the DFG Sonderforschungsbere-
ich/Transregio 9 “Computergestutzte Theoretische Teilchenphysik”. J. R. is supported by
a Marie Curie Intra-European Fellowship of the European Community’s 7th Framework
Programme under contract number PIEF-GA-2010-272515. The work of M. L. M. and
A. M. is supported by the ERC grant 291377 “LHCtheory: Theoretical predictions and
analyses of LHC physics: advancing the precision frontier”.
Open Access. This article is distributed under the terms of the Creative Commons
Attribution License which permits any use, distribution and reproduction in any medium,
provided the original author(s) and source are credited.
References
[1] M. Czakon, P. Fiedler and A. Mitov, The total top quark pair production cross-section at
hadron colliders through O(α4
S), arXiv:1303.6254 [INSPIRE].
[2] P. Baernreuther, M. Czakon and A. Mitov, Percent level precision physics at the Tevatron:
first genuine NNLO QCD corrections to qq → tt+X, Phys. Rev. Lett. 109 (2012) 132001
[arXiv:1204.5201] [INSPIRE].
[3] M. Czakon and A. Mitov, NNLO corrections to top-pair production at hadron colliders: the
all-fermionic scattering channels, JHEP 12 (2012) 054 [arXiv:1207.0236] [INSPIRE].
[4] M. Czakon and A. Mitov, NNLO corrections to top pair production at hadron colliders: the
quark-gluon reaction, JHEP 01 (2013) 080 [arXiv:1210.6832] [INSPIRE].
[5] M. Beneke, P. Falgari and C. Schwinn, Soft radiation in heavy-particle pair production:
all-order colour structure and two-loop anomalous dimension, Nucl. Phys. B 828 (2010) 69
[arXiv:0907.1443] [INSPIRE].
[6] M. Czakon, A. Mitov and G.F. Sterman, Threshold resummation for top-pair
hadroproduction to next-to-next-to-leading log, Phys. Rev. D 80 (2009) 074017
[arXiv:0907.1790] [INSPIRE].
[7] M. Cacciari, M. Czakon, M. Mangano, A. Mitov and P. Nason, Top-pair production at
hadron colliders with next-to-next-to-leading logarithmic soft-gluon resummation,
Phys. Lett. B 710 (2012) 612 [arXiv:1111.5869] [INSPIRE].
[8] M. Cacciari, S. Frixione, M.L. Mangano, P. Nason and G. Ridolfi, Updated predictions for
the total production cross sections of top and of heavier quark pairs at the Tevatron and at
the LHC, JHEP 09 (2008) 127 [arXiv:0804.2800] [INSPIRE].
[9] N. Kidonakis and B.D. Pecjak, Top-quark production and QCD,
Eur. Phys. J. C 72 (2012) 2084 [arXiv:1108.6063] [INSPIRE].
[10] S. Forte and G. Watt, Progress in the determination of the partonic structure of the proton,
arXiv:1301.6754 [INSPIRE].
[11] G. Watt, Parton distribution function dependence of benchmark standard model total cross
sections at the 7 TeV LHC, JHEP 09 (2011) 069 [arXiv:1106.5788] [INSPIRE].
– 22 –
JHEP07(2013)167
[12] G. Watt, MSTW PDFs and impact of PDFs on cross sections at Tevatron and LHC,
Nucl. Phys. Proc. Suppl. 222-224 (2012) 61 [arXiv:1201.1295] [INSPIRE].
[13] S. Moch, P. Uwer and A. Vogt, On top-pair hadro-production at next-to-next-to-leading
order, Phys. Lett. B 714 (2012) 48 [arXiv:1203.6282] [INSPIRE].
[14] M. Aliev et al., HATHOR: HAdronic Top and Heavy quarks crOss section calculatoR,
Comput. Phys. Commun. 182 (2011) 1034 [arXiv:1007.1327] [INSPIRE].
[15] M. Beneke, P. Falgari, S. Klein and C. Schwinn, Hadronic top-quark pair production with
NNLL threshold resummation, Nucl. Phys. B 855 (2012) 695 [arXiv:1109.1536] [INSPIRE].
[16] M. Beneke et al., Inclusive top-pair production phenomenology with TOPIXS,
JHEP 07 (2012) 194 [arXiv:1206.2454] [INSPIRE].
[17] V. Ahrens, A. Ferroglia, M. Neubert, B.D. Pecjak and L.L. Yang, Precision predictions for
the t+ t production cross section at hadron colliders, Phys. Lett. B 703 (2011) 135
[arXiv:1105.5824] [INSPIRE].
[18] M. Kramer et al., Supersymmetry production cross sections in pp collisions at√s = 7 TeV,
arXiv:1206.2892 [INSPIRE].
[19] K. Agashe, H. Davoudiasl, G. Perez and A. Soni, Warped gravitons at the LHC and beyond,
Phys. Rev. D 76 (2007) 036006 [hep-ph/0701186] [INSPIRE].
[20] L. Randall and R. Sundrum, An alternative to compactification,
Phys. Rev. Lett. 83 (1999) 4690 [hep-th/9906064] [INSPIRE].
[21] G.F. Giudice, R. Rattazzi and J.D. Wells, Graviscalars from higher dimensional metrics
and curvature Higgs mixing, Nucl. Phys. B 595 (2001) 250 [hep-ph/0002178] [INSPIRE].
[22] R. Frederix and F. Maltoni, Top pair invariant mass distribution: a window on new
physics, JHEP 01 (2009) 047 [arXiv:0712.2355] [INSPIRE].
[23] V. Barger, T. Han and D.G. Walker, Top quark pairs at high invariant mass: a
model-independent discriminator of new physics at the LHC,
Phys. Rev. Lett. 100 (2008) 031801 [hep-ph/0612016] [INSPIRE].
[24] P. Chiappetta and M. Perrottet, Possible bounds on compositeness from inclusive one jet
production in large hadron colliders, Phys. Lett. B 253 (1991) 489 [INSPIRE].
[25] CMS collaboration, Search for contact interactions using the inclusive jet pT spectrum in
pp collisions at√s = 7 TeV, Phys. Rev. D 87 (2013) 052017 [arXiv:1301.5023] [INSPIRE].
[26] CMS collaboration, Search for quark compositeness in dijet angular distributions from pp
collisions at√s = 7 TeV, JHEP 05 (2012) 055 [arXiv:1202.5535] [INSPIRE].
[27] ATLAS collaboration, ATLAS search for new phenomena in dijet mass and angular
distributions using pp collisions at√s = 7 TeV, JHEP 01 (2013) 029 [arXiv:1210.1718]
[INSPIRE].
[28] D0 collaboration, V. Abazov et al., Measurement of the inclusive jet cross-section in pp
collisions at√s = 1.96TeV, Phys. Rev. Lett. 101 (2008) 062001 [arXiv:0802.2400]
[INSPIRE].
[29] CDF collaboration, T. Aaltonen et al., Measurement of the inclusive jet cross section at the
Fermilab Tevatron pp collider using a cone-based jet algorithm,
Phys. Rev. D 78 (2008) 052006 [Erratum ibid. D 79 (2009) 119902] [arXiv:0807.2204]
[INSPIRE].
– 23 –

JHEP07(2013)167
[30] CMS collaboration, Measurements of differential jet cross sections in proton-proton
collisions at√s = 7 TeV with the CMS detector, Phys. Rev. D 87 (2013) 112002
[arXiv:1212.6660] [INSPIRE].
[31] ATLAS collaboration, Measurement of inclusive jet and dijet production in pp collisions at√s = 7 TeV using the ATLAS detector, Phys. Rev. D 86 (2012) 014022 [arXiv:1112.6297]
[INSPIRE].
[32] D. d’Enterria and J. Rojo, Quantitative constraints on the gluon distribution function in the
proton from collider isolated-photon data, Nucl. Phys. B 860 (2012) 311
[arXiv:1202.1762] [INSPIRE].
[33] L. Carminati et al., Sensitivity of the LHC isolated-gamma+jet data to the parton
distribution functions of the proton, EPL 101 (2013) 61002 [arXiv:1212.5511] [INSPIRE].
[34] A. G.-D. Ridder, T. Gehrmann, E. Glover and J. Pires, Second order QCD corrections to
jet production at hadron colliders: the all-gluon contribution,
Phys. Rev. Lett. 110 (2013) 162003 [arXiv:1301.7310] [INSPIRE].
[35] R.D. Ball et al., A first unbiased global NLO determination of parton distributions and their
uncertainties, Nucl. Phys. B 838 (2010) 136 [arXiv:1002.4407] [INSPIRE].
[36] M. Czakon and A. Mitov, Top++: a program for the calculation of the top-pair
cross-section at hadron colliders, arXiv:1112.5675 [INSPIRE].
[37] S. Alekhin, J. Blumlein and S. Moch, Parton distribution functions and benchmark cross
sections at NNLO, Phys. Rev. D 86 (2012) 054009 [arXiv:1202.2281] [INSPIRE].
[38] J. Gao et al., The CT10 NNLO global analysis of QCD, arXiv:1302.6246 [INSPIRE].
[39] ZEUS, H1 collaboration, A. Cooper-Sarkar, PDF Fits at HERA, PoS(EPS-HEP2011)320
[arXiv:1112.2107] [INSPIRE].
[40] P. Jimenez-Delgado and E. Reya, Dynamical NNLO parton distributions,
Phys. Rev. D 79 (2009) 074023 [arXiv:0810.4274] [INSPIRE].
[41] A. Martin, W. Stirling, R. Thorne and G. Watt, Parton distributions for the LHC,
Eur. Phys. J. C 63 (2009) 189 [arXiv:0901.0002] [INSPIRE].
[42] R.D. Ball et al., Parton distributions with LHC data, Nucl. Phys. B 867 (2013) 244
[arXiv:1207.1303] [INSPIRE].
[43] R.D. Ball et al., Parton distribution benchmarking with LHC data, JHEP 04 (2013) 125
[arXiv:1211.5142] [INSPIRE].
[44] P.M. Nadolsky and Z. Sullivan, PDF uncertainties in WH production at Tevatron,
eConf C 010630 (2001) P510 [hep-ph/0110378] [INSPIRE].
[45] Particle Data Group collaboration, J. Beringer et al., Review of particle physics,
Phys. Rev. D 86 (2012) 010001 [INSPIRE].
[46] H.-L. Lai et al., Uncertainty induced by QCD coupling in the CTEQ global analysis of
parton distributions, Phys. Rev. D 82 (2010) 054021 [arXiv:1004.4624] [INSPIRE].
[47] F. Demartin, S. Forte, E. Mariani, J. Rojo and A. Vicini, The impact of PDF and alphas
uncertainties on Higgs Production in gluon fusion at hadron colliders,
Phys. Rev. D 82 (2010) 014002 [arXiv:1004.0962] [INSPIRE].
[48] M. Whalley, D. Bourilkov and R. Group, The Les Houches accord PDFs (LHAPDF) and
LHAGLUE, hep-ph/0508110 [INSPIRE].
– 24 –
JHEP07(2013)167
[49] CDF, D0 collaboration, T. Aaltonen et al., Combination of the top-quark mass
measurements from the Tevatron collider, Phys. Rev. D 86 (2012) 092003
[arXiv:1207.1069] [INSPIRE].
[50] LHC Higgs Cross Section Working Group collaboration, S. Dittmaier et al.,
Handbook of LHC Higgs Cross Sections: 1. Inclusive observables, arXiv:1101.0593
[INSPIRE].
[51] Tevatron electroweak working group, T. Aaltonen et al., Combination of the tt
production cross section measurements from the Tevatron collider, D0 Note 6363 (2012).
[52] ATLAS collaboration, Statistical combination of top quark pair production cross-section
measurements using dilepton, single-lepton and all-hadronic final states at√s = 7TeV with
the ATLAS detector, ATLAS-CONF-2012-024 (2012).
[53] CMS collaboration, Measurement of the tt production cross section in the dilepton channel
in pp collisions at√s = 7 TeV, JHEP 11 (2012) 067 [arXiv:1208.2671] [INSPIRE].
[54] ATLAS collaboration, Measurement of the top quark pair production cross section in the
single-lepton channel with ATLAS in proton-proton collisions at 8TeV using kinematic fits
with b-tagging, ATLAS-CONF-2012-149 (2012).
[55] CMS collaboration, Combination of ATLAS and CMS top-quark pair cross section
measurements using proton-proton collisions at√s = 7TeV, CMS-PAS-TOP-12-003 (2012).
[56] CMS collaboration, Top pair cross section in e/µ+ jets at 8 TeV, CMS-PAS-TOP-12-006
(2012).
[57] ATLAS and CMS collaboration, Combination of ATLAS and CMS top-quark pair cross
section measurements using proton-proton collisions at√s = 7TeV, CMS-PAS-TOP-12-003
(2012).
[58] S. Forte, E. Laenen, P. Nason and J. Rojo, Heavy quarks in deep-inelastic scattering,
Nucl. Phys. B 834 (2010) 116 [arXiv:1001.2312] [INSPIRE].
[59] R. Thorne, A variable-flavor number scheme for NNLO, Phys. Rev. D 73 (2006) 054019
[hep-ph/0601245] [INSPIRE].
[60] M. Guzzi, P.M. Nadolsky, H.-L. Lai and C.-P. Yuan, General-mass treatment for deep
inelastic scattering at two-loop accuracy, Phys. Rev. D 86 (2012) 053005
[arXiv:1108.5112] [INSPIRE].
[61] R. Thorne, Effect of changes of variable flavor number scheme on parton distribution
functions and predicted cross sections, Phys. Rev. D 86 (2012) 074017 [arXiv:1201.6180]
[INSPIRE].
[62] NNPDF collaboration, R.D. Ball et al., Theoretical issues in PDF determination and
associated uncertainties, Phys. Lett. B 723 (2013) 330 [arXiv:1303.1189] [INSPIRE].
[63] ATLAS collaboration, Determination of the top-quark mass from the tt cross section
measurement in pp collisions at√s = 7TeV with the ATLAS detector,
ATLAS-CONF-2011-054 (2011).
[64] CMS colaboration, Determination of the top quark mass from the tt cross section at√s = 7TeV, CMS-PAS-TOP-11-008 (2011).
[65] U. Langenfeld, S. Moch and P. Uwer, Measuring the running top-quark mass,
Phys. Rev. D 80 (2009) 054009 [arXiv:0906.5273] [INSPIRE].
– 25 –
JHEP07(2013)167
[66] D0 collaboration, V. Abazov et al., Determination of the strong coupling constant from the
inclusive jet cross section in pp collisions at√s = 1.96TeV,
Phys. Rev. D 80 (2009) 111107 [arXiv:0911.2710] [INSPIRE].
[67] B. Malaescu and P. Starovoitov, Evaluation of the strong coupling constant αs using the
ATLAS inclusive jet cross-section data, Eur. Phys. J. C 72 (2012) 2041
[arXiv:1203.5416] [INSPIRE].
[68] CMS collaboration, Measurement of the ratio of the inclusive 3-jet to 2-jet cross-sections in
pp collisions at 7 tev and first determination of the strong coupling at transverse momenta
in the TeV range, CMS-PAS-QCD-11-003 (2011).
[69] CMS collaboration, First determination of the strong coupling constant from the tt cross
section, CMS-PAS-TOP-12-022 (2012).
[70] P.M. Nadolsky et al., Implications of CTEQ global analysis for collider observables,
Phys. Rev. D 78 (2008) 013004 [arXiv:0802.0007] [INSPIRE].
[71] NNPDF collaboration, R.D. Ball et al., Reweighting and unweighting of parton
distributions and the LHC W lepton asymmetry data, Nucl. Phys. B 855 (2012) 608
[arXiv:1108.1758] [INSPIRE].
[72] NNPDF collaboration, R.D. Ball et al., Reweighting NNPDFs: the W lepton asymmetry,
Nucl. Phys. B 849 (2011) 112 [Erratum ibid. B 854 (2012) 926-927] [arXiv:1012.0836]
[INSPIRE].
[73] T. Carli et al., A posteriori inclusion of parton density functions in NLO QCD final-state
calculations at hadron colliders: The APPLGRID Project, Eur. Phys. J. C 66 (2010) 503
[arXiv:0911.2985] [INSPIRE].
[74] G. Watt and R. Thorne, Study of Monte Carlo approach to experimental uncertainty
propagation with MSTW 2008 PDFs, JHEP 08 (2012) 052 [arXiv:1205.4024] [INSPIRE].
[75] ATLAS collaboration, Measurements of top quark pair relative differential cross-sections
with ATLAS in pp collisions at√s = 7 TeV, Eur. Phys. J. C 73 (2013) 2261
[arXiv:1207.5644] [INSPIRE].
[76] CMS collaboration, Measurement of differential top-quark pair production cross sections in
pp colisions at√s = 7 TeV, Eur. Phys. J. C 73 (2013) 2339 [arXiv:1211.2220] [INSPIRE].
[77] V. Ahrens, A. Ferroglia, M. Neubert, B.D. Pecjak and L.-L. Yang, RG-improved
single-particle inclusive cross sections and forward-backward asymmetry in tt production at
hadron colliders, JHEP 09 (2011) 070 [arXiv:1103.0550] [INSPIRE].
[78] R.D. Ball et al., Impact of heavy quark masses on parton distributions and LHC
phenomenology, Nucl. Phys. B 849 (2011) 296 [arXiv:1101.1300] [INSPIRE].
[79] NNPDF collaboration, R.D. Ball et al., Unbiased global determination of parton
distributions and their uncertainties at NNLO and at LO, Nucl. Phys. B 855 (2012) 153
[arXiv:1107.2652] [INSPIRE].
[80] J. Alwall et al., MadGraph/MadEvent v4: the new web generation, JHEP 09 (2007) 028
[arXiv:0706.2334] [INSPIRE].
[81] CMS collaboration, Search for resonant tt production in lepton+jets events in pp collisions
at√s = 7 TeV, JHEP 12 (2012) 015 [arXiv:1209.4397] [INSPIRE].
– 26 –

JHEP07(2013)167
[82] ATLAS collaboration, A search for tt resonances in lepton+jets events with highly boosted
top quarks collected in pp collisions at√s = 7 TeV with the ATLAS detector,
JHEP 09 (2012) 041 [arXiv:1207.2409] [INSPIRE].
[83] ATLAS collaboration, A search for tt resonances with the ATLAS detector in 2.05 fb−1 of
proton-proton collisions at√s = 7 TeV, Eur. Phys. J. C 72 (2012) 2083
[arXiv:1205.5371] [INSPIRE].
[84] ATLAS collaboration, Search for resonances decaying into top-quark pairs using fully
hadronic decays in pp collisions with ATLAS at√s = 7 TeV, JHEP 01 (2013) 116
[arXiv:1211.2202] [INSPIRE].
[85] R. Frederix et al., Four-lepton production at hadron colliders: aMC@NLO predictions with
theoretical uncertainties, JHEP 02 (2012) 099 [arXiv:1110.4738] [INSPIRE].
[86] S. Frixione and B.R. Webber, Matching NLO QCD computations and parton shower
simulations, JHEP 06 (2002) 029 [hep-ph/0204244] [INSPIRE].
[87] R. Frederix, S. Frixione, F. Maltoni and T. Stelzer, Automation of next-to-leading order
computations in QCD: the FKS subtraction, JHEP 10 (2009) 003 [arXiv:0908.4272]
[INSPIRE].
[88] G. Corcella et al., HERWIG 6: an event generator for hadron emission reactions with
interfering gluons (including supersymmetric processes), JHEP 01 (2001) 010
[hep-ph/0011363] [INSPIRE].
[89] M.L. Mangano and J. Rojo, Cross section ratios between different CM energies at the LHC:
opportunities for precision measurements and BSM sensitivity, JHEP 08 (2012) 010
[arXiv:1206.3557] [INSPIRE].
[90] CMS collaboration, Search for pair produced fourth-generation up-type quarks in pp
collisions at√s = 7 TeV with a lepton in the final state, Phys. Lett. B 718 (2012) 307
[arXiv:1209.0471] [INSPIRE].
[91] ATLAS collaboration, Search for pair production of heavy top-like quarks decaying to a
high-pT W boson and a b quark in the lepton plus jets final state at√s = 7 TeV with the
ATLAS detector, Phys. Lett. B 718 (2013) 1284 [arXiv:1210.5468] [INSPIRE].
[92] CMS collaboration, Combined search for the quarks of a sequential fourth generation,
Phys. Rev. D 86 (2012) 112003 [arXiv:1209.1062] [INSPIRE].
– 27 –