Embed Size (px)
Citation preview
MPRAMunich Personal RePEc Archive
Constraints to SMEs: A Rotated FactorAnalysis Approach.
Quader Syed Manzur and Abdullah Md.Nayeem
2008
Online at http://mpra.ub.uni-muenchen.de/26135/MPRA Paper No. 26135, posted 23. October 2010 00:22 UTC
1
Constraints to SMEs: A Rotated Factor Analysis
Approach.
Syed Manzur Quader (Lecturer)
Mohammad Nayeem Abdullah (Lecturer)
School of Business, Independent University Bangladesh, 12, Jamal Khan Road,
Chittagong- 4000, Bangladesh
Phone: 0088031-611262, Fax: 0088031-653475,
E-mail: [email protected]/ [email protected]
Abstract:
There is little doubt that SMEs plays a vital role in development of an underdeveloped
economy, but still this sector is facing multifarious problems relating to raw materials,
power, land, marketing, transport, technical facilities, and finance etc and due to these
constraints it is getting more difficult for them to contribute to nation‟s GDP as expected.
This paper attempts to find out the major constraints faced by the SMEs in Bangladesh
selected from five sub-sectors using varimax normalization method based on primary
questionnaire survey and rank the factor constraints according to their level of severity. It
identified seven major factors comprised of 12 variables working as impediments to SME
growth and development, amongst which high lending rate, government regulatory
constraint, small domestic market size, collateral requirement for financing and lack of
technically skilled workers are on the top.
JEL classification: L53,L67,L88,M21,O14,O16
Keywords: SME, Economic Growth, Constraint, Factors, Rotation, Varimax
2
I. Introduction:
The SMEs play a vital role in development of an underdeveloped economy because it
eliminates the unemployment problems by using lower capital per employment, avoids
additional costs for development of industrial infrastructure, minimizes the investment
risks, ensures an equitable distributions of income and products, checks imbalances
between different pocket of economy and maximizes the use of locally available raw
materials. There is a debate whether to adopt industrialization for efficiency or encourage
SMEs. (Little & Majumdar & Page, 1987). But the mechanical efficiency should be
distinguished from economic efficiency and as such the large factories need not be
evaluated as more efficient than the small units especially when the socio-economic cost
of large-scale production taken into account. (Ranjit & Rashid, 1996). The argument of
economy of scale has limited relevance to economic efficiency, due to stagnant markets
with poor purchasing power, lack of operational skills, poor quality of raw materials and
inefficient services resulting in long interruptions and poor output per unit of capital.
(Dhar, 1958) and in underdeveloped areas development of large-scale industries has been
slow, inadequate and ineffective in tackling the unemployment problems due to lack of
investible resources. (Mahalonabish, 1958).
The commonly perceived merits often emphasized for their promotion especially in the
developing countries like Bangladesh, include their relatively high labor intensity,
dependence on indigenous skills and technology, contributions to entrepreneurship
development and innovativeness and growth of industrial linkages. (Ahmed, 2001).
Whatever the correct magnitude, the SMEs are undoubtedly quite predominant in the
industrial structure of Bangladesh comprising over 90% of all industrial units. This
numerical predominance of the SMEs in industrial sector of Bangladesh becomes visible
in all available sources of statistics on them. (Ahmed, 2001). Together, the various
categories of SMES are reported to contribute between 80 to 85 per cent of industrial
employment and 23 per cent of total civilian employment (SEDF, 2003). However,
serious controversies surround their relative contribution to Bangladesh‟s industrial
output due to paucity of reliable information and different methods used to estimate the
magnitude. The most commonly quoted figure by different sources (ADB, World Bank,
3
Planning Commission and BIDS) relating to value added contributions of the SME is
seen to vary between 45 to 50 per cent of the total manufacturing value added.
But this sector is facing severe problem in financing, regulatory aspects, access to non-
financial inputs. Some recent trend shows that Government policies have discriminated
against small-scale enterprises. There is nothing wrong with a situation in which
inexperienced entrepreneurs are unable to get institutional credit. (Little, 1987). In the
same study he shows that, the relative decline of small-scale enterprises in most
developing countries has been accelerated by the industrialization policies adopted in
these countries. Protection, regulatory constraint, investment incentives, credit control,
and the promotion of industry in the public sector have all discriminated against the
small. The common idea that the cost of capital is very high for small enterprises is
overly simple. (Little, 1987). From A research of World Bank suggest the existence of
financial constraint because formal banks do not lend to the smallest firms in most
countries. It has also severe impact on the smallest firms. (Levy, 1993)
In Bangladesh, Small and medium enterprises have been facing multifarious problems
related to raw materials, power, land, marketing, transport, technical facilities, and
finance. (Ranjit & Rashid, 1996). Due to their weak capital structure and other regulatory
constraint, it‟s getting more difficult for small & medium industry to contribute to GDP
There is serious shortage of in depth studies conducted on the constraints of the SMES
operating in Bangladesh. So it is perceived that a well thought out study is very much
required to determine the nature of the various financial, regulatory as well as other
constraints faced by SMEs in Bangladesh.
The definition of SME is not unique; it varies across countries and in some countries the
definition differs further between sectors. Number of people employed and size of
capital, sales, assets, etc. are used to classify enterprises into micro, small, and medium.
In Bangladesh, small enterprises was first defined in the Industrial Policy of 1991 when
they were classified as industrial undertakings engaged in manufacturing or services
activities with a total fixed investment not exceeding Tk. 30 million. The Industrial
4
Policy of 1999 also considered the size of employment for defining various enterprises.
According to it, small enterprises are those employing less than 50 workers and/or with a
fixed capital investment of less than Tk100 million. Enterprises with 50-99 workers
having a fixed capita of Tk100-300 million are to be regarded as medium-sized.
Therefore, the coverage of SME as defined by the Industrial Policy is very broad –
capturing business enterprises with a fixed capital ranging from Tk 1 million to 300
million and employment between 10-99.We consider definition of 1999 industrial policy
to select our target population. However, the Bangladesh of Bureau of Statistics (BBS)
follows a different definition of SME (Bhattacharya et al. 2000 & Sia, 2003). BBS
defines large enterprises as those with 50 or more employees, which is inconsistent with
the definition of the SME as provided in the Industrial Policy.
Reliable information on the activities of SME and their contribution in the economy is
scarce. An informal estimate by Planning Commission is reported to have found that the
SME sector accounts for more than 80 per cent of private establishments, approximately
80 per cent of industrial and 23 per cent of total labor force of the country, and about half
of the gross industrial output (Sia, 2003). The most recent private sector survey estimates
the contribution of the micro, small, and medium enterprises (MSMEs) is to be between
20-25 per cent of GDP (Daniels, 2003). All this points toward a very important role
played by SME in the economy of Bangladesh in terms of output, employment, and
private sector activities
A vibrant private sector that builds on the combined linkages between SME and large
enterprises supported by good governance and an enabling business environment have
been considered as the backbone and engine of a healthy economy and society.
Especially in developing economies, it is regarded as a precondition for generating
employment, enhancing productivity, maintaining competitiveness, contributing to
entrepreneurship development and reducing poverty (ADB 1999; AusAID 2000; EBRD
2004;).
5
II. Literature review:
Past studies have indicated that in the developing countries of South Asia, SME
constitute over 97 per cent and contribute between 40–60 per cent of the total output or
value-added to their national economies. While most of the SME are located in rural
areas, they account for over 70 per cent of total employment (Fan 2005; Kamesam 2003;
Nepal et al. 2002; Shrestha 2005).
Today, a number of studies find that SMEs are frequently faced with constraints and
challenges (Bannock et al. 2002; Batra and Mahmood 2001; Batra and Tan 2003; Beck et
al. 2004; Brunetti et al. 1998). For most developing and transition economies, the
common challenges for SMEs typically include financing, overcoming institutional, legal
and administrative barriers and accessing network support. The inability to access credit
is one of the major bottlenecks of SME, as almost all of these economies have poorly
developed banking sectors (EBRD 2004; Hossain 1998; PECC 2003). From the data of
23 transition countries, Aidis and Sauka (2005) find that the constraints facing SME
differ during different stages in the transition process.
According to Lall (2000: 9–12), SME in general tend to face three sets of competitive
challenges. These are related with their size, distortions in markets and government
policy interventions. Their small size imposes disadvantages: SME are debilitated in
activities where the risks are high; technology is fast-paced and relies on enormous
investments. Second, SME face „segmented factor markets‟ wherein large firms are
generally favored with access to inputs including credit, labor, infrastructure, and
technology and market information. Third, policies and institutions can be biased against
SME, since large firms with resources and connections can manipulate bureaucrats „to
exploit the system‟.
Recognition of such problems of SME has led many developing countries to adopt pro-
SME policies. Fundamentally, pro-SME policies are based on direct government support
of SME that will help exploit social benefits from greater competition and
entrepreneurship. They basically include financial support and institutional improvements
6
that can absorb labor because proponents believe that SME, being more labor-intensive
and dispersed, have the capacity to boost employment faster than the larger firms. From
this perspective, subsidizing SME is perceived as a poverty alleviation tool (Beck et al.
2004; World Bank 1994, 2002a).
As a member of the developing countries, Bangladesh is yet to utilize its potential and
pick up it‟s performance in this sector. There have been a number of studies carried out
on the SME sector of Bangladesh to identify its niche and also the constraints hindering
the growth of this sector. A. Razzaque (1994) in his paper identifies the factors
fundamental to the development of market for products and then discusses the problems
associated with them in the context of Bangladesh emphasizing the need for addressing
these constraints to facilitate the growth of a SME sector. He identified the underlying
demand and supply-side factors exerting significant influences on the development of the
market for SME. The demand side factors like Purchasing power of consumers, Trade
policies of the trading partners, Quality of products and services, Timely delivery and
availability of goods etc and supply side factors like Resource constraints, Unavailability
of information, Physical infrastructure, transport cost, domestic environment etc. do not
operate in isolation. Rather, they interact amongst themselves to aggravate the situation
further.
Hossain (1998) in his paper highlighted the findings of those two studies. A wide array of
constraints faced by SME has been briefly discussed in this report. It is apparent that
problems related to power and credits are the two most significant ones. Legal barriers,
poor law and order conditions, are some of the other problems that have adverse affect on
SME development.
Besides Bangladesh, studies were also carried out on other south asian coutries like
Bhutan, Pakistan etc. S.Moktan (2007) analyses the constraints on SME in Bhutan by
conducting interviews and a nationwide questionnaire survey of 168 micro and small
firms. Examining 14 variables related to the attitude or opinions of owners/ managers of
7
SME with respect to business constraints and the survey indicated that the biggest
constraints are related to restrictive business regulations, finance and infrastructure.
Additionally, significant differences in the severity level of constraints between urban
and rural districts are observed with regards to size, sector and ownership.
Bari, & Ali & Haque (2005) examined the key constraints faced by the SME sector in
Pakistan, including lack of access to credit, excessive government regulation, an arbitrary
and exploitative tax administration system, a weak technological base, and the lack of
business support services. It also provides a set of concrete strategic recommendations to
address such constraints in order to promote SME growth for greater income generation
and employment creation.
III. Objective of the study:
I) To what extent financial constraints affecting SME‟s operation?
II) To what extent regulatory constraints affecting SME‟S operation?
III) To what extent constraints on physical, technical, and marketing inputs
affecting SME‟S operation?
IV. Structure and Methodology:
Questionnaire: The research design incorporates both qualitative and quantitative
approaches. Two major phases of data collection are envisaged: Exploratory phase and
Main phase. In exploratory phase, data is generated basically to develop a clear picture of
the problem. In this stage, extensive literature survey as well as a pilot study through
interview of selected businessman, bankers, government officials, donor organization
officials are conducted. After exploratory phase research we develop a questionnaire to
distribute to the SME owners. In exploratory phase we ask open ended questions in the
interview about the key constraints faced by S.M.E sector in Bangladesh including lack
of access to credit, excessive government regulation, and arbitrary and exploitive tax
administration system, a weak technological base, and lack of business support system. It
provides us to come up with set of 18 variables to develop a detailed questionnaire.
8
Finally the variables in the survey instrument were derived from a review policy,
exploratory research and the relevant theoretical and empirical literature.
We have outlined below the 18 variables fewer than three categories, which we have
included in our questioner survey:
Financial constraints:
1) Unavailability of financing. (UF)
2) Interest on bank loan. (IB)
3) Collateral requirement. (CR)
4) Lengthy procedure (LP)
5) High cost of raw materials (HCM)
6) High cost of equipment (HCE)
Regulatory constraints:
7) Bureaucratic set up procedure. (BSP)
8) Utility connection. (UC)
9) Income tax structure. (ITS)
10) Lack of protective measurement. (LPM)
11) Labor regulation. (LR)
12) Policy uncertainty. (PU)
Constraints on physical technical & marketing input:
13) Unavailability of skilled worker. (USW)
14) Scarcity of technical skill. (STS)
15) Unavailability of raw materials. (URM)
16) Small domestic market. (SDM)
17) Competition with large industries. (CLI)
18) 18) Syndication on concentrated market power. (SCM)
9
Because of the job of coding, editing and analyzing the data we avoid open-ended
question in main phase. On the basis of those 18 variables the survey asks entrepreneur to
evaluate each constraints variable using score on a scale on a five point likert‟s scale.
(Fixed alternative question).
Sample: The coverage of SME as defined by the Industrial Policy is very broad –
capturing business enterprises with a fixed capital ranging from Tk 1 million to 300
million and employment between 10-99.Abiding by that criteria using qualitative survey
instrument, 60 firms are sampled to ascertain what they viewed as major obstacles to
their investment and growth. We use the quota sampling procedure (non-probability
sampling). The purpose of quota sampling is to ensure that the various sub-groups in a
population are represented on pertinent sample characteristics to the exact extent that the
investigator desires. Given the limitation of time and resources interviews are conducted
in five sub sectors: light engineering, agro based, fish processing, food & allied products
and chemical and pharmaceuticals. We took their contribution in Bangladesh G.D.P to
choose the sectors. The required data are collected from 60 companies from those five
sub-sectors. We use Interview protocols (revised after the initial interviews) to guide the
discussion and to gather data usable in quantitative analysis.
Data analysis: In the first phase of analysis the survey data are used to rank the
“binding” constraints that currently inhibit firm-level investment and growth Bangladesh.
Binding constraints are defined as constraints that obtained and average score of 3.5 and
above (an above average rank) and which over 30% (nearly one third) of the respondents
ranked as an above average constraints. Unlike other studies the dual –weighting
procedure of defining binding constraints allowed greater precision and clarity in results.
In the second phase, we have factor analysis by extracting the principal components using
varimax/promax normalizes method. The different method of factor analysis requires
extracting a set of factors from a data set. In general, only a small subset of factors is kept
for further consideration and the remaining factors are considered as either irrelevant or
non-existent. It is important to stress that the choice of subspace strongly influences the

10
result of the rotation. We need to try several sizes for the subspace of the retained factor
in order to assess the robustness of the interpretation of the rotation. For varimax, a
simple solution means that each factor has a small number of large loadings and a large
number of zero loadings. After a varimax rotation, each original variable tends to be
associated with one of the factors. In general, two highly correlated factors are better
interpreted as only one factor. To avoid two highly correlated factors, we use oblique
rotation. The promax (oblique) rotation has the advantage of being fast and conceptually
simple. The factors can often be interpreted from the opposition of few variables.
11
V: Findings & analysis
Severity level of constraints after categorization:
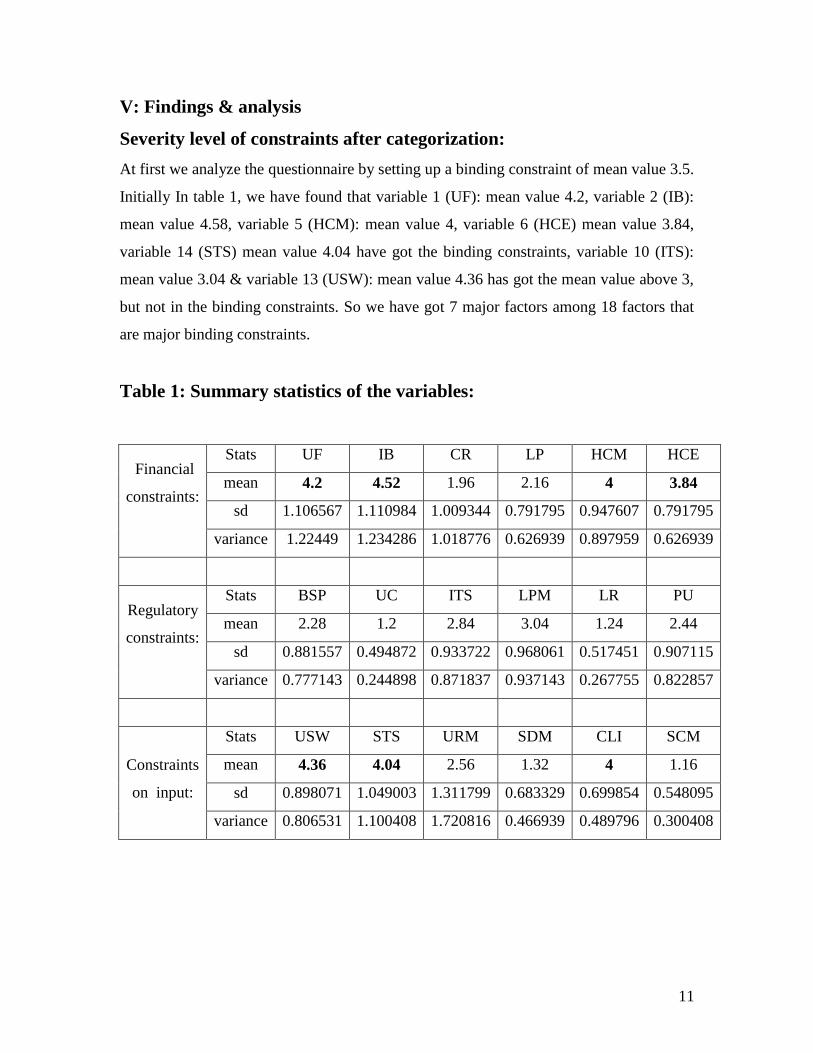
At first we analyze the questionnaire by setting up a binding constraint of mean value 3.5.
Initially In table 1, we have found that variable 1 (UF): mean value 4.2, variable 2 (IB):
mean value 4.58, variable 5 (HCM): mean value 4, variable 6 (HCE) mean value 3.84,
variable 14 (STS) mean value 4.04 have got the binding constraints, variable 10 (ITS):
mean value 3.04 & variable 13 (USW): mean value 4.36 has got the mean value above 3,
but not in the binding constraints. So we have got 7 major factors among 18 factors that
are major binding constraints.
Table 1: Summary statistics of the variables:
Financial
constraints:
Stats UF IB CR LP HCM HCE
mean 4.2 4.52 1.96 2.16 4 3.84
sd 1.106567 1.110984 1.009344 0.791795 0.947607 0.791795
variance 1.22449 1.234286 1.018776 0.626939 0.897959 0.626939
Regulatory
constraints:
Stats BSP UC ITS LPM LR PU
mean 2.28 1.2 2.84 3.04 1.24 2.44
sd 0.881557 0.494872 0.933722 0.968061 0.517451 0.907115
variance 0.777143 0.244898 0.871837 0.937143 0.267755 0.822857
Constraints
on input:
Stats USW STS URM SDM CLI SCM
mean 4.36 4.04 2.56 1.32 4 1.16
sd 0.898071 1.049003 1.311799 0.683329 0.699854 0.548095
variance 0.806531 1.100408 1.720816 0.466939 0.489796 0.300408
12
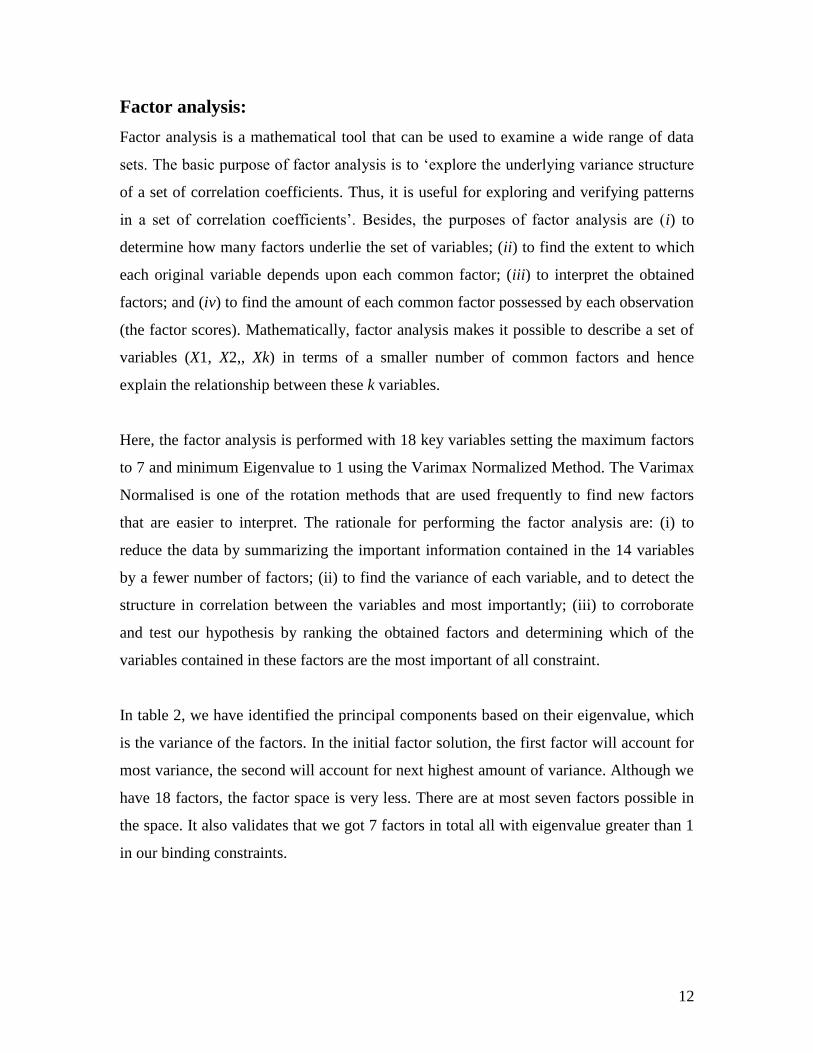
Factor analysis:
Factor analysis is a mathematical tool that can be used to examine a wide range of data
sets. The basic purpose of factor analysis is to „explore the underlying variance structure
of a set of correlation coefficients. Thus, it is useful for exploring and verifying patterns
in a set of correlation coefficients‟. Besides, the purposes of factor analysis are (i) to
determine how many factors underlie the set of variables; (ii) to find the extent to which
each original variable depends upon each common factor; (iii) to interpret the obtained
factors; and (iv) to find the amount of each common factor possessed by each observation
(the factor scores). Mathematically, factor analysis makes it possible to describe a set of
variables (X1, X2,, Xk) in terms of a smaller number of common factors and hence
explain the relationship between these k variables.
Here, the factor analysis is performed with 18 key variables setting the maximum factors
to 7 and minimum Eigenvalue to 1 using the Varimax Normalized Method. The Varimax
Normalised is one of the rotation methods that are used frequently to find new factors
that are easier to interpret. The rationale for performing the factor analysis are: (i) to
reduce the data by summarizing the important information contained in the 14 variables
by a fewer number of factors; (ii) to find the variance of each variable, and to detect the
structure in correlation between the variables and most importantly; (iii) to corroborate
and test our hypothesis by ranking the obtained factors and determining which of the
variables contained in these factors are the most important of all constraint.
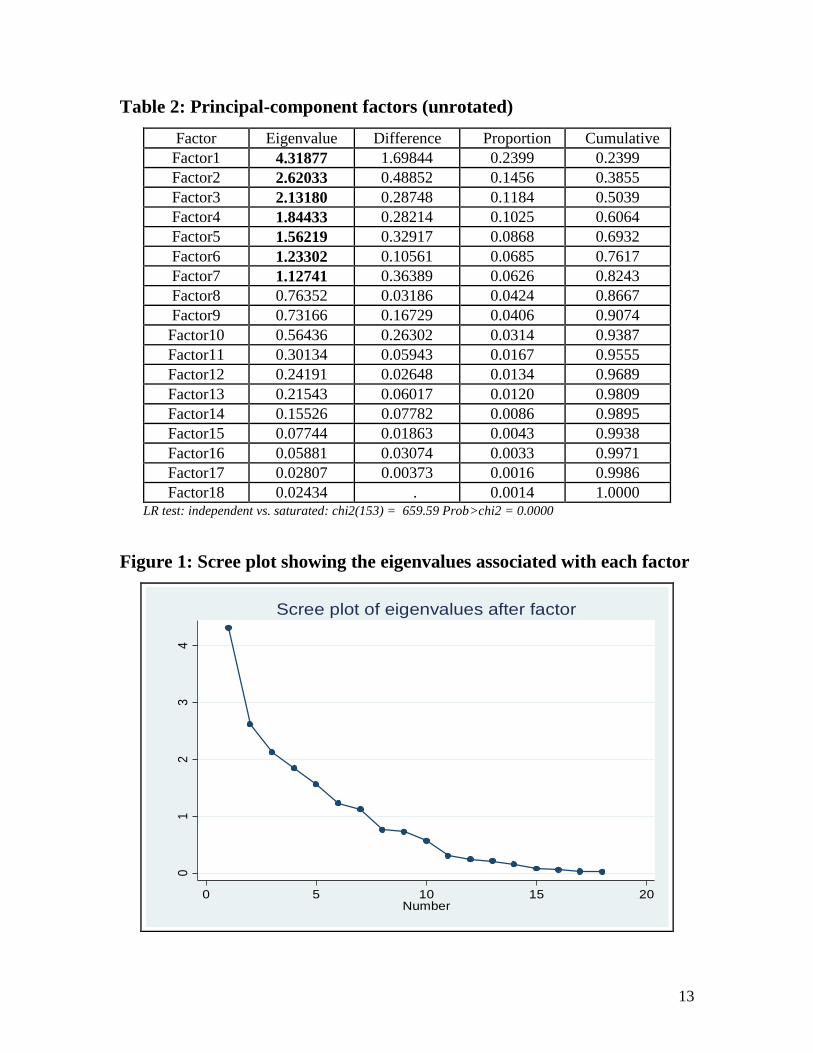
In table 2, we have identified the principal components based on their eigenvalue, which
is the variance of the factors. In the initial factor solution, the first factor will account for
most variance, the second will account for next highest amount of variance. Although we
have 18 factors, the factor space is very less. There are at most seven factors possible in
the space. It also validates that we got 7 factors in total all with eigenvalue greater than 1
in our binding constraints.
13
Table 2: Principal-component factors (unrotated)
Factor Eigenvalue Difference Proportion Cumulative
Factor1 4.31877 1.69844 0.2399 0.2399
Factor2 2.62033 0.48852 0.1456 0.3855
Factor3 2.13180 0.28748 0.1184 0.5039
Factor4 1.84433 0.28214 0.1025 0.6064
Factor5 1.56219 0.32917 0.0868 0.6932
Factor6 1.23302 0.10561 0.0685 0.7617
Factor7 1.12741 0.36389 0.0626 0.8243
Factor8 0.76352 0.03186 0.0424 0.8667
Factor9 0.73166 0.16729 0.0406 0.9074
Factor10 0.56436 0.26302 0.0314 0.9387
Factor11 0.30134 0.05943 0.0167 0.9555
Factor12 0.24191 0.02648 0.0134 0.9689
Factor13 0.21543 0.06017 0.0120 0.9809
Factor14 0.15526 0.07782 0.0086 0.9895
Factor15 0.07744 0.01863 0.0043 0.9938
Factor16 0.05881 0.03074 0.0033 0.9971
Factor17 0.02807 0.00373 0.0016 0.9986
Factor18 0.02434 . 0.0014 1.0000 LR test: independent vs. saturated: chi2(153) = 659.59 Prob>chi2 = 0.0000
Figure 1: Scree plot showing the eigenvalues associated with each factor
01
23
4
Eig
en
valu
es
0 5 10 15 20Number
Scree plot of eigenvalues after factor
14
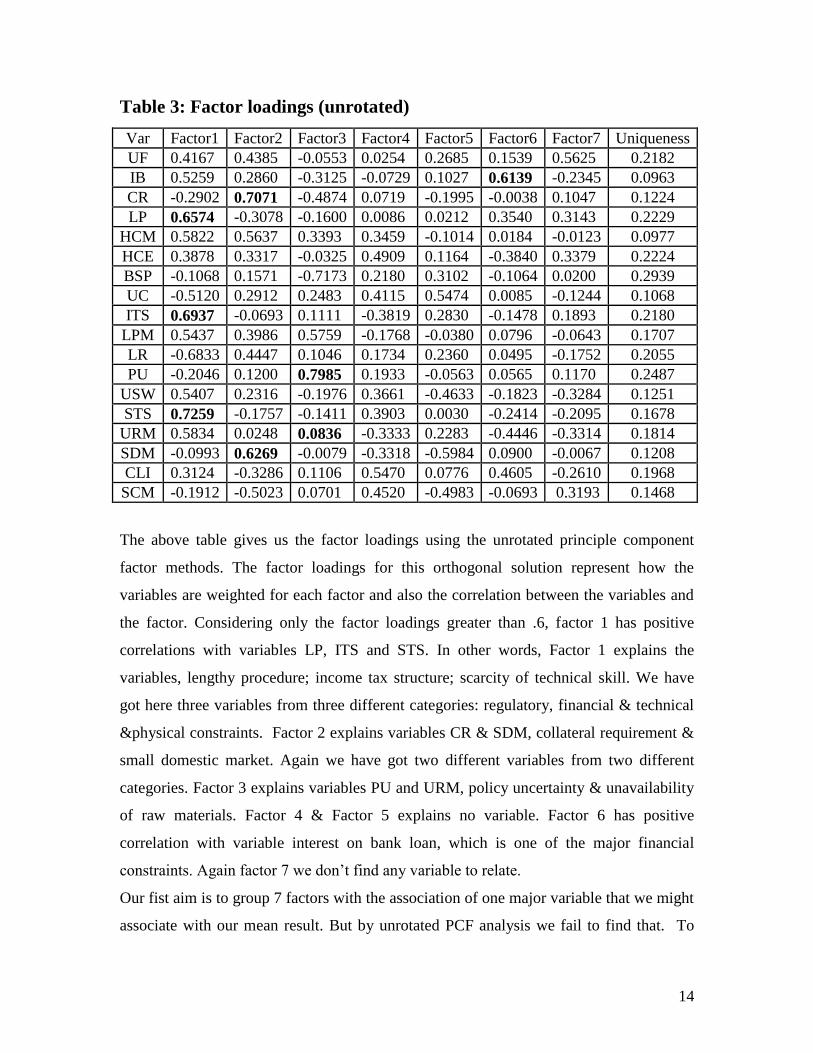
Table 3: Factor loadings (unrotated)
Var Factor1 Factor2 Factor3 Factor4 Factor5 Factor6 Factor7 Uniqueness
UF 0.4167 0.4385 -0.0553 0.0254 0.2685 0.1539 0.5625 0.2182
IB 0.5259 0.2860 -0.3125 -0.0729 0.1027 0.6139 -0.2345 0.0963
CR -0.2902 0.7071 -0.4874 0.0719 -0.1995 -0.0038 0.1047 0.1224
LP 0.6574 -0.3078 -0.1600 0.0086 0.0212 0.3540 0.3143 0.2229
HCM 0.5822 0.5637 0.3393 0.3459 -0.1014 0.0184 -0.0123 0.0977
HCE 0.3878 0.3317 -0.0325 0.4909 0.1164 -0.3840 0.3379 0.2224
BSP -0.1068 0.1571 -0.7173 0.2180 0.3102 -0.1064 0.0200 0.2939
UC -0.5120 0.2912 0.2483 0.4115 0.5474 0.0085 -0.1244 0.1068
ITS 0.6937 -0.0693 0.1111 -0.3819 0.2830 -0.1478 0.1893 0.2180
LPM 0.5437 0.3986 0.5759 -0.1768 -0.0380 0.0796 -0.0643 0.1707
LR -0.6833 0.4447 0.1046 0.1734 0.2360 0.0495 -0.1752 0.2055
PU -0.2046 0.1200 0.7985 0.1933 -0.0563 0.0565 0.1170 0.2487
USW 0.5407 0.2316 -0.1976 0.3661 -0.4633 -0.1823 -0.3284 0.1251
STS 0.7259 -0.1757 -0.1411 0.3903 0.0030 -0.2414 -0.2095 0.1678
URM 0.5834 0.0248 0.0836 -0.3333 0.2283 -0.4446 -0.3314 0.1814
SDM -0.0993 0.6269 -0.0079 -0.3318 -0.5984 0.0900 -0.0067 0.1208
CLI 0.3124 -0.3286 0.1106 0.5470 0.0776 0.4605 -0.2610 0.1968
SCM -0.1912 -0.5023 0.0701 0.4520 -0.4983 -0.0693 0.3193 0.1468
The above table gives us the factor loadings using the unrotated principle component
factor methods. The factor loadings for this orthogonal solution represent how the
variables are weighted for each factor and also the correlation between the variables and
the factor. Considering only the factor loadings greater than .6, factor 1 has positive
correlations with variables LP, ITS and STS. In other words, Factor 1 explains the
variables, lengthy procedure; income tax structure; scarcity of technical skill. We have
got here three variables from three different categories: regulatory, financial & technical
&physical constraints. Factor 2 explains variables CR & SDM, collateral requirement &
small domestic market. Again we have got two different variables from two different
categories. Factor 3 explains variables PU and URM, policy uncertainty & unavailability
of raw materials. Factor 4 & Factor 5 explains no variable. Factor 6 has positive
correlation with variable interest on bank loan, which is one of the major financial
constraints. Again factor 7 we don‟t find any variable to relate.
Our fist aim is to group 7 factors with the association of one major variable that we might
associate with our mean result. But by unrotated PCF analysis we fail to find that. To
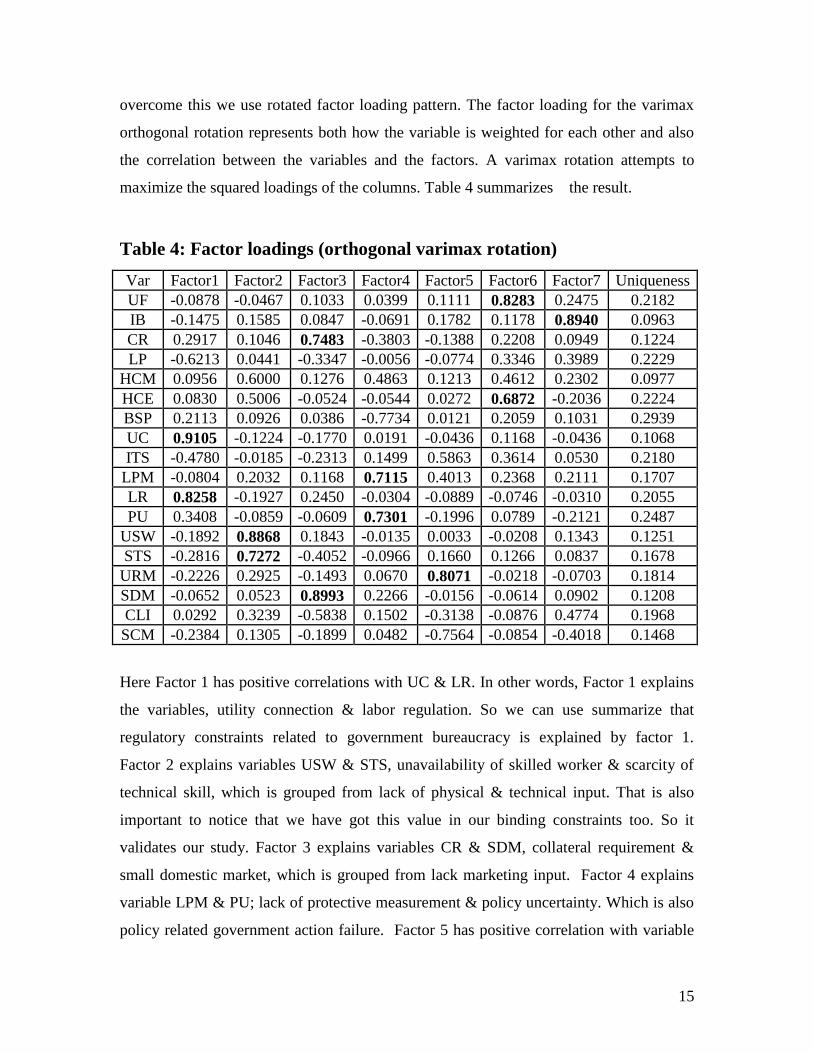
15
overcome this we use rotated factor loading pattern. The factor loading for the varimax
orthogonal rotation represents both how the variable is weighted for each other and also
the correlation between the variables and the factors. A varimax rotation attempts to
maximize the squared loadings of the columns. Table 4 summarizes the result.
Table 4: Factor loadings (orthogonal varimax rotation)
Var Factor1 Factor2 Factor3 Factor4 Factor5 Factor6 Factor7 Uniqueness
UF -0.0878 -0.0467 0.1033 0.0399 0.1111 0.8283 0.2475 0.2182
IB -0.1475 0.1585 0.0847 -0.0691 0.1782 0.1178 0.8940 0.0963
CR 0.2917 0.1046 0.7483 -0.3803 -0.1388 0.2208 0.0949 0.1224
LP -0.6213 0.0441 -0.3347 -0.0056 -0.0774 0.3346 0.3989 0.2229
HCM 0.0956 0.6000 0.1276 0.4863 0.1213 0.4612 0.2302 0.0977
HCE 0.0830 0.5006 -0.0524 -0.0544 0.0272 0.6872 -0.2036 0.2224
BSP 0.2113 0.0926 0.0386 -0.7734 0.0121 0.2059 0.1031 0.2939
UC 0.9105 -0.1224 -0.1770 0.0191 -0.0436 0.1168 -0.0436 0.1068
ITS -0.4780 -0.0185 -0.2313 0.1499 0.5863 0.3614 0.0530 0.2180
LPM -0.0804 0.2032 0.1168 0.7115 0.4013 0.2368 0.2111 0.1707
LR 0.8258 -0.1927 0.2450 -0.0304 -0.0889 -0.0746 -0.0310 0.2055
PU 0.3408 -0.0859 -0.0609 0.7301 -0.1996 0.0789 -0.2121 0.2487
USW -0.1892 0.8868 0.1843 -0.0135 0.0033 -0.0208 0.1343 0.1251
STS -0.2816 0.7272 -0.4052 -0.0966 0.1660 0.1266 0.0837 0.1678
URM -0.2226 0.2925 -0.1493 0.0670 0.8071 -0.0218 -0.0703 0.1814
SDM -0.0652 0.0523 0.8993 0.2266 -0.0156 -0.0614 0.0902 0.1208
CLI 0.0292 0.3239 -0.5838 0.1502 -0.3138 -0.0876 0.4774 0.1968
SCM -0.2384 0.1305 -0.1899 0.0482 -0.7564 -0.0854 -0.4018 0.1468
Here Factor 1 has positive correlations with UC & LR. In other words, Factor 1 explains
the variables, utility connection & labor regulation. So we can use summarize that
regulatory constraints related to government bureaucracy is explained by factor 1.
Factor 2 explains variables USW & STS, unavailability of skilled worker & scarcity of
technical skill, which is grouped from lack of physical & technical input. That is also
important to notice that we have got this value in our binding constraints too. So it
validates our study. Factor 3 explains variables CR & SDM, collateral requirement &
small domestic market, which is grouped from lack marketing input. Factor 4 explains
variable LPM & PU; lack of protective measurement & policy uncertainty. Which is also
policy related government action failure. Factor 5 has positive correlation with variable
16
unavailability of raw materials clearly indicating the lacking of physical input. Factor 6
explains variable UF & variable HCE; unavailability of financing and high cost of
equipment. These two are also binding financing constraints. Factor 6 explains
unavailability of financing is major issue. Factor 7 explains interest on bank loan is also a
major issue, which is another financial constraints & binding constraints.
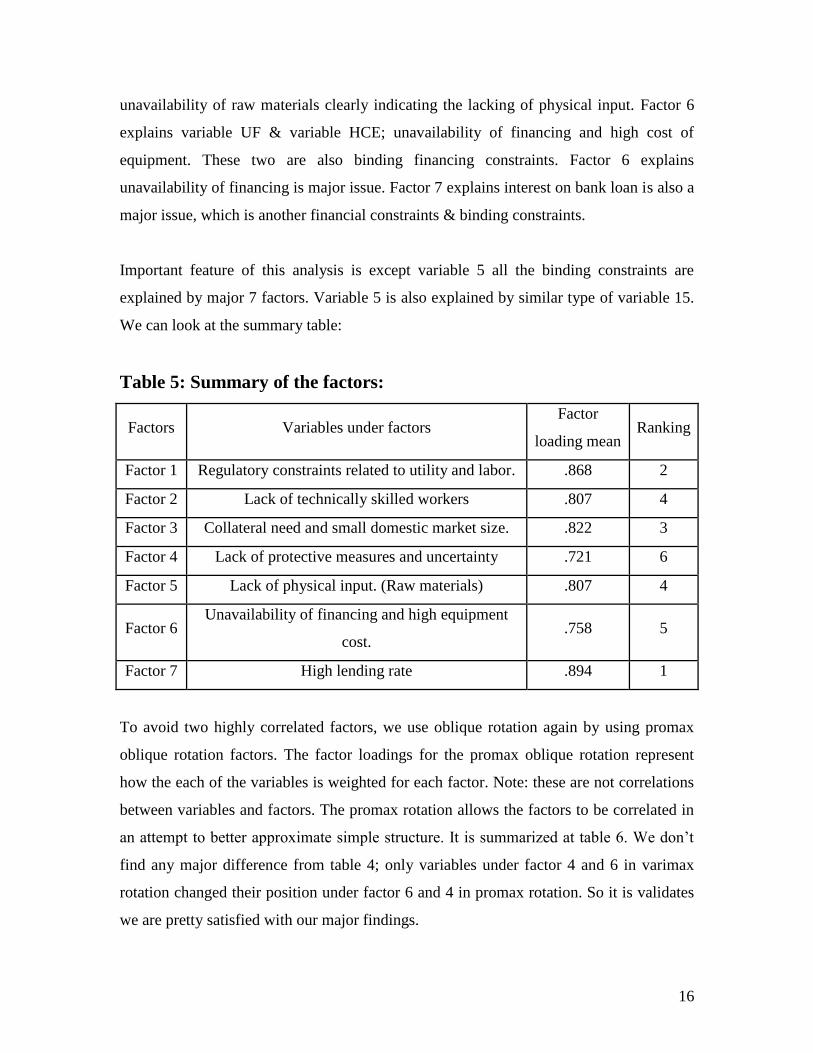
Important feature of this analysis is except variable 5 all the binding constraints are
explained by major 7 factors. Variable 5 is also explained by similar type of variable 15.
We can look at the summary table:
Table 5: Summary of the factors:
Factors Variables under factors Factor
loading mean Ranking
Factor 1 Regulatory constraints related to utility and labor. .868 2
Factor 2 Lack of technically skilled workers .807 4
Factor 3 Collateral need and small domestic market size. .822 3
Factor 4 Lack of protective measures and uncertainty .721 6
Factor 5 Lack of physical input. (Raw materials) .807 4
Factor 6 Unavailability of financing and high equipment
cost. .758 5
Factor 7 High lending rate .894 1
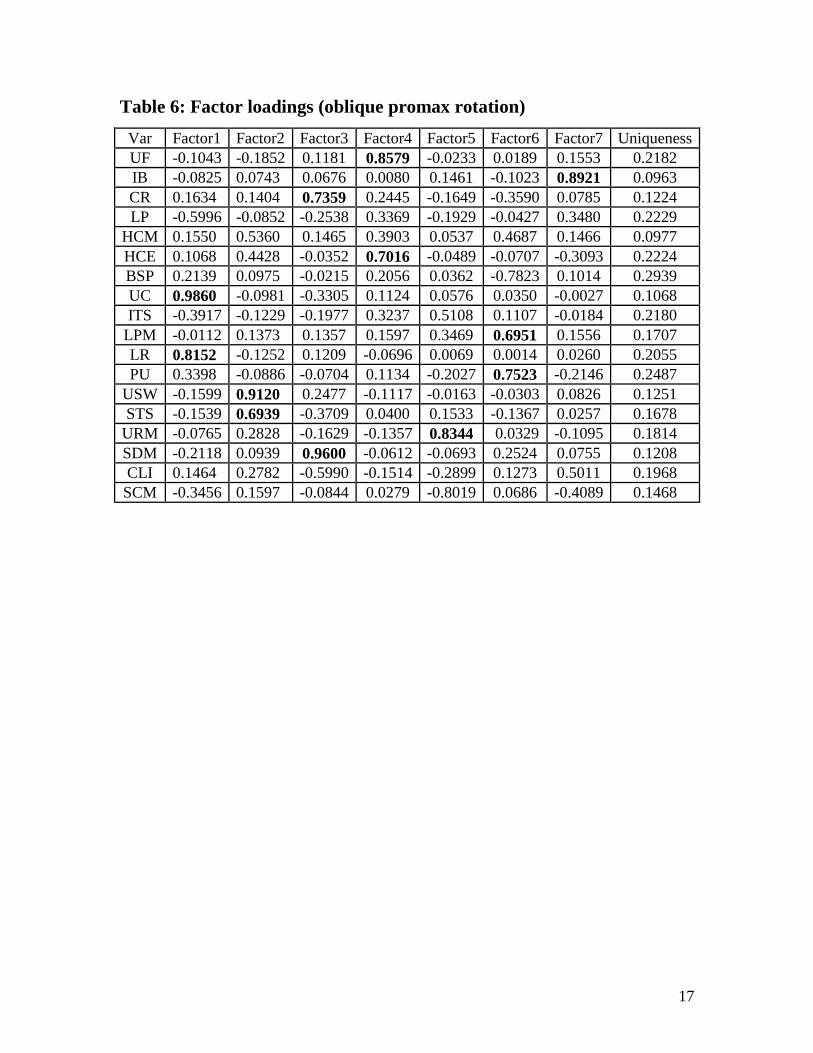
To avoid two highly correlated factors, we use oblique rotation again by using promax
oblique rotation factors. The factor loadings for the promax oblique rotation represent
how the each of the variables is weighted for each factor. Note: these are not correlations
between variables and factors. The promax rotation allows the factors to be correlated in
an attempt to better approximate simple structure. It is summarized at table 6. We don‟t
find any major difference from table 4; only variables under factor 4 and 6 in varimax
rotation changed their position under factor 6 and 4 in promax rotation. So it is validates
we are pretty satisfied with our major findings.
17
Table 6: Factor loadings (oblique promax rotation)
Var Factor1 Factor2 Factor3 Factor4 Factor5 Factor6 Factor7 Uniqueness
UF -0.1043 -0.1852 0.1181 0.8579 -0.0233 0.0189 0.1553 0.2182
IB -0.0825 0.0743 0.0676 0.0080 0.1461 -0.1023 0.8921 0.0963
CR 0.1634 0.1404 0.7359 0.2445 -0.1649 -0.3590 0.0785 0.1224
LP -0.5996 -0.0852 -0.2538 0.3369 -0.1929 -0.0427 0.3480 0.2229
HCM 0.1550 0.5360 0.1465 0.3903 0.0537 0.4687 0.1466 0.0977
HCE 0.1068 0.4428 -0.0352 0.7016 -0.0489 -0.0707 -0.3093 0.2224
BSP 0.2139 0.0975 -0.0215 0.2056 0.0362 -0.7823 0.1014 0.2939
UC 0.9860 -0.0981 -0.3305 0.1124 0.0576 0.0350 -0.0027 0.1068
ITS -0.3917 -0.1229 -0.1977 0.3237 0.5108 0.1107 -0.0184 0.2180
LPM -0.0112 0.1373 0.1357 0.1597 0.3469 0.6951 0.1556 0.1707
LR 0.8152 -0.1252 0.1209 -0.0696 0.0069 0.0014 0.0260 0.2055
PU 0.3398 -0.0886 -0.0704 0.1134 -0.2027 0.7523 -0.2146 0.2487
USW -0.1599 0.9120 0.2477 -0.1117 -0.0163 -0.0303 0.0826 0.1251
STS -0.1539 0.6939 -0.3709 0.0400 0.1533 -0.1367 0.0257 0.1678
URM -0.0765 0.2828 -0.1629 -0.1357 0.8344 0.0329 -0.1095 0.1814
SDM -0.2118 0.0939 0.9600 -0.0612 -0.0693 0.2524 0.0755 0.1208
CLI 0.1464 0.2782 -0.5990 -0.1514 -0.2899 0.1273 0.5011 0.1968
SCM -0.3456 0.1597 -0.0844 0.0279 -0.8019 0.0686 -0.4089 0.1468
18
Conclusion: The main findings of the study have generated some important implications for
alleviating or resolving various constraints facing SMEs, which may be a big challenge
for Bangladesh. The findings also substantiate that there is no „SME-specific‟ policy in
place in Bangladesh. Evidence suggests that micro and small firms are often
discriminated against vis-à-vis relatively large firms. While large established enterprises
possess the necessary economic and human resource potential to cope with regulatory
surprises and overcome difficulties, SMEs, due to their size, vulnerabilities and response
capacity, are far less capable of adapting and confronting challenges in an uncongenial
investment climate and business environment. While SMEs in Bangladesh may not be
deliberately discriminated against by legal or administrative regulations, they do remain
susceptible to unequal treatment due to dissimilarity in economic capacities, transition
phases, resource potential, location reasons, lack of well-disposed connections and so
forth. Such biases result in the distortion of a competitive environment for business in
which the major brunt is often confronted by fragile micro and cottage enterprises, which
then could lead to the proliferation of informal business.
In Bangladesh, high lending rate surfaced as the biggest constraint in the growth of
SMEs. Regulatory constraints related to utility and labor comes in second position. It
indicates that Policies should be consistent without surprises. Small firms in particular
must be given an adequate moratorium‟ to let them adjust to new changes and that extra
attention must be paid to safeguard SMEs against „bureaucratic discretions‟.
Finally, Collateral need and small domestic market size Lack of technically skilled
workers Lack of physical input. (Raw materials), Unavailability of financing and high
equipment cost, Lack of protective measures and uncertainty also shows lack of
government support to assist SMEs to compete in global arena.
19
Bibliography:
1. ADB. (1999). Private Sector Development Strategy: Promoting the Private Sector
for Growth and Poverty Reduction. Manila: Asian Development Bank, retrieved
from www.adb.org/Documents/Policies/ Private _Sector/private. pdf on 2 August
2007.
2. Ahmed, Momtaz Uddin (2001). Globalization and Competitiveness of
Bangladesh‟s Small scale Industries (SSIs): An Analysis of the Prospects and
Challenges, in CPD/UPL published, Bangladesh facing the Challenges of
Globalisation, IRBD. pp: 2.
3. Ahmed, Momtaz Uddin (1999, Jan-march). Development of Small-scale
Industries in Bangladesh in the New Millennium: Challenges and Opportunities,
Asian Affairs, Vol. 21, No.1. PP. 4
4. Aus Aid. (2000). Private Sector Development through Australia‟s Aid Program.
Canberra: Australian Agency for International Development, retrieved from
www.ausaid.gov.au/publications/pdf/privsectordevel.pdf on 4 August 2007.
5. Bari, & Ali & Haque, (2005). SME development in Pakistan: Analyzing the
constraint on Growth. Pakistan Resident Mission Working Paper No .3,
Islamabad: ADB.
6. Bannock, & Graham, & Matthew Gamser, & Mariell Juhlin & Andrew. (2002)
„Indigenous Private Sector Development and Regulation in Africa and Central
Europe: A 10 Country Study‟, London: Bannock Consulting, accessed from
http://www.dai.com/pdf/IndigenousPrivateSectorDevelopment.pdf (on 9
December 2007).
7. Batra, Geeta and Hong Tan. (2003,september). SME Technical Efficiency and Its
Correlates: Cross-National Evidence and Policy Implications. World Bank
InstituteWorkingPaper,Retrieved
fromhttp://info.worldbank.org/etools/docs/library/86489/ses3.1_smetechefficienc
y.pdf (on 9 October 2007).
20
8. Batra, & Geeta & Mahmood. (2001). Direct Support to Private Firms: Evidence
on Effectiveness, World Bank Policy Research Working Paper 3170, November,
accessed from
http://info.worldbank.org/etools/docs/library/86493/ses3.2_directsupport.pdf (on
9 October 2007).
9. Beck, & Thorsten, & Asli & Ross Levine. (2004.) SME, Growth, and Poverty:
Cross-Country Evidence, World Bank Policy Research Working Paper 3178,
accessed from https://rru.worldbank.org/PapersLinks/Open.aspx?id=2478 (on 9
October 2007).
10. Brunetti, & Aymo, & Kisunko & Weder. (1998, September). Credibility of Rules
and Economic Growth: Evidence from a Worldwide Survey of the Private
Sector‟, The World Bank Economic Review 12 (3), PP: 353–384.
11. Bhattacharya, D. (2002), Bangladesh Economy in fiscal year 2001:
Macroeconomic Performance, in Rehman Sobhan (ed.) Chapter 2 in Bangladesh
Facing the Challenges of Globalization: A Review of Bangladesh’s Development
2001, Center for Policy Dialogue and University Press Limited, Dhaka.
12. Bhattacharya, D., Faiz, N., & Zohir, S. (2000), Policy for Employment Generation
in the Informal Sector of Bangladesh .A Study Prepared for the International
Labor Office, Center for Policy Dialogue, Dhaka.
13. Capacity Building, 2nd OECD Conference of Ministers Responsible for Small
and Medium-Sized enterprises, Istanbul, Turkey, (3–5 June,2007) accessed from
http://www.oecd.org/dataoecd/6/7/31919278.pdf (on 24 September 2007).
14. Chowudhury,R .& Rashid, H. (1996) The role of Small Scale Industries in an
Under-developed Economy with reference to Bangladesh. Chittagong University
studies (commerce) Vol. 12, pp 45.
15. Chowudhury, R. & Rashid, H. (1996). The role of Small Scale Industries in an
Under-developed Economy with reference to Bangladesh. Chittagong University
studies (commerce) Vol. 12, pp 48.
16. Razzaque, Abdur (24th
dec, 2003). Market development for Bangladesh‟s SMEs:
An analysis of issues to constraints. (Paper prepared for a seminar of Bangladesh
Enterprise Institute)
21
17. Dhar,P.N .(1958) Small scale industries in Delhi, Bombay : Asia publishing
house, , p.6.
18. EBRD. (2004). SME Finance in the Early Transition Countries: The EBRD‟s
Experience, European Bank of Reconstruction and Development, accessed from
http://www.ebrd.com/pubs/legal/lit042h.pdf (on 6 November 2007).
19. Fan, Qimiao, Alberto Criscuolo and Iva Ilieva-Hamel. (2005).Whither SME
Policies?DevelopmentOutreach,March,accessefromhttp://www1.worldbank.org/d
evoutreach/mar05/article.asp?id=286 (on 8 October 2007).
20. Hossain, N. (1998), “Constraints to SME Development in Bangladesh”, Paper
Prepared for Job Opportunities And Business Support (Jobs) Program, mimeo.
21. Hossain, Najmul. (1998). Constraints to SME Development in Bangladesh, in Job
Opportunities an Business Support (JOBS) Program, Institutional Reform and the
InformalSectorUniversityofMarylandatCollegePark,accessedfromhttp://www.iris.
umd.edu/download.aspx?ID=580c5484-fe70-4f80-8282-2d906aaa224f (on 8
October 2007).
22. Kamesam, Vepa. (2003, September 9). Financing for Entrepreneurship and SME:
An Indian Perspective‟, OECD Workshop on „Entrepreneurship in a Global
Economy:
StrategicIssuesandPolicies‟,Budapest,Hungary,September,accessedfromhttp://rbi.
org.in/scripts/BS_ViewBulletin.aspx?Id=4806 (on8 July 2007).
23. Levy, B. Obstacles to Developing Indigenous Small and Medium Enterprises:
An Empirical Assessment. Source: The World Bank Economic Review, Vol. 7,
No. 1, (Jan., 1993), pp. 72. Published by: Oxford University PressStable URL:
http://www.jstor.org/stable/3989871
24. M. Suresh. (2007) Analyzing Constraints to Growth. Development of Small and
Medium Enterprises in Bhutan: South Asian Survey.vol. 14. pp. 251
http://sas.sagepub.com/cgi/content/abstract/14/2/251
25. Little, & Mazumdar, & Page,(1987). Small Manufacturing Enterprises: A
Comparative Analysis of India and Other Economies (New York: Oxford
University Press, for the World Bank,). pp 313
22
26. Little, (Jan, 1987). Small Manufacturing Enterprises in Developing Countries.
Source: The World Bank Economic Review, Vol. 1, No. 2, pp. 203-235,
Published by: Oxford University Press.Stable URL:
http://www.jstor.org/stable/3989829
27. Lall, Sanjaya.(2000) . Strengthening SME for International Competitiveness‟,
Workshop on „What MakesYour Firm Internationally Competitive?‟ Egyptian
Centre for Economic Studies,Cairo,6–8March,accessed
frohttp://worldbank.org/mdf/mdf3/papers/firm/Lall.pdf (on 9 November 2007).
28. Mahalonabish, P. (1968). Approach to planning in India, quoted by Gunner
Myrdall, Asian Drama: an Inquiry into poverty of nations, Vol III. London: Allen
lane the Penguin Press, ,pp .1219.
29. Nepal, Chiranjibi, Bishwa Raj Karki and Kabya Prasad Niraula. 2002.
„Technology Transfer in SME: Problems and Issues in the Context of Nepal‟,
accessed from www.unescap.org/tid/publication/indpub2306_chap3.pdf (on 18
September 2007).
30. PECC. (2003.) Financing Small and Medium Enterprises Challenges and Options,
Issues@PECC, Pacific Economic Cooperation Council, accessed from
http://www.pecc.org/finance/papers/FF-financingsmes (2003).pdf (on 17
September 2007).
31. Small Enterprise Development Facilities (SEDF/World Bank):
The SME Sector: Taking Stock of the Present Situation, mimeo, Dhaka, 2003.
32. Sia, M. T. (2003), “SME Finance”, Paper Prepared for the Asian Development
Bank, mimeo (work in process).
33. Shrestha, Binod K. (2005) .SME Promotion Strategies and Poverty Alleviation in
Nepal‟, in Utz Dornbergerand Ingrid Fromm (eds), Private Sector Development
and Poverty Reduction: Experiences from Developing Countries. SEPT Working
Paper No. 20, Small Enterprise Promotion and Training (SEPT),University of
Leipzig,34-
43,accessedfrohttp://www.red.or.id/index.php?option=com_docman&task=doc_v
iew&gid=38 (on 8 November 2007).


![Beer Fishbone Diagram - Rotated[1]](https://img.pdfslide.us/doc/110x75/55400001550346a57f8b493e/beer-fishbone-diagram-rotated1.jpg)