Embed Size (px)
Citation preview
GEOLOGY, December 2011 1127
INTRODUCTIONThe surface temperature distribution of an
active lava body has been used to derive infor-mation regarding lava composition and is a necessary boundary condition for estimating the rate at which lavas cool. It can also provide information regarding the degree to which lava crusts are fractured or fl ow surfaces thermally renew (Crisp and Baloga, 1990). Lava cooling is an important input into lava fl ow simulation models, as it drives the calculated changes in viscosity and yield strength, which determine the predicted cooling-limited length (Harris and Rowland, 2001). Temporal variations in the temperature of fractures on the surface of active lava domes have been found to be an indicator of their over-pressurization and the propensity of dome-hosting volcanoes to erupt explosively (Oppenheimer et al., 1993a). On the Jovian moon Io, lava surface temperatures of between 1400 and 1700 °C (McEwen et al., 1998) retrieved from analysis of data acquired during the National Aeronautics and Space Administra-tion’s (NASA’s) Galileo mission have been used to argue for the eruption of ultramafi c lavas, a conclusion that has implications for the thermal state of the Ionian mantle.
Although remote sensing has long offered the potential to document the detailed surface tem-perature characteristics of active lavas (Rothery
et al., 1988), this promise has not yet been fully realized. This is in part because the data avail-able have been of insuffi cient spectroradiometric fi delity to accurately retrieve lava surface tem-peratures over the commonly observed range of lava eruption conditions (Wright and Flynn, 2003). In Wright et al. (2010), we showed how spectral radiance data acquired by an imaging spectrometer (the Hyperion sensor carried on NASA’s Earth Observing–1 [EO-1] spacecraft) can be used to quantify the surface temperature characteristics of active lavas, due to the fact that Hyperion provides unsaturated radiance data for all points on the active lava surface.
The objective of this work is to establish how the surface temperature distributions of terres-trial lavas vary as a function of eruption style and lava composition. This has been achieved by analyzing 61 hyperspectral remote sensing data sets covering the full range of common eruptive styles, including mafi c lava fountains, lava fl ows (both ‘a‘a and pahoehoe types), and lava lakes, in addition to lava domes of inter-mediate and felsic composition. The images were acquired over 13 volcanoes, such that the provenance of the thermal emission data is well known with respect to the lava composition and eruption style that produced it.
METHODHyperion acquires spectral radiance data in
242 wavebands between 0.4 and 2.5 μm at a
spectral resolution of 10 nm and a spatial resolu-tion of 30 m. The spectral radiance (Lλ) emitted from a lava surface can be written as:
L f L Tii
n
iλ λ==∑ ( )
1
, , (1)
where Ti is the temperature of the ith compo-nent and fi is the fraction of the sensor’s instan-taneous fi eld of view that it occupies. For any pixel, although some wavebands may saturate at longer wavelengths, useable radiance data can be found at increasingly shorter wave-lengths. Saturated wavebands were excluded, and the remaining spectral measurements were corrected for the nonunitary graybody emis-sivity of the lava (basalt 0.95, Oppenheimer et al., 1993b; andesite 0.95, Oppenheimer et al., 1993a; dacite 0.82, Harris et al., 2002) and absorption of the surface-leaving radiance by the atmosphere (estimated using the MOD-TRAN [http://modtran.org/] radiative transfer code, assuming an appropriate atmosphere, sea-son, and altitude for each volcano). Rothery et al. (1988) indicated that an uncertainty of ±0.2 in emissivity translates into only ±15 °C in pixel integrated temperatures, while the error intro-duced by the atmospheric correction is unlikely to exceed 5–10 °C. Nighttime data were used to avoid contamination of the emitted radiance by refl ected sunlight. Pixels were identifi ed as containing active lava if they exhibited spectral radiance >5 W m–2 sr–1 μm–1 at 2.24 μm.
The best-fi t solution of Equation 1 to each spectral radiance spectrum was then obtained, to yield a Ti-fi solution for each image pixel, using the Levenberg-Marquardt method. Ti was allowed to fl oat between limits of 100 °C (the theoretical lower sensitivity limit of Hyperion) and 1200 °C (beyond the basalt liquidus), while fi was allowed to fl oat between values of 0 and 1. The sum of the fi values was constrained to not exceed one, but could (and usually did) sum to less than one, the remainder of the pixel being too cool to radiate signifi cantly at these wavelengths. Wright et al. (2010) found that most solutions converged when i = 2 or 3. The solution with the lowest root mean square error was retained.
We analyzed 61 Hyperion images to quan-tify the surface temperature distributions of the lavas they contained. This group included 10 images of ‘a‘a lava fl ows (Mount Etna, Sicily;
Geology, December 2011; v. 39; no. 12; p. 1127–1130; doi:10.1130/G32341.1; 2 fi gures.© 2011 Geological Society of America. For permission to copy, contact Copyright Permissions, GSA, or [email protected].
*E-mail: [email protected].
Constraints on determining the eruption style and composition of terrestrial lavas from spaceRobert Wright1*, Lori Glaze2, and Stephen M. Baloga3
1Hawai‘i Institute of Geophysics and Planetology, University of Hawai‘i at Manoa, Honolulu, Hawaii 96822, USA2National Aeronautics and Space Administration, Goddard Space Flight Center, Greenbelt, Maryland 20771, USA3Proxemy Research Inc., 20528 Farcroft Lane, Gaithersberg, Maryland 20882, USA
ABSTRACTThe surface temperatures of active lavas relate to cooling rates, chemistry, and eruption style.
We analyzed 61 hyperspectral satellite images acquired by the National Aeronautics and Space Administration’s Earth Observing–1 (EO-1) Hyperion imaging spectrometer to document the surface temperature distributions of active lavas erupted at 13 volcanoes. Images were selected to encompass the range of common lava eruption styles, specifi cally, lava fountains, fl ows, lakes, and domes. Our results reveal temperature distributions for terrestrial lavas that correlate with composition (i.e., a statistically signifi cant difference in the highest temperatures retrieved for mafi c lavas and intermediate and felsic lavas) and eruption style. Maximum temperatures observed for mafi c lavas are ~200 °C higher than for intermediate and felsic lavas. All eruption styles exhibit a low-temperature mode at ~300 °C; lava fountains and ‘a‘ a flows also exhibit a higher-temperature mode at ~700 °C. The observed differences between the temperatures are consistent with the contrasting rates at which the lava surfaces are thermally renewed. Eruption styles that allow persistent and pervasive thermal renewal of the lava surface (e.g., fractured crusts on channel-fed ‘a‘ a flows) exhibit a bimodal temperature distribution; eruption styles that do not (e.g., the continuous skin of pahoehoe lavas) exhibit a single mode. We conclude that insights into composition and eruption style can only be gained remotely by analyzing a large spatio-temporal sample of data. This has implications for determining composition and erup-tion style at the Jovian moon Io, for which no in situ validation is available.
on November 10, 2011geology.gsapubs.orgDownloaded from
1128 GEOLOGY, December 2011
Mount Nyamuragira, Democratic Republic of Congo), 10 images of pahoehoe fl ows (Kalauea, Hawai‘i), 20 images of lava lakes (Erta ‘Ale, Ethiopia; Mount Erebus, Antarctica; Mount Nyiragongo, Democratic Republic of Congo) and 20 images of lava domes (Mount St. Hel-ens, United States; Chaitén, Chile; Santiaguito, Guatemala; Soufrière Hills, Montserrat; Shive-luch, Russia; Popocatépetl, Mexico). Due to the rarity of lava fountains, only one image of this eruption style, acquired during the during the Fimmvörðuháls phase of the 2010 eruption of Eyjafjallajökull (Iceland), was used. As such, fountains are underrepresented in the data set (128 pixels) when compared to ‘a‘a fl ows (3771 pixels), pahoehoe fl ows (2048 pixels), lava lakes (962 pixels), and lava domes (957 pixels).
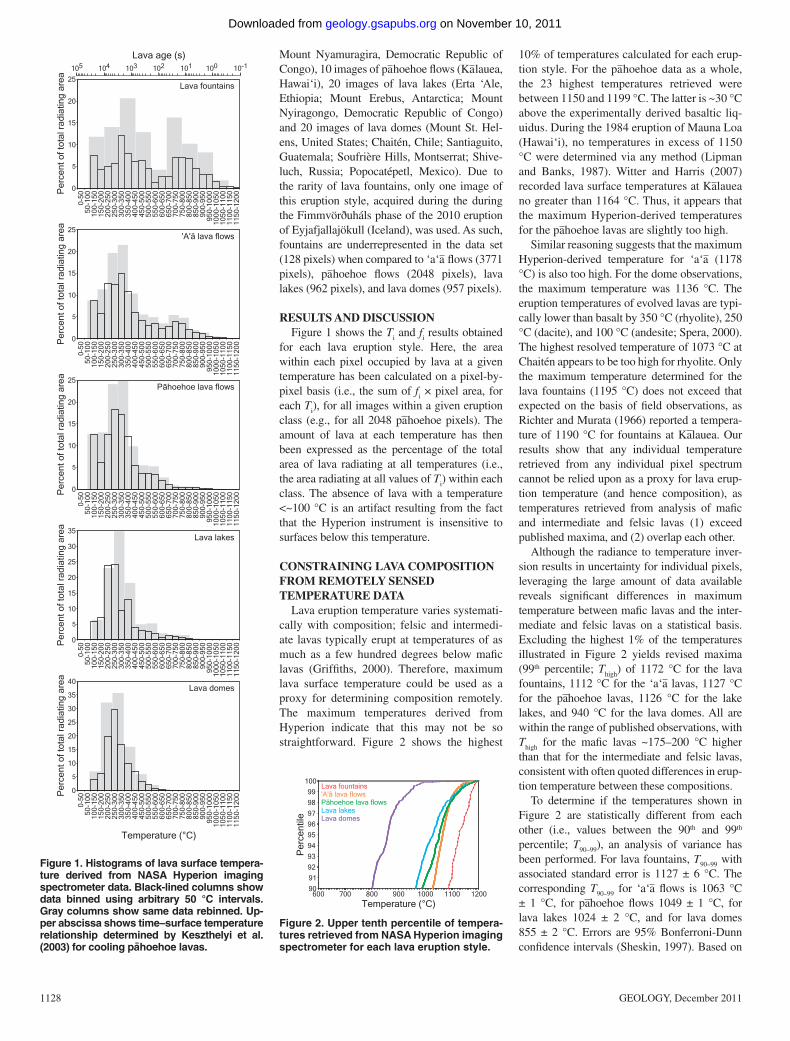
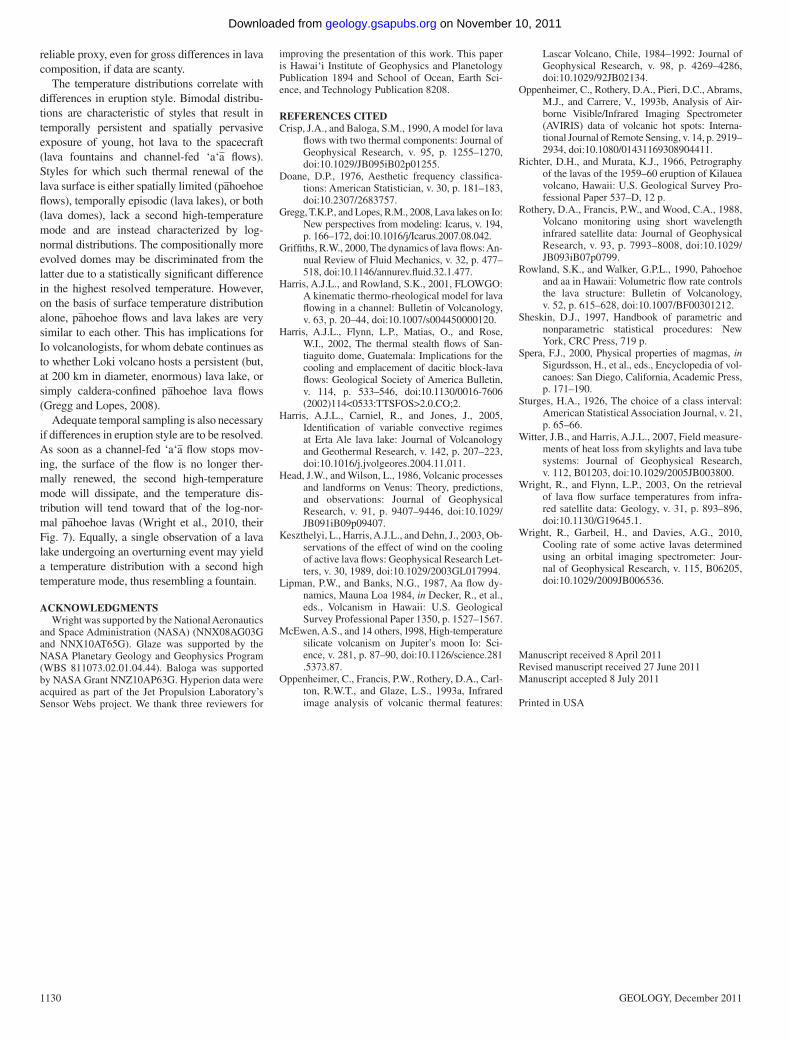
RESULTS AND DISCUSSIONFigure 1 shows the Ti and fi results obtained
for each lava eruption style. Here, the area within each pixel occupied by lava at a given temperature has been calculated on a pixel-by-pixel basis (i.e., the sum of fi × pixel area, for each Ti), for all images within a given eruption class (e.g., for all 2048 pahoehoe pixels). The amount of lava at each temperature has then been expressed as the percentage of the total area of lava radiating at all temperatures (i.e., the area radiating at all values of Ti) within each class. The absence of lava with a temperature <~100 °C is an artifact resulting from the fact that the Hyperion instrument is insensitive to surfaces below this temperature.
CONSTRAINING LAVA COMPOSITION FROM REMOTELY SENSED TEMPERATURE DATA
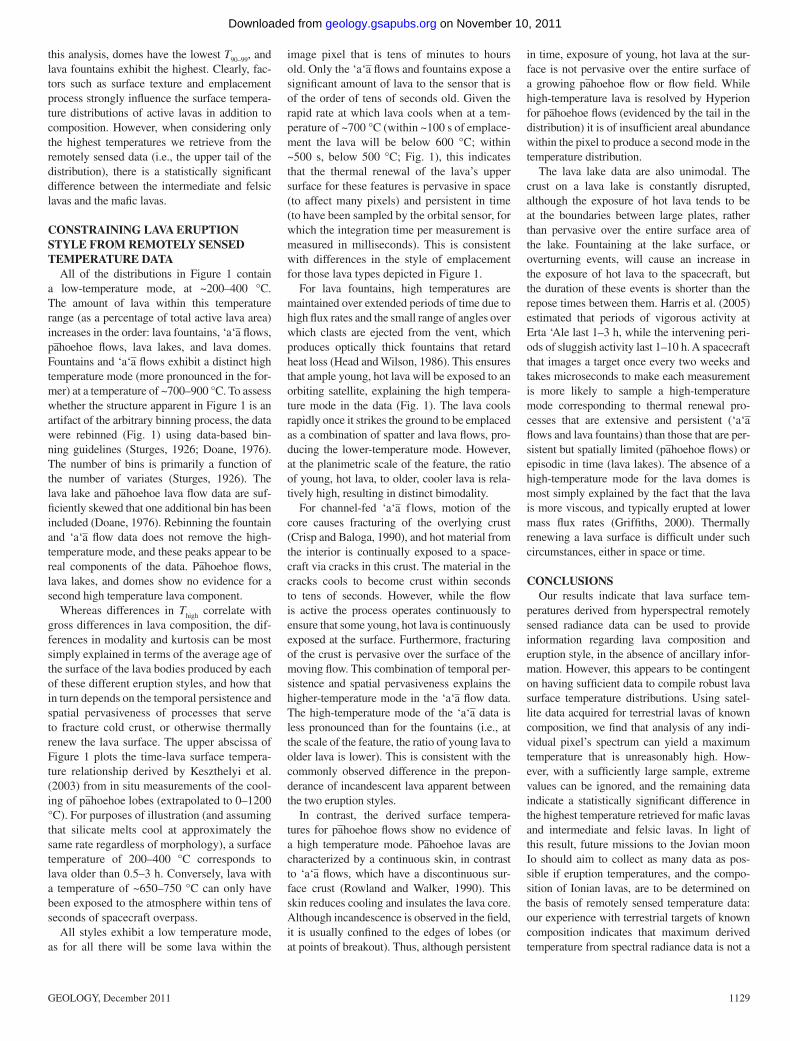
Lava eruption temperature varies systemati-cally with composition; felsic and intermedi-ate lavas typically erupt at temperatures of as much as a few hundred degrees below mafi c lavas (Griffi ths, 2000). Therefore, maximum lava surface temperature could be used as a proxy for determining composition remotely. The maximum temperatures derived from Hyperion indicate that this may not be so straightforward. Figure 2 shows the highest
10% of temperatures calculated for each erup-tion style. For the pahoehoe data as a whole, the 23 highest temperatures retrieved were between 1150 and 1199 °C. The latter is ~30 °C above the experimentally derived basaltic liq-uidus. During the 1984 eruption of Mauna Loa (Hawai‘i), no temperatures in excess of 1150 °C were determined via any method (Lipman and Banks, 1987). Witter and Harris (2007) recorded lava surface temperatures at Kalauea no greater than 1164 °C. Thus, it appears that the maximum Hyperion-derived temperatures for the pahoehoe lavas are slightly too high.
Similar reasoning suggests that the maximum Hyperion-derived temperature for ‘a‘a (1178 °C) is also too high. For the dome observations, the maximum temperature was 1136 °C. The eruption temperatures of evolved lavas are typi-cally lower than basalt by 350 °C (rhyolite), 250 °C (dacite), and 100 °C (andesite; Spera, 2000). The highest resolved temperature of 1073 °C at Chaitén appears to be too high for rhyolite. Only the maximum temperature determined for the lava fountains (1195 °C) does not exceed that expected on the basis of fi eld observations, as Richter and Murata (1966) reported a tempera-ture of 1190 °C for fountains at Kalauea. Our results show that any individual temperature retrieved from any individual pixel spectrum cannot be relied upon as a proxy for lava erup-tion temperature (and hence composition), as temperatures retrieved from analysis of mafi c and intermediate and felsic lavas (1) exceed published maxima, and (2) overlap each other.
Although the radiance to temperature inver-sion results in uncertainty for individual pixels, leveraging the large amount of data available reveals signifi cant differences in maximum temperature between mafi c lavas and the inter-mediate and felsic lavas on a statistical basis. Excluding the highest 1% of the temperatures illustrated in Figure 2 yields revised maxima (99th percentile; Thigh) of 1172 °C for the lava fountains, 1112 °C for the ‘a‘a lavas, 1127 °C for the pahoehoe lavas, 1126 °C for the lake lakes, and 940 °C for the lava domes. All are within the range of published observations, with Thigh for the mafi c lavas ~175–200 °C higher than that for the intermediate and felsic lavas, consistent with often quoted differences in erup-tion temperature between these compositions.
To determine if the temperatures shown in Figure 2 are statistically different from each other (i.e., values between the 90th and 99th percentile; T90–99), an analysis of variance has been performed. For lava fountains, T90–99 with associated standard error is 1127 ± 6 °C. The corresponding T90–99 for ‘a‘a fl ows is 1063 °C ± 1 °C, for pahoehoe fl ows 1049 ± 1 °C, for lava lakes 1024 ± 2 °C, and for lava domes 855 ± 2 °C. Errors are 95% Bonferroni-Dunn confi dence intervals (Sheskin, 1997). Based on
Temperature ( C)°
Lava age (s)10-1103 102 101 100105 104
Lava fountains
Per
cent
of t
otal
rad
iatin
g ar
ea
0
5
10
15
20
250-
50
450-
500
400-
450
350-
400
300-
350
250-
300
200-
250
150-
200
100-
150
50-1
00
800-
850
750-
800
700-
750
650-
700
600-
650
550-
600
500-
550
1100
-115
010
50-1
100
1000
-105
095
0-10
0090
0-95
085
0-90
0
1150
-120
0'A' lava flowsā
0-50
450-
500
400-
450
350-
400
300-
350
250-
300
200-
250
150-
200
100-
150
50-1
00
800-
850
750-
800
700-
750
650-
700
600-
650
550-
600
500-
550
1100
-115
010
50-1
100
1000
-105
095
0 -10
0090
0-95
085
0-90
0
1150
-120
0Per
cent
of t
otal
rad
iatin
g ar
ea
0
5
10
15
20
25
P hoehoe lava flowsā
0-50
450-
500
400-
450
350-
400
300-
350
250-
300
200-
250
150-
200
100-
150
50-1
00
800-
850
750-
800
700-
750
650-
700
600-
650
550-
600
500-
550
1 100
-115
01 0
50-1
100
1 000
-105
095
0-10
0090
0-95
085
0-90
0
1 150
-120
0Per
cent
of t
otal
rad
iatin
g ar
ea
0
5
10
15
20
25
Lava lakes
0-50
450-
500
400-
450
350-
400
300-
350
250-
300
200-
250
150-
200
100-
150
50-1
00
800-
850
750-
800
700-
750
650-
700
600-
650
550-
600
500-
550
1100
-115
010
50-1
100
1000
-105
095
0-10
0090
0-95
085
0-90
0
1150
-120
0Per
cent
of t
otal
rad
iatin
g ar
ea
0
5
10
15
20
25
35
30
Lava domes
0
5
10
15
20
40
30
35
25
0-50
450-
500
400-
450
350-
400
300-
350
250-
300
200-
250
150-
200
100-
150
50-1
00
8 00-
850
7 50-
800
7 00-
750
6 50-
700
6 00-
650
5 50-
600
500-
550
110 0
-115
010
5 0-1
100
100 0
-105
095
0-10
009 0
0-95
08 5
0-90
0
115 0
-120
0Per
cent
of t
otal
rad
iatin
g ar
ea
Per
cent
ile
95
9697
98
99
100
120011001000900700
Temperature ( C)°
90
91
92
93
94
800600
Lava fountains'A' lava flowsāP hoehoe lava flowsāLava lakesLava domes
Figure 1. Histograms of lava surface tempera-ture derived from NASA Hyperion imaging spectrometer data. Black-lined columns show data binned using arbitrary 50 °C intervals. Gray columns show same data rebinned. Up-per abscissa shows time–surface temperature relationship determined by Keszthelyi et al. (2003) for cooling pahoehoe lavas.
Figure 2. Upper tenth percentile of tempera-tures retrieved from NASA Hyperion imaging spectrometer for each lava eruption style.
on November 10, 2011geology.gsapubs.orgDownloaded from
GEOLOGY, December 2011 1129
this analysis, domes have the lowest T90–99, and lava fountains exhibit the highest. Clearly, fac-tors such as surface texture and emplacement process strongly infl uence the surface tempera-ture distributions of active lavas in addition to composition. However, when considering only the highest temperatures we retrieve from the remotely sensed data (i.e., the upper tail of the distribution), there is a statistically signifi cant difference between the intermediate and felsic lavas and the mafi c lavas.
CONSTRAINING LAVA ERUPTION STYLE FROM REMOTELY SENSED TEMPERATURE DATA
All of the distributions in Figure 1 contain a low-temperature mode, at ~200–400 °C. The amount of lava within this temperature range (as a percentage of total active lava area) increases in the order: lava fountains, ‘a‘a fl ows, pahoehoe fl ows, lava lakes, and lava domes. Fountains and ‘a‘a fl ows exhibit a distinct high temperature mode (more pronounced in the for-mer) at a temperature of ~700–900 °C. To assess whether the structure apparent in Figure 1 is an artifact of the arbitrary binning process, the data were rebinned (Fig. 1) using data-based bin-ning guidelines (Sturges, 1926; Doane, 1976). The number of bins is primarily a function of the number of variates (Sturges, 1926). The lava lake and pahoehoe lava fl ow data are suf-fi ciently skewed that one additional bin has been included (Doane, 1976). Rebinning the fountain and ‘a‘a fl ow data does not remove the high-temperature mode, and these peaks appear to be real components of the data. Pahoehoe fl ows, lava lakes, and domes show no evidence for a second high temperature lava component.
Whereas differences in Thigh correlate with gross differences in lava composition, the dif-ferences in modality and kurtosis can be most simply explained in terms of the average age of the surface of the lava bodies produced by each of these different eruption styles, and how that in turn depends on the temporal persistence and spatial pervasiveness of processes that serve to fracture cold crust, or otherwise thermally renew the lava surface. The upper abscissa of Figure 1 plots the time-lava surface tempera-ture relationship derived by Keszthelyi et al. (2003) from in situ measurements of the cool-ing of pahoehoe lobes (extrapolated to 0–1200 °C). For purposes of illustration (and assuming that silicate melts cool at approximately the same rate regardless of morphology), a surface temperature of 200–400 °C corresponds to lava older than 0.5–3 h. Conversely, lava with a temperature of ~650–750 °C can only have been exposed to the atmosphere within tens of seconds of spacecraft overpass.
All styles exhibit a low temperature mode, as for all there will be some lava within the
image pixel that is tens of minutes to hours old. Only the ‘a‘a fl ows and fountains expose a signifi cant amount of lava to the sensor that is of the order of tens of seconds old. Given the rapid rate at which lava cools when at a tem-perature of ~700 °C (within ~100 s of emplace-ment the lava will be below 600 °C; within ~500 s, below 500 °C; Fig. 1), this indicates that the thermal renewal of the lava’s upper surface for these features is pervasive in space (to affect many pixels) and persistent in time (to have been sampled by the orbital sensor, for which the integration time per measurement is measured in milliseconds). This is consistent with differences in the style of emplacement for those lava types depicted in Figure 1.
For lava fountains, high temperatures are maintained over extended periods of time due to high fl ux rates and the small range of angles over which clasts are ejected from the vent, which produces optically thick fountains that retard heat loss (Head and Wilson, 1986). This ensures that ample young, hot lava will be exposed to an orbiting satellite, explaining the high tempera-ture mode in the data (Fig. 1). The lava cools rapidly once it strikes the ground to be emplaced as a combination of spatter and lava fl ows, pro-ducing the lower-temperature mode. However, at the planimetric scale of the feature, the ratio of young, hot lava, to older, cooler lava is rela-tively high, resulting in distinct bimodality.
For channel-fed ‘a‘a flows, motion of the core causes fracturing of the overlying crust (Crisp and Baloga, 1990), and hot material from the interior is continually exposed to a space-craft via cracks in this crust. The material in the cracks cools to become crust within seconds to tens of seconds. However, while the fl ow is active the process operates continuously to ensure that some young, hot lava is continuously exposed at the surface. Furthermore, fracturing of the crust is pervasive over the surface of the moving fl ow. This combination of temporal per-sistence and spatial pervasiveness explains the higher-temperature mode in the ‘a‘a fl ow data. The high-temperature mode of the ‘a‘a data is less pronounced than for the fountains (i.e., at the scale of the feature, the ratio of young lava to older lava is lower). This is consistent with the commonly observed difference in the prepon-derance of incandescent lava apparent between the two eruption styles.
In contrast, the derived surface tempera-tures for pahoehoe fl ows show no evidence of a high temperature mode. Pahoehoe lavas are characterized by a continuous skin, in contrast to ‘a‘a fl ows, which have a discontinuous sur-face crust (Rowland and Walker, 1990). This skin reduces cooling and insulates the lava core. Although incandescence is observed in the fi eld, it is usually confi ned to the edges of lobes (or at points of breakout). Thus, although persistent
in time, exposure of young, hot lava at the sur-face is not pervasive over the entire surface of a growing pahoehoe fl ow or fl ow fi eld. While high-temperature lava is resolved by Hyperion for pahoehoe fl ows (evidenced by the tail in the distribution) it is of insuffi cient areal abundance within the pixel to produce a second mode in the temperature distribution.
The lava lake data are also unimodal. The crust on a lava lake is constantly disrupted, although the exposure of hot lava tends to be at the boundaries between large plates, rather than pervasive over the entire surface area of the lake. Fountaining at the lake surface, or overturning events, will cause an increase in the exposure of hot lava to the spacecraft, but the duration of these events is shorter than the repose times between them. Harris et al. (2005) estimated that periods of vigorous activity at Erta ‘Ale last 1–3 h, while the intervening peri-ods of sluggish activity last 1–10 h. A spacecraft that images a target once every two weeks and takes microseconds to make each measurement is more likely to sample a high-temperature mode corresponding to thermal renewal pro-cesses that are extensive and persistent (‘a‘a fl ows and lava fountains) than those that are per-sistent but spatially limited (pahoehoe fl ows) or episodic in time (lava lakes). The absence of a high-temperature mode for the lava domes is most simply explained by the fact that the lava is more viscous, and typically erupted at lower mass fl ux rates (Griffi ths, 2000). Thermally renewing a lava surface is diffi cult under such circumstances, either in space or time.
CONCLUSIONSOur results indicate that lava surface tem-
peratures derived from hyperspectral remotely sensed radiance data can be used to provide information regarding lava composition and eruption style, in the absence of ancillary infor-mation. However, this appears to be contingent on having suffi cient data to compile robust lava surface temperature distributions. Using satel-lite data acquired for terrestrial lavas of known composition, we fi nd that analysis of any indi-vidual pixel’s spectrum can yield a maximum temperature that is unreasonably high. How-ever, with a suffi ciently large sample, extreme values can be ignored, and the remaining data indicate a statistically signifi cant difference in the highest temperature retrieved for mafi c lavas and intermediate and felsic lavas. In light of this result, future missions to the Jovian moon Io should aim to collect as many data as pos-sible if eruption temperatures, and the compo-sition of Ionian lavas, are to be determined on the basis of remotely sensed temperature data: our experience with terrestrial targets of known composition indicates that maximum derived temperature from spectral radiance data is not a
on November 10, 2011geology.gsapubs.orgDownloaded from
1130 GEOLOGY, December 2011
reliable proxy, even for gross differences in lava composition, if data are scanty.
The temperature distributions correlate with differences in eruption style. Bimodal distribu-tions are characteristic of styles that result in temporally persistent and spatially pervasive exposure of young, hot lava to the spacecraft (lava fountains and channel-fed ‘a‘a fl ows). Styles for which such thermal renewal of the lava surface is either spatially limited (pahoehoe fl ows), temporally episodic (lava lakes), or both (lava domes), lack a second high-temperature mode and are instead characterized by log-normal distributions. The compositionally more evolved domes may be discriminated from the latter due to a statistically signifi cant difference in the highest resolved temperature. However, on the basis of surface temperature distribution alone, pahoehoe fl ows and lava lakes are very similar to each other. This has implications for Io volcanologists, for whom debate continues as to whether Loki volcano hosts a persistent (but, at 200 km in diameter, enormous) lava lake, or simply caldera-confi ned pahoehoe lava fl ows (Gregg and Lopes, 2008).
Adequate temporal sampling is also necessary if differences in eruption style are to be resolved. As soon as a channel-fed ‘a‘a fl ow stops mov-ing, the surface of the fl ow is no longer ther-mally renewed, the second high-temperature mode will dissipate, and the temperature dis-tribution will tend toward that of the log-nor-mal pahoehoe lavas (Wright et al., 2010, their Fig. 7). Equally, a single observation of a lava lake undergoing an overturning event may yield a temperature distribution with a second high temperature mode, thus resembling a fountain.
ACKNOWLEDGMENTSWright was supported by the National Aeronautics
and Space Administration (NASA) (NNX08AG03G and NNX10AT65G). Glaze was supported by the NASA Planetary Geology and Geophysics Program (WBS 811073.02.01.04.44). Baloga was supported by NASA Grant NNZ10AP63G. Hyperion data were acquired as part of the Jet Propulsion Laboratory’s Sensor Webs project. We thank three reviewers for
improving the presentation of this work. This paper is Hawai‘i Institute of Geophysics and Planetology Publication 1894 and School of Ocean, Earth Sci-ence, and Technology Publication 8208.
REFERENCES CITEDCrisp, J.A., and Baloga, S.M., 1990, A model for lava
fl ows with two thermal components: Journal of Geophysical Research, v. 95, p. 1255–1270, doi:10.1029/JB095iB02p01255.
Doane, D.P., 1976, Aesthetic frequency classifi ca-tions: American Statistician, v. 30, p. 181–183, doi:10.2307/2683757.
Gregg, T.K.P., and Lopes, R.M., 2008, Lava lakes on Io: New perspectives from modeling: Icarus, v. 194, p. 166–172, doi:10.1016/j/Icarus.2007.08.042.
Griffi ths, R.W., 2000, The dynamics of lava fl ows: An-nual Review of Fluid Mechanics, v. 32, p. 477–518, doi:10.1146/annurev.fl uid.32.1.477.
Harris, A.J.L., and Rowland, S.K., 2001, FLOWGO: A kinematic thermo-rheological model for lava fl owing in a channel: Bulletin of Volcanology, v. 63, p. 20–44, doi:10.1007/s004450000120.
Harris, A.J.L., Flynn, L.P., Matias, O., and Rose, W.I., 2002, The thermal stealth fl ows of San-tiaguito dome, Guatemala: Implications for the cooling and emplacement of dacitic block-lava fl ows: Geological Society of America Bulletin, v. 114, p. 533–546, doi:10.1130/0016-7606(2002)114<0533:TTSFOS>2.0.CO;2.
Harris, A.J.L., Carniel, R., and Jones, J., 2005, Identifi cation of variable convective regimes at Erta Ale lava lake: Journal of Volcanology and Geothermal Research, v. 142, p. 207–223, doi:10.1016/j.jvolgeores.2004.11.011.
Head, J.W., and Wilson, L., 1986, Volcanic processes and landforms on Venus: Theory, predictions, and observations: Journal of Geophysical Research, v. 91, p. 9407–9446, doi:10.1029/JB091iB09p09407.
Keszthelyi, L., Harris, A.J.L., and Dehn, J., 2003, Ob-servations of the effect of wind on the cooling of active lava fl ows: Geophysical Research Let-ters, v. 30, 1989, doi:10.1029/2003GL017994.
Lipman, P.W., and Banks, N.G., 1987, Aa fl ow dy-namics, Mauna Loa 1984, in Decker, R., et al., eds., Volcanism in Hawaii: U.S. Geological Survey Professional Paper 1350, p. 1527–1567.
McEwen, A.S., and 14 others, 1998, High-temperature silicate volcanism on Jupiter’s moon Io: Sci-ence, v. 281, p. 87–90, doi:10.1126/science.281.5373.87.
Oppenheimer, C., Francis, P.W., Rothery, D.A., Carl-ton, R.W.T., and Glaze, L.S., 1993a, Infrared image analysis of volcanic thermal features:
Lascar Volcano, Chile, 1984–1992: Journal of Geophysical Research, v. 98, p. 4269–4286, doi:10.1029/92JB02134.
Oppenheimer, C., Rothery, D.A., Pieri, D.C., Abrams, M.J., and Carrere, V., 1993b, Analysis of Air-borne Visible/Infrared Imaging Spectrometer (AVIRIS) data of volcanic hot spots: Interna-tional Journal of Remote Sensing, v. 14, p. 2919–2934, doi:10.1080/01431169308904411.
Richter, D.H., and Murata, K.J., 1966, Petrography of the lavas of the 1959–60 eruption of Kilauea volcano, Hawaii: U.S. Geological Survey Pro-fessional Paper 537–D, 12 p.
Rothery, D.A., Francis, P.W., and Wood, C.A., 1988, Volcano monitoring using short wavelength infrared satellite data: Journal of Geophysical Research, v. 93, p. 7993–8008, doi:10.1029/JB093iB07p0799.
Rowland, S.K., and Walker, G.P.L., 1990, Pahoehoe and aa in Hawaii: Volumetric fl ow rate controls the lava structure: Bulletin of Volcanology, v. 52, p. 615–628, doi:10.1007/BF00301212.
Sheskin, D.J., 1997, Handbook of parametric and nonparametric statistical procedures: New York, CRC Press, 719 p.
Spera, F.J., 2000, Physical properties of magmas, in Sigurdsson, H., et al., eds., Encyclopedia of vol-canoes: San Diego, California, Academic Press, p. 171–190.
Sturges, H.A., 1926, The choice of a class interval: American Statistical Association Journal, v. 21, p. 65–66.
Witter, J.B., and Harris, A.J.L., 2007, Field measure-ments of heat loss from skylights and lava tube systems: Journal of Geophysical Research, v. 112, B01203, doi:10.1029/2005JB003800.
Wright, R., and Flynn, L.P., 2003, On the retrieval of lava fl ow surface temperatures from infra-red satellite data: Geology, v. 31, p. 893–896, doi:10.1130/G19645.1.
Wright, R., Garbeil, H., and Davies, A.G., 2010, Cooling rate of some active lavas determined using an orbital imaging spectrometer: Jour-nal of Geophysical Research, v. 115, B06205, doi:10.1029/2009JB006536.
Manuscript received 8 April 2011Revised manuscript received 27 June 2011Manuscript accepted 8 July 2011
Printed in USA
on November 10, 2011geology.gsapubs.orgDownloaded from