Embed Size (px)
Citation preview

University of ConnecticutOpenCommons@UConn
Technical Reports Department of Civil and EnvironmentalEngineering
8-1-2011
CONSTITUTIVE MODEL FOR RATEDEPENDENT BEHAVIOR OF CLAY InternalGeotechnical Report 2011-3Harry MartindaleUniversity of Connecticut - Storrs, [email protected]
Dipanjan BasuUniversity of Connecticut - Storrs, [email protected]
Follow this and additional works at: https://opencommons.uconn.edu/cee_techreports
Part of the Civil Engineering Commons, Environmental Engineering Commons, and theGeotechnical Engineering Commons
Recommended CitationMartindale, Harry and Basu, Dipanjan, "CONSTITUTIVE MODEL FOR RATE DEPENDENT BEHAVIOR OF CLAY InternalGeotechnical Report 2011-3" (2011). Technical Reports. 3.https://opencommons.uconn.edu/cee_techreports/3

CONSTITUTIVE MODEL FOR RATE DEPENDENT BEHAVIOR OF CLAY
Internal Geotechnical Report 2011-3
Harry Martindale and Dipanjan Basu
Department of Civil and Environmental Engineering University of Connecticut
Storrs, Connecticut
August 2011

2
Copyright by
Harry Martindale and Dipanjan Basu
2011

3
SYNOPSIS
This report presents a strain-rate dependent plastic constitutive model for clays.
Based on the concepts of critical-state soil mechanics and bounding surface plasticity
theory, the model reproduces the mechanical response of clays under multi-axial loading
conditions and predicts both the drained and undrained behavior. The model parameters
are determined for Boston Blue Clay, London Clay and Kaolin Clay, and the
performance of the model in simulating the mechanical response of these clays is
demonstrated for low to medium strain rates. The sensitivity of each model parameter is
checked by perturbing the calibrated values by ±20%. Subsequently, a probabilistic
analysis using Monte Carlo simulations is performed by treating the model parameters as
random variables and the impact of the statistics of the parameters on the undrained shear
strength is investigated.
KEYWORDS: Constitutive relations; Plasticity; Rate-dependence; Clay; Probabilistic
analysis

4
INTRODUCTION
The mechanical behavior of clayey soils is affected by the rate of induced strains
(Kavazanjian and Mitchell 1980, Sorensen et al. 2007, Sheahan 2005 and 1991, Díaz-
Rodríguez et al. 2009, Matesic and Vucetic 2003). Examples of practical problems
where rate-dependent behavior of clay is important are landslides, pile penetration and
wave loads on offshore foundations. The rate effects in clay are exhibited from a low
applied strain rate of 10−2%/hr (≈10−7/sec). It has been observed in the laboratory triaxial
compression tests that, for low to medium applied strain rates of 10−2-102%/hr (≈10−7-
10−4/sec), the undrained shear strength increases by 5-20% per log-cycle increase in the
strain rate. The initial shear modulus increases at a rate of about 10% per log-cycle
increase in the applied strain rate (Matesic and Vucetic 2003). The critical-state strength
of clays, however, remains rather unaffected by the rate of induced strains under low to
medium strain rates (Sheahan et al. 1996, Sorensen et al. 2007, Díaz-Rodríguez et al.
2009). The overconsolidation ratio (OCR) plays an important role in the rate-dependent
mechanical response of clay. For a constant OCR, the deviatoric stress attains its peak at
approximately the same strain level for different strain rates. However, the strain at
which the peak occurs increases with increasing OCR. Significant post-peak softening is
observed for low OCR of 1 and 2 due to the generation of positive excess pore pressure
while, for OCR of 4 or greater, the post-peak softening is relatively small.
Rate dependence of clay has been mostly investigated for creep and stress
relaxation, and elasto-viscoplastic constitutive models based on overstress theory have
been developed to simulate them (Perzyna 1963, 1966, Zienkiewicz and Cormeau 1974,
Adachi and Oka 1982, Hinchberger and Rowe 1998). Adachi and Oka (1982) proposed
5
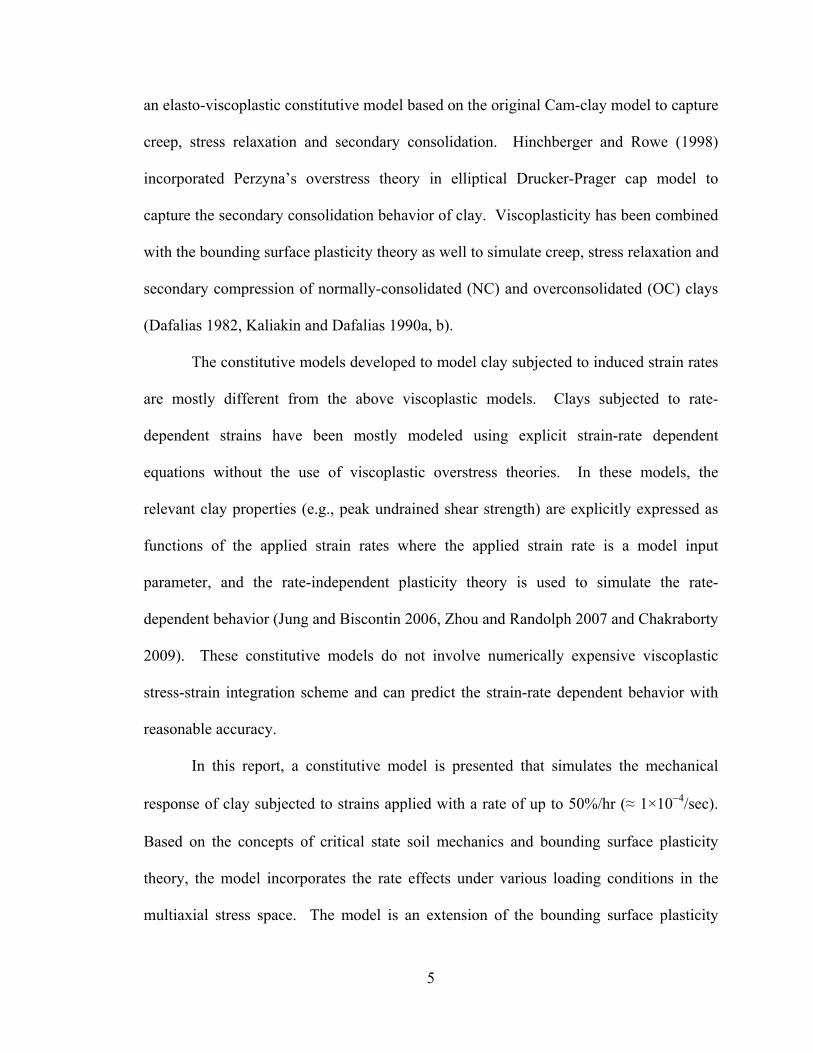
an elasto-viscoplastic constitutive model based on the original Cam-clay model to capture
creep, stress relaxation and secondary consolidation. Hinchberger and Rowe (1998)
incorporated Perzyna’s overstress theory in elliptical Drucker-Prager cap model to
capture the secondary consolidation behavior of clay. Viscoplasticity has been combined
with the bounding surface plasticity theory as well to simulate creep, stress relaxation and
secondary compression of normally-consolidated (NC) and overconsolidated (OC) clays
(Dafalias 1982, Kaliakin and Dafalias 1990a, b).
The constitutive models developed to model clay subjected to induced strain rates
are mostly different from the above viscoplastic models. Clays subjected to rate-
dependent strains have been mostly modeled using explicit strain-rate dependent
equations without the use of viscoplastic overstress theories. In these models, the
relevant clay properties (e.g., peak undrained shear strength) are explicitly expressed as
functions of the applied strain rates where the applied strain rate is a model input
parameter, and the rate-independent plasticity theory is used to simulate the rate-
dependent behavior (Jung and Biscontin 2006, Zhou and Randolph 2007 and Chakraborty
2009). These constitutive models do not involve numerically expensive viscoplastic
stress-strain integration scheme and can predict the strain-rate dependent behavior with
reasonable accuracy.
In this report, a constitutive model is presented that simulates the mechanical
response of clay subjected to strains applied with a rate of up to 50%/hr (≈ 1×10⁻⁴/sec).
Based on the concepts of critical state soil mechanics and bounding surface plasticity
theory, the model incorporates the rate effects under various loading conditions in the
multiaxial stress space. The model is an extension of the bounding surface plasticity

6
model developed by Manzari and Dafalias (1997) and later modified by Li and Dafalias
(2000), Papadimitriou and Bouckovalas (2002), Dafalias et al. (2004), Loukidis and
Salgado (2009) and Chakraborty (2009). The model parameters have been determined
for Boston Blue Clay (BBC), London Clay (LC) and Kaolin Clay (KC) by comparing the
simulation results with the experimental data available in the literature. The rate-
dependent model parameter is determined from the strain-rate dependent triaxial
compression test data, while the rate-independent parameters are determined from one-
dimensional and isotropic consolidation tests, resonant column tests, triaxial compression
and extension tests, and simple shear tests following a hierarchical process. A sensitivity
analysis is performed by varying the input model parameters by ± 20% of the calibrated
values. Finally, a probabilistic analysis is performed by treating the input model
parameters as random variables and performing Monte Carlo simulations, and the
statistics of the output undrained shear strength is investigated.
CONSTITUTIVE MODEL DEVELOPMENT
Model Surfaces in Stress Space
The basic, rate-independent part of the model consists of yield, dilatancy, and
critical-state surfaces that are made up of two distinct geometrical surfaces: a cone with
straight surfaces in the meridional plane and apex at the origin, and a bounding flat cap
on the critical state surface (Chakraborty 2009). The model formulation is done in terms
of stress ratios, i.e., stresses normalized with respect to the mean effective stress p' (=
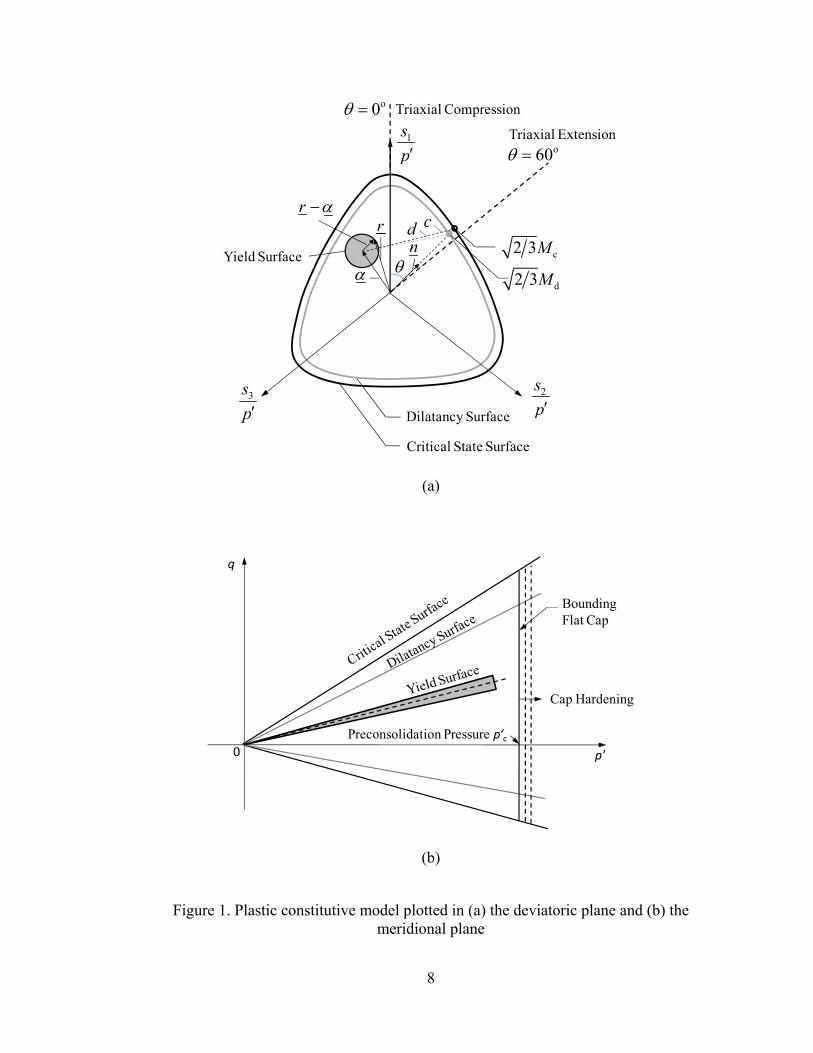
σ'kk/3, where σ'ij is the effective Cauchy stress tensor). Figure 1(a) shows the projection
of the yield, dilatancy and critical-state surfaces on the π-plane of the principal deviatoric
stress ratio space s1/p'-s2/p'-s3/p' (sij = σ'ij − δijσ'kk/3 is the deviatoric stress tensor in

7
which δij denotes the Kronecker’s delta). Figure 1(b) shows the projection of the model
surfaces on the longitudinal q-p' plane (q = σ'1 − σ'3 is the deviatoric stress in the triaxial
stress space). The yield surface is expressed in terms of the deviatoric stress ratio tensor
rij (= sij/p') as
( )( )ij ij ij ij 2 3 0f r r – m α α= − − = (1)
which can be visualized as a cone in the principal deviatoric stress space intersecting the
π-plane as a circle with radius 2 3m and center αij, which is the kinematic hardening
tensor. The yield surface cannot harden isotropically (i.e., m stays constant in the model)
but can harden kinematically through the evolution of αij given by
( ) ( )sij shear c ij ij c ij ij
2 23 3
H M m n M m np
α λ α α⎛ ⎞ ⎛ ⎞
= − − − −⎜ ⎟ ⎜ ⎟′ ⎝ ⎠ ⎝ ⎠ (2)
where shearλ is the shearing-related plastic multiplier, Hs is the plastic modulus controlling
the development of the plastic shear strain (the equations of shearλ and Hs are given later),
nij ( ) ( )( )ij ij kl kl kl kl/s p s p s pα α α⎡ ⎤′ ′ ′= − − −⎣ ⎦ determines the direction of the projection of
the current stress on the critical-state and dilatancy surfaces (i.e., the mapping rule) and
Mc denotes the critical-state surface defined by
ss
s
ss
s
1/11/1
c cc cc1/11/1
111
( )11 cos31
nn
n
nn
n
cc
M g M Mcc
θ
θ
⎡ ⎤⎛ ⎞−−⎢ ⎥⎜ ⎟+⎢ ⎥⎝ ⎠= = ⎢ ⎥⎛ ⎞−⎢ ⎥−⎜ ⎟⎢ ⎥+⎝ ⎠⎣ ⎦
(3)
8
(a)
(b)
Figure 1. Plastic constitutive model plotted in (a) the deviatoric plane and (b) the meridional plane
c2 3M
Dilatancy Surface
Critical State Surface
d2 3M
2sp′
1sp′
3sp′
o0θ = Triaxial Compression
o60θ =Triaxial Extension
r
α
r α−
Yield Surface nθ
d c
q
p'
Preconsolidation Pressure p‘c
Bounding Flat Cap
Cap Hardening
0

9
where Mcc is the stress ratio q/p' at the critical-state (CS) under triaxial compression, g(θ)
is a function of the Lode’s angle θ and determines the shape of the critical state surface in
the deviatoric stress space and c1 = 3/(Mcc + 3). The parameter ns takes a constant value
of 0.2 for all the clays. The dilatancy surface is defined by
cc dd cc
d
( ) 21 exp( )
M k OCRM g Mk OCRξθ
ξ⎡ ⎤
= +⎢ ⎥−⎣ ⎦ (4)
where ξ = e − eCS is the state parameter (Been and Jefferies 1985) in which e and eCS are
the current and critical-state void ratios at the same mean stress (Figure 2), OCR is the
overconsolidation ratio and kd is given by
( )cc
d lnMk
λ κ ρ=
− (5)
in which λ and κ are the slopes of the linear normal-consolidation and overconsolidation
lines in the e-ln(p') space and ρ (= p'c/p'CS) is the ratio of the preconsolidation pressure p'c
to the critical-state pressure p'CS along the same overconsolidation line in the e-ln(p')
space (Figure 2). The dilatancy surface hardens isotropically as the state parameter ξ
changes due to a change in the stress state.
The flat cap to the critical-state surface helps in capturing the yielding and
development of plastic strains under pure compression. The bounding flat cap is
perpendicular to the hydrostatic (mean stress) axis and intersects the hydrostatic axis at p′
= p′c (Figure 1b). It is given by
c c 0F p p′ ′= − = (6)
The movement of the cap along the mean-stress axis signifies the increase in the
preconsolidation pressure along the normal consolidation line (NCL) in the e-ln(p') space.

10
The consistency condition is not applied to the cap, and hence, stress states marginally
outside the cap are possible.
Figure 2. Locus of the normal consolidation line and critical state line in e-ln(p') space
The normal consolidation line is given by (Figure 2)
NCa
N ln pep
− λ⎛ ⎞′
= ⎜ ⎟′⎝ ⎠ (7)
where eNC is the normal consolidation void ratio and N is the void ratio at the reference
mean stress pa (= 100 kPa). The critical state line (CSL) follows the same slope as that of
the normal consolidation line in the e-ln(p') space, and is given by
( )CS 0a a
ln N ln lnp pep p
λ λ κ ρ − λ⎛ ⎞ ⎛ ⎞′ ′
= Γ − = − −⎜ ⎟ ⎜ ⎟⎝ ⎠ ⎝ ⎠
(8)
e
ln(p‘)
N
Γ
ln(p‘c)ln(p‘CS)ln(p‘a)
eCS
ξ
λλ
κ
11
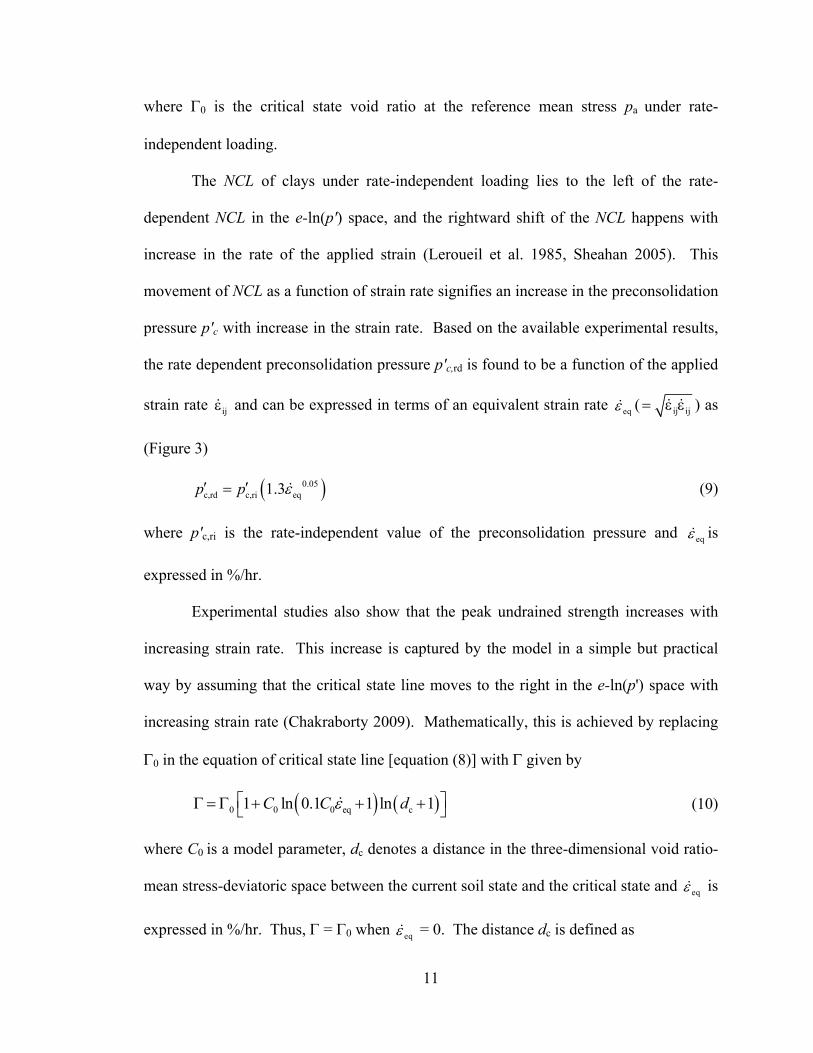
where Γ0 is the critical state void ratio at the reference mean stress pa under rate-
independent loading.
The NCL of clays under rate-independent loading lies to the left of the rate-
dependent NCL in the e-ln(p') space, and the rightward shift of the NCL happens with
increase in the rate of the applied strain (Leroueil et al. 1985, Sheahan 2005). This
movement of NCL as a function of strain rate signifies an increase in the preconsolidation
pressure p'c with increase in the strain rate. Based on the available experimental results,
the rate dependent preconsolidation pressure p'c,rd is found to be a function of the applied
strain rate ijε and can be expressed in terms of an equivalent strain rate eqε ( ij ij= ε ε ) as
(Figure 3)
( )0.05c,rd c,ri eq1.3p p ε′ ′=
(9)
where p'c,ri is the rate-independent value of the preconsolidation pressure and eqε is
expressed in %/hr.
Experimental studies also show that the peak undrained strength increases with
increasing strain rate. This increase is captured by the model in a simple but practical
way by assuming that the critical state line moves to the right in the e-ln(p') space with
increasing strain rate (Chakraborty 2009). Mathematically, this is achieved by replacing
Γ0 in the equation of critical state line [equation (8)] with Γ given by
( ) ( )0 0 0 eq c1 ln 0.1 1 ln 1C C dε⎡ ⎤Γ = Γ + + +⎣ ⎦
(10)
where C0 is a model parameter, dc denotes a distance in the three-dimensional void ratio-
mean stress-deviatoric space between the current soil state and the critical state and eqε is
expressed in %/hr. Thus, Γ = Γ0 when eqε = 0. The distance dc is defined as
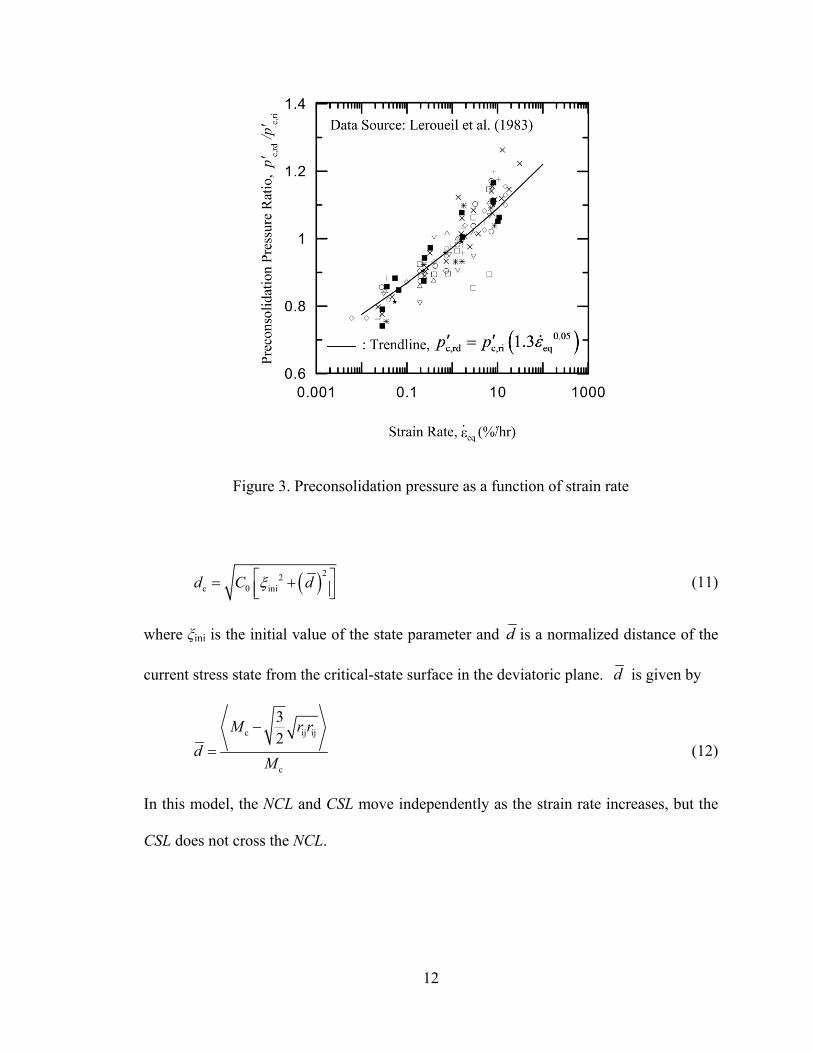
12
Figure 3. Preconsolidation pressure as a function of strain rate
( )22c 0 inid C dξ⎡ ⎤= +⎢ ⎥⎣ ⎦
(11)
where ξini is the initial value of the state parameter and d is a normalized distance of the
current stress state from the critical-state surface in the deviatoric plane. d is given by
c ij ij
c
32
M r rd
M
−
=
(12)
In this model, the NCL and CSL move independently as the strain rate increases, but the
CSL does not cross the NCL.
13
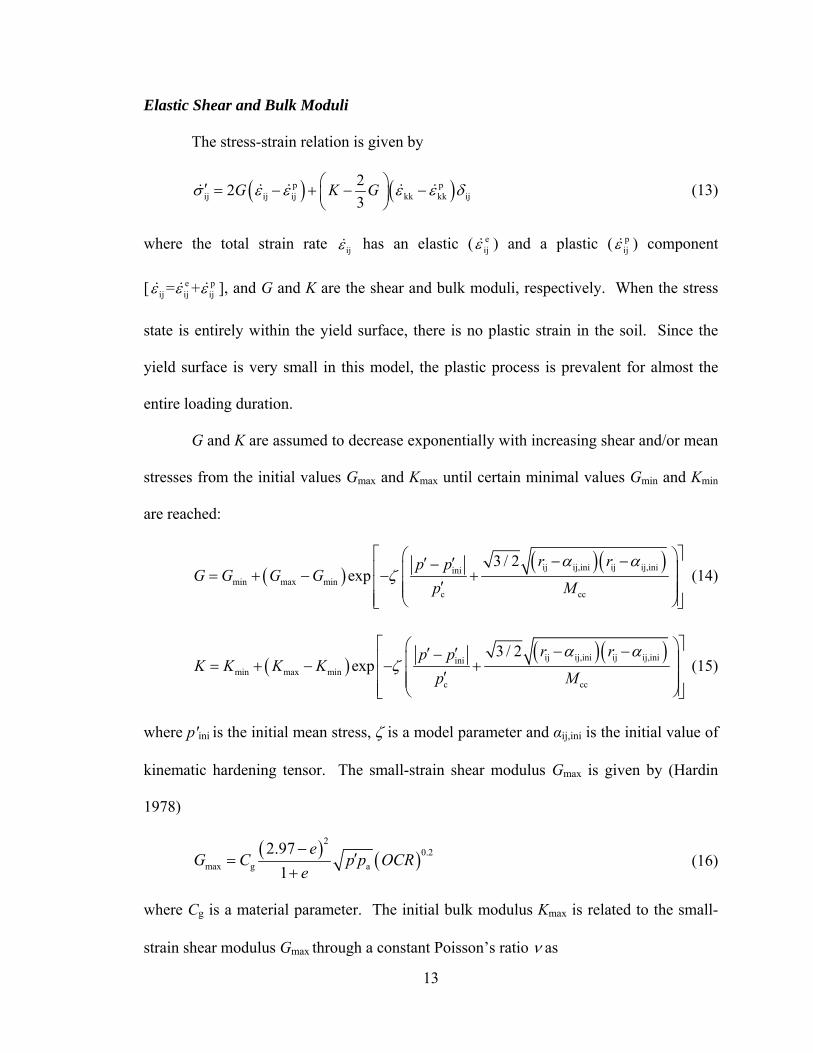
Elastic Shear and Bulk Moduli
The stress-strain relation is given by
( ) ( )p pij ij ij kk kk ij
223
G K Gσ ε ε ε ε δ⎛ ⎞′ = − + − −⎜ ⎟⎝ ⎠ (13)
where the total strain rate ijε has an elastic ( eijε ) and a plastic ( p
ijε ) component
[ e pij ij ij= +ε ε ε ], and G and K are the shear and bulk moduli, respectively. When the stress
state is entirely within the yield surface, there is no plastic strain in the soil. Since the
yield surface is very small in this model, the plastic process is prevalent for almost the
entire loading duration.
G and K are assumed to decrease exponentially with increasing shear and/or mean
stresses from the initial values Gmax and Kmax until certain minimal values Gmin and Kmin
are reached:
( )( )( )ij ij,ini ij ij,iniini
min max minc cc
3 / 2exp
r rp pG G G G
p M
α αζ
⎡ ⎤⎛ ⎞− −′ ′−⎢ ⎥⎜ ⎟= + − − +⎢ ⎥⎜ ⎟′⎜ ⎟⎢ ⎥⎝ ⎠⎣ ⎦
(14)
( )( )( )ij ij,ini ij ij,iniini
min max minc cc
3 / 2exp
r rp pK K K K
p M
α αζ
⎡ ⎤⎛ ⎞− −′ ′−⎢ ⎥⎜ ⎟= + − − +⎢ ⎥⎜ ⎟′⎜ ⎟⎢ ⎥⎝ ⎠⎣ ⎦
(15)
where p'ini is the initial mean stress, ζ is a model parameter and αij,ini is the initial value of
kinematic hardening tensor. The small-strain shear modulus Gmax is given by (Hardin
1978)
( ) ( )2
0.2max g a
2.971
eG C p p OCR
e−
′=+
(16)
where Cg is a material parameter. The initial bulk modulus Kmax is related to the small-
strain shear modulus Gmax through a constant Poisson’s ratio ν as
14
max max2(1 )3(1 2 )
K G νν
+=
− (17)
The minimal values of bulk and shear moduli, Kmin and Gmin, are given by
min(1 )p eKκ
′ +=
(18)
min min3(1 2 )2(1 )
G Kνν
−=
+ (19)
which are obtained using the slope κ of the overconsolidation lines in the e-ln(p') space
observed in one-dimensional compression tests for a constant Poisson’s ratio ν.
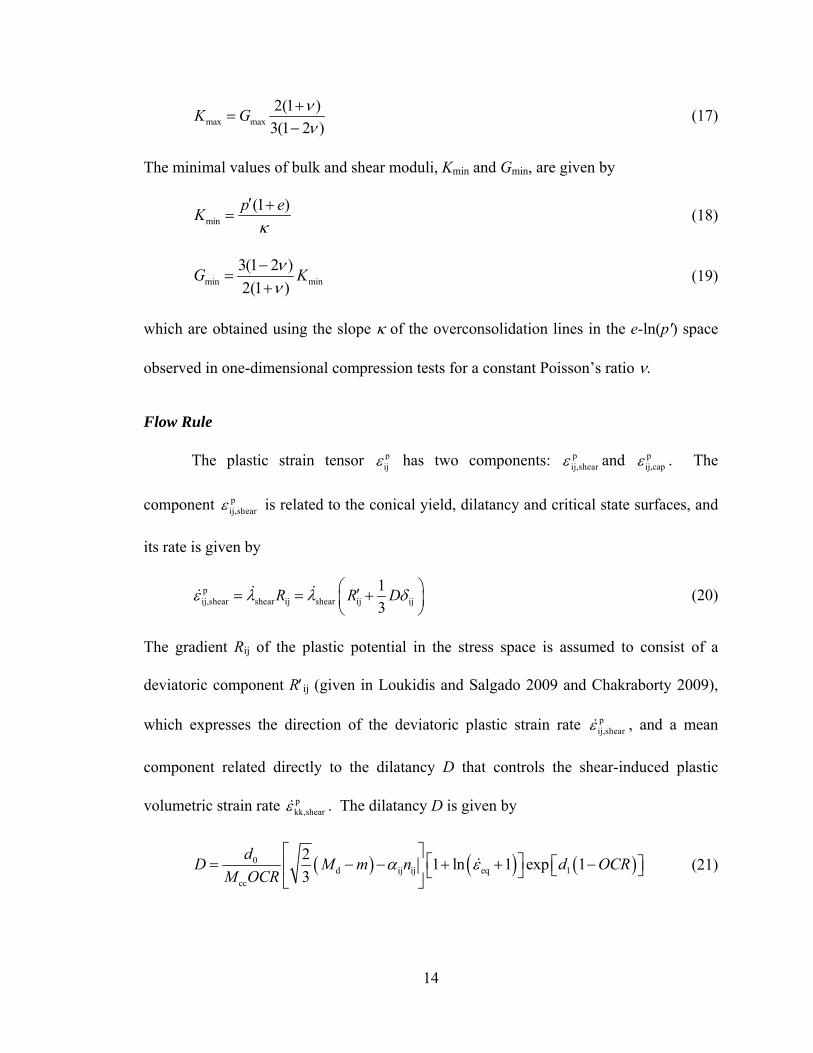
Flow Rule
The plastic strain tensor pijε has two components: p
ij,shearε and pij,capε . The
component pij,shearε is related to the conical yield, dilatancy and critical state surfaces, and
its rate is given by
pij,shear shear ij shear ij ij
13
R R Dε λ λ δ⎛ ⎞′= = +⎜ ⎟⎝ ⎠
(20)
The gradient Rij of the plastic potential in the stress space is assumed to consist of a
deviatoric component R′ij (given in Loukidis and Salgado 2009 and Chakraborty 2009),
which expresses the direction of the deviatoric plastic strain rate pij,shearε , and a mean
component related directly to the dilatancy D that controls the shear-induced plastic
volumetric strain rate pkk,shearε . The dilatancy D is given by
( ) ( ) ( )0d ij ij eq 1
cc
2 1 ln 1 exp 13
dD M m n d OCRM OCR
α ε⎡ ⎤
⎡ ⎤= − − + + −⎡ ⎤⎢ ⎥ ⎣ ⎦⎣ ⎦⎣ ⎦
(21)
15
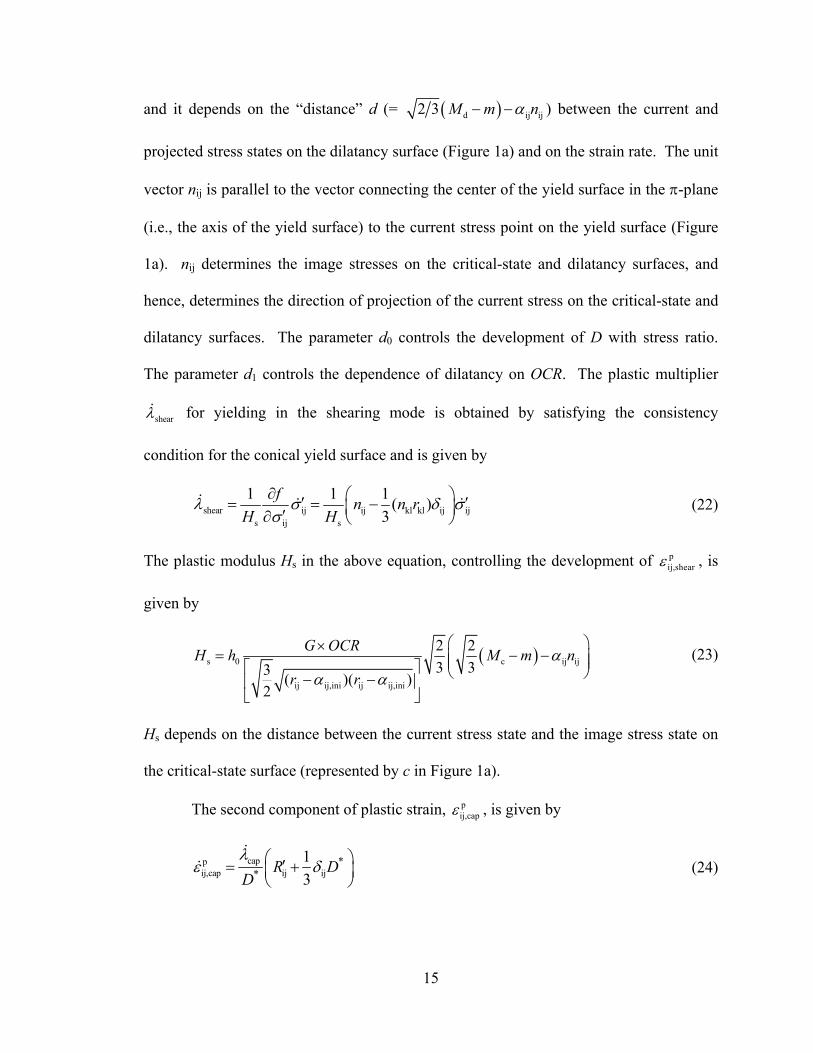
and it depends on the “distance” d (= ( )d ij ij2 3 M m nα− − ) between the current and
projected stress states on the dilatancy surface (Figure 1a) and on the strain rate. The unit
vector nij is parallel to the vector connecting the center of the yield surface in the π-plane
(i.e., the axis of the yield surface) to the current stress point on the yield surface (Figure
1a). nij determines the image stresses on the critical-state and dilatancy surfaces, and
hence, determines the direction of projection of the current stress on the critical-state and
dilatancy surfaces. The parameter d0 controls the development of D with stress ratio.
The parameter d1 controls the dependence of dilatancy on OCR. The plastic multiplier
shearλ for yielding in the shearing mode is obtained by satisfying the consistency
condition for the conical yield surface and is given by
shear ij ij kl kl ij ijs ij s
1 1 1 ( )3
f n n rH H
λ σ δ σσ∂ ⎛ ⎞′ ′= = −⎜ ⎟′∂ ⎝ ⎠
(22)
The plastic modulus Hs in the above equation, controlling the development of pij,shearε , is
given by
( )s 0 c ij ij
ij ij,ini ij ij,ini
2 23 33 ( )( )
2
G OCRH h M m nr r
αα α
⎛ ⎞×= − −⎜ ⎟⎜ ⎟⎡ ⎤ ⎝ ⎠− −⎢ ⎥
⎣ ⎦
(23)
Hs depends on the distance between the current stress state and the image stress state on
the critical-state surface (represented by c in Figure 1a).
The second component of plastic strain, pij,capε , is given by
cappij,cap ij ij
**
13
R DDλ
ε δ⎛ ⎞′= +⎜ ⎟⎝ ⎠
(24)

16
where D* is the cap related dilatancy and capλ the cap related plastic multiplier
(Chakraborty 2009). The equation of D* is obtained by Chakraborty (2009) as
( ) ( )0,NC 0,NC
0,NC 0,NC
ij ij
*
1 11 11 2 1 21 1 13 3
1 1 2
K K
K KD
p e K p e Gr rλ κ λ κ
− −⎛ ⎞ ⎡ ⎤⎜ ⎟ ⎢ ⎥
+ +⎜ ⎟ ⎢ ⎥⎡ ⎤− −⎜ ⎟ ⎢ ⎥= + −⎢ ⎥′ ′+ +⎜ ⎟ ⎢ ⎥⎣ ⎦⎜ ⎟ ⎢ ⎥⎜ ⎟ ⎢ ⎥⎝ ⎠ ⎣ ⎦
(25)
where K0,NC is the coefficient of earth pressure at rest for normally consolidated clay.
capλ is given by
capc
1 pH
λ ′= (26)
where Hc is the plastic modulus controlling the development of pij,capε and is given by
cc
1 exp p peH pp
ζλ κ
′ ′⎡ ⎤−+′= ⎢ ⎥′− ⎣ ⎦ (27)
Hc is very high for stress states far from the cap but decreases exponentially with the
distance p′c − p′.
The constitutive model presented in this report is an extension of previously
developed constitutive model by Manzari and Dafalias (1997), Dafalias et al. (2004),
Loukidis and Salgado (2009) and Chakraborty (2009). The unique features of the
constitutive model presented herein are (1) a new equation for the strain-rate dependent
preconsolidation pressure, (2) use of a single parameter C0 to capture the rate dependence
as a function of OCR, (3) variable distance between CSL and NCL in the e-ln(p′) space
and (4) rate dependent dilatancy equation. These features have improved the
performance of the model significantly.
17
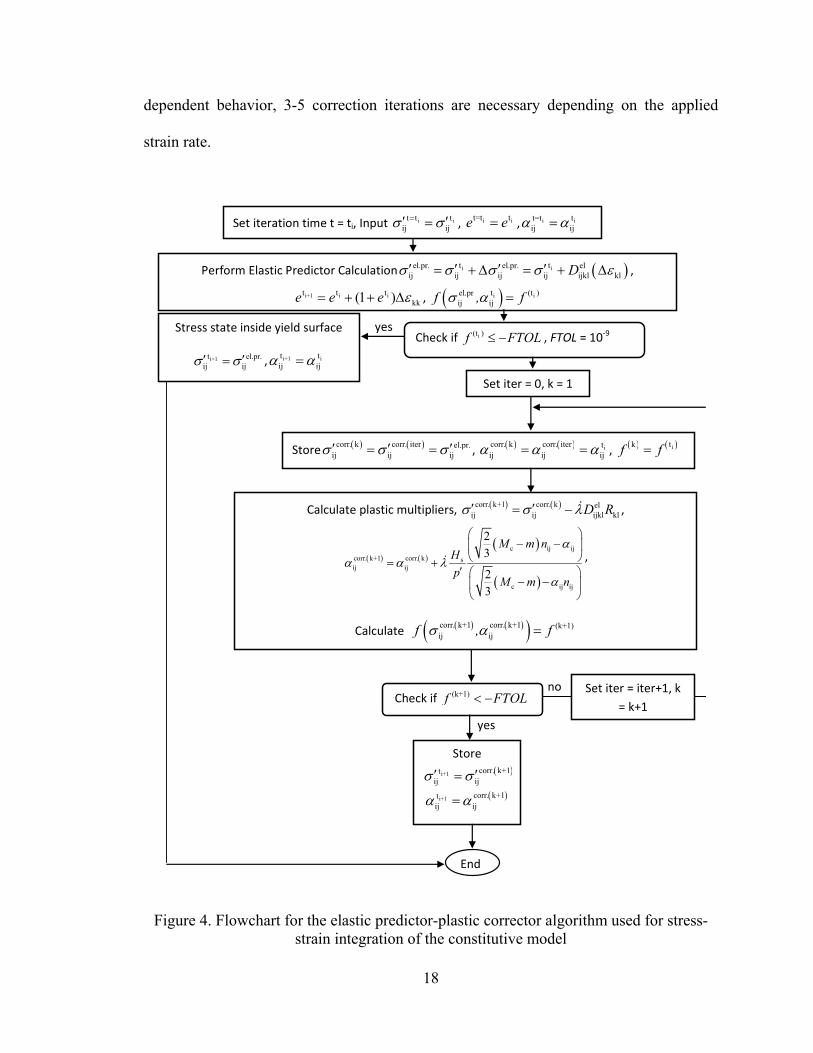
The stress-strain integration of the constitutive model is performed using an
elastic predictor-plastic corrector algorithm as illustrated in Figure 4 (Ortiz and Simo
1986). In this algorithm, at a certain time step t = ti, the stresses σ'ij, kinematic hardening
variable αij and void ratio e are the input parameters. The elastic predictor stress is
calculated from the input stresses using the strain increment Δεkl in the iteration step.
The elastic stiffness matrix elijklD used in the stress-strain relation is the shear modulus
when deviatoric stress is calculated from deviatoric strain and is the bulk modulus when
mean stress is calculated from volumetric strain. Once the elastic predictor stresses are
calculated, the yield stress value f is checked with the yield surface error tolerance FTOL
(= 10−9). If f < FTOL, it signifies that the stresses are elastic and the iteration loop
completes and the next strain increment starts. If f > FTOL, then stresses are outside the
yield surface, and plastic correction starts. Plastic multiplier λ is calculated to perform
the plastic correction. The shear induced plastic multiplier shearλ is calculated for the
deviatoric stress correction and the cap induced plastic multiplier capλ is calculated for the
cap induced volumetric stress correction. In the correction step, the total incremental
strain Δεkl for that particular increment remains constant. After the stress correction is
done, stresses, kinematic hardening variable and void ratio are updated and the yield
stress value is again checked with FTOL. Further plastic correction is performed before
starting a new strain increment if f > FTOL. For the simulation of the rate-independent,
single element triaxial test, one-step plastic correction iteration is generally sufficient
when the incremental strain Δεkl is sufficiently small. However, for simulating rate-
18
dependent behavior, 3-5 correction iterations are necessary depending on the applied
strain rate.
Figure 4. Flowchart for the elastic predictor-plastic corrector algorithm used for stress-strain integration of the constitutive model
Set iteration time t = ti, Input i it t t
ij ij=′ ′=σ σ , i it=t t=e e , i it=t t
ij ij=α α
Perform Elastic Predictor Calculation ( )i it tel.pr. el.pr. elij ij ij ij ijkl kl′ ′ ′ ′= + Δ = + ΔDσ σ σ σ ε ,
i+1 i it t tkk(1 )e e e ε= + + Δ , ( )i it (t )el.pr
ij ij =f , fσ α
Check if i(t ) ≤ −f FTOL , FTOL = 10‐9
Store ( ) ( )corr. k corr. iter el.pr.ij ij ij′ ′ ′= =σ σ σ , ( ) ( ) icorr. k corr. iter t
ij ij ij= =α α α , ( ) ( )ik t=f f
Calculate plastic multipliers, ( ) ( )corr. k+1 corr. k elij ij ijkl kl′ ′= − D Rσ σ λ ,
( ) ( )( )
( )
c ij ijcorr. k+1 corr. k sij ij
c ij ij
23
23
⎛ ⎞− −⎜ ⎟
⎝ ⎠= +′ ⎛ ⎞
− −⎜ ⎟⎝ ⎠
M m nHp
M m n
αα α λ
α
,
Calculate ( ) ( )( )corr. k+1 corr. k+1 (k+1)ij ij =f , fσ α
Stress state inside yield surface
i+1t el.pr.ij ij′ ′=σ σ , i+1 it t
ij ij=α α
yes
Check if (k+1) < −f FTOL
yes
Store( )i+1 corr. k+1t
ij ij′ ′=σ σ( )i+1 corr. k+1t
ij ij=α α
no
End
Set iter = 0, k = 1
Set iter = iter+1, k = k+1

19
MODEL PARAMETERS
The constitutive model has 14 rate-independent and 1 rate-dependent parameters.
These parameters were determined based on one-dimensional consolidation, triaxial
compression and extension, simple shear, bender element and resonant column tests. The
constitutive model is calibrated in a hierarchical manner by curve fitting over given sets
of experimental data points. Such a hierarchical process of model parameter
determination is described in details in Chakraborty (2009).
The model parameters are determined for Boston Blue Clay (BBC), Kaolin Clay
(KC), and London Clay (LC). BBC is a low-plasticity marine clay, composed of illite
and quartz (Terzaghi et al. 1996). LC contains illite, kaolinite, smectite and quartz
(Gasparre et al. 2007a and 2007b). KC mainly contains kaolinite. Table 1 shows the
index properties of BBC, LC and KC. The calibrated values of the model parameters are
given in Table 2. Most of the rate-independent model parameters for BBC and LC are
obtained from Chakraborty (2009). The newly introduced dilatancy parameter d1 is
determined by comparing the rate-independent simulation results with the experimental
data obtained from the literature. The parameter ρ is recalibrated to better capture the
anisotropic stress-strain behavior of clays. The experimental data for BBC used in this
study are obtained from Papadimitriou et al. (2005), Pestana et al. (2002) and Ling et al.
(2002) (the original test data of Ladd and Varallay 1965, Ladd and Edgers 1972 and
Sheahan 1991 were used). The data for LC are obtained from Gasparre (2005), Gasparre
et al. (2007a, b) and Hight et al. (2003). The experimental data for KC are obtained from
Ling et al. (2002).

20
Table 1. Index Properties of Boston Blue Clay, London Clay, and Kaolin Clay
Table 2. Constitutive Model Parameters for Boston Blue Clay, London Clay and Kaolin Clay
Model Parameters Model Relationships BBC LC KC
Small-Strain (Elastic) Poisson’s ratio ν 0.25 0.2 0.25 G0 Correlation Parameter Cg 250 100 120
Elastic Moduli with Degradation ζ 5 10 5 κ 0.036 0.064 0.033
Normal Consolidation Line N 1.138 1.07 0.984 λ 0.187 0.168 0.18
Critical State Surface Mc 1.305 0.827 1.18 ρ 2.2 2.5 2.7
Dilatancy Surface d1 0.2 0.2 0.2 d0 1 0.24 0.8
Flow Rule c2 0.95 0.95 0.95 ns 0.2 0.2 0.2
Hardening h0 1.1 1.1 1.1 Rate Dependence C0 0.1-2.0 2.0 0.05
The rate-dependent parameter C0 was determined by comparing the simulation
results with the rate-dependent triaxial compression data of Sheahan (1991) and Sheahan
et al. (1996) for BBC, of Sorensen et al. (2007) for LC and of Mukabi and Tatsuoka
Clay Type
Liquid Limit (%)
Plastic Limit(%) Classification Reference
Boston Blue Clay
32.6 19.5 Inorganic Clay or Silt of Low to Medium Plasticity (CL) (USCS) Ladd and Varallyay
(1965)
London Clay 69.6 26.2 High Plasticity Stiff Clay Nishimura (2005)
KaolinClay 62 30 Low Compressibility (CL/ML)
(USCS) Prashant (2004)
21
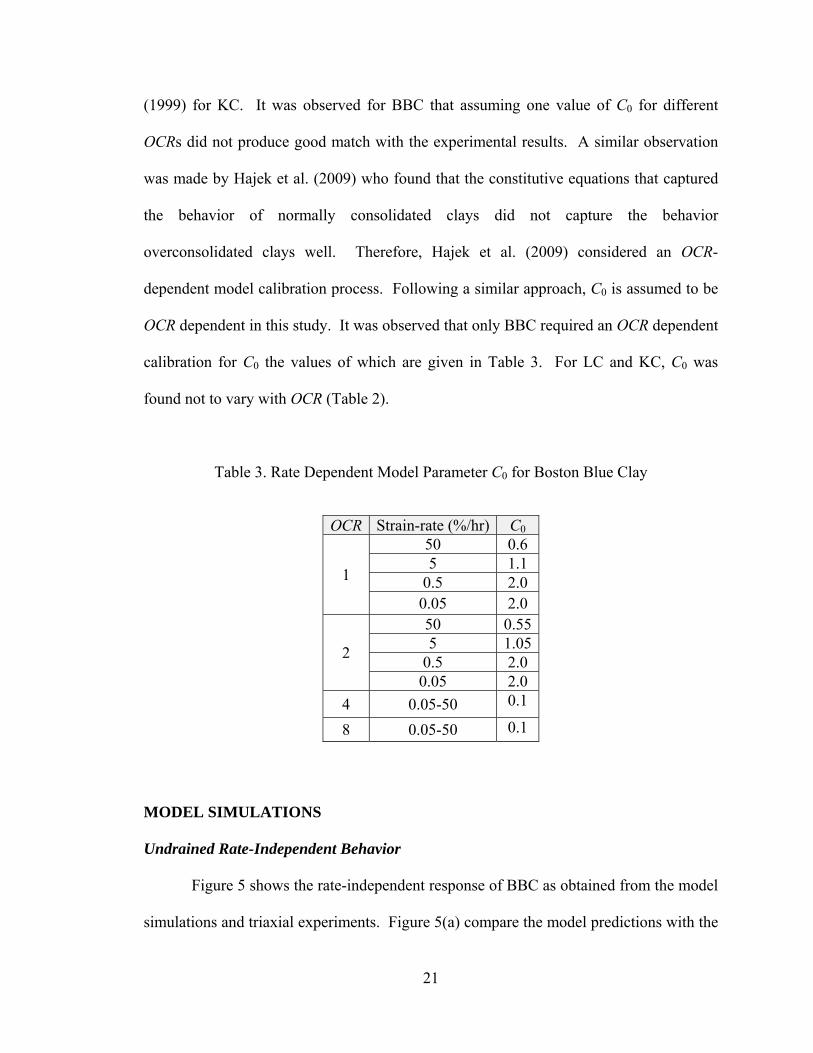
(1999) for KC. It was observed for BBC that assuming one value of C0 for different
OCRs did not produce good match with the experimental results. A similar observation
was made by Hajek et al. (2009) who found that the constitutive equations that captured
the behavior of normally consolidated clays did not capture the behavior
overconsolidated clays well. Therefore, Hajek et al. (2009) considered an OCR-
dependent model calibration process. Following a similar approach, C0 is assumed to be
OCR dependent in this study. It was observed that only BBC required an OCR dependent
calibration for C0 the values of which are given in Table 3. For LC and KC, C0 was
found not to vary with OCR (Table 2).
Table 3. Rate Dependent Model Parameter C0 for Boston Blue Clay
OCR Strain-rate (%/hr) C0
1
50 0.6 5 1.1
0.5 2.0 0.05 2.0
2
50 0.555 1.05
0.5 2.0 0.05 2.0
4 0.05-50 0.1
8 0.05-50 0.1
MODEL SIMULATIONS
Undrained Rate-Independent Behavior
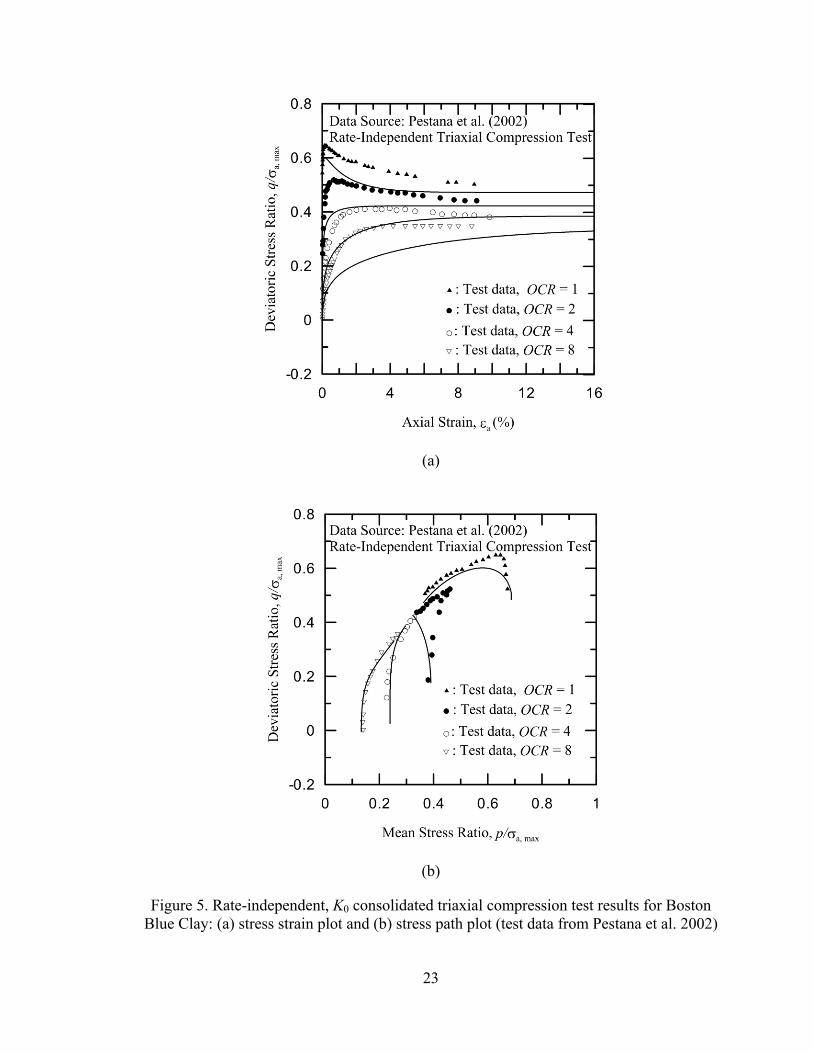
Figure 5 shows the rate-independent response of BBC as obtained from the model
simulations and triaxial experiments. Figure 5(a) compare the model predictions with the
22
experimental data of the deviatoric stress q as a function of axial strain εa for undrained
triaxial compression of K0-consolidated specimens. Figure 5(b) shows the comparisons
for the corresponding stress path plots (deviatoric stress versus mean stress). The stress
values are normalized with respect to the maximum axial stress σ'a,max. In the
simulations, the same Mcc value is used for both isotropic and K0 consolidation cases.
This causes a slight under prediction of stresses at OCR = 4 and 8. Overall, the
simulations match the experimental results reasonably well. Similar match between
experimental and simulation results were observed for LC and KC as well and are given
in Martindale (2011).
Figure 6 compares the model predictions with the rate-independent experimental
data of undrained triaxial compression tests performed on isotropically-consolidated
specimens of LC. The stress-strain (Figures 6(a)) and stress path plots (Figure 6(b))
show a reasonable match between simulation results and experimental data. Similar
comparisons for BBC and KC were also done and a reasonable match between
experimental and simulation results were observed (Martindale 2011).
23
(a)
(b)
Figure 5. Rate-independent, K0 consolidated triaxial compression test results for Boston Blue Clay: (a) stress strain plot and (b) stress path plot (test data from Pestana et al. 2002)

24
(a)
(b)
Figure 6. Rate-independent, isotropically consolidated triaxial compression test results for London clay: (a) stress strain plot and (b) stress path plot (test data from Gasparre
2005)

25
Undrained Rate-Dependent Behavior
Figure 7 shows the comparison between simulation and experimental results of
rate-dependent, K0-consolidated triaxial compression tests on BBC with an applied strain
rate of 5%/hr. The stresses are normalized with respect to the maximum axial stress
σ'a,max. The stress-strain (Figure 7(a)) and stress path plots (Figure 7(b)) demonstrate the
ability of the constitutive model to capture the mechanical response of clays under strain
rate-dependent loading. The model captures the peak undrained strength su,peak as a
function of strain rate reasonably well for the range of OCR considered in the study. The
post-peak shear strength is, however, under predicted. The stress paths are also captured
with reasonable accuracy. Similar comparisons for BBC for other strain-rate values are
given in Martindale (2011).
Figure 8 shows the deviatoric stress versus axial strain plots of rate-dependent,
isotropically consolidated triaxial tests performed on LC samples with OCR = 1 and 5 at
different strain rates. The simulated plots are in reasonable agreement with the
experimental plots. Similar comparisons for KC were also done the details of which are
given in Martindale (2011). Figure 9 shows the plots of the predicted su,peak values for
BBC, LC and KC along with the corresponding experimental values as a function of
strain rate. This plot shows that the developed constitutive model predicts the rate-
dependent undrained shear strength of clay reasonably well.

26
(a)
(b).
Figure 7. Rate-dependent, K0 consolidated triaxial compression test results for Boston Blue clay (applied strain rate = 5%/hr): (a) stress strain plot and (b) stress path plot (test
data from Sheahan et al. 1996)

27
Figure 8. Stress strain plots for rate-dependent, isotropically consolidated triaxial compression tests performed on London clay (test data from Sorensen et al. 2007)

28
Figure 9. Normalized su,peak as a function of strain rate: comparison of simulation and experimental results
Parametric Sensitivity Study
The sensitivity of each model parameter was checked for BBC, LC and KC. For
the sensitivity study, the model parameters were perturbed by ±20% of their calibrated
values one at a time. An average error Eaverage was calculated for each parameter as
29
Total Number of Strain Valuesbase,i var ,i
i 1 base,iaverage
100
(%) = Total Number of Error Calculations at Different Strain Values
q qq
E=
⎡ ⎤⎡ ⎤−⎢ ⎥×⎢ ⎥⎢ ⎥⎢ ⎥⎣ ⎦⎢ ⎥⎢ ⎥⎢ ⎥⎣ ⎦
∑
(28)
where qbase,i is the value of deviatoric stress obtained from model simulation at ith strain
increment using the calibrated model parameters and qvar,i is the corresponding value of
deviatoric stress obtained from model simulation when a parameter is perturbed. The
error E = |qbase,i − qvar,i|/qbase,i is calculated at different strain values and then the total
accumulated error for all the strain values is divided by the number of calculations to
obtain Eaverage. Eaverage calculated for all the parameters of BBC for rate-independent, K0
consolidated triaxial test simulations are shown in Table 4 for different values of OCR.
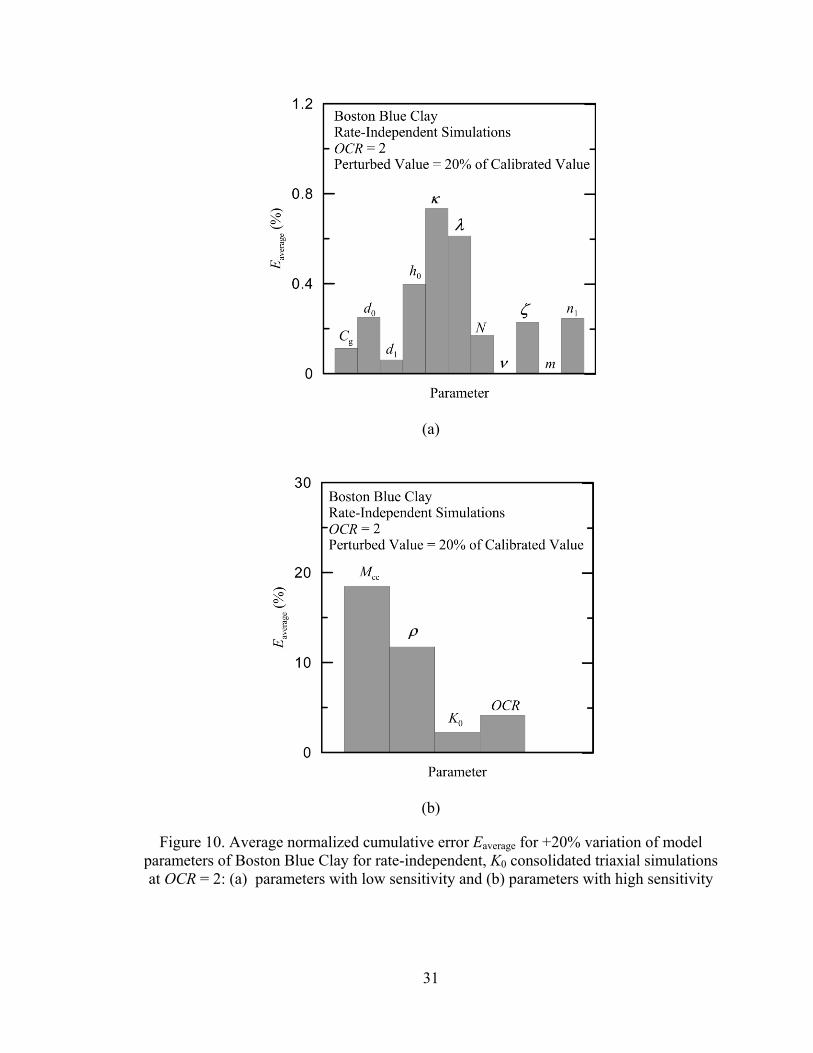
The values corresponding to OCR = 2 and +20% perturbation are shown in Figure 10. It
is evident that Mcc, ρ, OCR and K0 are the most sensitive parameters. For normally
consolidated clays, λ and κ are relatively more sensitive than the remaining parameters
while, for overconsolidated clays, the dilatancy parameters d0 and d1 are relatively more
sensitive. Similar trends were observed for LC and KC as well (Martindale 2011).

30
Table 4. Average Parameter Sensitivity Error for Boston Blue Clay for Rate-Independent Loading
Average Parameter Sensitivity Error Eaverage (%) +20% Variation −20% Variation
Parameter OCR = 1 OCR = 2 OCR = 4 OCR = 8 OCR = 1 OCR = 2 OCR = 4 OCR = 8 Cg 0.15 0.11 0.50 0.82 0.19 0.14 0.60 0.96 d0 0.83 0.25 0.51 2.64 1.33 0.39 0.75 3.39 d1 0 0.06 0.39 4.27 0 0.06 0.35 34.55
Mcc 17.89 18.54 19.46 22.64 18.68 19.01 19.87 22.67 h0 0.39 0.39 0.48 0.27 0.55 0.56 0.73 0.39 κ 2.94 0.73 1.58 4.21 3.01 0.77 1.82 5.30 λ 2.09 0.61 0.58 1.09 3.26 0.93 0.85 1.73 N 0.11 0.17 0.53 1.38 0.12 0.16 0.54 1.36 ρ 11.22 11.802 11.75 12.38 17.03 18.08 18.18 20.89 ν 0 0 0 0 0 0 0 0 ζ 0.39 0.22 1.25 2.26 0.56 0.25 1.69 3.76
K0 9.14 2.27 2.62 3.72 10.14 2.52 2.70 3.26 OCR 4.33 4.18 5.77 11.89 - 5.29 6.44 12.51
m 0.01 0 0 0 0 0 0 0 n1 0.40 0.24 0.08 0.11 0.48 0.28 0.09 0.12
30
31
(a)
(b)
Figure 10. Average normalized cumulative error Eaverage for +20% variation of model parameters of Boston Blue Clay for rate-independent, K0 consolidated triaxial simulations at OCR = 2: (a) parameters with low sensitivity and (b) parameters with high sensitivity
32
Uncertainties in Model Parameters
The uncertainty associated with the estimation of the model parameters is
investigated probabilistically by considering the model parameters as random variables
and performing Monte Carlo (M-C) simulations of the mechanical response of BBC. The
study was done assuming that the random variables (model parameters) follow normal
and uniform probability distributions. The calibrated deterministic values were assumed
to be the means μ of the random parameters. The standard deviations σ were calculated
with the assumption that the ±20% scatter about the mean (deterministic) values
correspond to ±3σ. Thus, the coefficient of variation COV (= σ/μ) for all the parameters
is 0.067. The same mean and standard deviation values were used for normal and
uniform distributions in the M-C simulations.
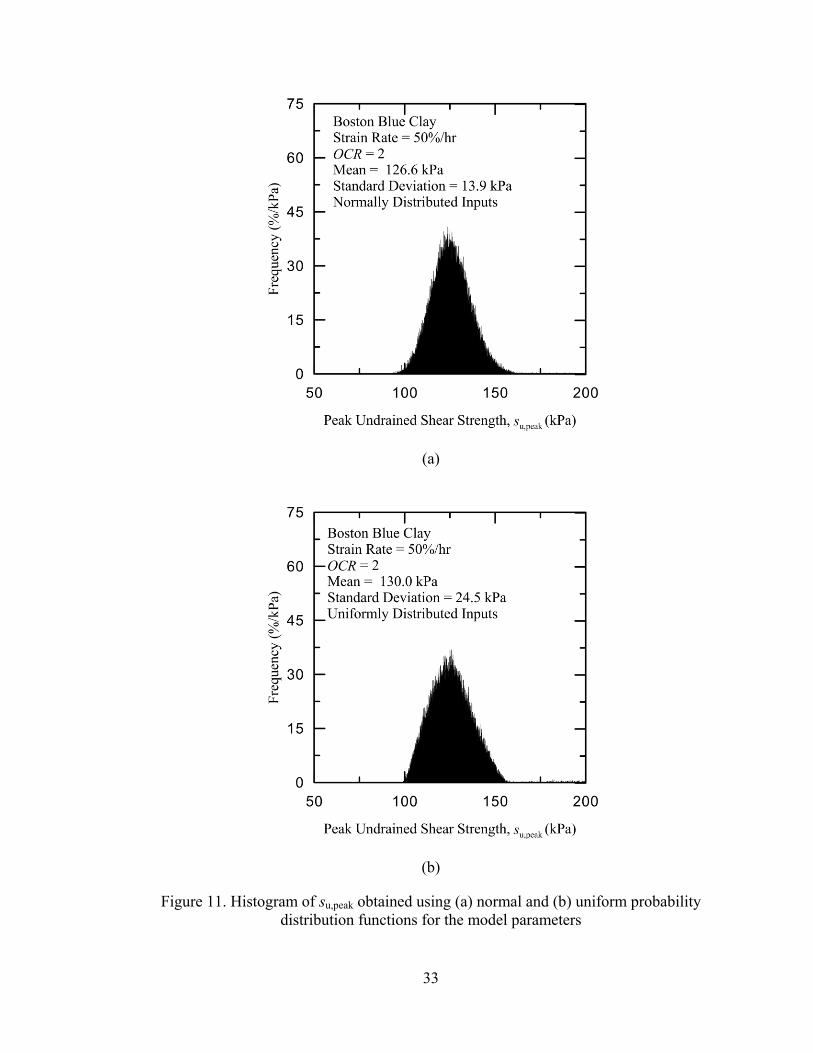
Representative histograms of su,peak of BBC considering normal and uniform
probability distribution functions are shown in Figure 11. These results were obtained for
triaxial simulations at 50%/hr strain rate on K0 consolidated specimens with OCR = 2.
The nature of the distributions of su,peak is approximately the same for both the normal
and uniform probability distributions of the input parameters. The difference in the mean
values of su,peak obtained for normally and uniformly distributed input parameters is only
0.21%. A similar trend was observed for the undrained shear strength su,CS at the critical
state (Martindale 2011).
33
(a)
(b)
Figure 11. Histogram of su,peak obtained using (a) normal and (b) uniform probability distribution functions for the model parameters
34
Figure 12 shows the mean and COV of su,peak of K0 consolidated BBC at OCR = 8
as a function of strain rate. The su,peak values are obtained deterministically and
probabilistically using normally and uniformly distributed inputs. The mean values for
all the three cases match very well. The mean (or deterministic) undrained shear strength
increases while the COV decreases with increase in the applied strain rate. Figure 12(a)
shows that the deterministic and mean values are the same for practical purposes. Figure
12(b) indicates that, in most likelihood, the magnitude of error in the estimation of the
undrained shear strength due to erroneous model parameter estimations will not be
significant.

35
(a)
(b)
Figure 12. Variation of (a) mean and deterministic su,peak and (b) COV of su,peak with applied strain rate for OCR = 8
36
CONCLUSIONS
The report presents a rate-dependent plastic constitutive model for clays
developed using the concepts of critical state soil mechanics and bounding surface
plasticity. The model consists of conical yield, dilatancy and critical state surfaces with a
flat cap on the critical state surface. The model is capable of simulating clay behavior for
both isotropic and anisotropic initial stress state and for loading paths that are more
general than triaxial compression/extension. The proposed model has 1 rate dependent
parameter and 14 rate independent parameters. The parameters were determined for
BBC, LC and KC following a hierarchical manner. The model considers OCR dependent
model calibration process for the strain-rate dependent parameter.
The proposed constitutive model captures adequately the rate-independent and
rate-dependent response of clay behavior under isotropic and K0-consolidated triaxial
compression conditions. The model retains the rate-independent formulation in
conjunction with the two-surface plasticity model and simulates the rate-dependent clay
response without expensive numerical algorithm.
The sensitivity of each model parameter is checked by perturbing the calibrated
values by ±20% one at a time. The parameters Mcc, ρ, OCR and K0 are the most
sensitive. For normally consolidated clays, λ and κ are relatively more sensitive than the
remaining parameters while, for overconsolidated clays, the dilatancy parameters d0 and
d1 are relatively more sensitive.
The uncertainties associated with the estimation of the model parameters was
investigated probabilistically by considering the model parameters as random variables
following normal and uniform probability distributions. Monte Carlo (M-C) simulations

37
were performed and the statistics of the undrained shear strength of BBC was
investigated. The same values of mean and standard deviation were used for normal and
uniform distributions in the M-C simulations. The su,peak values, obtained
deterministically and probabilistically using normally and uniformly distributed inputs,
matched very well. The coefficients of variation of su,peak were found to be not more than
12% which indicate that the magnitude of error in the estimation of the undrained shear
strength due to erroneous model parameter estimations will not be significant.
REFERENCES
Adachi, T. and Oka, F. (1982). “Constitutive equations for normally consolidated clay
based on elasto-viscoplasticity.” Soils and Foundations, 22(4), 57-70.
Been, K. and Jefferies, M. G. (1985). “A State Parameter for Sands.” Géotechnique,
35(2), 99-112.
Chakraborty, T. (2009). “Development of a clay constitutive model and its application to
pile boundary value problems.” Ph.D. Thesis, Purdue University, West Lafayette,
Indiana, USA.
Dafalias, Y. F. (1982). “Bounding surface elastoplasticity-viscoplasticity for particulate
cohesive media.” International Union of Theoretical and Applied Mechanics
Conference on Deformation and Failure of Granular Materials (P. A. Vermeer
and H. J. Luger, eds.), 97–107.
Dafalias, Y. F., Papadimitriou, A. G. and Li, X. S. (2004). “Sand plasticity model
accounting for inherent fabric anisotropy.” Journal of Engineering Mechanics,
ASCE, 130(11), 1319-1333.

38
Díaz-Rodríguez, J. A., Martínez-Vasquez, J. J. and Santamarina, J. C. (2009). “Strain-rate
effects in Mexico city soil.” Journal of Geotechnical and Geoenvironmental
Engineering, ASCE, 135(2), 300-305.
Gasparre, A. (2005). “Advanced laboratory characterization of London clay.” Ph.D.
Thesis, Imperial College London.
Gasparre, A., Nishimura, S., Minh, N. A., Coop, M. R. and Jardine, R. J. (2007a). “The
stiffness of natural London clay.” Géotechnique, 57(1), 33-7.
Gasparre, A., Nishimura, S., Coop, M. R., and Jardine, R. J. (2007b). “The influence of
structure on the behaviour of London clay.” Géotechnique, 57(1), 19-31.
Hájek, V., Mašín, D., and Boháč, J. (2009). “Capability of constitutive models to
simulate soils with different OCR using a single set of parameters.” Computers
and Geotechnics, 36, 655-664.
Hardin, B. O. (1978). “The nature of stress-strain behavior of soils.” State-of –the-Art
Report, Proceedings of the ASCE Specialty Conference on Earthquake
Engineering and Soil Dynamics, Pasadena, 1978, 3-90.
Hight, D.W., McMillan, F., Powell, J. J. M., Jardine, R.J., and Allenou, C.P. (2003).
“Some characteristics of London clay.” Characterization of Engineering
Properties of Natural Soils, Balkema, 851-908.
Hinchberger S. D. and Rowe, K. R. (1998). “Evaluation of the predictive ability of two
elasticviscoplastic constitutive models.” Canada Geotechnical Journal, 35, 769–
789.
Jung, B. C. and Biscontin, G. (2006). “Modeling of strain rate effects on clay in simple
shear.” Proceedings of GeoCongress 2006, 1-6.

39
Kaliakin, V. N. and Dafalias, Y. F. (1990a). “Theoretical aspects of the elastoplastic-
viscoplastic bounding surface model for cohesive soils.” Soils and Foundations,
30(3), 11-24.
Kaliakin, V. N. and Dafalias, Y. F. (1990b). “Verification of the elastoplastic-viscoplastic
bounding surface model for cohesive soils.” Soils and Foundations, 30(3), 25-36.
Kavazanjian, E., and Mitchell, J. K. (1980). “Time-dependent deformation behavior of
clays.” Journal of Geotechnical and Geoenvironmental Engineering, ASCE,
106(6), 611-630.
Ladd, C. C. and Edgers, L. (1972). “Consolidated-Undrained Direct Simple Shear Tests
on Boston Blue Clay.” Research Report R72-82, Department of Civil
Engineering, MIT, Cambridge, MA.
Ladd, C.C. and Varallyay, J. (1965). “The influence of the stress system on the behavior
of saturated clays during undrained shear.” Research Report No R65-11,
Department of Civil Engineering, MIT, Cambridge, MA.
Leroueil, S., Tavenas, F., Samson, L. and Morin, P. (1983). “Preconsolidation Pressure of
Champlain Clays – Part II: Laboratory Determination.” Canadian Geotechnical
Journal, 20(4), 803-816.
Leroueil, S., Kabbaj, M., Tavenas, F. and Bouchard, R. (1985). “Stress-strain rate relation
for the compressibility of sensitive natural clays.” Géotechnique, 35(2), 159-180.
Li, X. S. and Dafalias, Y. F. (2000). “Dilatancy of cohesionless soils.” Géotechnique,
50(4), 449-460.

40
Ling, H. I., Yue, D., Kaliakin, V. and Themelis, N.J. (2002). “An anisotropic elasto-
plastic bounding surface model for cohesive soils.” Journal of Engineering
Mechanics, ASCE, 128(7), 748-758.
Loukidis, D. and Salgado, R. (2009). “Modeling sand response using two-surface
plasticity.” Computers and Geotechnics, 36, 166–186.
Manzari, M. T. and Dafalias, Y. F. (1997). “A critical state two-surface plasticity model
for sands.” Géotechnique, 47(2), 255-272.
Martindale, H. (2011). “Rate-Dependent Behavior of Clay.” M.S. Thesis, University of
Connecticut, Storrs, Connecticut, USA.
Matešić, L. and Vucetic, M. (2003). “Strain-Rate Effect on Soil Secant Modulus at Small
Cyclic Strains.” Journal of Geotechnical and Geoenvironmental Engineering,
ASCE, 129(6), 536–549.
Mukabi, J.N. and Tatsuoka, F. (1999) “Influence of reconsolidation stress history and
strain rate on the behaviour of kaolin over a wide range of strain.” 12th ARC:
Geotechnics for Developing Africa, Durban, South Africa., 365-377.
Nishimura, S. (2005). “Laboratory study on anisotropy of natural London Clay.” PhD
Thesis, Imperial College London.
Ortiz, M. and Simo, J. C. (1986). “An Analysis of a New Class of Integration Algorithms
for Elastoplastic Constitutive Relations.” 23, 353-366.
Papadimitriou, A. G. and Bouckovalas, G. D. (2002). “Plasticity Model for Sand Under
Small and Large Cyclic Strains: a Multiaxial Formulation.” Soil Dynamics and
Earthquake Engineering, 22 (3), 191-204.

41
Papadimitriou AG, Manzari MT and Dafalias YF. (2005) “Calibration of A Simple
Anisotropic Plasticity Model for Soft Clays.” Proceedings, GeoFrontiers
Conference of ASCE, January 24–26, Austin, TX, Geotechnical Special
Publication No. 128, 415–424.
Paquin, G. (1983). “Contribution á l’étude de la Déstructuration et Restructuration des
Argiles Sensible.” M.S. Thesis, Université Laval, Quebec, P.Q.
Perzyna, P. (1963). “The Constitutive Equations for Rate Sensitive Plastic Materials.”
Quarterly of Applied Mathematics, 20, 321-332.
Perzyna, P. (1966). “Fundamental Problems in Viscoplasticity.” Advances in Applied
Mechanics, 9, 244–377.
Pestana, J. M., Whittle, A. J. and Gens, A. (2002). “Evaluation of a Constitutive Model
for Clays and Sands: Part II – Clay Behavior.”, International Journal for
Numerical and Analytical Methods in Geomechanics, 26, 1123-1146.
Prashant, A. (2004). “Three-Dimensional Mechanical Behavior of Kaolin Clay with
Controlled Microfabric Using True Triaxial Testing.” PhD. Dissertation,
University of Tennessee, Knoxville, USA.
Sheahan, T.C. (1991). “An Experimental Study of the Time-Dependent Undrained Shear
Behavior of Resedimented Clay Using Automated Stress Path Equipment.”
Doctoral Dissertation, MIT, Cambridge, MA.
Sheahan, T.C., Ladd, C.C. and Germaine, J.T. (1996). “Rate Dependent Undrained Shear
Behaviour of Saturated Clay.” Journal of Geotechnical and Geoenvironmental
Engineering, ASCE, 122(2), 99–108.
42
Sheahan, T.C. (2005). “A Soil Structure Index to Predict Rate Dependence of Stress-
Strain Behavior.” Testing, Modeling and Simulation in Geomechanics, ASCE,
Geotechnical Special Publication, no. 143, 81-97.
Sorensen, K.K., Baudet, B. A. and Simpson, B. (2007). “Influence of Structure on the
Time-Dependent Behaviour of a Stiff Sedimentary Clay.” Géotechnique, 57(1),
113–124.
Terzaghi, K., Peck, R. B. and Mesri, G. (1996). Soil Mechanics in Engineering Practice.
3rd Ed., Wiley, New York.
Zhou, H. and Randolph, M.F. (2007). “Computational Techniques and Shear Band
Development for Cylindrical and Spherical Penetrometers in Strain-Softening
Clay.” International Journal of Geomechanics, 7(4), 287–295.
Zienkiewicz, O. C. and Cormeau, I. C. (1974). “Viscoplasticity, Plasticity and Creep in
Elastic Solids: A Unified Numerical Solution Approach.” International Journal of
Numerical Methods in Engineering, 8, 821–828.