Embed Size (px)
Citation preview
Consortium for Climate Risk in the Urban Northeast
Research Highlights, April 1 2013 - May 31, 2014
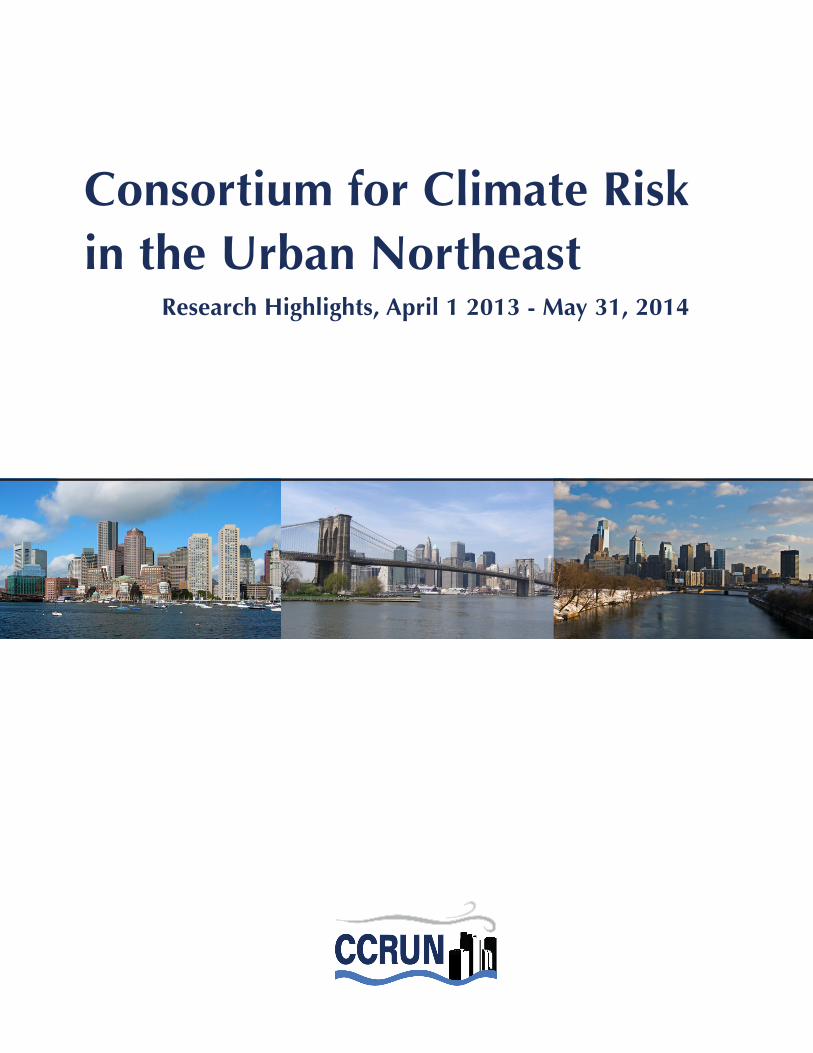
CCRUN’s Mission
To conduct stakeholder-driven research that reduces climate-related vulnerability and advances opportunities
for adaptation in the urban Northeast
Columbia University in the City of New York
Apr i l 2013 - May 2014 | 1
The CCRUN TeamThe team is comprised of investigators, research & support staff, and graduate students from five institutions across the CCRUN project area: Columbia University (CU), the University of Massa-chusetts-Amherst (UMass), City College of the City University of New York (CCNY), Stevens In-stitute of Technology (Stevens), and Drexel University (Drexel).
Lead Investigators, Sectors and Cross-Cutting Themes: Alan Blumberg (Stevens), Patrick Kin-ney (CU), Yochanan Kushnir (CU), Upmanu Lall (CU), Malgosia Madajewicz (CU), Franco Mon-talto (Drexel), Richard Palmer (UMass), Cynthia Rosenzweig (CU/NASA)
Research Coordinator: Radley Horton (CU)
Project Manager: Linda Sohl (CU)
Investigators: Mark Arend (CCNY), James Booth (CCNY), Raymond Bradley (UMass), Casey Brown (UMass), Robert Chen (CU), Naresh Devineni (CCNY), Kimberly DiGiovanni (Drex-el), Richardson Dilworth (Drexel), Vivien Gornitz (CU), Patrick Gurian (Drexel), Reza Khanbil-vardi (CCNY), Joseph Martin (Drexel), Kytt MacManus (CU) Rouzbeh Nazari (CCNY), Philip Or-ton (Stevens), Anu Pradhan (Drexel), Julie Pullen (Stevens), Dave Runnels (Stevens), Sabrina Spa-tari (Drexel), Brian Vant-Hull (CCNY), Sergei Vinogradov (Stevens), Larry Yin (Stevens)
Research & Support Staff: Dan Bader (CU), Kaitlin Butler (CU), Paulina Concha (CU), Manishka De Mel (CU) Nickitas Georgas (Stevens), Annie Gerard (CU), Donna Lee (CU), Valentina Mara (CU), Dara Mendeloff (CU)
Graduate Students and Post-Docs: Bita Alizadehtazi (Drexel), Leslie DeCristofaro (UMass), Scott Jeffers (Drexel), Maryam Karimi (CCNY), Griffin Kidd (Drexel), Benjamin Mayersohn (CU), Stepha-nie Miller (Drexel), Elisaveta Petkova (CU), Haruka Morita (CU), Nicholas Rossi (UMass), Ma-ria Raquel Catalano De Sousa (Drexel), Lauren Smalls-Mantey (Drexel), Sarah Whateley (UMass), Suiijia Yang (CU), Walter Yerk (Drexel), Ziwen Yu (Drexel)
Research Affiliates: Susana Adamo (CU), Somayya Ali (CU), James Booth (CCNY), Olena Borkovs-ka (CU), Suzana Carmaga (CU), Edward Cook (CU), Jennifer Hansen (Stevens), Klaus Jacob (CU), Malanding Jaiteh (CU), Peter Kolesar (CU Business School), Jamie Madrigano (Rutgers), David Major (CU), Jane Mills (CU), Jennifer Nakamura (CU), Dan O’Flaherty (CU), Neil Peder-son (CU), Nada Petrovic (CU CRED), Ashlinn Quinn (CU), Harald Reider (Univ. of Graz, Austria), Andrew Robertson (CU), Ray Sambrotto (CU), Richard Seager (CU), Jeffrey Shaman (CU), John Squires (CU), James Tamerius (CU), Mingfang Ting (CU), Jin Wen (Drexel), Jianting Zhang (CCNY)
Other Collaborators: Cecil Corbin-Mark (WE ACT), Raluca Ellis (Franklin Institute), Timo-thy Hall (NASA-GISS), Penny Howell (CT Dept. of Energy & Environmental Protection), Kaz Ito (NYC DOH), David Jay (Portland State University), Tiantian Li (China Centers for Disease Con-trol), Tom Matte (NYC DOH), Kate Orff and the SCAPE team, Leslie Patrick (CUNY Institute for Sustainable Cities), Hugh Roberts (Arcadis, Inc.), , Guy Robinson (Fordham University), Alex Ru-ane (NASA-GISS), Vincent Saba (NOAA NMFS), Eric Sanderson (Wildlife Conservation Society), Peggy Shepard (WE ACT), William Solecki (CUNY Institute for Sustainable Cities), Stefan Talke (Portland State University), Jalonne White-Newsome (WE ACT)
2 | CCRUN R e p o R t
Stakeholders and Partners A & D Hydro, Inc. Alternatives for Community and Environment (ACE)American Red Cross of Greater New YorkAmerican Water CompanyAmerican Water Works AssociationAppalachian Mountain Club Ashburnham (MA) Department of Public Works Bear Swamp Power Company, LLC Boston Office of Environmental and Energy ServicesBoston Public Health CommissionBrattleboro (VT) Water Department Bristol (CT) Water Department Brookfield Renewable Power, Inc.Bucks County (PA) Water & Sewer AuthorityBurlington (MA) Water Department Canaan (NH) Water Department Chester (PA) Water Authority Chicopee (MA) Water Department Clean Air CouncilClean Air-Cool PlanetConnecticut Department of Environmental Protection/Inland Wa-
ter Resources Division Connecticut River Watershed Council Connecticut Water Dalton Hydro, LLC Delaware River Basin CommissionDelaware Valley Green Building Council Delaware Valley Regional Planning Commission/Office of Ener-
gy and Climate Change InitiativesDorchester (MA) Environmental Health Coalition East Hampton (CT) Water and Sewer Commission Environmental Protection Agency (Regions 2and 3)Fairmount Park CommissionFarmington River Power Co.Fitchburg (MA) Public Works Department/Water Division Green Mountain Power Harvard University Graduate School of DesignHolyoke (MA) Gas and Electric Department Keene (NH) Public Works Department/Water DivisionL.S. Starrett Co. Massachusetts Department of Conservation and Recreation Massachusetts Department of Environmental Protection/Water, Waste-
water, and Wetlands Massachusetts Department of Fish and GameMassachusetts Executive Office of Energy and Environmental Affairs Massachusetts Water Resources Authority Metropolitan District of ConnecticutMetropolitan Waterfront AllianceMonson (MA) Water & Sewer Department Montgomery County (PA) Advisory Committee on Climate ChangeNational Association of Water CompaniesNational GridNational Park Service, Partnership Wild and Scenic Rivers/Farming-
ton River, CTNational Park Service, Partnership Wild and Scenic Rivers/West-
field River, MA
Natural Resources Defense CouncilThe Nature Conservancy New Britain (CT) Water Department New England Interstate Water Pollution Control Commission New Hampshire Department of Environmental Services New Hampshire Rivers Council New York City Department of Health and Mental HygieneNew York City Department of Environmental Protection/Bu-
reau of Water SupplyNew York City Department of Environmental Protection/Environmen-
tal Planning and AnalysisNew York City Department of Parks and RecreationNew York City Office of Long-Term Planning and SustainabilityNorth American Energy Alliance, LLC North Brookfield (MA) Water Department Palmer (MA) Water Department Pennsylvania Department of Conservation and Natural ResourcesPennsylvania Department of Environmental Protection/Cli-
mate Change Advisory CommitteePennsylvania Environmental CouncilPennsylvania Horticultural SocietyPhiladelphia City Planning CommissionPhiladelphia Department of Public Health/Air Management Ser-
vices DivisionPhiladelphia Department of Public Health/Environmental Health Ser-
vices DivisionPhiladelphia Department of StreetsPhiladelphia Energy Coordinating AgencyPhiladelphia Industrial Development CorporationPhiladelphia Mayor’s Office of SustainabilityPhiladelphia Municipal Energy OfficePhiladelphia Office of Emergency ManagementPhiladelphia Water DepartmentPhiladelphia Parks & RecreationRivers Alliance of ConnecticutSpringfield (MA) Water and Sewer Commission Stratford (CT) Department of Public Works/Water Pollution ControlTransCanadaTurners Falls Hydro, LLCUS Army Corps of EngineersUS Forest Service
University of ConnecticutVermont Agency of Natural ResourcesVermont Department of Environmental Conservation/River Manage-
ment SectionVermont Department of Environmental Conservation/Water Qual-
ity DivisionVermont Department of Fish and Wildlife Vermont Natural Resources Board Vermont Natural Resources Council WE ACT for Environmental JusticeWest Harlem Environmental Action GroupWestfield (MA) Water Resources Department Williamsburg (MA) Water and Sewer Commission Women’s Health and Environmental Network
Apr i l 2013 - May 2014 | 3
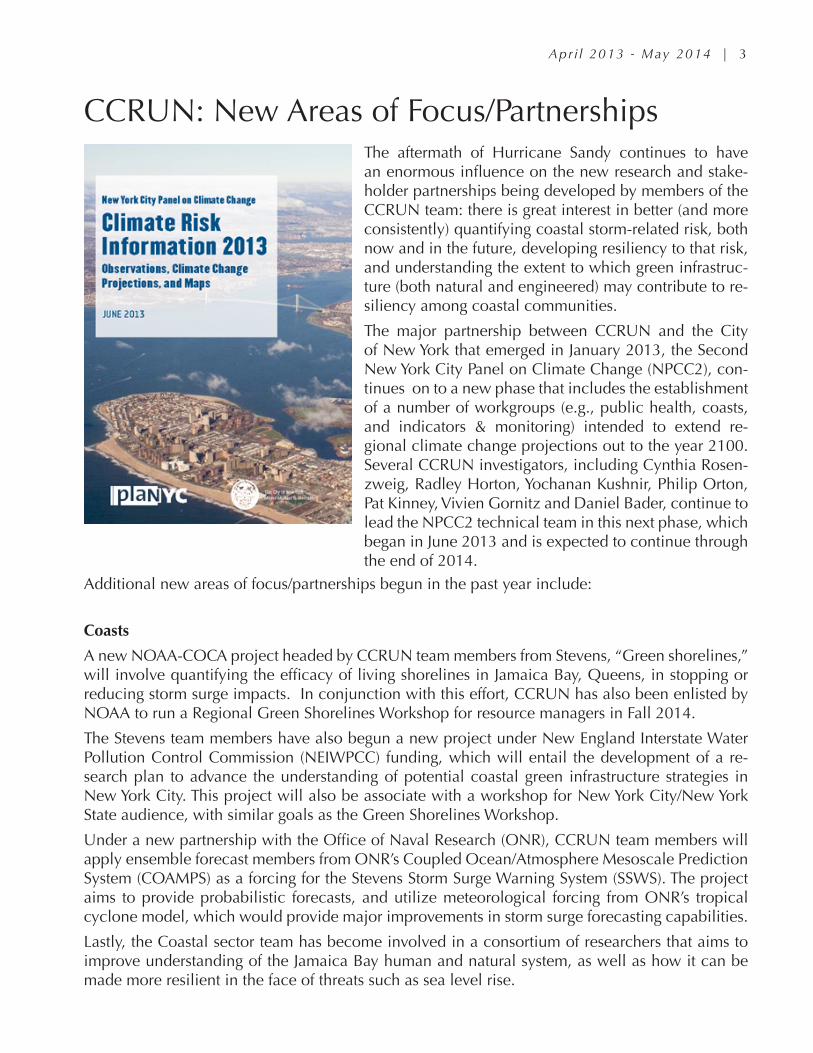
CCRUN: New Areas of Focus/PartnershipsThe aftermath of Hurricane Sandy continues to have an enormous influence on the new research and stake-holder partnerships being developed by members of the CCRUN team: there is great interest in better (and more consistently) quantifying coastal storm-related risk, both now and in the future, developing resiliency to that risk, and understanding the extent to which green infrastruc-ture (both natural and engineered) may contribute to re-siliency among coastal communities.
The major partnership between CCRUN and the City of New York that emerged in January 2013, the Second New York City Panel on Climate Change (NPCC2), con-tinues on to a new phase that includes the establishment of a number of workgroups (e.g., public health, coasts, and indicators & monitoring) intended to extend re-gional climate change projections out to the year 2100. Several CCRUN investigators, including Cynthia Rosen-zweig, Radley Horton, Yochanan Kushnir, Philip Orton, Pat Kinney, Vivien Gornitz and Daniel Bader, continue to lead the NPCC2 technical team in this next phase, which began in June 2013 and is expected to continue through the end of 2014.
Additional new areas of focus/partnerships begun in the past year include:
Coasts
A new NOAA-COCA project headed by CCRUN team members from Stevens, “Green shorelines,” will involve quantifying the efficacy of living shorelines in Jamaica Bay, Queens, in stopping or reducing storm surge impacts. In conjunction with this effort, CCRUN has also been enlisted by NOAA to run a Regional Green Shorelines Workshop for resource managers in Fall 2014.
The Stevens team members have also begun a new project under New England Interstate Water Pollution Control Commission (NEIWPCC) funding, which will entail the development of a re-search plan to advance the understanding of potential coastal green infrastructure strategies in New York City. This project will also be associate with a workshop for New York City/New York State audience, with similar goals as the Green Shorelines Workshop.
Under a new partnership with the Office of Naval Research (ONR), CCRUN team members will apply ensemble forecast members from ONR’s Coupled Ocean/Atmosphere Mesoscale Prediction System (COAMPS) as a forcing for the Stevens Storm Surge Warning System (SSWS). The project aims to provide probabilistic forecasts, and utilize meteorological forcing from ONR’s tropical cyclone model, which would provide major improvements in storm surge forecasting capabilities.
Lastly, the Coastal sector team has become involved in a consortium of researchers that aims to improve understanding of the Jamaica Bay human and natural system, as well as how it can be made more resilient in the face of threats such as sea level rise.
4 | CCRUN R e p o R t
Water
As part of a new project to develop a Water Utility Risk Index, the Water sector team members from UMass and the Columbia Water Center (CWC) are exploring opportunities for robust, no-regret, decision making for drought operations and planning in a practical framework relevant to utilities in the Northeast of the United States. A survey developed by the CWC to obtain information about water sources, capacity and demand of small, medium and large utilities in the Northeastern U.S. was distributed to a list of contacts from water utilities of different sizes, with assistance from stakeholders at the National Association of Water Companies (NAWC) and the Climate Change Resource Community of the American Water Works Association (AWWA).
In parallel to the survey’s distribution, a test case is being developed with information from the City of Newark (N.J.)’s water supply. A systems model is being built with reservoir and diversion data gathered from US Geological Survey, along with water use information coming from Newark’s water system annual reports. Once the model is finished, different climate scenarios will be tested to evaluate various system performance metrics (reliability, risk of prolonged droughts, etc.). This type of work will be extended to other parts of the Northeast, with local models created being fed to the VIRTUE on-line tool developed by CCRUN team members Casey Brown and Sarah What-eley from UMass. This tool enables water utilities to explore problematic future climate conditions using a stress test that requires minimum input from the operators.
In addition, several new initiatives and/or partnerships have been recently launched:
• An exploration of water allocations and potential water trades between Rockland County, New York and Newark, New Jersey
• The development of reservoir optimization models for northern New Jersey that include varying demand and climate inputs
• A model of the Hartford water supply system (with the Metropolitan District Commission)
• A climate risk assessment of large water supply systems in New England and New York City
• Development of a Spring hydrological forecast for the Northeastern U.S.
• Study of the contribution of climate uncertainties (i.e., internal variability and mean chang-es in temperature and precipitation) on water supply performance
• A project with The Nature Conservancy for developing methodologies and completing an ecological assessment of the Hudson River watershed (led by CCRUN team member Malanding Jaiteh of CIESIN)
Public Health
CCRUN team member Pat Kinney (CU MPH) is working with collaborators from the International Research Institute for Climate and Society (IRI) and Columbia University President Lee Bollinger’s office to plan a public health event around the date of the United Nations Climate Summit (Sep-tember 23, 2014), concurrent with the U.N. General Assembly and NY Climate Week.
CCRUN team member Rouzbeh Nazari (CCNY) has begun a collaboration with the New York University Center for Urban Science and Progress (CUSP), a new center which is spinning up op-erations. His projects will focus on thermal imaging of buildings to locate heat transfer patterns, and traffic congestion influence on air quality.
Apr i l 2013 - May 2014 | 5
Fellow CCNYer Mark Arend was an invited panel member at the April 2013 American Association for Geographers Annual meeting, in a session highlighting an NAS report to which he had contributed, titled “Urban Meteorology: Forecasting, Monitoring, and Meeting Users’ Needs.” This panel session, cosponsored by the National Academies of Science and the American Meteorology Society, has in-spired new areas of focus on urban ecosystem resiliency under stresses of extreme events (e.g., extreme wind events as experienced during Hurricane Sandy as well as extreme heat events).
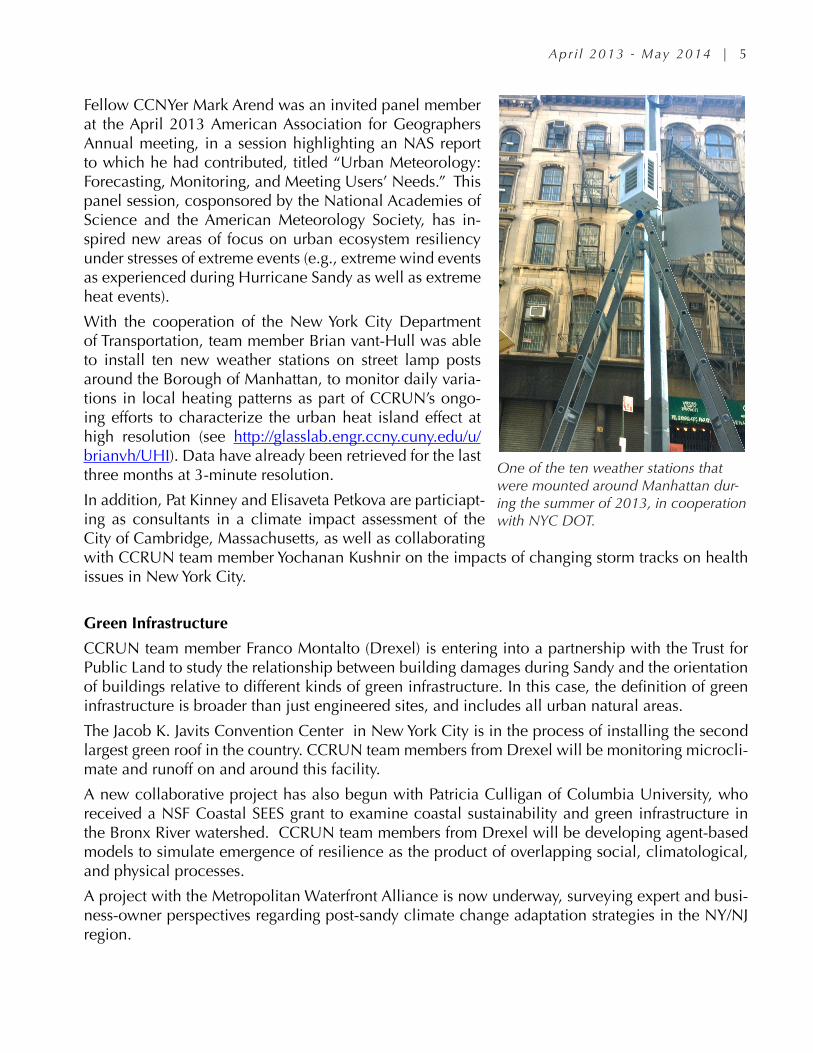
With the cooperation of the New York City Department of Transportation, team member Brian vant-Hull was able to install ten new weather stations on street lamp posts around the Borough of Manhattan, to monitor daily varia-tions in local heating patterns as part of CCRUN’s ongo-ing efforts to characterize the urban heat island effect at high resolution (see http://glasslab.engr.ccny.cuny.edu/u/brianvh/UHI). Data have already been retrieved for the last three months at 3-minute resolution.
In addition, Pat Kinney and Elisaveta Petkova are particiapt-ing as consultants in a climate impact assessment of the City of Cambridge, Massachusetts, as well as collaborating with CCRUN team member Yochanan Kushnir on the impacts of changing storm tracks on health issues in New York City.
Green Infrastructure
CCRUN team member Franco Montalto (Drexel) is entering into a partnership with the Trust for Public Land to study the relationship between building damages during Sandy and the orientation of buildings relative to different kinds of green infrastructure. In this case, the definition of green infrastructure is broader than just engineered sites, and includes all urban natural areas.
The Jacob K. Javits Convention Center in New York City is in the process of installing the second largest green roof in the country. CCRUN team members from Drexel will be monitoring microcli-mate and runoff on and around this facility.
A new collaborative project has also begun with Patricia Culligan of Columbia University, who received a NSF Coastal SEES grant to examine coastal sustainability and green infrastructure in the Bronx River watershed. CCRUN team members from Drexel will be developing agent-based models to simulate emergence of resilience as the product of overlapping social, climatological, and physical processes.
A project with the Metropolitan Waterfront Alliance is now underway, surveying expert and busi-ness-owner perspectives regarding post-sandy climate change adaptation strategies in the NY/NJ region.
One of the ten weather stations that were mounted around Manhattan dur-ing the summer of 2013, in cooperation with NYC DOT.
6 | CCRUN R e p o R t
Climate
With supplementary funding supplied by NASA’s Interdisciplinary Research Science program, the Climate team’s Yochanan Kushnir and Donna Lee have embarked on a study of the vulnerability of the Northeastern U.S. to extratropical, cold-season storms. This project also brings in the exper-tise of other CCRUN team members, including Philip Orton (using modeling and analysis tools to study coastal flooding due to storm surges); Susana Adamo (study of human and infrastructure vulnerability to these storms using census and remote sensing data); and Malgosia Madajewicz, with CCRUN affiliate Mingfang Ting (study of human response to, and awareness of, the coastal cold-season storm hazard). Additional CCRUN affiliates Tim Hall (NASA/GISS) (stochastic storm generator for enhanced statistical analysis of the storm hazard) and Ray Sambrotto (LDEO) and Sherwin Ladner (ONR) (study of ecosystem vulnerability to coastal storm impacts through remote sensing) will also participate.
In addition, CCRUN team members Radley Horton and Dan Bader have begun developing a new, cutting-edge sea level rise projection method for application along the Northeastern U.S. coast-line, as well as begun downscaling the latest climate modeling results for a variety of applications, including heat impacts on human health.
Evaluation and Vulnerability
CCRUN’s Malgosia Madajewicz has embarked on a new partnership with the Trust for Public Land (TPL), a not-for-profit entity that focuses on the conservation of green space to be used as parks, gardens, natural areas, and open space. This work will examine how green infrastructure influ-ences the resilience of urban areas to coastal storms, with one possible goal being the creation of a web tool that would enable the user to map social vulnerability for the purpose of choosing sites for green infrastructure.
Research Findings
Our most significant research findings in the past year include the following:
Coasts: In an observation-based assessment of the Boston coastal flood hazard, we have found that sea level rise could increase the frequency of extreme coastal flooding events significantly. Under a middle-range sea level rise scenario, the present-day 100-year flood elevation will become a 7.5-year event in the 2050s.
Water: Multi-model ensembles of GCM projections of temperature and precipitation for 2050 (i.e. ensembles of CMIP3 A1B and CMIP5 RCP4.5 projections) suggest that large water supply systems in the Northeast are not vulnerable to demand shortages in the future.
Public Health: Future projections of heat-related mortality in Boston, New York and Phila-delphia reveal that in the 2020s, 2050s and 2080s mortality were highest in New York City followed by Philadelphia and Boston. During the baseline period between 1985 and 2006, heat-related mortality rates per 100,000 were highest in Philadelphia followed by New York City and Boston.
Green Infrastructure: A study of GI infiltration, ponding and overflow in NYC during extreme events that occurred between 2011 and 2013 found that the GI sites studied (with a hydraulic
Apr i l 2013 - May 2014 | 7
loading ratio of up to 15:1) were able to capture and infiltrate 40-47% of incident rainfall and tributary catchment runoff during all events studied, including Sandy and Hurricane Irene. The results suggest that GI can provide important adaptation service. Infiltration during extreme events seems to have an ephemeral effect on soil moisture, and a negligible effect on local groundwater levels. To the extent that it too influences inlet hydraulic efficiency, maintenance regime is critical to GI performance.
Vulnerability: Data from ongoing interviews suggest that small volunteer groups were much more active in addressing relief, recovery, and rebuilding needs in the aftermath of Sandy than were larger, formal institutions and that these small volunteer groups were considerably more effective. The evidence has implications for the design of preparedness and relief and recovery efforts for future storms.
For additional research findings by the CCRUN team, please see Appendix A.
Accomplishments
Our most significant accomplishments in the past year include the following:
Coasts: We performed a coastal flood hazard assessment and flood zone mapping study for New York City (NYC) and Northern New Jersey, including storm tides and sea level rise (SLR). We utilized the same models and methods currently being used by FEMA in their Region 2 flood hazard assessment but included increases in mean sea level representing new 90th-percentile projections of SLR from the NYC Panel on Climate Change for the 2020s, 2050s and 2080s.
Water: ViRTUE, a web-based climate risk assessment tool for small water utilities, is available online with a demo version that anyone can test.
Public Health: We developed a heat vulnerability index for New York City in collaboration with Tom Matte and Kaz Ito from the NYC Department of Health.
Green Infrastructure: A study that contrasts the expert and general public perspectives on rebuilding after Sandy found that experts and residents agreed on the greatest climate change threats to the NYC region over the next 25 years:
• Increased frequency of “extreme” climate events, e.g., hurricanes, drought, heat waves
• Coastal flooding and storm surge
• Sea level rise
The same study also revealed that experts and residents do not agree on which resiliency strategies will best protect the people, property, and ecology of NYC over the next 25 years. Residents chose “promote renewable energy” as the best strategy while experts chose “develop new guidelines for shoreline reconstruction through the region; new GI criteria.”
Vulnerability: We have prepared preliminary maps that show predicted flooding in two coastal Boston neighborhoods that the City of Boston has asked us to focus on for 10-year, 100-year, and 500-year floods. The analyses show how the return periods of these floods change with median and high predictions of sea level rise for the 2020s, 2050s, and 2080s.
For additional accomplishments by the CCRUN team, please see Appendix B.
8 | CCRUN R e p o R t
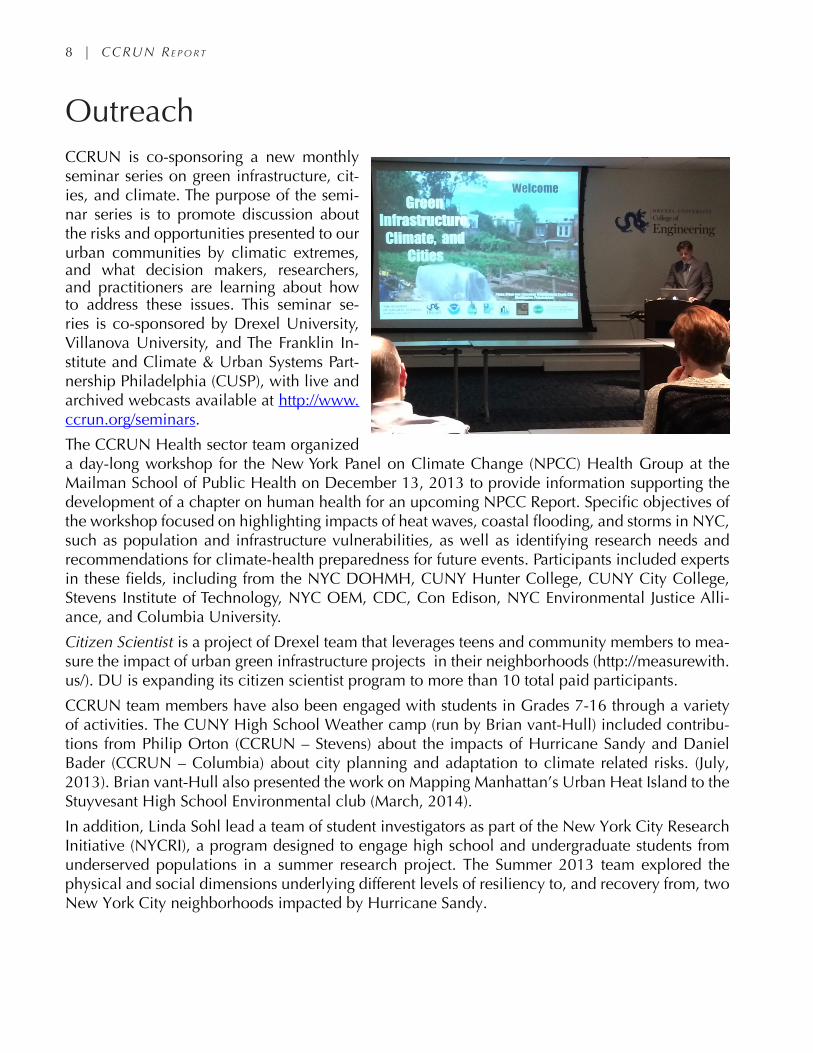
OutreachCCRUN is co-sponsoring a new monthly seminar series on green infrastructure, cit-ies, and climate. The purpose of the semi-nar series is to promote discussion about the risks and opportunities presented to our urban communities by climatic extremes, and what decision makers, researchers, and practitioners are learning about how to address these issues. This seminar se-ries is co-sponsored by Drexel University, Villanova University, and The Franklin In-stitute and Climate & Urban Systems Part-nership Philadelphia (CUSP), with live and archived webcasts available at http://www.ccrun.org/seminars.
The CCRUN Health sector team organized a day-long workshop for the New York Panel on Climate Change (NPCC) Health Group at the Mailman School of Public Health on December 13, 2013 to provide information supporting the development of a chapter on human health for an upcoming NPCC Report. Specific objectives of the workshop focused on highlighting impacts of heat waves, coastal flooding, and storms in NYC, such as population and infrastructure vulnerabilities, as well as identifying research needs and recommendations for climate-health preparedness for future events. Participants included experts in these fields, including from the NYC DOHMH, CUNY Hunter College, CUNY City College, Stevens Institute of Technology, NYC OEM, CDC, Con Edison, NYC Environmental Justice Alli-ance, and Columbia University.
Citizen Scientist is a project of Drexel team that leverages teens and community members to mea-sure the impact of urban green infrastructure projects in their neighborhoods (http://measurewith.us/). DU is expanding its citizen scientist program to more than 10 total paid participants.
CCRUN team members have also been engaged with students in Grades 7-16 through a variety of activities. The CUNY High School Weather camp (run by Brian vant-Hull) included contribu-tions from Philip Orton (CCRUN – Stevens) about the impacts of Hurricane Sandy and Daniel Bader (CCRUN – Columbia) about city planning and adaptation to climate related risks. (July, 2013). Brian vant-Hull also presented the work on Mapping Manhattan’s Urban Heat Island to the Stuyvesant High School Environmental club (March, 2014).
In addition, Linda Sohl lead a team of student investigators as part of the New York City Research Initiative (NYCRI), a program designed to engage high school and undergraduate students from underserved populations in a summer research project. The Summer 2013 team explored the physical and social dimensions underlying different levels of resiliency to, and recovery from, two New York City neighborhoods impacted by Hurricane Sandy.
Apr i l 2013 - May 2014 | 9
Publications and ReportsAhmed, K.F., G. Wang, J. Silander, A.M. Wilson, J.M. Allen, R. Horton, and R. Anyah, 2013. Statis-
tical downscaling and bias correction of climate model outputs for climate change impact assessment in the U.S. northeast. Glob. Planet. Change, 100, 320-332, doi:10.1016/j.glop-lacha.2012.11.003.
Arend, M., Gutiérrez, E., Moshary, F., Bornstein, R., Khanbilvardi, R., Karimi, M., Vant Hull, B., Gonzalez, J., “Monitoring and Modeling Urban Climates to Better Understand Climate Risks”, 2013 AAG Annual Meeting, Los Angeles, California.
Barsugli, J. J., Guentchev, G., Horton, R. M., Wood, A., Mearns, L. O., Liang, X. Z., ... & Ammann, C., 2013. The Practitioner’s Dilemma: How to assess the credibility of downscaled climate projections. Eos, Transactions American Geophysical Union, 94(46), 424-425.
Gornitz, V., 2013. Rising Seas: Past, Present, and Future. New York: Columbia University Press.
Horton, R., G. Yohe, W. Easterling, R. Kates, M. Ruth, E. Sussman, A. Whelchel, D. Wolfe, and F. Lipschultz, 2014: Ch. 16: Northeast. In Climate Change Impacts in the United States: The Third National Climate Assessment, J. M. Melillo, Terese (T.C.) Richmond, and G. W. Yohe, Eds., U.S. Global Change Research Program, 16-1–16-nn.
Kenney, M.A., A.C. Janetos, et al. 2014. Pilot National Climate Indicators System Proposal. 16 February 2014. http://downloads.globalchange.gov/nca/NCADAC/Feb14_Indicators_Pro-posal_Approved.pdf.
Li, T., Horton, R.M., and Kinney, P.L., 2013. Projections of seasonal patterns in temperature-related deaths for Manhattan, New York. Nature Climate Change. Published online: 19 May 2013. DOI: 10.1038/NCLIMATE1902.
Mason, E., and Montalto, F., 2014. The overlooked role of New York City urban yards in mitigating and adapting to climate change. Local Environment, http://dx.doi.org/10.1080/13549839.2014.907249.
Meir, T., Orton, P., Pullen, J, Holt, T., Thompson, W., Arend, M., 2013 in press. Forecasting the New York City urban heat island and sea breeze during extreme heat events, Weather and Forecasting. DOI: 10.1175/WAF-D-13-00012.1.
Miller, S., Kidd, G., Montalto, F., Gurian, P., Worrall, C., and Lewis, R., 2014 accepted. Contrasting perspectives regarding climate risks and adaptation strategies in the New York Metropolitan Area after Superstorm Sandy, Journal of Extreme Events.
New York City Panel on Climate Change. Climate Risk Information 2013: Observations, Climate Change Projections, and Maps, June 2013. PlaNYC NYC Mayor’s Office of Long-Term Planning and Sustainability.
Orton, P. New York Times Room for Debate op-ed, “Prepare for Floods and Prevent Them,” Sep-tember 2, 2013.
Orton, P., S. Vinogradov, N. Georgas, and A. Blumberg, 2013. Hydrodynamic Mapping of Future Coastal Flood Hazards for New York City, 27 pp, Final report prepared for New York City Office of Emergency Management.
10 | CCRUN R e p o R t
Orff, K., K. Wirth, P. Orton, and et al., 2013. The Shallows: Bay Landscapes as Ecological Infra-structure, 69 pp, Housing and Urban Development, Rebuild By Design.
Petkova, E.P., Jack, D.W., Volavka-Close, N.H., and Kinney, P.L., 2013. Particulate matter pollution in African cities. Air Quality, Atmosphere and Health. DOI: 10.1007/s11869-013-0199-6.
Petkova, E. P., Horton, R. M., Bader, D. A., & Kinney, P. L., 2013. Projected Heat-Related Mortal-ity in the US Urban Northeast. Intl J. Environ. Res. and Public Health, 10(12), 6734-6747.
Petkova, E. P., Morita, H., & Kinney, P. L., 2014. Health Impacts of Heat in a Changing Climate: How Can Emerging Science Inform Urban Adaptation Planning?. Current Epidemiology Reports, 1-8.
Petkova, E., Gasparrini, A., Kinney, P.L., 2014. Analyze historic heat-related mortality in New York City since the beginning of the 20th century. Epidemiology, In Press.
Rao, S., Pachauri, P., Dentener, F., Kinney, P., Klimont, Z., Riahi, K., and Schoepp, W., 2013. Bet-ter air for better health: forging synergies in policies for energy access, climate change and air pollution. Global Environmental Change 23(5):1122-1130. DOI: 10.1016/j.gloen-vcha.2013.05.003.
Snyder, S., Hoffstadt, R. M., Allen, L. B., Crowley, K., Bader, D. A., & Horton, R. M., 2014. City-wide collaborations for urban climate education. Future Earth: Advancing Civic Under-standing of the Anthropocene, 203, 103.
Talke, S.A., Orton, P., Jay, D.A., 2014. Increasing storm tides in New York Harbor, 1844-2013. Geophysical Research Letters, 41, DOI: 10.1002/2014GL059574.
Vant-Hull, B., M. Karimi, A. Sossa, J. Wisanto, R. Nazari, R. Khanbilvardi, 2014 accepted. Fine Structure in Manhattan’s Daytime Urban Heat Island: a New Dataset. J. Urban Env. Eng.
Project MetricsPlans, policies, strategies, tools, agreements that have been proposed, adopted and/or imple-mented as a result of CCRUN’s activities:
Several CCRUN team members played key roles on the Second New York City Panel on Climate Change (NPCC2) in providing the technical information that was the basis for New York City’s Spe-cial Initiative for Rebuilding and Resiliency (SIRR). This report, released in June 2013 in conjunc-tion with the NPCC2’s report, Climate Risk Information 2013, outlines tasks that include:
• Analyzing the impacts of Hurricane Sandy on buildings, infrastructure, and the public.
• Assessing the medium-term and long-term risks that climate change presents to NYC.
• Creating strategies to increase climate resilience.
• Developing proposals for rebuilding the areas most damaged by Hurricane Sandy.
To date, the City of New York has identified funding sources for approximately 75% of the $20 bil-lion needed for the implementation of this plan, including city, state and grants. These funds will supplement over 250 initiatives towards climate adaptation.
Related to this work, CCRUN is updating ClimAID projections for New York State Commissions
Apr i l 2013 - May 2014 | 11
convened by Governor Cuomo, and NYSERDA. Coordination efforts are also underway to link federal coastal mapping with local sea level rise information, as was done for the creation of the New York Metro Area sea level rise mapping tool developed with NOAA.
VISTADATA is the data management system CCRUN Drexel team uses for storing data from our monitored network of green infrastructure (GI) sites, so we can evaluate the performance of GI under severe climatic conditions. We are particularly interested in find out if the GI sites are able to manage runoff generated during extreme precipitation events and if these sites can help to mitigate heat island effects. It is important to note that this tool allows real-time data visualiza-tion and it is open to our stakeholders and to the public in general (http://vistadv.cae.drexel.edu/vdv/index.html).
LIDRA is a tool the CCRUN Drexel team developed for comparing the cost effectiveness of re-ducing runoff with different green infrastructure / low impact development technologies. Our stakeholders and users in general can run LIDRA simulations for free through this website (http://www.lidratool.net/). Over the past year, stakeholders used LIDRA in Bethlehem, PA and New-burgh, NY. LIDRA capabilities were presented at the LID workshop in Houston, Texas.
The CCRUN CIESIN team members are developing a critical infrastructure database for South Boston and Fort Point, the two neighborhoods studied in the NOAA COCA project with Malgo-sia Madajewicz. There will be more than 20 data sets included in the database, organized by transportation infrastructure, food, health, landuse, and building footprints.
The CCRUN CIESIN team members have also developed a web mapping application for the NOAA COCA project with Malgosia Madajewicz. The web map tool allows decision makers to visualize the flood impacts of present day 10 year, 100 year and 500 year flood return periods, produced by Philip Orton’s team at Steven Institute of Technology, on the critical infrastructure created by CIESIN. (http://beta.www.ciesin.columbia.edu/fib/)
CCRUN UMass team members have developed STATS (Screening Tool Assessment of Turbidity and Supply) on behalf of the New York City Water Supply System, and are currently developing two datasets for this stakeholder: one on the potential effects of climate change on turbidity in Ashokan Reservoir in Ulster County, New York, and one on stochastic weather sequences result-ing in simulated shortfalls or alum use.
Together with CCRUN team members at the Columbia Water Center, UMass team members have also developed ViRTUE: the Vulnerability and Risk Assessment Tool for Water Utilities. ViR-TUE is currently in testing with the City of Newark, New Jersey.
Several CCRUN team members have made key contributions to the HUD Rebuild By Design competition. Drs. Orton and Blumberg were on winning team and a finalist team, respectively, designing coastal flood adaptation strategies. Orton’s team was the “SCAPE team” of several in-stitutions led by SCAPE design, and New York State is being awarded $60 million to build out the project off Staten Island – Living, Growing Breakwaters. Dr. Montalto is also on one of the winning HUD-funded Rebuilding by Design teams (Penn/Olin team), focusing on strategies for building resilience in coastal areas that could be vacated after extreme coastal flooding events.
The New York City Department of Health has implemented an asthma warning system as a re-sult of work done by Columbia PhD candidate, Kate Weinberger. In 2014 Advisory #9, the NYC Health Department reminds providers that rising spring tree pollen concentrations can exac-erbate asthma in sensitive patients. See https://a816-health29ssl.nyc.gov/sites/NYCHAN/Lists/AlertUpdateAdvisoryDocuments/SprpollenalertHAN_2014_for%20clearanceb.pdf
12 | CCRUN R e p o R t
Graduate students and postdoctoral researchers supported by RISA funding (in whole or in part): Current- Maria Raquel Catalano de Sousa (PhD student, Drexel University)- Leslie DeCristofaro (PhD student, University of Massachusetts-Amherst)- Maryam Karimi (PhD student, City College of New York)- Kate Weinberger (PhD student, Columbia University)
Past- Naresh Devineni (Post-Doctoral Research Scientist, Columbia University)- Jaime Madrigano (Post-Doctoral Research Scientist, Columbia University)- Elisaveta Petkova (PhD, Columbia University)- Nicholas Rossi (MA, University of Massachusetts-Amherst)- Brian vant-Hull (Post-Doctoral Research Scientist, City College of New York)
Links to Other NOAA ProgramsNational Weather Service Northeast River Forecast Center: This NOAA entity is engaged in CC-RUN PI Casey Brown’s NOAA-SARP-funded project, “Collaborative Development of Climate In-formation for the Connecticut River Basin using Shared Vision Forecasting,” which seeks to pro-mote the adoption of forecasting techniques. The NWS NRFC interacts regularly with PI Brown, with the goal of establishing a climate knowledge network and an information baseline of the current use of climate information and forecasting in water management decision-making.
National Marine Fisheries Service, NE Fisheries Science Center: This NOAA entity is involved in the CCRUN project, “Analyzing history to project and manage the future: Simulating the ef-fects of climate on Long Island Sound’s physical environment and living marine resources,” led by CCRUN team members Nickitas Georgas, Philip Orton and Alan Blumberg and funded by the NY and CT Sea Grant offices.
Apr i l 2013 - May 2014 | 13
Appendix A - Additional Research FindingsCoasts
CCRUN team member Philip Orton worked with collaborators at Portland State University to reco-vere and analyze storm tide data back to 1844 for New York Harbor, and together showed that the 10-year storm-tide for New York Harbor has increased by 0.28m. Combined with a 0.44m in-crease in local sea-level since 1856, the 10-year flood-level has increased by approximately 0.72 ± 0.25m, and magnified the annual probability of overtopping the typical Manhattan seawall from less than 1% to about 20-25% (Talke et al., 2014).
Superposition and bathtubbing are often utilized to re-draw coastal flood zones with added sea level rise, assuming that sea level rise can simply be added on top of a flood elevation, and that these flood elevations do not decrease with distance inland over a floodplain. We compared superposition/bathtubbing to hydrodynamic modeling for NYC, with two major conclusions: (1) for extra-tropical storm tides, both methods give similar results, and (2) for tropical cyclones, they more frequently give differing results and superposition/bathtubbing is not always a conservative (i.e. risk-averse) estimation method for mapping future flood zones and heights.
We studied and modeled the Hurricane of 1821 storm tide, thought to have been similar to Hurri-cane Sandy’s storm tide. Our tentative conclusion is that the storm tide peaked at low tide and only caused a total water elevation of ~3.1 m (above MSL1821). Therefore, Sandy caused flooding in Northern New Jersey and New York City (NYC) that exceeded any levels in tide gauge records and also exceeded estimated flood levels from hurricanes in three prior centuries.
Modeling Hurricane Sandy’s storm tide in the NY/NJ region, an experiment omitting remote forc-ing and the steric sea level contribution in model runs leads to an average decrease of 33% in peak elevation. We also show that meteorological forecasts varied substantially with Sandy, and this is shown to have also had a major impact on storm surge forecast accuracy.
Engineering wetland islands that cover a large proportion of Jamaica Bay only has a very small ef-fect in reducing storm tides. However, adding channel shallowing and wetlands reduces storm tides dramatically, by ~25%.
We simulated Sandy’s storm surge if it were to have arrived at high tide in Long Island Sound. The actual Sandy flood height at Kings Point was 14.37 ft MLLW. This led to a water elevation of 17.59 ft MLLW. The record at Willet’s Point, near Kings Point (they switched locations) is from the 1938 Long Island Express hurricane, when the water level hit 16.77 ft. So, Sandy would have set the record if the storm had come earlier and coincided with high tide in Western LIS / Eastern East River.
Water
Engaging utilities to participate in surveys regarding climate change adaptation and risk mitiga-tion has been a challenge. We will continue to follow up on survey results, but a change of strat-egy has to take place by including more water system test analysis, as in the City of New-ark (N.J.), so that utilities can more readily envision the benefits. We will also promote the avail-ability of our soon-to-be-launched VIRTUE online tool, created by Casey Brown and Sarah What-eley, in water conferences across the Northeast, and in some instances by meeting small utili-ties case by case.
14 | CCRUN R e p o R t
In the case of the City of Newark, a change in water management strategy may lead to funding of needed water infrastructure projects. The potential for such improvements is still under study but there may be an improvement opportunity.
Results from an optimization model designed to create maximum ecological benefits (in the form of natural/ecological flows in Connecticut River tributaries) while maintaining flood protection can be used to advise operations under conditions of climate change by providing monthly cli-mate- and streamflow-varying upper and lower limits on reservoir releases.
Linked stochastic weather generator, hydrology model, and operations model allow for easy test-ing of a wide range of climate change scenarios for New York City’s water supply system.
Climate vulnerability modeling of the New York City water supply system indicates that standard water supply measures (eg. reliability) and violations of stakeholder defined quality thresholds are sensitive to changes in climate.
Modeled turbidity concentrations in the east and west basins of New York City’s Ashokan reservoir show patterns of increasing turbidity with increasing precipitation under conditions of climate change.
Many of the larger water supply systems in the Northeast US (Boston, MA, Hartford, CT, Spring-field, MA, and Providence, RI) are more vulnerable to mean changes in precipitation than mean changes in temperature.
Springfield, MA’s water supply system (the most vulnerable of the ones explored thus far) fails to meet a 95% reliability threshold (i.e. meet water supply demands 95% of the time) when mean precipitation drops below 6%.
An analysis of variance (ANOVA) showed that internal variability in the climate influences water supply reliability most early on (2010-2030) and mean changes in precipitation dominate toward the end of the record (2050).
Based on the current state of the Northeast as of March 20, 2014, our hydrologic outlook indicated that flows in April may be similar to the historic average, varying only slightly across some of the major river basins throughout the region (Connecticut River, Delaware River, Susquehanna River, and Pawtuxet River).
Newark, NJ’s population has decreased by 31% in the past 5 decades and its water supply in-creased by 10% in the same period. Rockland County, NY’s population has increased by 127% new water sources are needed to satisfy the increase in demand (7.5 MGD). Newark therefore has a water surplus of more than 16 MGD and has the potential to divert the water excess to satisfy Rockland’s demand.
The consultant Malcolm Pirmine Arcadis issued a report in 2013 indicating that Newark, NJ’s wa-ter infrastructure needs an investment of $177 million in the next 6 years and water rates will have to increase 6% yearly until 2019. Selling water to Rockland County, NY could be a way to reduce the rate increases and thus the burden on the population.
Health
We find that locations in New York City that are warmer or cooler than average during the day tend to switch sign at night, though the deviations become smaller. This is likely due to heat capac-ity influencing heating/cooling rates.
Apr i l 2013 - May 2014 | 15
Future warming in NYC could lead to increasing health risks in months such as May and Sep-tember that have not traditionally been associated with heat extremes.
Historical analysis shows that the exposure-response function linking heat to mortali-ty in NYC gradually diminished over the 20th century.
Similar responses to heat extremes are seen across Boston, NYC, and Philadelphia in spite of dif-ferences in climate and heat/health response systems.
We analyzed historic heat-related mortality in New York City since the beginning of the 20th cen-tury, and find that heat-related mortality has been declining over the course of the century (Petkova et al., 2014 in press).
We created a composite vulnerability index comprised of neighborhood characteristics that were statistically significant modifiers of the association between heat waves and mortality: (+) propor-tion of homes receiving public assistance, (+) proportion of African-American residents, (+) pro-portion of overall deaths occurring in the home, (+) relative surface temperature, (-) proportion of trees.
Landcover effects on local temperature can reverse sign depending on whether a site is in the sun or in shadow. For example, taller buildings will lower temperature by providing more shade to some sites, while increasing temperature by reflecting more light into others. The effects of albedo also changes sign. For this reason the exact sun and surface geometry can be critical for estimat-ing temperature effects.
Green Infrastructure
An analysis of monitoring data collected in and around a 125 m2 bioretention Greenstreet locat-ed in Queens, NYC revealed that:
• During the most extreme climatic events occurring from April 2012-Au-gust 2013, this green infrastructure site was able to infiltrate the 100% of rainfall and runoff di-rected towards it. • At this site, infiltration seems to have an ephemeral and short term effect on soil mois-ture, and negligible effect on the elevation of the groundwater table.• Inlet and upgradient catchbasin clogging can significantly, and in unexpected ways, al-ter flow into the facility through its curb cut.• Maintenance is thus critical in our ability to predict green infrastructure performance.
A field experiment investigating interception loss by shrubs (Itea and Cornus) common-ly used in green infrastructure facilities indicates that stand alone exemplars of both of these spe-cies can intercept more than 10% of incident event precipitation. There is a significant differ-ence in the rainfall partitioning ability of different species, even if they are of similar size, like-ly a consequence of differences in leaf area index (LAI).
Species selection is a key factor to GI performance under climate change. An experiment con-ducted during 2013 growing season found that two species currently specified in NYC’s GI (Carex lurida and Liriope muscari) are significantly resistant to consecutive periods of droughts, floods and high temperatures (>30˚C).
16 | CCRUN R e p o R t
A study about evapotranspiration around green-infrastructure sites installed in NYC found that:
• Runoff routing dictates ability to fulfill evapotranspiration (ET) capacity. Urban green spac-es receiving runoff evapotranspire at median 2 to 3 times more than those not receiving runoff. Findings also support that vegetation selection is important in regulating ET.
• Urban microclimate conditions drives evaporative capacity from urban green spaces: refer-ence crop evapotranspiration rates as determined at a daily time-step are statistically signifi-cantly differences across sites in an urban area.
A field experiment about rainfall interception by common species installed in GI found:
• Shrub canopies intercept 12-48% of incident rainfall when compared to adjacent reference sites
• Shrub interception quantities vary by species, and appear to be related to canopy allometry
• Evaporation alone cannot account for all of the intercepted rainfall; drop-splash evapora-tion and/or displacement is suspected
Climate
Sea level rise in the Northeast is projected to accelerate, and exceed the global average.
• Higher sea levels are virtually certain by late 21st-century. Sea levels in New York City by the 2080s are projected to rise 18-39 inches (mid-range estimates 25th-75th percentile), and 58 inches (high estimate; 90th percentile).
• By the 2080s, coastal flooding is very likely to increase in frequency, extent, and height as a result of increased sea levels.
• The annual chance of today’s 100-year flood (one with a 1 % probability of occurrence per year) could increase to 2.4-7.1 percent (25th-75th percentile), up to 18.5 percent (90th percentile) by the 2080s.
• By the 2080s, flood heights of the 100-year storm could increase from 12.3-14.0 feet (25th-75th percentile), up to 15.6 feet (90th percentile), relative to the present baseline of 10.8 feet.
• By the 2080s, the areas flooded by today’s 100-yr storm plus sea level rise would cover significant portions of New York City: parts of Brooklyn, including Coney Island, Sheepshead Bay; Queens including the Rockaways, Jamaica Bay; and low-lying portions of Staten Island.
In general, the high-end temperature and precipitation projections are a little higher for the end of the century in our current climate risk assessment than in our projections using the prior genera-tion of climate models and greenhouse gas emissions scenarios.
By using two “trackers” and different weather re-analyses we found that process of storm track-ing that is based on using 6-hourly sea level pressure maps, is more sensitive to the detection and tracking algorithm than to the data set uses.
The analysis of storm tracking proceeded to study the reliability of the data by comparison to storm surge events and data based on tide gauge data from coastal New York, New Jersey, and Connecti-cut. Preliminary results suggests that storms that cause peak surges in the New York Battery can be divided into tow families: Nor’easters that track along the Atlantic Coast from Florida and to a lesser extent to storms that originate in the Great Lakes region and move eastward to wards the
Apr i l 2013 - May 2014 | 17
coast. Both types of storms can generate strong southeasterly and southerly winds in the region.
We are studying the characteristics of strong wind events in the NOAA Northeast US region, by collecting the history of a daily variable referred to as sustained wind maximum (MAX, defined as the peak daily wind observation that lasts at least one hour) in 54 stations from NOAA’s Inte-grated Surface Database (ISD). Focusing on wintertime extreme winds connected with extratropi-cal storms, the study had two aims: assess the return period of winds stronger than 18 m/s (the National Weather Service threshold for declaring a wind watch or warning) and how this threshold criterion relates to the typical weather patterns, in particular the leading cyclone track history. We find that return periods can best be assessed by first separating from the record only the high wind events (~12 m/s), because the pdf of wind speeds is highly non-Gaussian. Once this is done we tabulated and mapped the 1, 3 and 5-year return period extreme wind values in the study region finding that the strong winds tend to occur along the Atlantic Coast and near the great lakes, while weaker winds dominate the middle, in-land region. Surprisingly, the type of storms that pose the bigger wind threat to the Northeast, based on intensity and spatial extent, are not Nor’easters but storms that originate over land in the Southeast and move over land into Ohio, Illinois, Michigan, Pennsylvania, New York and Eastern Canada.
Vulnerability
The comparison of three different social vulnerability indices for New York City and Boston sug-gests that social vulnerability indices may provide more policy-relevant information about social vulnerability when the study uses multiple approaches to calculating the index and illustrates similarities as well as reasons why the indices tell a different story for some locations.
18 | CCRUN R e p o R t
Appendix B - Additional Accomplishments Coasts
As a product of work completed in support of the Second New York City Panel on Climate Change, we report the following:
• Higher sea levels are extremely likely by mid-century. Sea levels in New York City by the 2050s are projected to rise 11 to 24 inches (mid-range estimates 25th-75th percentile), and 31 inches (high estimate; 90 percentile).
• By the 2050s, coastal flooding is very likely to increase in frequency, extent, and height as a result of increased sea levels.
• The annual chance of today’s 100-year flood (one with a 1 % probability of occurrence per year) could increase to 1.7-3.2 percent (25th-75th percentile), up to 5.0 percent (90th per-centile) by the 2050s.
• By the 2050s, flood heights of the 100-year storm may increase from 15.9 to 17 feet (25th-75th percentile), up to 17.6 feet (90th percentile), relative to the 1971-2000 baseline of 15.0 feet.
• By the 2050s, the areas flooded by the 100-yr storm, with sea level rise would cover signifi-cant portions of Brooklyn, including Coney Island, Sheepshead Bay, Queens including the Rockaways, Jamaica Bay, and low-lying portions of Staten Island.
For Boston, the 10-, 100-, and 500-year flood elevations were computed by fitting Generalized Ex-treme Value distributions to annual maximum storm tide elevations from the historical tide gauge dataset. Flood zones were mapped for each return period using a “bathtub” method in ArcMap, overlaying each coastal flood elevation across the topography of the city. Lastly, the reduction in return period for each flood elevation and mapped flood zone was calculated under selected sea level scenarios for the 2020s, 2050s, and 2080s.
New 6-meter resolution hydrodynamic model grids have been developed and validated for (1) the city of Hoboken and (2) all the surrounding New Jersey Hudson shorelines (from Bayonne to Weehawken). These models are nested within the three dimensional NYHOPS model at their offshore open boundaries, influenced by estuarine tide and storm surge, and forced by uniform winds. These model grids enable dynamic prediction of flood elevations and velocities across area neighborhoods during inundation events.
Green Infrastructure
In our comparison of social and climatic uncertainty in watershed-scale green infrastructure pre-dictions, we accomplished the following:
• Used our LIDRA model to work with watershed stakeholders in the Bronx and in Queens, NY to develop locally appropriate GI scenarios, and predictions of their respective cost-NY to develop locally appropriate GI scenarios, and predictions of their respective cost-effec-tiveness in reducing urban runoff, assuming future stationary precipitation.
• Development of a non-stationary hourly precipitation generator that utilizes GCM-output pressure data to appropriately resample historical precipitation sequences.
Apr i l 2013 - May 2014 | 19
• Compared the runoff reduction and life cycle cost results with the stationary and non-stationary precipitation generators to quantify the uncertainty in GI predictions potentially attributable to changed precipitation
• Results show that the variability in predictions due to precipitation change is small, relative to the variability implied by the institutional and other factors that will determine where and at what rate GI will be implemented.
Public Health
Statistical temperature anomaly maps have been formed over New York city based on the field campaigns of surface observations correlated to surface cover characteristics.
Climate
Climate projections developed by CCRUN helped lead to a Public Services Commission ruling that Consolidated-Edison should consider climate information in future planning.
The New York City Panel on Climate Change, led by CCRUN’s Lead-PI and with contributions from many CCRUN members has informed New York City’s post-Hurricane Sandy rebuilding and resiliency efforts.
A century-long storm track database for the East Coast is being analyzed for relationship to coastal wind surge and temporal robustness by comparing to tidegauge records.
A study of the spatial distribution of strong, wintertime wind events in the Northeast, their associ-ated statistical properties and association with extratropical storm tracks has been completed and submitted for review at the Journal of Geophysical Research.
Vulnerability
We have completed the construction and mapping of social vulnerability indices for New York City and Boston using three different approaches.