Embed Size (px)
Citation preview

CONSORCIO DE COMPENSACIÓN DE SEGUROS:
THE CATASTROPHE INSURANCE PROGRAM IN SPAIN
Alfonso Nájera
Sofia – June 17, 2014
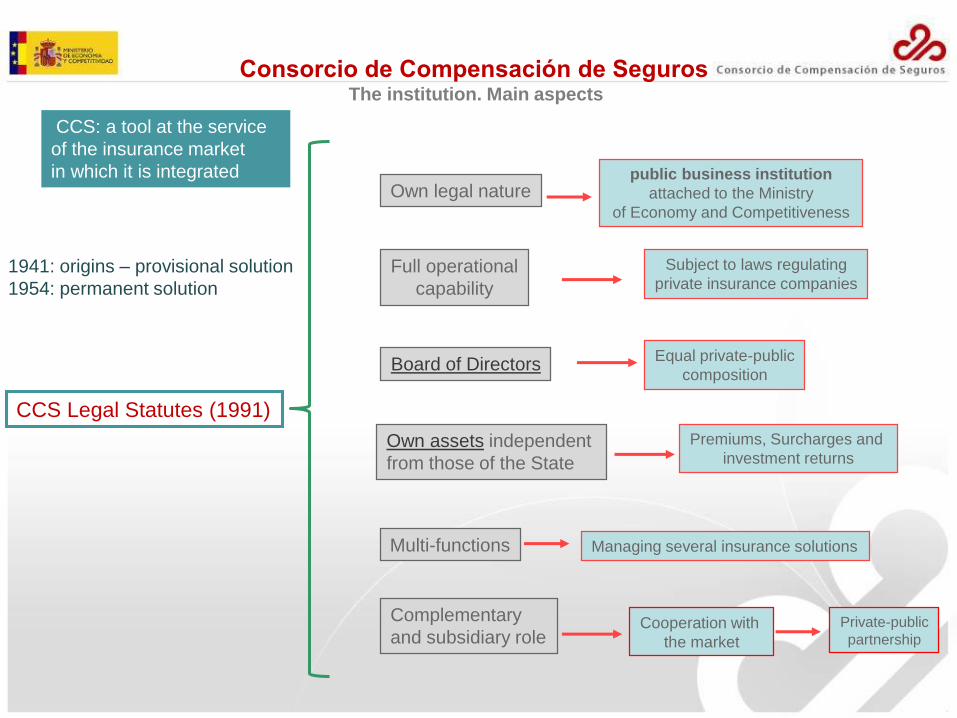
Own assets independent
from those of the State
Premiums, Surcharges and
investment returns
Own legal nature
Full operational
capability
Board of DirectorsEqual private-public
composition
Subject to laws regulating
private insurance companies
Multi-functions
Cooperation with
the market
Consorcio de Compensación de SegurosThe institution. Main aspects
Managing several insurance solutions
CCS: a tool at the service
of the insurance market
in which it is integrated public business institution
attached to the Ministry
of Economy and Competitiveness
CCS Legal Statutes (1991)
Complementary
and subsidiary rolePrivate-public
partnership
1941: origins – provisional solution
1954: permanent solution

PRINCIPLES OF THE EXTRAOIRDINARY RISK
INSURANCE SYSTEM
SOLIDARITY MUTUALIZATION OF RISK
COMPENSATION
GEOGRAPHICAL
AMONG RISKS
INTER ANNUAL
COOPERATION
UNIVERSALITY ADVERSE SELECTIONCOMPULSORY
INSURANCE INDUSTRY
(SUBSIDIARY ROLE)
AFORDABLE PRICES
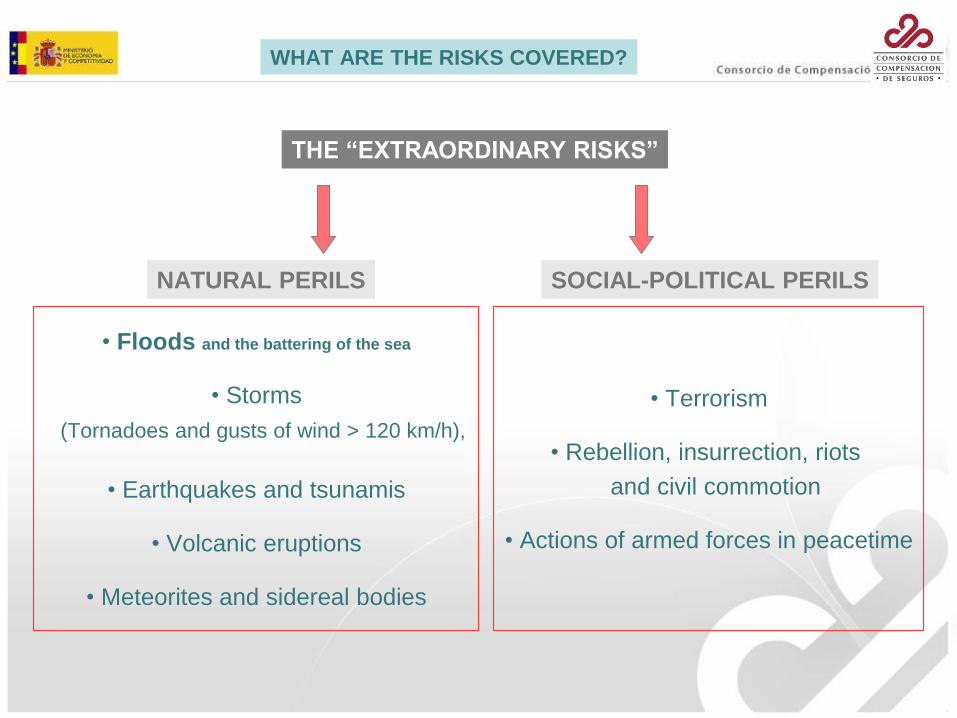
THE “EXTRAORDINARY RISKS”
NATURAL PERILS
• Floods and the battering of the sea
• Storms
(Tornadoes and gusts of wind > 120 km/h),
• Earthquakes and tsunamis
• Volcanic eruptions
• Meteorites and sidereal bodies
• Terrorism
• Rebellion, insurrection, riots
and civil commotion
• Actions of armed forces in peacetime
WHAT ARE THE RISKS COVERED?
SOCIAL-POLITICAL PERILS
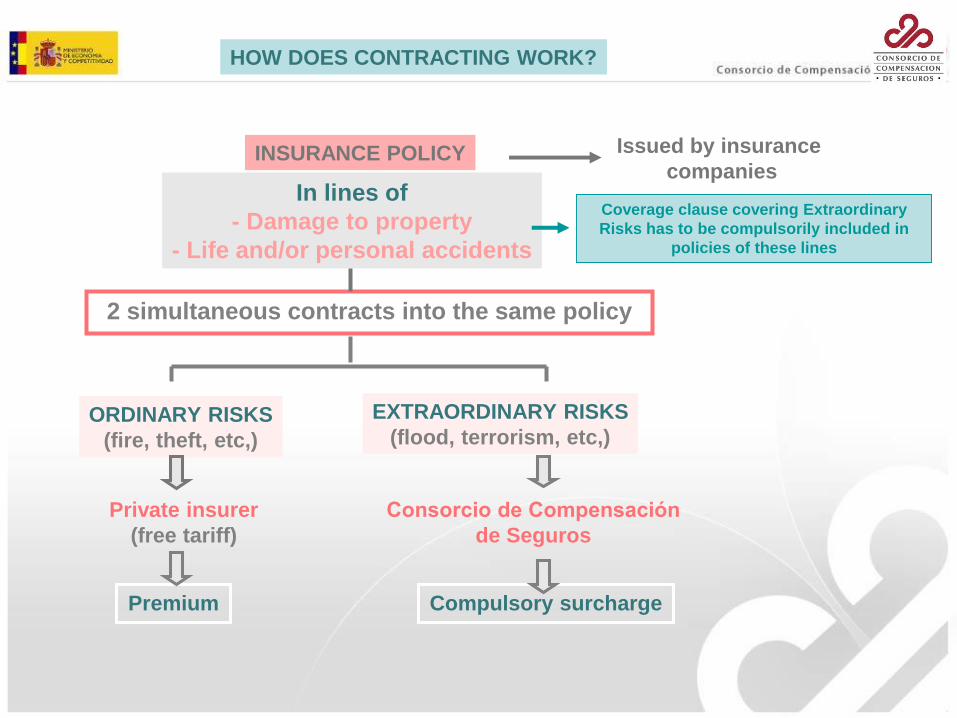
In lines of
- Damage to property
- Life and/or personal accidents
2 simultaneous contracts into the same policy
ORDINARY RISKS
(fire, theft, etc,)
EXTRAORDINARY RISKS
(flood, terrorism, etc,)
Private insurer
(free tariff)
Consorcio de Compensación
de Seguros
Issued by insurance
companies
Premium Compulsory surcharge
Coverage clause covering Extraordinary
Risks has to be compulsorily included in
policies of these lines
HOW DOES CONTRACTING WORK?
INSURANCE POLICY
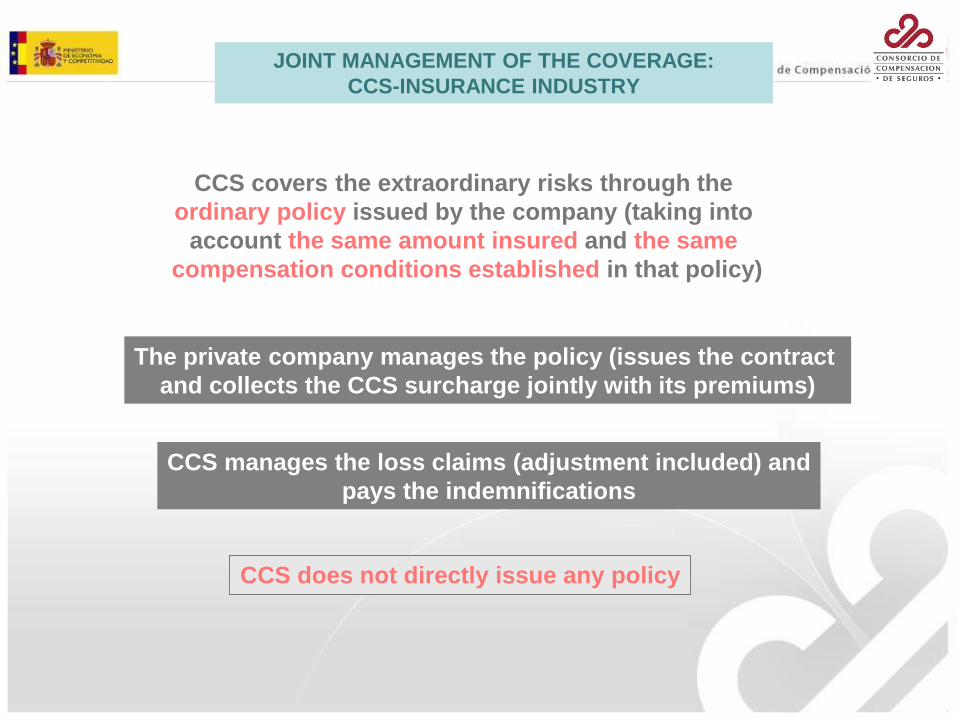
The private company manages the policy (issues the contract
and collects the CCS surcharge jointly with its premiums)
CCS manages the loss claims (adjustment included) and
pays the indemnifications
CCS does not directly issue any policy
JOINT MANAGEMENT OF THE COVERAGE:
CCS-INSURANCE INDUSTRY
CCS covers the extraordinary risks through the
ordinary policy issued by the company (taking into
account the same amount insured and the same
compensation conditions established in that policy)

COMPULSORY SURCHARGE IN FAVOUR OF THE CCS
A per thousand rate over the sum insured of the ordinary policy
Insurance companies collect the surcharges together with their premiums
Companies pay the surcharges to the CCS on a monthly basis
Collecting commission retained by the companies is 5%
HOW IS THE COVERAGE FINANCED?
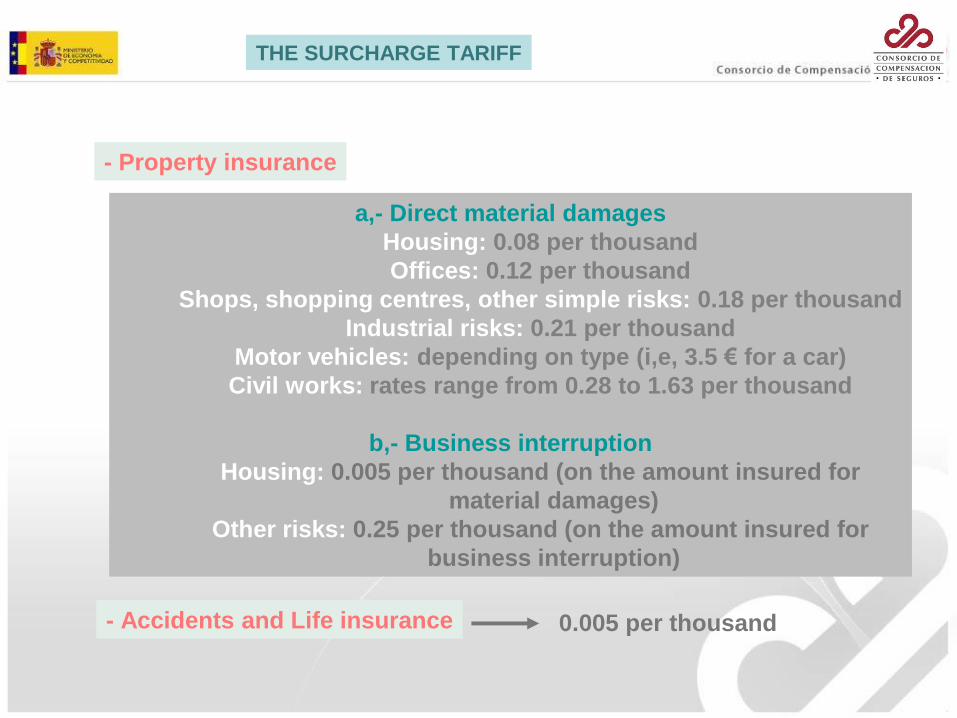
- Property insurance
a,- Direct material damages
Housing: 0.08 per thousand
Offices: 0.12 per thousand
Shops, shopping centres, other simple risks: 0.18 per thousand
Industrial risks: 0.21 per thousand
Motor vehicles: depending on type (i,e, 3.5 € for a car)
Civil works: rates range from 0.28 to 1.63 per thousand
b,- Business interruption
Housing: 0.005 per thousand (on the amount insured for
material damages)
Other risks: 0.25 per thousand (on the amount insured for
business interruption)
- Accidents and Life insurance 0.005 per thousand
THE SURCHARGE TARIFF
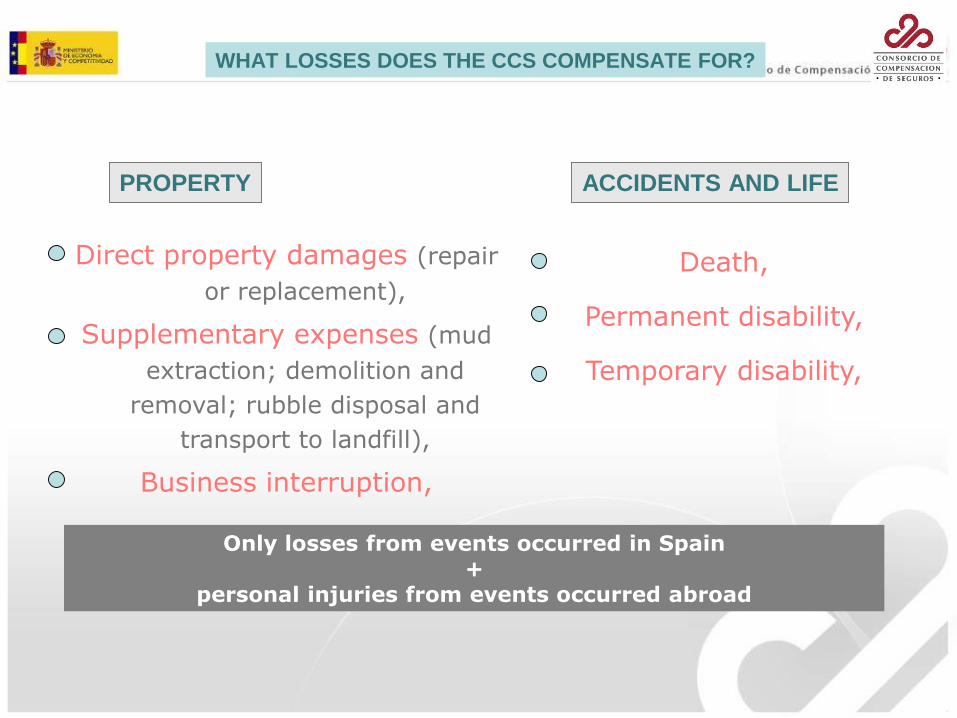
Only losses from events occurred in Spain +
personal injuries from events occurred abroad
Direct property damages (repair
or replacement),
Supplementary expenses (mud
extraction; demolition and
removal; rubble disposal and
transport to landfill),
Business interruption,
Death,
Permanent disability,
Temporary disability,
WHAT LOSSES DOES THE CCS COMPENSATE FOR?
PROPERTY ACCIDENTS AND LIFE
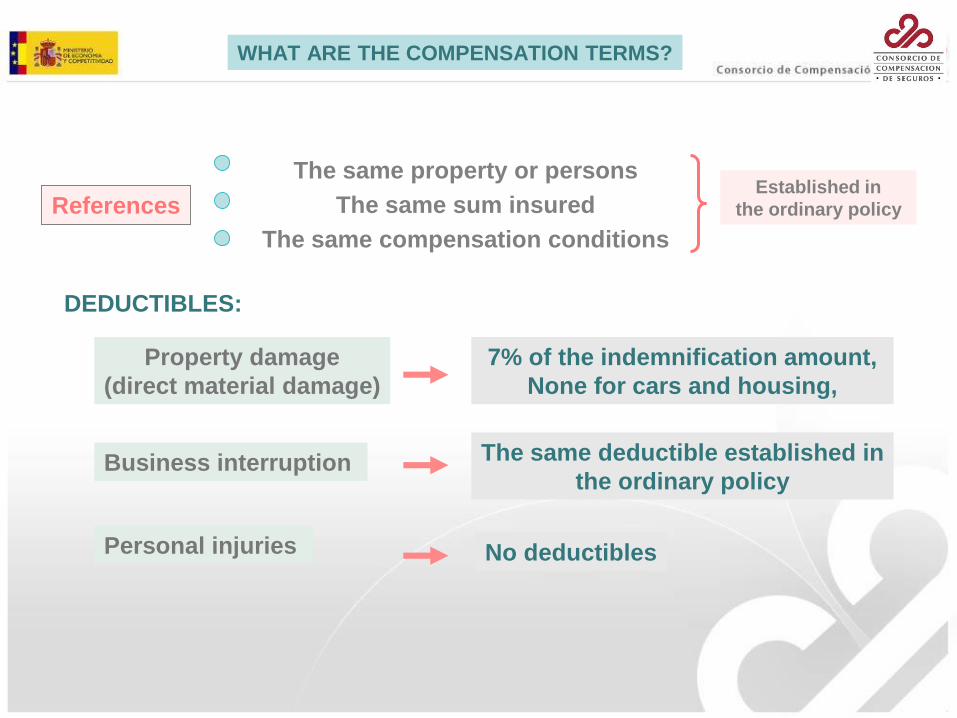
References
The same property or persons
The same sum insured
The same compensation conditions
Established in
the ordinary policy
DEDUCTIBLES:
Property damage
(direct material damage)
7% of the indemnification amount,
None for cars and housing,
Business interruption The same deductible established in
the ordinary policy
Personal injuries No deductibles
WHAT ARE THE COMPENSATION TERMS?
LOSSES ASSESSMENT
This task is made by experts designed by CCS
Number of experts designed: depending on the volume of the damage
They are professionals whose services are taken on in the market
Experts are not CCS’ workers
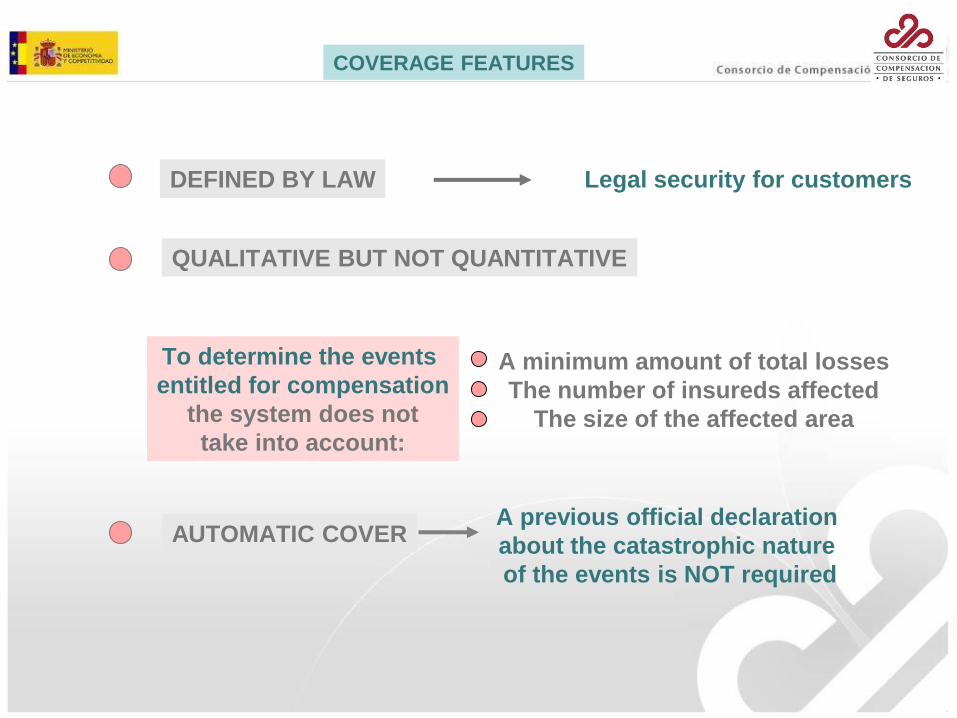
To determine the events
entitled for compensation
the system does not
take into account:
A minimum amount of total losses
The number of insureds affected
The size of the affected area
QUALITATIVE BUT NOT QUANTITATIVE
DEFINED BY LAW Legal security for customers
AUTOMATIC COVER
COVERAGE FEATURES
A previous official declaration
about the catastrophic nature
of the events is NOT required
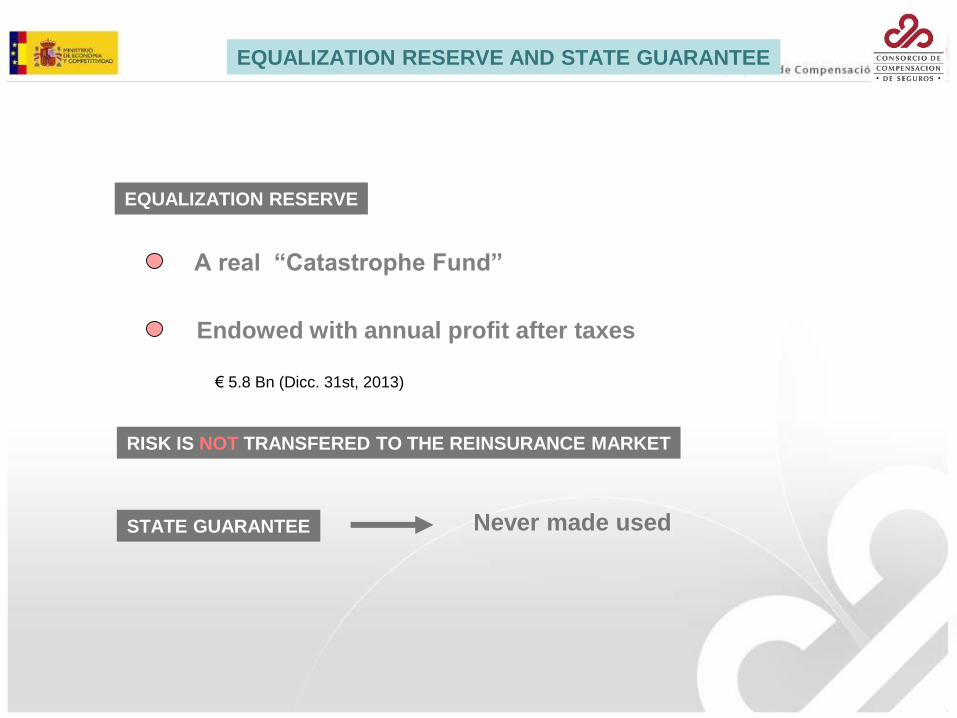
EQUALIZATION RESERVE
A real “Catastrophe Fund”
Endowed with annual profit after taxes
STATE GUARANTEE Never made used
EQUALIZATION RESERVE AND STATE GUARANTEE
RISK IS NOT TRANSFERED TO THE REINSURANCE MARKET
€ 5.8 Bn (Dicc. 31st, 2013)

Exposures
Number of policies and capital insured
Property
Year Policies Capital insured
Persons
Year Policies Capital insuredAmounts in euros
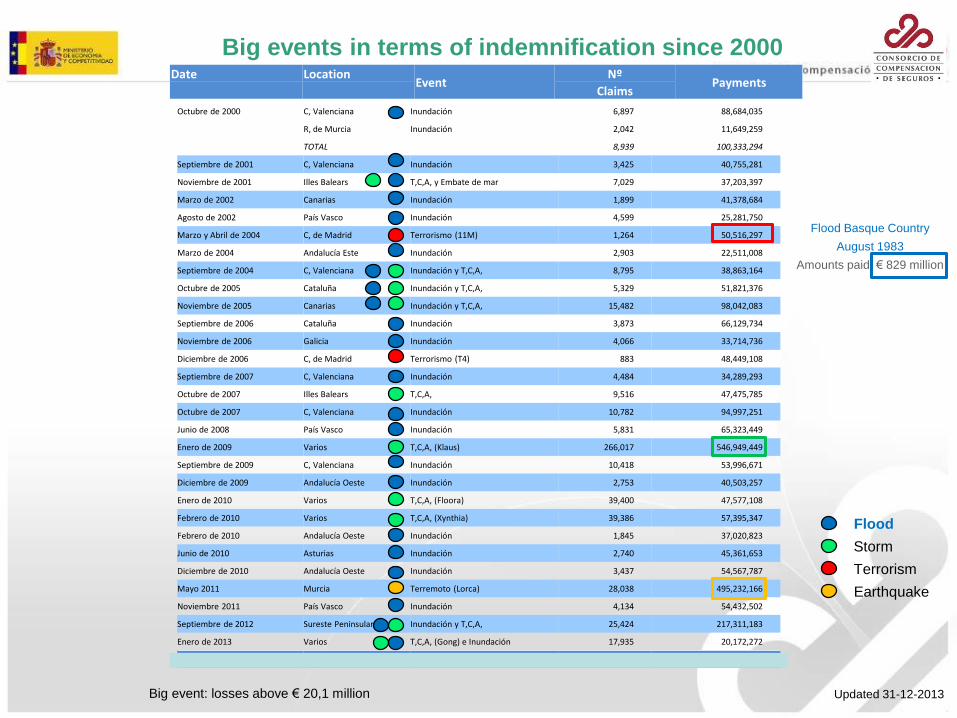
Date LocationEvent
Nº Payments
Claims
Octubre de 2000 C, Valenciana Inundación 6,897 88,684,035
R, de Murcia Inundación 2,042 11,649,259
TOTAL 8,939 100,333,294
Septiembre de 2001 C, Valenciana Inundación 3,425 40,755,281
Noviembre de 2001 Illes Balears T,C,A, y Embate de mar 7,029 37,203,397
Marzo de 2002 Canarias Inundación 1,899 41,378,684
Agosto de 2002 País Vasco Inundación 4,599 25,281,750
Marzo y Abril de 2004 C, de Madrid Terrorismo (11M) 1,264 50,516,297
Marzo de 2004 Andalucía Este Inundación 2,903 22,511,008
Septiembre de 2004 C, Valenciana Inundación y T,C,A, 8,795 38,863,164
Octubre de 2005 Cataluña Inundación y T,C,A, 5,329 51,821,376
Noviembre de 2005 Canarias Inundación y T,C,A, 15,482 98,042,083
Septiembre de 2006 Cataluña Inundación 3,873 66,129,734
Noviembre de 2006 Galicia Inundación 4,066 33,714,736
Diciembre de 2006 C, de Madrid Terrorismo (T4) 883 48,449,108
Septiembre de 2007 C, Valenciana Inundación 4,484 34,289,293
Octubre de 2007 Illes Balears T,C,A, 9,516 47,475,785
Octubre de 2007 C, Valenciana Inundación 10,782 94,997,251
Junio de 2008 País Vasco Inundación 5,831 65,323,449
Enero de 2009 Varios T,C,A, (Klaus) 266,017 546,949,449
Septiembre de 2009 C, Valenciana Inundación 10,418 53,996,671
Diciembre de 2009 Andalucía Oeste Inundación 2,753 40,503,257
Enero de 2010 Varios T,C,A, (Floora) 39,400 47,577,108
Febrero de 2010 Varios T,C,A, (Xynthia) 39,386 57,395,347
Febrero de 2010 Andalucía Oeste Inundación 1,845 37,020,823
Junio de 2010 Asturias Inundación 2,740 45,361,653
Diciembre de 2010 Andalucía Oeste Inundación 3,437 54,567,787
Mayo 2011 Murcia Terremoto (Lorca) 28,038 495,232,166
Noviembre 2011 País Vasco Inundación 4,134 54,432,502
Septiembre de 2012 Sureste Peninsular Inundación y T,C,A, 25,424 217,311,183
Enero de 2013 Varios T,C,A, (Gong) e Inundación 17,935 20,172,272
685,729 5,148,625,939
Updated 31-12-2013
Big events in terms of indemnification since 2000
Big event: losses above € 20,1 million
Flood
Storm
Terrorism
Earthquake
Flood Basque Country
August 1983
Amounts paid: € 829 million

LOSSES INDEMNIFIED - NATURAL EVENTS
PROPERTY
(Amounts in euros.
Updated 31-12-13)
AÑO INUNDACIÓN TERREMOTO TCA
1987 339,737,327 89,000 -
1988 102,752,353 4,427 -
1989 287,384,214 563,654 -
1990 30,555,410 59,548 -
1991 47,931,583 295,582 -
1992 70,409,260 92,875 2,718,660
1993 40,064,064 453,949 -
1994 113,300,400 1,021,118 -
1995 113,873,863 1,037,990 -
1996 145,734,471 444,353 -
1997 301,947,317 1,790,384 2,912,751
1998 55,389,965 176,607 -
1999 118,694,325 16,439,464 1,998,051
2000 190,561,568 12,856 -
2001 142,691,679 23,915 33,561,937
2002 147,850,995 1,758,124 -
2003 99,564,243 596,405 16,604,652
2004 116,401,403 990,467 19,558,299
2005 97,765,685 8,618,237 90,762,096
2006 172,805,384 230,502 15,494,831
2007 251,368,880 1,443,303 57,585,673
2008 262,951,541 591,002 15,681,925
2009 190,171,624 153,323 567,250,143
2010 328,924,549 115,858 135,127,242
2011 177,972,462 478,356,471 4,312,287
2012 255,053,620 44,709 17,888,421
2013 122,236,237 149,297 24,766,016
TOTAL 4,324,094,419 515,553,422 1,006,222,983
FLOOD EARTHQUAKEYear STORM
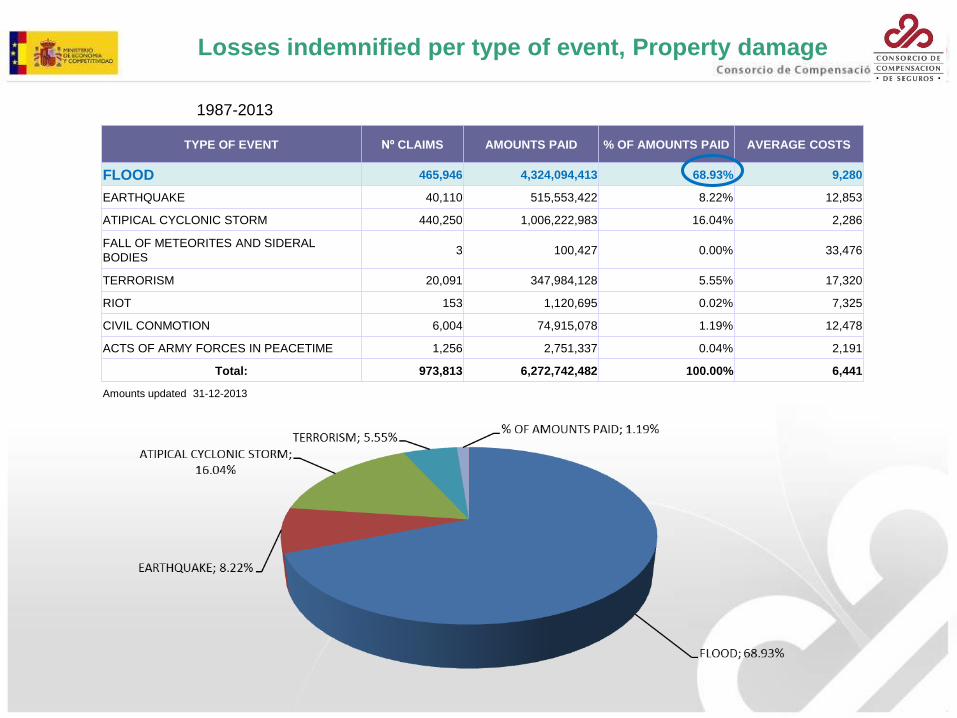
TYPE OF EVENT Nº CLAIMS AMOUNTS PAID % OF AMOUNTS PAID AVERAGE COSTS
FLOOD 465,946 4,324,094,413 68.93% 9,280
EARTHQUAKE 40,110 515,553,422 8.22% 12,853
ATIPICAL CYCLONIC STORM 440,250 1,006,222,983 16.04% 2,286
FALL OF METEORITES AND SIDERAL
BODIES3 100,427 0.00% 33,476
TERRORISM 20,091 347,984,128 5.55% 17,320
RIOT 153 1,120,695 0.02% 7,325
CIVIL CONMOTION 6,004 74,915,078 1.19% 12,478
ACTS OF ARMY FORCES IN PEACETIME 1,256 2,751,337 0.04% 2,191
Total: 973,813 6,272,742,482 100.00% 6,441
Amounts updated 31-12-2013
Losses indemnified per type of event, Property damage
1987-2013
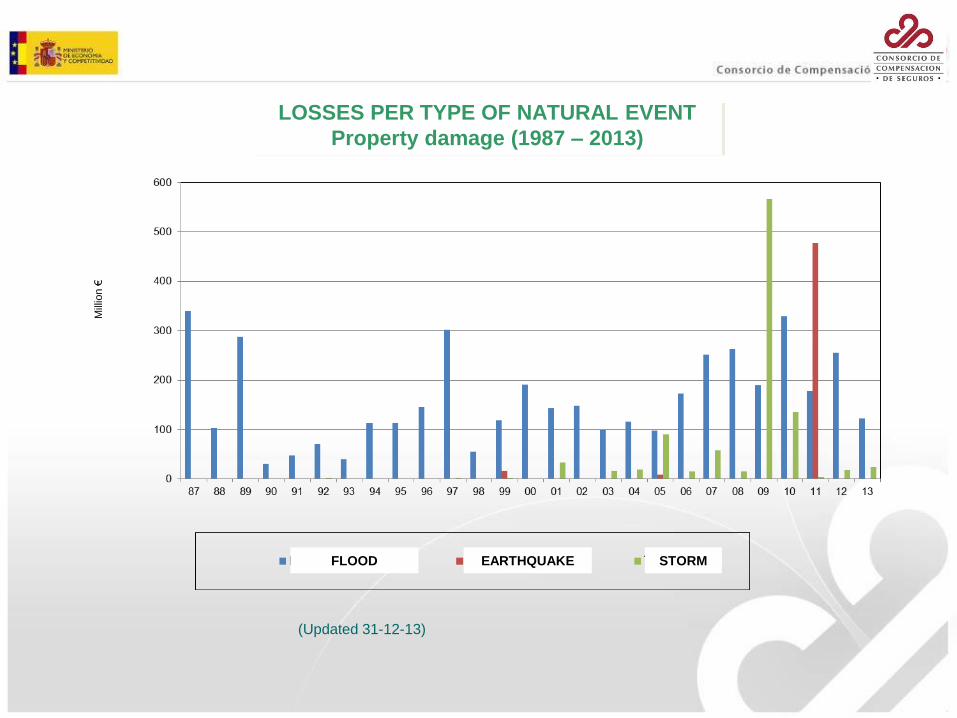
(Updated 31-12-13)
LOSSES PER TYPE OF NATURAL EVENT
Property damage (1987 – 2013)
Mill
ion €
FLOOD EARTHQUAKE STORM

COMBINED RATIO SURCHARGES/LOSSESPROPERTY
1981 122,694,402 66,049,297 53.83
1982 129,410,489 422,264,078 326.30
1983 130,351,038 980,875,582 752.49
1984 135,252,515 79,074,406 58.46
1985 144,520,645 40,255,645 27.85
1986 148,212,353 94,240,561 63.58
1987 143,228,258 391,802,034 273.55
1988 149,730,375 119,887,413 80.07
1989 213,605,282 316,800,756 148.31
1990 231,290,872 52,920,570 22.88
1991 250,191,662 70,013,002 27.98
1992 267,384,276 93,021,218 34.79
1993 280,061,164 52,917,249 18.89
1994 289,180,892 128,924,253 44.58
1995 299,849,881 139,262,490 46.44
1996 315,656,691 182,883,761 57.94
1997 346,999,074 354,503,535 102.16
1998 368,697,165 71,193,563 19.31
1999 390,478,207 155,384,620 39.79
2000 420,442,577 235,204,922 55.94
2001 442,239,961 225,293,028 50.94
2002 446,356,012 186,508,472 41.78
2003 493,020,297 127,903,088 25.94
2004 522,331,878 150,341,183 28.78
2005 555,848,348 218,269,439 39.27
2006 593,679,539 255,789,425 43.09
2007 616,439,147 336,165,495 54.53
2008 651,328,354 326,300,296 50.10
2009 615,560,843 817,638,561 132.83
2010 591,427,982 492,936,780 83.35
2011 596,726,193 700,641,859 117.41
2012 589,477,295 289,918,879 49.18
2013 603,907,775 188,041,955 31.14
TOTAL 12,095,581,443 8,363,227,416 69.14
Surcharges PaymentsCombined
ratio(%)
Amounts updated (31-12-2013)
Lorca earthquake
Storm “Klaus”
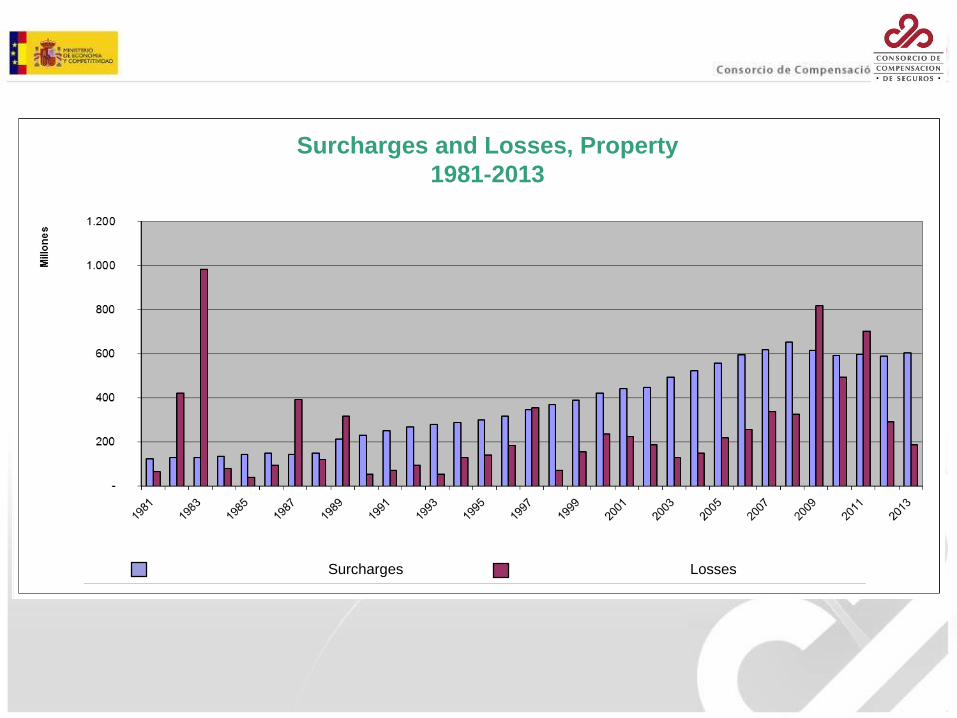
Surcharges and Losses, Property
1981-2013
Surcharges Losses

http://www.consorseguros.es
THANK YOU FOR YOUR ATTENTION