Embed Size (px)
Citation preview

Consolidation of Grade 6 EQAO Questions
Data Management and Probability
Compiled by Devika William-Yu (SE2 Math Coach)

GRADE SIX EQAO QUESTIONS: Data Management and Probability Overall Expectations
DV1 • Collect and organize discrete or continuous primary data and secondary data and display the data using charts and graphs, including continuous line graphs
DV2 • Read, describe, and interpret data, and explain relationships between sets of
data
DV3 • Determine the theoretical probability of an outcome in a probability experiment, and use it to predict the frequency of the outcome
Year DV1 DV2 DV3
Spring 2006 MC26 OR27
MC6 MC12
MC13 MC36 OR10
Spring 2007 MC26
MC12 MC32 OR28
MC11 MC33 OR7
Spring 2008 MC13
MC11 MC36 OR29
MC12 MC35 OR9
Spring 2009 OR27
MC11 MC13 MC36
MC12 MC35 OR8
Spring 2010 MC11 MC13 MC36 OR9
MC12 MC35 OR27
Spring 2011 MC18 OR26
MC4 MC12
MC21 MC32 OR9

GRADE SIX EQAO QUESTIONS: Data Management and Probability
Year Knowledge & Understanding
Problem Solving (Thinking)
Application
Spring 2009 MC36 MC35 OR8
OR27
MC11 MC12 MC13
Spring 2010 MC36 MC35
OR9 OR27
MC11 MC12 MC13
Spring 2011 MC12
MC21
MC4
MC18 MC32 OR9
OR26

DATA MANAGEMENT & PROBABILITY: Collection and Organization of Data
Grade 4 Grade 5 Grade 6 Overall Expectation
- collect and organize discrete primary data and display the data using charts and graphs, including stem-and-leaf plots and double bar graphs
- collect and organize discrete or continuous primary data and secondary data and display the data using charts and graphs, including broken-line graphs
- collect and organize discrete or continuous primary data and secondary data and display the data using charts and graphs, including continuous line graphs
Specific Expectations – distinguish between discrete data (i.e., data
organized using numbers that have gaps between them, such as whole numbers, and often used to represent a count, such as the number of times a word is used) and continuous data (i.e., data organized using all numbers on a number line that fall within the range of the data, and used to represent measurements such as heights or ages of trees)
- collect data by conducting a survey or an experiment to do with themselves, their environment, issues in their school or the community, or content from another subject, and record observations or measurements
- collect data by conducting a survey or an experiment do with themselves, their environment, issues in their school or community, or content from another subject, and record observations or measurements
- collect data by conducting a survey or an experiment to do with themselves, their environment, issues in their school or community, or content from another subject, and record observations or measurements
- collect and organize discrete primary data and display the data in charts, tables, and graphs (including stem-and-leaf plots and double bar graphs) that have appropriate titles, labels, and scales that suit the range and distribution of the data, using a variety of tools
- collect and organize discrete or continuous primary data and secondary data and display the data in charts, tables, and graphs (including broken-line graphs) that have appropriate titles, labels and scales that suit the range and distribution of the data using a variety of tools
- collect and organize discrete or continuous primary data and secondary data and display the data in charts, tables, and graphs (including continuous line graphs) that have appropriate titles, labels, and scales that suit the range and distribution of the data, using a variety of tools
- demonstrate an understanding that sets of data can be samples of larger populations
- describe, through investigation, how a set of data is collected and explain whether the collection method is appropriate
- determine, through investigation, how well a set of data represents a population, on the basis of the method that was used to collect the data
– select an appropriate type of graph to represent a set of data, graph the data using technology, and justify the choice of graph (i.e., from types of graphs already studied, such as pictographs, horizontal or vertical bar graphs, stem-and-leaf plots, double bar graphs, broken-line graphs, and continuous line graphs)

DATA MANAGEMENT & PROBABILITY: Data Relationships
Grade 4 Grade 5 Grade 6 Overall Expectations
- read, describe, and interpret primary data and secondary data presented in charts and graphs, including stem-and-leaf plots and double bar graphs
- read, describe, and interpret primary data and secondary data presented in charts and graphs, including broken-line graphs
- read, describe, and interpret data, and explain relationships between sets of data
Specific Expectations - read, interpret, and draw conclusions from primary data from secondary data presented in charts, tables, and graphs (including stem-and-leaf plots and double bar graphs)
– read, interpret, and draw conclusions from primary data and from secondary data
- read, interpret, and draw conclusions from primary data and from secondary data, presented in charts, tables, and graphs (including continuous line graphs)
- describe the shape of a set of data across its range of values, using charts, tables, and graphs
– calculate the mean for a small set of data and use it to describe the shape of the data set across its range of values, using charts, tables, and graphs
- compare similarities and differences between two related sets of data, using a variety of strategies
– compare similarities and differences between two related sets of data, using a variety of strategies
- demonstrate an understanding of mean, and use the mean to compare two sets of related data, with and without the use of technology
- demonstrate, through investigation, an understanding of median and determine the median of a set of data
- compare, through investigation, different graphical representations of the same data
- demonstrate, through investigation, an understanding of how data from charts, tables, and graphs can be used to make inferences and convincing arguments
- explain how different scales used on graphs can influence conclusions drawn from the data

DATA MANAGEMENT & PROBABILITY: Probability
Grade 4 Grade 5 Grade 6 Overall Expectations
- predict the results of a simple probability experiment, then conduct the experiment and compare the prediction to the results
- represent as a fraction the probability that a specific outcome will occur in a simple probability experiment, using systematic lists and area models
- determine the theoretical probability of an outcome in a probability experiment, and use it to predict the frequency of the outcome
Specific Expectations - determine and represent all the possible
outcomes in a simple probability experiment, using systematic lists and area models
- express theoretical probability as a ratio of the number of favourable outcomes to the total number of possible outcomes, where all outcomes are equally likely
- predict the frequency of an outcome in a simple probability experiment, explaining their reasoning; conduct the experiment; and compare the result with the prediction
- pose and solve simple probability problems, and solve them by conducting probability experiments and selecting appropriate methods of recording the results
- predict the frequency of an outcome of a simple probability experiment or game, by calculating and using the theoretical probability of that outcome
- determine, through investigation, how the number of repetitions of a probability experiment can affect the conclusions drawn
- represent, using a common fraction, the probability that an event will occur in simple games and probability experiments
- represent the probability of an event (i.e., the likelihood that the event will occur), using a value from the range of 0 (never happens or impossible) to 1 (always happens or certain)

GRADE SIX EQAO QUESTIONS: Data Management and Probability
Overall Expectation #1 Spring 2006

GRADE SIX EQAO QUESTIONS: Data Management and Probability
Overall Expectation #1 Spring 2006

GRADE SIX EQAO QUESTIONS: Data Management and Probability
Overall Expectation #1 Spring 2007

GRADE SIX EQAO QUESTIONS: Data Management and Probability
Overall Expectation #1 Spring 2008

GRADE SIX EQAO QUESTIONS: Data Management and Probability
Overall Expectation #1 Spring 2009

GRADE SIX EQAO QUESTIONS: Data Management and Probability
Overall Expectation #1 Spring 2011

GRADE SIX EQAO QUESTIONS: Data Management and Probability
Overall Expectation #1 Spring 2011

GRADE SIX EQAO QUESTIONS: Data Management and Probability
Overall Expectation #2 Spring 2006

GRADE SIX EQAO QUESTIONS: Data Management and Probability
Overall Expectation #2 Spring 2006

GRADE SIX EQAO QUESTIONS: Data Management and Probability
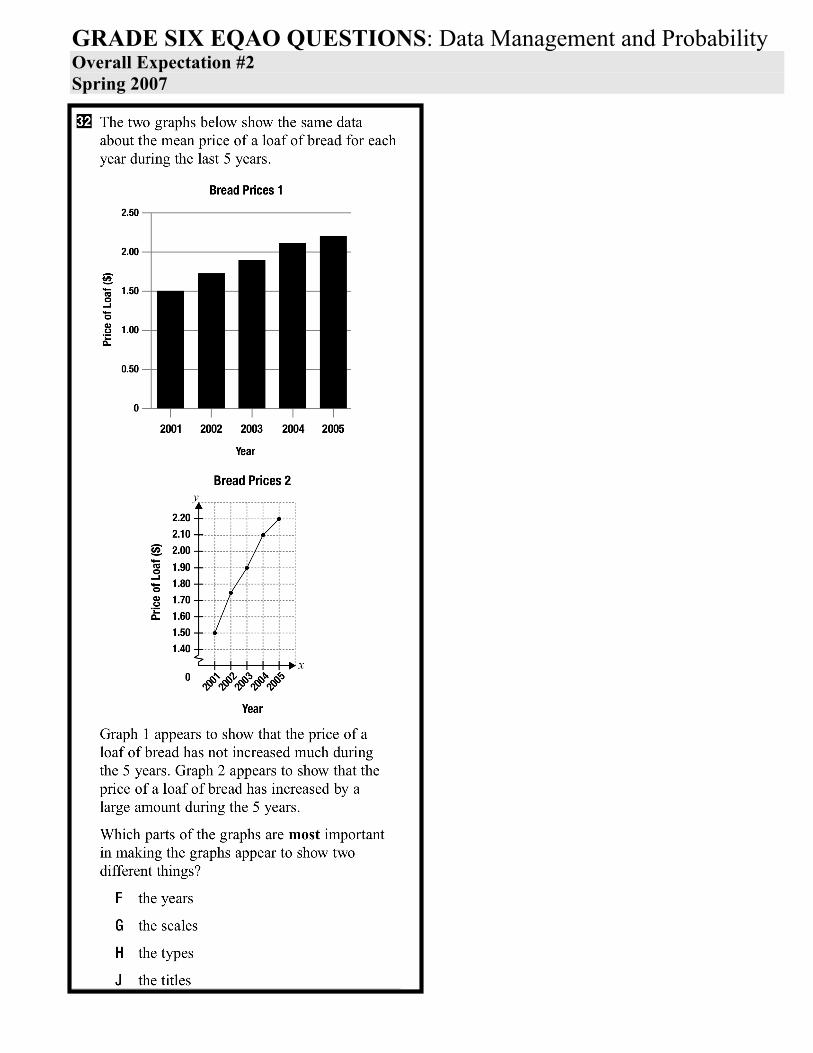
Overall Expectation #2 Spring 2007
GRADE SIX EQAO QUESTIONS: Data Management and Probability
Overall Expectation #2 Spring 2007

GRADE SIX EQAO QUESTIONS: Data Management and Probability
Overall Expectation #2 Spring 2007

GRADE SIX EQAO QUESTIONS: Data Management and Probability
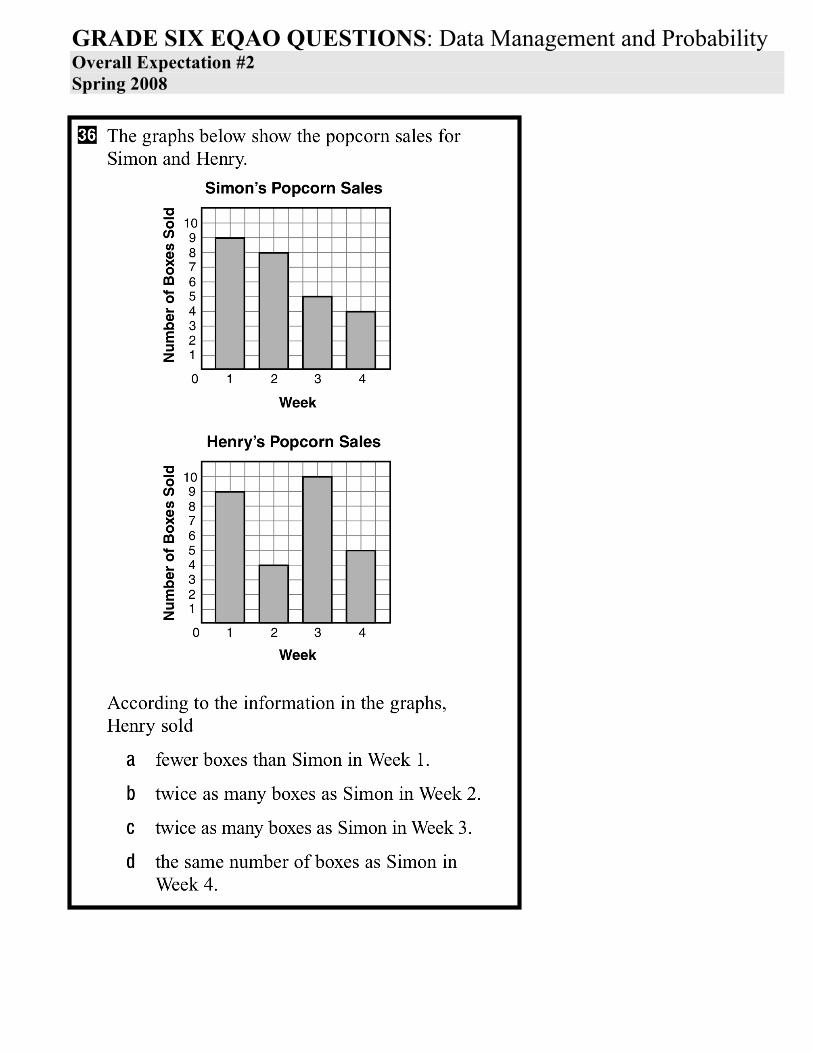
Overall Expectation #2 Spring 2008
GRADE SIX EQAO QUESTIONS: Data Management and Probability
Overall Expectation #2 Spring 2008

GRADE SIX EQAO QUESTIONS: Data Management and Probability
Overall Expectation #2 Spring 2008

GRADE SIX EQAO QUESTIONS: Data Management and Probability
Overall Expectation #2 Spring 2009

GRADE SIX EQAO QUESTIONS: Data Management and Probability
Overall Expectation #2 Spring 2009

GRADE SIX EQAO QUESTIONS: Data Management and Probability
Overall Expectation #2 Spring 2009

GRADE SIX EQAO QUESTIONS: Data Management and Probability
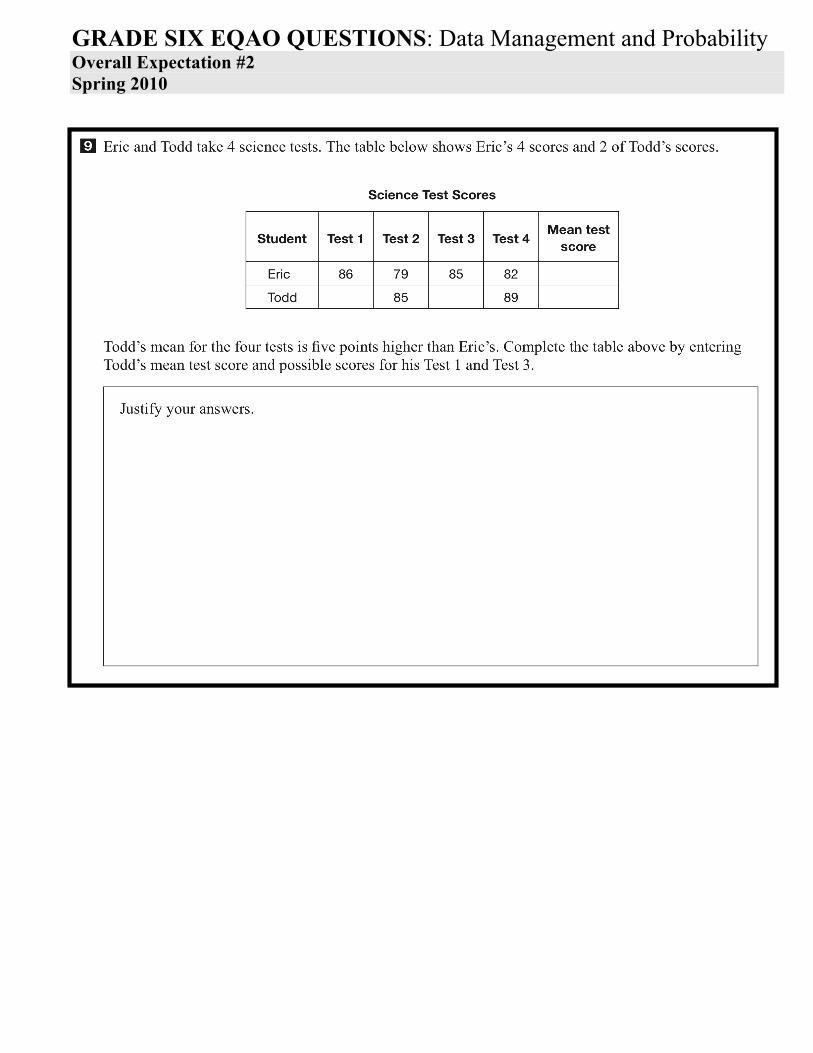
Overall Expectation #2 Spring 2010

GRADE SIX EQAO QUESTIONS: Data Management and Probability
Overall Expectation #2 Spring 2010

GRADE SIX EQAO QUESTIONS: Data Management and Probability
Overall Expectation #2 Spring 2010
GRADE SIX EQAO QUESTIONS: Data Management and Probability
Overall Expectation #2 Spring 2010

GRADE SIX EQAO QUESTIONS: Data Management and Probability
Overall Expectation #2 Spring 2011

GRADE SIX EQAO QUESTIONS: Data Management and Probability
Overall Expectation #2 Spring 2011

GRADE SIX EQAO QUESTIONS: Data Management and Probability
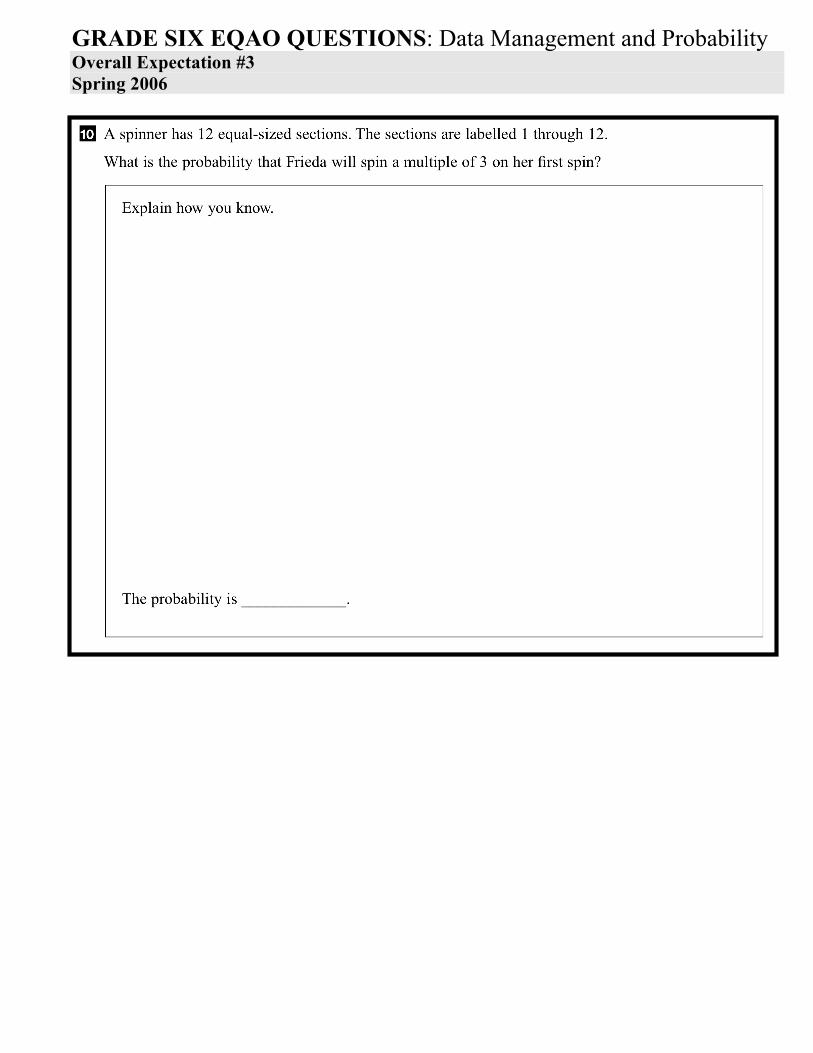
Overall Expectation #3 Spring 2006

GRADE SIX EQAO QUESTIONS: Data Management and Probability
Overall Expectation #3 Spring 2006
GRADE SIX EQAO QUESTIONS: Data Management and Probability
Overall Expectation #3 Spring 2006

GRADE SIX EQAO QUESTIONS: Data Management and Probability
Overall Expectation #3 Spring 2007

GRADE SIX EQAO QUESTIONS: Data Management and Probability
Overall Expectation #3 Spring 2007

GRADE SIX EQAO QUESTIONS: Data Management and Probability
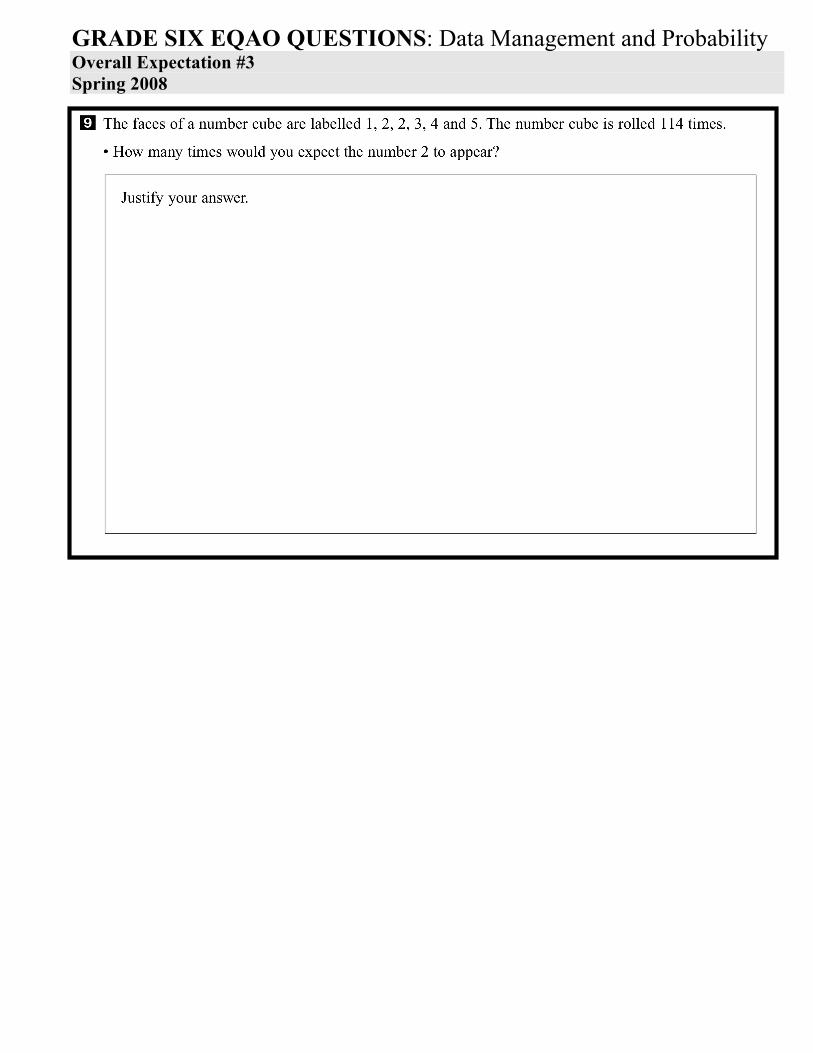
Overall Expectation #3 Spring 2008
GRADE SIX EQAO QUESTIONS: Data Management and Probability
Overall Expectation #3 Spring 2008

GRADE SIX EQAO QUESTIONS: Data Management and Probability
Overall Expectation #3 Spring 2009

GRADE SIX EQAO QUESTIONS: Data Management and Probability
Overall Expectation #3 Spring 2009
GRADE SIX EQAO QUESTIONS: Data Management and Probability
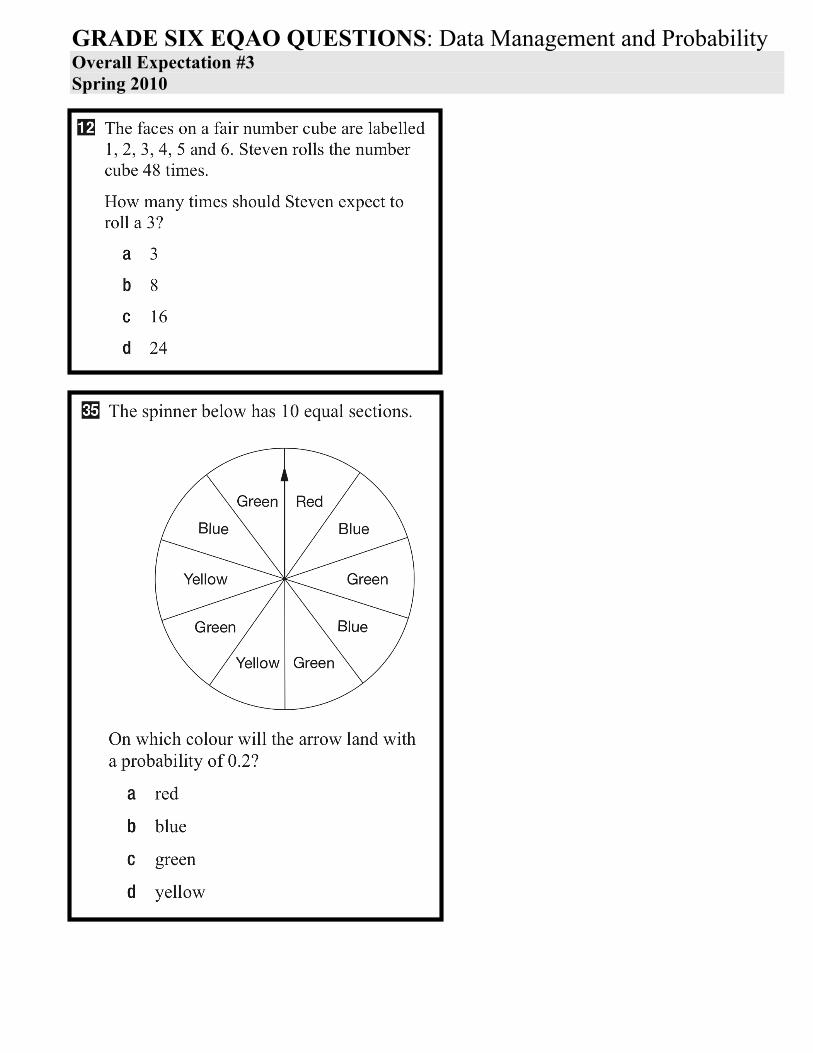
Overall Expectation #3 Spring 2010

GRADE SIX EQAO QUESTIONS: Data Management and Probability
Overall Expectation #3 Spring 2010

GRADE SIX EQAO QUESTIONS: Data Management and Probability
Overall Expectation #3 Spring 2011

GRADE SIX EQAO QUESTIONS: Data Management and Probability
Overall Expectation #3 Spring 2011