Embed Size (px)
Citation preview
93
CONSOLIDATED ACCOUNTS

95
We have audited the annexed consolidated financial statements comprising consolidated statement offinancial position of Habib Metropolitan Bank Limited as at 31 December 2010 and the related consolidatedprofit and loss account, consolidated statement of comprehensive income, consolidated cash flow statementand consolidated statement of changes in equity together with the notes forming part thereof, for the yearthen ended. These consolidated financial statements include unaudited certified returns from the branches,except for 15 branches, which have been audited by us.
These consolidated financial statements are responsibility of the Bank's management. Our responsibilityis to express our opinion on these consolidated financial statements based on our audit.We conducted our audit in accordance with the auditing standards as applicable in Pakistan. These standardsrequire that we plan and perform the audit to obtain reasonable assurance about whether the above saidstatements are free of any material misstatement. An audit includes examining, on a test basis, evidencesupporting the amounts and disclosures in the above said statements. An audit also includes assessingthe accounting policies and significant estimates made by management, as well as, evaluating the overallpresentation of the above said statements. We believe that our audit provides a reasonable basis for ouropinion.
In our opinion the consolidated financial statements present fairly the financial position of Habib MetropolitanBank Limited as at 31 December 2010 and the results of its operations, its cash flows and changes in equityfor the year then ended in accordance with the approved accounting standards as applicable in Pakistan.The financial statements of the subsidiary company (Habib Metropolitan Financial Services Limited) for theyear ended 31 December 2009 were audited by another firm of Chartered Accountants who had expressedan unqualified opinion thereon vide their report dated 10 February 2010.
Karachi: 1 March 2011
KPMG Taseer Hadi & CoChartered Accountants
Amyn Pirani
AUDITORS’ REPORT TO THE MEMBERS
96
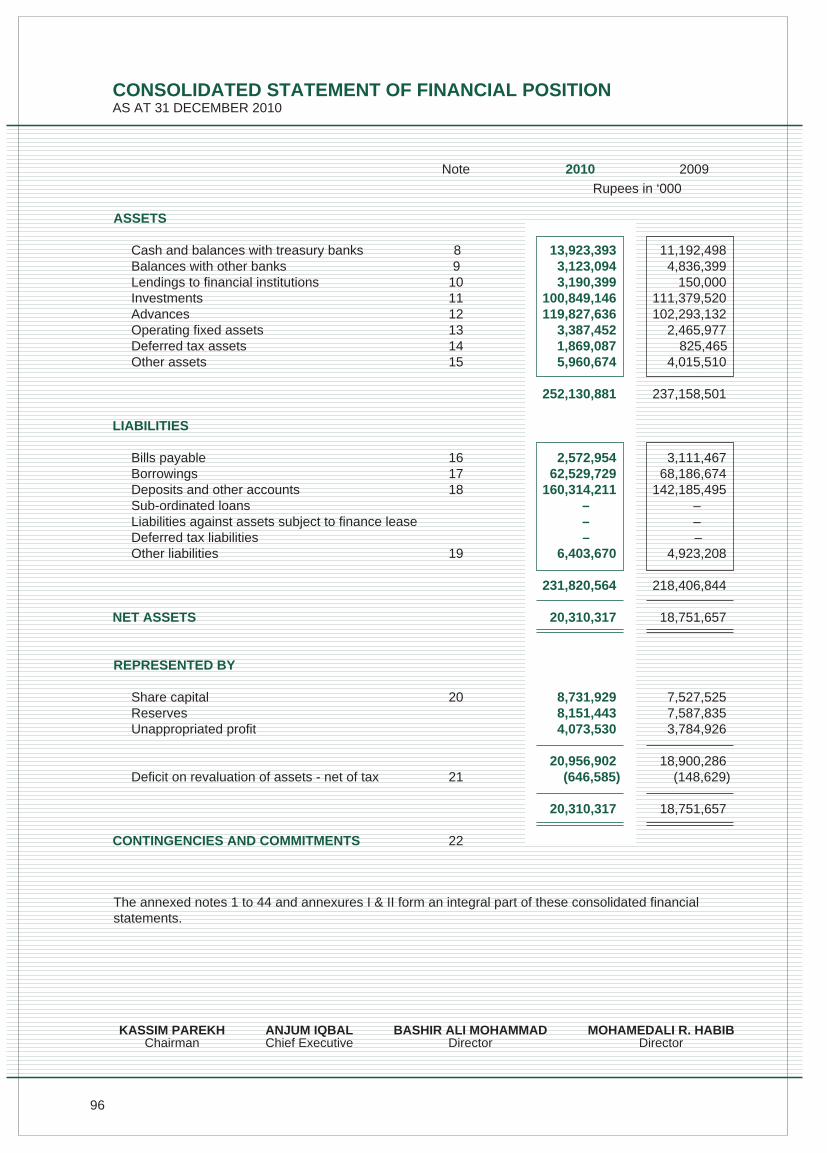
CONSOLIDATED STATEMENT OF FINANCIAL POSITIONAS AT 31 DECEMBER 2010
ASSETS
Cash and balances with treasury banks 8 13,923,393 11,192,498Balances with other banks 9 3,123,094 4,836,399Lendings to financial institutions 10 3,190,399 150,000Investments 11 100,849,146 111,379,520Advances 12 119,827,636 102,293,132Operating fixed assets 13 3,387,452 2,465,977Deferred tax assets 14 1,869,087 825,465Other assets 15 5,960,674 4,015,510
252,130,881 237,158,501
LIABILITIES
Bills payable 16 2,572,954 3,111,467Borrowings 17 62,529,729 68,186,674Deposits and other accounts 18 160,314,211 142,185,495Sub-ordinated loans – –Liabilities against assets subject to finance lease – –Deferred tax liabilities – –Other liabilities 19 6,403,670 4,923,208
231,820,564 218,406,844
NET ASSETS 20,310,317 18,751,657
REPRESENTED BY
Share capital 20 8,731,929 7,527,525Reserves 8,151,443 7,587,835Unappropriated profit 4,073,530 3,784,926
20,956,902 18,900,286Deficit on revaluation of assets - net of tax 21 (646,585) (148,629)
20,310,317 18,751,657
CONTINGENCIES AND COMMITMENTS 22
2010 2009
Rupees in ‘000
Note
The annexed notes 1 to 44 and annexures I & II form an integral part of these consolidated financialstatements.
KASSIM PAREKHChairman
ANJUM IQBALChief Executive
BASHIR ALI MOHAMMADDirector
MOHAMEDALI R. HABIBDirector
97
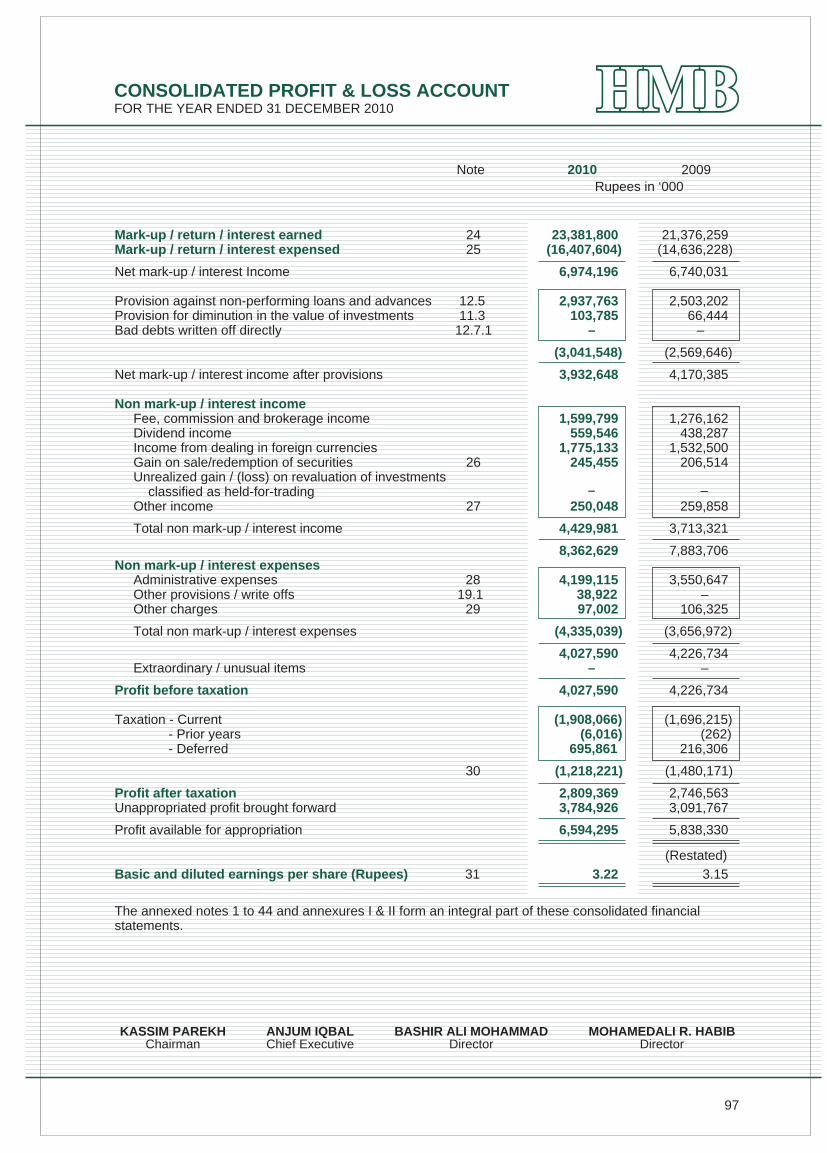
CONSOLIDATED PROFIT & LOSS ACCOUNTFOR THE YEAR ENDED 31 DECEMBER 2010
2010 2009Rupees in ‘000
Note
Mark-up / return / interest earned 24 23,381,800 21,376,259Mark-up / return / interest expensed 25 (16,407,604) (14,636,228)
Net mark-up / interest Income 6,974,196 6,740,031
Provision against non-performing loans and advances 12.5 2,937,763 2,503,202Provision for diminution in the value of investments 11.3 103,785 66,444Bad debts written off directly 12.7.1 – –
(3,041,548) (2,569,646)
Net mark-up / interest income after provisions 3,932,648 4,170,385
Non mark-up / interest incomeFee, commission and brokerage income 1,599,799 1,276,162Dividend income 559,546 438,287Income from dealing in foreign currencies 1,775,133 1,532,500Gain on sale/redemption of securities 26 245,455 206,514Unrealized gain / (loss) on revaluation of investments classified as held-for-tradingOther income 27 250,048 259,858
Total non mark-up / interest income 4,429,981 3,713,321
8,362,629 7,883,706Non mark-up / interest expenses Administrative expenses 28 4,199,115 3,550,647
Other provisions / write offs 19.1 38,922 –Other charges 29 97,002 106,325
Total non mark-up / interest expenses (4,335,039) (3,656,972)
4,027,590 4,226,734Extraordinary / unusual items – –
Profit before taxation 4,027,590 4,226,734
Taxation - Current (1,908,066) (1,696,215)- Prior years (6,016) (262)- Deferred 695,861 216,306
30 (1,218,221) (1,480,171)
Profit after taxation 2,809,369 2,746,563Unappropriated profit brought forward 3,784,926 3,091,767
Profit available for appropriation 6,594,295 5,838,330
Basic and diluted earnings per share (Rupees) 31 3.22 3.15
The annexed notes 1 to 44 and annexures I & II form an integral part of these consolidated financialstatements.
– –
(Restated)
KASSIM PAREKHChairman
ANJUM IQBALChief Executive
BASHIR ALI MOHAMMADDirector
MOHAMEDALI R. HABIBDirector
98
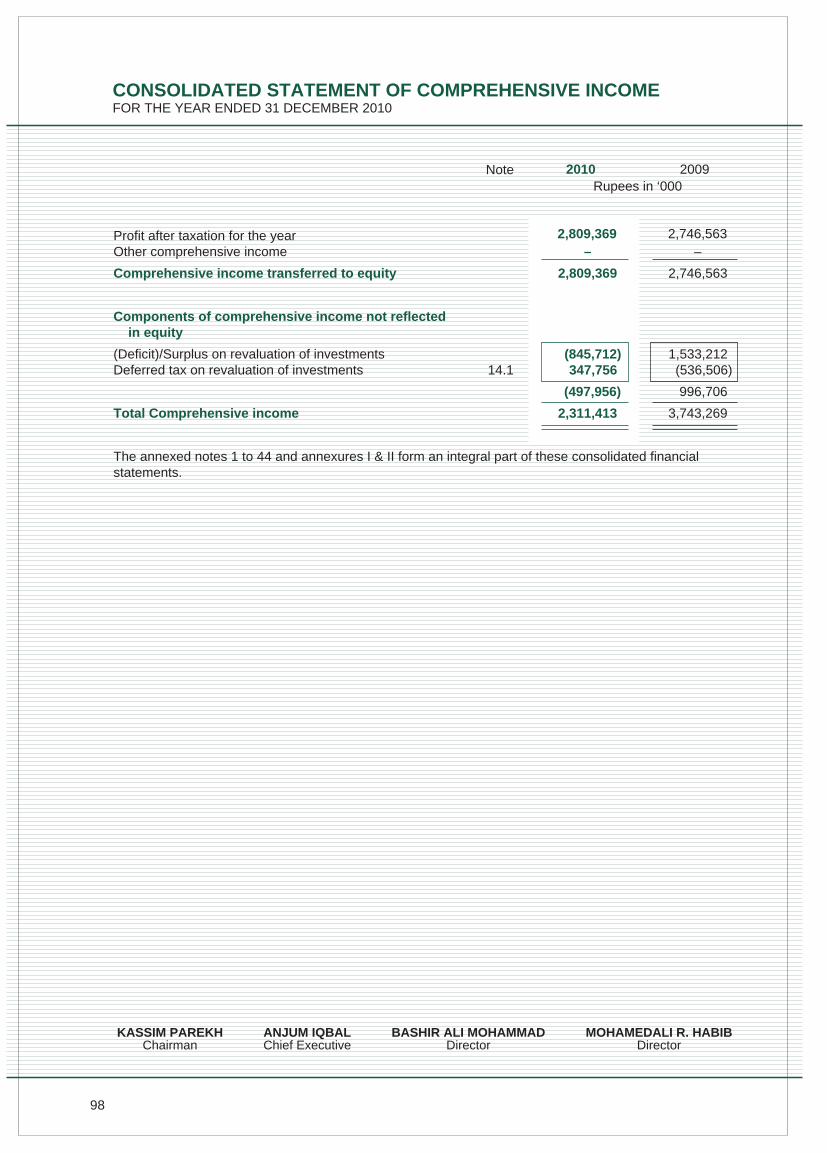
Profit after taxation for the yearOther comprehensive income – –
Comprehensive income transferred to equity 2,809,369 2,746,563
Components of comprehensive income not reflected in equity
(Deficit)/Surplus on revaluation of investments (845,712) 1,533,212Deferred tax on revaluation of investments 14.1 347,756 (536,506)
(497,956) 996,706
Total Comprehensive income 2,311,413 3,743,269
The annexed notes 1 to 44 and annexures I & II form an integral part of these consolidated financialstatements.
2010 2009Rupees in ‘000
2,746,5632,809,369
CONSOLIDATED STATEMENT OF COMPREHENSIVE INCOMEFOR THE YEAR ENDED 31 DECEMBER 2010
Note
KASSIM PAREKHChairman
ANJUM IQBALChief Executive
BASHIR ALI MOHAMMADDirector
MOHAMEDALI R. HABIBDirector
99
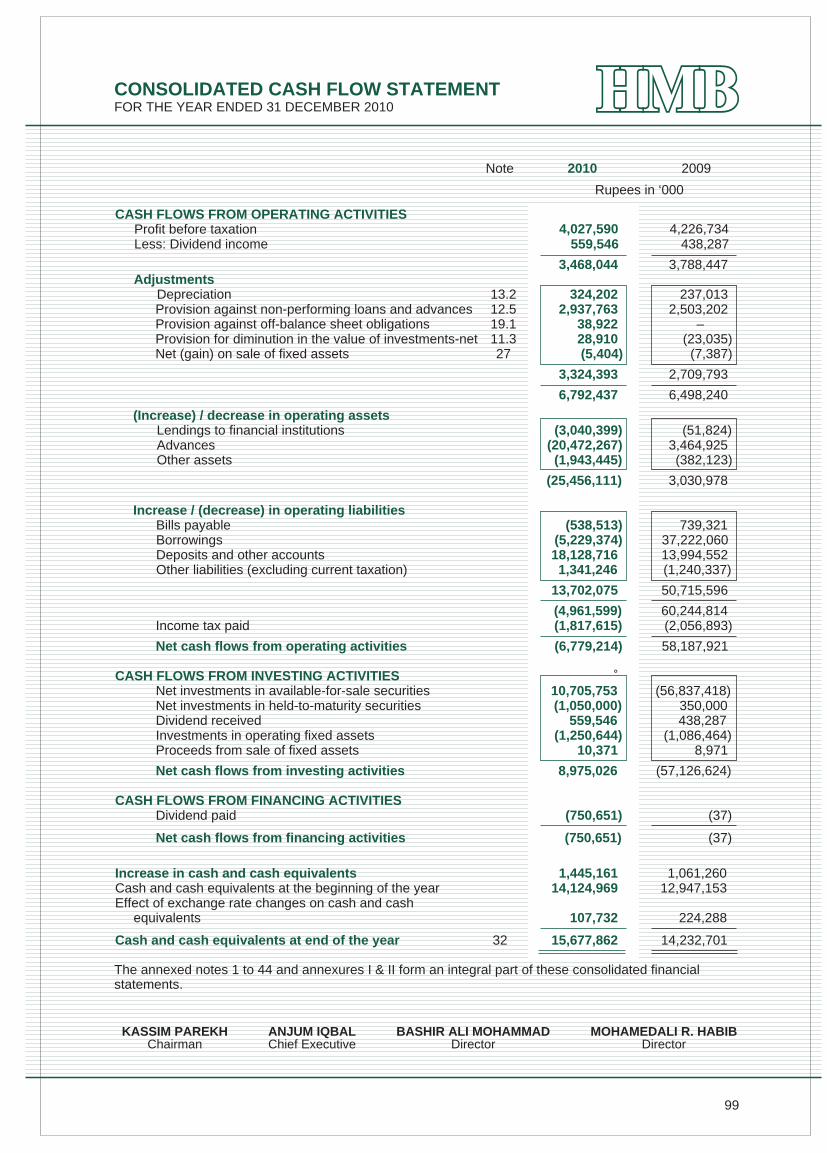
CASH FLOWS FROM OPERATING ACTIVITIESProfit before taxationLess: Dividend income 559,546 438,287
3,468,044 3,788,447Adjustments
Depreciation 13.2 324,202 237,013Provision against non-performing loans and advances 12.5 2,937,763 2,503,202Provision against off-balance sheet obligations 19.1 38,922 –Provision for diminution in the value of investments-net 11.3 28,910 (23,035)Net (gain) on sale of fixed assets 27 (5,404) (7,387)
3,324,393 2,709,793
6,792,437 6,498,240
(Increase) / decrease in operating assetsLendings to financial institutions (3,040,399) (51,824)Advances (20,472,267) 3,464,925Other assets (1,943,445) (382,123)
(25,456,111) 3,030,978
Increase / (decrease) in operating liabilitiesBills payable (538,513) 739,321Borrowings (5,229,374) 37,222,060Deposits and other accounts 18,128,716 13,994,552Other liabilities (excluding current taxation) 1,341,246 (1,240,337)
13,702,075 50,715,596
(4,961,599) 60,244,814Income tax paid (1,817,615) (2,056,893)
Net cash flows from operating activities (6,779,214) 58,187,921
CASH FLOWS FROM INVESTING ACTIVITIES Net investments in available-for-sale securities 10,705,753 (56,837,418)Net investments in held-to-maturity securities (1,050,000) 350,000Dividend received 559,546 438,287Investments in operating fixed assets (1,250,644) (1,086,464)Proceeds from sale of fixed assets 10,371 8,971
Net cash flows from investing activities 8,975,026 (57,126,624)
CASH FLOWS FROM FINANCING ACTIVITIESDividend paid (750,651) (37)
Net cash flows from financing activities (750,651) (37)
Increase in cash and cash equivalents 1,445,161 1,061,260Cash and cash equivalents at the beginning of the year 14,124,969 12,947,153Effect of exchange rate changes on cash and cash equivalents 107,732 224,288
Cash and cash equivalents at end of the year 32 15,677,862 14,232,701
The annexed notes 1 to 44 and annexures I & II form an integral part of these consolidated financialstatements.
2010 2009
Rupees in ‘000
Note
4,226,7344,027,590
CONSOLIDATED CASH FLOW STATEMENTFOR THE YEAR ENDED 31 DECEMBER 2010
KASSIM PAREKHChairman
ANJUM IQBALChief Executive
BASHIR ALI MOHAMMADDirector
MOHAMEDALI R. HABIBDirector
100
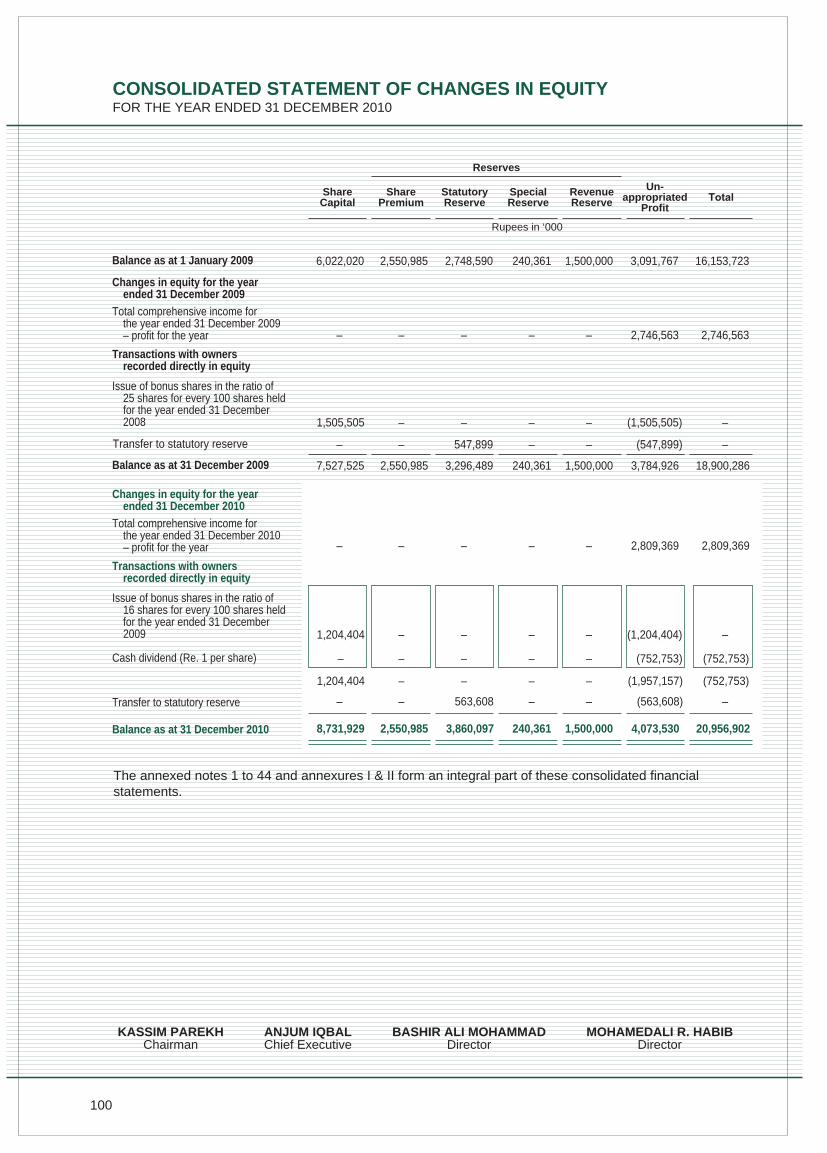
CONSOLIDATED STATEMENT OF CHANGES IN EQUITYFOR THE YEAR ENDED 31 DECEMBER 2010
The annexed notes 1 to 44 and annexures I & II form an integral part of these consolidated financialstatements.
ShareCapital
SharePremium
StatutoryReserve
SpecialReserve
RevenueReserve
Un-appropriated
Profit
Rupees in ‘000
Balance as at 1 January 2009 6,022,020 2,748,590 240,361 1,500,000 3,091,767 16,153,7232,550,985
Reserves
Transfer to statutory reserve – – (547,899)–– 547,899 –
7,527,525 3,296,489 240,361 1,500,000 3,784,926 18,900,2862,550,985
– – (563,608)–– 563,608 –
Changes in equity for the yearended 31 December 2009
Transactions with ownersrecorded directly in equity
Issue of bonus shares in the ratio of25 shares for every 100 shares heldfor the year ended 31 December2008
Balance as at 31 December 2009
Total comprehensive income forthe year ended 31 December 2009– profit for the year
Changes in equity for the yearended 31 December 2010
Transactions with ownersrecorded directly in equity
Issue of bonus shares in the ratio of16 shares for every 100 shares heldfor the year ended 31 December2009
Cash dividend (Re. 1 per share)
Transfer to statutory reserve
Total comprehensive income forthe year ended 31 December 2010– profit for the year
Balance as at 31 December 2010 8,731,929 3,860,097 240,361 1,500,000 4,073,530 20,956,9022,550,985
–– – – 2,746,563– 2,746,563
– – (1,505,505)–1,505,505 ––
–– – – 2,809,369– 2,809,369
– – (1,204,404)–1,204,404 ––
– – (752,753)–– – (752,753)
– – (1,957,157)–1,204,404 – (752,753)
KASSIM PAREKHChairman
ANJUM IQBALChief Executive
BASHIR ALI MOHAMMADDirector
MOHAMEDALI R. HABIBDirector
101
NOTES TO THE CONSOLIDATEDFINANCIAL STATEMENTSFOR THE YEAR ENDED 31 DECEMBER 2010
1. STATUS AND NATURE OF BUSINESS
1.1 The Group comprises of Habib Metropolitan Bank Limited (holding company) and HabibMetropolitan Financial Services Limited (wholly owned subsidiary company). The Group is
engaged in providing Commercial Banking and Brokerage Services.
1.2 Habib Metropolitan Bank Limited (the Bank) was incorporated in Pakistan on 3 August 1992as a public limited company, under the Companies Ordinance, 1984 and is engaged in commercialbanking and related services. Its shares are listed on all the three stock exchanges in Pakistan.The Bank operates 135 (2009: 120) branches including 4 (2009: 4) Islamic banking branchesand 8 (2009: 2) sub-branches in Pakistan. The Bank is a subsidiary of Habib Bank AG Zurich- Switzerland (the holding company) which is incorporated in Switzerland. The registered officeof the Bank is situated at Spencer's Building, I.I. Chundrigar Road, Karachi.
1.3 Habib Metropolitan Financial Services Limited (the Company) was incorporated in Pakistan on28 September 2007 as a public limited company under the Companies Ordinance, 1984. TheCompany is a wholly owned subsidiary of Habib Metropolitan Bank Limited (the holding company).The registered office of the Company is located at 1st Floor, GPC 2, Block 5, Khekashan Clifton,Karachi. The Company is a corporate member of the Karachi Stock Exchange (Guarantee)Limited and engaged in equity brokerage services.
2. BASIS OF PRESENTATION
2.1 These consolidated financial statements comprise the financial statements of the bank and itssubsidiary company. The financial statements of the subsidiary company have been preparedfor the same reporting year as the bank using consistent accounting policies. The assets,liabilities, income and expenses of the subsidiary company have been consolidated on a lineby line basis. Intra-group balances and transactions have been eliminated for the purpose of
consolidation.
2.2 In accordance with the directives of the Federal Government regarding shifting of the bankingsystem to Islamic modes, the SBP has issued various circulars from time to time. Permissibleforms of trade-related modes of financing include purchase of goods by the Bank from theircustomers and immediate resale to them at appropriate mark-up in price on a deferred paymentbasis. The purchases and sales arising under these arrangements are not reflected in theseConsolidated financial statements as such but are restricted to the amount of facility actuallyutilized and the appropriate portion of mark-up thereon.
2.3 Basis of measurement
These consolidated financial statements have been prepared under the historical cost conventionexcept that certain investments are stated at market value and derivative financial instrumentsare carried at fair values as disclosed in notes 5.3 and 5.6 respectively.
3. STATEMENT OF COMPLIANCE
3.1 These consolidated financial statements have been prepared in accordance with approvedaccounting standards as applicable in Pakistan. Approved accounting standards comprise ofsuch International Financial Reporting Standards (IFRS) issued by the International AccountingStandards Board (IASB) and Islamic Financial Accounting Standard (IFAS) issued by the
102
4. CRITICAL ACCOUNTING JUDGEMENTS AND KEY SOURCES OF ESTIMATION UNCERTAINTY
The preparation of consolidated financial statements in conformity with the approved accountingstandards requires the use of certain critical accounting estimates. It also requires the managementto exercise its judgment in the process of applying the Group's accounting policies. Estimates andjudgments are continually evaluated and are based on historical experience, including expectationsof future events that are believed to be reasonable under the circumstances. The areas where variousassumptions and estimates are significant to the Group's financial statements or where judgment wasexercised in application of accounting policies are as follows:
i) Classification of investments
- In classifying investments as "held-for-trading" the Group has determined securities whichare acquired with the intention to trade by taking advantage of short term market / interestrate movements and are to be sold within 90 days.
- In classifying investments as "held-to-maturity" the Group follows the guidance provided inSBP circulars on classifying non-derivative financial assets with fixed or determinablepayments and fixed maturity. In making this judgment, the Group evaluates its intention andability to hold such investments to maturity.
- The investments which are not classified as held for trading or held to maturity are classifiedas available for sale.
ii) Provision against non performing loans and advances and debt securities classified as investments
The Group reviews its loan portfolio and debt securities classified as investments to assessamount of non-performing loans and advances and debt securities and provision required there-against. While assessing this requirement various factors including the delinquency in theaccount, financial position of the borrower and the forced sale value of the securities etc. asper the requirement of the Prudential Regulations are considered. For portfolio impairmentprovision on consumer advances, the Bank follows the general provision requirement set outin Prudential Regulations. In addition the Bank also maintain a general provision against itsloan portfolio discussed in note 5.4.
Institute of Chartered Accountants of Pakistan (ICAP) as are notified under the CompaniesOrdinance, 1984, provisions of and directives issued under the Companies Ordinance, 1984and Banking Companies Ordinance, 1962 and the directives issued by the State Bank ofPakistan. In case the requirements differ, the provisions of and directives issued under theCompanies Ordinance, 1984 and Banking Companies Ordinance, 1962 and the directivesissued by SBP shall prevail.
3.2 The SBP vide BSD Circular No. 10, dated 26 August 2002 has deferred the applicability ofInternational Accounting Standard 39, Financial Instruments: Recognition and Measurement(IAS 39) and International Accounting Standard 40, Investment Property for banking companiestill further instructions. Further, according to a notification of the Securities and ExchangeCommission of Pakistan (SECP) dated 28 April 2008, IFRS 7 "Financial Instruments: Disclosures"has not been made applicable for banks. Accordingly, the requirements of these standardshave not been considered in the preparation of these consolidated financial statements. However,investments have been classified and valued in accordance with the requirements of variouscirculars issued by the SBP.
103
v) Income taxes
In making the estimates for income taxes currently payable by the Group, the managementlooks, at the current income tax laws and the decisions of appellate authorities on certain issuesin the past. In making the provision for deferred taxes, estimates of the Group's future taxableprofits are taken into account.
vi) Fixed assets, depreciation and amortisation
In making estimates of the depreciation / amortisation method, the management uses methodwhich reflects the pattern in which economic benefits are expected to be consumed by theGroup. The method applied is reviewed at each financial year end and if there is a change inthe expected pattern of consumption of the future economic benefits embodied in the assets,the method would be changed to reflect the change in pattern. Such change is accounted foras change in accounting estimates in accordance with International Accounting Standard - 8,"Accounting Policies, Changes in Accounting Estimates and Errors".
vii) Defined benefits plan
Liability is determined on the basis of actuarial advice using the Projected Unit Credit Method,as more fully disclosed in note 34 to these consolidated financial statements.
5. SUMMARY OF SIGNIFICANT ACCOUNTING POLICIES
The accounting policies adopted in the preparation of these consolidated financial statements are thesame as those applied in the preparation of the consolidated financial statements of the Bank for theyear ended 31 December 2009.
iii) Valuation and impairment of available-for-sale equity investments
The Group determines that available-for-sale equity investments as impaired when there hasbeen a significant or prolonged decline in the fair value below its cost. This determination ofwhat is significant or prolonged requires judgment. In making this judgment, the Group evaluatesamong other factors, the normal volatility in share price. In addition, impairment may beappropriate when there is evidence of deterioration in the financial health of the investee,industry and sector performance, changes in technology and operational and financing cashflows.
iv) Impairment of non-financial assets (excluding deferred tax asset)
Non financial assets are subject to impairment review if there are events or changes incircumstances that indicate that the carrying amount may not be recoverable. If any suchindication exists, the Group estimates the recoverable amount of the asset and the impairmentloss, if any. The recoverable amount of an asset is the higher of its fair value less costs to selland its value in use. Value in use is the present value of future cash flows from the assetdiscounted at a rate that reflects market interest rates adjusted for risks specific to the asset.If the recoverable amount of an intangible or tangible asset is less than its carrying value, animpairment loss is recognised immediately in the profit and loss account and the carrying valueof the asset reduced by the amount of the loss. A reversal of an impairment loss on intangibleassets is recognized as it arises provided the increased carrying value does not exceed thatwhich it would have been had no impairment loss been recognized.
104
5.1 Cash and cash equivalents
For the purpose of cash flow statement, cash and cash equivalents include cash and balanceswith treasury banks and balances with other banks less overdrawn nostro and local bankaccounts.
5.2 Lendings to / borrowings from financial institutions
The Group enters into transactions of borrowing (re-purchase) from and lending (reverse re-purchase) to financial institutions, at contracted rates for a specified period of time. These arerecorded as under:
Sale under repurchase obligation
Securities sold with a simultaneous commitment to repurchase at a specified future date (repos)continue to be recognised in the balance sheet and are measured in accordance with accountingpolicies for investments and counter party liability is included in borrowing from financialinstitutions. The difference between sale and repurchase price is amortised as an expense overthe term of the repo agreement.
Purchase under resale obligation
Securities purchased with a corresponding commitment to resell at a specified future date(reverse repos) are not recognised in the balance sheet and instead amounts paid under thesearrangements are included in lendings to financial institutions. The difference between purchaseand resale price is accrued as income over the term of the agreement.
Other borrowings including borrowings from SBP are recorded at the proceeds received. Markup on such borrowing is charged to the profit and loss account on a time proportion basis.
5.3 Investments
5.3.1 Investments are classified as follows:
Held-for-trading
These are securities, which are either acquired for generating profit from short-termfluctuation in market prices, interest rate movements, dealers margin or are securitiesincluded in a portfolio in which a pattern of short-term trading exists.
Held-to-maturity
These are securities with fixed or determinable payments and fixed maturities that areheld with the positive intention and ability to hold till maturity.
Available-for-sale
These are investments that do not fall under the held-for-trading or held-to-maturitycategories.
5.3.2 Investments (other than held-for-trading) include transaction costs associated with theinvestments. In case of held for trading investments transaction costs are expensed inthe profit and loss account.
In accordance with the requirements of the State Bank of Pakistan, quoted securities,other than those classified as held to maturity are carried at market value. Investmentsclassified as held to maturity are carried at amortized cost whereas investment in asubsidiary is carried at cost less impairment losses, if any.
105
Unrealized surplus / (deficit) arising on the revaluation of the Group’s held for tradinginvestment portfolio is taken to the profit and loss account. Surplus / (deficit) arising onrevaluation of quoted securities classified as available for sale is kept in a separateaccount shown in the balance sheet below equity. Surplus / (deficit) arising on thesesecurities is taken to the profit and loss account when actually realised upon disposalor when the investment is considered to be impaired.
Unquoted equity securities are valued at the lower of cost and break-up value. Subsequentdecreases in the carrying value are charged to profit and loss account. Break-up valueof equity securities is calculated with reference to the net assets of the investee companyas per the latest available audited financial statements. Investments in other unquotedsecurities are valued at cost less impairment losses, if any.
Provision for diminution in the value of securities (other than Bonds and term financecertificates) is made after considering objective evidence of impairment, if any, in theirvalue. Provision for diminution in value of Bonds and term finance certificates are madein accordance with the requirements of Prudential Regulations issued by State Bank ofPakistan.
All “regular way” purchases and sales of investments are recognized on the trade date,i.e., the date that the Group commits to purchase or sell the asset. Regular way purchasesor sales are purchases or sales of investments that require delivery of assets within thetime frame generally established by regulation or convention in the market place.
5.4 Advances (including net investment in finance lease and ijarah arrangements)
Loans and advances
Loans and advances and net investments in finance lease are stated net of provision for loanlosses against non - performing advances. Provision for loan losses is made in accordancewith the Prudential Regulations issued by the SBP and is charged to profit and loss account.The Bank also maintains general provision in addition to the requirements of the PrudentialRegulations on the basis of management's assessment of credit risk characteristics and generalbanking risk such as nature of credit, collateral type, industry sector and other relevant factors.Murabaha receivables are stated at gross amount receivable less deferred income andprovisions, if any.
Finance lease receivables
Leases, where the Bank transfers substantially all the risks and rewards incidental to ownershipof an asset to the lessee are classified as finance lease. A receivable is recognised at an amountequal to the present value of the minimum lease payments including guaranteed residual value,if any. Finance lease receivables are included in advances to the customers.
Ijarah
In accordance with the requirements of Islamic Financial Accounting Standard (IFAS) No. 2for the accounting and financial reporting of “Ijarah”, Ijarah arrangements by the Islamic Bankingbranches are accounted for as 'Assets held under Ijarah' and are stated at cost less accumulateddepreciation, residual value and impairment losses, if any. Accordingly assets subject to Ijarahs
106
have been reflected in note 12 to these consolidated financial statements under “Advances”.Rental income on these Ijarahs is recognised in the Bank's profit and loss account on a timeproportion basis, while depreciation is calculated on Ijarah assets on a straight line basis overthe period of Ijarah from the date of delivery of respective assets to mustajir (lessee) up to thedate of maturity / termination of Ijarah agreement and is charged to the profit and loss account.The classification and provisioning of Ijarah assets is done in line with the requirements laiddown in the prudential regulations and are recognised in the profit and loss account.
Advances are written off when there are no realistic prospects of recovery.
5.5 Fixed assets
Tangible - Owned (operating)
These are stated at cost less accumulated depreciation and accumulated impairment losses,if any, except for land which are stated at cost less accumulated impairment losses, if any.
Depreciation is calculated on a straight-line basis over the estimated useful life of the asset atthe rates specified in note 13.2. Depreciation on additions during the year is charged from thedate of addition. In case of disposals during the year, the depreciation is charged up till thedate of disposal. Depreciation on Ijarah assets referred to in note 12.10 is calculated on astraight line basis over the period of Ijarah from the date of delivery of respective assets to themustajir (lessee) up to the date of maturity / termination of ijarah agreed.
Subsequent cost are included in the asset's carrying amount only when it is probable that futureeconomic benefits associated with the item will flow to the Bank and the cost of the item canbe measured reliably. All other repairs and maintenance are charged to the profit and lossaccount.
An item of property and equipment is derecognized upon disposal or when no future economic
benefits are expected from its use or disposal. Any gain or loss arising on derecognition of theasset is recognized in the profit and loss account in the year the asset is derecognized.
The residual values, useful lives and depreciation methods are reviewed and changes, if any,are treated as change in accounting estimates, at each balance sheet date.
Gain and loss on disposal of assets is included in income currently.
Intangible
These are stated at cost less accumulated amortization and impairment, if any. The cost ofintangible assets are amortized from the month when the assets are available for intended use,using the straight line method, whereby the cost of the intangible asset is amortised over itsestimated useful life over which economic benefits are expected to flow to the Bank. The usefullife and amortisation method is reviewed and adjusted, if appropriate, at each balance sheetdate.
Capital work-in-progress
These are stated at cost less impairment losses, if any.
107
5.6 Derivative financial instruments
Derivative financial instruments are initially recognised at their fair value on the date on whichthe derivative contract is entered into and are subsequently remeasured at fair value. Allderivative financial instruments are carried as asset when fair value is positive and liabilitieswhen fair value is negative. Any change in the value of derivative financial instruments is takento the profit and loss account.
5.7 Provisions
Provision against identified non-funded losses is recognized when intimated and reasonablecertainty exists for the Bank to settle the obligation. The loss is charged to the profit and lossaccount net of expected recovery and is classified under other liabilities.
Other provisions are recognised when the Bank has a legal or constructive obligation as a resultof past events and it is probable that an outflow of resources will be required to settle theobligation and a reliable estimate of the amount can be made. Provisions are reviewed at eachbalance sheet date and are adjusted to reflect the current best estimate.
5.8 Taxation
Income tax expense comprises current and deferred tax. Income tax expense is recognizedin the profit and loss account except to the extent that it relates to the items recognized directlyin equity, in which case it is recognized in equity.
Current
Provision for current taxation is based on taxable income for the year at the current rates oftaxation after taking into consideration available tax credits and rebates. The charge for thecurrent tax also includes adjustments where considered necessary, relating to prior years whicharise from assessments framed / finalized during the year.
Deferred
Deferred tax is recognised using the balance sheet liability method on all major temporarydifferences between the carrying amounts of assets and liabilities for financial reporting purposesand amount used for taxation purposes. Deferred tax is measured at the tax rate that areexpected to be applied on the temporary differences when they reverse, based on the tax ratesthat have been enacted or substantially enacted at the reporting date.
A deferred tax asset is recognised only to the extent that it is probable that the future taxableprofit will be available against which the asset can be utilised. Deferred tax assets are reducedto the extent that it is no longer probable that the related tax benefit will be realised.
The Group also recognises deferred tax asset / liability on deficit / surplus on revaluation ofassets which is adjusted against the related deficit / surplus in accordance with the requirementsof IAS 12 ''Income Taxes''.
5.9 Employees' benefits
5.9.1 Retirement benefits
Defined benefit plan
The Bank operates an approved funded gratuity scheme for all its permanent employees.Retirement benefits are payable to the members of the scheme on the completion ofprescribed qualifying period of service under the scheme. Contribution is made inaccordance with the actuarial recommendation. The actuarial valuation is carried out
108
annually as at the balance sheet date using "Projected Unit Credit Method". Acturialgains and losses arising from experience adjustments and changes in acturial assumptionsin excess of the greater of 10% of the value of plan assets or 10% of the defined benefitobligation at the end of the last reporting year are recognised in income overthe employees' expected average remaining working lives.
Past service cost resulting from changes to defined benefit plan to the extent the benefitsare already vested is recognized immediately in the profit and loss account and remainingunrecognized past service cost is recognized as an expense on a straight line basis overthe average period untill the benefits become vested.
Defined contribution plan
The Bank operates a recognised provident fund scheme for all its regular employees,which is administered by the Board of Trustees. Contributions are made by the Bankand its employees, to the fund at the rate of 10% of basic salary.
5.9.2 Other benefits
Employee compensated absences
Employees' entitlement to annual leave is recognised when they accrue to employees.A provision is made for estimated liability for annual leaves as a result of services renderedby the employees against unavailed leaves, as per term of service contract, up to balancesheet date.
5.10 Revenue recognition
Revenue is recognized to the extent that the economic benefits will flow to the Group and therevenue can be reliably measured. These are recognized as follows:
a) Advances and investments
Mark-up / return on regular loans / advances and debt security investments is recognizedon a time proportion basis that take in the account the effective yield on the asset. Wheredebt securities are purchased at premium or discount, the same is amortized throughthe profit and loss account using the effective interest rate method.
Interest or mark-up recoverable on classified loans and advances and investments isrecognized on receipt basis. Interest / return / mark-up on classified rescheduled /restructured loans and advances and investments is recognized as permitted by theregulations of the State Bank of Pakistan.
Dividend income is recognised when the Group’s right to receive the dividend is established.
Gains and losses on sale of investments are recognized in the profit and loss account.
Income on bills discounted are recognised over the period of the bill.
b) Lease financing / Ijarah contracts
Financing method is used in accounting for income from lease financing. Under thismethod, the unearned lease income (excess of the sum of total lease rentals andestimated residual value over the cost of leased assets) is deferred and taken to incomeover the term of the lease period so as to produce a constant periodic rate of return onthe outstanding net investment in lease. Unrealised income on classified leases isrecognized on receipt basis.
109
Rental income on Ijarahs executed by the Islamic Banking branches and accounted forIFAS 2 (refer note 5.4) is recognised in the profit and loss account on a time proportionbasis.
Gains / losses on termination of lease contracts and other lease income are recognizedwhen realized.
c) Fees, brokerage and commission
Fees, commission and brokerage except income from letters of guarantee is accountedfor on receipt basis. Income from letter of guarantee is recognised on an accrual basisover the period of the guarnatee.
5.11 Off setting
Financial assets and financial liabilities are set off and the net amount is reported in the financialstatements when there is a legally enforceable right to set off and the Group intends to eithersettle on a net basis, or to realize the assets and to settle the liabilities simultaneously.
5.12 Foreign currencies
Foreign currency transactions are translated into local currency at the exchange rates prevailingon the date of transaction. Monetary assets and liabilities in foreign currencies are translatedinto rupees at the exchange rates prevailing at the balance sheet date. Forward exchangecontracts including foreign exchange bills purchased, are revalued using forward exchangerates applicable to their respective remaining maturities. Exchange gains or losses are includedin income currently.Commitments for outstanding forward foreign exchange contracts disclosedin these financial statements are translated at contracted rates. Contingent liabilities/commitmentsfor letters of credit and letters of guarantee denominated in foreign currencies are expressedin rupee terms at the rates of exchange ruling on the balance sheet date.
5.13 Segment reporting
A segment is a distinguishable component of the Group that is engaged in providing productor services (business segment), or in providing products or services within a particular economicenvironment (geographical segment), which is subject to risks and rewards that are differentfrom those of other segments. The Group's primary format of reporting is based on businesssegments.
Business segments
a) Trading and sales
This segment undertakes the Group’s treasury, money market and capital market activities.
b) Retail banking
Retail banking provides services to small borrowers i.e. consumers, small and mediumenterprises (SMEs) and borrowers’ agriculture sector. It includes loans, deposits andother transactions with retail customers.
c) Commercial banking
This includes loans, deposits and other transactions with corporate/commercial customers.
110
Geographical segments
The Group conducts all its operations in Pakistan.
5.14 Dividend distribution and appropriations
Bonus and cash dividend and other appropriations (except for the appropriations required bylaw), declared / approved subsequent to balance sheet date are considered as non-adjustingevent and are not recorded in unconsolidated financial statements of the current year. Theseare recognized in the period in which these are declared / approved.
5.15 Earnings per share
The Group presents basic and diluted earnings per share (EPS) data for its ordinary shares.Basic EPS is calculated by dividing the profit or loss attributable to ordinary shareholders ofthe Group by the weighted average number of ordinary shares outstanding during the period.Diluted EPS is determined by adjusting the profit or loss attributable to ordinary shareholdersand the weighted average number of ordinary shares outstanding for the effects of all dilutivepotential ordinary shares.
5.16 Impairment (Other than loans & advances and investments)
At each balance sheet date, the Group reviews the carrying amount of its assets (other thandeferred tax asset) to determine whether there is an indication that those assets have suffered an impairment loss. If any such indication exists, the recoverable amount of relevant asset isestimated. Recoverable amount is the greater of the net selling price and value in use. If therecoverable amount of an asset is estimated to be less than its carrying amount, the carryingamount of the assets is reduced to its recoverable amount. The resulting impairment loss isrecognized as an expense immediately. An impairment loss is reversed if the reversal can beobjectively related to an event occuring after the impairment loss was recognised.
Details of the basis of determination of impairment against loans & advances and investmentshave been discussed in their respective notes.
5.17 Financial instruments
All financial assets and liabilities are recognized at the time when the Group becomes a partyto the contractual provisions of the instrument. Financial assets are derecognized when theGroup loses control of the contractual rights that comprise the financial assets. Financial liabilitiesare derecognized when they are extinguished i.e. when the obligation specified in the contractis discharged, cancelled or expired. Any gain or loss on derecognition of the financial assetsand financial liabilities is taken to income directly. Financial assets carried on the balance sheetinclude cash and bank balances, lendings to financial institutions, investments, advances andcertain receivables. Financial liabilities include borrowings, deposits, bills payable and otherpayables. The particular recognition methods adopted for significant financial assets and financialliabilities are disclosed in the individual policy statements associated with them.
5.18 Murabaha
Murabaha transactions are reflected as receivable at the invoiced amount. Actual sale andpurchase are not reflected as the goods are purchased by the customer as agent of the Groupand all documents relating to purchase belongs to the customer. However, the profit on thatsale revenue not due for payment is deferred by recording a credit to the "Deferred MurahabaIncome" account. Funds disbursed under Murhaba arrangements for purchase of goods arerecorded as ‘Advance against Murabaha’.
111
5.19 Diminishing Musharaka
In Diminishing Musharakah based financing, the Group enters into a Musharakah based onShirkat-ul-milk for financing an agreed share of fixed asset (e.g. house, land, plant or machinery)with its customers and enters into period profit payment agreement for the utilization of theGroup's Musharakah share by the customer.
6. STANDARDS, INTERPRETATIONS AND AMENDMENTS TO PUBLISHED APPROVEDACCOUNTING STANDARDS THAT ARE NOT YET EFFECTIVE
The following standards, amendments and interpretations of approved accounting standards will beeffective for accounting periods beginning on or after 1 January 2011.
- Amendment to IAS 32 Financial Instruments: Presentation – Classification of Rights Issues(effective for annual periods beginning on or after February 01, 2010). The IASB amended IAS32 to allow rights, options or warrants to acquire a fixed number of the entity’s own equityinstruments for a fixed amount of any currency to be classified as equity instruments providedthe entity offers the rights, options or warrants pro rata to all of its existing owners of the sameclass of its own non-derivative equity instruments. This amendment has no impact on theGroup's financial statements.
- IFRIC 19 Extinguishing Financial Liabilities with Equity Instruments (effective for annual periodsbeginning on or after July 01, 2010). This interpretation provides guidance on the accountingfor debt for equity swaps. This interpretation has no impact on Group's financial statements.
- IAS 24 Related Party Disclosures (revised 2009) – effective for annual periods beginning onor after January 01, 2011. The revision amends the definition of a related party and modifiescertain related party disclosure requirements for government-related entities. The amendmentwill result in certain changes in disclosures.
- Amendments to IFRIC 14 IAS 19 – The Limit on a Defined Benefit Assets, Minimum FundingRequirements and their Interaction (effective for annual periods beginning on or after January01, 2011). These amendments remove unintended consequences arising from the treatmentof prepayments where there is a minimum funding requirement. These amendments result inprepayments of contributions in certain circumstances being recognised as an asset rather thanan expense. This amendment is not likely to have any impact on Group's financial statements.
- Improvements to IFRSs 2010 – In May 2010, the IASB issued improvements to IFRSs 2010,which comprise of 11 amendments to 7 standards. Effective dates, early application andtransitional requirements are addressed on a standard by standard basis. The majority ofamendments are effective for annual periods beginning on or after January 1, 2011. Theamendments include list of events or transactions that require disclosure in the interim financialstatements and fair value of award credits under the customer loyalty programmes to take intoaccount the amount of discounts or incentives that otherwise would be offered to customersthat have not earned the award credits. Certain of these amendments will result in increaseddisclosures in the financial statements.
- Amendments to IAS 12 – deferred tax on investment property (effective for annual periodsbeginning on or after January 1, 2012). The 2010 amendment provides an exception to themeasurement principle in respect of investment property measured using the fair value modelin accordance with IAS 40 Investment Property. The amendment has no impact on the Group'sfinancial statements.
7. FUNCTIONAL AND PRESENTATION CURRENCY
These consolidated financial statements are presented in Pakistani Rupees, which is Group'sfunctional currency. Except as indicated, financial information presented in Pakistani Rupeeshas been rounded to nearest thousand.
112
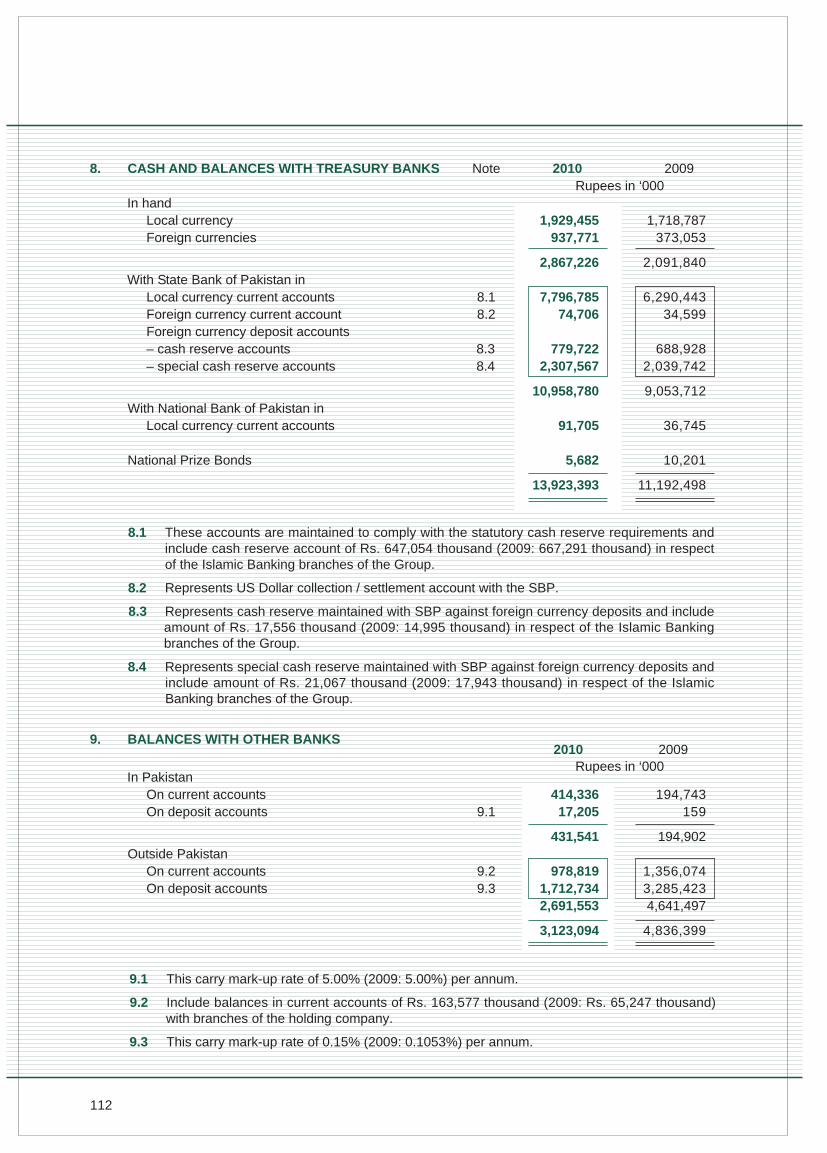
8. CASH AND BALANCES WITH TREASURY BANKS 2010 2009 Rupees in ‘000In hand
Local currency 1,929,455 1,718,787Foreign currencies 937,771 373,053
2,867,226 2,091,840With State Bank of Pakistan in
Local currency current accounts 8.1 7,796,785 6,290,443Foreign currency current account 8.2 74,706 34,599Foreign currency deposit accounts– cash reserve accounts 8.3 779,722 688,928– special cash reserve accounts 8.4 2,307,567 2,039,742
10,958,780 9,053,712With National Bank of Pakistan in
Local currency current accounts 91,705 36,745
National Prize Bonds 5,682 10,201
13,923,393 11,192,498
8.1 These accounts are maintained to comply with the statutory cash reserve requirements andinclude cash reserve account of Rs. 647,054 thousand (2009: 667,291 thousand) in respectof the Islamic Banking branches of the Group.
8.2 Represents US Dollar collection / settlement account with the SBP.
8.3 Represents cash reserve maintained with SBP against foreign currency deposits and includeamount of Rs. 17,556 thousand (2009: 14,995 thousand) in respect of the Islamic Bankingbranches of the Group.
8.4 Represents special cash reserve maintained with SBP against foreign currency deposits andinclude amount of Rs. 21,067 thousand (2009: 17,943 thousand) in respect of the IslamicBanking branches of the Group.
9. BALANCES WITH OTHER BANKS
In PakistanOn current accounts 414,336 194,743On deposit accounts 9.1 17,205 159
431,541 194,902Outside Pakistan
On current accounts 9.2 978,819 1,356,074On deposit accounts 9.3 1,712,734 3,285,423
2,691,553 4,641,497
3,123,094 4,836,399
2010 2009Rupees in ‘000
9.1 This carry mark-up rate of 5.00% (2009: 5.00%) per annum.
9.2 Include balances in current accounts of Rs. 163,577 thousand (2009: Rs. 65,247 thousand)with branches of the holding company.
9.3 This carry mark-up rate of 0.15% (2009: 0.1053%) per annum.
Note
113
2010 2009Rupees in ‘000
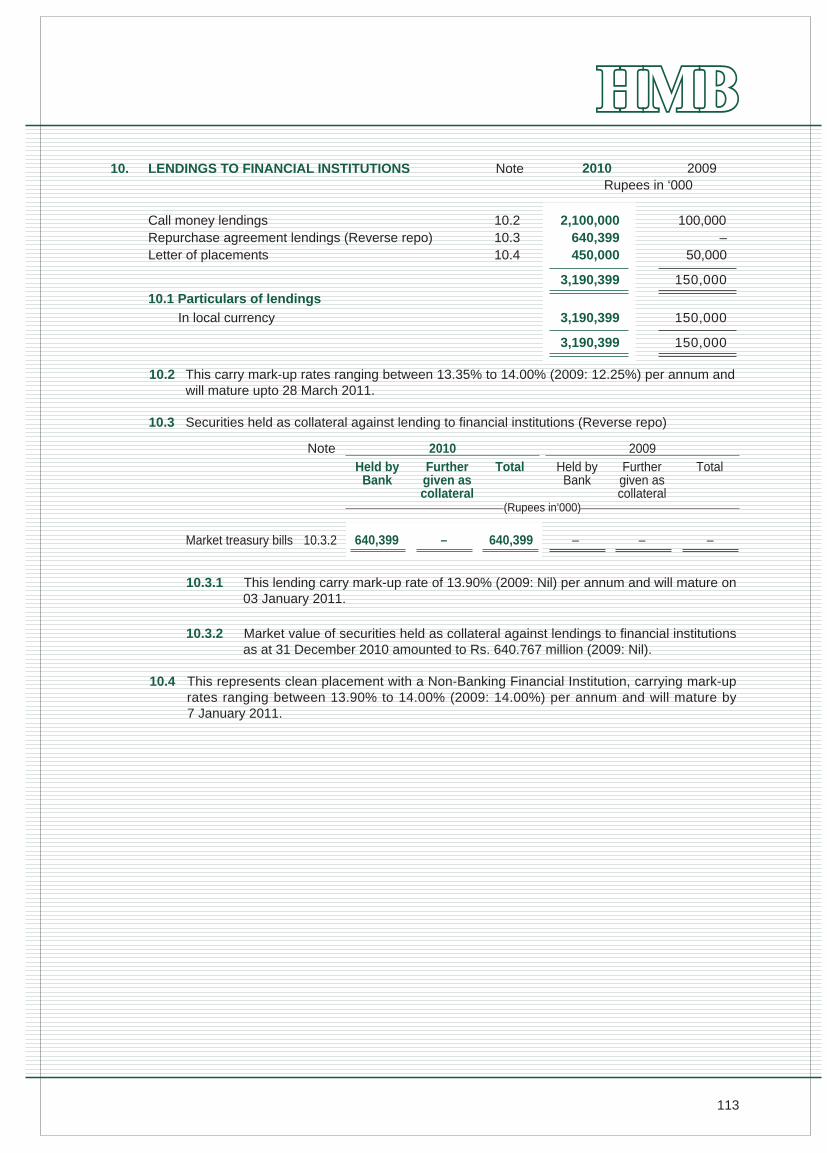
10. LENDINGS TO FINANCIAL INSTITUTIONS
Call money lendings 10.2 2,100,000 100,000Repurchase agreement lendings (Reverse repo) 10.3 640,399 –Letter of placements 10.4 450,000 50,000
3,190,399 150,000
10.1 Particulars of lendings
In local currency 3,190,399 150,000
3,190,399 150,000
10.2 This carry mark-up rates ranging between 13.35% to 14.00% (2009: 12.25%) per annum andwill mature upto 28 March 2011.
10.3 Securities held as collateral against lending to financial institutions (Reverse repo)
10.3.1 This lending carry mark-up rate of 13.90% (2009: Nil) per annum and will mature on03 January 2011.
10.3.2 Market value of securities held as collateral against lendings to financial institutionsas at 31 December 2010 amounted to Rs. 640.767 million (2009: Nil).
10.4 This represents clean placement with a Non-Banking Financial Institution, carrying mark-uprates ranging between 13.90% to 14.00% (2009: 14.00%) per annum and will mature by7 January 2011.
TotalFurthergiven ascollateral
Held byBank
2010TotalFurther
given ascollateral
Held byBank
2009
(Rupees in’000)
640,399 – 640,399 – – –10.3.2Market treasury bills
Note
Note
114
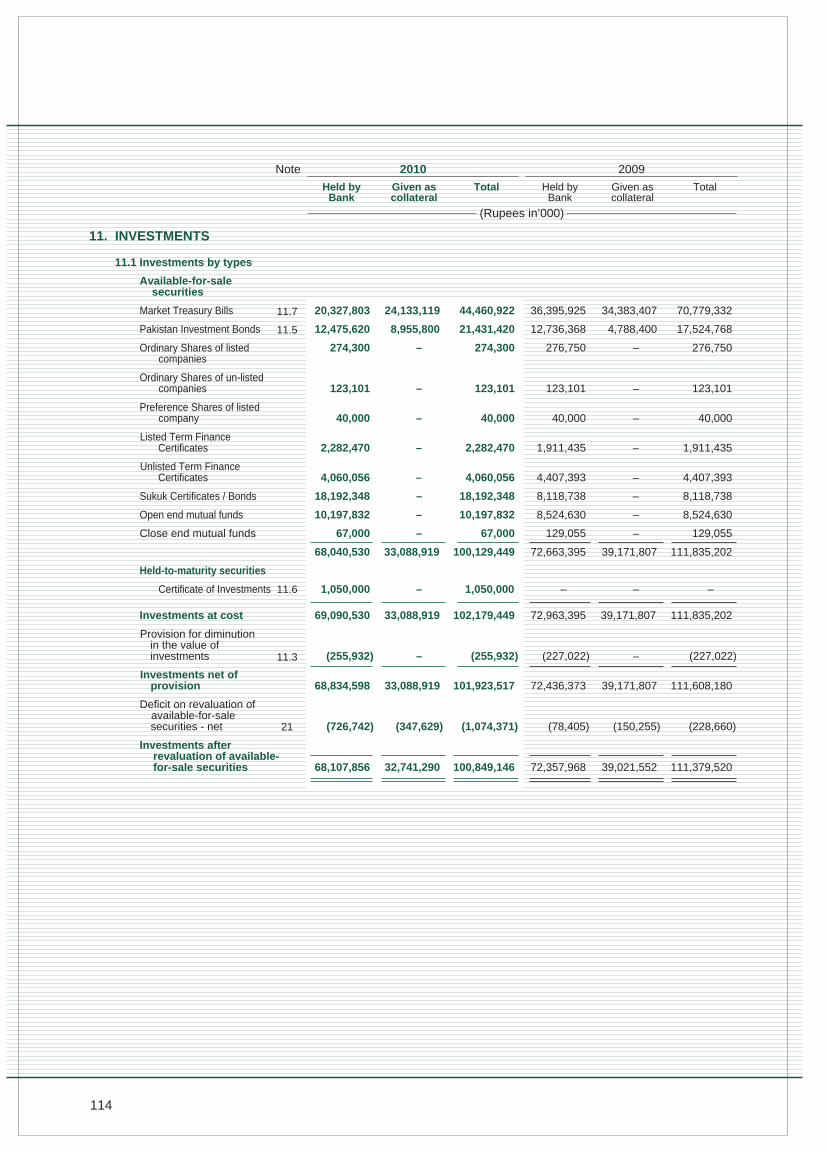
11. INVESTMENTS
11.1 Investments by types
Available-for-sale securities
Market Treasury Bills 20,327,803 24,133,119 44,460,922 36,395,925 34,383,407 70,779,332
Pakistan Investment Bonds 12,475,620 8,955,800 21,431,420 12,736,368 4,788,400 17,524,768
Ordinary Shares of listed 274,300 – 274,300 276,750 – 276,750companies
Ordinary Shares of un-listedcompanies 123,101 – 123,101 123,101 – 123,101
Preference Shares of listedcompany 40,000 – 40,000 40,000 – 40,000
Listed Term FinanceCertificates 2,282,470 – 2,282,470 1,911,435 – 1,911,435
Unlisted Term FinanceCertificates 4,060,056 – 4,060,056 4,407,393 – 4,407,393
Sukuk Certificates / Bonds 18,192,348 – 18,192,348 8,118,738 – 8,118,738
Open end mutual funds 10,197,832 – 10,197,832 8,524,630 – 8,524,630
Close end mutual funds 67,000 – 67,000 129,055 – 129,055
68,040,530 33,088,919 100,129,449 72,663,395 39,171,807 111,835,202
Held-to-maturity securities
Certificate of Investments 1,050,000 – 1,050,000 – – –
Investments at cost 69,090,530 33,088,919 102,179,449 72,963,395 39,171,807 111,835,202
Provision for diminution in the value ofinvestments (255,932) – (255,932) (227,022) – (227,022)
Investments net ofprovision 68,834,598 33,088,919 101,923,517 72,436,373 39,171,807 111,608,180
Deficit on revaluation of available-for-sale
securities - net (726,742) (347,629) (1,074,371) (78,405) (150,255) (228,660)
Investments afterrevaluation of available-for-sale securities 68,107,856 32,741,290 100,849,146 72,357,968 39,021,552 111,379,520
TotalGiven ascollateral
Held byBank
2010
TotalGiven ascollateral
Held byBank
2009
11.5
11.3
21
(Rupees in’000)
11.7
11.6
Note
115
2010 2009Rupees in ‘000
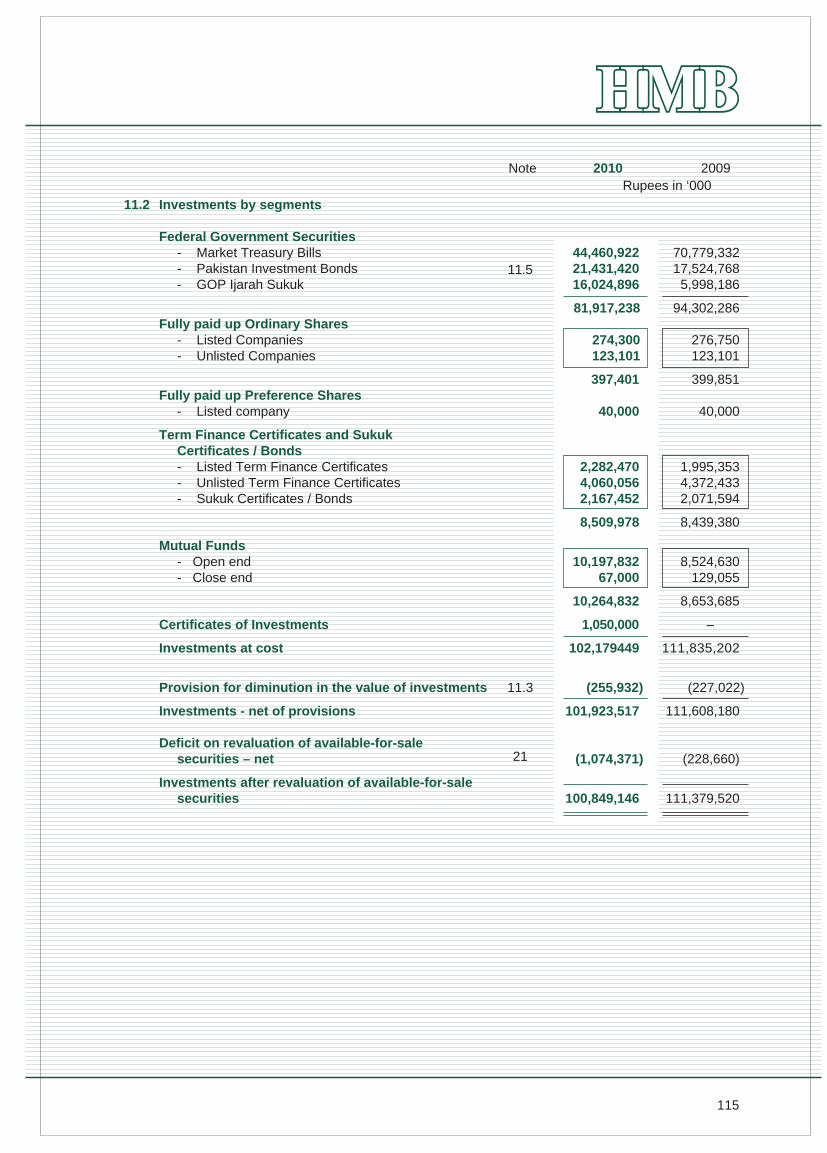
11.2 Investments by segments
Federal Government Securities- Market Treasury Bills 44,460,922 70,779,332- Pakistan Investment Bonds 21,431,420 17,524,768- GOP Ijarah Sukuk 16,024,896 5,998,186
81,917,238 94,302,286Fully paid up Ordinary Shares
- Listed Companies 274,300 276,750- Unlisted Companies 123,101 123,101
397,401 399,851Fully paid up Preference Shares
- Listed company 40,000 40,000
Term Finance Certificates and Sukuk Certificates / Bonds
- Listed Term Finance Certificates 2,282,470 1,995,353- Unlisted Term Finance Certificates 4,060,056 4,372,433- Sukuk Certificates / Bonds 2,167,452 2,071,594
8,509,978 8,439,380
Mutual Funds- Open end 10,197,832 8,524,630- Close end 67,000 129,055
10,264,832 8,653,685
Certificates of Investments 1,050,000 –
Investments at cost 102,179449 111,835,202
Provision for diminution in the value of investments (255,932) (227,022)
Investments - net of provisions 101,923,517 111,608,180
Deficit on revaluation of available-for-sale securities – net (1,074,371) (228,660)
Investments after revaluation of available-for-salesecurities 100,849,146 111,379,520
11.3
21
11.5
Note
116
2010 2009Rupees in ‘000
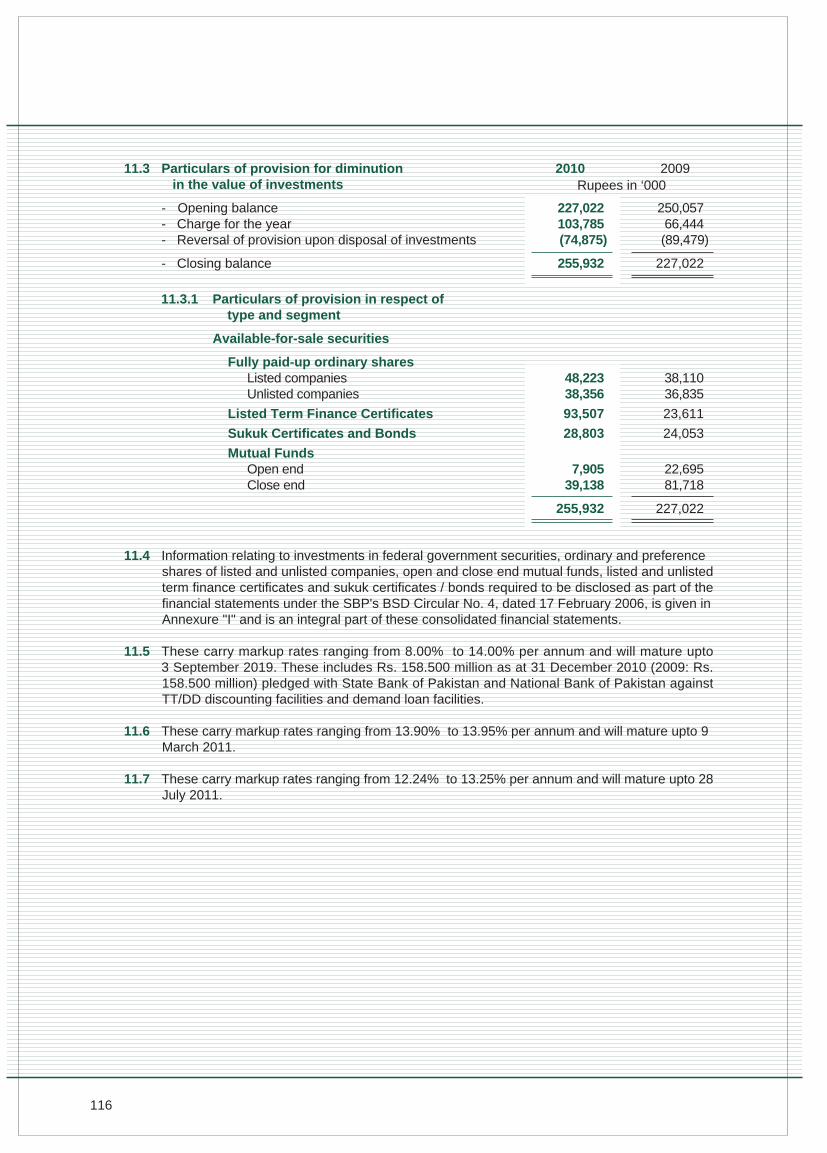
11.3 Particulars of provision for diminution in the value of investments
- Opening balance 227,022 250,057- Charge for the year 103,785 66,444- Reversal of provision upon disposal of investments (74,875) (89,479)
- Closing balance 255,932 227,022
11.3.1 Particulars of provision in respect of type and segment
Available-for-sale securities
Fully paid-up ordinary shares Listed companies 48,223 38,110 Unlisted companies 38,356 36,835
Listed Term Finance Certificates 93,507 23,611
Sukuk Certificates and Bonds 28,803 24,053
Mutual Funds Open end 7,905 22,695 Close end 39,138 81,718
255,932 227,022
11.4 Information relating to investments in federal government securities, ordinary and preferenceshares of listed and unlisted companies, open and close end mutual funds, listed and unlistedterm finance certificates and sukuk certificates / bonds required to be disclosed as part of thefinancial statements under the SBP's BSD Circular No. 4, dated 17 February 2006, is given inAnnexure "I" and is an integral part of these consolidated financial statements.
11.5 These carry markup rates ranging from 8.00% to 14.00% per annum and will mature upto3 September 2019. These includes Rs. 158.500 million as at 31 December 2010 (2009: Rs.158.500 million) pledged with State Bank of Pakistan and National Bank of Pakistan againstTT/DD discounting facilities and demand loan facilities.
11.6 These carry markup rates ranging from 13.90% to 13.95% per annum and will mature upto 9March 2011.
11.7 These carry markup rates ranging from 12.24% to 13.25% per annum and will mature upto 28July 2011.
117
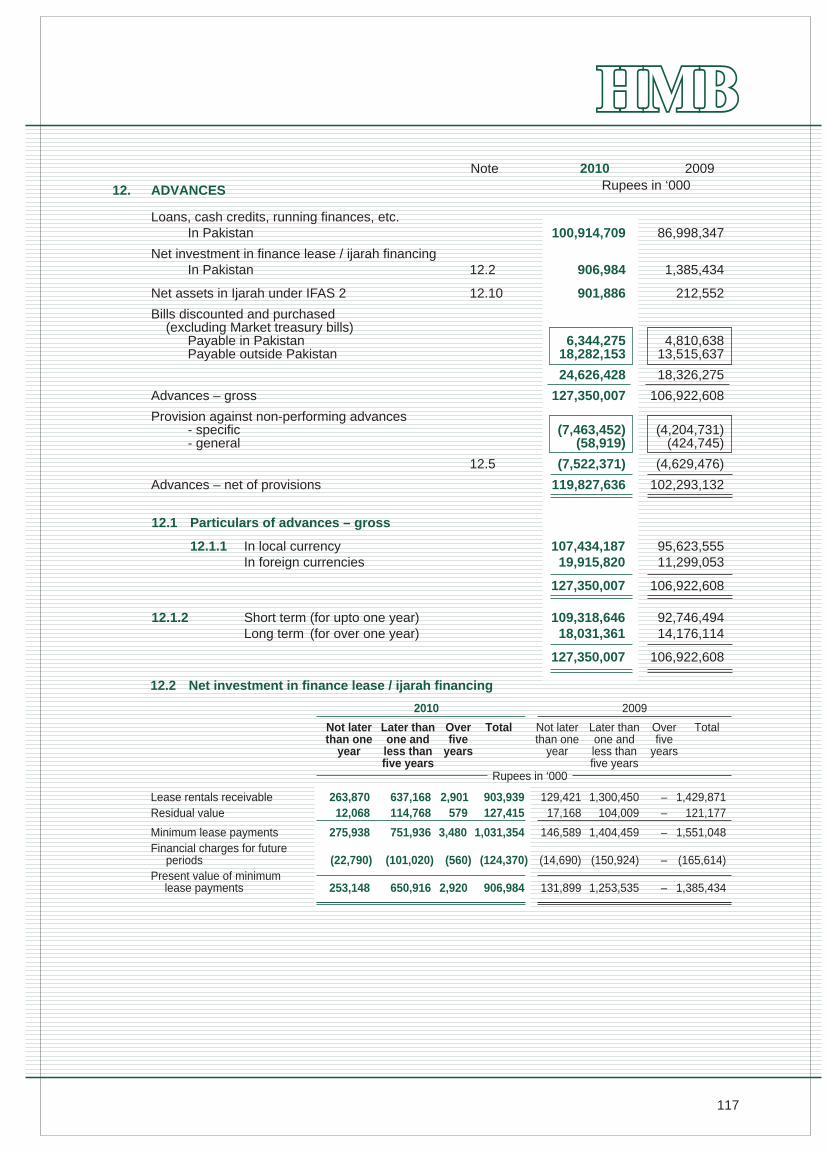
12. ADVANCES
Loans, cash credits, running finances, etc. In Pakistan 100,914,709 86,998,347
Net investment in finance lease / ijarah financingIn Pakistan 12.2 906,984 1,385,434
Net assets in Ijarah under IFAS 2 12.10 901,886 212,552
Bills discounted and purchased (excluding Market treasury bills)
Payable in Pakistan 6,344,275 4,810,638Payable outside Pakistan 18,282,153 13,515,637
24,626,428 18,326,275
Advances – gross 127,350,007 106,922,608
Provision against non-performing advances- specific (7,463,452) (4,204,731)- general (58,919) (424,745)
12.5 (7,522,371) (4,629,476)
Advances – net of provisions 119,827,636 102,293,132
2010 2009Rupees in ‘000
12.1 Particulars of advances – gross
12.1.1 In local currency 107,434,187 95,623,555In foreign currencies 19,915,820 11,299,053
127,350,007 106,922,608
12.1.2 Short term (for upto one year) 109,318,646 92,746,494Long term (for over one year) 18,031,361 14,176,114
127,350,007 106,922,608
12.2 Net investment in finance lease / ijarah financing
Lease rentals receivable 263,870 637,168 2,901 903,939 129,421 1,300,450 – 1,429,871Residual value 12,068 114,768 579 127,415 17,168 104,009 – 121,177
Minimum lease payments 275,938 751,936 3,480 1,031,354 146,589 1,404,459 – 1,551,048Financial charges for future
periods (22,790) (101,020) (560) (124,370) (14,690) (150,924) – (165,614)Present value of minimum
lease payments 253,148 650,916 2,920 906,984 131,899 1,253,535 – 1,385,434
Not laterthan one
year
Later thanone andless thanfive years
Overfive
years
Total
2010
Not laterthan one
year
Later thanone andless thanfive years
Overfive
years
Total
2009
Rupees in ‘000
Note
118
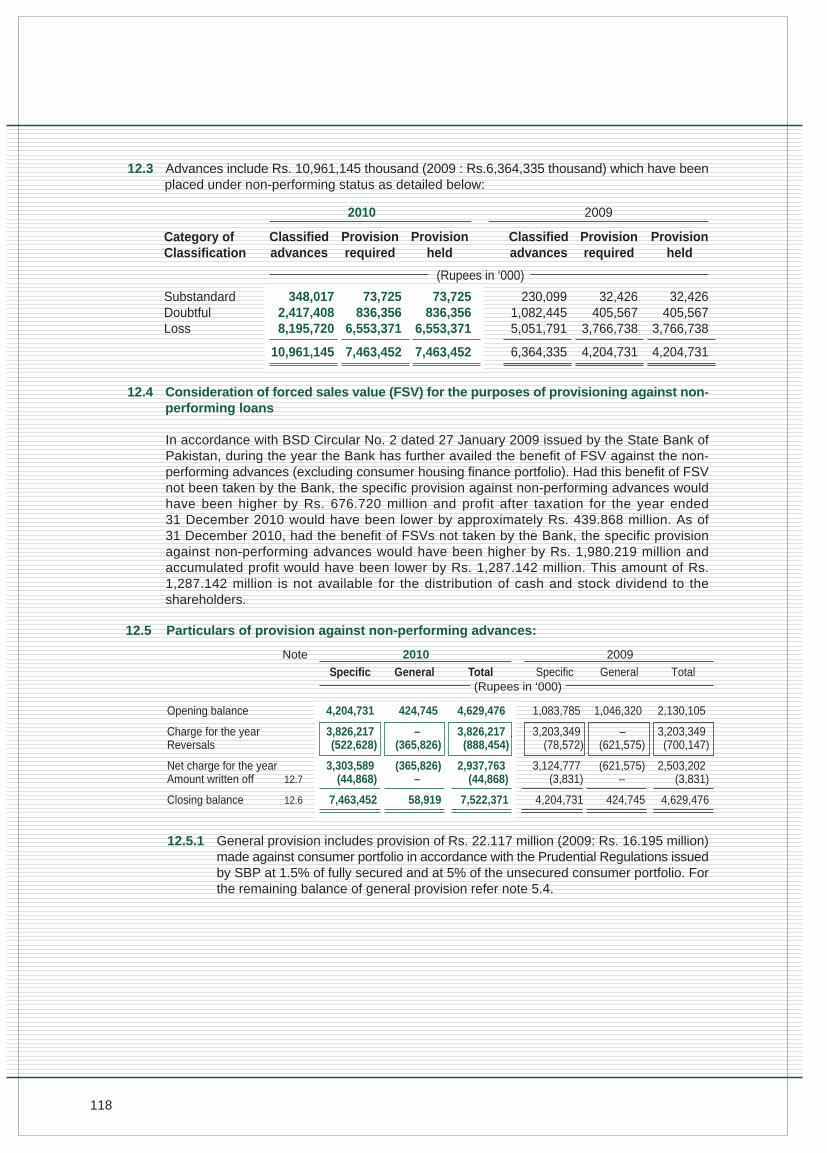
12.4 Consideration of forced sales value (FSV) for the purposes of provisioning against non-performing loans
In accordance with BSD Circular No. 2 dated 27 January 2009 issued by the State Bank ofPakistan, during the year the Bank has further availed the benefit of FSV against the non-performing advances (excluding consumer housing finance portfolio). Had this benefit of FSVnot been taken by the Bank, the specific provision against non-performing advances wouldhave been higher by Rs. 676.720 million and profit after taxation for the year ended31 December 2010 would have been lower by approximately Rs. 439.868 million. As of31 December 2010, had the benefit of FSVs not taken by the Bank, the specific provisionagainst non-performing advances would have been higher by Rs. 1,980.219 million andaccumulated profit would have been lower by Rs. 1,287.142 million. This amount of Rs.1,287.142 million is not available for the distribution of cash and stock dividend to theshareholders.
12.3 Advances include Rs. 10,961,145 thousand (2009 : Rs.6,364,335 thousand) which have beenplaced under non-performing status as detailed below:
12.5.1 General provision includes provision of Rs. 22.117 million (2009: Rs. 16.195 million)made against consumer portfolio in accordance with the Prudential Regulations issuedby SBP at 1.5% of fully secured and at 5% of the unsecured consumer portfolio. Forthe remaining balance of general provision refer note 5.4.
12.5 Particulars of provision against non-performing advances:
Opening balance 4,204,731 424,745 4,629,476 1,083,785 1,046,320 2,130,105
Charge for the year 3,826,217 – 3,826,217 3,203,349 – 3,203,349Reversals (522,628) (365,826) (888,454) (78,572) (621,575) (700,147)
Net charge for the year 3,303,589 (365,826) 2,937,763 3,124,777 (621,575) 2,503,202 Amount written off 12.7 (44,868) – (44,868) (3,831) – (3,831)
Closing balance 12.6 7,463,452 58,919 7,522,371 4,204,731 424,745 4,629,476
Specific(Rupees in ‘000)
General Total Specific General Total
2010 2009
348,017 2,417,408 8,195,720
10,961,145
73,725 836,356
6,553,371
7,463,452
73,725 836,356
6,553,371
7,463,452
230,099 1,082,445 5,051,791
6,364,335
32,426 405,567
3,766,738
4,204,731
32,426 405,567
3,766,738
4,204,731
SubstandardDoubtfulLoss
Category ofClassification
Classifiedadvances
Provisionrequired
Provisionheld
Classifiedadvances
Provisionrequired
Provisionheld
(Rupees in ‘000)
2010 2009
Note
119
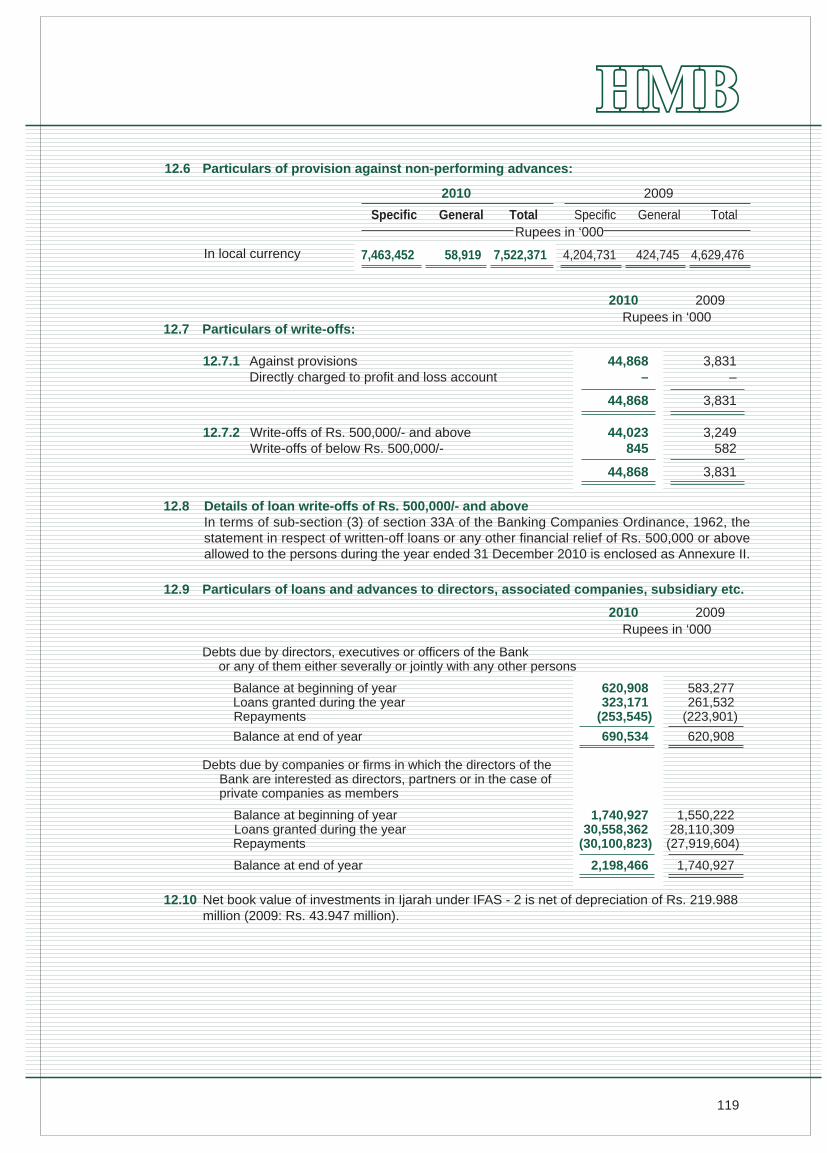
12.8 Details of loan write-offs of Rs. 500,000/- and aboveIn terms of sub-section (3) of section 33A of the Banking Companies Ordinance, 1962, thestatement in respect of written-off loans or any other financial relief of Rs. 500,000 or aboveallowed to the persons during the year ended 31 December 2010 is enclosed as Annexure II.
12.7 Particulars of write-offs:
12.7.1 Against provisions 44,868 3,831Directly charged to profit and loss account – –
44,868 3,831
12.7.2 Write-offs of Rs. 500,000/- and above 44,023 3,249Write-offs of below Rs. 500,000/- 845 582
44,868 3,831
Rupees in ‘0002010 2009
12.6 Particulars of provision against non-performing advances:
SpecificRupees in ‘000
General Total Specific General Total
2010 2009
7,463,452 58,919 7,522,371 4,204,731 424,745 4,629,476In local currency
12.9 Particulars of loans and advances to directors, associated companies, subsidiary etc.
Debts due by directors, executives or officers of the Bankor any of them either severally or jointly with any other persons
Balance at beginning of year 620,908 583,277Loans granted during the year 323,171 261,532Repayments (253,545) (223,901)
Balance at end of year 690,534 620,908
Debts due by companies or firms in which the directors of theBank are interested as directors, partners or in the case ofprivate companies as members
Balance at beginning of year 1,740,927 1,550,222Loans granted during the year 30,558,362 28,110,309Repayments (30,100,823) (27,919,604)
Balance at end of year 2,198,466 1,740,927
12.10 Net book value of investments in Ijarah under IFAS - 2 is net of depreciation of Rs. 219.988 million (2009: Rs. 43.947 million).
Rupees in ‘0002010 2009
120
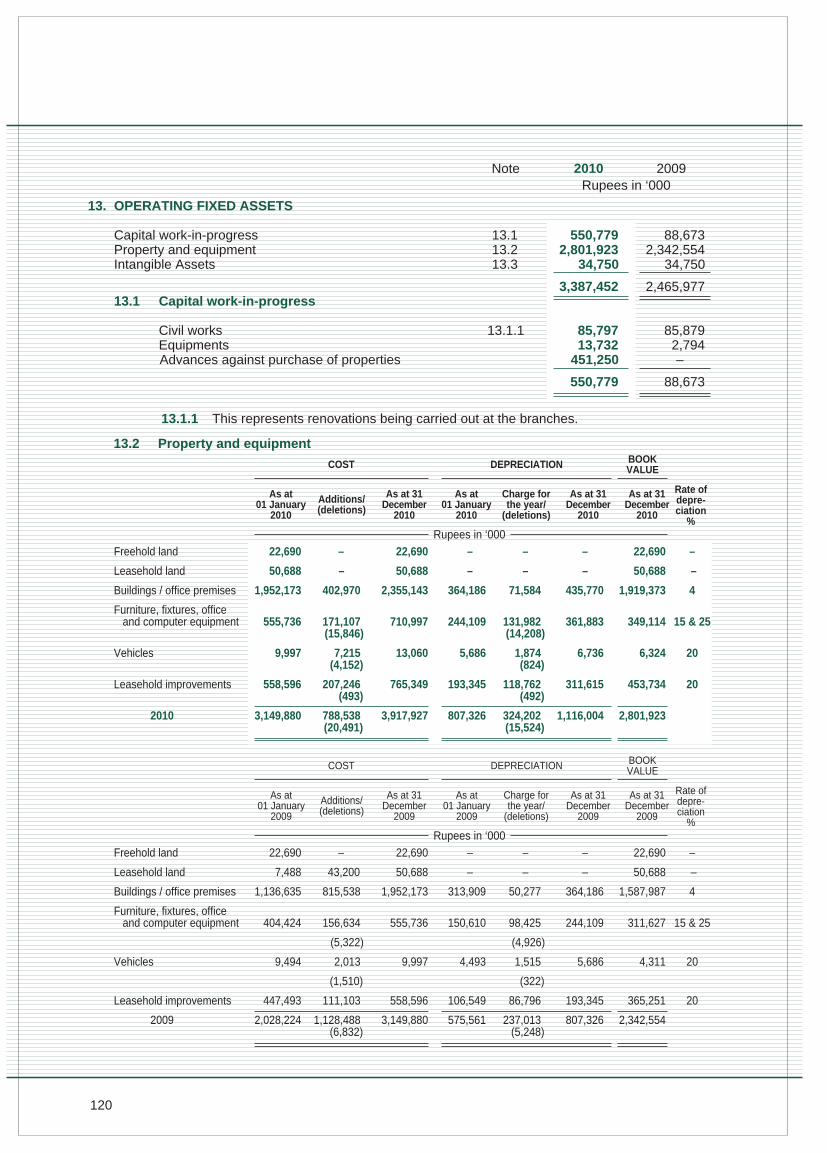
13. OPERATING FIXED ASSETS
Capital work-in-progress 13.1 550,779 88,673Property and equipment 13.2 2,801,923 2,342,554Intangible Assets 13.3 34,750 34,750
3,387,452 2,465,97713.1 Capital work-in-progress
Civil works 13.1.1 85,797 85,879Equipments 13,732 2,794Advances against purchase of properties 451,250 –
550,779 88,673
13.1.1 This represents renovations being carried out at the branches.
13.2 Property and equipment
COST DEPRECIATION
As at01 January
2010
Additions/(deletions)
As at 31December
2010
As at 31December
2010
Rate ofdepre-ciation
%Rupees in ‘000
Freehold land 22,690 – 22,690 – – – 22,690 –
Leasehold land 50,688 – 50,688 – – – 50,688 –
Buildings / office premises 1,952,173 402,970 2,355,143 364,186 71,584 435,770 1,919,373 4
Furniture, fixtures, office and computer equipment 555,736 171,107 710,997 244,109 131,982 361,883 349,114 15 & 25
(15,846) (14,208)
Vehicles 9,997 7,215 13,060 5,686 1,874 6,736 6,324 20(4,152) (824)
Leasehold improvements 558,596 207,246 765,349 193,345 118,762 311,615 453,734 20(493) (492)
2010 3,149,880 788,538 3,917,927 807,326 324,202 1,116,004 2,801,923 (20,491) (15,524)
As at01 January
2010
As at 31December
2010
BOOKVALUE
Charge forthe year/
(deletions)
2010 2009Rupees in ‘000
COST DEPRECIATION
As at01 January
2009
Additions/(deletions)
As at 31December
2009
As at 31December
2009
Rate ofdepre-ciation
%Rupees in ‘000
Freehold land 22,690 – 22,690 – – – 22,690 –
Leasehold land 7,488 43,200 50,688 – – – 50,688 –
Buildings / office premises 1,136,635 815,538 1,952,173 313,909 50,277 364,186 1,587,987 4
Furniture, fixtures, office and computer equipment 404,424 156,634 555,736 150,610 98,425 244,109 311,627 15 & 25
(5,322) (4,926)
Vehicles 9,494 2,013 9,997 4,493 1,515 5,686 4,311 20
(1,510) (322)
Leasehold improvements 447,493 111,103 558,596 106,549 86,796 193,345 365,251 20
2009 2,028,224 1,128,488 3,149,880 575,561 237,013 807,326 2,342,554 (6,832) (5,248)
As at01 January
2009
As at 31December
2009
BOOKVALUE
Charge forthe year/
(deletions)
Note
121
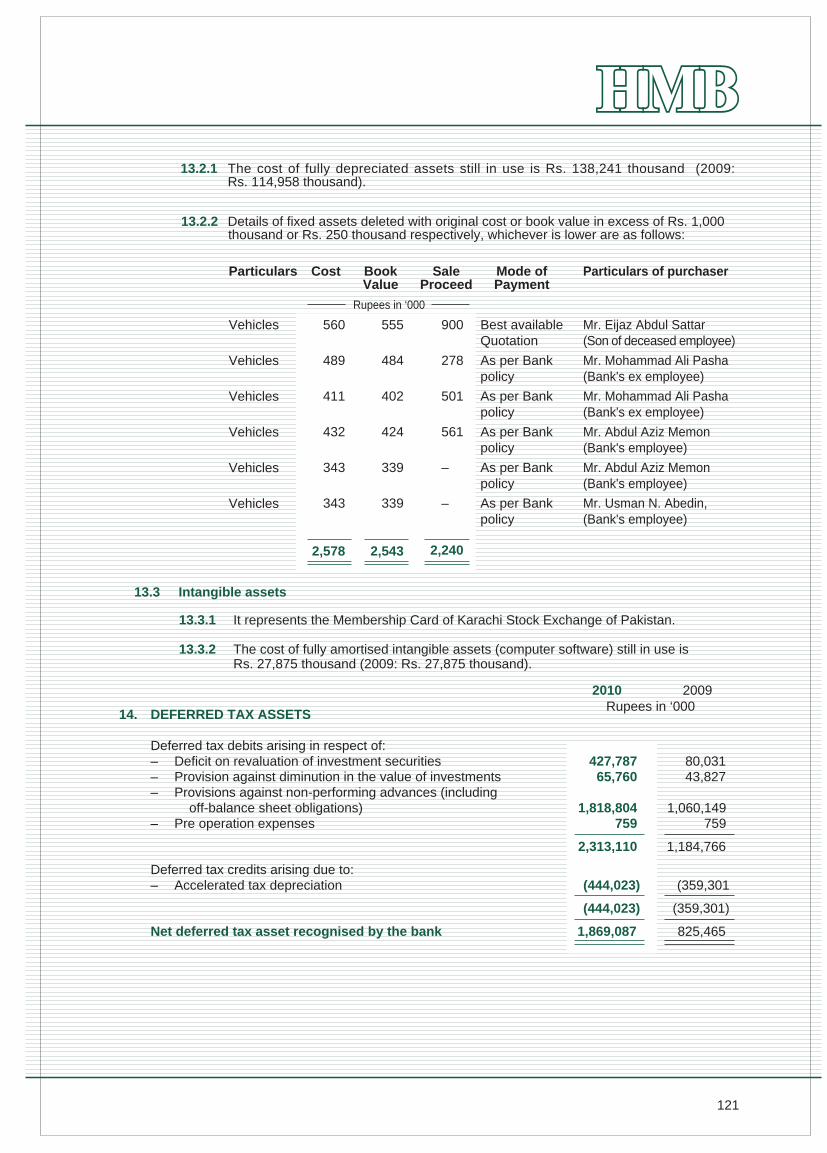
13.2.1 The cost of fully depreciated assets still in use is Rs. 138,241 thousand (2009:Rs. 114,958 thousand).
13.2.2 Details of fixed assets deleted with original cost or book value in excess of Rs. 1,000thousand or Rs. 250 thousand respectively, whichever is lower are as follows:
Vehicles
Vehicles
Vehicles
Vehicles
Vehicles
Vehicles
555
484
402
424
339
339
2,543
900
278
501
561
–
–
2,240
Best availableQuotation
As per Bankpolicy
As per Bankpolicy
As per Bankpolicy
As per Bankpolicy
As per Bankpolicy
Mr. Eijaz Abdul Sattar(Son of deceased employee)
Mr. Mohammad Ali Pasha(Bank's ex employee)
Mr. Mohammad Ali Pasha(Bank's ex employee)
Mr. Abdul Aziz Memon(Bank's employee)
Mr. Abdul Aziz Memon(Bank's employee)
Mr. Usman N. Abedin,(Bank's employee)
Particulars Cost BookValue
SaleProceed
Mode ofPayment
Particulars of purchaser
560
489
411
432
343
343
2,578
13.3 Intangible assets
13.3.1 It represents the Membership Card of Karachi Stock Exchange of Pakistan.
13.3.2 The cost of fully amortised intangible assets (computer software) still in use isRs. 27,875 thousand (2009: Rs. 27,875 thousand).
2010 2009Rupees in ‘000
14. DEFERRED TAX ASSETS
Deferred tax debits arising in respect of:– Deficit on revaluation of investment securities 427,787 80,031– Provision against diminution in the value of investments 65,760 43,827– Provisions against non-performing advances (including
off-balance sheet obligations) 1,818,804 1,060,149– Pre operation expenses 759 759
2,313,110 1,184,766
Deferred tax credits arising due to:– Accelerated tax depreciation (444,023) (359,301
(444,023) (359,301)
Net deferred tax asset recognised by the bank 1,869,087 825,465
Rupees in ‘000
122
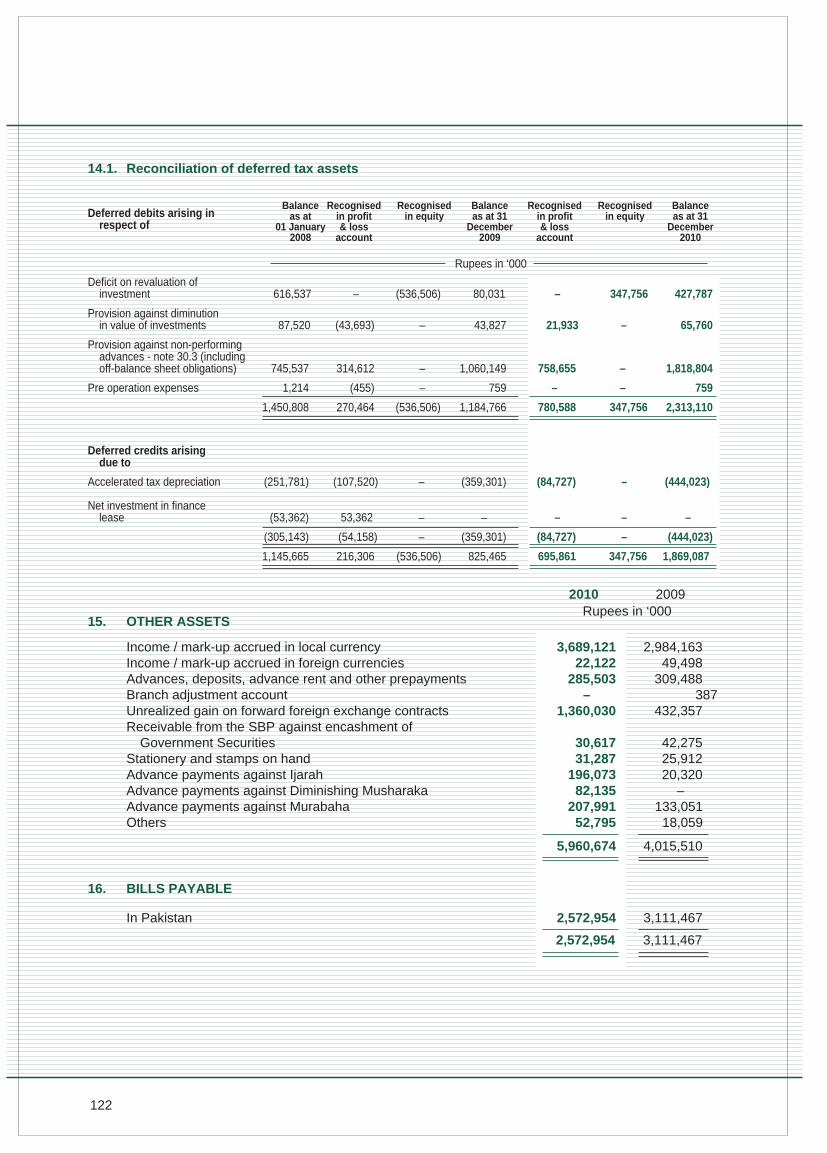
Balanceas at
01 January2008
Recognisedin profit& loss
account
Recognisedin equity
Rupees in ‘000
Balanceas at 31
December2009
Recognisedin profit& loss
account
Recognisedin equity
Balanceas at 31
December2010
Deficit on revaluation ofinvestment 616,537 – (536,506) 80,031 – 347,756 427,787
Provision against diminutionin value of investments 87,520 (43,693) – 43,827 21,933 – 65,760
Provision against non-performingadvances - note 30.3 (includingoff-balance sheet obligations) 745,537 314,612 – 1,060,149 758,655 – 1,818,804
Pre operation expenses 1,214 (455) – 759 – – 759
1,450,808 270,464 (536,506) 1,184,766 780,588 347,756 2,313,110
Deferred credits arisingdue to
Accelerated tax depreciation (251,781) (107,520) – (359,301) (84,727) – (444,023)
Net investment in financelease (53,362) 53,362 – – – – –
(305,143) (54,158) – (359,301) (84,727) – (444,023)
1,145,665 216,306 (536,506) 825,465 695,861 347,756 1,869,087
14.1. Reconciliation of deferred tax assets
Deferred debits arising inrespect of
Rupees in ‘0002010 2009
16. BILLS PAYABLE
In Pakistan 2,572,954 3,111,467
2,572,954 3,111,467
15. OTHER ASSETS
Income / mark-up accrued in local currency 3,689,121 2,984,163Income / mark-up accrued in foreign currencies 22,122 49,498Advances, deposits, advance rent and other prepayments 285,503 309,488Branch adjustment account – 387Unrealized gain on forward foreign exchange contracts 1,360,030 432,357Receivable from the SBP against encashment of
Government Securities 30,617 42,275Stationery and stamps on hand 31,287 25,912Advance payments against Ijarah 196,073 20,320Advance payments against Diminishing Musharaka 82,135 –Advance payments against Murabaha 207,991 133,051Others 52,795 18,059
5,960,674 4,015,510
123
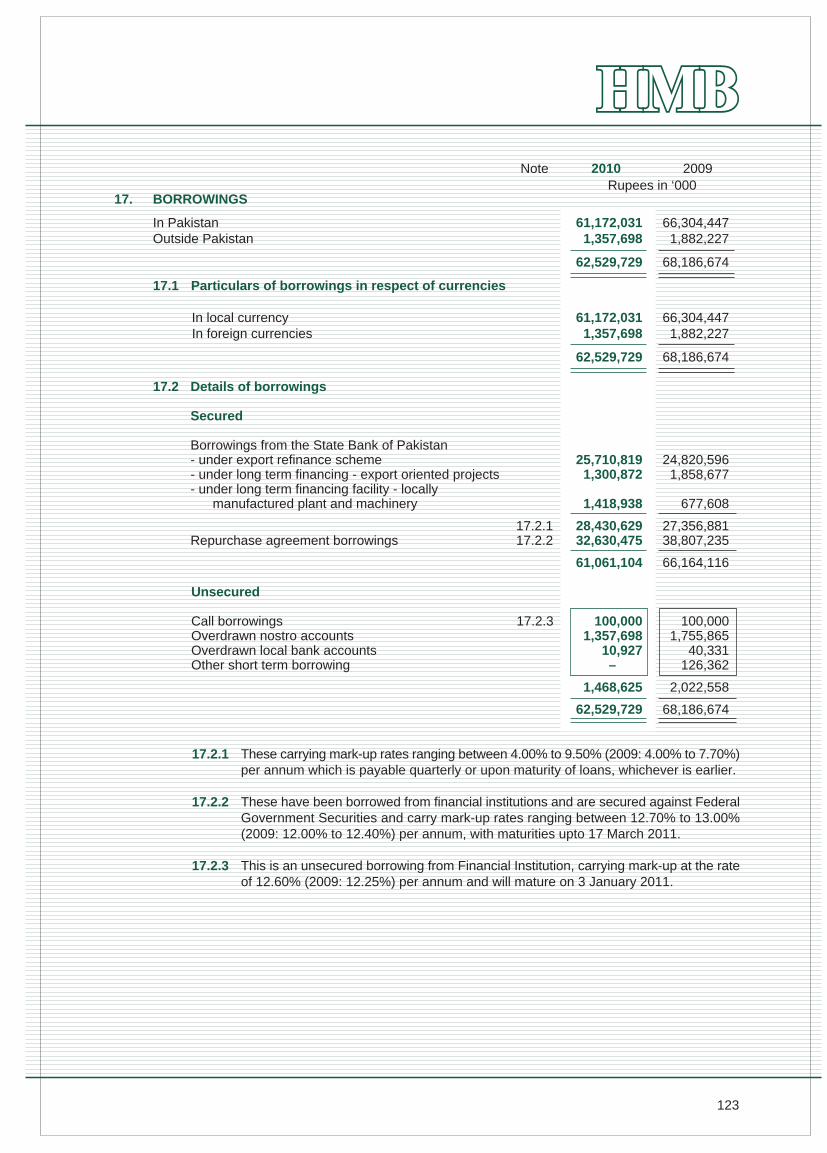
17.2 Details of borrowings
Secured
Borrowings from the State Bank of Pakistan- under export refinance scheme 25,710,819 24,820,596- under long term financing - export oriented projects 1,300,872 1,858,677- under long term financing facility - locally manufactured plant and machinery 1,418,938 677,608
17.2.1 28,430,629 27,356,881Repurchase agreement borrowings 17.2.2 32,630,475 38,807,235
61,061,104 66,164,116
Unsecured
Call borrowings 17.2.3 100,000 100,000Overdrawn nostro accounts 1,357,698 1,755,865Overdrawn local bank accounts 10,927 40,331Other short term borrowing – 126,362
1,468,625 2,022,558
62,529,729 68,186,674
17.2.1 These carrying mark-up rates ranging between 4.00% to 9.50% (2009: 4.00% to 7.70%)per annum which is payable quarterly or upon maturity of loans, whichever is earlier.
17.2.2 These have been borrowed from financial institutions and are secured against FederalGovernment Securities and carry mark-up rates ranging between 12.70% to 13.00%(2009: 12.00% to 12.40%) per annum, with maturities upto 17 March 2011.
17.2.3 This is an unsecured borrowing from Financial Institution, carrying mark-up at the rateof 12.60% (2009: 12.25%) per annum and will mature on 3 January 2011.
17. BORROWINGS
In Pakistan 61,172,031 66,304,447Outside Pakistan 1,357,698 1,882,227
62,529,729 68,186,674
17.1 Particulars of borrowings in respect of currencies
In local currency 61,172,031 66,304,447In foreign currencies 1,357,698 1,882,227
62,529,729 68,186,674
2010 2009Rupees in ‘000
Note

124
18. DEPOSITS AND OTHER ACCOUNTS
Customers
18.1 Particulars of depositsIn local currency 144,632,822 128,735,874In foreign currencies 15,681,389 13,449,621
160,314,211 142,185,495
Rupees in ‘0002010 2009
Fixed deposits 69,954,427 63,745,868Savings deposits 38,873,120 39,879,767Current accounts (non-remunerative) 37,316,518 33,250,907Others 1,818,566 1,478,044
147,962,631 138,354,586Financial institutionsRemunerative deposits 11,975,440 3,693,545Non-remunerative deposits 376,140 137,364
12,351,580 3,830,909
160,314,211 142,185,495
19. OTHER LIABILITIES
Mark-up / return / interest payable in local currency 3,720,511 2,983,665Mark-up / return / interest payable in foreign currencies 23,081 8,500Unearned commission and income on bills discounted 119,288 158,948Accrued expenses 259,512 251,593Current taxation (provisions less payments) 426,814 328,627Provision against off-balance sheet obligations 19.1 38,922 –Unclaimed dividend 3,150 1,049Unrealized loss on forward foreign exchange contracts 628,822 157,400Branch adjustment account 181 –Workers' welfare fund 29.1 123,008 137,060Excise duty payable 26,368 21,078Locker deposits 313,297 271,593Advance against Diminishing Musharaka 37,067 33,661Advance rental for Ijarah 17,743 10,316Security deposits against leases/ Ijarah 437,229 402,380Sundry creditors 67,395 28,314Others 161,282 129,024
6,403,670 4,923,208
19.1 Provision against off-balance sheet obligations
Opening balance – –Charge for the year 38,922 –
Closing balance 38,922 –
Note
125
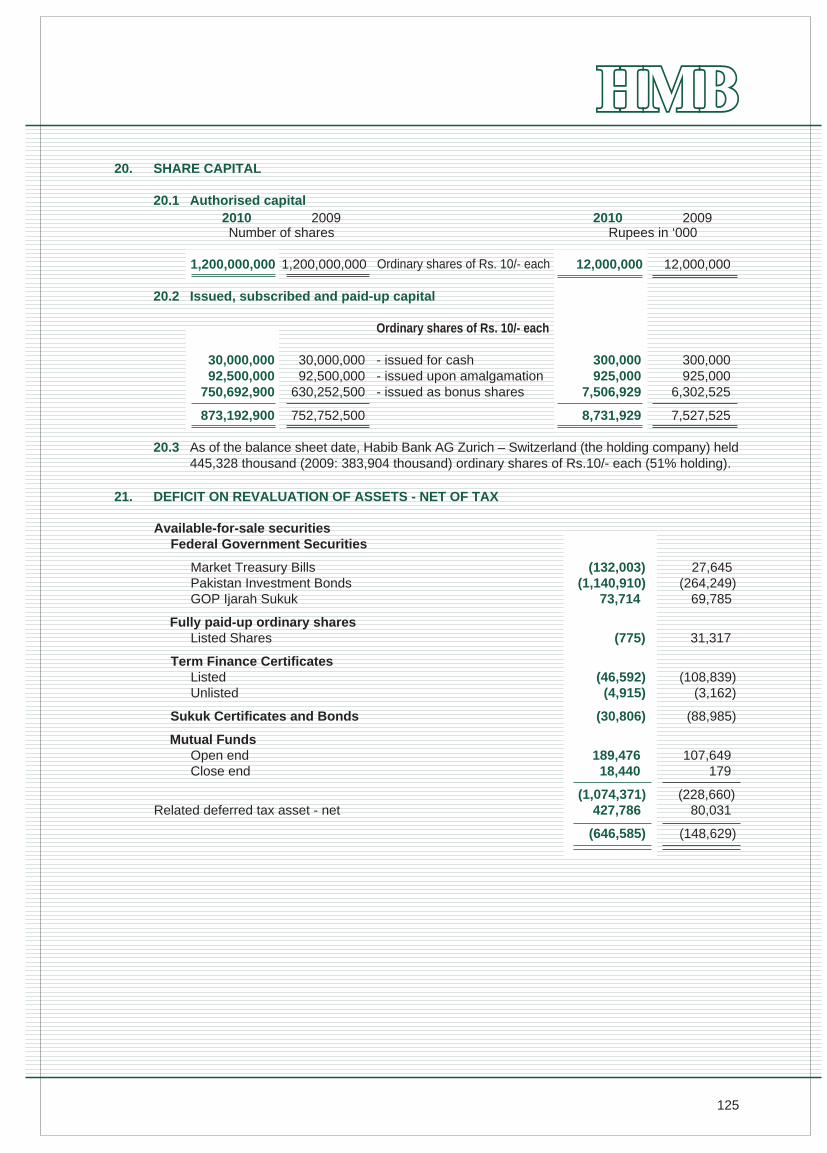
20. SHARE CAPITAL
20.1 Authorised capital
1,200,000,000 1,200,000,000 12,000,000 12,000,000
20.2 Issued, subscribed and paid-up capital
Ordinary shares of Rs. 10/- each
30,000,000 30,000,000 - issued for cash 300,000 300,00092,500,000 92,500,000 - issued upon amalgamation 925,000 925,000
750,692,900 630,252,500 - issued as bonus shares 7,506,929 6,302,525
873,192,900 752,752,500 8,731,929 7,527,525
20.3 As of the balance sheet date, Habib Bank AG Zurich – Switzerland (the holding company) held445,328 thousand (2009: 383,904 thousand) ordinary shares of Rs.10/- each (51% holding).
Number of shares2010 2009
Ordinary shares of Rs. 10/- each
Rupees in ‘0002010 2009
21. DEFICIT ON REVALUATION OF ASSETS - NET OF TAX
Available-for-sale securitiesFederal Government Securities
Market Treasury Bills (132,003) 27,645Pakistan Investment Bonds (1,140,910) (264,249)GOP Ijarah Sukuk 73,714 69,785
Fully paid-up ordinary sharesListed Shares (775) 31,317
Term Finance CertificatesListed (46,592) (108,839)Unlisted (4,915) (3,162)
Sukuk Certificates and Bonds (30,806) (88,985)
Mutual FundsOpen end 189,476 107,649Close end 18,440 179
(1,074,371) (228,660)Related deferred tax asset - net 427,786 80,031
(646,585) (148,629)

126
22.7 Commitments for the acquisition of operating fixed assets 62,154 14,884
22.8 Claims against bank not acknowledged as debt 2,229,910 1,634,510
22.9 Commitments in respect of forward lendings
The Bank makes commitments to extend credit in the normal course of its business, but noneof these commitments are irrevocable and do not attract any penalty if the facility is unilaterallywithdrawn.
22.10 Commitments in respect of syndicate financing 253,691 593,191
22.11 Commitments in respect of investment in Sukuk certificates and Term Finance Certificates 48,572 294,696
Rupees in ‘0002010 200922. CONTINGENCIES AND COMMITMENTS
22.1 Direct credit substitutesBank guarantees of indebtness in favour of:– Banking companies and other financial institutions 238,522 106,518
22.2 Transaction-related contingent liabilitiesIncludes performance bonds, bid bonds, advance payment
guarantees and shipping guarantees favouring:i) Government 9,351,603 7,384,640ii) Banking companies and other financial institutions 261,415 184,431iii) Others 3,711,022 6,521,564
13,324,040 14,090,635
22.3 Trade-related contingent liabilities Letters of credit 49,231,412 33,926,635
Acceptances 10,313,588 8,815,049
22.4 Commitments in respect of forward exchange contractsPurchase 55,991,653 25,374,364
Sale 68,631,860 29,690,658
22.5 Commitments in respect of Repurchase agreement borrowings – 4,655,405
22.6 Commitments in respect of operating leases Not later than one year 59,698 85,563Later than one year and not later than five years 30,291 67,481
89,989 153,044
The Group has entered into non-cancellable lease agreements with a Modaraba which hasbeen duly approved by the Religious Board as Ijarah transactions. The monthly rental instalmentsare spread over a period of 72 months. When a lease is terminated before the lease periodhas expired, any payment required to be made to the lessor by way of penalty is recognizedas an expense in the period in which termination takes place.
127
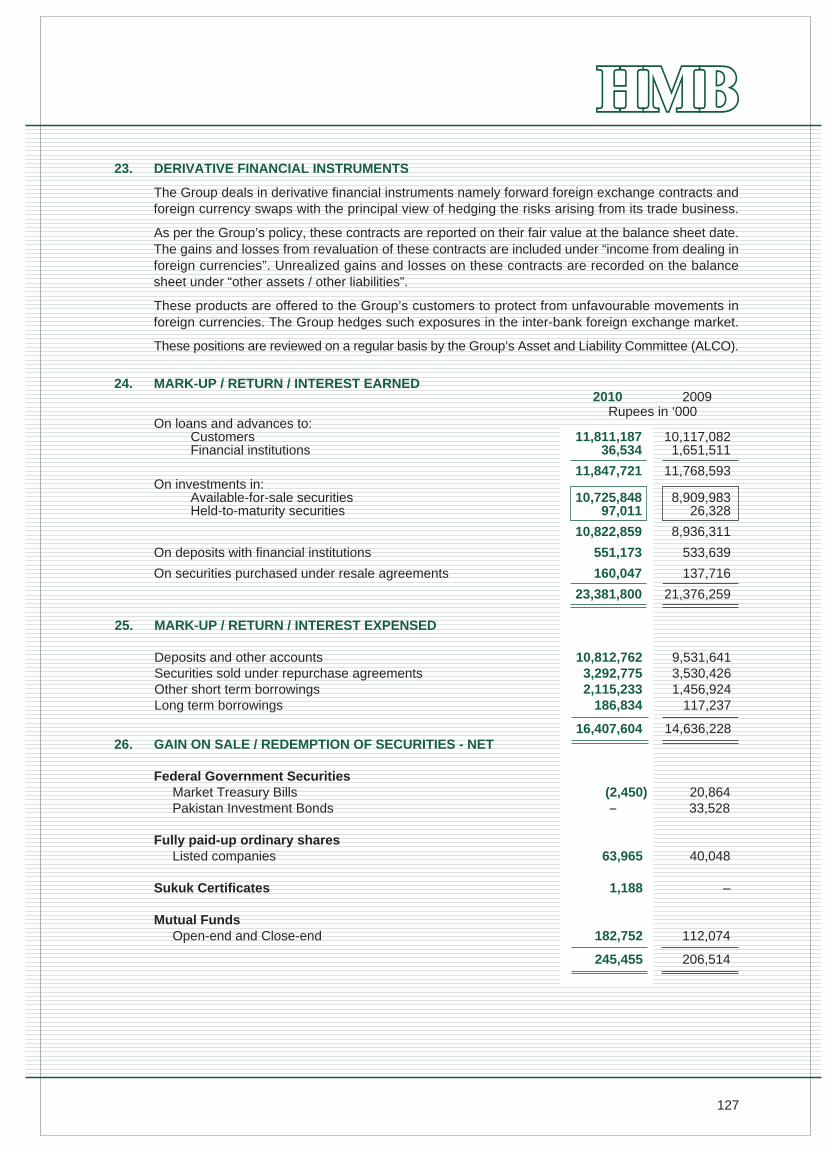
23. DERIVATIVE FINANCIAL INSTRUMENTS
The Group deals in derivative financial instruments namely forward foreign exchange contracts andforeign currency swaps with the principal view of hedging the risks arising from its trade business.
As per the Group’s policy, these contracts are reported on their fair value at the balance sheet date.The gains and losses from revaluation of these contracts are included under “income from dealing inforeign currencies”. Unrealized gains and losses on these contracts are recorded on the balancesheet under “other assets / other liabilities”.
These products are offered to the Group’s customers to protect from unfavourable movements inforeign currencies. The Group hedges such exposures in the inter-bank foreign exchange market.
These positions are reviewed on a regular basis by the Group’s Asset and Liability Committee (ALCO).
24. MARK-UP / RETURN / INTEREST EARNED
On loans and advances to:Customers 11,811,187 10,117,082Financial institutions 36,534 1,651,511
11,847,721 11,768,593On investments in:
Available-for-sale securities 10,725,848 8,909,983 Held-to-maturity securities 97,011 26,328
10,822,859 8,936,311
On deposits with financial institutions 551,173 533,639
On securities purchased under resale agreements 160,047 137,716
23,381,800 21,376,259
25. MARK-UP / RETURN / INTEREST EXPENSED
Deposits and other accounts 10,812,762 9,531,641Securities sold under repurchase agreements 3,292,775 3,530,426Other short term borrowings 2,115,233 1,456,924Long term borrowings 186,834 117,237
16,407,604 14,636,22826. GAIN ON SALE / REDEMPTION OF SECURITIES - NET
Federal Government SecuritiesMarket Treasury Bills (2,450) 20,864Pakistan Investment Bonds – 33,528
Fully paid-up ordinary sharesListed companies 63,965 40,048
Sukuk Certificates 1,188 –
Mutual FundsOpen-end and Close-end 182,752 112,074
245,455 206,514
Rupees in ‘0002010 2009
128
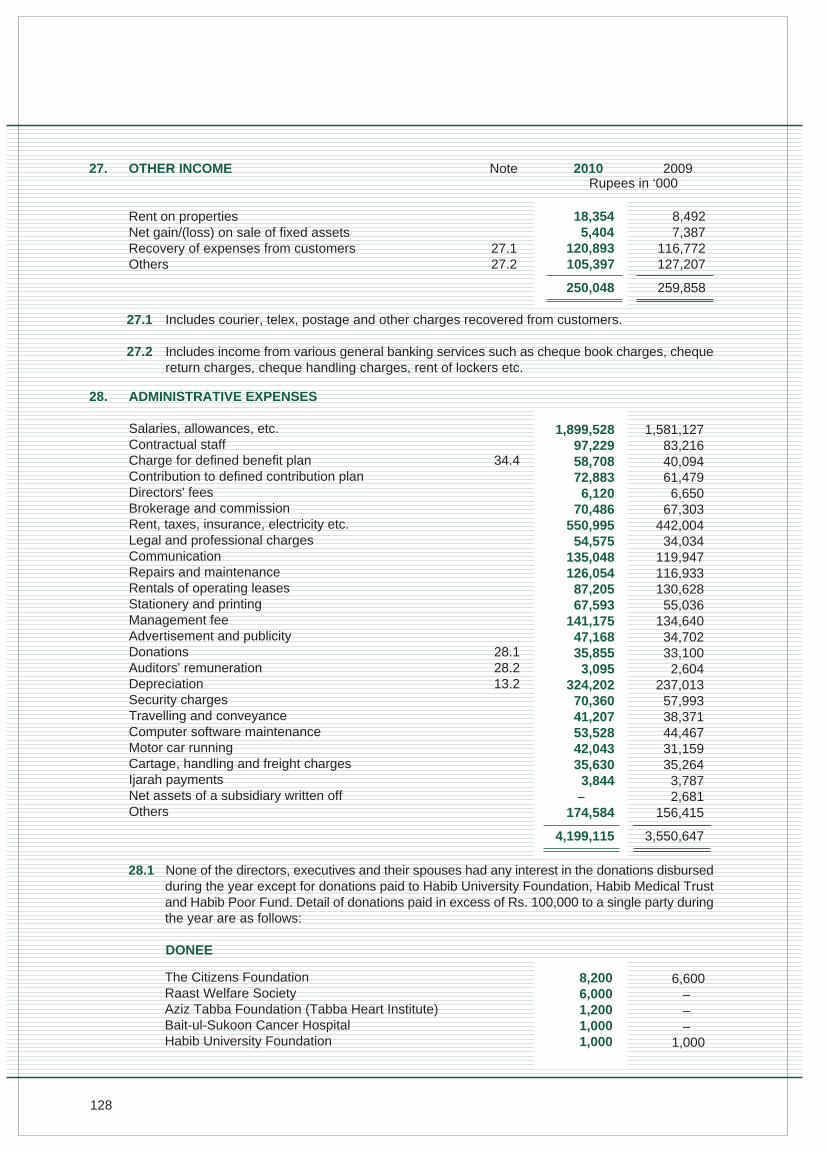
27. OTHER INCOME
Rent on properties 18,354 8,492Net gain/(loss) on sale of fixed assets 5,404 7,387Recovery of expenses from customers 27.1 120,893 116,772Others 27.2 105,397 127,207
250,048 259,858
27.1 Includes courier, telex, postage and other charges recovered from customers.
27.2 Includes income from various general banking services such as cheque book charges, chequereturn charges, cheque handling charges, rent of lockers etc.
28.1 None of the directors, executives and their spouses had any interest in the donations disbursedduring the year except for donations paid to Habib University Foundation, Habib Medical Trustand Habib Poor Fund. Detail of donations paid in excess of Rs. 100,000 to a single party duringthe year are as follows:
DONEE
28. ADMINISTRATIVE EXPENSES
Salaries, allowances, etc.Contractual staffCharge for defined benefit plan 34.4Contribution to defined contribution planDirectors' feesBrokerage and commissionRent, taxes, insurance, electricity etc.Legal and professional chargesCommunicationRepairs and maintenanceRentals of operating leasesStationery and printingManagement fee Advertisement and publicityDonations 28.1Auditors' remuneration 28.2Depreciation 13.2Security chargesTravelling and conveyanceComputer software maintenanceMotor car runningCartage, handling and freight chargesIjarah paymentsNet assets of a subsidiary written offOthers
Rupees in ‘0002010 2009
1,899,528 97,229 58,708 72,883
6,120 70,486
550,995 54,575
135,048 126,054
87,205 67,593
141,175 47,168 35,855
3,095 324,202
70,360 41,207 53,528 42,043 35,630
3,844–
174,584
4,199,115
1,581,127 83,216 40,094 61,479
6,650 67,303
442,004 34,034
119,947 116,933 130,628
55,036 134,640
34,702 33,100
2,604 237,013
57,993 38,371 44,467 31,159 35,264
3,787 2,681
156,415
3,550,647
The Citizens FoundationRaast Welfare SocietyAziz Tabba Foundation (Tabba Heart Institute)Bait-ul-Sukoon Cancer HospitalHabib University Foundation
8,200 6,000 1,200 1,000 1,000
6,600 – – –
1,000
Note
129
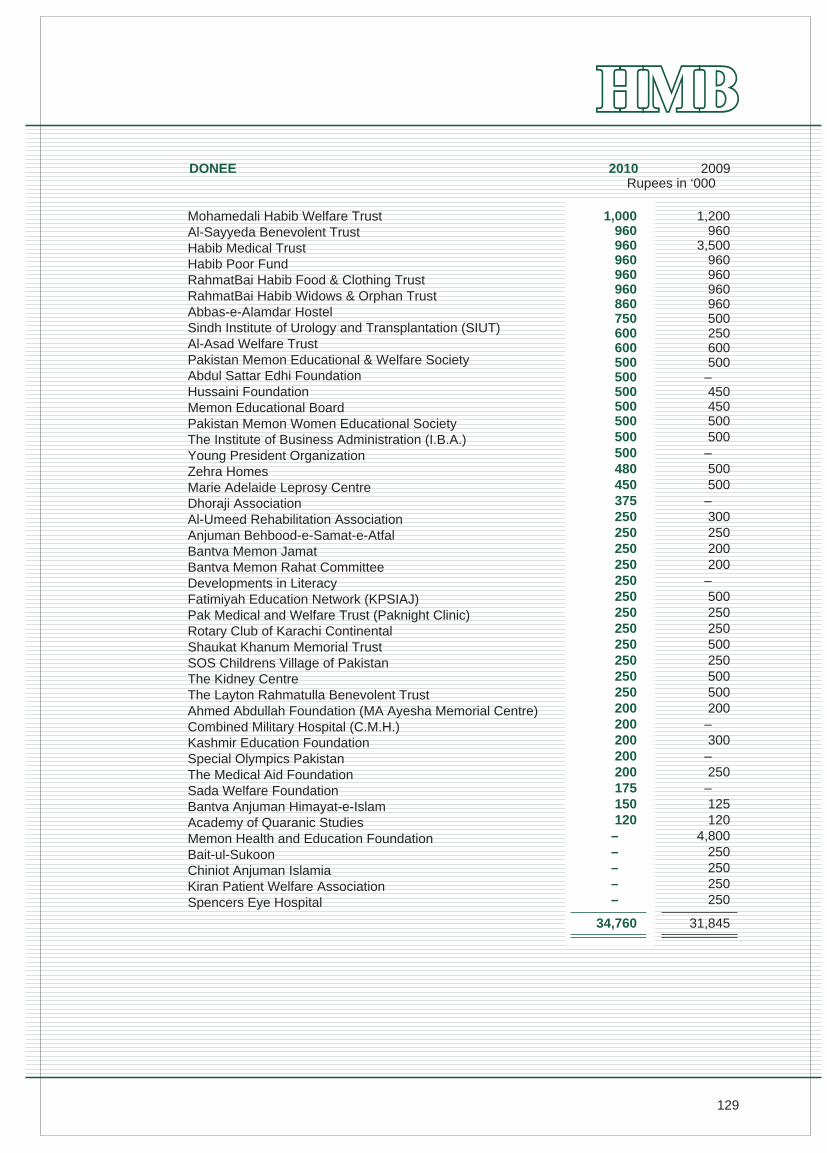
DONEERupees in ‘000
2010 2009
Mohamedali Habib Welfare TrustAl-Sayyeda Benevolent TrustHabib Medical TrustHabib Poor FundRahmatBai Habib Food & Clothing TrustRahmatBai Habib Widows & Orphan TrustAbbas-e-Alamdar HostelSindh Institute of Urology and Transplantation (SIUT)Al-Asad Welfare TrustPakistan Memon Educational & Welfare SocietyAbdul Sattar Edhi FoundationHussaini FoundationMemon Educational BoardPakistan Memon Women Educational SocietyThe Institute of Business Administration (I.B.A.)Young President OrganizationZehra HomesMarie Adelaide Leprosy CentreDhoraji AssociationAl-Umeed Rehabilitation AssociationAnjuman Behbood-e-Samat-e-AtfalBantva Memon JamatBantva Memon Rahat CommitteeDevelopments in LiteracyFatimiyah Education Network (KPSIAJ)Pak Medical and Welfare Trust (Paknight Clinic)Rotary Club of Karachi ContinentalShaukat Khanum Memorial TrustSOS Childrens Village of PakistanThe Kidney CentreThe Layton Rahmatulla Benevolent TrustAhmed Abdullah Foundation (MA Ayesha Memorial Centre)Combined Military Hospital (C.M.H.)Kashmir Education FoundationSpecial Olympics PakistanThe Medical Aid FoundationSada Welfare FoundationBantva Anjuman Himayat-e-IslamAcademy of Quaranic StudiesMemon Health and Education FoundationBait-ul-SukoonChiniot Anjuman IslamiaKiran Patient Welfare AssociationSpencers Eye Hospital
1,000 960 960960 960 960 860 750 600 600 500 500 500 500 500 500 500 480 450 375 250 250 250 250 250 250 250 250 250 250 250 250 200 200 200 200 200 175 150 120
– – – – –
34,760
1,200960
3,500960 960 960 960 500 250 600 500
– 450 450 500 500 – 500 500
– 300 250 200 200
– 500 250 250 500 250 500 500 200
– 300
– 250
– 125 120
4,800 250 250 250 250
31,845
130
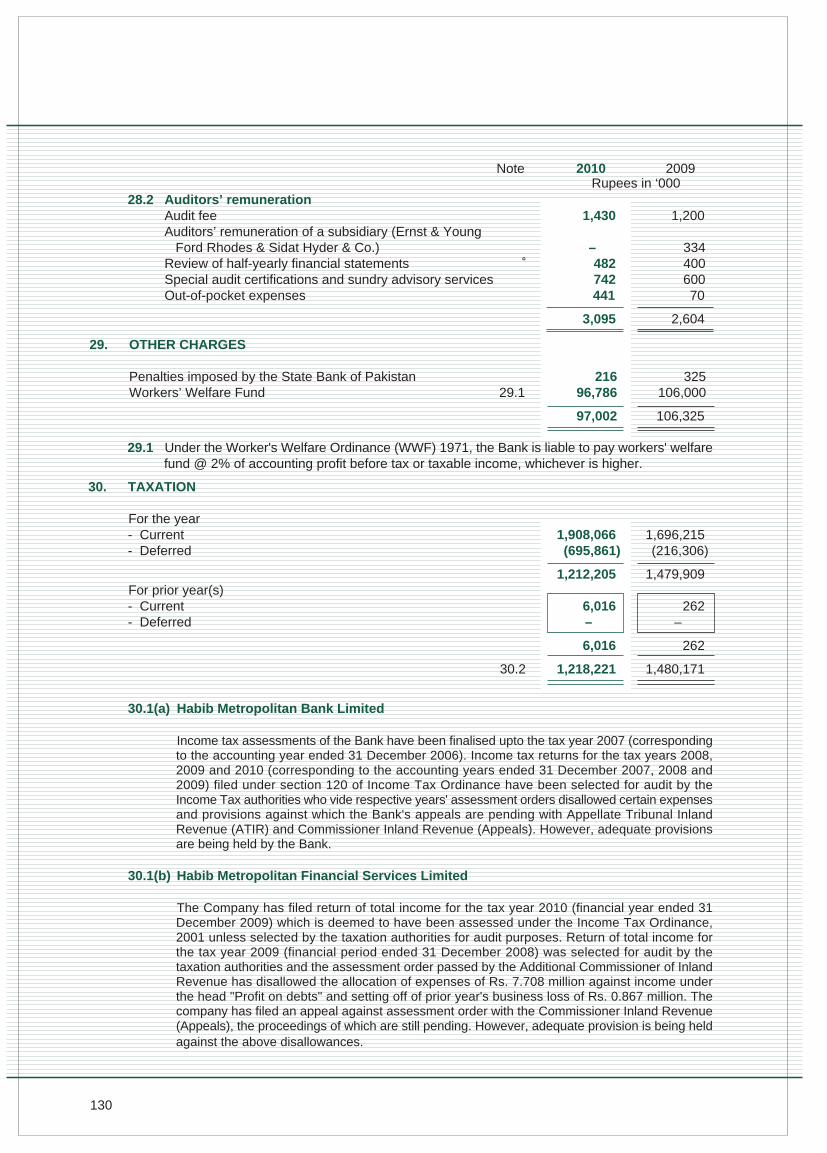
28.2 Auditors’ remunerationAudit fee 1,430 1,200Auditors’ remuneration of a subsidiary (Ernst & Young Ford Rhodes & Sidat Hyder & Co.) – 334Review of half-yearly financial statements 482 400Special audit certifications and sundry advisory services 742 600Out-of-pocket expenses 441 70
3,095 2,604
29.1 Under the Worker's Welfare Ordinance (WWF) 1971, the Bank is liable to pay workers' welfarefund @ 2% of accounting profit before tax or taxable income, whichever is higher.
30. TAXATION
For the year- Current 1,908,066 1,696,215
- Deferred (695,861) (216,306)
1,212,205 1,479,909For prior year(s)- Current 6,016 262
- Deferred – –
6,016 262
30.2 1,218,221 1,480,171
30.1(a) Habib Metropolitan Bank Limited
Income tax assessments of the Bank have been finalised upto the tax year 2007 (correspondingto the accounting year ended 31 December 2006). Income tax returns for the tax years 2008,2009 and 2010 (corresponding to the accounting years ended 31 December 2007, 2008 and2009) filed under section 120 of Income Tax Ordinance have been selected for audit by theIncome Tax authorities who vide respective years' assessment orders disallowed certain expensesand provisions against which the Bank's appeals are pending with Appellate Tribunal InlandRevenue (ATIR) and Commissioner Inland Revenue (Appeals). However, adequate provisionsare being held by the Bank.
30.1(b) Habib Metropolitan Financial Services Limited
The Company has filed return of total income for the tax year 2010 (financial year ended 31December 2009) which is deemed to have been assessed under the Income Tax Ordinance,2001 unless selected by the taxation authorities for audit purposes. Return of total income forthe tax year 2009 (financial period ended 31 December 2008) was selected for audit by thetaxation authorities and the assessment order passed by the Additional Commissioner of InlandRevenue has disallowed the allocation of expenses of Rs. 7.708 million against income underthe head "Profit on debts" and setting off of prior year's business loss of Rs. 0.867 million. Thecompany has filed an appeal against assessment order with the Commissioner Inland Revenue(Appeals), the proceedings of which are still pending. However, adequate provision is being heldagainst the above disallowances.
29. OTHER CHARGES
Penalties imposed by the State Bank of Pakistan 216 325Workers’ Welfare Fund 29.1 96,786 106,000
97,002 106,325
Rupees in ‘0002010 2009Note
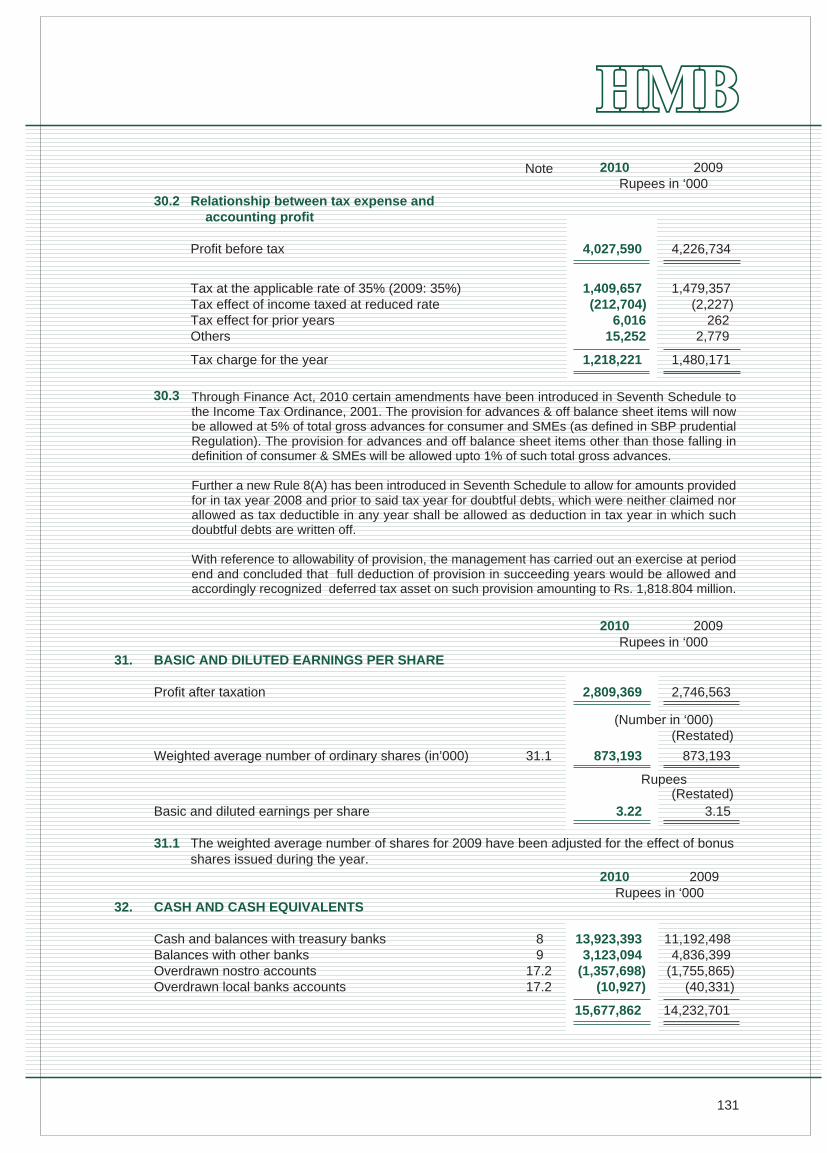
131
30.2 Relationship between tax expense and accounting profit
Profit before tax 4,027,590 4,226,734
Tax at the applicable rate of 35% (2009: 35%) 1,409,657 1,479,357Tax effect of income taxed at reduced rate (212,704) (2,227)Tax effect for prior years 6,016 262Others 15,252 2,779
Tax charge for the year 1,218,221 1,480,171
30.3
Rupees in ‘0002010 2009
Through Finance Act, 2010 certain amendments have been introduced in Seventh Schedule tothe Income Tax Ordinance, 2001. The provision for advances & off balance sheet items will nowbe allowed at 5% of total gross advances for consumer and SMEs (as defined in SBP prudentialRegulation). The provision for advances and off balance sheet items other than those falling indefinition of consumer & SMEs will be allowed upto 1% of such total gross advances.
Further a new Rule 8(A) has been introduced in Seventh Schedule to allow for amounts providedfor in tax year 2008 and prior to said tax year for doubtful debts, which were neither claimed norallowed as tax deductible in any year shall be allowed as deduction in tax year in which suchdoubtful debts are written off.
With reference to allowability of provision, the management has carried out an exercise at periodend and concluded that full deduction of provision in succeeding years would be allowed andaccordingly recognized deferred tax asset on such provision amounting to Rs. 1,818.804 million.
31. BASIC AND DILUTED EARNINGS PER SHARE
Profit after taxation 2,809,369 2,746,563
Weighted average number of ordinary shares (in’000) 31.1 873,193 873,193
Basic and diluted earnings per share 3.22 3.15
31.1 The weighted average number of shares for 2009 have been adjusted for the effect of bonus shares issued during the year.
32. CASH AND CASH EQUIVALENTS
Cash and balances with treasury banks 8 13,923,393 11,192,498Balances with other banks 9 3,123,094 4,836,399Overdrawn nostro accounts 17.2 (1,357,698) (1,755,865)Overdrawn local banks accounts 17.2 (10,927) (40,331)
15,677,862 14,232,701
Rupees in ‘0002010 2009
(Number in ‘000)
Rupees
Rupees in ‘0002010 2009
(Restated)
(Restated)
Note
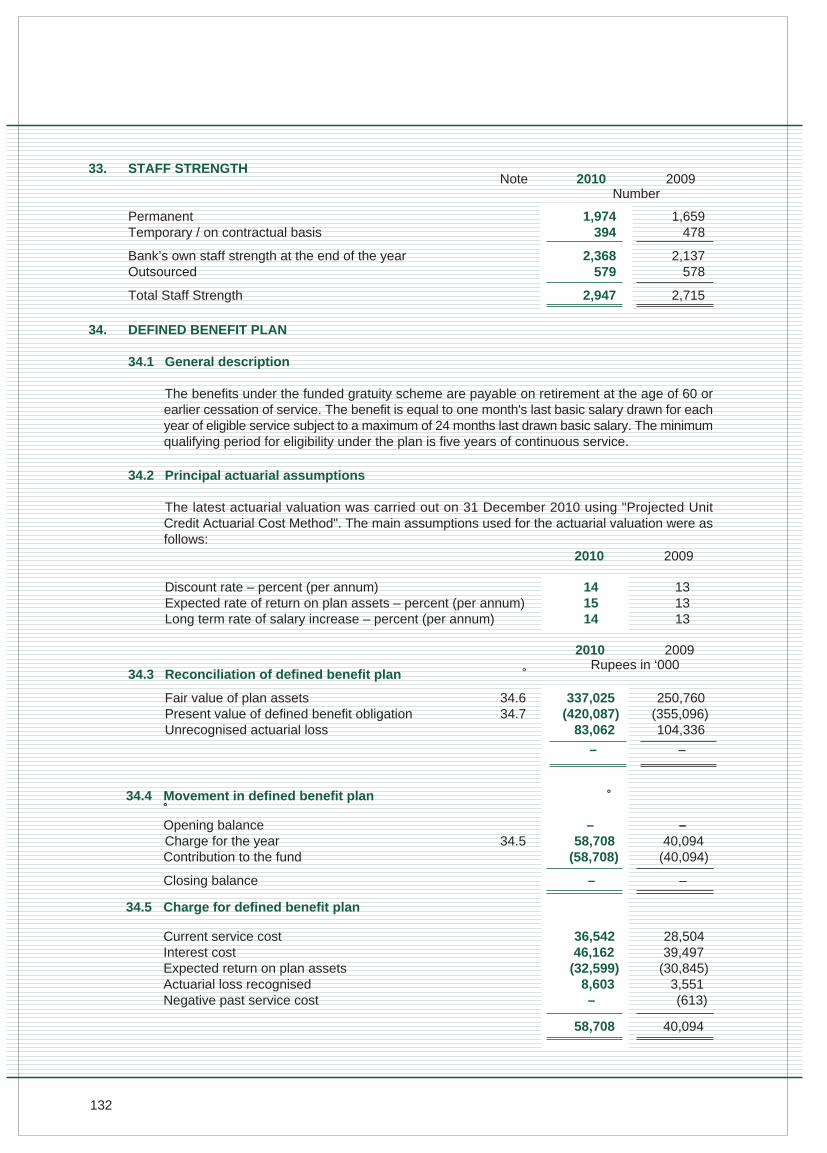
132
33. STAFF STRENGTH
Permanent 1,974 1,659Temporary / on contractual basis 394 478
Bank’s own staff strength at the end of the year 2,368 2,137Outsourced 579 578
Total Staff Strength 2,947 2,715
Number2010 2009
34. DEFINED BENEFIT PLAN
34.1 General description
The benefits under the funded gratuity scheme are payable on retirement at the age of 60 orearlier cessation of service. The benefit is equal to one month's last basic salary drawn for eachyear of eligible service subject to a maximum of 24 months last drawn basic salary. The minimumqualifying period for eligibility under the plan is five years of continuous service.
34.2 Principal actuarial assumptions
The latest actuarial valuation was carried out on 31 December 2010 using "Projected UnitCredit Actuarial Cost Method". The main assumptions used for the actuarial valuation were asfollows:
Discount rate – percent (per annum) 14 13Expected rate of return on plan assets – percent (per annum) 15 13Long term rate of salary increase – percent (per annum) 14 13
34.3 Reconciliation of defined benefit plan
Fair value of plan assets 34.6 337,025 250,760Present value of defined benefit obligation 34.7 (420,087) (355,096)Unrecognised actuarial loss 83,062 104,336
– –
34.4 Movement in defined benefit plan Opening balance – –Charge for the year 34.5 58,708 40,094Contribution to the fund (58,708) (40,094)
Closing balance – –
34.5 Charge for defined benefit plan
Current service cost 36,542 28,504Interest cost 46,162 39,497Expected return on plan assets (32,599) (30,845)Actuarial loss recognised 8,603 3,551Negative past service cost – (613)
58,708 40,094
Rupees in ‘0002010 2009
2010 2009
Note
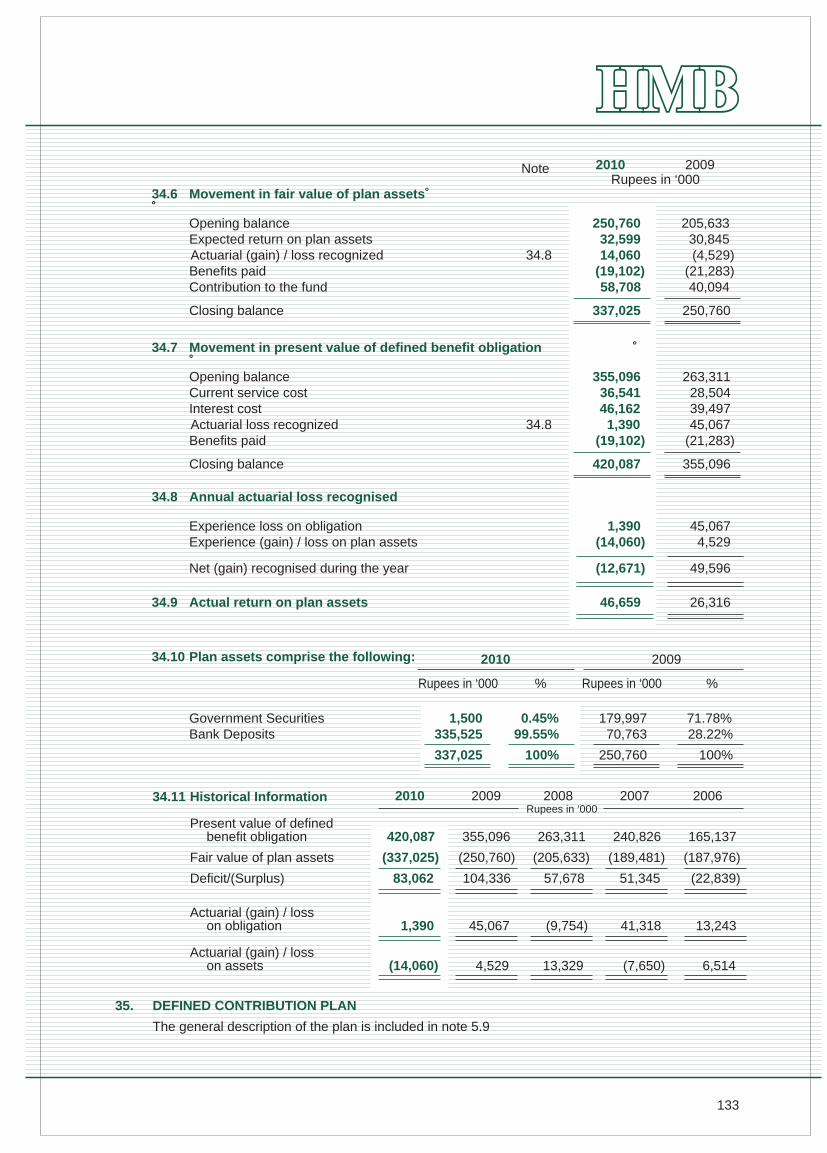
133
Rupees in ‘0002010 2009
34.8 Annual actuarial loss recognised
Experience loss on obligation 1,390 45,067Experience (gain) / loss on plan assets (14,060) 4,529
Net (gain) recognised during the year (12,671) 49,596
34.9 Actual return on plan assets 46,659 26,316
34.10 Plan assets comprise the following:
Rupees in ‘000 % Rupees in ‘000 %
Government Securities 1,500 0.45% 179,997 71.78%Bank Deposits 335,525 99.55% 70,763 28.22%
337,025 100% 250,760 100%
34.11 Historical Information
Present value of definedbenefit obligation 420,087 355,096 263,311 240,826 165,137
Fair value of plan assets (337,025) (250,760) (205,633) (189,481) (187,976)
Deficit/(Surplus) 83,062 104,336 57,678 51,345 (22,839)
Actuarial (gain) / losson obligation 1,390 45,067 (9,754) 41,318 13,243
Actuarial (gain) / losson assets (14,060) 4,529 13,329 (7,650) 6,514
2010 2009
2010 2009 2008Rupees in ‘000
35. DEFINED CONTRIBUTION PLAN
The general description of the plan is included in note 5.9
2007 2006
34.7 Movement in present value of defined benefit obligation Opening balance 355,096 263,311Current service cost 36,541 28,504Interest cost 46,162 39,497Actuarial loss recognized 34.8 1,390 45,067Benefits paid (19,102) (21,283)
Closing balance 420,087 355,096
34.6 Movement in fair value of plan assets
Opening balance 250,760 205,633Expected return on plan assets 32,599 30,845Actuarial (gain) / loss recognized 34.8 14,060 (4,529)Benefits paid (19,102) (21,283)Contribution to the fund 58,708 40,094
Closing balance 337,025 250,760
Note
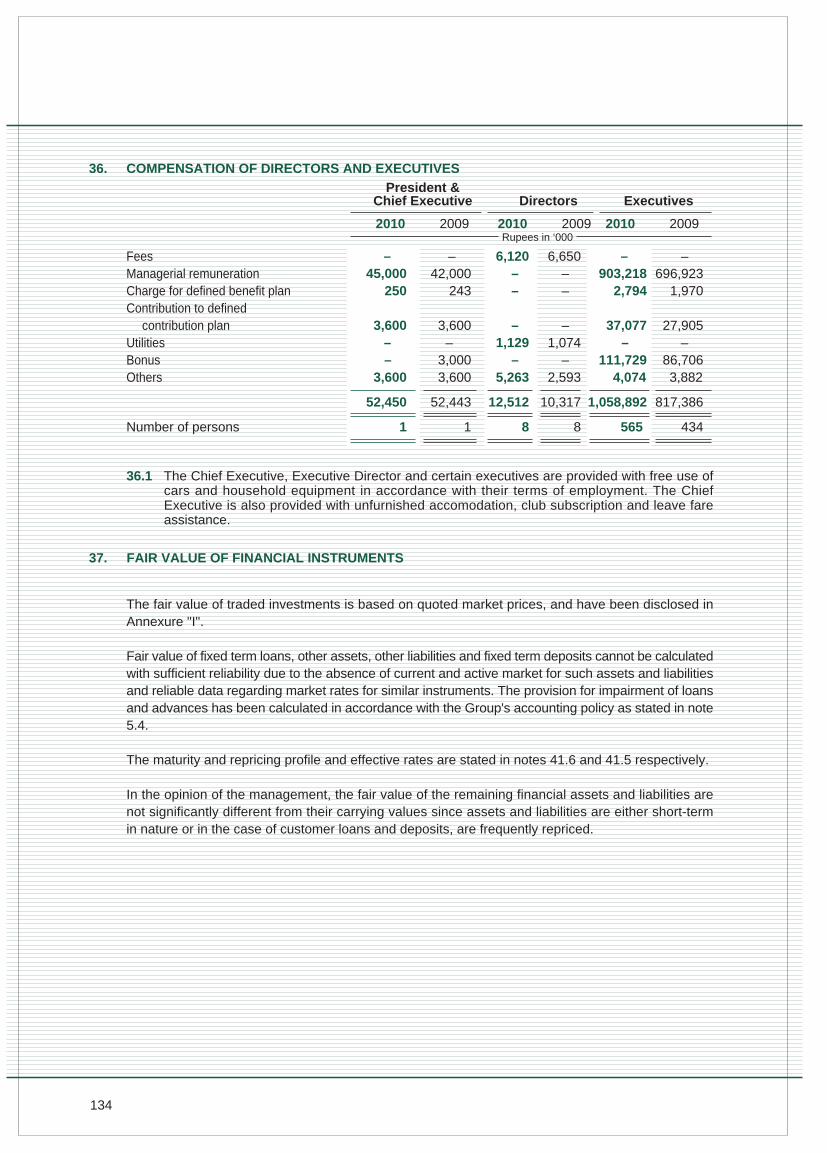
134
The fair value of traded investments is based on quoted market prices, and have been disclosed inAnnexure "I".
Fair value of fixed term loans, other assets, other liabilities and fixed term deposits cannot be calculatedwith sufficient reliability due to the absence of current and active market for such assets and liabilitiesand reliable data regarding market rates for similar instruments. The provision for impairment of loansand advances has been calculated in accordance with the Group's accounting policy as stated in note5.4.
The maturity and repricing profile and effective rates are stated in notes 41.6 and 41.5 respectively.
In the opinion of the management, the fair value of the remaining financial assets and liabilities arenot significantly different from their carrying values since assets and liabilities are either short-termin nature or in the case of customer loans and deposits, are frequently repriced.
36. COMPENSATION OF DIRECTORS AND EXECUTIVES
Fees – – 6,120 6,650 – –Managerial remuneration 45,000 42,000 – – 903,218 696,923Charge for defined benefit plan 250 243 – – 2,794 1,970Contribution to defined
contribution plan 3,600 3,600 – – 37,077 27,905Utilities – – 1,129 1,074 – –Bonus – 3,000 – – 111,729 86,706Others 3,600 3,600 5,263 2,593 4,074 3,882
52,450 52,443 12,512 10,317 1,058,892 817,386
Number of persons 1 1 8 8 565 434
36.1 The Chief Executive, Executive Director and certain executives are provided with free use ofcars and household equipment in accordance with their terms of employment. The ChiefExecutive is also provided with unfurnished accomodation, club subscription and leave fareassistance.
37. FAIR VALUE OF FINANCIAL INSTRUMENTS
2010 2009
President &Chief Executive Directors Executives
Rupees in ‘0002010 2009 2010 2009
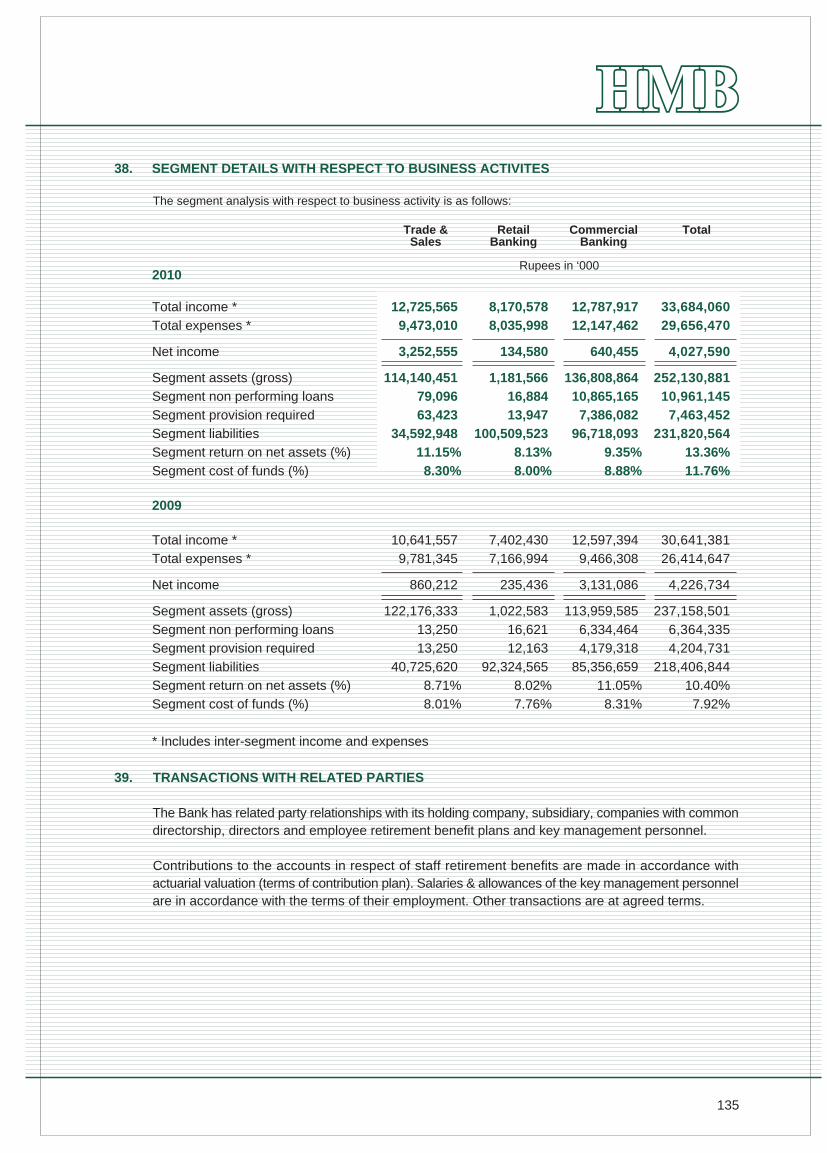
135
38. SEGMENT DETAILS WITH RESPECT TO BUSINESS ACTIVITES
The segment analysis with respect to business activity is as follows:
2010
Total income * 12,725,565 8,170,578 12,787,917 33,684,060
Total expenses * 9,473,010 8,035,998 12,147,462 29,656,470
Net income 3,252,555 134,580 640,455 4,027,590
Segment assets (gross) 114,140,451 1,181,566 136,808,864 252,130,881
Segment non performing loans 79,096 16,884 10,865,165 10,961,145
Segment provision required 63,423 13,947 7,386,082 7,463,452
Segment liabilities 34,592,948 100,509,523 96,718,093 231,820,564
Segment return on net assets (%) 11.15% 8.13% 9.35% 13.36%
Segment cost of funds (%) 8.30% 8.00% 8.88% 11.76%
2009
Total income * 10,641,557 7,402,430 12,597,394 30,641,381
Total expenses * 9,781,345 7,166,994 9,466,308 26,414,647
Net income 860,212 235,436 3,131,086 4,226,734
Segment assets (gross) 122,176,333 1,022,583 113,959,585 237,158,501
Segment non performing loans 13,250 16,621 6,334,464 6,364,335
Segment provision required 13,250 12,163 4,179,318 4,204,731
Segment liabilities 40,725,620 92,324,565 85,356,659 218,406,844
Segment return on net assets (%) 8.71% 8.02% 11.05% 10.40%
Segment cost of funds (%) 8.01% 7.76% 8.31% 7.92%
* Includes inter-segment income and expenses
39. TRANSACTIONS WITH RELATED PARTIES
The Bank has related party relationships with its holding company, subsidiary, companies with commondirectorship, directors and employee retirement benefit plans and key management personnel.
Contributions to the accounts in respect of staff retirement benefits are made in accordance withactuarial valuation (terms of contribution plan). Salaries & allowances of the key management personnelare in accordance with the terms of their employment. Other transactions are at agreed terms.
RetailBanking
CommercialBanking
Trade &Sales
Rupees in ‘000
Total
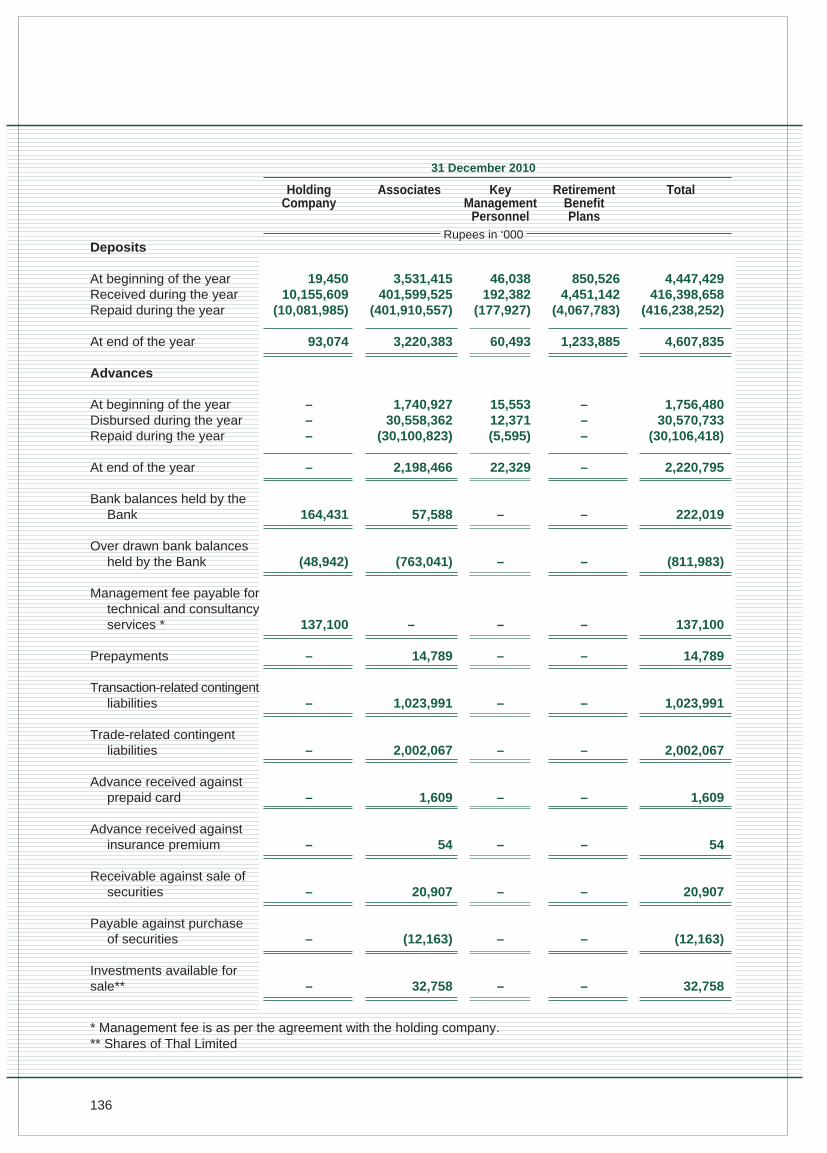
136
HoldingCompany
Associates KeyManagement
Personnel
RetirementBenefitPlans
Total
Rupees in ‘000
31 December 2010
Deposits
At beginning of the yearReceived during the yearRepaid during the year
At end of the year
Advances
At beginning of the yearDisbursed during the yearRepaid during the year
At end of the year
Bank balances held by the Bank
Over drawn bank balancesheld by the Bank
Management fee payable fortechnical and consultancyservices *
Prepayments
Transaction-related contingentliabilities
Trade-related contingent liabilities
Advance received against prepaid card
Advance received against insurance premium
Receivable against sale of securities
Payable against purchaseof securities
Investments available forsale**
19,450 10,155,609
(10,081,985)
93,074
–––
–
164,431
(48,942)
137,100
–
–
–
–
–
–
–
–
3,531,415 401,599,525
(401,910,557)
3,220,383
1,740,927 30,558,362
(30,100,823)
2,198,466
57,588
(763,041)
–
14,789
1,023,991
2,002,067
1,609
54
20,907
(12,163)
32,758
46,038 192,382
(177,927)
60,493
15,553 12,371 (5,595)
22,329
–
–
–
–
–
–
–
–
–
–
–
850,526 4,451,142
(4,067,783)
1,233,885
–––
–
–
–
–
–
–
–
–
–
–
–
–
4,447,429 416,398,658
(416,238,252)
4,607,835
1,756,480 30,570,733
(30,106,418)
2,220,795
222,019
(811,983)
137,100
14,789
1,023,991
2,002,067
1,609
54
20,907
(12,163)
32,758
* Management fee is as per the agreement with the holding company.** Shares of Thal Limited
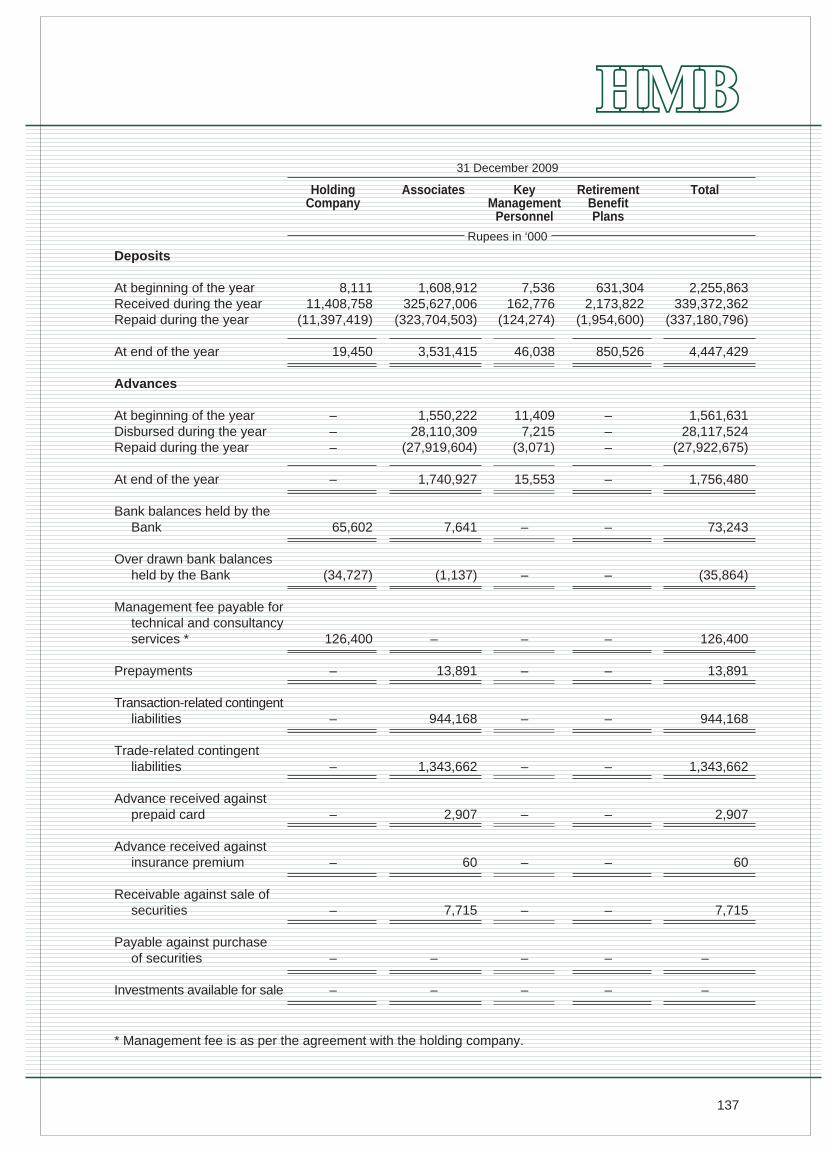
137
HoldingCompany
Associates KeyManagement
Personnel
RetirementBenefitPlans
Total
Rupees in ‘000
31 December 2009
Deposits
At beginning of the yearReceived during the yearRepaid during the year
At end of the year
Advances
At beginning of the yearDisbursed during the yearRepaid during the year
At end of the year
Bank balances held by the Bank
Over drawn bank balancesheld by the Bank
Management fee payable fortechnical and consultancyservices *
Prepayments
Transaction-related contingentliabilities
Trade-related contingent liabilities
Advance received against prepaid card
Advance received against insurance premium
Receivable against sale of securities
Payable against purchaseof securities
Investments available for sale
8,111 11,408,758
(11,397,419)
19,450
–––
–
65,602
(34,727)
126,400
–
–
–
–
–
–
–
–
1,608,912 325,627,006
(323,704,503)
3,531,415
1,550,222 28,110,309
(27,919,604)
1,740,927
7,641
(1,137)
–
13,891
944,168
1,343,662
2,907
60
7,715
–
–
7,536 162,776
(124,274)
46,038
11,409 7,215
(3,071)
15,553
–
–
–
–
–
–
–
–
–
–
–
631,304 2,173,822
(1,954,600)
850,526
–––
–
–
–
–
–
–
–
–
–
–
–
–
2,255,863 339,372,362
(337,180,796)
4,447,429
1,561,631 28,117,524
(27,922,675)
1,756,480
73,243
(35,864)
126,400
13,891
944,168
1,343,662
2,907
60
7,715
–
–
* Management fee is as per the agreement with the holding company.
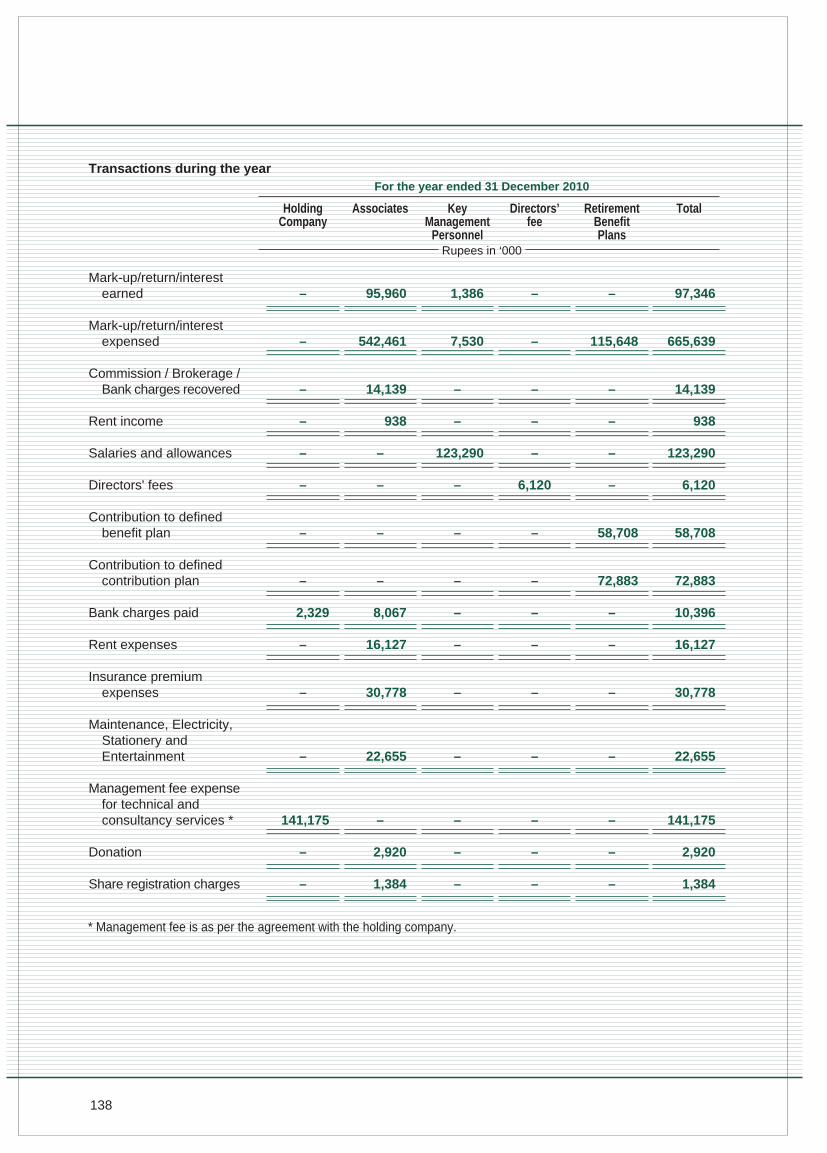
138
HoldingCompany
Associates KeyManagement
Personnel
RetirementBenefitPlans
Total
Rupees in ‘000
For the year ended 31 December 2010
Directors’fee
Transactions during the year
–
–
–
–
–
–
–
–
2,329
–
–
–
141,175
–
–
Mark-up/return/interestearned
Mark-up/return/interestexpensed
Commission / Brokerage /Bank charges recovered
Rent income
Salaries and allowances
Directors' fees
Contribution to definedbenefit plan
Contribution to definedcontribution plan
Bank charges paid
Rent expenses
Insurance premiumexpenses
Maintenance, Electricity,Stationery andEntertainment
Management fee expensefor technical andconsultancy services *
Donation
Share registration charges
95,960
542,461
14,139
938
–
–
–
–
8,067
16,127
30,778
22,655
–
2,920
1,384
1,386
7,530
–
–
123,290
–
–
–
–
–
–
–
–
–
–
–
–
–
–
–
6,120
–
–
–
–
–
–
–
–
–
–
115,648
–
–
–
–
58,708
72,883
–
–
–
–
–
–
–
97,346
665,639
14,139
938
123,290
6,120
58,708
72,883
10,396
16,127
30,778
22,655
141,175
2,920
1,384
* Management fee is as per the agreement with the holding company.
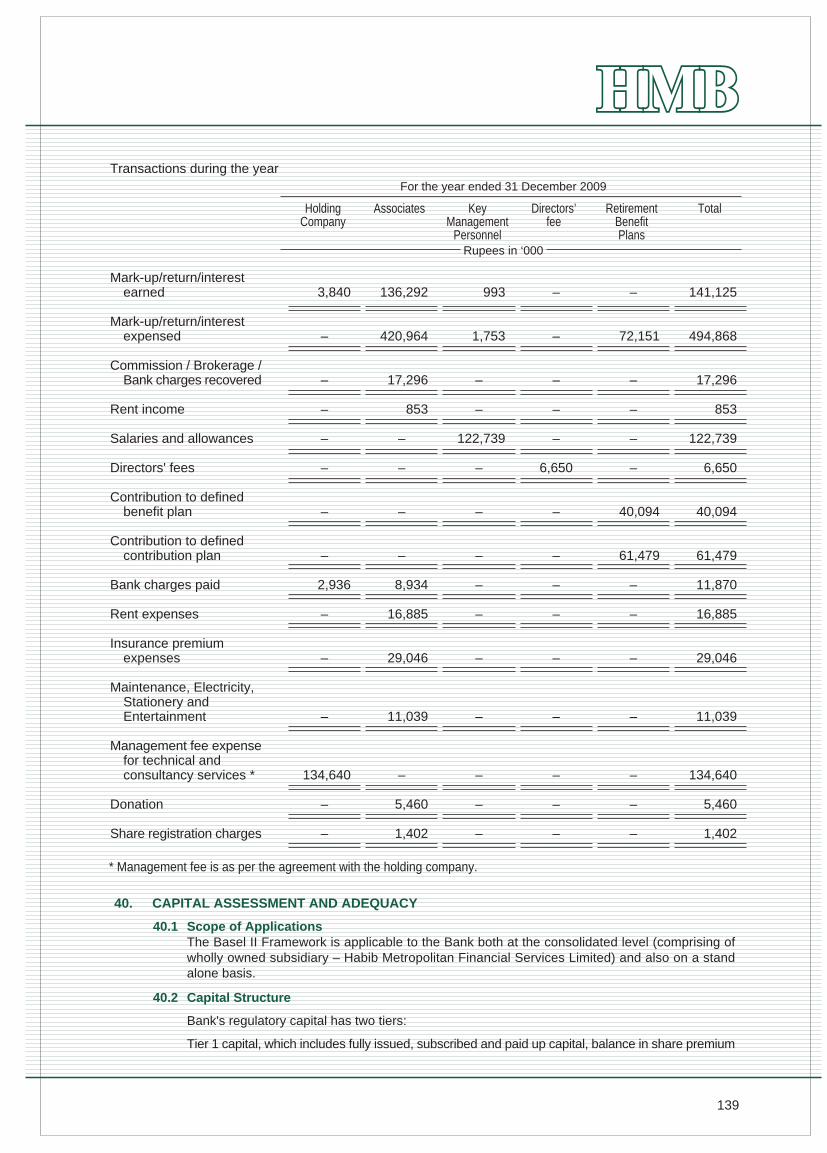
139
40. CAPITAL ASSESSMENT AND ADEQUACY
40.1 Scope of ApplicationsThe Basel II Framework is applicable to the Bank both at the consolidated level (comprising ofwholly owned subsidiary – Habib Metropolitan Financial Services Limited) and also on a standalone basis.
* Management fee is as per the agreement with the holding company.
HoldingCompany
Associates KeyManagement
Personnel
RetirementBenefitPlans
Total
Rupees in ‘000
For the year ended 31 December 2009
Directors’fee
Transactions during the year
3,840
–
–
–
–
–
–
–
2,936
–
–
–
134,640
–
–
Mark-up/return/interestearned
Mark-up/return/interestexpensed
Commission / Brokerage /Bank charges recovered
Rent income
Salaries and allowances
Directors' fees
Contribution to definedbenefit plan
Contribution to definedcontribution plan
Bank charges paid
Rent expenses
Insurance premiumexpenses
Maintenance, Electricity,Stationery andEntertainment
Management fee expensefor technical andconsultancy services *
Donation
Share registration charges
136,292
420,964
17,296
853
–
–
–
–
8,934
16,885
29,046
11,039
–
5,460
1,402
993
1,753
–
–
122,739
–
–
–
–
–
–
–
–
–
–
–
–
–
–
–
6,650
–
–
–
–
–
–
–
–
–
–
72,151
–
–
–
–
40,094
61,479
–
–
–
–
–
–
–
141,125
494,868
17,296
853
122,739
6,650
40,094
61,479
11,870
16,885
29,046
11,039
134,640
5,460
1,402
40.2 Capital Structure
Bank's regulatory capital has two tiers:
Tier 1 capital, which includes fully issued, subscribed and paid up capital, balance in share premium
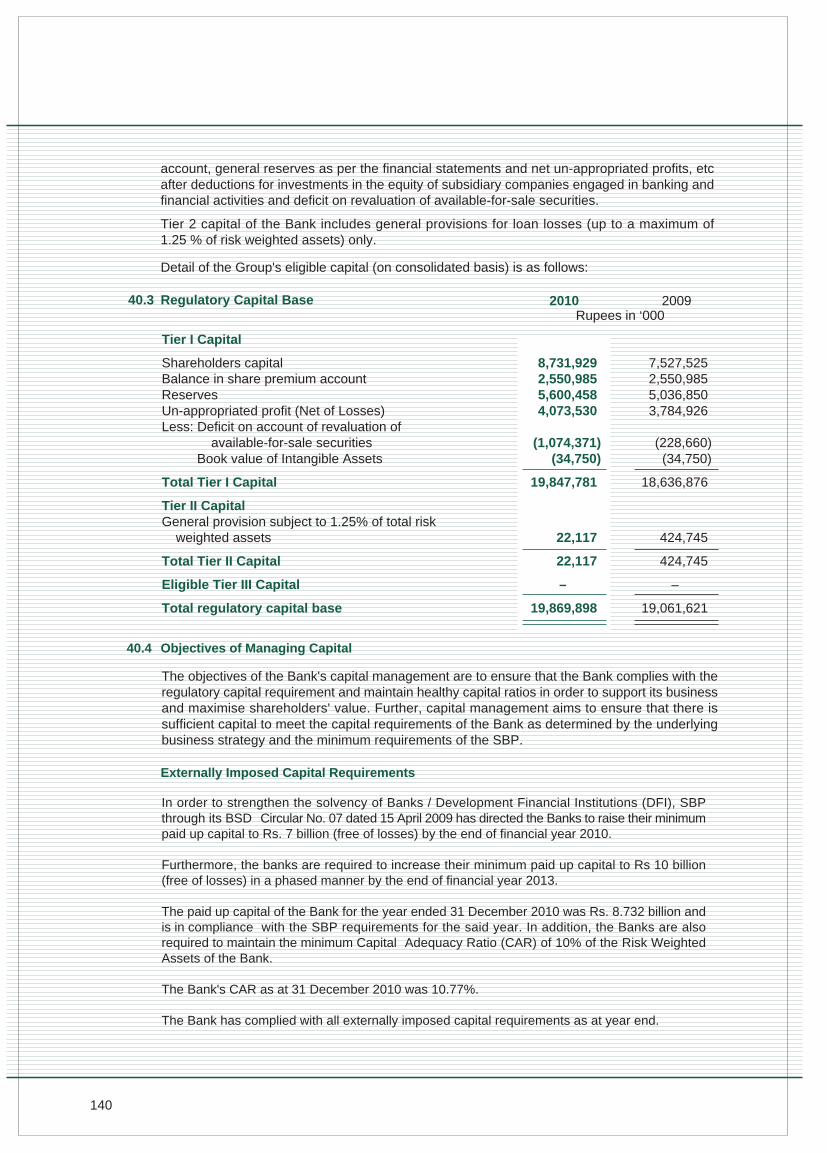
140
account, general reserves as per the financial statements and net un-appropriated profits, etcafter deductions for investments in the equity of subsidiary companies engaged in banking andfinancial activities and deficit on revaluation of available-for-sale securities.
Tier 2 capital of the Bank includes general provisions for loan losses (up to a maximum of1.25 % of risk weighted assets) only.
40.3 Regulatory Capital Base
Tier I Capital
Shareholders capital 8,731,929 7,527,525Balance in share premium account 2,550,985 2,550,985Reserves 5,600,458 5,036,850Un-appropriated profit (Net of Losses) 4,073,530 3,784,926Less: Deficit on account of revaluation of
available-for-sale securities (1,074,371) (228,660) Book value of Intangible Assets (34,750) (34,750)
Total Tier I Capital 19,847,781 18,636,876
Tier II CapitalGeneral provision subject to 1.25% of total risk
weighted assets 22,117 424,745
Total Tier II Capital 22,117 424,745
Eligible Tier III Capital – –
Total regulatory capital base 19,869,898 19,061,621
Rupees in ‘0002010 2009
Detail of the Group's eligible capital (on consolidated basis) is as follows:
40.4 Objectives of Managing Capital
Externally Imposed Capital Requirements
The objectives of the Bank's capital management are to ensure that the Bank complies with theregulatory capital requirement and maintain healthy capital ratios in order to support its businessand maximise shareholders' value. Further, capital management aims to ensure that there issufficient capital to meet the capital requirements of the Bank as determined by the underlyingbusiness strategy and the minimum requirements of the SBP.
In order to strengthen the solvency of Banks / Development Financial Institutions (DFI), SBPthrough its BSD Circular No. 07 dated 15 April 2009 has directed the Banks to raise their minimumpaid up capital to Rs. 7 billion (free of losses) by the end of financial year 2010.
Furthermore, the banks are required to increase their minimum paid up capital to Rs 10 billion(free of losses) in a phased manner by the end of financial year 2013.
The paid up capital of the Bank for the year ended 31 December 2010 was Rs. 8.732 billion andis in compliance with the SBP requirements for the said year. In addition, the Banks are alsorequired to maintain the minimum Capital Adequacy Ratio (CAR) of 10% of the Risk WeightedAssets of the Bank.
The Bank's CAR as at 31 December 2010 was 10.77%.
The Bank has complied with all externally imposed capital requirements as at year end.
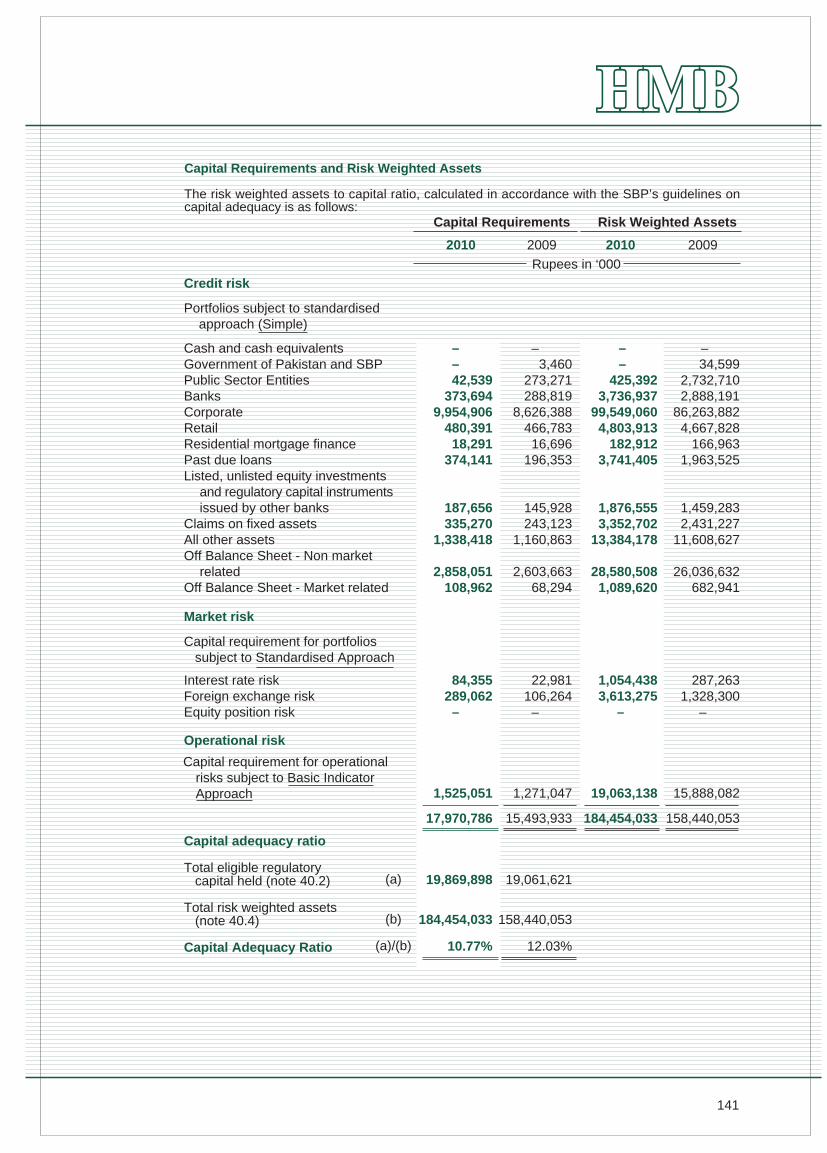
141
2010
Capital Requirements Risk Weighted Assets
Rupees in ‘000
2009 2010 2009
The risk weighted assets to capital ratio, calculated in accordance with the SBP’s guidelines oncapital adequacy is as follows:
Capital Requirements and Risk Weighted Assets
Credit risk
––
42,539 373,694
9,954,906 480,391
18,291 374,141
187,656 335,270
1,338,418
2,858,051 108,962
Cash and cash equivalentsGovernment of Pakistan and SBPPublic Sector EntitiesBanksCorporateRetailResidential mortgage financePast due loansListed, unlisted equity investments
and regulatory capital instrumentsissued by other banks
Claims on fixed assetsAll other assetsOff Balance Sheet - Non market
relatedOff Balance Sheet - Market related
–3,460
273,271 288,819
8,626,388 466,783
16,696 196,353
145,928 243,123
1,160,863
2,603,663 68,294
Market risk
84,355 289,062
–
Interest rate riskForeign exchange riskEquity position risk
22,981106,264–
Operational risk
1,525,051 1,271,047
17,970,786 15,493,933
– –
425,392 3,736,937
99,549,060 4,803,913
182,912 3,741,405
1,876,555 3,352,702
13,384,178
28,580,508 1,089,620
–34,599
2,732,710 2,888,191
86,263,882 4,667,828
166,963 1,963,525
1,459,283 2,431,227
11,608,627
26,036,632 682,941
1,054,438 3,613,275
–
287,263 1,328,300
–
19,063,138 15,888,082
184,454,033 158,440,053
Capital requirement for portfolios subject to Standardised Approach
Capital requirement for operationalrisks subject to Basic IndicatorApproach
Portfolios subject to standardisedapproach (Simple)
Capital adequacy ratio
Total eligible regulatorycapital held (note 40.2)
Total risk weighted assets(note 40.4)
Capital Adequacy Ratio
19,869,898
184,454,033
10.77%
19,061,621
158,440,053
12.03%
(a)
(b)
(a)/(b)
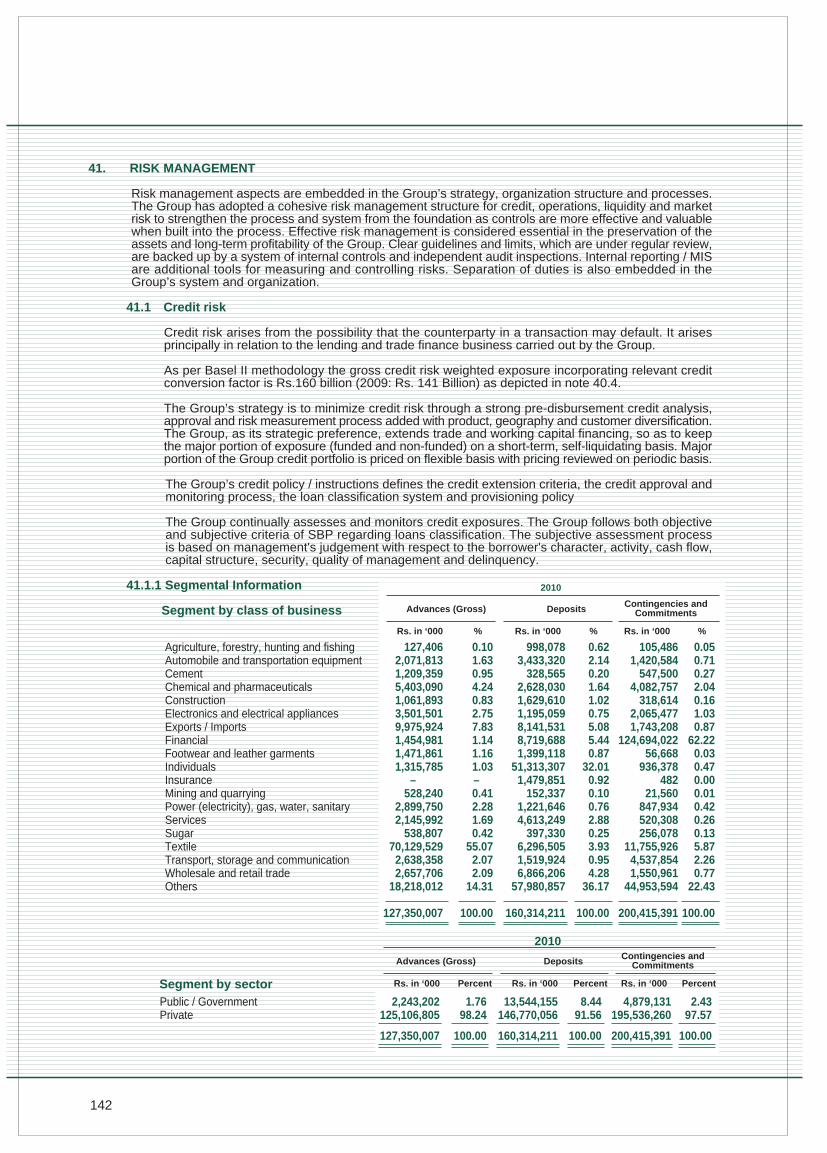
142
41. RISK MANAGEMENT
Risk management aspects are embedded in the Group’s strategy, organization structure and processes.The Group has adopted a cohesive risk management structure for credit, operations, liquidity and marketrisk to strengthen the process and system from the foundation as controls are more effective and valuablewhen built into the process. Effective risk management is considered essential in the preservation of theassets and long-term profitability of the Group. Clear guidelines and limits, which are under regular review,are backed up by a system of internal controls and independent audit inspections. Internal reporting / MISare additional tools for measuring and controlling risks. Separation of duties is also embedded in theGroup’s system and organization.
41.1 Credit risk
Credit risk arises from the possibility that the counterparty in a transaction may default. It arisesprincipally in relation to the lending and trade finance business carried out by the Group.
As per Basel II methodology the gross credit risk weighted exposure incorporating relevant creditconversion factor is Rs.160 billion (2009: Rs. 141 Billion) as depicted in note 40.4.
The Group’s strategy is to minimize credit risk through a strong pre-disbursement credit analysis,approval and risk measurement process added with product, geography and customer diversification.The Group, as its strategic preference, extends trade and working capital financing, so as to keepthe major portion of exposure (funded and non-funded) on a short-term, self-liquidating basis. Majorportion of the Group credit portfolio is priced on flexible basis with pricing reviewed on periodic basis.
The Group’s credit policy / instructions defines the credit extension criteria, the credit approval andmonitoring process, the loan classification system and provisioning policy
The Group continually assesses and monitors credit exposures. The Group follows both objectiveand subjective criteria of SBP regarding loans classification. The subjective assessment processis based on management's judgement with respect to the borrower's character, activity, cash flow,capital structure, security, quality of management and delinquency.
41.1.1 Segmental Information
Segment by class of business
2010
Advances (Gross)
Rs. in ‘000 %
Contingencies andCommitmentsDeposits
Rs. in ‘000 % Rs. in ‘000 %
Public / Government 2,243,202 1.76 13,544,155 8.44 4,879,131 2.43Private 125,106,805 98.24 146,770,056 91.56 195,536,260 97.57
127,350,007 100.00 160,314,211 100.00 200,415,391 100.00
Segment by sector
2010
Advances (Gross)
Rs. in ‘000 Percent
Contingencies andCommitmentsDeposits
Rs. in ‘000 Percent Rs. in ‘000 Percent
Agriculture, forestry, hunting and fishingAutomobile and transportation equipmentCementChemical and pharmaceuticalsConstructionElectronics and electrical appliancesExports / ImportsFinancialFootwear and leather garmentsIndividualsInsuranceMining and quarryingPower (electricity), gas, water, sanitaryServicesSugarTextileTransport, storage and communicationWholesale and retail tradeOthers
127,406 2,071,813 1,209,359 5,403,090 1,061,893 3,501,501 9,975,924 1,454,981 1,471,861 1,315,785
– 528,240
2,899,750 2,145,992
538,807 70,129,529
2,638,358 2,657,706
18,218,012
127,350,007
998,078 3,433,320
328,565 2,628,030 1,629,610 1,195,059 8,141,531 8,719,688 1,399,118
51,313,307 1,479,851
152,337 1,221,646 4,613,249
397,330 6,296,505 1,519,924 6,866,206
57,980,857
160,314,211
0.10 1.63 0.95 4.24 0.83 2.75 7.83 1.14 1.16 1.03–
0.412.28 1.69 0.42
55.07 2.07 2.09
14.31
100.00
0.62 2.14 0.20 1.64 1.02 0.75 5.08 5.44 0.87
32.01 0.92 0.100.76 2.88 0.25 3.93 0.95 4.28
36.17
100.00
0.05 0.71 0.27 2.04 0.16 1.03 0.87
62.22 0.03 0.47 0.00 0.010.42 0.26 0.13 5.87 2.26 0.77
22.43
100.00
105,486 1,420,584
547,500 4,082,757
318,614 2,065,477 1,743,208
124,694,022 56,668
936,378 482
21,560847,934 520,308 256,078
11,755,926 4,537,854 1,550,961
44,953,594
200,415,391
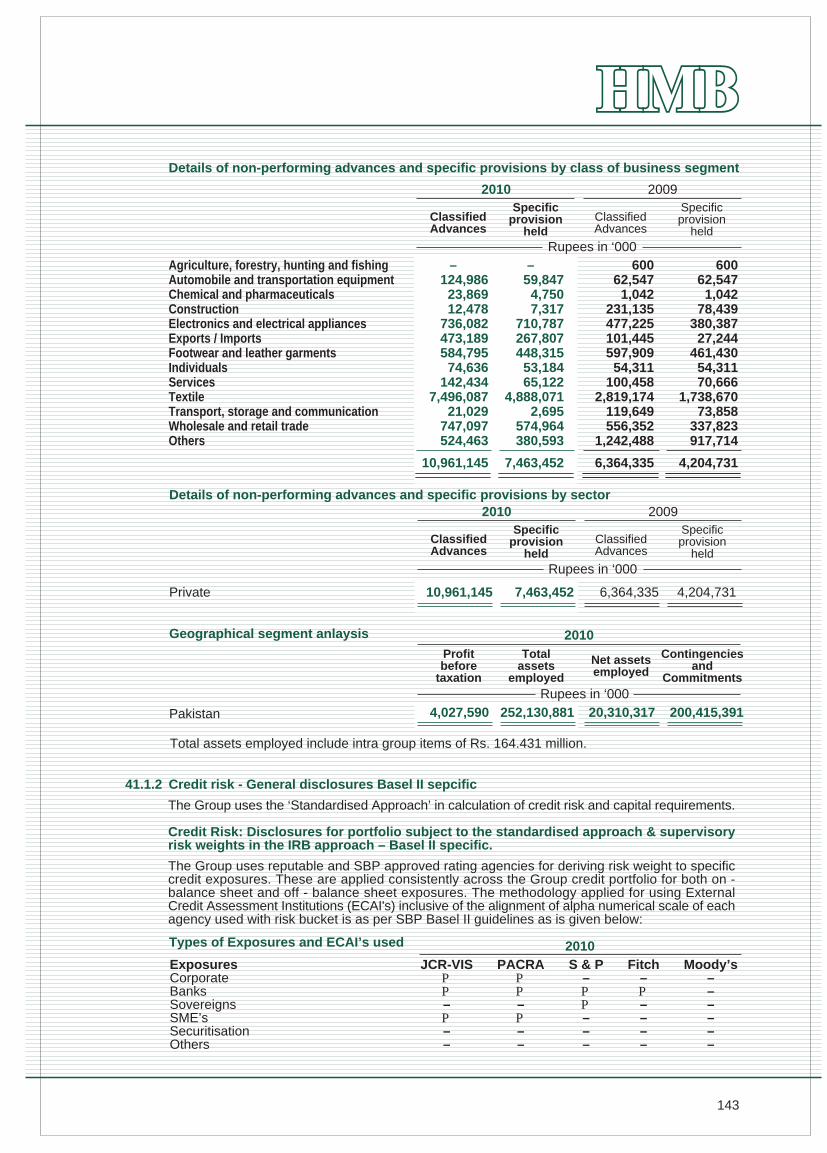
143
41.1.2 Credit risk - General disclosures Basel II sepcific
The Group uses the ‘Standardised Approach’ in calculation of credit risk and capital requirements.
Credit Risk: Disclosures for portfolio subject to the standardised approach & supervisoryrisk weights in the IRB approach – Basel II specific.
The Group uses reputable and SBP approved rating agencies for deriving risk weight to specificcredit exposures. These are applied consistently across the Group credit portfolio for both on -balance sheet and off - balance sheet exposures. The methodology applied for using ExternalCredit Assessment Institutions (ECAI's) inclusive of the alignment of alpha numerical scale of eachagency used with risk bucket is as per SBP Basel II guidelines as is given below:
ExposuresCorporateBanksSovereignsSME’sSecuritisationOthers
Types of Exposures and ECAI’s used
JCR-VISPP–P––
PACRAPP–P––
S & P–PP–––
Fitch–P––––
2010
Profitbefore
taxation
Totalassets
employed
Net assetsemployed
Contingenciesand
Commitments
Pakistan
Total assets employed include intra group items of Rs. 164.431 million.
Details of non-performing advances and specific provisions by sector
Geographical segment anlaysis 2010
Rupees in ‘0004,027,590 252,130,881 20,310,317 200,415,391
10,961,145 7,463,452 6,364,335 4,204,731Private
ClassifiedAdvances
Specificprovision
heldClassifiedAdvances
Specificprovision
held
2010 2009
Rupees in ‘000
Moody’s––––––
Details of non-performing advances and specific provisions by class of business segment
– 124,986
23,869 12,478
736,082 473,189 584,795
74,636142,434
7,496,087 21,029
747,097 524,463
10,961,145
– 59,847
4,750 7,317
710,787 267,807 448,315
53,184 65,122
4,888,071 2,695
574,964380,593
7,463,452
341,254 600 62,547
1,042 231,135 477,225 101,445 597,909
54,311 100,458
2,819,174 119,649 556,352
1,242,488
6,364,335
600 62,547
1,042 78,439
380,387 27,244
461,430 54,31170,666
1,738,670 73,858
337,823 917,714
4,204,731
Agriculture, forestry, hunting and fishingAutomobile and transportation equipmentChemical and pharmaceuticalsConstructionElectronics and electrical appliancesExports / ImportsFootwear and leather garmentsIndividualsServicesTextileTransport, storage and communicationWholesale and retail tradeOthers
ClassifiedAdvances
Specificprovision
heldClassifiedAdvances
Specificprovision
held
2010 2009
Rupees in ‘000
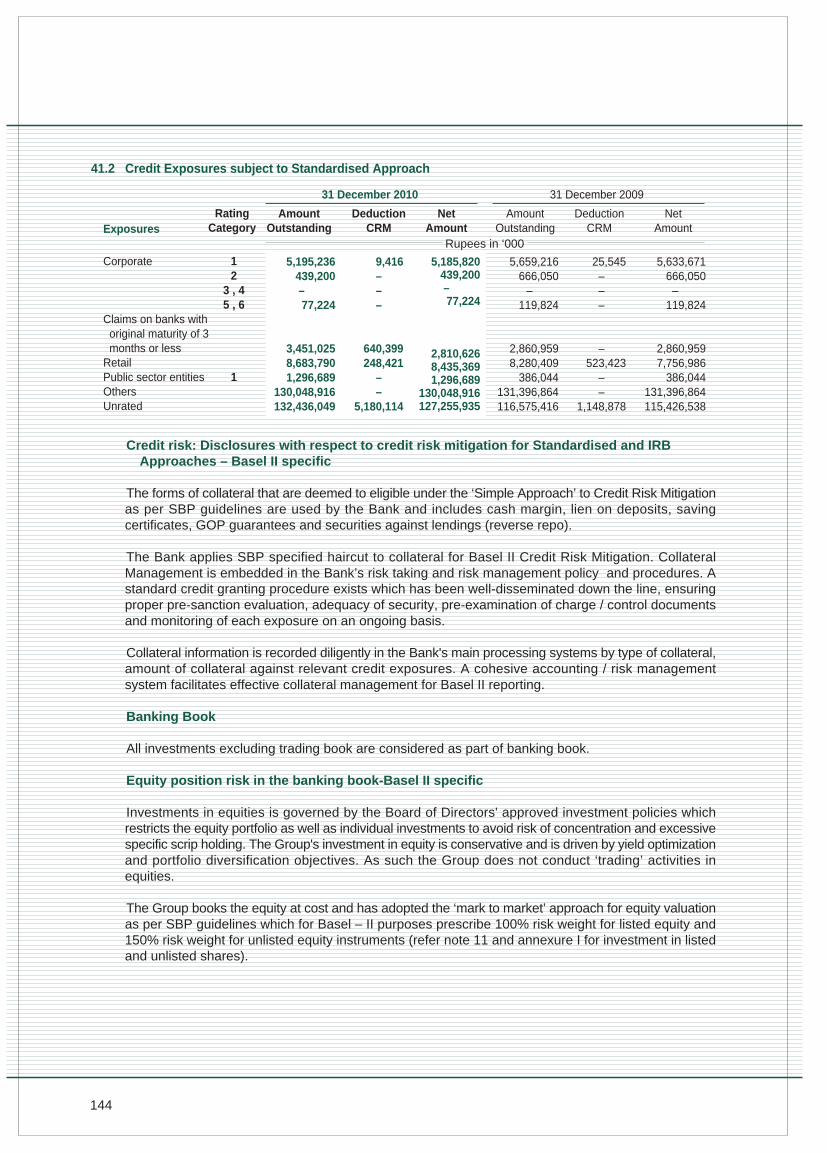
144
Corporate
Claims on banks with original maturity of 3 months or lessRetailPublic sector entitiesOthersUnrated
RatingCategory
AmountOutstanding
DeductionCRM
31 December 2010
Exposures
41.2 Credit Exposures subject to Standardised Approach
5,195,236 439,200– 77,224
3,451,025 8,683,790 1,296,689
130,048,916 132,436,049
9,416–––
640,399248,421
––
5,180,114
Corporate
Claims on banks with original maturity of 3 months or lessRetailPublic sector entitiesOthersUnrated
12
3 , 45 , 6
1
NetAmount
5,185,820 439,200– 77,224
2,810,626 8,435,369 1,296,689
130,048,916 127,255,935
AmountOutstanding
DeductionCRM
31 December 2009
5,659,216666,050 –
119,824
2,860,9598,280,409
386,044131,396,864116,575,416
25,545–––
–523,423
––
1,148,878
NetAmount
5,633,671666,050–
119,824
2,860,9597,756,986
386,044131,396,864115,426,538
Credit risk: Disclosures with respect to credit risk mitigation for Standardised and IRB Approaches – Basel II specific
The forms of collateral that are deemed to eligible under the ‘Simple Approach’ to Credit Risk Mitigationas per SBP guidelines are used by the Bank and includes cash margin, lien on deposits, savingcertificates, GOP guarantees and securities against lendings (reverse repo).
The Bank applies SBP specified haircut to collateral for Basel II Credit Risk Mitigation. CollateralManagement is embedded in the Bank’s risk taking and risk management policy and procedures. Astandard credit granting procedure exists which has been well-disseminated down the line, ensuringproper pre-sanction evaluation, adequacy of security, pre-examination of charge / control documentsand monitoring of each exposure on an ongoing basis.
Collateral information is recorded diligently in the Bank's main processing systems by type of collateral,amount of collateral against relevant credit exposures. A cohesive accounting / risk managementsystem facilitates effective collateral management for Basel II reporting.
Banking Book
All investments excluding trading book are considered as part of banking book.
Equity position risk in the banking book-Basel II specific
Investments in equities is governed by the Board of Directors' approved investment policies whichrestricts the equity portfolio as well as individual investments to avoid risk of concentration and excessivespecific scrip holding. The Group's investment in equity is conservative and is driven by yield optimizationand portfolio diversification objectives. As such the Group does not conduct ‘trading’ activities inequities.
The Group books the equity at cost and has adopted the ‘mark to market’ approach for equity valuationas per SBP guidelines which for Basel – II purposes prescribe 100% risk weight for listed equity and150% risk weight for unlisted equity instruments (refer note 11 and annexure I for investment in listedand unlisted shares).
Rupees in ‘000
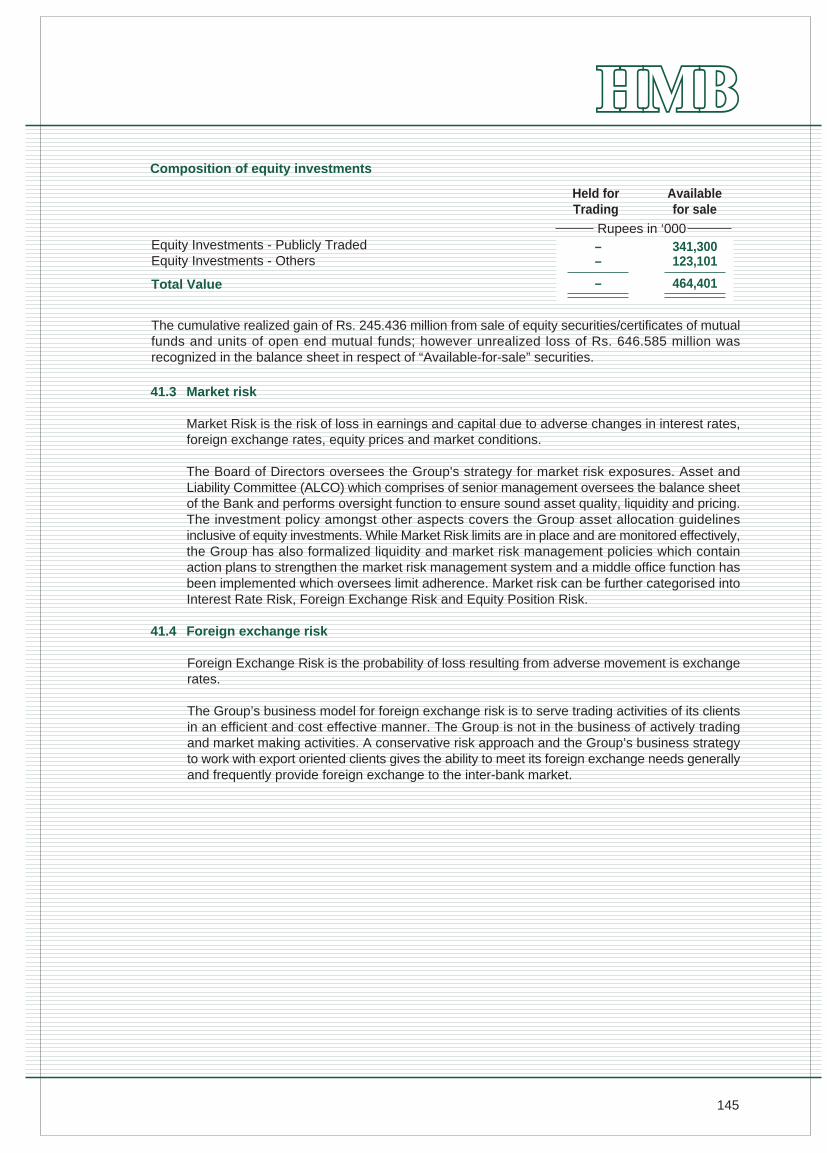
145
Composition of equity investments
Equity Investments - Publicly TradedEquity Investments - Others
Total Value
The cumulative realized gain of Rs. 245.436 million from sale of equity securities/certificates of mutualfunds and units of open end mutual funds; however unrealized loss of Rs. 646.585 million wasrecognized in the balance sheet in respect of “Available-for-sale” securities.
41.3 Market risk
Market Risk is the risk of loss in earnings and capital due to adverse changes in interest rates,foreign exchange rates, equity prices and market conditions.
The Board of Directors oversees the Group's strategy for market risk exposures. Asset andLiability Committee (ALCO) which comprises of senior management oversees the balance sheetof the Bank and performs oversight function to ensure sound asset quality, liquidity and pricing.The investment policy amongst other aspects covers the Group asset allocation guidelinesinclusive of equity investments. While Market Risk limits are in place and are monitored effectively,the Group has also formalized liquidity and market risk management policies which containaction plans to strengthen the market risk management system and a middle office function hasbeen implemented which oversees limit adherence. Market risk can be further categorised intoInterest Rate Risk, Foreign Exchange Risk and Equity Position Risk.
41.4 Foreign exchange risk
Foreign Exchange Risk is the probability of loss resulting from adverse movement is exchangerates.
The Group’s business model for foreign exchange risk is to serve trading activities of its clientsin an efficient and cost effective manner. The Group is not in the business of actively tradingand market making activities. A conservative risk approach and the Group’s business strategyto work with export oriented clients gives the ability to meet its foreign exchange needs generallyand frequently provide foreign exchange to the inter-bank market.
Held forTrading
––
–
Availablefor sale
341,300123,101
464,401
Rupees in ‘000
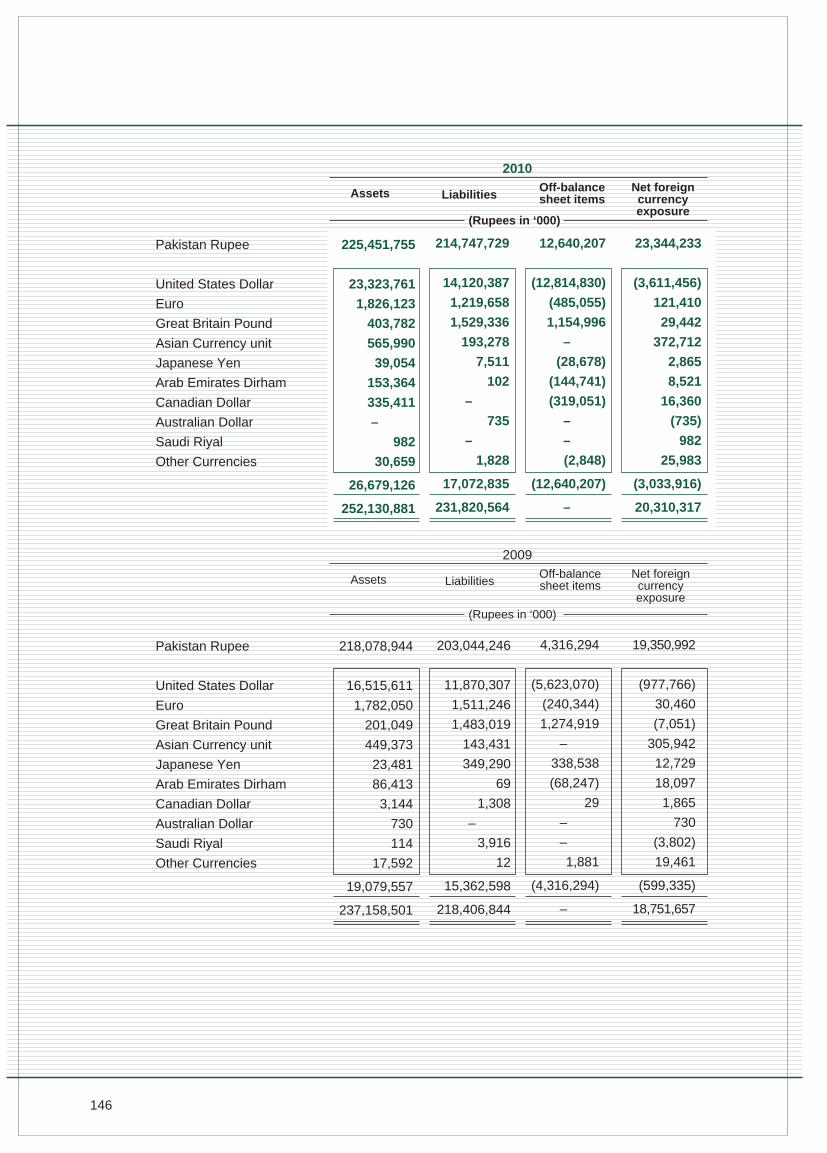
146
Pakistan Rupee
United States Dollar
Euro
Great Britain Pound
Asian Currency unit
Japanese Yen
Arab Emirates Dirham
Canadian Dollar
Australian Dollar
Saudi Riyal
Other Currencies
2010
Assets LiabilitiesOff-balancesheet items
Net foreigncurrencyexposure
(Rupees in ‘000)
225,451,755
23,323,761
1,826,123
403,782
565,990
39,054
153,364
335,411
–
982
30,659
26,679,126
252,130,881
214,747,729
14,120,387
1,219,658
1,529,336
193,278
7,511
102
–
735
–
1,828
17,072,835
231,820,564
23,344,233
(3,611,456)
121,410
29,442
372,712
2,865
8,521
16,360
(735)
982
25,983
(3,033,916)
20,310,317
2009
Assets LiabilitiesOff-balancesheet items
Net foreigncurrencyexposure
(Rupees in ‘000)
Pakistan Rupee
United States Dollar
Euro
Great Britain Pound
Asian Currency unit
Japanese Yen
Arab Emirates Dirham
Canadian Dollar
Australian Dollar
Saudi Riyal
Other Currencies
218,078,944
16,515,611
1,782,050
201,049
449,373
23,481
86,413
3,144
730
114
17,592
19,079,557
237,158,501
203,044,246
11,870,307
1,511,246
1,483,019
143,431
349,290
69
1,308
–
3,916
12
15,362,598
218,406,844
4,316,294
(5,623,070)
(240,344)
1,274,919
–
338,538
(68,247)
29
–
–
1,881
(4,316,294)
–
19,350,992
(977,766)
30,460
(7,051)
305,942
12,729
18,097
1,865
730
(3,802)
19,461
(599,335)
18,751,657
12,640,207
(12,814,830)
(485,055)
1,154,996
–
(28,678)
(144,741)
(319,051)
–
–
(2,848)
(12,640,207)
–
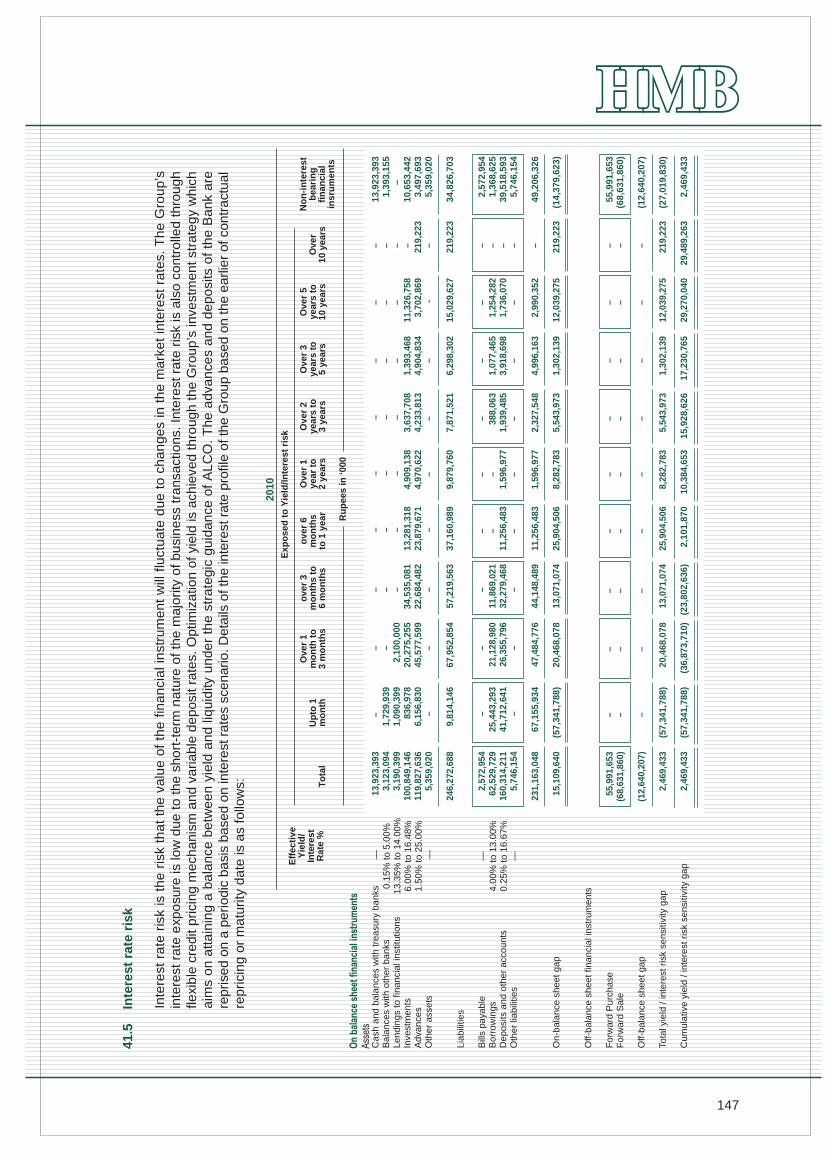
147
41.5
Inte
rest
rat
e ri
sk
Inte
rest
ra
te r
isk
is t
he
ris
k th
at
the
va
lue
of
the
fin
an
cia
l in
stru
me
nt
will
flu
ctu
ate
du
e t
o c
ha
ng
es
in t
he
ma
rke
t in
tere
st r
ate
s. T
he
Gro
up
’sin
tere
st r
ate
exp
osu
re is
low
due to the s
hort
-term
natu
re o
f th
e m
ajo
rity
of busi
ness
tra
nsa
ctio
ns.
Inte
rest
rate
ris
k is
als
o c
ontr
olle
d thro
ugh
flexi
ble
cre
dit
prici
ng m
ech
anis
m a
nd v
ariable
deposi
t ra
tes.
Optim
izatio
n o
f yi
eld
is a
chie
ved thro
ugh the G
roup’s
inve
stm
ent st
rate
gy
whic
ha
ims
on
att
ain
ing
a b
ala
nce
be
twe
en
yie
ld a
nd
liq
uid
ity u
nd
er
the
str
ate
gic
gu
ida
nce
of
AL
CO
. T
he
ad
van
ces
an
d d
ep
osi
ts o
f th
e B
an
k a
rere
pris
ed o
n a
perio
dic
basi
s base
d o
n in
tere
st r
ate
s sc
enario
. Deta
ils o
f the in
tere
st r
ate
pro
file o
f the G
roup b
ase
d o
n th
e e
arli
er
of c
ontr
act
ual
reprici
ng o
r m
atu
rity
date
is a
s fo
llow
s:
Eff
ecti
veY
ield
/In
tere
stR
ate
%
Exp
ose
d t
o Y
ield
/Inte
rest
ris
k
2010
Cas
h an
d ba
lanc
es w
ith tr
easu
ry b
anks
Bal
ance
s w
ith o
ther
ban
ksLe
ndin
gs to
fina
ncia
l ins
titut
ions
Inve
stm
ents
Adv
ance
sO
ther
ass
ets
Liab
ilitie
s
Bill
s pa
yabl
eB
orro
win
gsD
epos
its a
nd o
ther
acc
ount
sO
ther
liab
ilitie
s
On-
bala
nce
shee
t gap
Off-
bala
nce
shee
t fin
anci
al in
stru
men
ts
For
war
d P
urch
ase
For
war
d S
ale
Off-
bala
nce
shee
t gap
Tota
l yie
ld /
inte
rest
ris
k se
nsiti
vity
gap
Cum
ulat
ive
yiel
d / i
nter
est r
isk
sens
itivi
ty g
ap
Ru
pee
s in
‘000
13,
923,
393
3,1
23,0
94 3
,190
,399
100
,849
,146
119
,827
,636
5,3
59,0
20
246
,272
,688
2,5
72,9
54 6
2,52
9,72
9 1
60,3
14,2
11 5
,746
,154
231
,163
,048
15,
109,
640
55,
991,
653
(68
,631
,860
)
(12,
640,
207)
2,4
69,4
33
2,46
9,43
3
To
tal
– 1
,729
,939
1,0
90,3
99 8
36,9
78 6
,156
,830
–
9,8
14,1
46
– 2
5,44
3,29
3 4
1,71
2,64
1 –
67,
155,
934
(57
,341
,788
)
– – –
(57
,341
,788
)
(57
,341
,788
)
Up
to 1
mo
nth
– –2,
100,
000
20,
275,
255
45,
577,
599
–
67,
952,
854
– 2
1,12
8,98
0 2
6,35
5,79
6 –
47,
484,
776
20,
468,
078
– – –
20,
468,
078
(36
,873
,710
)
Ove
r 1
mo
nth
to
3 m
on
ths
ove
r 3
mo
nth
s to
6 m
on
ths
ove
r 6
mo
nth
sto
1 y
ear
Ove
r 1
year
to
2 ye
ars
Ove
r 2
year
s to
3 ye
ars
Ove
r 3
year
s to
5 ye
ars
Ove
r 5
year
s to
10 y
ears
Ove
r10
yea
rs
13,
923,
393
1,3
93,1
55 –
10,
653,
442
3,4
97,6
93 5
,359
,020
34,
826,
703
2,5
72,9
54 1
,368
,625
39,
518,
593
5,7
46,1
54
49,
206,
326
(14
,379
,623
)
55,
991,
653
(68
,631
,860
)
(12,
640,
207)
(27
,019
,830
)
2,4
69,4
33
No
n-i
nte
rest
bea
rin
gfi
nan
cial
insr
um
ents
—0.
15%
to 5
.00%
13.3
5% to
14.
00%
6.00
% to
16.
48%
1.50
% to
25.
00%
— —4.
00%
to 1
3.00
%0.
25%
to 1
6.67
%—
– – – 3
4,53
5,08
1 2
2,68
4,48
2 –
57,
219,
563
– 1
1,86
9,02
1 3
2,27
9,46
8 –
44,
148,
489
13,
071,
074
– – –
13,
071,
074
(23
,802
,636
)
– – – 1
3,28
1,31
8 2
3,87
9,67
1 –
37,
160,
989
– – 1
1,25
6,48
3–
11,
256,
483
25,
904,
506
– – –
25,
904,
506
2,1
01,8
70
– – –4,
909,
138
4,9
70,6
22–
9,8
79,7
60
– –1,
596,
977
–
1,5
96,9
77
8,2
82,7
83
– – –
8,2
82,7
83
10,
384,
653
– – – 3
,637
,708
4,2
33,8
13–
7,8
71,5
21
– 3
88,0
63 1
,939
,485
–
2,3
27,5
48
5,5
43,9
73
– – –
5,5
43,9
73
15,
928,
626
– – – 1
,393
,468
4,9
04,8
34–
6,2
98,3
02
– 1
,077
,465
3,9
18,6
98–
4,9
96,1
63
1,3
02,1
39
– – –
1,3
02,1
39
17,
230,
765
– – – 1
1,32
6,75
8 3
,702
,869
-
15,
029,
627
– 1
,254
,282
1,7
36,0
70–
2,9
90,3
52
12,
039,
275
– – –
12,
039,
275
29,
270,
040
– – – – 2
19,2
23–
219
,223
– – – – – 219,
223
– – – 219,
223
29,
489,
263
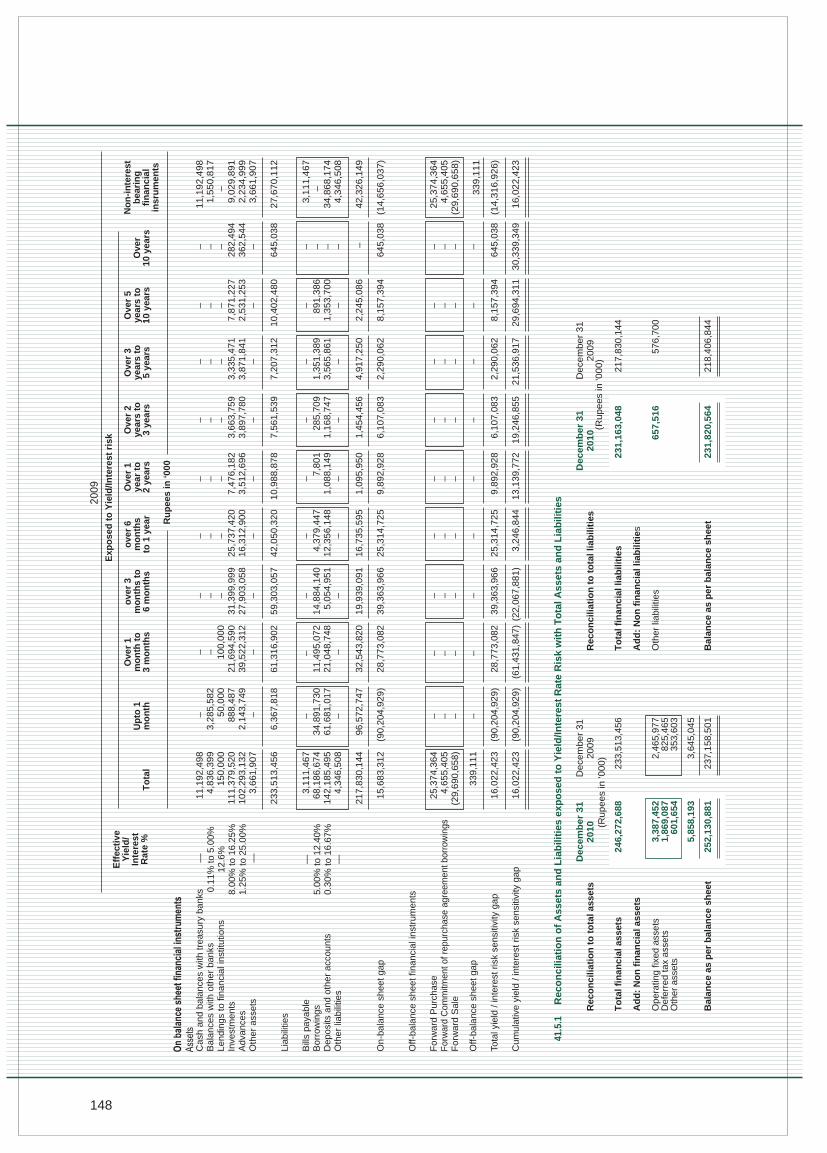
148
Eff
ecti
veY
ield
/In
tere
stR
ate
%
Exp
ose
d t
o Y
ield
/Inte
rest
ris
k
2009
Cas
h an
d ba
lanc
es w
ith tr
easu
ry b
anks
Bal
ance
s w
ith o
ther
ban
ksLe
ndin
gs to
fina
ncia
l ins
titut
ions
Inve
stm
ents
Adv
ance
sO
ther
ass
ets
Liab
ilitie
s
Bill
s pa
yabl
eB
orro
win
gsD
epos
its a
nd o
ther
acc
ount
sO
ther
liab
ilitie
s
On-
bala
nce
shee
t gap
Off-
bala
nce
shee
t fin
anci
al in
stru
men
ts
For
war
d P
urch
ase
For
war
d C
omm
itmen
t of r
epur
chas
e ag
reem
ent b
orro
win
gsF
orw
ard
Sal
e
Off-
bala
nce
shee
t gap
Tota
l yie
ld /
inte
rest
ris
k se
nsiti
vity
gap
Cum
ulat
ive
yiel
d / i
nter
est r
isk
sens
itivi
ty g
ap
Ru
pee
s in
‘000
11
,19
2,4
98
4,8
36
,39
9 1
50
,00
0 1
11
,37
9,5
20
10
2,2
93
,13
2 3
,66
1,9
07
23
3,5
13
,45
6
3,1
11
,46
7 6
8,1
86
,67
4 1
42
,18
5,4
95
4,3
46
,50
8
21
7,8
30
,14
4
15
,68
3,3
12
25
,37
4,3
64
4,6
55
,40
5 (
29
,69
0,6
58
)
33
9,1
11
16
,02
2,4
23
16
,02
2,4
23
To
tal
– 3
,28
5,5
82
50
,00
0 8
88
,48
7 2
,14
3,7
49
–
6,3
67
,81
8
– 3
4,8
91
,73
0 6
1,6
81
,01
7–
96
,57
2,7
47
(9
0,2
04
,92
9)
– – – –
(9
0,2
04
,92
9)
(9
0,2
04
,92
9)
Up
to 1
mo
nth
– – 10
0,0
00
21
,69
4,5
90
39
,52
2,3
12
–
61
,31
6,9
02
– 1
1,4
95
,07
2 2
1,0
48
,74
8 –
32
,54
3,8
20
28
,77
3,0
82
– – – –
28
,77
3,0
82
(6
1,4
31
,84
7)
Ove
r 1
mo
nth
to
3 m
on
ths
– – – 3
1,3
99
,99
9 2
7,9
03
,05
8–
59
,30
3,0
57
– 1
4,8
84
,14
0 5
,05
4,9
51
–
19
,93
9,0
91
39
,36
3,9
66
– – – –
39
,36
3,9
66
(2
2,0
67
,88
1)
ove
r 3
mo
nth
s to
6 m
on
ths
– – – 2
5,7
37
,42
0 1
6,3
12
,90
0–
42
,05
0,3
20
– 4
,37
9,4
47
12
,35
6,1
48
–
16
,73
5,5
95
25
,31
4,7
25
– – – –
25
,31
4,7
25
3,2
46
,84
4
ove
r 6
mo
nth
sto
1 y
ear
– – – 7
,47
6,1
82
3,5
12
,69
6–
10
,98
8,8
78
– 7,8
01
1,0
88
,14
9–
1,0
95
,95
0
9,8
92
,92
8
– – – –
9,8
92
,92
8
13
,13
9,7
72
Ove
r 1
year
to
2 ye
ars
– – – 3
,66
3,7
59
3,8
97
,78
0–
7,5
61
,53
9
– 2
85
,70
9 1
,16
8,7
47
–
1,4
54
,45
6
6,1
07
,08
3
– – – –
6,1
07
,08
3
19
,24
6,8
55
Ove
r 2
year
s to
3 ye
ars
– – – 3
,33
5,4
71
3,8
71
,84
1–
7,2
07
,31
2
– 1
,35
1,3
89
3,5
65
,86
1–
4,9
17
,25
0
2,2
90
,06
2
– – – –
2,2
90
,06
2
21
,53
6,9
17
Ove
r 3
year
s to
5 ye
ars
– – – 7
,87
1,2
27
2,5
31
,25
3–
10
,40
2,4
80
– 8
91
,38
6 1
,35
3,7
00
–
2,2
45
,08
6
8,1
57
,39
4
– – – –
8,1
57
,39
4
29
,69
4,3
11
Ove
r 5
year
s to
10 y
ears
– – – 2
82
,49
4 3
62
,54
4–
64
5,0
38
– – – – –
64
5,0
38
– – – –
64
5,0
38
30
,33
9,3
49
Ove
r10
yea
rs
11,1
92,4
98
1,5
50,8
17
– 9
,029,8
91
2,2
34,9
99
3,6
61,9
07
27,6
70,1
12
3,1
11,4
67
– 3
4,8
68,1
74
4,3
46,5
08
42,3
26,1
49
(14,6
56,0
37)
25,3
74,3
64
4,6
55,4
05
(29,6
90,6
58)
339,1
11
No
n-i
nte
rest
bea
rin
gfi
nan
cial
insr
um
ents
—0.
11%
to 5
.00%
12.6
%8.
00%
to 1
6.25
%1.
25%
to 2
5.00
% — —
5.00
% to
12.
40%
0.30
% to
16.
67%
—
41.5
.1R
eco
nci
liati
on
of
Ass
ets
and
Lia
bili
ties
exp
ose
d t
o Y
ield
/Inte
rest
Rat
e R
isk
wit
h T
ota
l Ass
ets
and
Lia
bili
ties
Rec
on
cilia
tio
n t
o t
ota
l lia
bili
ties
To
tal f
inan
cial
liab
iliti
es
Ad
d:
No
n f
inan
cial
liab
iliti
es
Oth
er li
abili
ties
Bal
ance
as
per
bal
ance
sh
eet
(R
upees
in '0
00)
Decem
ber
31
2010
Dece
mber
31
2009
233
,513
,456
2,4
65,9
77 8
25,4
65 3
53,6
03
3,6
45,0
45
237
,158
,501
(R
upees
in '0
00)
Decem
ber
31
2010
Dece
mber
31
2009
23
1,1
63
,04
8
65
7,5
16
23
1,8
20
,56
4
21
7,8
30
,14
4
57
6,7
00
21
8,4
06
,84
4
Rec
on
cilia
tio
n t
o t
ota
l ass
ets
To
tal f
inan
cial
ass
ets
Ad
d:
No
n f
inan
cial
ass
ets
Ope
ratin
g fix
ed a
sset
sD
efer
red
tax
asse
tsO
ther
ass
ets
Bal
ance
as
per
bal
ance
sh
eet
246
,272
,688
3,3
87,4
52 1
,869
,087
601
,654
5,8
58,1
93
252
,130
,881
(14,3
16,9
26)
16,0
22,4
23
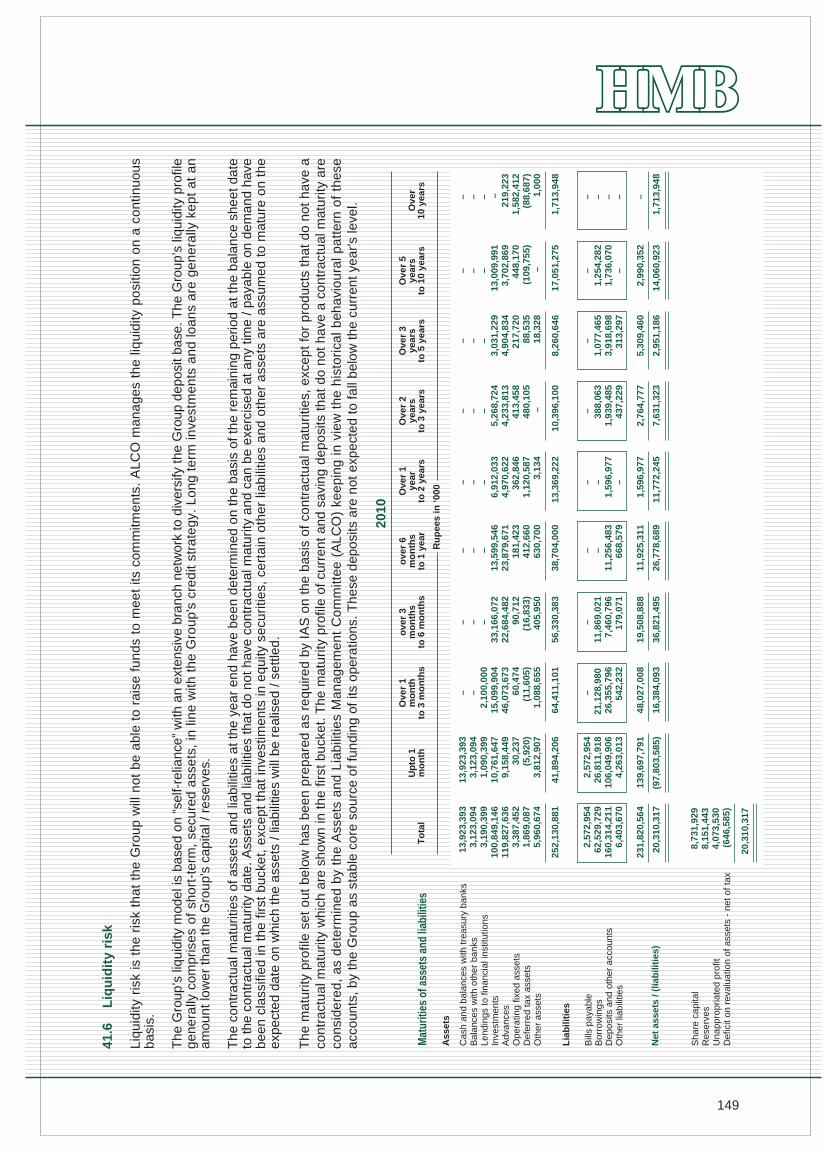
149
41.6
Liq
uid
ity
risk
Liq
uid
ity r
isk
is t
he
ris
k th
at
the
Gro
up
will
no
t b
e a
ble
to
ra
ise
fu
nd
s to
me
et
its c
om
mitm
en
ts.
AL
CO
ma
na
ge
s th
e li
qu
idity
po
sitio
n o
n a
co
ntin
uo
us
basi
s.
The
Gro
up’s
liqu
idity
mod
el is
bas
ed o
n “s
elf-
relia
nce”
with
an
exte
nsiv
e br
anch
net
wor
k to
div
ersi
fy th
e G
roup
dep
osit
base
. The
Gro
up’s
liqu
idity
pro
file
ge
ne
rally
co
mp
rise
s o
f sh
ort
-te
rm,
secu
red
ass
ets
, in
lin
e w
ith t
he
Gro
up
's c
red
it st
rate
gy.
Lo
ng
te
rm in
vest
me
nts
an
d lo
an
s a
re g
en
era
lly k
ep
t a
t a
nam
ount
low
er t
han
the
Gro
up's
cap
ital /
res
erve
s.
The
con
trac
tual
mat
uriti
es o
f as
sets
and
liab
ilitie
s at
the
yea
r en
d ha
ve b
een
dete
rmin
ed o
n th
e ba
sis
of t
he r
emai
ning
per
iod
at t
he b
alan
ce s
heet
dat
eto
the
cont
ract
ual m
atur
ity d
ate.
Ass
ets
and
liabi
litie
s th
at d
o no
t hav
e co
ntra
ctua
l mat
urity
and
can
be
exer
cise
d at
any
tim
e / p
ayab
le o
n de
man
d ha
veb
ee
n c
lass
ifie
d in
th
e f
irst
bu
cke
t, e
xce
pt
tha
t in
vest
ime
nts
in e
qu
ity s
ecu
ritie
s, c
ert
ain
oth
er
liab
ilitie
s a
nd
oth
er
ass
ets
are
ass
um
ed
to
ma
ture
on
th
eex
pect
ed d
ate
on w
hich
the
ass
ets
/ lia
bilit
ies
will
be
real
ised
/ s
ettle
d.
Th
e m
atu
rity
pro
file
se
t o
ut
be
low
ha
s b
ee
n p
rep
are
d a
s re
qu
ire
d b
y IA
S o
n t
he
ba
sis
of
con
tra
ctu
al m
atu
ritie
s, e
xce
pt
for
pro
du
cts
tha
t d
o n
ot
ha
ve a
con
tra
ctu
al m
atu
rity
wh
ich
are
sh
ow
n in
th
e f
irst
bu
cke
t. T
he
ma
turi
ty p
rofil
e o
f cu
rre
nt
an
d s
avi
ng
de
po
sits
th
at
do
no
t h
ave
a c
on
tra
ctu
al m
atu
rity
are
con
sid
ere
d,
as
de
term
ine
d b
y th
e A
sse
ts a
nd
Lia
bili
ties
Ma
na
ge
me
nt
Co
mm
itte
e (
AL
CO
) ke
ep
ing
in v
iew
th
e h
isto
rica
l be
ha
vio
ura
l pa
tte
rn o
f th
ese
acco
unts
, by
the
Gro
up a
s st
able
cor
e so
urce
of
fund
ing
of it
s op
erat
ions
. T
hese
dep
osits
are
not
exp
ecte
d to
fal
l bel
ow t
he c
urre
nt y
ear's
leve
l.
13,
923,
393
3,1
23,0
94 1
,090
,399
10,
761,
647
9,1
58,4
49 3
0,23
7 (
5,92
0) 3
,812
,907
41,
894,
206
2,5
72,9
54 2
6,81
1,91
8 1
06,0
49,9
06 4
,263
,013
139
,697
,791
(97
,803
,585
)
13,
923,
393
3,1
23,0
94 3
,190
,399
100
,849
,146
119
,827
,636
3,3
87,4
52 1
,869
,087
5,9
60,6
74
252
,130
,881
2,5
72,9
54 6
2,52
9,72
9 1
60,3
14,2
11 6
,403
,670
231
,820
,564
20,
310,
317
8,7
31,9
29 8
,151
,443
4,0
73,5
30 (
646,
585)
20,
310,
317
– – – 1
3,59
9,54
6 2
3,87
9,67
1 1
81,4
2341
2,66
0 6
30,7
00
38,
704,
000
– – 1
1,25
6,48
3 6
68,5
79
11,
925,
311
26,
778,
689
– – – 5
,268
,724
4,2
33,8
13 4
13,4
58 4
80,1
05 –
10,
396,
100
– 3
88,0
63 1
,939
,485
437
,229
2,7
64,7
77
7,6
31,3
23
– – – 3
,031
,229
4,9
04,8
34 2
17,7
20 8
8,53
5 1
8,32
8
8,2
60,6
46
– 1
,077
,465
3,9
18,6
98 3
13,2
97
5,3
09,4
60
2,9
51,1
86
– – – 1
3,00
9,99
1 3
,702
,869
448
,170
(10
9,75
5) –
17,
051,
275
– 1
,254
,282
1,7
36,0
70–
2,9
90,3
52
14,
060,
923
– – – – 2
19,2
23 1
,582
,412
(88
,687
)1,
000
1,7
13,9
48
– – – – –
1,71
3,94
8
2010
Ru
pee
s in
‘000
Mat
uriti
es o
f ass
ets
and
liabi
litie
s
Ove
r 1
mo
nth
to 3
mo
nth
sU
pto
1m
on
thT
ota
l
ove
r 6
mo
nth
sto
1 y
ear
Ove
r 1
year
to 2
yea
rs
Ove
r 2
year
sto
3 y
ears
Ove
r 3
year
sto
5 y
ears
Ove
r 5
year
sto
10
year
sO
ver
10 y
ears
ove
r 3
mo
nth
sto
6 m
on
ths
– – – 3
3,16
6,07
2 2
2,68
4,48
2 9
0,71
2(1
6,83
3) 4
05,9
50
56,
330,
383
– 1
1,86
9,02
1 7
,460
,796
179
,071
19,
508,
888
36,
821,
495
Ass
ets
Cas
h an
d ba
lanc
es w
ith tr
easu
ry b
anks
Bal
ance
s w
ith o
ther
ban
ksLe
ndin
gs to
fina
ncia
l ins
titut
ions
Inve
stm
ents
Adv
ance
sO
pera
ting
fixed
ass
ets
Def
erre
d ta
x as
sets
Oth
er a
sset
s
Lia
bili
ties
Bill
s pa
yabl
eB
orro
win
gsD
epos
its a
nd o
ther
acc
ount
sO
ther
liab
ilitie
s
Net
ass
ets
/ (lia
bili
ties
)
Sha
re c
apita
lR
eser
ves
Una
ppro
pria
ted
prof
itD
efic
it on
rev
alua
tion
of a
sset
s -
net o
f tax
– – 2
,100
,000
15,
099,
904
46,
073,
673
60,
474
(11,
605)
1,0
88,6
55
64,
411,
101
– 2
1,12
8,98
0 2
6,35
5,79
6 5
42,2
32
48,
027,
008
16,3
84,0
93
– – – 6
,912
,033
4,9
70,6
22 3
62,8
46 1
,120
,587
3,1
34
13,
369,
222
– – 1
,596
,977
–
1,5
96,9
77
11,
772,
245

150
2009
Rup
ees
in ‘0
00
Ove
r 1
mon
thto
3 m
onth
sU
pto
1m
onth
Tot
al
11,
192,
498
4,8
36,3
99 1
50,0
00 1
11,3
79,5
20 1
02,2
93,1
32 2
,465
,977
825
,465
4,0
15,5
10
237
,158
,501
3,1
11,4
67 6
8,18
6,67
4 1
42,1
85,4
95 4
,923
,208
218
,406
,844
18,
751,
657
7,5
27,5
25 7
,587
,835
3,7
84,9
26 (
148,
629)
18,
751,
657
Ove
r 6
mon
ths
to 1
yea
r
Ove
r 1
year
to 2
yea
rs
Ove
r 2
year
sto
3 y
ears
Ove
r 3
year
sto
5 y
ears
Ove
r 5
year
sto
10
year
sO
ver
10 y
ears
Ove
r 3
mon
ths
to 6
mon
ths
Ass
ets
Cas
h an
d ba
lanc
es w
ith tr
easu
ry b
anks
Bal
ance
s w
ith o
ther
ban
ksLe
ndin
gs to
fina
ncia
l ins
titut
ions
Inve
stm
ents
Adv
ance
sO
pera
ting
fixed
ass
ets
Def
erre
d ta
x as
sets
Oth
er a
sset
s
Lia
bili
ties
Bill
s pa
yabl
eB
orro
win
gsD
epos
its a
nd o
ther
acc
ount
sO
ther
liab
ilitie
s
Net
ass
ets
Sha
re c
apita
lR
eser
ves
Una
ppro
pria
ted
prof
itD
efic
it on
rev
alua
tion
of a
sset
s -
net o
f tax
11,
192,
498
4,8
36,3
99 5
0,00
0 9
,038
,221
4,3
78,7
48 2
1,24
1–
3,3
95,4
93
32,
912,
600
3,1
11,4
67 3
4,89
1,73
0 9
6,54
9,19
1 3
,233
,198
137
,785
,586
(10
4,87
2,98
6)
– – 1
00,0
00 1
6,96
4,05
7 3
9,52
2,31
2 4
2,48
0–
174
,926
56,
803,
775
– 1
1,49
5,07
2 2
1,04
8,74
8 5
3,74
3
32,
597,
563
24,
206,
212
– – – 2
8,69
0,43
7 2
7,90
3,05
8 6
3,72
1–
127
,513
56,
784,
729
– 1
4,88
4,14
0 5
,054
,951
205
,730
20,
144,
821
36,
639,
908
– – – 2
5,83
2,08
3 1
6,31
2,90
0 1
27,4
44 8
25,4
65 2
97,7
23
43,
395,
615
– 4
,379
,447
12,
356,
148
756
,344
17,
492,
159
25,
903,
456
– – – 8
,850
,854
3,5
12,6
96 2
54,8
87–
630
12,
619,
067
– 7,8
01 1
,088
,149
–
1,0
95,9
50
11,
523,
117
– – – 5
,670
,852
3,8
97,7
80 2
54,6
54– –
9,8
23,2
86
– 2
85,7
09 1
,168
,747
–
1,4
54,4
56
8,36
8,83
0
– – – 6
,333
,272
3,8
71,8
41 2
56,8
20– 1
8,22
5
10,
480,
158
– 1
,351
,389
3,5
65,8
61 6
73,9
73
5,5
91,2
23
4,88
8,93
5
– – – 9
,717
,250
2,5
31,2
53 2
51,3
85– –
12,
499,
888
– 8
91,3
86 1
,353
,700
–
2,2
45,0
86
10,2
54,8
02
– – – 2
82,4
94 3
62,5
44 1
,193
,345
– 1,00
0
1,8
39,3
83
– – – – –
1,83
9,38
3
151
41.7 Operational risk
The Group operates in a controlled manner and operations risk is generally managed effectively.With the evolution of operations risk management into a separate distinct discipline, the Group’sstrategy is to further strengthen the risk management system along new industry standards.
The Group’s operations risk management strategy takes guidance from Basel – II, Committeeof Sponsoring Organization of Treadway Commission (COSO) publications, the SBP guidelinesand standard industry practices. The operational risk management manual addresses enterprisewide risk drivers inclusive of technology infrastructure, software hardware and I.T security.
While broadening risk awareness and assuring regulatory compliance, internal audit departmentof the Group is an important pillar of the Group’s risk management and controls infrastructure,performing continuous reviews to improve the quality of the Group’s internal control environment,ensuring an effective balance in safety and performance of processes and adding value towardsthe Group’s risk mitigation endeavors.
The Group’s Business Continuity Plan includes risk management strategies to mitigate inherentrisk and prevent interruption of mission critical services caused by disaster event. The Group’soperational risk management infrastructure has been further strengthened through theestablishment of a separate operational and risk control unit.
41.8 Operational risk – Disclosures – Basel II specific
The Group uses Basic Indicator Approach (BIA) for regulatory capital at risk calculation foroperational risk. Under BIA the capital charge for operational risk is a fixed percentage ofaverage positive annual gross income of the Group over the past three years. Figures of capitalcharge of operation risk for the year is Rs. 1,525,051 thousand (2009: Rs. 1,271,047 thousand).
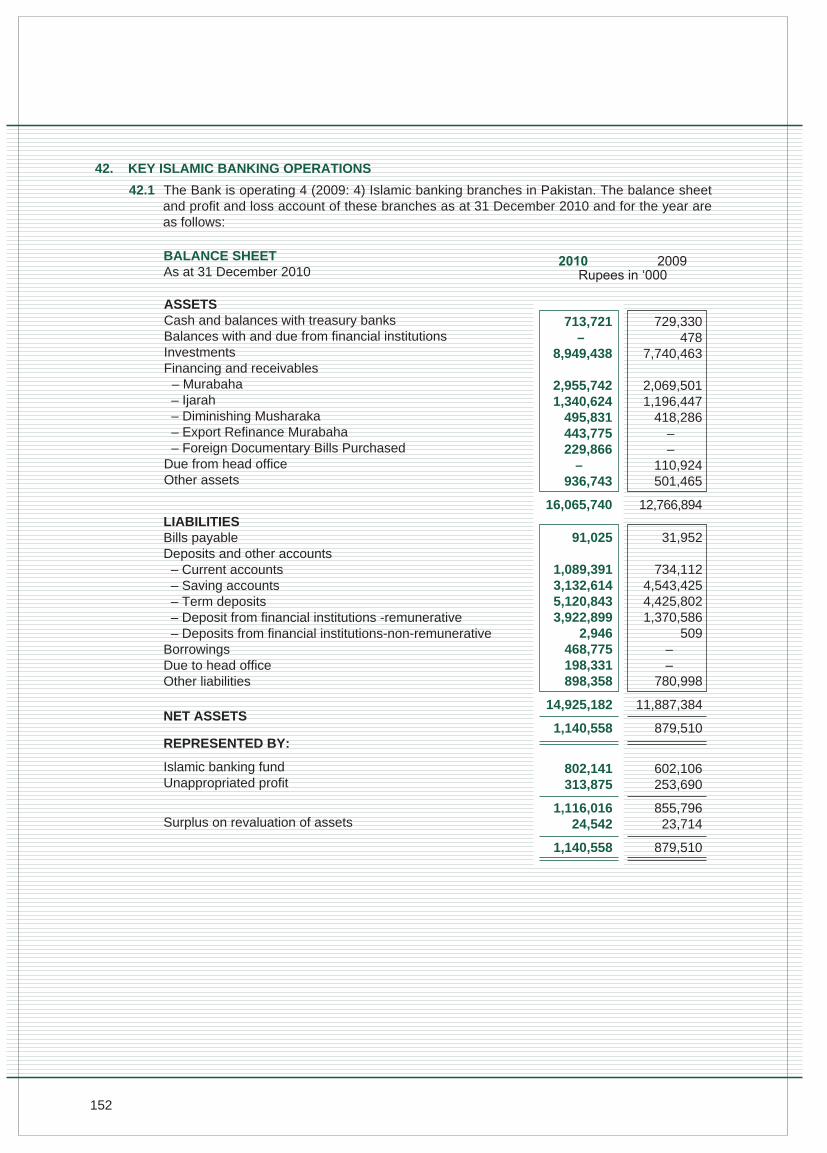
152
42. KEY ISLAMIC BANKING OPERATIONS
42.1 The Bank is operating 4 (2009: 4) Islamic banking branches in Pakistan. The balance sheetand profit and loss account of these branches as at 31 December 2010 and for the year areas follows:
BALANCE SHEETAs at 31 December 2010
ASSETSCash and balances with treasury banksBalances with and due from financial institutionsInvestmentsFinancing and receivables
– Murabaha– Ijarah– Diminishing Musharaka– Export Refinance Murabaha– Foreign Documentary Bills Purchased
Due from head officeOther assets
713,721 –
8,949,438
2,955,7421,340,624
495,831443,775229,866
–936,743
16,065,740LIABILITIESBills payableDeposits and other accounts
– Current accounts– Saving accounts– Term deposits– Deposit from financial institutions -remunerative– Deposits from financial institutions-non-remunerative
BorrowingsDue to head officeOther liabilities
NET ASSETS
REPRESENTED BY:
Islamic banking fundUnappropriated profit
Surplus on revaluation of assets
91,025
1,089,391 3,132,614 5,120,843 3,922,899
2,946468,775198,331 898,358
14,925,182
1,140,558
729,330 478
7,740,463
2,069,501 1,196,447
418,286––
110,924 501,465
12,766,894
31,952
734,112 4,543,425 4,425,802 1,370,586
509––
780,998
11,887,384
879,510
802,141313,875
1,116,01624,542
1,140,558
602,106253,690
855,79623,714
879,510
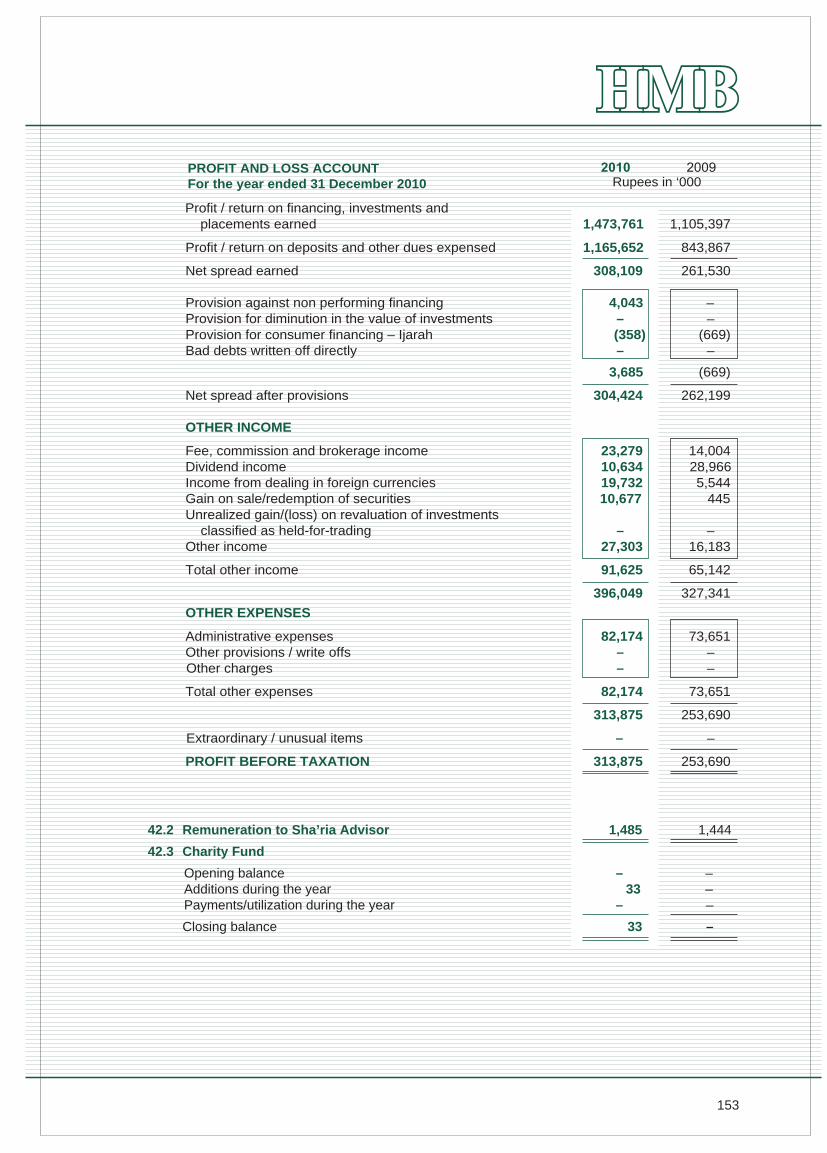
153
Profit / return on financing, investments and placements earned 1,473,761 1,105,397
Profit / return on deposits and other dues expensed 1,165,652 843,867
Net spread earned 308,109 261,530
Provision against non performing financing 4,043 –Provision for diminution in the value of investments – –Provision for consumer financing – Ijarah (358) (669)Bad debts written off directly – –
3,685 (669)
Net spread after provisions 304,424 262,199
OTHER INCOME
Fee, commission and brokerage income 23,279 14,004Dividend income 10,634 28,966Income from dealing in foreign currencies 19,732 5,544Gain on sale/redemption of securities 10,677 445Unrealized gain/(loss) on revaluation of investments classified as held-for-trading – –Other income 27,303 16,183
Total other income 91,625 65,142
396,049 327,341
OTHER EXPENSES
Administrative expenses 82,174 73,651Other provisions / write offs – –Other charges – –
Total other expenses 82,174 73,651
313,875 253,690
Extraordinary / unusual items – –
PROFIT BEFORE TAXATION 313,875 253,690
PROFIT AND LOSS ACCOUNTFor the year ended 31 December 2010 Rupees in ‘000
42.2 Remuneration to Sha’ria Advisor 1,485 1,444
42.3 Charity Fund
Opening balance – –Additions during the year 33 –Payments/utilization during the year – –
Closing balance 33 –
154
43. GENERAL
43.1 The Board of Directors in its meeting held on March 1, 2011 has proposed bonus share issuein the proportion of 20 shares for every 100 shares held amounting to Rs. 1,746,386 thousand(2009: bonus and cash dividend amounting to Rs. 1,957,157 thousand) for approval by theshareholders in forthcoming Annual General Meeting. The consolidated financial statementsfor the year ended 31 December 2010 do not include the effect of bonus issue, which will beaccounted for in the consolidated financial statements for the year ending 31 December 2011.
43.2 These consolidated financial statements have been prepared in accordance with the revisedforms of annual financial statements of the banks issued by the State Bank of Pakistan throughits BSD Circular No. 04 dated 17 February 2006.
44. DATE OF AUTHORIZATION FOR ISSUE
These financial statements were authorized for issue on March 1, 2011 by the Board of Directors ofthe Bank.
KASSIM PAREKHChairman
ANJUM IQBALChief Executive
BASHIR ALI MOHAMMADDirector
MOHAMEDALI R. HABIBDirector
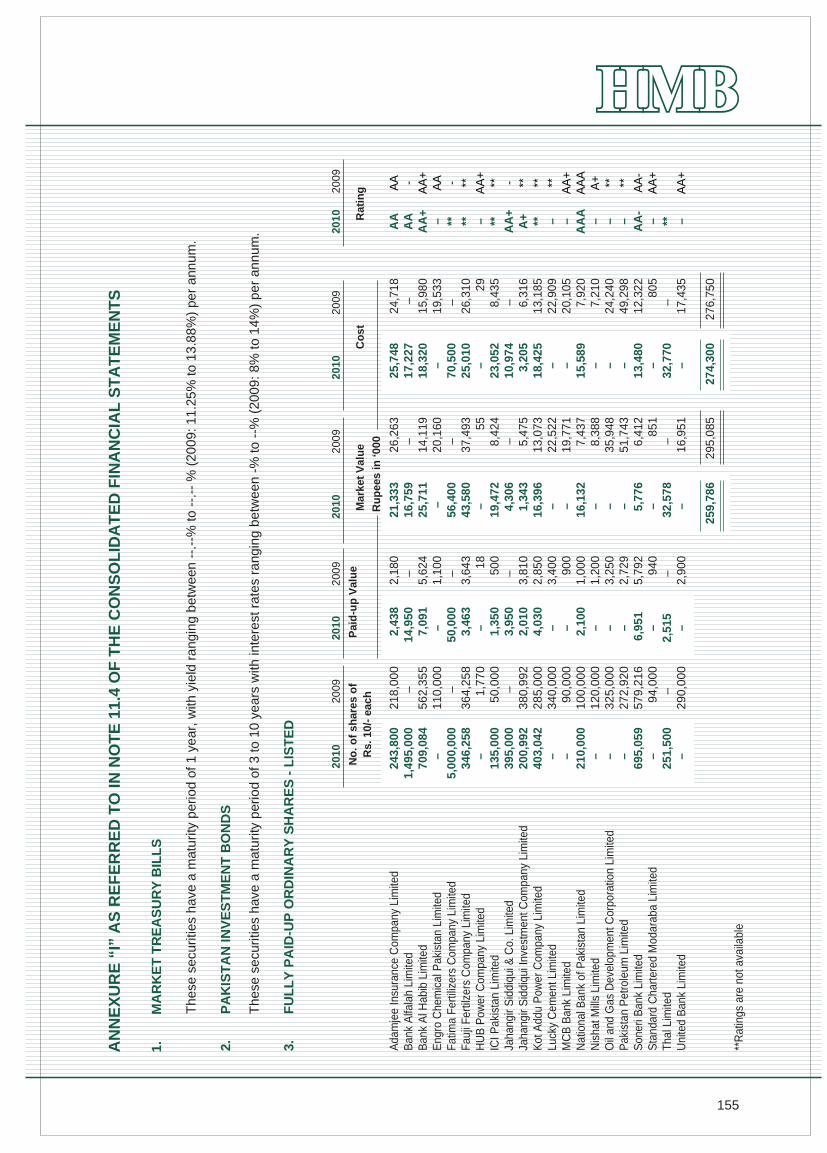
155
2010
2009
No
. of
shar
es o
fR
s. 1
0/-
each
2010
2009
2010
2009
2010
2009
Mar
ket
Val
ue
Co
stR
atin
g
Ru
pee
s in
‘000
218
,000
– 5
62,3
55 1
10,0
00 –
364
,258
1,7
70 5
0,00
0 –
380
,992
285
,000
340
,000
90,
000
100
,000
120
,000
325
,000
272
,920
579
,216
94,
000
–29
0,00
0
AA -
AA
+A
A - ** AA
+** - ** ** ** AA
+A
AA
A+ ** ** AA
-A
A+
AA
+
2010
2009
Pai
d-u
p V
alu
e
AN
NE
XU
RE
“I”
AS
RE
FE
RR
ED
TO
IN N
OT
E 1
1.4
OF
TH
E C
ON
SO
LID
AT
ED
FIN
AN
CIA
L S
TA
TE
ME
NT
S
1.
MA
RK
ET
TR
EA
SU
RY
BIL
LS
The
se s
ecur
ities
hav
e a
mat
urity
per
iod
of 1
yea
r, w
ith y
ield
ran
ging
bet
wee
n --
.--%
to -
-.--
% (
2009
: 11.
25%
to 1
3.88
%)
per
annu
m.
2.P
AK
IST
AN
INV
ES
TM
EN
T B
ON
DS
The
se s
ecur
ities
hav
e a
mat
urity
per
iod
of 3
to 1
0 ye
ars
with
inte
rest
rat
es r
angi
ng b
etw
een
-% to
--%
(20
09: 8
% to
14%
) pe
r an
num
.
3.F
UL
LY
PA
ID-U
P O
RD
INA
RY
SH
AR
ES
- L
IST
ED
Ada
mje
e In
sura
nce
Com
pany
Lim
ited
Ban
k A
lfala
h Li
mite
dB
ank
Al H
abib
Lim
ited
Eng
ro C
hem
ical
Pak
ista
n Li
mite
dFa
tima
Ferti
lizer
s C
ompa
ny L
imite
dFa
uji F
ertil
zers
Com
pany
Lim
ited
HU
B P
ower
Com
pany
Lim
ited
ICI P
akis
tan
Lim
ited
Jaha
ngir
Sid
diqu
i & C
o. L
imite
dJa
hang
ir S
iddi
qui I
nves
tmen
t Com
pany
Lim
ited
Kot
Add
u P
ower
Com
pany
Lim
ited
Luck
y C
emen
t Lim
ited
MC
B B
ank
Lim
ited
Nat
iona
l Ban
k of
Pak
ista
n Li
mite
dN
isha
t Mill
s Li
mite
dO
il an
d G
as D
evel
opm
ent C
orpo
ratio
n Li
mite
dP
akis
tan
Pet
role
um L
imite
dS
oner
i Ban
k Li
mite
dS
tand
ard
Cha
rtere
d M
odar
aba
Lim
ited
Thal
Lim
ited
Uni
ted
Ban
k Li
mite
d
**R
atin
gs a
re n
ot a
vaila
ble
243
,800
1,4
95,0
00 7
09,0
84–
5,0
00,0
00 3
46,2
58–
135
,000
395
,000
200
,992
403
,042
– – 2
10,0
00– – –
695
,059
–25
1,50
0–
2,4
38 1
4,95
0 7
,091
– 5
0,00
0 3
,463
– 1
,350
3,9
50 2
,010
4,0
30– –
2,1
00– – –
6,9
51 –2,
515
–
2,1
80–
5,6
24 1
,100
– 3
,643 1
8 5
00–
3,8
10 2
,850
3,4
00 9
00 1
,000
1,2
00 3
,250
2,7
29 5
,792
940
–2,
900
21,
333
16,
759
25,
711
– 5
6,40
0 4
3,58
0–
19,
472
4,3
06 1
,343
16,
396
– – 1
6,13
2– – – 5,7
76–
32,5
78–
259
,786
26,
263
– 1
4,11
9 2
0,16
0–
37,
493
55
8,4
24– 5,4
75 1
3,07
3 2
2,52
2 1
9,77
1 7
,437
8,3
88 3
5,94
8 5
1,74
3 6
,412
851
– 1
6,95
1
295
,085
25,
748
17,
227
18,
320
– 7
0,50
0 2
5,01
0–
23,
052
10,
974
3,2
05 1
8,42
5– –
15,
589
– – – 1
3,48
0–
32,7
70–
274,
300
24,
718
– 1
5,98
0 1
9,53
3–
26,
310
29
8,4
35– 6,
316
13,
185
22,
909
20,
105
7,9
20 7
,210
24,
240
49,
298
12,
322
805
–17
,435
276
,750
AA
AA
AA
+– ** ** – **
AA
+A
+ ** – –A
AA
– – –A
A-
– ** –
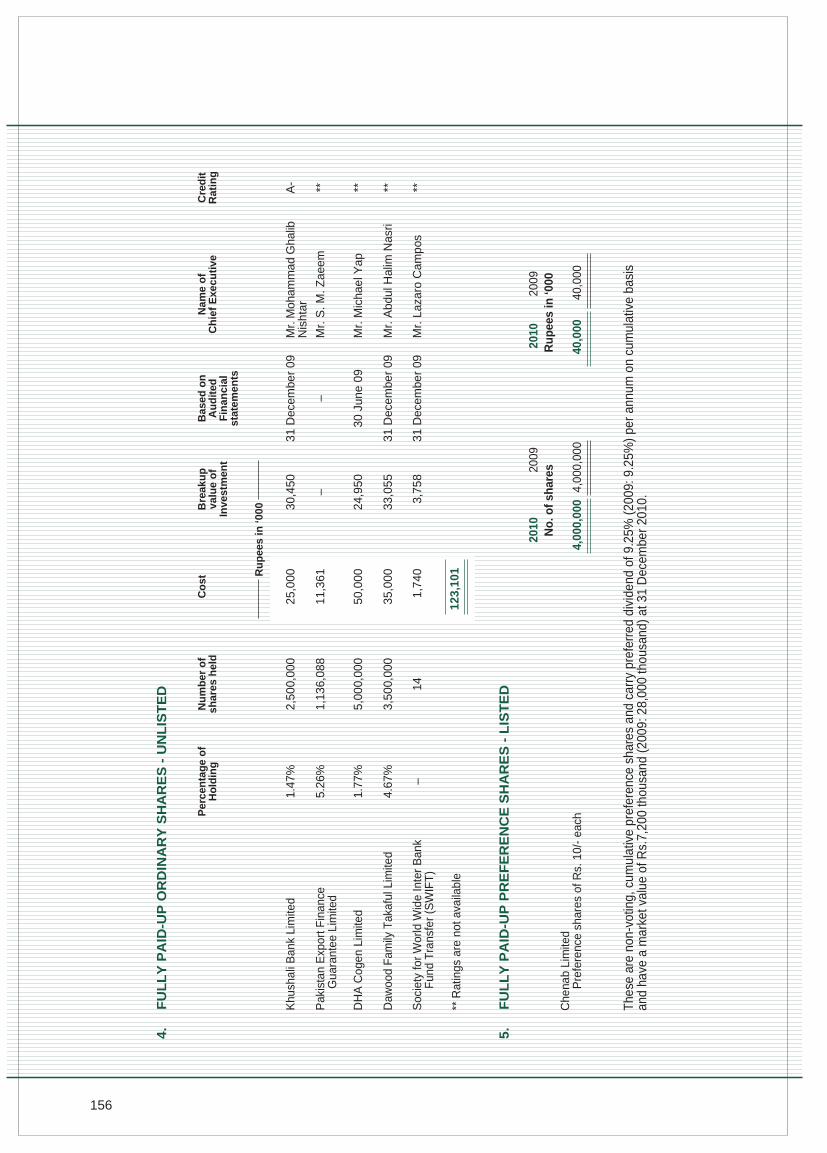
156
31 D
ecem
ber
091,
740
31 D
ecem
ber
094.
67%
3,50
0,00
035
,000
30 J
une
091.
77%
5,00
0,00
050
,000
5.26
%1,
136,
088
11,3
61
31 D
ecem
ber
0925
,000
2,50
0,00
01.
47%
The
se a
re n
on-v
otin
g, c
umul
ativ
e pr
efer
ence
sha
res
and
carr
y pr
efer
red
divi
dend
of 9
.25%
(20
09: 9
.25%
) pe
r an
num
on
cum
ulat
ive
basi
san
d ha
ve a
mar
ket v
alue
of R
s.7,
200
thou
sand
(20
09: 2
8,00
0 th
ousa
nd)
at 3
1 D
ecem
ber
2010
.
4.
FU
LL
Y P
AID
-UP
OR
DIN
AR
Y S
HA
RE
S -
UN
LIS
TE
D
Per
cen
tag
e o
fH
old
ing
Ru
pee
s in
‘000
Nu
mb
er o
fsh
ares
hel
dC
ost
Bre
aku
pva
lue
of
Inve
stm
ent
Bas
ed o
nA
ud
ited
Fin
anci
alst
atem
ents
Nam
e o
fC
hie
f E
xecu
tive
Cre
dit
Rat
ing
Daw
ood
Fam
ily T
akaf
ul L
imite
dM
r. A
bdul
Hal
im N
asri
**
DH
A C
ogen
Lim
ited
Mr.
Mic
hael
Yap
**
Khu
shal
i Ban
k Li
mite
dM
r. M
oham
mad
Gha
libN
isht
arA
-
Pak
ista
n E
xpor
t Fin
ance
G
uara
ntee
Lim
ited
–M
r. S
. M. Z
aeem
**
Soc
iety
for
Wor
ld W
ide
Inte
r B
ank
Fun
d T
rans
fer
(SW
IFT
)–
143,
758
Mr.
Laz
aro
Cam
pos
**
** R
atin
gs a
re n
ot a
vaila
ble
5.
FU
LL
Y P
AID
-UP
PR
EF
ER
EN
CE
SH
AR
ES
- L
IST
ED
2010
2009
2010
2009
No
. of
shar
esR
up
ees
in ‘0
00C
hena
b Li
mite
dP
refe
renc
e sh
ares
of R
s. 1
0/-
each
40,0
0040
,000
4,00
0,00
04,
000,
000
123,
101
33,0
55
24,9
50
–
30,4
50
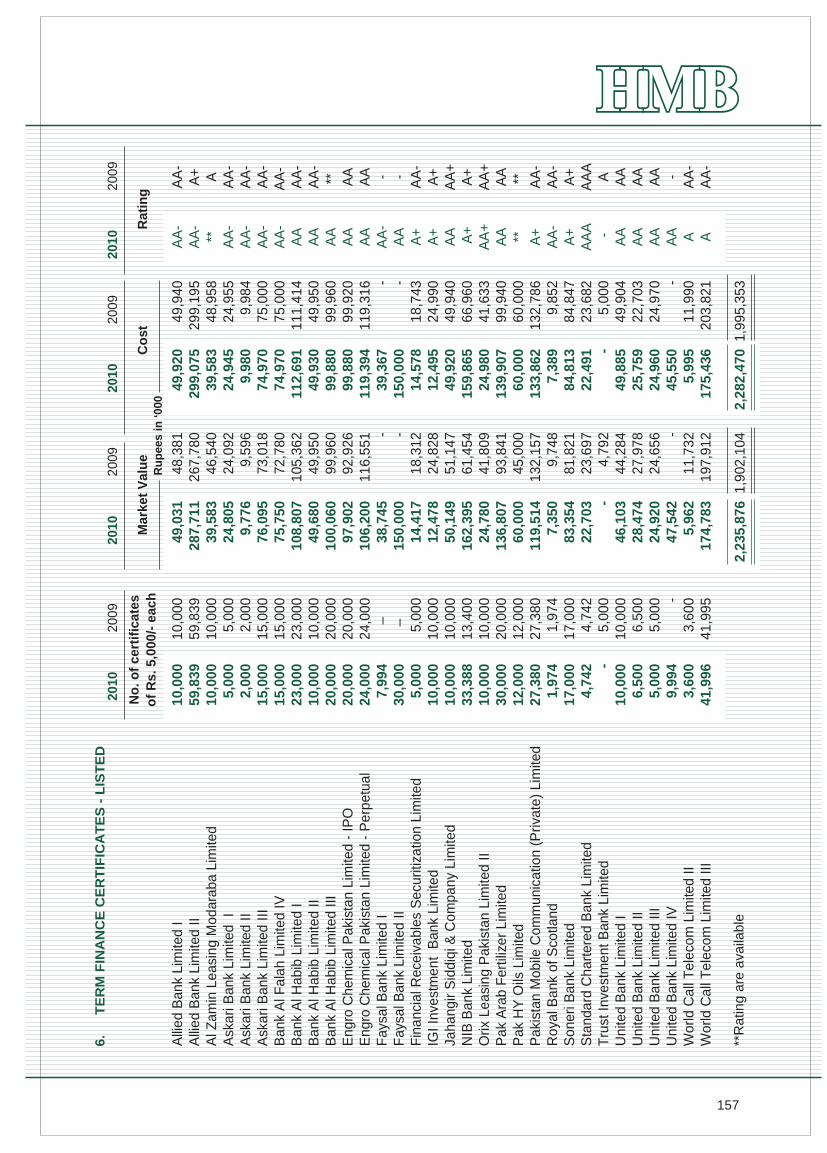
157
6.
TE
RM
FIN
AN
CE
CE
RT
IFIC
AT
ES
- L
IST
ED
Alli
ed B
ank
Lim
ited
IA
llied
Ban
k Li
mite
d II
Al Z
amin
Lea
sing
Mod
arab
a Li
mite
dA
skar
i Ban
k Li
mite
d I
Ask
ari B
ank
Lim
ited
IIA
skar
i Ban
k Li
mite
d III
Ban
k A
l Fal
ah L
imite
d IV
Ban
k A
l Hab
ib L
imite
d I
Ban
k A
l Hab
ib L
imite
d II
Ban
k A
l Hab
ib L
imite
d III
Eng
ro C
hem
ical
Pak
ista
n Li
mite
d -
IPO
Eng
ro C
hem
ical
Pak
ista
n Li
mite
d -
Per
petu
alF
aysa
l Ban
k Li
mite
d I
Fay
sal B
ank
Lim
ited
IIF
inan
cial
Rec
eiva
bles
Sec
uriti
zatio
n Li
mite
dIG
I Inv
estm
ent
Ban
k Li
mite
dJa
hang
ir S
iddi
qi &
Com
pany
Lim
ited
NIB
Ban
k Li
mite
dO
rix L
easi
ng P
akis
tan
Lim
ited
IIP
ak A
rab
Fer
tiliz
er L
imite
dP
ak H
Y O
ils L
imite
dP
akis
tan
Mob
ile C
omm
unic
atio
n (P
rivat
e) L
imite
dR
oyal
Ban
k of
Sco
tland
Son
eri B
ank
Lim
ited
Sta
ndar
d C
hart
ered
Ban
k Li
mite
dT
rust
Inve
stm
ent B
ank
Lim
ited
Uni
ted
Ban
k Li
mite
d I
Uni
ted
Ban
k Li
mite
d II
Uni
ted
Ban
k Li
mite
d III
Uni
ted
Ban
k Li
mite
d IV
Wor
ld C
all T
elec
om L
imite
d II
Wor
ld C
all T
elec
om L
imite
d III
**R
atin
g ar
e av
aila
ble
2010
2009
No
. of
cert
ific
ates
of
Rs.
5,0
00/-
eac
hM
arke
t V
alu
eC
ost
Rat
ing
Ru
pee
s in
‘000
10,
000
59,
839
10,
000
5,0
00 2
,000
15,
000
15,
000
23,
000
10,
000
20,
000
20,
000
24,
000
– – 5
,000
10,
000
10,
000
13,
400
10,
000
20,
000
12,
000
27,
380
1,9
74 1
7,00
0 4
,742
5,0
00 1
0,00
0 6
,500
5,0
00 - 3
,600
41,
995
AA
-A
A-
** AA
-A
A-
AA
-A
A-
AA
AA
AA
AA
AA
AA
-A
AA
+A
+A
A A
+A
A+
AA ** A+
AA
-A
+A
AA
- AA
AA
AA
AA A A
10,
000
59,
839
10,
000
5,0
00 2
,000
15,
000
15,
000
23,
000
10,
000
20,
000
20,
000
24,
000
7,9
94 3
0,00
0 5
,000
10,
000
10,
000
33,
388
10,
000
30,
000
12,
000
27,
380
1,9
74 1
7,00
0 4
,742 -
10,
000
6,5
00 5
,000
9,9
94 3
,600
41,
996
49,
031
287
,711
39,
583
24,
805
9,7
76 7
6,09
5 7
5,75
0 1
08,8
07 4
9,68
0 1
00,0
60 9
7,90
2 1
06,2
00 3
8,74
5 1
50,0
00 1
4,41
7 1
2,47
8 5
0,14
9 1
62,3
95 2
4,78
0 1
36,8
07 6
0,00
0 1
19,5
14 7
,350
83,
354
22,
703 -
46,
103
28,
474
24,
920
47,
542
5,9
62 1
74,7
83
2,2
35,8
76
48,
381
267
,780
46,
540
24,
092
9,5
96 7
3,01
8 7
2,78
0 1
05,3
62 4
9,95
0 9
9,96
0 9
2,92
6 1
16,5
51 - - 1
8,31
2 2
4,82
8 5
1,14
7 6
1,45
4 4
1,80
9 9
3,84
1 4
5,00
0 1
32,1
57 9
,748
81,
821
23,
697
4,7
92 4
4,28
4 2
7,97
8 2
4,65
6 - 1
1,73
2 1
97,9
12
1,9
02,1
04
49,
920
299
,075
39,
583
24,
945
9,9
80 7
4,97
0 7
4,97
0 1
12,6
91 4
9,93
0 9
9,88
0 9
9,88
0 1
19,3
94 3
9,36
7 1
50,0
00 1
4,57
8 1
2,49
5 4
9,92
0 1
59,8
65 2
4,98
0 1
39,9
07 6
0,00
0 1
33,8
62 7
,389
84,
813
22,
491 -
49,
885
25,
759
24,
960
45,
550
5,9
95 1
75,4
36
2,2
82,4
70
49,
940
299
,195
48,
958
24,
955
9,9
84 7
5,00
0 7
5,00
0 1
11,4
14 4
9,95
0 9
9,96
0 9
9,92
0 1
19,3
16 - - 1
8,74
3 2
4,99
0 4
9,94
0 6
6,96
0 4
1,63
3 9
9,94
0 6
0,00
0 1
32,7
86 9
,852
84,
847
23,
682
5,0
00 4
9,90
4 2
2,70
3 2
4,97
0 - 1
1,99
0 2
03,8
21
1,9
95,3
53
2010
2009
2010
2009
2010
2009
AA
- A
+ A AA
- A
A-
AA
-A
A-
AA
- A
A-
** AA
AA - -
AA
- A
+ A
A+
A+
AA
+ A
A ** A
A-
AA
- A
+ A
AA
A AA
AA
AA -
AA
- A
A-
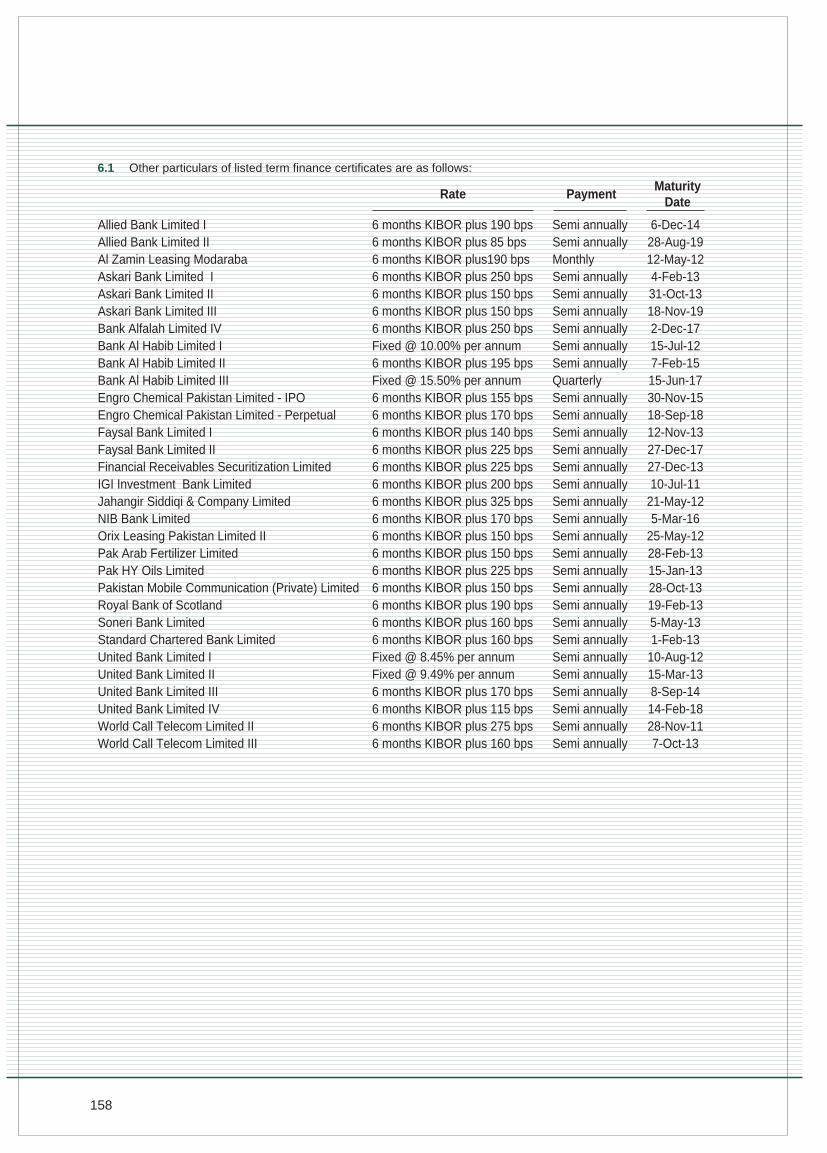
158
6 months KIBOR plus 190 bps6 months KIBOR plus 85 bps6 months KIBOR plus190 bps6 months KIBOR plus 250 bps6 months KIBOR plus 150 bps6 months KIBOR plus 150 bps6 months KIBOR plus 250 bpsFixed @ 10.00% per annum6 months KIBOR plus 195 bpsFixed @ 15.50% per annum6 months KIBOR plus 155 bps6 months KIBOR plus 170 bps6 months KIBOR plus 140 bps6 months KIBOR plus 225 bps6 months KIBOR plus 225 bps6 months KIBOR plus 200 bps6 months KIBOR plus 325 bps6 months KIBOR plus 170 bps6 months KIBOR plus 150 bps6 months KIBOR plus 150 bps6 months KIBOR plus 225 bps6 months KIBOR plus 150 bps6 months KIBOR plus 190 bps6 months KIBOR plus 160 bps6 months KIBOR plus 160 bpsFixed @ 8.45% per annumFixed @ 9.49% per annum6 months KIBOR plus 170 bps6 months KIBOR plus 115 bps6 months KIBOR plus 275 bps6 months KIBOR plus 160 bps
Semi annuallySemi annuallyMonthlySemi annuallySemi annuallySemi annuallySemi annuallySemi annuallySemi annuallyQuarterlySemi annuallySemi annuallySemi annuallySemi annuallySemi annuallySemi annuallySemi annuallySemi annuallySemi annuallySemi annuallySemi annuallySemi annuallySemi annuallySemi annuallySemi annuallySemi annuallySemi annuallySemi annuallySemi annuallySemi annuallySemi annually
6-Dec-1428-Aug-1912-May-124-Feb-1331-Oct-1318-Nov-192-Dec-1715-Jul-127-Feb-1515-Jun-1730-Nov-1518-Sep-1812-Nov-1327-Dec-1727-Dec-1310-Jul-11
21-May-125-Mar-16
25-May-1228-Feb-1315-Jan-1328-Oct-1319-Feb-135-May-131-Feb-13
10-Aug-1215-Mar-138-Sep-1414-Feb-1828-Nov-117-Oct-13
6.1 Other particulars of listed term finance certificates are as follows:
Allied Bank Limited IAllied Bank Limited IIAl Zamin Leasing ModarabaAskari Bank Limited IAskari Bank Limited IIAskari Bank Limited IIIBank Alfalah Limited IVBank Al Habib Limited IBank Al Habib Limited IIBank Al Habib Limited IIIEngro Chemical Pakistan Limited - IPOEngro Chemical Pakistan Limited - PerpetualFaysal Bank Limited IFaysal Bank Limited IIFinancial Receivables Securitization LimitedIGI Investment Bank LimitedJahangir Siddiqi & Company LimitedNIB Bank LimitedOrix Leasing Pakistan Limited IIPak Arab Fertilizer LimitedPak HY Oils LimitedPakistan Mobile Communication (Private) LimitedRoyal Bank of ScotlandSoneri Bank LimitedStandard Chartered Bank LimitedUnited Bank Limited IUnited Bank Limited IIUnited Bank Limited IIIUnited Bank Limited IVWorld Call Telecom Limited IIWorld Call Telecom Limited III
Rate PaymentMaturity
Date
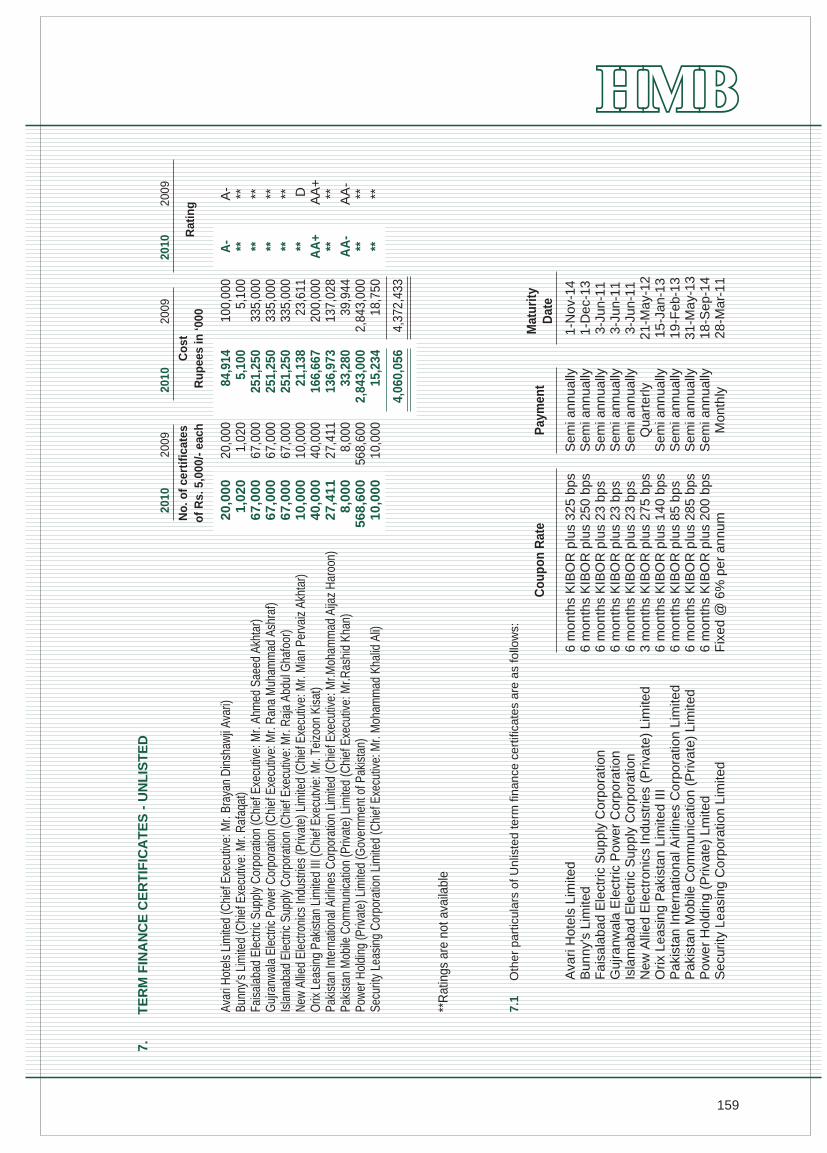
159
6 m
onth
s K
IBO
R p
lus
325
bps
6 m
onth
s K
IBO
R p
lus
250
bps
6 m
onth
s K
IBO
R p
lus
23 b
ps6
mon
ths
KIB
OR
plu
s 23
bps
6 m
onth
s K
IBO
R p
lus
23 b
ps3
mon
ths
KIB
OR
plu
s 27
5 bp
s6
mon
ths
KIB
OR
plu
s 14
0 bp
s6
mon
ths
KIB
OR
plu
s 85
bps
6 m
onth
s K
IBO
R p
lus
285
bps
6 m
onth
s K
IBO
R p
lus
200
bps
Fix
ed @
6%
per
ann
um
Sem
i ann
ually
Sem
i ann
ually
Sem
i ann
ually
Sem
i ann
ually
Sem
i ann
ually
Qua
rter
lyS
emi a
nnua
llyS
emi a
nnua
llyS
emi a
nnua
llyS
emi a
nnua
llyM
onth
ly
1-N
ov-1
41-
Dec
-13
3-Ju
n-11
3-Ju
n-11
3-Ju
n-11
21-M
ay-1
215
-Jan
-13
19-F
eb-1
331
-May
-13
18-S
ep-1
428
-Mar
-11
A- ** ** ** ** **
AA
+** AA
-** **
84,
914
5,1
00 2
51,2
50 2
51,2
50 2
51,2
50 2
1,13
8 1
66,6
67 1
36,9
73 3
3,28
0 2
,843
,000
15,
234
4,0
60,0
56
20,
000
1,0
20 6
7,00
0 6
7,00
0 6
7,00
0 1
0,00
0 4
0,00
0 2
7,41
1 8
,000
568
,600
10,
000
7.T
ER
M F
INA
NC
E C
ER
TIF
ICA
TE
S -
UN
LIS
TE
D
Avar
i Hot
els
Lim
ited
(Chi
ef E
xecu
tive:
Mr.
Bray
an D
insh
awji
Avar
i)Bu
nny's
Lim
ited
(Chi
ef E
xecu
tive:
Mr.
Raf
aqat
)Fa
isal
abad
Ele
ctric
Sup
ply
Cor
pora
tion
(Chi
ef E
xecu
tive:
Mr.
Ahm
ed S
aeed
Akh
tar)
Guj
ranw
ala
Elec
tric
Pow
er C
orpo
ratio
n (C
hief
Exe
cutiv
e: M
r. R
ana
Muh
amm
ad A
shra
f)Is
lam
abad
Ele
ctric
Sup
ply
Cor
pora
tion
(Chi
ef E
xecu
tive:
Mr.
Raj
a Ab
dul G
hafo
or)
New
Allie
d El
ectro
nics
Indu
strie
s (P
rivat
e) L
imite
d (C
hief
Exe
cutiv
e: M
r. M
ian
Perv
aiz
Akht
ar)
Orix
Lea
sing
Pak
ista
n Li
mite
d III
(Chi
ef E
xecu
tvie
: Mr.
Teiz
oon
Kisa
t)Pa
kist
an In
tern
atio
nal A
irlin
es C
orpo
ratio
n Li
mite
d (C
hief
Exe
cutiv
e: M
r.Moh
amm
ad A
ijaz
Har
oon)
Paki
stan
Mob
ile C
omm
unic
atio
n (P
rivat
e) L
imite
d (C
hief
Exe
cutiv
e: M
r.Ras
hid
Khan
)Po
wer
Hol
ding
(Priv
ate)
Lim
ited
(Gov
ernm
ent o
f Pak
ista
n)Se
curit
y Le
asin
g C
orpo
ratio
n Li
mite
d (C
hief
Exe
cutiv
e: M
r. M
oham
mad
Kha
lid A
li)
2010
2009
2010
2009
Co
stR
up
ees
in ‘0
00
2010
2009
Rat
ing
20,
000
1,0
20 6
7,00
0 6
7,00
0 6
7,00
0 1
0,00
0 4
0,00
0 2
7,41
1 8
,000
568
,600
10,
000
A- ** ** ** ** D
AA
+** AA
-** **
No
. of
cert
ific
ates
of
Rs.
5,0
00/-
eac
h
100
,000
5,1
00 3
35,0
00 3
35,0
00 3
35,0
00 2
3,61
1 2
00,0
00 1
37,0
28 3
9,94
4 2
,843
,000
18,
750
4,3
72,4
33
**R
atin
gs a
re n
ot a
vaila
ble
Ava
ri H
otel
s Li
mite
dB
unny
's L
imite
dF
aisa
laba
d E
lect
ric S
uppl
y C
orpo
ratio
nG
ujra
nwal
a E
lect
ric P
ower
Cor
pora
tion
Isla
mab
ad E
lect
ric S
uppl
y C
orpo
ratio
nN
ew A
llied
Ele
ctro
nics
Indu
strie
s (P
rivat
e) L
imite
dO
rix L
easi
ng P
akis
tan
Lim
ited
IIIP
akis
tan
Inte
rnat
iona
l Airl
ines
Cor
pora
tion
Lim
ited
Pak
ista
n M
obile
Com
mun
icat
ion
(Priv
ate)
Lim
ited
Pow
er H
oldi
ng (
Priv
ate)
Lm
ited
Sec
urity
Lea
sing
Cor
pora
tion
Lim
ited
Cou
pon
Rat
eP
aym
ent
Mat
urity
Dat
e
7.1
Oth
er p
artic
ular
s of
Unl
iste
d te
rm fi
nanc
e ce
rtifi
cate
s ar
e as
follo
ws:
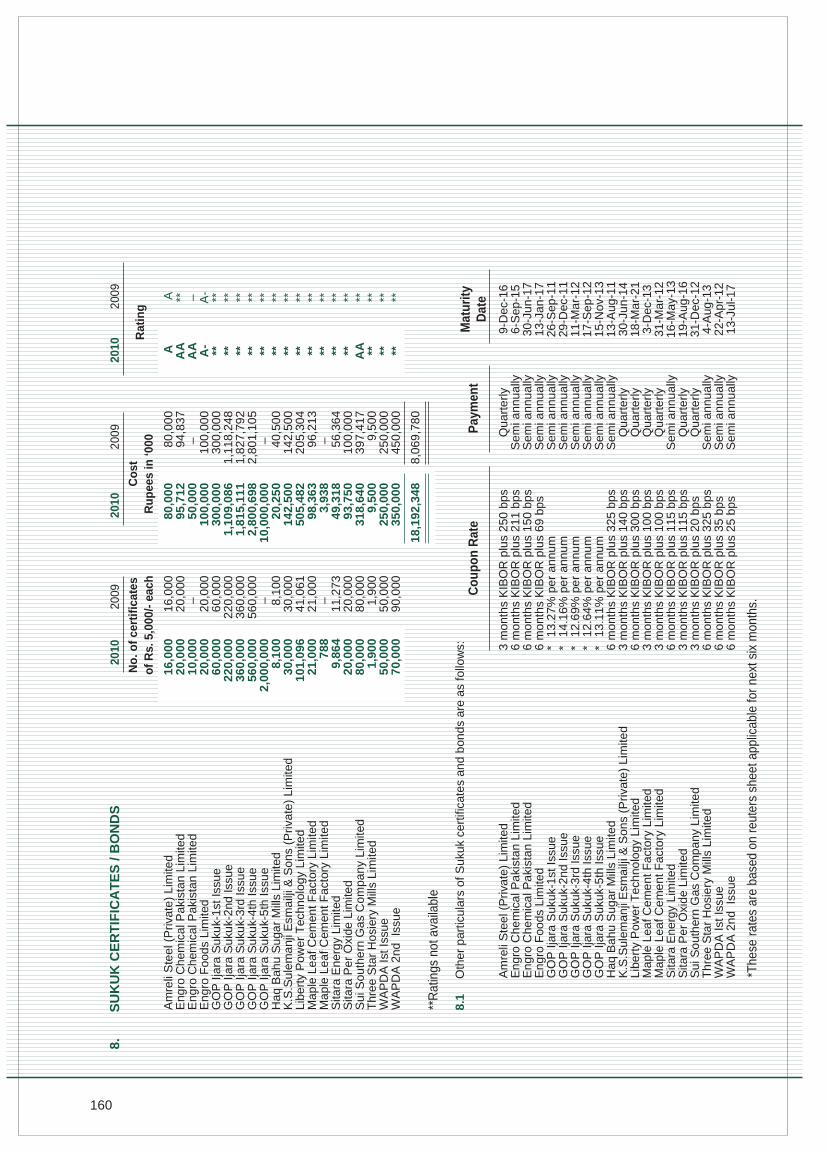
160
3 m
onth
s K
IBO
R p
lus
250
bps
6 m
onth
s K
IBO
R p
lus
211
bps
6 m
onth
s K
IBO
R p
lus
150
bps
6 m
onth
s K
IBO
R p
lus
69 b
ps*
13.2
7% p
er a
nnum
*14
.16%
per
ann
um*
12.6
9% p
er a
nnum
*12
.64%
per
ann
um*
13.1
1% p
er a
nnum
6 m
onth
s K
IBO
R p
lus
325
bps
3 m
onth
s K
IBO
R p
lus
140
bps
6 m
onth
s K
IBO
R p
lus
300
bps
3 m
onth
s K
IBO
R p
lus
100
bps
3 m
onth
s K
IBO
R p
lus
100
bps
6 m
onth
s K
IBO
R p
lus
115
bps
3 m
onth
s K
IBO
R p
lus
115
bps
3 m
onth
s K
IBO
R p
lus
20 b
ps6
mon
ths
KIB
OR
plu
s 32
5 bp
s6
mon
ths
KIB
OR
plu
s 35
bps
6 m
onth
s K
IBO
R p
lus
25 b
ps
Qua
rter
lyS
emi a
nnua
llyS
emi a
nnua
llyS
emi a
nnua
llyS
emi a
nnua
llyS
emi a
nnua
llyS
emi a
nnua
llyS
emi a
nnua
llyS
emi a
nnua
llyS
emi a
nnua
llyQ
uart
erly
Qua
rter
lyQ
uart
erly
Qua
rter
lyS
emi a
nnua
llyQ
uart
erly
Qua
rter
lyS
emi a
nnua
llyS
emi a
nnua
llyS
emi a
nnua
lly
9-D
ec-1
66-
Sep
-15
30-J
un-1
713
-Jan
-17
26-S
ep-1
129
-Dec
-11
11-M
ar-1
217
-Sep
-12
15-N
ov-1
313
-Aug
-11
30-J
un-1
418
-Mar
-21
3-D
ec-1
331
-Mar
-12
16-M
ay-1
319
-Aug
-16
31-D
ec-1
24-
Aug
-13
22-A
pr-1
213
-Jul
-17
A ** – A- ** ** ** ** ** ** ** ** ** ** ** ** ** ** ** **
A AA
AA A-
** ** ** ** ** ** ** ** ** ** ** ** AA ** ** **
80,
000
95,
712
50,
000
100
,000
300
,000
1,1
09,0
86 1
,815
,111
2,8
00,6
98 1
0,00
0,00
0 2
0,25
0 1
42,5
00 5
05,4
82 9
8,36
3 3
,938
49,
318
93,
750
318
,640
9,5
00 2
50,0
00 3
50,0
00
18,
192,
348
16,
000
20,
000
10,
000
20,
000
60,
000
220
,000
360
,000
560
,000
2,0
00,0
00 8
,100
30,
000
101
,096
21,
000
788
9,8
64 2
0,00
0 8
0,00
0 1
,900
50,
000
70,
000
8.S
UK
UK
CE
RT
IFIC
AT
ES
/ B
ON
DS
Am
reli
Ste
el (
Priv
ate)
Lim
ited
Eng
ro C
hem
ical
Pak
ista
n Li
mite
dE
ngro
Che
mic
al P
akis
tan
Lim
ited
Eng
ro F
oods
Lim
ited
GO
P Ij
ara
Suk
uk-1
st Is
sue
GO
P Ij
ara
Suk
uk-2
nd Is
sue
GO
P Ij
ara
Suk
uk-3
rd Is
sue
GO
P Ij
ara
Suk
uk-4
th Is
sue
GO
P Ij
ara
Suk
uk-5
th Is
sue
Haq
Bah
u S
ugar
Mill
s Li
mite
dK
.S.S
ulem
anji
Esm
ailji
& S
ons
(Priv
ate)
Lim
ited
Libe
rty
Pow
er T
echn
olog
y Li
mite
dM
aple
Lea
f Cem
ent F
acto
ry L
imite
dM
aple
Lea
f Cem
ent F
acto
ry L
imite
dS
itara
Ene
rgy
Lim
ited
Sita
ra P
er O
xide
Lim
ited
Sui
Sou
ther
n G
as C
ompa
ny L
imite
dT
hree
Sta
r H
osie
ry M
ills
Lim
ited
WA
PD
A Is
t Iss
ueW
AP
DA
2nd
Iss
ue
2010
2009
2010
2009
Co
stR
up
ees
in ‘0
00
2010
2009
Rat
ing
16,
000
20,
000
– 2
0,00
0 6
0,00
0 2
20,0
00 3
60,0
00 5
60,0
00– 8,1
00 3
0,00
0 4
1,06
1 2
1,00
0–
11,
273
20,
000
80,
000
1,9
00 5
0,00
0 9
0,00
0
No
. of
cert
ific
ates
of
Rs.
5,0
00/-
eac
h
80,
000
94,
837
– 1
00,0
00 3
00,0
00 1
,118
,248
1,8
27,7
92 2
,801
,105
– 40,
500
142
,500
205
,304
96,
213
– 56,
364
100
,000
397
,417
9,5
00 2
50,0
00 4
50,0
00
8,0
69,7
80
**R
atin
gs n
ot a
vaila
ble
8.1
Oth
er p
artic
ular
s of
Suk
uk c
ertif
icat
es a
nd b
onds
are
as
follo
ws:
Am
reli
Ste
el (
Priv
ate)
Lim
ited
Eng
ro C
hem
ical
Pak
ista
n Li
mite
dE
ngro
Che
mic
al P
akis
tan
Lim
ited
Eng
ro F
oods
Lim
ited
GO
P Ij
ara
Suk
uk-1
st Is
sue
GO
P Ij
ara
Suk
uk-2
nd Is
sue
GO
P Ij
ara
Suk
uk-3
rd Is
sue
GO
P Ij
ara
Suk
uk-4
th Is
sue
GO
P Ij
ara
Suk
uk-5
th Is
sue
Haq
Bah
u S
ugar
Mill
s Li
mite
dK
.S.S
ulem
anji
Esm
ailji
& S
ons
(Priv
ate)
Lim
ited
Libe
rty
Pow
er T
echn
olog
y Li
mite
dM
aple
Lea
f Cem
ent F
acto
ry L
imite
dM
aple
Lea
f Cem
ent F
acto
ry L
imite
dS
itara
Ene
rgy
Lim
ited
Sita
ra P
er O
xide
Lim
ited
Sui
Sou
ther
n G
as C
ompa
ny L
imite
dT
hree
Sta
r H
osie
ry M
ills
Lim
ited
WA
PD
A Is
t Iss
ueW
AP
DA
2nd
Iss
ue
Cou
pon
Rat
eP
aym
ent
Mat
urity
Dat
e
*The
se ra
tes
are
base
d on
reut
ers
shee
t app
licab
le fo
r nex
t six
mon
ths.
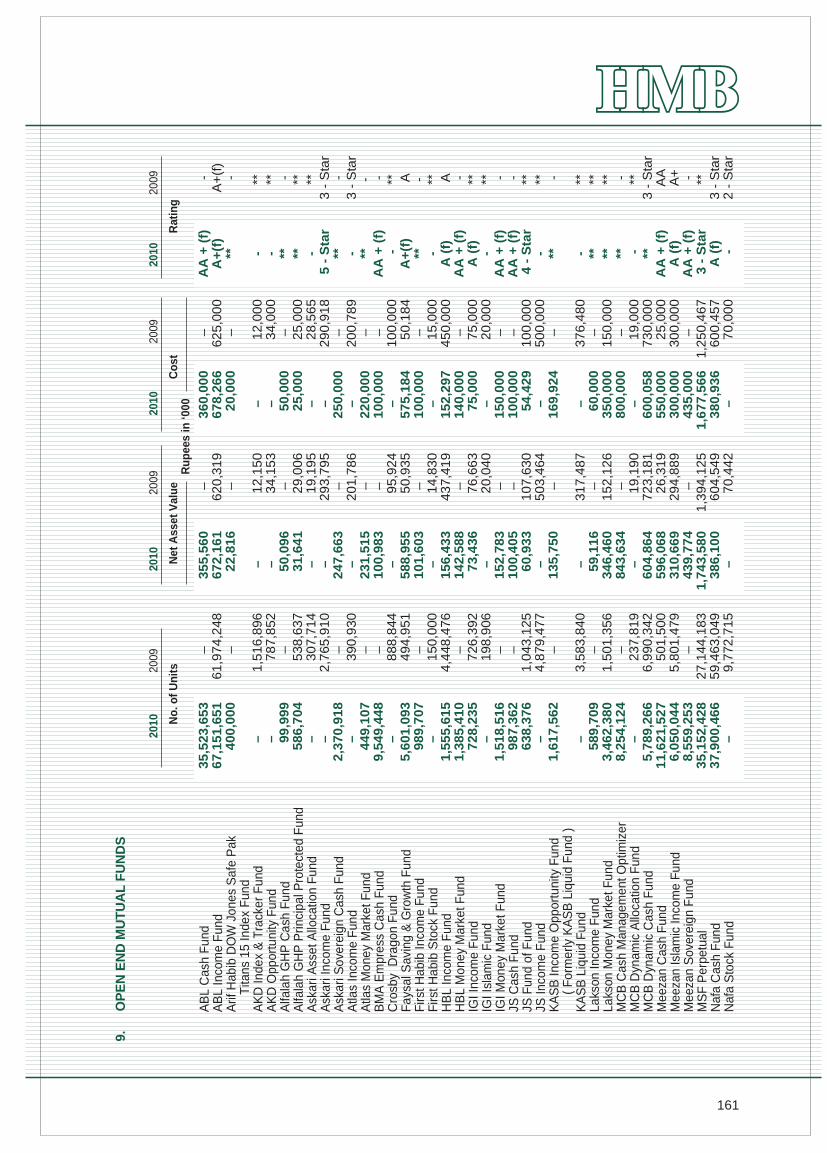
161
36
0,0
00
67
8,2
66
20
,00
0
– – 5
0,0
00
25
,00
0– –
25
0,0
00
– 2
20
,00
0 1
00
,00
0–
57
5,1
84
10
0,0
00
– 1
52
,29
7 1
40
,00
0 7
5,0
00
– 1
50
,00
0 1
00
,00
0 5
4,4
29
– 1
69
,92
4
– 6
0,0
00
35
0,0
00
80
0,0
00
– 6
00
,05
8 5
50
,00
0 3
00
,00
0 4
35
,00
0 1
,67
7,5
66
38
0,9
36
–
35
5,5
60
67
2,1
61
22
,81
6
– – 5
0,0
96
31
,64
1– –
24
7,6
63
– 2
31
,51
5 1
00
,98
3–
58
8,9
55
10
1,6
03
– 1
56
,43
3 1
42
,58
8 7
3,4
36
– 1
52
,78
3 1
00
,40
5 6
0,9
33
– 1
35
,75
0
– 5
9,1
16
34
6,4
60
84
3,6
34
– 6
04
,86
4 5
96
,06
8 3
10
,66
9 4
39
,77
4 1
,74
3,5
80
38
6,1
00
–
35
,52
3,6
53
67
,15
1,6
51
40
0,0
00
– – 99
,99
9 5
86
,70
4– –
2,3
70
,91
8–
44
9,1
07
9,5
49
,44
8–
5,6
01
,09
3 9
89
,70
7–
1,5
55
,61
5 1
,38
5,4
10
72
8,2
35
– 1
,51
8,5
16
98
7,3
62
63
8,3
76
– 1
,61
7,5
62
– 5
89
,70
9 3
,46
2,3
80
8,2
54
,12
4–
5,7
89
,26
6 1
1,6
21
,52
7 6
,05
0,0
44
8,5
59
,25
3 3
5,1
52
,42
8 3
7,9
00
,46
6–
9.
OP
EN
EN
D M
UT
UA
L F
UN
DS
2010
2009
2010
2009
2010
2009
Net
Ass
et V
alu
eC
ost
Rat
ing
Ru
pee
s in
‘000
2010
2009
No
. of
Un
its
AB
L C
ash
Fun
dA
BL
Inco
me
Fun
dA
rif H
abib
DO
W J
ones
Saf
e P
akT
itans
15
Inde
x F
und
AK
D In
dex
& T
rack
er F
und
AK
D O
ppor
tuni
ty F
und
Alfa
lah
GH
P C
ash
Fun
dA
lfala
h G
HP
Prin
cipa
l Pro
tect
ed F
und
Ask
ari A
sset
Allo
catio
n F
und
Ask
ari I
ncom
e F
und
Ask
ari S
over
eign
Cas
h F
und
Atla
s In
com
e F
und
Atla
s M
oney
Mar
ket F
und
BM
A E
mpr
ess
Cas
h F
und
Cro
sby
Dra
gon
Fun
dF
aysa
l Sav
ing
& G
row
th F
und
Firs
t Hab
ib In
com
e F
und
Firs
t Hab
ib S
tock
Fun
dH
BL
Inco
me
Fun
dH
BL
Mon
ey M
arke
t Fun
dIG
I Inc
ome
Fun
dIG
I Isl
amic
Fun
dIG
I Mon
ey M
arke
t Fun
dJS
Cas
h F
und
JS F
und
of F
und
JS In
com
e F
und
KA
SB
Inco
me
Opp
ortu
nity
Fun
d(
For
mer
ly K
AS
B L
iqui
d F
und
)K
AS
B L
iqui
d F
und
Laks
on In
com
e F
und
Laks
on M
oney
Mar
ket F
und
MC
B C
ash
Man
agem
ent O
ptim
izer
MC
B D
ynam
ic A
lloca
tion
Fun
dM
CB
Dyn
amic
Cas
h F
und
Mee
zan
Cas
h F
und
Mee
zan
Isla
mic
Inco
me
Fun
dM
eeza
n S
over
eign
Fun
dM
SF
Per
petu
alN
afa
Cas
h F
und
Naf
a S
tock
Fun
d
– 6
20
,31
9–
12
,15
0 3
4,1
53
– 2
9,0
06
19
,19
5 2
93
,79
5–
20
1,7
86
– – 9
5,9
24
50
,93
5–
14
,83
0 4
37
,41
9–
76
,66
3 2
0,0
40
– – 1
07
,63
0 5
03
,46
4–
31
7,4
87
– 1
52
,12
6–
19
,19
0 7
23
,18
1 2
6,3
19
29
4,8
89
– 1
,39
4,1
25
60
4,5
49
70
,44
2
– 6
25
,00
0– 12
,00
0 3
4,0
00
– 2
5,0
00
28
,56
5 2
90
,91
8–
20
0,7
89
– – 1
00
,00
0 5
0,1
84
– 1
5,0
00
45
0,0
00
– 7
5,0
00
20
,00
0– –
10
0,0
00
50
0,0
00
–
37
6,4
80
– 1
50
,00
0–
19
,00
0 7
30
,00
0 2
5,0
00
30
0,0
00
– 1
,25
0,4
67
60
0,4
57
70
,00
0
AA
+ (
f)A
+(f
)** - - ** ** -
5 -
Sta
r** - **
AA
+ (
f) -
A+
(f)
** -A
(f)
AA
+ (
f)A
(f) -
AA
+ (
f)A
A +
(f)
4 -
Sta
r- ** - ** ** ** - **
AA
+ (
f)A
(f)
AA
+ (
f) 3
- S
tar
A (
f) -
- A
+(f
) - ** ** - ** **
3 -
Sta
r -
3 -
Sta
r- - ** A - ** A - ** ** - - ** ** - ** ** ** - **
3 -
Sta
r A
A A
+ - ** 3
- S
tar
2 -
Sta
r
– 6
1,9
74
,24
8–
1,5
16
,89
6 7
87
,85
2–
53
8,6
37
30
7,7
14
2,7
65
,91
0–
39
0,9
30
– – 8
88
,84
4 4
94
,95
1–
15
0,0
00
4,4
48
,47
6–
72
6,3
92
19
8,9
06
– – 1
,04
3,1
25
4,8
79
,47
7–
3,5
83
,84
0–
1,5
01
,35
6–
23
7,8
19
6,9
90
,34
2 5
01
,50
0 5
,80
1,4
79
– 2
7,1
44
,18
3 5
9,4
63
,04
9 9
,77
2,7
15
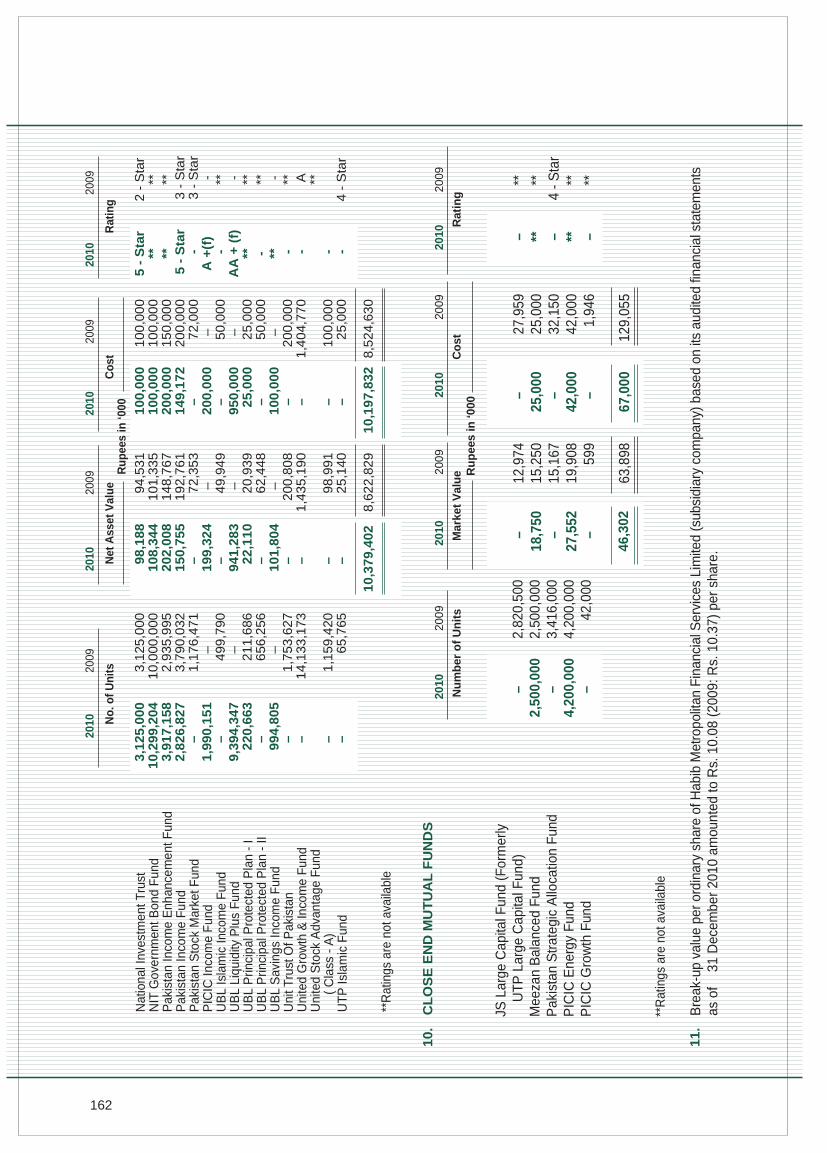
162
**R
atin
gs a
re n
ot a
vaila
ble
10
0,0
00
10
0,0
00
20
0,0
00
14
9,1
72
– 2
00
,00
0–
95
0,0
00
25
,00
0–
10
0,0
00
– – – –
10
,19
7,8
32
98
,18
8 1
08
,34
4 2
02
,00
8 1
50
,75
5–
19
9,3
24
– 9
41
,28
3 2
2,1
10
– 1
01
,80
4– – – –
10
,37
9,4
02
3,1
25
,00
0 1
0,2
99
,20
4 3
,91
7,1
58
2,8
26
,82
7–
1,9
90
,15
1–
9,3
94
,34
7 2
20
,66
3–
99
4,8
05
– – – –
2010
2009
2010
2009
2010
2009
Net
Ass
et V
alu
eC
ost
Rat
ing
Ru
pee
s in
‘000
2010
2009
No
. of
Un
its
Nat
iona
l Inv
estm
ent T
rust
NIT
Gov
ernm
ent B
ond
Fun
dP
akis
tan
Inco
me
Enh
ance
men
t Fun
dP
akis
tan
Inco
me
Fun
dP
akis
tan
Sto
ck M
arke
t Fun
dP
ICIC
Inco
me
Fun
dU
BL
Isla
mic
Inco
me
Fun
dU
BL
Liqu
idity
Plu
s F
und
UB
L P
rinci
pal P
rote
cted
Pla
n -
IU
BL
Prin
cipa
l Pro
tect
ed P
lan
- II
UB
L S
avin
gs In
com
e F
und
Uni
t Tru
st O
f Pak
ista
nU
nite
d G
row
th &
Inco
me
Fun
dU
nite
d S
tock
Adv
anta
ge F
und
( C
lass
- A
)U
TP
Isla
mic
Fun
d
94
,53
1 1
01
,33
5 1
48
,76
7 1
92
,76
1 7
2,3
53
– 4
9,9
49
– 2
0,9
39
62
,44
8–
20
0,8
08
1,4
35
,19
0
98
,99
12
5,1
40
8,6
22
,82
9
10
0,0
00
10
0,0
00
15
0,0
00
20
0,0
00
72
,00
0–
50
,00
0–
25
,00
0 5
0,0
00
– 2
00
,00
0 1
,40
4,7
70
10
0,0
00
25
,00
0
8,5
24
,63
0
5 -
Sta
r** **
5 -
Sta
r -
A +
(f)
-A
A +
(f)
** - ** - - - -
2 -
Sta
r** **
3 -
Sta
r 3
- S
tar
- ** - ** ** - ** A **
4 -
Sta
r
3,1
25
,00
0 1
0,0
00
,00
0 2
,93
5,9
95
3,7
90
,03
2 1
,17
6,4
71
– 4
99
,79
0–
21
1,6
86
65
6,2
56
– 1
,75
3,6
27
14
,13
3,1
73
1,1
59
,42
0 6
5,7
65
10
. C
LO
SE
EN
D M
UT
UA
L F
UN
DS
JS L
arge
Cap
ital F
und
(For
mer
ly
UT
P L
arge
Cap
ital F
und)
Mee
zan
Bal
ance
d F
und
Pak
ista
n S
trat
egic
Allo
catio
n F
und
PIC
IC E
nerg
y F
und
PIC
IC G
row
th F
und
2010
2009
Nu
mb
er o
f U
nit
s
2010
2009
2010
2009
2010
2009
Mar
ket
Val
ue
Co
stR
atin
gR
up
ees
in ‘0
00
– 2
,500
,000
– 4
,200
,000
–
2,82
0,50
0 2
,500
,000
3,4
16,0
00 4
,200
,000
42,
000
– 1
8,75
0–
27,
552
–
46,3
02
12,
974
15,
250
15,
167
19,
908
599
63,
898
– 2
5,00
0–
42,
000
–
67,
000
27,
959
25,
000
32,
150
42,
000
1,9
46
129
,055
– ** – ** –
** ** 4
- S
tar
** **
Bre
ak-u
p va
lue
per o
rdin
ary
shar
e of
Hab
ib M
etro
polit
an F
inan
cial
Ser
vice
s Li
mite
d (s
ubsi
diar
y co
mpa
ny) b
ased
on
its a
udite
d fin
anci
al s
tate
men
tsas
of
31
Dec
embe
r 20
10 a
mou
nted
to R
s. 1
0.08
(20
09: R
s. 1
0.37
) pe
r sh
are.
11
.
**R
atin
gs a
re n
ot a
vaila
ble
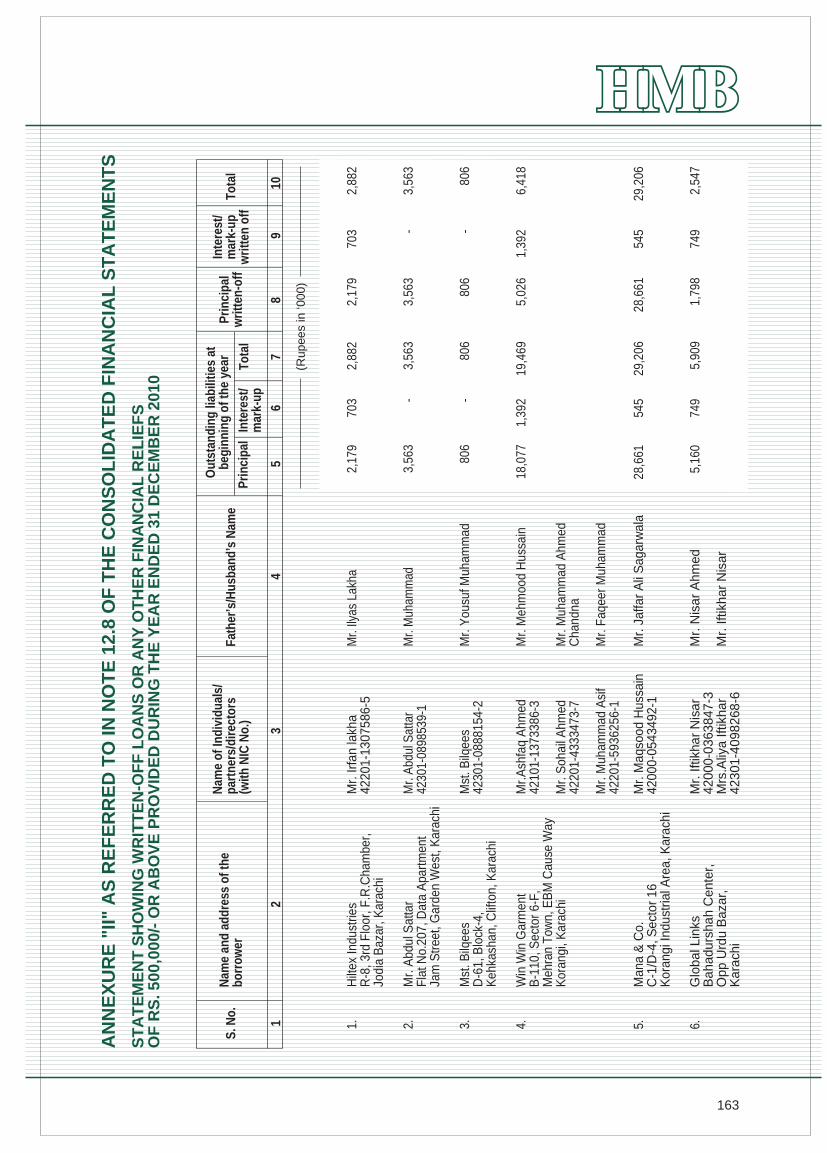
163
Nam
e an
d ad
dres
s of
the
borr
ower
Nam
e of
Indi
vidu
als/
part
ners
/dir
ecto
rs(w
ith N
IC N
o.)
Fath
er’s
/Hus
band
’s N
ame
Pri
ncip
alIn
tere
st/
mar
k-up
Tota
l
Pri
ncip
alw
ritt
en-o
ff
Inte
rest
/m
ark-
upw
ritt
en o
ffTo
tal
Out
stan
ding
liab
ilitie
s at
begi
nnin
g of
the
year
S. N
o.
ST
AT
EM
EN
T S
HO
WIN
G W
RIT
TE
N-O
FF
LO
AN
S O
R A
NY
OT
HE
R F
INA
NC
IAL
RE
LIE
FS
OF
RS
. 500
,000
/- O
R A
BO
VE
PR
OV
IDE
D D
UR
ING
TH
E Y
EA
R E
ND
ED
31
DE
CE
MB
ER
201
0
Hilt
ex In
dust
ries
R-8
, 3rd
Flo
or, F
.R.C
ham
ber,
Jodi
a B
azar
, Kar
achi
Mr.
Irfa
n la
kha
4220
1-13
0758
6-5
Mr.
Ilyas
Lak
ha2,
179
703
2,88
22,
179
703
2,88
21.
Mr.
Abd
ul S
atta
rFl
at N
o.20
7, D
ata
Apa
rtmen
tJa
m S
treet
, Gar
den
Wes
t, K
arac
hi
Mr.
Abd
ul S
atta
r42
301-
0898
539-
1M
r. M
uham
mad
3,56
3-
3,56
33,
563
-3,
563
2.
(Rup
ees
in ‘0
00)
12
34
56
78
910
Mst
. Bilq
ees
D-6
1, B
lock
-4,
Keh
kash
an, C
lifto
n, K
arac
hi
Mst
. Bilq
ees
4230
1-08
8815
4-2
Mr.
You
suf M
uham
mad
806
-80
680
6-
806
3.
Win
Win
Gar
men
tB
-110
, Sec
tor 6
-F,
Meh
ran
Tow
n, E
BM
Cau
se W
ayK
oran
gi, K
arac
hi
Mr.A
shfa
q A
hmed
4210
1-13
7338
6-3
Mr.
Soh
ail A
hmed
4220
1-43
3347
3-7
Mr.
Muh
amm
ad A
sif
4220
1-59
3625
6-1
Mr.
Meh
moo
d H
ussa
in
Mr.
Muh
amm
ad A
hmed
Cha
ndna
Mr.
Faqe
er M
uham
mad
18,0
771,
392
19,4
695,
026
1,39
26,
418
4.
Man
a &
Co.
C-1
/D-4
, Sec
tor
16K
oran
gi In
dust
rial A
rea,
Kar
achi
Mr.
Maq
sood
Hus
sain
4200
0-05
4349
2-1
Mr.
Jaf
far
Ali
Sag
arw
ala
545
29,2
0628
,661
545
29,2
065.
28,6
61
Glo
bal L
inks
Bah
adur
shah
Cen
ter,
Opp
Urd
u B
azar
,K
arac
hi
Mr.
Iftik
har
Nis
ar42
000-
0363
847-
3M
rs.A
liya
Iftik
har
4230
1-40
9826
8-6
Mr.
Nis
ar A
hmed
Mr.
Iftik
har
Nis
ar
749
5,90
91,
798
749
2,54
76.
5,16
0
AN
NE
XU
RE
"II"
AS
RE
FE
RR
ED
TO
IN N
OT
E 1
2.8
OF
TH
E C
ON
SO
LID
AT
ED
FIN
AN
CIA
L S
TA
TE
ME
NT
S
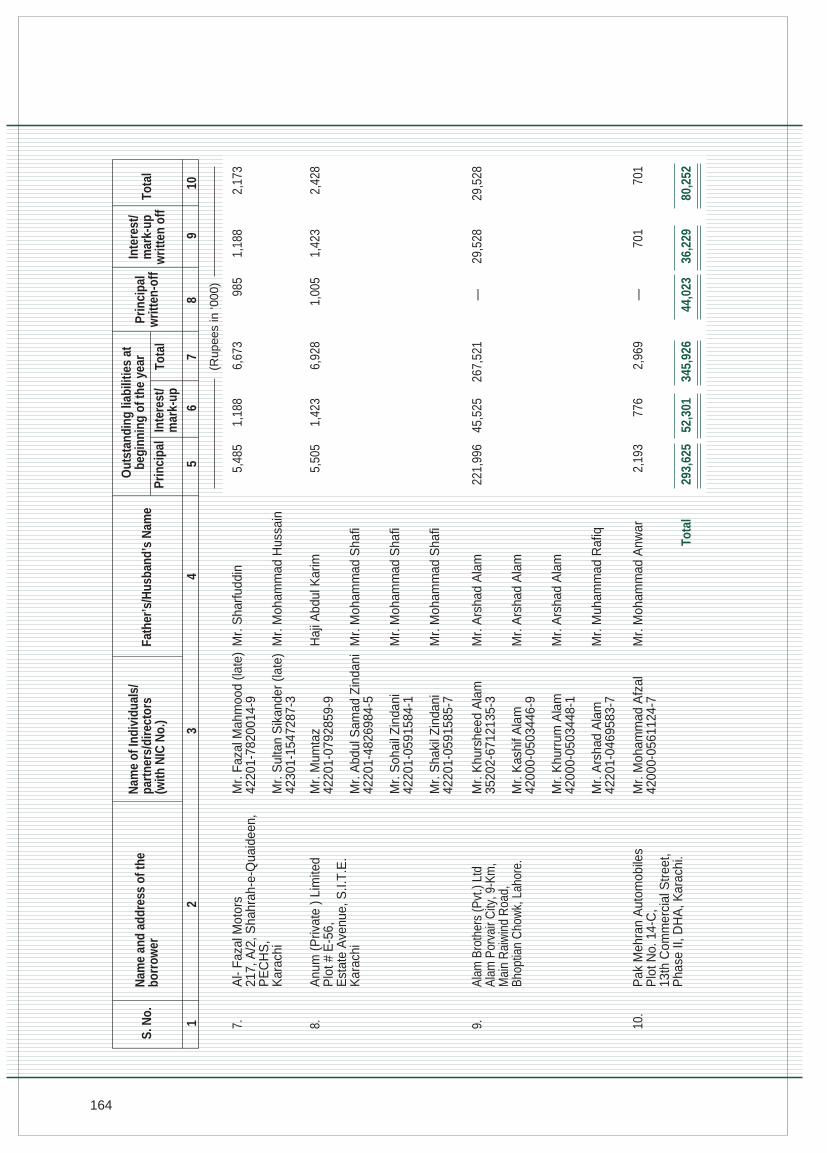
164
Nam
e an
d ad
dres
s of
the
borr
ower
Nam
e of
Indi
vidu
als/
part
ners
/dir
ecto
rs(w
ith N
IC N
o.)
Fath
er’s
/Hus
band
’s N
ame
Pri
ncip
alIn
tere
st/
mar
k-up
Tota
l
Pri
ncip
alw
ritt
en-o
ff
Inte
rest
/m
ark-
upw
ritt
en o
ffTo
tal
Out
stan
ding
liab
ilitie
s at
begi
nnin
g of
the
year
S. N
o.
Al-
Faz
al M
otor
s21
7, A
/2, S
hahr
ah-e
-Qua
idee
n,P
EC
HS
,K
arac
hi
Mr.
Faz
al M
ahm
ood
(late
)42
201-
7820
014-
9
Mr.
Sul
tan
Sik
ande
r (la
te)
4230
1-15
4728
7-3
Mr.
Sha
rfud
din
Mr.
Moh
amm
ad H
ussa
in
5,48
51,
188
6,67
398
51,
188
2,17
37.
(Rup
ees
in ‘0
00)
12
34
56
78
910
Anu
m (
Priv
ate
) Li
mite
dP
lot #
E-5
6,E
stat
e A
venu
e, S
.I.T
.E.
Kar
achi
Mr.
Mum
taz
4220
1-07
9285
9-9
Mr.
Abd
ul S
amad
Zin
dani
4220
1-48
2698
4-5
Mr.
Soh
ail Z
inda
ni42
201-
0591
584-
1
Mr.
Sha
kil Z
inda
ni42
201-
0591
585-
7
Haj
i Abd
ul K
arim
Mr.
Moh
amm
ad S
hafi
Mr.
Moh
amm
ad S
hafi
Mr.
Moh
amm
ad S
hafi
5,50
51,
423
6,92
81,
005
1,42
32,
428
8.
Ala
m B
roth
ers
(Pvt
.) Lt
dA
lam
Por
vair
City
, 9-K
m,
Mai
n R
aiw
ind
Roa
d,B
hopt
ian
Cho
wk,
Lah
ore.
Mr.
Khu
rshe
ed A
lam
3520
2-67
1213
5-3
Mr.
Kas
hif A
lam
4200
0-05
0344
6-9
Mr.
Khu
rrum
Ala
m42
000-
0503
448-
1
Mr.
Ars
had
Ala
m42
201-
0469
583-
7
Mr.
Ars
had
Ala
m
Mr.
Ars
had
Ala
m
Mr.
Ars
had
Ala
m
Mr.
Muh
amm
ad R
afiq
221,
996
45,5
2526
7,52
1—
29,5
2829
,528
9.
Pak
Meh
ran
Aut
omob
iles
Plo
t No.
14-
C,
13th
Com
mer
cial
Str
eet,
Pha
se II
, DH
A, K
arac
hi.
Mr.
Moh
amm
ad A
fzal
4200
0-05
6112
4-7
Mr.
Moh
amm
ad A
nwar
2,19
377
62,
969
—70
170
110
.
293,
625
52,3
0134
5,92
644
,023
36,2
2980
,252
Tota
l
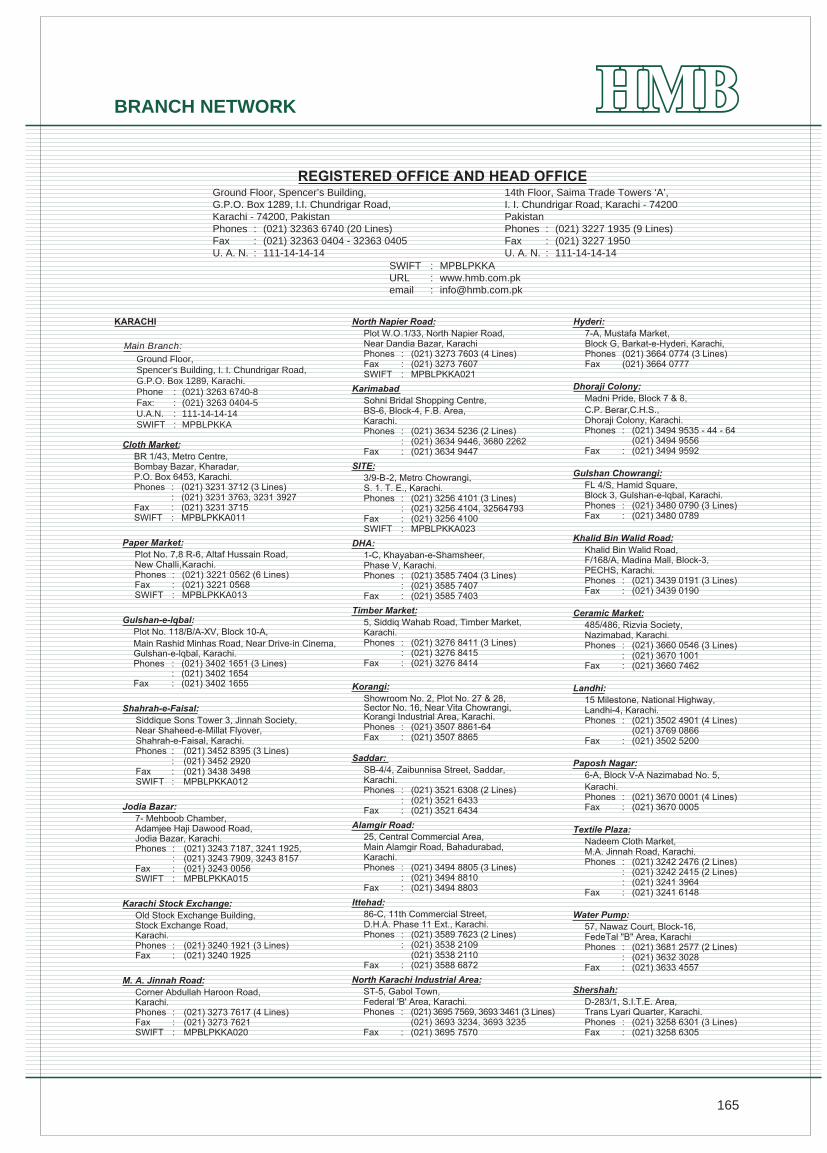
165
Ground Floor, Spencer’s Building,G.P.O. Box 1289, I.I. Chundrigar Road,Karachi - 74200, PakistanPhones : (021) 32363 6740 (20 Lines)Fax : (021) 32363 0404 - 32363 0405U. A. N. : 111-14-14-14
14th Floor, Saima Trade Towers ‘A’,I. I. Chundrigar Road, Karachi - 74200PakistanPhones : (021) 3227 1935 (9 Lines)Fax : (021) 3227 1950U. A. N. : 111-14-14-14
SWIFT : MPBLPKKAURL : www.hmb.com.pkemail : [email protected]
Ground Floor,Spencer’s Building, I. I. Chundrigar Road,G.P.O. Box 1289, Karachi.Phone : (021) 3263 6740-8Fax: : (021) 3263 0404-5U.A.N. : 111-14-14-14SWIFT : MPBLPKKA
Main Branch:
BRANCH NETWORK
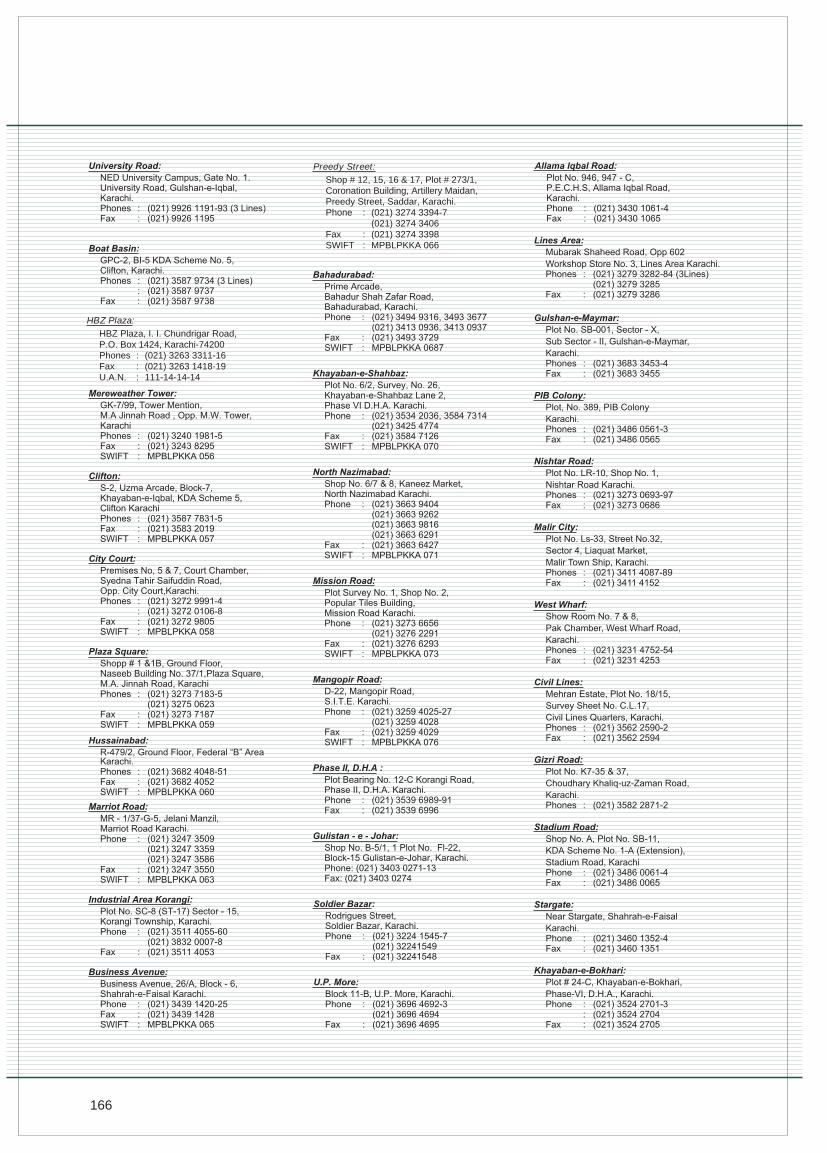
166
Shop # 12, 15, 16 & 17, Plot # 273/1,Coronation Building, Artillery Maidan,Preedy Street, Saddar, Karachi.Phone : (021) 3274 3394-7
(021) 3274 3406Fax : (021) 3274 3398SWIFT : MPBLPKKA 066
Preedy Street:
HBZ Plaza, I. I. Chundrigar Road,P.O. Box 1424, Karachi-74200Phones : (021) 3263 3311-16Fax : (021) 3263 1418-19U.A.N. : 111-14-14-14
HBZ Plaza:
167
3530 2174
Chandni Chowk:
Showroom No. 2, Plot No. Sc-12Chandni Chowk (Old Sabzi Mandi)University Road, KDA Scheme No. 7Karachi.Phone : (021) 3412 0721-3Fax : (021) 3412 0725
Khayaban-e-Sehar:
Plot # C-5-C, Khayaban-e-Sehar,DHA Phase VII, Karachi.Phone : (021) 3524 1804,
(021) 3524 1810,(021) 3524 1813
Fax : (021) 3524 1821
Sub-branch Sunset Boulevard:
2-D, Gizri Boulevard, Phase IV,DHA, Karachi.Phone : (021) 3587 5051,
(021) 3587 5056-80Fax : (021) 3587 5060
Plot # C-2-C, Khayaban-e-TanzeemPhase V, DHA, Karachi.Phone : (021) 3529 4963-4Fax: : (021) 3529 4963
Khayaban-e-Tanzeem:
G/3, Plot # SB-7/32, Bohri BazarSaddar, Karachi.Phone : (021) 3562 2184-6Fax: : (021) 3562 2188
Bohri Bazar:
Allahdina Street, Mithadar,Bartan Gali, Karachi.Phone : (021) 3250 0221-223
Mithadar:
Plot # G-21/29, Block 8,KDA Scheme # 5, Clifton, Karachi.Phone : (021) 3254 4091
Sub-branch Ch. Khaleeq uz Zaman Road:
Ground Floor, Apollo Centre,Unit No. 3, Dalmia Road, Karachi.Phone : (021) 3810 7915-19
Dalmia Road:
Shop # 10 & 11, Plot # 14-D,Sky Garden Apartments,M.A.C.H.S. Karachi.Phone : (021) 3430 1691-95
Sub branch Tipu Sultan Road:
Plot # 3, Block D, Unit # 7,Latifabad, Hyderabad.Phone : (021) 3430 1691-95
Latifabad:
F-66, Risala Road, P.O. Box No. 182,Hyderabad.Phone : (021) 278 3893, 784087U.A.N. : (022) 111-18-18-18Fax : (022) 278 3894
Risala Road:
103-K, Block-2, P.E.C.H.S.,Shahrah-e-Quaideen, Karachi.Phone : (021) 3439 2701-2
(021) 3439 2704-5Fax : (021) 3452 3079
Shahrah-e-Quaideen:
168
B VIII - 59/1/4Rh, Circular Road,Sohawa, Daska, SialkotPhone : (052) 661 3034
(052) 661 3036-7Fax : (052) 661 3039
Sohawa:
Plot # 412, Industrial Area,Sector I-9, IslamabadPhone : (051) 485 9121-23Fax : (051) 485 9125
I-9:
Shahdara:
Plot # N-127 R/1380/A, Village Kot Begum,Opp. Rustam Sohrab Cycle Factory,Shahdara, Lahore.Phone : (042) 3791 9174-7Fax : (042) 3791 9172
45 Shahalam Market, LahorePhone : (042) 3737 7192
(042) 3737 7194-6Fax : (042) 3737 7193
Shahalam Market:
Main Bedian Road, Village Lidhar,Lahore Cantt, Lahore.Phone : (042) 3574 0814-15Fax : (042) 3574 0816
Sub branch Bedian Road:
Shop # F-2183-A/1, Chora Khooh,Usman Farooq Bazar, Azam ClothMarket, LahorePhone : (042) 3763 2982-6
(042) 3763 2988Fax : (042) 3763 2989
Sub branch Azam Cloth Market:
New Commercial Plaza, MainBoulevard, Wapda Town, LahorePhone : (042) 3595 5263-64Fax : (042) 3595 5262
Sub branch Wapda Town:
Plot # 39, Arra Jattan, Dadyal Road,Azad Kashmir.Phone : (05827) 465 803-4Fax : (05827) 465 805
DADYAL:
Railway Road, Kasur.Phone : (049) 276 4606Fax : (049) 925 0090
Phones : (052) 458 8002, 458 0037: (052) 460 4905, 460 2451: (052) 459 3571-2
UAN : (052) 111-18-18-18Fax : (052) 458 8024SWIFT : MPBLPKKA006
169
B-6-188, Plot # 128, Block B,Model Town, Ghalla Mandi Road,Bahawalpur.Phone : (062) 288 9901-2Fax : (062) 288 9905
Bahawalpur:
Ghulam-e-Mustafa Center,Revenue Estate, Chack # 1-A/4-L,M. A. Jinnah Road, Tehsil & DistrictOkara.Phone : (044) 252 6103-4Fax : (044) 252 6105
OKARA:
68/B, Baldia Road, Hasilpur.Phone : (062) 244 1033-4Fax : (062) 244 1050
HASILPUR:

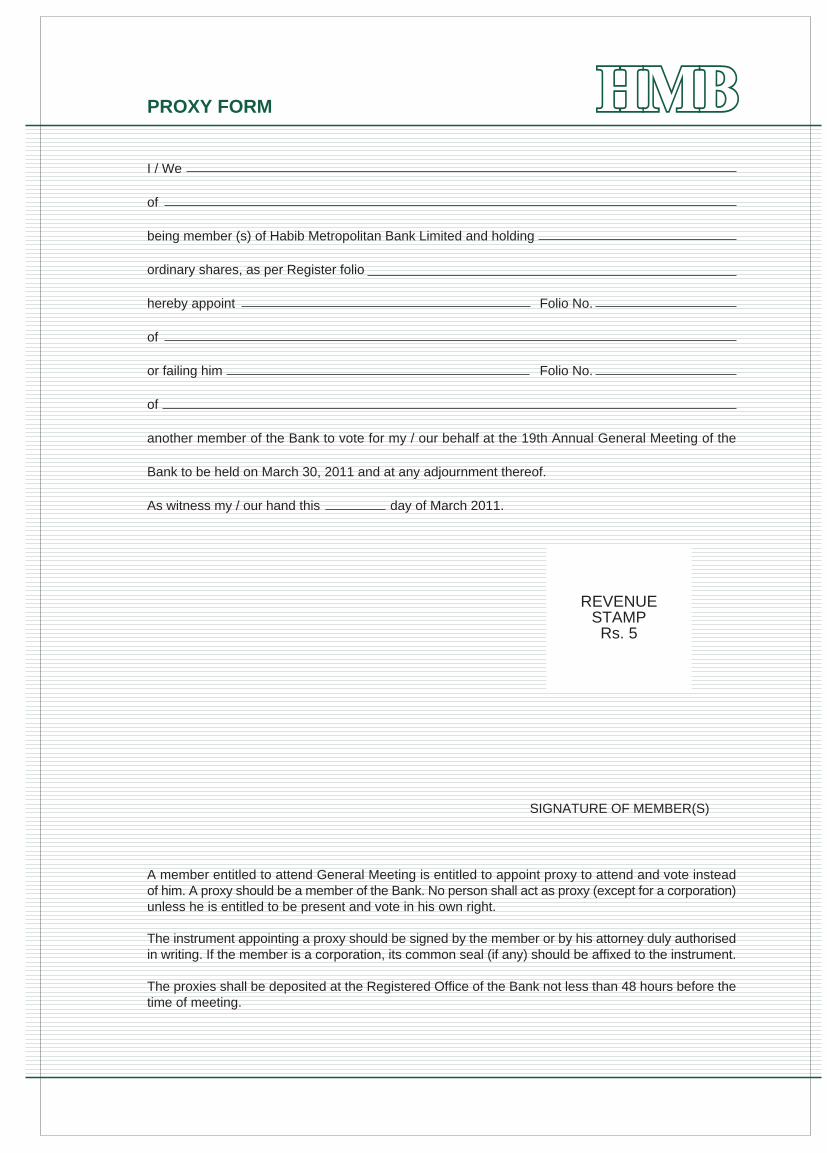
PROXY FORM
I / We
of
being member (s) of Habib Metropolitan Bank Limited and holding
ordinary shares, as per Register folio
hereby appoint Folio No.
of
or failing him Folio No.
of
another member of the Bank to vote for my / our behalf at the 19th Annual General Meeting of the
Bank to be held on March 30, 2011 and at any adjournment thereof.
As witness my / our hand this day of March 2011.
REVENUESTAMPRs. 5
SIGNATURE OF MEMBER(S)
A member entitled to attend General Meeting is entitled to appoint proxy to attend and vote insteadof him. A proxy should be a member of the Bank. No person shall act as proxy (except for a corporation)unless he is entitled to be present and vote in his own right.
The instrument appointing a proxy should be signed by the member or by his attorney duly authorisedin writing. If the member is a corporation, its common seal (if any) should be affixed to the instrument.
The proxies shall be deposited at the Registered Office of the Bank not less than 48 hours before thetime of meeting.