Embed Size (px)
Citation preview

Consolidated Summary Report <under Japanese GAAP>for the six months ended September 30, 2016
November 14, 2016
Company name: Mitsubishi UFJ Financial Group, Inc. Stock exchange listings: Tokyo, Nagoya, New YorkCode number: 8306 URL http://www.mufg.jp/Representative: Nobuyuki Hirano, President & Group CEOFor inquiry: Kazutaka Yoneda, General Manager - Financial Planning Division / Financial Accounting Office
TEL (03) 3240-3110Quarterly securities report issuing date: November 29, 2016 Dividend payment date: December 5, 2016Trading accounts: EstablishedSupplemental information for quarterly financial statements: AvailableQuarterly investor meeting presentation: Scheduled (for investors and analysts)
(Amounts of less than one million yen are rounded down.)1. Consolidated Financial Data for the Six Months ended September 30, 2016(1) Results of Operations (% represents the change from the same period in the previous fiscal year)
Six months ended million yen % million yen % million yen %September 30, 2016September 30, 2015
(*) Comprehensive incomeSeptember 30, 2016: million yen, - %; September 30, 2015: million yen, %
Six months ended yen yenSeptember 30, 2016September 30, 2015
(2) Financial Conditions
As of million yen million yen %September 30, 2016March 31, 2016
(Reference) Shareholders’ equity as of September 30, 2016: million yen; March 31, 2016: million yen(*) “Equity-to-asset ratio” is computed under the formula shown below
(Total net assets - Subscription rights to shares - Non-controlling interests) / Total assets
2. Dividends on Common Stock
Fiscal year yen yen yen yen yenended March 31, 2016ending March 31, 2017ending March 31, 2017 (Forecast)
(*) Revision of forecasts for dividends on the presentation date of this Consolidated Summary Report : None
3. Earnings Target for the Fiscal Year ending March 31, 2017 (Consolidated)MUFG has the target of 850.0 billion yen of profits attributable to owners of parent for the fiscal year ending March 31, 2017. (There is no change to our earnings target released on May 16, 2016.)MUFG is engaged in financial service businesses such as banking business, trust banking business, securities business and credit card/loan businesses. Because there are various uncertainties caused by economic situation, market environments and other factors in these businesses, MUFG discloses a target of its profits attributable to owners of parent instead of a forecast of its performance.
8.3 969,908
9.00 -
Profits Attributable toOwners of ParentOrdinary ProfitsOrdinary Income
18.00
3.6 2,991,884 2.1 599,321
-9.00 -
17,386,769 5.1
2,779,372 (7.1) 794,873 (18.0)
298,302,898
52,662
Equity-to-asset ratio (*)
490,530
14,951,695
1st quarter-end TotalDividends per Share
Diluted earningsper share
Fiscal year-end2nd quarter-end 3rd quarter-end
35.82
16,501,568
(95.5)
35.93
Basic earningsper share
(231,540)
Total Assets Total Net Assets
42.97 42.76
18.00
-
5.2
9.00 9.00
(18.2)
293,677,194
15,457,970

※ Notes
(1) Changes in significant subsidiaries during the period: No
(2) Changes in accounting policies, changes in accounting estimates and restatements(A) Changes in accounting policies due to revision of accounting standards: No(B) Changes in accounting policies due to reasons other than (A): No(C) Changes in accounting estimates: No(D) Restatements: No
(3) Number of common stocks outstanding at the end of the period(A) Total stocks outstanding including treasury stocks: September 30, 2016 shares
March 31, 2016 shares(B) Treasury stocks: September 30, 2016 shares
March 31, 2016 shares(C) Average outstanding stocks: Six months ended September 30, 2016 shares
Six months ended September 30, 2015 shares
(Reference) Summary of non-consolidated financial dataNon-consolidated Financial Data for the Six Months ended September 30, 2016(1) Results of Operations (% represents the change from the same period in the previous fiscal year)
Six months ended million yen % million yen % million yen % million yen %September 30, 2016September 30, 2015
Six months ended yenSeptember 30, 2016September 30, 2015
(2) Financial Conditions
As of million yen million yen %September 30, 2016March 31, 2016
(Reference) Shareholders’ equity as of September 30, 2016: million yen; March 31, 2016: million yen
*Disclosure regarding the execution of the interim audit process
This “Consolidated Summary Report” (Quarterly “Tanshin”) is outside the scope of the external auditor’s interim audit procedurewhich is required by “Financial Instruments and Exchange Act”. Therefore, the interim audit process has not been completed as ofthis disclosure in the “Consolidated Summary Report”.
*Notes for using forecasted information etc.
1. This financial summary report contains forward-looking statements regarding estimations, forecasts, targets and plans in relation to the results of operations, financial conditions and other overall management of the company and/or the group as a whole (the “forward-looking statements”). The forward-looking statements are made based upon, among other things, the company’s current estimations, perceptions and evaluations. In addition, in order for the company to adopt such estimations, forecasts, targets and plans regarding future events, certain assumptions have been made. Accordingly, due to various risks and uncertainties, the statements and assumptions are inherently not guarantees of future performance, may be considered differently from alternative perspectives and may result in material differences from the actual result. For the main factors that may affect the current forecasts, please see Consolidated SummaryReport, Annual Securities Report, Disclosure Book, Annual Report, and other current disclosures that the company has announced.
2. The financial information included in this financial summary report is prepared and presented in accordance with accounting principles generally accepted in Japan (“Japanese GAAP”). Differences exist between Japanese GAAP and the accounting principles generally accepted in the United States (“U.S. GAAP”) in certain material respects. Such differences have resulted in the past, and are expected to continue to result for this period and future periods, in amounts for certain financial statement line items under U.S. GAAP to differ significantly from the amounts under Japanese GAAP. For example, differences in consolidation basis or accounting for business combinations, including but not limited to amortization and impairment of goodwill, could result in significant differences in our reported financial results between Japanese GAAP and U.S. GAAP. Readers should consult their own professional advisors for an understanding of the differences between Japanese GAAP and U.S. GAAP and how those differences might affect our reported financial results. We will publish U.S. GAAP financial results in a separate disclosure document when such information becomes available.
14,168,853,820 14,168,853,820
585,267,346
11.4
8,482,329 70.4
12.4
12,960,910 8,626,342 66.5
8,619,937 8,474,069
Operating Income Operating Profits Ordinary Profits
12.4 29.0
12,043,230
Net Income
11.7 30.3
380,255,157 13,652,178,742 13,948,270,022
30.4 336,087 300,795
Total Assets Total Net Assets Equity-to-asset ratio
Basic earningsper share
24.61 21.56
319,952 346,184 307,959
334,977 300,567 29.9
359,492

Mitsubishi UFJ Financial Group, Inc.
(Appendix) Contents of Appendix 1. Qualitative Information Pertaining to Consolidated Earnings and others for the Six Months ended September 30,
2016 ···································································································································· 2
(1) Qualitative Information Pertaining to Consolidated Earnings Target ······················································· 2
2. Consolidated Financial Statements ································································································· 3
(1) Consolidated Balance Sheets ····································································································· 3
(2) Consolidated Statements of Income and Consolidated Statements of Comprehensive Income ························· 5
(3) Consolidated Statements of Changes in Net Assets ··········································································· 7
(4) Notes on Going-Concern Assumption ··························································································· 9
3. Non-consolidated Financial Statements ·························································································· 10
(1) Non-consolidated Balance Sheets ······························································································· 10
(2) Non-consolidated Statements of Income ······················································································· 12
(3) Non-consolidated Statements of Changes in Net Assets ····································································· 13
(4) Notes on Going-Concern Assumption ·························································································· 15
Supplemental Information:
“Selected Financial Information under Japanese GAAP for the Six Months Ended September 30, 2016”
(*) The following is the schedule of internet conference and explanation for investors and analysts. You can confirm
those contents over the internet. Materials distributed for those will be uploaded in our homepage soon after the
internet conference or the explanation is held.
Internet Conference: November 14, 2016 (Monday)
Explanation for investors and analysts: November 18, 2016 (Friday)
1

Mitsubishi UFJ Financial Group, Inc.
1. Qualitative Information Pertaining to Consolidated Earnings and others for the Six Months ended September 30, 2016
(1) Qualitative Information Pertaining to Consolidated Earnings Target
MUFG has the target of 850.0 billion yen of profits attributable to owners of parent for the fiscal year ending March 31, 2017. (There is no change to our earnings target released on May 16, 2016.) As for other figures released on May 16, 2016, MUFG has revised some of them taking into account the performance of interim results as shown in the following table. (MUFG is engaged in financial service businesses such as banking business, trust banking business, securities business and credit card/loan businesses. Because there are various uncertainties caused by economic situation, market environments and other factors in these businesses, MUFG discloses a target of its consolidated net income instead of a forecast of its performance.)
[Reference] MUFG Consolidated
(in billions of Japanese yen)
For the fiscal year ending
March 31, 2017
For the six months ended
September 30,2016 (Results)
For the fiscal year ended
March 31, 2016 (Results)
For the six months ended
September 30, 2015 (Results)
Total credit costs (150.0) (57.6) (255.1) (31.0)
Ordinary profits (losses) 1,320.0 794.8 1,539.4 969.9
Profits attributable to owners of parent 850.0 490.5 951.4 599.3 〈2 Banks on a stand-alone basis〉
The Bank of Tokyo-Mitsubishi UFJ, Ltd.
Net operating profits before provision for general allowance for credit losses 700.0 417.0 888.1 480.4
Total credit costs (30.0) (4.7) (103.4) 21.2
Ordinary profits (losses) 670.0 410.2 863.7 538.3
Net income (loss) 490.0 323.0 586.0 379.6 Mitsubishi UFJ Trust and Banking Corporation
Net operating profits before credit costs for trust accounts and provision for general allowance for credit losses
170.0 92.7 193.0 95.6
Total credit costs (5.0) 1.7 (0.2) 1.3
Ordinary profits (losses) 180.0 105.5 206.5 99.5
Net income (loss) 130.0 75.7 159.9 70.3
2

Mitsubishi UFJ Financial Group, Inc.
3
2. Consolidated Financial Statements
(1) Consolidated Balance SheetsAs of As of
(in millions of yen) March 31, 2016 September 30, 2016Assets:
Cash and due from banks 49,158,293 57,245,014 Call loans and bills bought 660,015 447,074 Receivables under resale agreements 7,466,633 4,519,699 Receivables under securities borrowing transactions 6,041,983 6,783,779 Monetary claims bought 4,733,393 4,658,963 Trading assets 20,460,863 24,902,251 Money held in trust 679,678 720,178 Securities 69,993,869 64,908,413 Loans and bills discounted 113,756,325 104,844,873 Foreign exchanges 1,792,888 1,999,870 Other assets 12,255,764 12,193,211 Tangible fixed assets 1,362,044 1,323,634 Intangible fixed assets 1,254,727 1,170,308 Net defined benefit assets 377,955 424,729 Deferred tax assets 125,739 113,584 Customers’ liabilities for acceptances and guarantees 9,240,310 8,346,896 Allowance for credit losses (1,057,585) (925,288)Total assets 298,302,898 293,677,194
Liabilities:Deposits 160,965,056 161,625,048 Negotiable certificates of deposit 11,591,578 8,864,056 Call money and bills sold 1,360,238 1,890,781 Payables under repurchase agreements 23,515,240 21,677,674 Payables under securities lending transactions 4,710,407 6,448,251 Commercial papers 2,292,282 1,529,381 Trading liabilities 17,251,302 21,116,570 Borrowed money 12,482,277 13,856,984 Foreign exchanges 2,054,937 1,708,965 Short-term bonds payable 752,492 983,999 Bonds payable 9,190,542 8,969,625 Due to trust accounts 13,296,033 8,101,288 Other liabilities 10,834,564 10,658,207 Reserve for bonuses 90,219 69,872 Reserve for bonuses to directors 396 256 Reserve for stocks payment - 1,153 Net defined benefit liabilities 62,791 60,250 Reserve for retirement benefits to directors 1,113 968 Reserve for loyalty award credits 15,971 17,054 Reserve for contingent losses 210,087 206,180 Reserves under special laws 4,232 4,037 Deferred tax liabilities 866,815 912,909 Deferred tax liabilities for land revaluation 127,237 125,212 Acceptances and guarantees 9,240,310 8,346,896 Total liabilities 280,916,129 277,175,626

Mitsubishi UFJ Financial Group, Inc.
4
As of As of(in millions of yen) March 31, 2016 September 30, 2016
Net assets:Capital stock 2,141,513 2,141,513 Capital surplus 1,425,637 1,424,633 Retained earnings 8,587,578 8,965,050 Treasury stock (298,922) (405,538)Total shareholders’ equity 11,855,806 12,125,658 Net unrealized gains (losses) on available-for-sale securities 2,486,627 2,437,773 Net deferred gains (losses) on hedging instruments 337,297 364,989 Land revaluation excess 176,364 173,754 Foreign currency translation adjustments 791,401 9,119
(189,526) (160,369)- 768
Total accumulated other comprehensive income 3,602,163 2,826,036 Subscription rights to shares 8,260 6,421 Non-controlling interests 1,920,538 1,543,451 Total net assets 17,386,769 16,501,568
Total liabilities and net assets 298,302,898 293,677,194
Remeasurements of defined benefit plansDebt value adjustments of foreign subsidiaries and affiliates

Mitsubishi UFJ Financial Group, Inc.
5
(2) Consolidated Statements of Income and Consolidated Statements of Comprehensive IncomeConsolidated Statements of Income
For the six months For the six monthsended ended
(in millions of yen) September 30, 2015 September 30, 2016Ordinary income 2,991,884 2,779,372
Interest income 1,394,968 1,352,690 Interest on loans and bills discounted 918,153 866,315 Interest and dividends on securities 311,129 323,017
Trust fees 58,581 63,201 Fees and commissions 756,548 718,809 Trading income 189,350 152,009 Other operating income 279,233 224,510 Other ordinary income 313,201 268,151
Ordinary expenses 2,021,975 1,984,499 Interest expenses 318,627 377,622
Interest on deposits 151,490 129,594 Fees and commissions 114,994 99,321 Trading expenses - 1,017 Other operating expenses 135,905 63,867 General and administrative expenses 1,297,774 1,277,017 Other ordinary expenses 154,674 165,653
Ordinary profits 969,908 794,873 Extraordinary gains 1,237 8,410
Gains on disposition of fixed assets 1,237 8,215
- 194 Extraordinary losses 44,386 64,842
Losses on disposition of fixed assets 6,240 5,087 Losses on impairment of fixed assets 1,804 4,069
328 - 36,013 45,654
- 5,266 - 4,538 - 226
Profits before income taxes 926,759 738,440 Income taxes-current 187,742 145,032 Income taxes-deferred 71,204 33,440 Total taxes 258,946 178,473 Profits 667,812 559,967 Profits attributable to non-controlling interests 68,491 69,436 Profits attributable to owners of parent 599,321 490,530
Losses on liquidation of equity securities of subsidiaries
Losses on sales of equity securities of subsidiaries
Provision for reserve for contingent liabilities from financial instruments transactionsLosses on change in equity
Losses on exchange of shares of affiliates
Reversal of reserve for contingent liabilities from financial instruments transactions

Mitsubishi UFJ Financial Group, Inc.
6
Consolidated Statements of Comprehensive IncomeFor the six months For the six months
ended ended(in millions of yen) September 30, 2015 September 30, 2016
Profits 667,812 559,967 Other comprehensive income
Net unrealized gains (losses) on available-for-sale securities (679,716) (53,741)Net deferred gains (losses) on hedging instruments 43,897 27,734 Land revaluation excess 326 (15)Foreign currency translation adjustments (6,450) (562,909)Remeasurements of defined benefit plans 3,771 29,407
23,020 (231,983)Total other comprehensive income (615,150) (791,507)
Comprehensive income 52,662 (231,540)(Comprehensive income attributable to)
Comprehensive income attributable to owners of parent (10,354) (274,538)Comprehensive income attributable to non-controlling interests 63,017 42,997
Share of other comprehensive income of associates accounted for using equity method

Mitsubishi UFJ Financial Group, Inc.
7
(3) Consolidated Statements of Changes in Net Assets
For the six months ended September 30, 2015
1,994,506 17,119,928 Balance at the end of the period 172,589 980,821 (48,554) 3,390,680 7,782
(565,898) shareholders’ equityTotal changes during the period 238 29,273 4,355 (598,593) (488) 33,184 (167,604)
(907)
Net changes of items other than 238 29,273 4,355 (598,593) (488) 33,184
method Changes in subsidiaries’ equity
88
Change of application of equity 24,394
Reversal of land revaluation excess
(100,056)
Disposal of treasury stock 1,632
599,321 parent Repurchase of treasury stock
Profits attributable to owners of Dividends from retained earnings (126,179)
8,271 1,961,322 17,287,533
Changes during the period
Remeasurements ofdefined benefit plans
Total accumulatedother comprehensive
income
Balance at the beginning of the period 172,350 951,547 (52,909) 3,989,274
2,156,395 129,428
Accumulated other comprehensive income
Subscription rights toshares
Non-controllinginterests Total net assetsLand revaluation
excess
Foreign currencytranslation
adjustments
Balance at the end of the period 2,141,513 1,426,314 8,358,034 (198,903) 11,726,959
46,234 shareholders’ equityTotal changes during the period - (2,089) 497,624 (97,242) 398,293 (678,696) 46,234
(907)
Net changes of items other than (678,696)
method Changes in subsidiaries’ equity (907)
Change of application of equity 24,394 24,394
Reversal of land revaluation excess 88 88
Disposal of treasury stock (1,181) 2,814 1,632
parent Repurchase of treasury stock (100,056) (100,056)
Profits attributable to owners of 599,321 599,321
Dividends from retained earnings (126,179) (126,179)
Changes during the period
Net deferred gains(losses) on hedging
instruments
Balance at the beginning of the period 2,141,513 1,428,403 7,860,410 (101,661) 11,328,666 2,835,091 83,194
(in millions of yen)
Shareholders’ equity Accumulated other comprehensive income
Capital stock Capital surplus Retained earnings Treasury stock Total shareholders’equity
Net unrealized gains(losses) on available-
for-sale securities

Mitsubishi UFJ Financial Group, Inc.
8
For the six months ended September 30, 2016
490,530
(2,609)
(124,116)
(109,752)
Balance at the end of the period 6,421 1,543,451
shareholders’ equityTotal changes during the period (767,662)
16,501,568 2,826,036
Accumulated other comprehensive income
Total accumulatedother
comprehensiveincome
3,602,163
(8,464)
3,593,699
(1,146,588)
(1,838) (377,086) (885,201)
Net changes of items other than (1,838) (377,086)
29,157
(160,369)
9,233
9,233
768
(767,662)
2,593
Changes in subsidiaries’ equity 0
Reversal of land revaluation excess
173,754
(782,281)
9,119
29,157 (2,609)
Repurchase of treasury stock
(782,281)
Profits attributable to owners of parent
Disposal of treasury stock
(124,116)
2,132
17,386,769
Changes during the period
(8,464)176,364
1,920,538 17,386,769
Cumulative effects due to revision of accounting standards for
Restated balance 8,260 (189,526)
-
(8,464)
1,920,538
Balance at the beginning of the period 8,260
Dividends from retained earnings
Non-controllinginterests Total net assets
Foreigncurrency
translationadjustments
Remeasurementsof defined
benefit plans
Debt valueadjustments of
foreignsubsidiaries and
affiliates
Subscription rights toshares
27,692
Balance at the end of the period (405,538) 12,125,658 2,437,773 364,989
Total changes during the period (106,616)
2,141,513 1,424,633
0
261,387 (48,853)- (1,004) 369,007
Net changes of items other than (48,853) 27,692
Changes in subsidiaries’ equity 0
shareholders’ equity
Reversal of land revaluation excess 2,593
(109,752)
2,593
Disposal of treasury stock 3,136 (1,004)
parent Repurchase of treasury stock (109,752)
Profits attributable to owners of 490,530
2,132
1,425,637 8,596,043 Restated balance
Dividends from retained earnings (124,116)
(in millions of yen)
Treasury stock Total shareholders’equity
Net unrealized gains(losses) on available-
for-sale securities
Net deferred gains(losses) on hedging
instruments
337,297
8,464
(298,922)
Balance at the beginning of the period (298,922) 11,855,806
11,864,271
791,401
foreign subsidiaries and affiliates
2,486,627 337,297
Cumulative effects due to revision
Changes during the period
2,141,513
8,587,578
Shareholders’ equity Accumulated other comprehensive income
8,464 of accounting standards for
foreign subsidiaries and affiliates
176,364
791,401
(189,526)
-
Capital stock Capital surplus Retained earnings
2,141,513 1,425,637
8,965,050
Landrevaluation
excess
2,486,627
490,530

Mitsubishi UFJ Financial Group, Inc.
9
(4) Notes on Going-Concern Assumption
Not applicable

Mitsubishi UFJ Financial Group, Inc.
10
3. Non-consolidated Financial Statements
(1) Non-consolidated Balance SheetsAs of As of
(in millions of yen) March 31, 2016 September 30, 2016Assets:
Current assets:Cash and due from banks 160,467 241,580 Accounts receivable 63,428 78,328 Others 6,370 8,215 Total current assets 230,267 328,125
Fixed assets:Tangible fixed assets 433 369 Intangible fixed assets 9,384 9,010 Investments and other assets: 11,803,145 12,623,404
Investments in subsidiaries and affiliates 10,186,842 10,186,842 Long-term loans receivable from subsidiaries and affiliates 1,586,400 2,421,320 Others 30,696 16,453 Allowance for credit losses (793) (1,210)
Total fixed assets 11,812,962 12,632,785 Total assets 12,043,230 12,960,910
Liabilities:Current liabilities:
Short-term borrowings 1,703,000 1,632,538 Lease liabilities 20 18 Income taxes payable 1,415 92 Reserve for bonuses and reserve for bonuses to directors 675 560 Others 15,910 21,402 Total current liabilities 1,721,022 1,654,612
Fixed liabilities:Bonds payable 1,798,024 2,607,248 Long-term borrowings 41,826 72,532 Reserve for stocks payment - 153 Lease liabilities 14 7 Others 11 13 Total fixed liabilities 1,839,877 2,679,955
Total liabilities 3,560,900 4,334,567

Mitsubishi UFJ Financial Group, Inc.
11
(1) Non-consolidated Balance SheetsAs of As of
(in millions of yen) March 31, 2016 September 30, 2016Net assets:
Shareholders’ equity:Capital stock 2,141,513 2,141,513 Capital surplus:
Capital reserve 2,141,524 2,141,524 Other capital surplus 1,468,824 1,467,819 Total capital surplus 3,610,348 3,609,344
Retained earnings:Other retained earnings:
Other reserve 150,000 150,000 Earned surplus brought forward 2,976,603 3,188,574
Total retained earnings 3,126,603 3,338,574 Treasury stock (297,385) (404,030)Total shareholders’ equity 8,581,079 8,685,401
Valuation and translation adjustments:Net deferred gains (losses) on hedging instruments (107,010) (65,464)Total valuation and translation adjustments (107,010) (65,464)
Subscription rights to shares 8,260 6,405 Total net assets 8,482,329 8,626,342
Total liabilities and net assets 12,043,230 12,960,910

Mitsubishi UFJ Financial Group, Inc.
12
(2) Non-consolidated Statements of IncomeFor the six months For the six months
ended ended(in millions of yen) September 30, 2015 September 30, 2016
Operating income 319,952 359,492 Operating expenses 11,993 13,308 Operating profits 307,959 346,184 Non-operating income 7,600 24,890 Non-operating expenses 14,992 36,097 Ordinary profits 300,567 334,977 Extraordinary gains - - Extraordinary losses 0 39 Income before income taxes 300,567 334,938 Income taxes-current (400) (1,313)Income taxes-deferred 172 164 Total taxes (228) (1,149)Net income 300,795 336,087

Mitsubishi UFJ Financial Group, Inc.
13
(3) Non-consolidated Statements of Changes in Net Assets
For the six months ended September 30, 2015
Balance at the end of the period (197,366) 8,561,369 (134,686) 7,782 8,434,464
Total changes during the period (97,218) 76,215 787 (488) 76,513
Net changes of items other than787 (488) 298
shareholders’ equity
Disposal of treasury stock 2,814 1,632 1,632
Repurchase of treasury stock (100,032) (100,032) (100,032)
Net income 300,795 300,795
Dividends from retained earnings (126,179) (126,179)
Changes during the period
Balance at the beginning of the period (100,147) 8,485,153 (135,474) 8,271 8,357,950
Shareholders’ equityValuation and
translationadjustments Subscription rights
to shares Total net assets
Treasury stock Total shareholders’equity
Net deferred gains(losses) on hedging
instruments
Balance at the end of the period 2,141,513 2,141,524 1,468,824 150,000 2,856,873
Total changes during the period - - (1,181) - 174,615
Net changes of items other than shareholders’ equity
Disposal of treasury stock (1,181)
Repurchase of treasury stock
Net income 300,795
Dividends from retained earnings (126,179)
Changes during the period
Earned surplusbrought forward
Balance at the beginning of the period 2,141,513 2,141,524 1,470,006 150,000 2,682,257
(in millions of yen)
Shareholders’ equity
Capital stock
Capital surplus Retained earnings
Capital reserve Other capital surplusOther retained earnings
Other reserve

Mitsubishi UFJ Financial Group, Inc.
14
For the six months ended September 30, 2016
(107,010)
8,685,401 (65,464)
41,545
41,545
3,107
144,012
8,260 8,482,329
(124,116)
336,087
104,322
Balance at the beginning of the period
Changes during the period
Total shareholders’equity
8,581,079
Treasury stock
Shareholders’ equity
(297,385)
(1,855) 39,690
(in millions of yen)
(109,752)
Net changes of items other than shareholders’ equityTotal changes during the period
(404,030)Balance at the end of the period 6,405 8,626,342
(1,855)
2,141,524 1,467,819
Total changes during the period (1,004)
150,000 3,188,574
-
Disposal of treasury stock
-
2,141,513 Balance at the end of the period
-
Net changes of items other than shareholders’ equity
(124,116)
211,970
2,976,603 150,000 2,141,524
Capital stock
2,141,513
336,087
1,468,824
Shareholders’ equity
Capital surplus Retained earnings
Capital reserve Other capital surplusOther retained earnings
(1,004)
Repurchase of treasury stock
Net income
Other reserve Earned surplusbrought forward
Balance at the beginning of the period
Changes during the period
Dividends from retained earnings
Dividends from retained earnings
(109,752)
Net income
Repurchase of treasury stock
Disposal of treasury stock 2,103
(109,752)
Subscription rightsto shares Total net assets
(106,644)
Valuation andtranslation
adjustments
2,103
Net deferred gains(losses) on hedging
instruments
336,087
(124,116)

Mitsubishi UFJ Financial Group, Inc.
15
(4) Notes on Going-Concern Assumption
Not applicable

Mitsubishi UFJ Financial Group, Inc.
under Japanese GAAPSelected Financial Information
For the Six Months Ended September 30, 2016

Mitsubishi UFJ Financial Group, Inc.
[Contents]
1. Financial Results [ MUFG Consolidated ]*1[ BTMU and MUTB Combined ]*2*3*4 ----- 1[ BTMU Consolidated ][ BTMU Non-consolidated ][ MUTB Consolidated ][ MUTB Non-consolidated ]
2. Average Interest Rate Spread [ BTMU Non-consolidated ][ MUTB Non-consolidated ] ----- 7[ BTMU and MUTB Combined ]
3. Notional Principal by the Remaining Life of the Interest Rate Swaps for Hedge-Accounting ----- 8[ MUFG Consolidated ][ BTMU Consolidated ][ MUTB Consolidated ]
4. Securities [ MUFG Consolidated ] ----- 9[ BTMU Non-consolidated ][ MUTB Non-consolidated ]
5. ROE [ MUFG Consolidated ] ----- 12
6. Risk-Adjusted Capital Ratio ----- 13[ MUFG Consolidated ][ BTMU Consolidated ][ MUTB Consolidated ][ BTMU Non-consolidated ][ MUTB Non-consolidated ]
7. Risk-Monitored Loans [ MUFG Consolidated ] ----- 14[ BTMU Non-consolidated ][ MUTB Non-consolidated ][ MUTB Non-consolidated : Trust Account ]
8. Non Performing Loans Based on the Financial Reconstruction Law (the “FRL”) ----- 18[ BTMU and MUTB Combined including Trust Account ][ BTMU Non-consolidated ][ MUTB Non-consolidated ][ MUTB Non-consolidated : Trust Account ]
9. Progress in Disposition of Problem Assets [ BTMU Non-consolidated ] ----- 23[ MUTB Non-consolidated including Trust Account ]
10. Loans Classified by Type of Industry, Domestic Consumer Loans, Domestic Loans to ----- 25 Small/Medium-Sized Companies and Proprietors
[ BTMU and MUTB Combined including Trust Accounts ][ BTMU Non-consolidated ][ MUTB Non-consolidated ][ MUTB Non-consolidated : Trust Accounts ]
11. Overseas Loans [ BTMU and MUTB Combined ] ----- 29
12. Loans and Deposits [ BTMU and MUTB Combined ] ----- 30[ BTMU Non-consolidated ][ MUTB Non-consolidated ]
13. Domestic Deposits [ BTMU and MUTB Combined ] ----- 31[ BTMU Non-consolidated ][ MUTB Non-consolidated ]
14. Status of Deferred Tax Assets [ BTMU Non-consolidated ][ MUTB Non-consolidated ] ----- 32
(References) 1. Financial Statements [ BTMU Non-consolidated ][ MUTB Non-consolidated ] ----- 34
(*1) “MUFG” means Mitsubishi UFJ Financial Group, Inc.(*2) “BTMU” means The Bank of Tokyo-Mitsubishi UFJ, Ltd.(*3) “MUTB” means Mitsubishi UFJ Trust and Banking Corporation.(*4) “BTMU and MUTB Combined” means simple sum of “BTMU” and “MUTB” without consolidation processes.

Mitsubishi UFJ Financial Group, Inc.
1
1. Financial Results
MUFG Consolidated(in millions of yen)
September 30, 2016(A)
September 30, 2015(B)
Gross profits 1,969,410 2,109,178 (139,768)Gross profits before credit costs for trust accounts 1,969,410 2,109,178 (139,768)Net interest income 975,085 1,076,365 (101,279)Trust fees 63,201 58,581 4,620
Credit costs for trust accounts (1) 0 0 0 Net fees and commissions 619,488 641,554 (22,065)Net trading profits 150,992 189,350 (38,358)Net other operating profits 160,643 143,327 17,315
Net gains (losses) on debt securities 92,678 82,150 10,528 General and administrative expenses 1,244,009 1,288,965 (44,956)
Amortization of goodwill 7,427 8,886 (1,459)
732,828 829,099 (96,270)
725,401 820,212 (94,811)Provision for general allowance for credit losses (2) - - - Net operating profits* 725,401 820,213 (94,811)Net non-recurring gains (losses) 69,471 149,695 (80,223)
Credit costs (3) (108,435) (104,379) (4,055)Losses on loan write-offs (59,831) (65,246) 5,414 Provision for specific allowance for credit losses - - - Other credit costs (48,603) (39,133) (9,470)
Reversal of allowance for credit losses (4) 22,807 44,442 (21,634)Reversal of reserve for contingent losses included in credit costs (5) - - - Gains on loans written-off (6) 27,993 28,926 (932)Net gains (losses) on equity securities 44,034 40,992 3,042
Gains on sales of equity securities 82,635 60,883 21,751 Losses on sales of equity securities (27,193) (11,790) (15,403)Losses on write-down of equity securities (11,407) (8,101) (3,305)
Profits (losses) from investments in affiliates 113,940 144,680 (30,740)Other non-recurring gains (losses) (30,868) (4,966) (25,902)
Ordinary profits 794,873 969,908 (175,035)Net extraordinary gains (losses) (56,432) (43,148) (13,283)
Net losses on change in equity (45,654) (36,013) (9,641)Profits before income taxes 738,440 926,759 (188,319)Income taxes-current 145,032 187,742 (42,709)Income taxes-deferred 33,440 71,204 (37,763)Total taxes 178,473 258,946 (80,473)Profits 559,967 667,812 (107,845)Profits attributable to non-controlling interests 69,436 68,491 945 Profits attributable to owners of parent 490,530 599,321 (108,791)Note:
* Net operating profits = Banking subsidiaries’ net operating profits + Other consolidated entities’ gross profits - Other consolidated entities’ general and administrative expenses - Other consolidated entities’ provision for general allowance for credit losses - Amortization of goodwill - Inter-company transactions
(Reference)Total credit costs (1)+(2)+(3)+(4)+(5)+(6) (57,634) (31,011) (26,623)
Number of consolidated subsidiaries 218 227 (9)Number of affiliated companies accounted for under the equity method 65 62 3
For the six months ended Increase(Decrease)(A) - (B)
Net operating profits before credit costs for trust accounts, provision for general allowance for credit losses and amortization of goodwillNet operating profits before credit costs for trust accounts and provision for general allowance for credit losses

Mitsubishi UFJ Financial Group, Inc.
2
BTMU and MUTB Combined(in millions of yen)
September 30, 2016(A)
September 30, 2015(B)
Gross profits 1,164,706 1,235,424 (70,717)Gross profits before credit costs for trust accounts 1,164,706 1,235,424 (70,717)Domestic gross profits 637,483 751,116 (113,633)
Net interest income 352,383 422,717 (70,333)Trust fees 49,897 45,638 4,259
Credit costs for trust accounts (1) 0 0 0 Net fees and commissions 183,973 195,964 (11,991)Net trading profits 17,579 20,821 (3,241)Net other operating profits 33,648 65,974 (32,325)
Net gains (losses) on debt securities 33,854 60,641 (26,787)Non-domestic gross profits 527,223 484,308 42,915
Net interest income 273,338 284,023 (10,685)Net fees and commissions 94,849 97,785 (2,935)Net trading profits 79,124 51,142 27,981 Net other operating profits 79,910 51,356 28,554
Net gains (losses) on debt securities 52,611 16,015 36,596 General and administrative expenses 654,826 659,308 (4,482)
Personnel expenses 237,980 246,337 (8,357)Non-personnel expenses 380,961 379,057 1,903 Taxes 35,884 33,913 1,970
509,880 576,115 (66,235)Provision for general allowance for credit losses (2) - - - Net operating profits 509,880 576,115 (66,235)Net non-recurring gains (losses) 5,874 61,813 (55,939)
Credit costs (3) (64,663) (59,124) (5,538)Losses on loan write-offs (16,144) (19,453) 3,309 Provision for specific allowance for credit losses - - - Other credit costs (48,518) (39,670) (8,847)
Reversal of allowance for credit losses (4) 52,591 73,808 (21,216)Reversal of reserve for contingent losses included in credit costs (5) 103 - 103 Gains on loans written-off (6) 8,978 7,893 1,084 Net gains (losses) on equity securities 36,938 34,053 2,884
Gains on sales of equity securities 76,533 53,150 23,383 Losses on sales of equity securities (28,226) (11,361) (16,865)Losses on write-down of equity securities (11,368) (7,735) (3,632)
Other non-recurring gains (losses) (28,073) 5,183 (33,257)Ordinary profits 515,754 637,929 (122,174)Net extraordinary gains (losses) (3,830) 12,812 (16,642)
Net gains (losses) on disposition of fixed assets 3,909 (4,089) 7,999 Losses on impairment of fixed assets (1,611) (1,417) (193)Losses on liquidation of equity securities of subsidiaries (7,941) - (7,941)Gain on sales of equity securities of subsidiaries 2,600 18,319 (15,718)
Income before income taxes 511,924 650,741 (138,817)Income taxes-current 123,675 141,947 (18,271)Income taxes-deferred (10,523) 58,780 (69,303)Total taxes 113,152 200,728 (87,575)Net income 398,772 450,013 (51,241)
(Reference)Total credit costs (1)+(2)+(3)+(4)+(5)+(6) (2,990) 22,576 (25,566)
For the six months ended Increase(Decrease)(A) - (B)
Net operating profits before credit costs for trust accounts and provision for general allowance for credit losses

Mitsubishi UFJ Financial Group, Inc.
3
BTMU Consolidated(in millions of yen)
September 30, 2016(A)
September 30, 2015(B)
Gross profits 1,374,053 1,464,630 (90,577)Net interest income 833,575 903,716 (70,141)Trust fees 6,293 6,635 (341)Net fees and commissions 331,626 337,130 (5,503)Net trading profits 78,969 57,741 21,228 Net other operating profits 123,588 159,407 (35,819)
Net gains (losses) on debt securities 77,362 82,475 (5,113)General and administrative expenses 820,861 864,026 (43,165)
Amortization of goodwill 6,890 8,353 (1,463)
560,082 608,958 (48,875)
553,192 600,604 (47,412)Provision for general allowance for credit losses (1) - - - Net operating profits* 553,192 600,604 (47,412)Net non-recurring gains (losses) (18,718) 37,321 (56,040)
Credit costs (2) (79,016) (77,327) (1,688)Losses on loan write-offs (30,387) (38,164) 7,777 Provision for specific allowance for credit losses - - - Other credit costs (48,629) (39,163) (9,465)
Reversal of allowance for credit losses (3) 31,175 50,403 (19,227)Reversal of reserve for contingent losses included in credit costs (4) - - - Gains on loans written-off (5) 17,544 17,859 (315)Net gains (losses) on equity securities 23,686 36,785 (13,098)
Gains on sales of equity securities 62,226 52,509 9,717 Losses on sales of equity securities (27,776) (8,810) (18,966)Losses on write-down of equity securities (10,762) (6,913) (3,849)
Profits (losses) from investments in affiliates 9,997 16,751 (6,753)Other non-recurring gains (losses) (22,106) (7,150) (14,955)
Ordinary profits 534,474 637,926 (103,452)Net extraordinary gains (losses) (5,125) 9,945 (15,070)
Net gains (losses) on disposition of fixed assets 4,947 (4,660) 9,608 Losses on impairment of fixed assets (2,601) (1,101) (1,500)Gains (losses) on sales of equity securities of subsidiaries (226) 15,595 (15,821)Losses on liquidation of equity securities of subsidiaries (3,236) - (3,236)Losses on exchange of shares of affiliates (4,007) - (4,007)
Profits before income taxes 529,349 647,871 (118,522)Income taxes-current 106,324 134,483 (28,158)Income taxes-deferred 17,442 69,386 (51,944)Total taxes 123,767 203,870 (80,102)Profits 405,581 444,001 (38,419)Profits attributable to non-controlling interests 30,736 35,401 (4,664)Profits attributable to owners of parent 374,844 408,599 (33,755)Note:
* Net operating profits = Net operating profits of BTMU + Other consolidated entities’ gross profits - Other consolidated entities’ general and administrative expenses - Other consolidated entities’ provision for general allowance for credit losses - Amortization of goodwill - Inter-company transactions
(Reference)Total credit costs (1)+(2)+(3)+(4)+(5) (30,296) (9,064) (21,231)
Number of consolidated subsidiaries 128 129 (1)Number of affiliated companies accounted for under the equity method 57 58 (1)
For the six months ended Increase(Decrease)(A) - (B)
Net operating profits before provision for general allowance for credit losses and amortization of goodwillNet operating profits before provision for general allowance for credit losses

Mitsubishi UFJ Financial Group, Inc.
4
BTMU Non-consolidated(in millions of yen)
September 30, 2016(A)
September 30, 2015(B)
Gross profits 972,318 1,048,746 (76,427)Domestic gross profits 491,111 599,169 (108,057)
Net interest income 312,320 372,961 (60,641)Net fees and commissions 135,450 147,702 (12,251)Net trading profits 12,992 8,116 4,875 Net other operating profits 30,348 70,389 (40,040)
Net gains (losses) on debt securities 28,414 60,257 (31,842)Non-domestic gross profits 481,207 449,577 31,629
Net interest income 244,394 237,911 6,482 Net fees and commissions 93,323 96,071 (2,747)Net trading profits 76,464 53,803 22,661 Net other operating profits 67,024 61,790 5,233
Net gains (losses) on debt securities 43,539 18,418 25,121 General and administrative expenses 555,226 568,300 (13,073)
Personnel expenses 199,442 211,256 (11,813)Non-personnel expenses 325,411 326,415 (1,004)
Amortization of goodwill 164 148 15 Taxes 30,373 30,628 (255)
417,256 480,595 (63,338)
417,092 480,446 (63,354)Provision for general allowance for credit losses (1) - - - Net operating profits 417,092 480,446 (63,354)Net non-recurring gains (losses) (6,853) 57,933 (64,786)
Credit costs (2) (64,280) (58,860) (5,420)Losses on loan write-offs (15,802) (19,303) 3,501 Provision for specific allowance for credit losses - - - Other credit costs (48,478) (39,556) (8,921)
Reversal of allowance for credit losses (3) 50,973 72,400 (21,426)Reversal of reserve for contingent losses included in credit costs (4) - - - Gains on loans written-off (5) 8,574 7,724 850 Net gains (losses) on equity securities 23,471 32,130 (8,659)
Gains on sales of equity securities 61,342 47,178 14,163 Losses on sales of equity securities (27,401) (8,357) (19,043)Losses on write-down of equity securities (10,469) (6,690) (3,779)
Other non-recurring gains (losses) (25,592) 4,537 (30,130)Ordinary profits 410,239 538,379 (128,140)Net extraordinary gains (losses) 1,725 13,266 (11,540)
Net gains (losses) on disposition of fixed assets 5,034 (4,101) 9,135 Losses on impairment of fixed assets (271) (951) 680 Losses on liquidation of equity securities of subsidiaries (4,850) - (4,850)Gain on sales of equity securities of subsidiaries 2,600 18,319 (15,718)
Income before income taxes 411,964 551,645 (139,680)Income taxes-current 98,189 119,046 (20,856)Income taxes-deferred (9,268) 52,945 (62,213)Total taxes 88,921 171,991 (83,070)Net income 323,043 379,654 (56,610)
(Reference)Total credit costs (1)+(2)+(3)+(4)+(5) (4,731) 21,264 (25,996)
For the six months ended Increase(Decrease)(A) - (B)
Net operating profits before provision for general allowance for credit losses
Net operating profits before provision for general allowance for credit losses and amortization of goodwill

Mitsubishi UFJ Financial Group, Inc.
5
MUTB Consolidated(in millions of yen)
September 30, 2016(A)
September 30, 2015(B)
Gross profits 232,909 236,353 (3,443)Gross profits before credit costs for trust accounts 232,909 236,352 (3,443)Trust fees 57,046 52,029 5,017
Trust fees before credit costs for trust accounts 57,045 52,028 5,017 Money trusts fees (Jointly operated designated money trusts before credit costs for trust account) 14,556 4,668 9,888 Other trust fees 42,489 47,360 (4,871)
Credit costs for trust accounts (1) 0 0 0 Net interest income 50,915 91,167 (40,252)Net fees and commissions 96,899 94,006 2,892 Net trading profits 9,735 12,972 (3,236)Net other operating profits 18,313 (13,822) 32,135
Net gains (losses) on debt securities 14,478 (2,103) 16,582 General and administrative expenses 141,670 129,276 12,393
Amortization of goodwill 535 531 4
91,774 107,607 (15,832)
91,238 107,075 (15,837)Provision for general allowance for credit losses (2) - - - Net operating profits* 91,238 107,076 (15,837)Net non-recurring gains (losses) 14,309 8,260 6,048
Credit costs (3) (403) (275) (127)Losses on loan write-offs (362) (161) (200)Provision for specific allowance for credit losses - - - Other credit costs (40) (114) 73
Reversal of allowance for credit losses (4) 1,647 1,507 140 Reversal of reserve for contingent losses included in credit costs (5) 103 - 103 Gains on loans written-off (6) 458 192 265 Net gains (losses) on equity securities 13,466 1,929 11,537
Gains on sales of equity securities 15,191 5,977 9,213 Losses on sales of equity securities (825) (3,003) 2,177 Losses on write-down of equity securities (899) (1,045) 146
Profits (losses) from investments in affiliates 2,391 5,853 (3,461)Other non-recurring gains (losses) (3,355) (945) (2,409)
Ordinary profits 105,547 115,336 (9,788)Net extraordinary gains (losses) (5,247) (512) (4,735)
Net gains (losses) on disposition of fixed assets (1,134) (4) (1,130)Losses on impairment of fixed assets (1,339) (508) (831)Losses on liquidation of equity securities of subsidiaries (2,773) - (2,773)
Profits before income taxes 100,300 114,824 (14,524)Income taxes-current 31,204 28,446 2,758 Income taxes-deferred (1,965) 1,265 (3,230)Total taxes 29,239 29,712 (472)Profits 71,060 85,111 (14,051)Profits attributable to non-controlling interests 5,620 5,517 103 Profits attributable to owners of parent 65,439 79,594 (14,155)Note:
* Net operating profits = Net operating profits of MUTB + Other consolidated entities’ gross profits - Other consolidated entities’ general and administrative expenses - Other consolidated entities’ provision for general allowance for credit losses - Amortization of goodwill - Inter-company transactions
(Reference)Total credit costs (1)+(2)+(3)+(4)+(5)+(6) 1,806 1,424 382
Number of consolidated subsidiaries 52 56 (4)Number of affiliated companies accounted for under the equity method 13 12 1
For the six months ended Increase(Decrease)(A) - (B)
Net operating profits before credit costs for trust accounts, provision for general allowance for credit losses and amortization of goodwillNet operating profits before credit costs for trust accounts and provision for general allowance for credit losses

Mitsubishi UFJ Financial Group, Inc.
6
MUTB Non-consolidated(in millions of yen)
September 30, 2016(A)
September 30, 2015(B)
Gross profits 192,388 186,677 5,710 Gross profits before credit costs for trust accounts 192,387 186,677 5,710 Domestic gross profits 146,371 151,947 (5,575)
Trust fees 49,897 45,638 4,259 Trust fees before credit costs for trust accounts 49,897 45,638 4,259
Money trusts fees (Jointly operated designated money trusts before credit costs for trust account) 14,556 4,668 9,888 Other trust fees 35,341 40,969 (5,628)
Credit costs for trust accounts (1) 0 0 0 Net interest income 40,062 49,755 (9,692)Net fees and commissions 48,522 48,262 260 Net trading profits 4,587 12,704 (8,117)Net other operating profits 3,300 (4,414) 7,714
Net gains (losses) on debt securities 5,440 384 5,055 Non-domestic gross profits 46,016 34,730 11,285
Net interest income 28,943 46,111 (17,168)Net fees and commissions 1,526 1,713 (187)Net trading profits 2,659 (2,660) 5,320 Net other operating profits 12,886 (10,434) 23,320
Net gains (losses) on debt securities 9,072 (2,402) 11,475 General and administrative expenses 99,599 91,008 8,591
Personnel expenses 38,538 35,081 3,456 Non-personnel expenses 55,550 52,641 2,908 Taxes 5,511 3,284 2,226
92,788 95,669 (2,881)Provision for general allowance for credit losses (2) - - - Net operating profits 92,788 95,669 (2,880)Net non-recurring gains (losses) 12,727 3,880 8,846
Credit costs (3) (383) (264) (118)Losses on loan write-offs (342) (150) (191)Provision for specific allowance for credit losses - - - Other credit costs (40) (114) 73
Reversal of allowance for credit losses (4) 1,617 1,407 209 Reversal of reserve for contingent losses included in credit costs (5) 103 - 103 Gains on loans written-off (6) 403 168 234 Net gains (losses) on equity securities 13,466 1,922 11,544
Gains on sales of equity securities 15,191 5,971 9,220 Losses on sales of equity securities (825) (3,003) 2,177 Losses on write-down of equity securities (899) (1,045) 146
Other non-recurring gains (losses) (2,480) 645 (3,126)Ordinary profits 105,515 99,549 5,965 Net extraordinary gains (losses) (5,556) (454) (5,101)
Net gains (losses) on disposition of fixed assets (1,124) 11 (1,136)Losses on impairment of fixed assets (1,339) (465) (873)Losses on liquidation of equity securities of subsidiaries (3,091) - (3,091)
Income before income taxes 99,959 99,095 863 Income taxes-current 25,485 22,901 2,584 Income taxes-deferred (1,255) 5,835 (7,090)Total taxes 24,230 28,736 (4,505)Net income 75,728 70,359 5,369
(Reference)Total credit costs (1)+(2)+(3)+(4)+(5)+(6) 1,741 1,312 429
For the six months ended Increase(Decrease)(A) - (B)
Net operating profits before credit costs for trust accounts and provision for general allowance for credit losses

Mitsubishi UFJ Financial Group, Inc.
7
2. Average Interest Rate Spread
BTMU Non-consolidated(percentage per annum)
(Domestic business segment)Total average interest rate on interest-earning assets (a) 0.57 (0.08) 0.65
Average interest rate on loans and bills discounted (b) 0.87 (0.07) 0.95 Average interest rate on securities 0.70 (0.10) 0.80
0.62 (0.04) 0.66 Average interest rate on deposits and NCD (d) 0.01 (0.02) 0.03 Average interest rate on other liabilities 0.29 0.10 0.18
Overall interest rate spread (a)-(c) (0.05) (0.04) (0.01)Interest rate spread (b)-(d) 0.86 (0.05) 0.91
(After excluding loans to the Japanese government and governmental organizations)Average interest rate on loans and bills discounted (e) 1.00 (0.12) 1.13 Interest rate spread (e)-(d) 0.99 (0.10) 1.10
MUTB Non-consolidated(percentage per annum)
(Domestic business segment)Total average interest rate on interest-earning assets (a) 0.51 (0.08) 0.60
Average interest rate on loans and bills discounted (b) 0.52 (0.16) 0.68 Average interest rate on securities 0.85 (0.03) 0.88
Total average interest rate on interest-bearing liabilities (c) 0.15 (0.00) 0.16 Average interest rate on deposits and NCD (d) 0.09 (0.03) 0.13
Overall interest rate spread (a)-(c) 0.35 (0.08) 0.43 Interest rate spread (b)-(d) 0.42 (0.12) 0.55
(After excluding loans to the Japanese government and governmental organizations)Average interest rate on loans and bills discounted (e) 0.55 (0.12) 0.68 Interest rate spread (e)-(d) 0.46 (0.09) 0.55
BTMU and MUTB Combined(percentage per annum)
(Domestic business segment)Average interest rate on loans and bills discounted (a) 0.81 (0.09) 0.91 Average interest rate on deposits and NCD (b) 0.02 (0.02) 0.04 Interest rate spread (a)-(b) 0.79 (0.07) 0.86
(After excluding loans to the Japanese government and governmental organizations)Average interest rate on loans and bills discounted (c) 0.92 (0.12) 1.05 Interest rate spread (c)-(b) 0.90 (0.10) 1.01
For the six monthsended
September 30, 2015(B)
Increase(Decrease)(A) - (B)
For the six monthsended
September 30, 2016(A)
Total average interest rate on interest-bearing liabilities (c)<including general and administrative expenses>
For the six monthsended
September 30, 2016(A)
Increase(Decrease)(A) - (B)
For the six monthsended
September 30, 2015(B)
For the six monthsended
September 30, 2016(A)
Increase(Decrease)(A) - (B)
For the six monthsended
September 30, 2015(B)
Mitsubishi UFJ Financial Group, Inc.
8
3. Notional Principal by the Remaining Life of the Interest Rate Swaps for Hedge-Accounting
MUFG Consolidated(in billions of yen)
within 1 year 1 year to 5 years over 5 years TotalReceive-fix/pay-floater 1,427.3 5,966.8 10,380.5 17,774.7 Receive-floater/pay-fix 349.8 2,944.7 3,465.5 6,760.1 Receive-floater/pay-floater - - - - Receive-fix/pay-fix - - - - Total 1,777.2 8,911.5 13,846.1 24,534.9
BTMU Consolidated(in billions of yen)
within 1 year 1 year to 5 years over 5 years TotalReceive-fix/pay-floater 741.3 4,411.2 9,590.0 14,742.6 Receive-floater/pay-fix 151.0 861.0 1,467.1 2,479.2 Receive-floater/pay-floater - - - - Receive-fix/pay-fix - - - - Total 892.4 5,272.2 11,057.2 17,221.9
MUTB Consolidated(in billions of yen)
within 1 year 1 year to 5 years over 5 years TotalReceive-fix/pay-floater 686.0 1,555.6 790.4 3,032.0 Receive-floater/pay-fix 210.2 1,923.7 1,982.4 4,116.3 Receive-floater/pay-floater - - - - Receive-fix/pay-fix - - - - Total 896.2 3,479.3 2,772.9 7,148.4
As of September 30, 2016
As of September 30, 2016
As of September 30, 2016

Mitsubishi UFJ Financial Group, Inc.
9
4. Securities
MUFG Consolidated
The tables include negotiable certificates of deposit in “Cash and due from banks”, beneficiary rights to the trust in“Monetary claims bought” and others in addition to “Securities”.
Fair Value Information on Securities(in millions of yen)
Gains Losses Gains Losses
3,474,740 93,017 98,249 5,232 3,886,239 64,518 79,584 15,066 Domestic bonds 1,101,018 60,481 60,481 - 1,101,107 58,008 58,008 -
Government bonds 1,101,018 60,481 60,481 - 1,101,107 58,008 58,008 - Municipal bonds - - - - - - - - Corporate bonds - - - - - - - -
Other 2,373,722 32,535 37,768 5,232 2,785,132 6,510 21,576 15,066 Foreign bonds 1,063,121 33,117 33,235 118 1,233,171 6,746 12,805 6,058 Other 1,310,600 (581) 4,532 5,114 1,551,961 (236) 8,771 9,007
(in millions of yen)
Gains Losses Gains Losses
Available-for-sale securities 60,761,775 3,409,026 3,613,700 204,673 65,518,480 3,485,297 3,706,495 221,198 Domestic equity securities 4,624,945 2,042,574 2,144,280 101,705 4,873,212 2,205,424 2,295,767 90,342 Domestic bonds 28,055,148 695,136 699,033 3,897 30,322,492 718,247 721,722 3,475
Government bonds 24,414,844 612,091 613,542 1,451 27,255,998 631,901 632,132 231 Municipal bonds 762,993 13,233 13,271 38 449,330 11,539 11,623 84 Corporate bonds 2,877,310 69,812 72,219 2,407 2,617,163 74,806 77,966 3,159
Other 28,081,681 671,315 770,386 99,070 30,322,776 561,624 689,005 127,380 Foreign equity securities 144,552 17,640 38,228 20,587 149,076 23,820 35,445 11,624 Foreign bonds 24,709,611 617,606 631,079 13,472 26,650,433 510,987 544,870 33,883 Other 3,227,517 36,068 101,078 65,009 3,523,265 26,816 108,689 81,872
As of September 30, 2016 As of March 31, 2016
Amount onconsolidatedbalance sheet
DifferencesAmount onconsolidatedbalance sheet
Differences
Debt securities being held to maturity
As of September 30, 2016 As of March 31, 2016
Amount onconsolidatedbalance sheet
DifferencesAmount onconsolidatedbalance sheet
Differences

Mitsubishi UFJ Financial Group, Inc.
10
BTMU Non-consolidated
The tables include negotiable certificates of deposit in “Cash and due from banks”, beneficiary rights to the trust in“Monetary claims bought” and others in addition to “Securities”.
Fair Value Information on Securities(in millions of yen)
Gains Losses Gains Losses
2,411,619 59,899 65,013 5,114 2,653,043 57,771 66,779 9,007
932,607 (135,866) 28,263 164,129 843,460 (91,424) 29,661 121,086
(in millions of yen)
Gains Losses Gains LossesAvailable-for-sale securities 41,817,914 2,455,027 2,639,933 184,905 44,773,389 2,531,495 2,713,435 181,940
Domestic equity securities 3,740,312 1,534,937 1,633,955 99,017 3,943,763 1,661,719 1,751,653 89,934 Domestic bonds 21,728,383 601,094 603,558 2,464 23,353,550 619,996 621,020 1,024 Other 16,349,218 318,996 402,419 83,422 17,476,076 249,779 340,761 90,981
Foreign equity securities 135,940 12,401 33,572 21,171 142,546 18,227 29,916 11,688 Foreign bonds 14,375,420 338,777 344,533 5,755 15,024,229 279,857 285,357 5,500 Other 1,837,857 (32,182) 24,312 56,495 2,309,300 (48,305) 25,487 73,792
Redemption schedule of other securities with maturities and debt securities being held to maturity(in millions of yen)
within1 year
1 year to5 years
5 years to10 years
over10 years
within1 year
1 year to5 years
5 years to10 years
over10 years
Domestic bonds 9,415,824 4,245,313 5,484,547 3,683,717 9,503,563 5,596,113 5,325,107 4,029,848 Government bonds 9,248,462 3,610,046 4,291,591 2,639,992 9,377,044 4,996,212 4,581,169 3,029,462 Municipal bonds 25,009 118,287 579,470 319 10,160 106,842 292,183 329 Corporate bonds 142,352 516,980 613,484 1,043,404 116,358 493,058 451,754 1,000,056
Other 2,285,339 4,160,654 6,053,294 3,590,949 2,072,496 5,953,081 6,055,164 2,948,188 Foreign bonds 2,077,150 3,946,016 5,068,239 3,268,153 1,851,875 5,671,608 4,823,497 2,659,161 Other 208,189 214,638 985,055 322,796 220,621 281,472 1,231,667 289,026
Total 11,701,164 8,405,968 11,537,842 7,274,666 11,576,060 11,549,194 11,380,271 6,978,036
As of September 30, 2016 As of March 31, 2016Amount on
balance sheet Differences Amount onbalance sheet Differences
As of September 30, 2016 As of March 31, 2016
Stocks of subsidiaries and affiliates
As of September 30, 2016 As of March 31, 2016Amount on
balance sheet Differences Amount onbalance sheet Differences
Debt securities being held to maturity

Mitsubishi UFJ Financial Group, Inc.
11
MUTB Non-consolidated
The tables include beneficiary rights to the trust in “Monetary claims bought” in addition to “Securities”.
Fair Value Information on Securities(in millions of yen)
Gains Losses Gains Losses
- - - - - - - -
60,671 46,072 46,232 160 57,771 50,968 51,070 102
(in millions of yen)
Gains Losses Gains LossesAvailable-for-sale securities 15,962,024 844,064 868,960 24,895 17,108,424 873,305 899,752 26,447
Domestic equity securities 924,151 432,020 447,787 15,766 974,012 470,438 484,778 14,340 Domestic bonds 6,420,660 93,839 95,402 1,563 7,013,586 98,263 100,843 2,580 Other 8,617,212 318,204 325,770 7,565 9,120,825 304,604 314,131 9,526
Foreign equity securities 54 31 31 - 51 26 26 0 Foreign bonds 7,657,334 248,763 252,310 3,546 8,367,901 228,667 235,989 7,322 Other 959,824 69,409 73,428 4,019 752,872 75,910 78,114 2,204
Redemption schedule of other securities with maturities and debt securities being held to maturity(in millions of yen)
within1 year
1 year to5 years
5 years to10 years
over10 years
within1 year
1 year to5 years
5 years to10 years
over10 years
Domestic bonds 899,500 3,809,768 932,573 778,818 1,406,286 3,784,586 1,548,706 274,006 Government bonds 859,001 3,671,107 549,036 730,566 1,342,229 3,658,650 1,178,195 228,813 Municipal bonds - 70 35,928 3,905 - 88 35,825 3,900 Corporate bonds 40,499 138,590 347,608 44,346 64,057 125,847 334,685 41,292
Other 789,183 2,909,401 2,772,309 1,745,448 809,569 3,407,239 3,072,071 1,445,720 Foreign bonds 742,135 2,586,547 2,584,207 1,744,444 774,774 3,145,573 3,021,564 1,425,989 Other 47,048 322,854 188,101 1,003 34,795 261,666 50,507 19,731
Total 1,688,683 6,719,170 3,704,883 2,524,266 2,215,856 7,191,826 4,620,778 1,719,726
As of September 30, 2016 As of March 31, 2016
Stocks of subsidiaries and affiliates
As of September 30, 2016 As of March 31, 2016Amount on
balance sheet Differences Amount onbalance sheet Differences
Debt securities being held to maturity
As of September 30, 2016 As of March 31, 2016Amount on
balance sheet Differences Amount onbalance sheet Differences

Mitsubishi UFJ Financial Group, Inc.
12
5. ROE
MUFG Consolidated(%)
For the six monthsended
September 30, 2016(A)
Increase(Decrease)(A) - (B)
For the six monthsended
September 30, 2015(B)
ROE 7.91 (1.67) 9.59 Note:
ROE is computed as follows: profits attributable to owners of parent × 2 {(Total shareholders’ equity at the beginning of the period + Foreign currency translation adjustments at the beginning of the period) + (Total shareholders’ equity at the end of the period + Foreign currency translation adjustments at the end of the period)} / 2
×100

Mitsubishi UFJ Financial Group, Inc.
13
6. Risk-Adjusted Capital Ratio
MUFG Consolidated (in billions of yen)As of
September 30, 2016Preliminary (A)
Increase(Decrease)(A) - (B)
As ofMarch 31, 2016
(B)(1) Total capital ratio (4)/(7) 16.56 % 0.55 % 16.01 %(2) Tier 1 capital ratio (5)/(7) 13.50 % 0.26 % 13.24 %(3) Common Equity Tier 1 capital ratio (6)/(7) 12.20 % 0.56 % 11.63 %(4) Total capital 17,424.3 (517.4) 17,941.8 (5) Tier 1 capital 14,205.5 (633.7) 14,839.2 (6) Common Equity Tier 1 capital 12,839.4 (200.4) 13,039.8 (7) Risk weighted assets 105,206.2 (6,858.1) 112,064.3 (8) Required Capital (7)×8% 8,416.4 (548.6) 8,965.1
BTMU Consolidated (in billions of yen)As of
September 30, 2016Preliminary (A)
Increase(Decrease)(A) - (B)
As ofMarch 31, 2016
(B)(1) Total capital ratio (4)/(7) 16.20 % 0.53 % 15.66 %(2) Tier 1 capital ratio (5)/(7) 12.93 % 0.22 % 12.71 %(3) Common Equity Tier 1 capital ratio (6)/(7) 11.64 % 0.55 % 11.08 %(4) Total capital 13,545.6 (467.5) 14,013.2 (5) Tier 1 capital 10,816.6 (558.5) 11,375.2 (6) Common Equity Tier 1 capital 9,733.5 (184.2) 9,917.7 (7) Risk weighted assets 83,596.9 (5,859.6) 89,456.6 (8) Required Capital (7)×8% 6,687.7 (468.7) 7,156.5
MUTB Consolidated (in billions of yen)As of
September 30, 2016Preliminary (A)
Increase(Decrease)(A) - (B)
As ofMarch 31, 2016
(B)(1) Total capital ratio (4)/(7) 20.43 % 0.45 % 19.97 %(2) Tier 1 capital ratio (5)/(7) 17.15 % 0.33 % 16.82 %(3) Common Equity Tier 1 capital ratio (6)/(7) 16.38 % 0.36 % 16.01 %(4) Total capital 2,359.8 (11.2) 2,371.0 (5) Tier 1 capital 1,981.4 (15.1) 1,996.6 (6) Common Equity Tier 1 capital 1,891.9 (8.7) 1,900.6 (7) Risk weighted assets 11,549.4 (318.8) 11,868.3 (8) Required Capital (7)×8% 923.9 (25.5) 949.4
BTMU Non-consolidated (in billions of yen)As of
September 30, 2016Preliminary (A)
Increase(Decrease)(A) - (B)
As ofMarch 31, 2016
(B)(1) Total capital ratio (4)/(7) 18.37 % 0.86 % 17.51 %(2) Tier 1 capital ratio (5)/(7) 14.73 % 0.47 % 14.25 %(3) Common Equity Tier 1 capital ratio (6)/(7) 12.97 % 0.66 % 12.30 %(4) Total capital 12,819.0 (14.2) 12,833.3 (5) Tier 1 capital 10,279.9 (166.7) 10,446.7 (6) Common Equity Tier 1 capital 9,050.2 30.8 9,019.4 (7) Risk weighted assets 69,770.1 (3,507.7) 73,277.9 (8) Required Capital (7)×8% 5,581.6 (280.6) 5,862.2
MUTB Non-consolidated (in billions of yen)As of
September 30, 2016Preliminary (A)
Increase(Decrease)(A) - (B)
As ofMarch 31, 2016
(B)(1) Total capital ratio (4)/(7) 21.81 % 0.73 % 21.08 %(2) Tier 1 capital ratio (5)/(7) 18.07 % 0.61 % 17.45 %(3) Common Equity Tier 1 capital ratio (6)/(7) 17.17 % 0.59 % 16.58 %(4) Total capital 2,372.4 13.7 2,358.7 (5) Tier 1 capital 1,965.6 12.6 1,952.9 (6) Common Equity Tier 1 capital 1,867.7 12.2 1,855.5 (7) Risk weighted assets 10,874.5 (313.5) 11,188.1 (8) Required Capital (7)×8% 869.9 (25.0) 895.0
Note: Risk-adjusted capital ratio of MUFG is computed in accordance with the Notification of the Financial Services Agency No.20, 2006. Risk-adjusted capital ratio of BTMU and MUTB are computed in accordance with the Notification of the Financial Services Agency No.19, 2006.

Mitsubishi UFJ Financial Group, Inc.
14
7. Risk-Monitored Loans
MUFG Consolidated
(1) Risk-Monitored Loans(in millions of yen)
% to total loansand bills discounted
% to total loansand bills discounted
% to total loansand bills discounted
Loans to bankrupt borrowers 50,382 0.04 % 54,913 0.04 % (4,531) (0.00)%Non-accrual delinquent loans 778,755 0.74 % 1,110,576 0.97 % (331,821) (0.23)%
49,669 0.04 % 51,620 0.04 % (1,950) 0.00 %Restructured loans 665,784 0.63 % 438,767 0.38 % 227,017 0.24 %
Total risk monitored loans 1,544,592 1.47 % 1,655,877 1.45 % (111,285) 0.01 %Total loans and bills discounted 104,844,873 113,756,325 (8,911,451)
Written-off 413,491 397,076 16,414
(2) Allowance for Credit Losses(in millions of yen)
% to total riskmonitored loans
% to total riskmonitored loans
% to total riskmonitored loans
Allowance for credit losses 925,288 59.90 % 1,057,585 63.86 % (132,297) (3.96)%General allowance for credit losses 661,320 571,689 89,631 Specific allowance for credit losses 263,608 485,577 (221,969)Allowance for credit to specific foreign borrowers 358 318 39
(3) Classification of Risk-Monitored LoansClassified by Geographic Area (in millions of yen)
As ofSeptember 30,
2016 (A)
As ofMarch 31,2016 (B)
Increase(Decrease)(A) - (B)
Domestic 1,085,917 1,177,149 (91,231)Overseas 458,674 478,728 (20,053)
Asia 124,510 145,343 (20,832)Indonesia 7,484 7,451 33 Singapore 15,476 18,414 (2,938)Thailand 81,881 93,510 (11,628)China 3,128 3,488 (360)Other 16,539 22,477 (5,938)
Americas 207,437 199,432 8,004 Europe, Middle East and Other 126,726 133,952 (7,225)
Total 1,544,592 1,655,877 (111,285)
Classified by Industry (in millions of yen)
As ofSeptember 30,
2016 (A)
As ofMarch 31,2016 (B)
Increase(Decrease)(A) - (B)
Domestic 1,085,917 1,177,149 (91,231)Manufacturing 394,908 430,858 (35,949)Construction 17,873 20,705 (2,832)Wholesale and retail 151,021 164,429 (13,408)Finance and insurance 420 1,466 (1,045)Real estate, goods rental and leasing 81,162 90,620 (9,457)Services 57,447 67,387 (9,939)Other industries 27,268 32,828 (5,560)Consumer 355,813 368,852 (13,038)
Overseas 458,674 478,728 (20,053)Financial institutions 12,072 14,361 (2,288)Commercial and industrial 321,470 319,456 2,014 Other 125,131 144,910 (19,779)
Total 1,544,592 1,655,877 (111,285)
Accruing loans contractually past due 3 months or more
As ofMarch 31,2016 (B)
As ofSeptember 30,
2016 (A)
Increase(Decrease)(A) - (B)
As ofSeptember 30,
2016 (A)
Increase(Decrease)(A) - (B)
As ofMarch 31,2016 (B)

Mitsubishi UFJ Financial Group, Inc.
15
BTMU Non-consolidated
(1) Risk-Monitored Loans(in millions of yen)
% to total loansand bills discounted
% to total loansand bills discounted
% to total loansand bills discounted
Loans to bankrupt borrowers 42,397 0.05% 46,057 0.05% (3,659) 0.00%Non-accrual delinquent loans 549,247 0.69% 851,173 0.98% (301,925) (0.29)%
51,819 0.06% 54,585 0.06% (2,765) 0.00%Restructured loans 517,686 0.65% 276,441 0.31% 241,245 0.33%
Total risk monitored loans 1,161,151 1.46% 1,228,257 1.41% (67,105) 0.04%Total loans and bills discounted 79,523,573 86,691,727 (7,168,153)
Written-off 333,232 309,542 23,690
(2) Allowance for Credit Losses(in millions of yen)
% to total riskmonitored loans
% to total riskmonitored loans
% to total riskmonitored loans
Allowance for credit losses 565,093 48.66% 665,588 54.18% (100,494) (5.52)%General allowance for credit losses 398,913 290,081 108,831 Specific allowance for credit losses 165,823 375,188 (209,364)Allowance for credit to specific foreign borrowers 356 318 38
(3) Classification of Risk-Monitored LoansClassified by Geographic Area (in millions of yen)
As ofSeptember 30,
2016 (A)
As ofMarch 31,2016 (B)
Increase(Decrease)(A) - (B)
Domestic 883,106 972,296 (89,189)Overseas 278,044 255,960 22,083
Asia 37,613 44,823 (7,209)Indonesia 2,665 2,979 (314)Singapore 15,476 18,414 (2,938)Thailand 5 - 5 China 3,035 3,380 (344)Other 16,431 20,048 (3,617)
Americas 113,866 77,184 36,681 Europe, Middle East and Other 126,564 133,952 (7,387)
Total 1,161,151 1,228,257 (67,105)
Classified by Industry (in millions of yen)
As ofSeptember 30,
2016 (A)
As ofMarch 31,2016 (B)
Increase(Decrease)(A) - (B)
Domestic 883,106 972,296 (89,189)Manufacturing 372,515 405,969 (33,453)Construction 17,187 20,003 (2,816)Wholesale and retail 149,390 162,914 (13,524)Finance and insurance 397 1,443 (1,045)Real estate 71,186 79,324 (8,138)Goods rental and leasing 2,501 2,720 (219)Services 57,144 67,072 (9,927)Other industries 26,950 32,500 (5,550)Consumer 185,832 200,346 (14,514)
Overseas 278,044 255,960 22,083 Financial institutions 11,931 14,290 (2,358)Commercial and industrial 212,023 181,531 30,491 Other 54,089 60,138 (6,049)
Total 1,161,151 1,228,257 (67,105)
Accruing loans contractually past due 3 months or more
As ofMarch 31,2016 (B)
As ofSeptember 30,
2016 (A)
Increase(Decrease)(A) - (B)
As ofSeptember 30,
2016 (A)
Increase(Decrease)(A) - (B)
As ofMarch 31,2016 (B)

Mitsubishi UFJ Financial Group, Inc.
16
MUTB Non-consolidated
(1) Risk-Monitored Loans(in millions of yen)
% to total loansand bills discounted
% to total loansand bills discounted
% to total loansand bills discounted
Loans to bankrupt borrowers 563 0.00 % 526 0.00 % 36 0.00 %Non-accrual delinquent loans 10,237 0.07 % 32,576 0.24 % (22,338) (0.17)%
201 0.00 % 214 0.00 % (13) (0.00)%Restructured loans 27,170 0.20 % 9,886 0.07 % 17,283 0.12 %
Total risk monitored loans 38,172 0.28 % 43,203 0.32 % (5,031) (0.04)%Total loans and bills discounted 13,573,206 13,192,538 380,668
Written-off 8,285 7,459 825
(2) Allowance for Credit Losses(in millions of yen)
% to total riskmonitored loans
% to total riskmonitored loans
% to total riskmonitored loans
Allowance for credit losses 34,114 89.37 % 37,084 85.83 % (2,969) 3.53 %General allowance for credit losses 33,080 26,355 6,725 Specific allowance for credit losses 1,031 10,729 (9,697)Allowance for credit to specific foreign borrowers 1 0 1
(3) Classification of Risk-Monitored LoansClassified by Geographic Area (in millions of yen)
As ofSeptember 30,
2016 (A)
As ofMarch 31,2016 (B)
Increase(Decrease)(A) - (B)
Domestic 38,172 43,181 (5,008)Overseas - 22 (22)
Asia - - - Americas - 22 (22)Europe, Middle East and Other - - -
Total 38,172 43,203 (5,031)
Classified by Industry (in millions of yen)
As ofSeptember 30,
2016 (A)
As ofMarch 31,2016 (B)
Increase(Decrease)(A) - (B)
Domestic 38,172 43,181 (5,008)Manufacturing 22,365 24,857 (2,492)Construction 669 684 (15)Wholesale and retail 1,409 1,353 56 Finance and insurance - - - Real estate 7,426 8,524 (1,098)Goods rental and leasing - - - Services 284 296 (11)Other industries 313 322 (9)Consumer 5,704 7,143 (1,438)
Overseas - 22 (22)Financial institutions - - - Commercial and industrial - - - Other - 22 (22)
Total 38,172 43,203 (5,031)
Accruing loans contractually past due 3 months or more
As ofMarch 31,2016 (B)
As ofSeptember 30,
2016 (A)
Increase(Decrease)(A) - (B)
As ofSeptember 30,
2016 (A)
Increase(Decrease)(A) - (B)
As ofMarch 31,2016 (B)

Mitsubishi UFJ Financial Group, Inc.
17
MUTB Non-consolidated: Trust Account“Trust Account” represents trust account with contracts indemnifying the principal amounts.
(1) Risk-Monitored Loans(in millions of yen)
% to total loansand bills discounted
% to total loansand bills discounted
% to total loansand bills discounted
Loans to bankrupt borrowers 3 0.01 % 11 0.04 % (7) (0.03)%Non-accrual delinquent loans 0 0.00 % 0 0.00 % (0) (0.00)%
5 0.02 % 5 0.02 % - 0.00 %Restructured loans 597 2.91 % 606 2.62 % (8) 0.29 %
Total risk monitored loans 606 2.96 % 623 2.69 % (16) 0.26 %Total loans and bills discounted 20,489 23,111 (2,622)
(2) Allowance for Credit Losses(in millions of yen)
Allowance for bad debts 64 69 (4)
(3) Classification of Risk-Monitored LoansClassified by Industry (in millions of yen)
As ofSeptember 30,
2016 (A)
As ofMarch 31,2016 (B)
Increase(Decrease)(A) - (B)
Domestic 606 623 (16)Manufacturing - - - Construction - - - Wholesale and retail - - - Finance and insurance - - - Real estate 549 564 (15)Goods rental and leasing - - - Services - - - Other industries - - - Consumer 57 59 (1)
Total 606 623 (16)
Increase(Decrease)(A) - (B)
Accruing loans contractually past due 3 months or more
As ofSeptember 30,
2016 (A)
As ofMarch 31,2016 (B)
Increase(Decrease)(A) - (B)
As ofSeptember 30,
2016 (A)
As ofMarch 31,2016 (B)

Mitsubishi UFJ Financial Group, Inc.
18
8. Non Performing Loans Based on the Financial Reconstruction Law (the “FRL”)BTMU and MUTB Combined including Trust Account“Trust account” represents trust account with contracts indemnifying the principal amounts.(1) Non Performing Loans
(in millions of yen)As of
September 30, 2016(A)
As ofMarch 31, 2016
(B)
Increase(Decrease)(A) - (B)
Bankrupt or De facto Bankrupt 126,824 118,819 8,005 Doubtful 489,307 846,495 (357,187)Special Attention 597,375 341,635 255,739
Non Performing Loans (1) 1,213,507 1,306,950 (93,442)
Normal 101,122,971 108,009,909 (6,886,937)Total 102,336,479 109,316,859 (6,980,380)
Non Performing Loans / Total 1.18 % 1.19 % (0.00)%
(2) Status of Coverage of Non Performing Loans(in millions of yen)
As ofSeptember 30, 2016
(A)
As ofMarch 31, 2016
(B)
Increase(Decrease)(A) - (B)
Covered amount (2) 987,762 1,096,492 (108,730)Allowance for credit losses 380,570 461,495 (80,924)Collateral, guarantees, etc. 607,191 634,997 (27,805)
Coverage ratio (2) / (1) 81.39 % 83.89 % (2.49)%
(3) Coverage Ratio(in millions of yen)
Loan amount (A) Allowance forcredit losses (B)
Covered bycollateral and/orguarantees (C)
Coverage ratio forunsecured portion(B) / [(A) - (C)]
Coverage ratio[(B) + (C)] / (A)
126,824 12,568 114,256 100.00 % [ 118,819 ] [ 17,327 ] [ 101,491 ] [ 100.00 %]
489,307 153,175 247,203 81.82 % [ 846,495 ] [ 355,601 ] [ 348,378 ] [ 83.16 %]
597,375 214,826 245,731 77.09 % [ 341,635 ] [ 88,566 ] [ 185,127 ] [ 80.11 %]1,213,507 380,570 607,191 81.39 %
[ 1,306,950 ] [ 461,495 ] [ 634,997 ] [ 83.89 %]Note: The upper figures are as of September 30, 2016. The lower figures with brackets are as of March 31, 2016.
(4) Classified by Industry(in millions of yen)
As ofSeptember 30, 2016
(A)
As ofMarch 31, 2016
(B)
Increase(Decrease)(A) - (B)
Domestic 930,430 1,043,076 (112,646)Manufacturing 395,755 446,091 (50,335)Construction 17,940 20,787 (2,847)Wholesale and retail 155,194 172,559 (17,365)Finance and insurance 1,771 2,777 (1,006)Real estate 79,398 88,661 (9,263)Goods rental and leasing 2,501 2,722 (220)Services 57,882 67,852 (9,970)Other industries 28,088 33,701 (5,613)Consumer 191,897 207,921 (16,024)
Overseas 283,077 263,873 19,203 Financial institutions 12,139 14,290 (2,150)Commercial and industrial 216,848 189,422 27,425 Other 54,089 60,160 (6,071)
Total 1,213,507 1,306,950 (93,442)
Category
Bankrupt or De facto Bankrupt
Doubtful
Special Attention
Total

Mitsubishi UFJ Financial Group, Inc.
19
BTMU Non-consolidated
(1) Non Performing Loans(in millions of yen)
As ofSeptember 30, 2016
(A)
As ofMarch 31, 2016
(B)
Increase(Decrease)(A) - (B)
Bankrupt or De facto Bankrupt 124,891 116,853 8,038 Doubtful 480,318 815,231 (334,912)Special Attention 569,506 331,026 238,479
Non Performing Loans (1) 1,174,716 1,263,111 (88,394)
Normal 87,106,127 94,370,441 (7,264,314)Total 88,280,843 95,633,552 (7,352,708)
Non Performing Loans / Total 1.33 % 1.32 % 0.00%
(2) Status of Coverage of Non Performing Loans(in millions of yen)
As ofSeptember 30, 2016
(A)
As ofMarch 31, 2016
(B)
Increase(Decrease)(A) - (B)
Covered amount (2) 956,318 1,059,742 (103,424)Allowance for credit losses 368,535 447,041 (78,505)Collateral, guarantees, etc. 587,782 612,701 (24,918)
Coverage ratio (2) / (1) 81.40 % 83.89 % (2.49)%
(3) Coverage Ratio(in millions of yen)
Loan amount (A) Allowance forcredit losses (B)
Covered bycollateral and/orguarantees (C)
Coverage ratio forunsecured portion(B) / [(A) - (C)]
Coverage ratio[(B) + (C)] / (A)
124,891 12,559 112,332 100.00 % 100.00 % [ 116,853 ] [ 17,316 ] [ 99,536 ] [ 100.00 %] [ 100.00 %]
480,318 152,625 239,491 63.37 % 81.63 % [ 815,231 ] [ 345,361 ] [ 331,408 ] [ 71.38 %] [ 83.01 %]
569,506 203,351 235,958 60.96 % 77.13 % [ 331,026 ] [ 84,363 ] [ 181,756 ] [ 56.51 %] [ 80.39 %]1,174,716 368,535 587,782 62.78 % 81.40 %
[ 1,263,111 ] [ 447,041 ] [ 612,701 ] [ 68.73 %] [ 83.89 %]Note: The upper figures are as of September 30, 2016. The lower figures with brackets are as of March 31, 2016.
(4) Classified by Industry(in millions of yen)
As ofSeptember 30, 2016
(A)
As ofMarch 31, 2016
(B)
Increase(Decrease)(A) - (B)
Domestic 891,638 999,259 (107,620)Manufacturing 373,390 421,233 (47,843)Construction 17,271 20,103 (2,832)Wholesale and retail 153,785 171,206 (17,421)Finance and insurance 1,771 2,777 (1,006)Real estate 71,422 79,572 (8,149)Goods rental and leasing 2,501 2,722 (220)Services 57,597 67,556 (9,958)Other industries 27,775 33,379 (5,603)Consumer 186,123 200,707 (14,584)
Overseas 283,077 263,851 19,225 Financial institutions 12,139 14,290 (2,150)Commercial and industrial 216,848 189,422 27,425 Other 54,089 60,138 (6,049)
Total 1,174,716 1,263,111 (88,394)
Total
Category
Bankrupt or De facto Bankrupt
Doubtful
Special Attention

Mitsubishi UFJ Financial Group, Inc.
20
MUTB Non-consolidated
(1) Non Performing Loans(in millions of yen)
As ofSeptember 30, 2016
(A)
As ofMarch 31, 2016
(B)
Increase(Decrease)(A) - (B)
Bankrupt or De facto Bankrupt 1,929 1,954 (25)Doubtful 8,883 31,159 (22,276)Special Attention 27,371 10,101 17,270
Non Performing Loans (1) 38,184 43,215 (5,031)
Normal 13,996,962 13,616,979 379,982 Total 14,035,146 13,660,195 374,950
Non Performing Loans / Total 0.27 % 0.31 % (0.04)%
(2) Status of Coverage of Non Performing Loans(in millions of yen)
As ofSeptember 30, 2016
(A)
As ofMarch 31, 2016
(B)
Increase(Decrease)(A) - (B)
Covered amount (2) 30,897 36,260 (5,363)Allowance for credit losses 12,035 14,454 (2,419)Collateral, guarantees, etc. 18,861 21,805 (2,944)
Coverage ratio (2) / (1) 80.91 % 83.90 % (2.98)%
(3) Coverage Ratio(in millions of yen)
Loan amount (A) Allowance forcredit losses (B)
Covered bycollateral and/orguarantees (C)
Coverage ratio forunsecured portion(B) / [(A) - (C)]
Coverage ratio[(B) + (C)] / (A)
1,929 8 1,920 100.00 % 100.00 % [ 1,954 ] [ 10 ] [ 1,943 ] [ 100.00 %] [ 100.00 %]
8,883 550 7,609 43.21 % 91.85 % [ 31,159 ] [ 10,239 ] [ 16,879 ] [ 71.70 %] [ 87.03 %]
27,371 11,475 9,331 63.61 % 76.01 % [ 10,101 ] [ 4,203 ] [ 2,982 ] [ 59.05 %] [ 71.14 %]
38,184 12,035 18,861 62.28 % 80.91 % [ 43,215 ] [ 14,454 ] [ 21,805 ] [ 67.51 %] [ 83.90 %]
Note: The upper figures are as of September 30, 2016. The lower figures with brackets are as of March 31, 2016.
(4) Classified by Industry(in millions of yen)
As ofSeptember 30, 2016
(A)
As ofMarch 31, 2016
(B)
Increase(Decrease)(A) - (B)
Domestic 38,184 43,193 (5,009)Manufacturing 22,365 24,857 (2,492)Construction 669 684 (15)Wholesale and retail 1,409 1,353 56 Finance and insurance - - - Real estate 7,426 8,524 (1,098)Goods rental and leasing - - - Services 284 296 (11)Other industries 313 322 (9)Consumer 5,716 7,155 (1,438)
Overseas - 22 (22)Financial institutions - - - Commercial and industrial - - - Other - 22 (22)
Total 38,184 43,215 (5,031)
Total
Category
Bankrupt or De facto Bankrupt
Doubtful
Special Attention

Mitsubishi UFJ Financial Group, Inc.
21
MUTB Non-consolidated: Trust Account“Trust account” represents trust account with contracts indemnifying the principal amounts.
(1) Non Performing Loans(in millions of yen)
As ofSeptember 30, 2016
(A)
As ofMarch 31, 2016
(B)
Increase(Decrease)(A) - (B)
Bankrupt or De facto Bankrupt 3 11 (7)Doubtful 105 104 1 Special Attention 497 507 (10)
Non Performing Loans (1) 606 623 (16)
Normal 19,882 22,488 (2,605)Total 20,489 23,111 (2,622)
Non Performing Loans / Total 2.96 % 2.69 % 0.26 %
(2) Status of Coverage of Non Performing Loans(in millions of yen)
As ofSeptember 30, 2016
(A)
As ofMarch 31, 2016
(B)
Increase(Decrease)(A) - (B)
Covered amount (2) 547 490 56 Allowance for credit losses - - - Collateral, guarantees, etc. 547 490 56
Coverage ratio (2) / (1) 90.19 % 78.65 % 11.54 %
(3) Coverage Ratio(in millions of yen)
Loan amount (A) Allowance forcredit losses (B)
Covered bycollateral and/orguarantees (C)
Coverage ratio forunsecured portion(B) / [(A) - (C)]
Coverage ratio[(B) + (C)] / (A)
3 - 3 100.00 % [ 11 ] [ - ] [ 11 ] [ 100.00 %]105 - 102 96.89 %
[ 104 ] [ - ] [ 90 ] [ 87.31 %]497 - 440 88.69 %
[ 507 ] [ - ] [ 387 ] [ 76.38 %]606 - 547 90.19 %
[ 623 ] [ - ] [ 490 ] [ 78.65 %]Note: The upper figures are as of September 30, 2016. The lower figures with brackets are as of March 31, 2016.
(4) Classified by Industry(in millions of yen)
As ofSeptember 30, 2016
(A)
As ofMarch 31, 2016
(B)
Increase(Decrease)(A) - (B)
Domestic 606 623 (16)Manufacturing - - - Construction - - - Wholesale and retail - - - Finance and insurance - - - Real estate 549 564 (15)Goods rental and leasing - - - Services - - - Other industries - - - Consumer 57 59 (1)
Total 606 623 (16)
Category
Bankrupt or De facto Bankrupt
Doubtful
Special Attention
Total

Mitsubishi UFJ Financial Group, Inc.
22
Overview of Non-Performing Loans
BTMU and MUTB Combined (in billions of yen)
Non-Classification
ClassificationⅡ
ClassificationⅢ
ClassificationⅣ
【42.9】
【11.2】 【1.3】 100.00 % 【126.8】(*1)
【559.4】ii ) Doubtful
【241.7】 63.26 % 【489.2】
iii ) Special Attention 【52.0】61.10 % 【596.8】
Restructured loans【544.8】
iv ) Normal【101,103.0】
i ) + ii ) + iii )1,212.9 1,199.3
Totali ) + ii ) + iii ) + iv )
102,315.9 (*1) “Customers’ liabilities for acceptances and guarantees” in Classification IV are fully reserved.
Category ofBorrowers
【247.5】
Loans to bankruptborrowersBankrupt
Borrowers
Coverage ratio for
unsecuredportion
Self-Assessment
PotentiallyBankruptBorrowers
Accruing loanscontractually past due
3 months or more
NormalBorrowers
【114.2】
BorrowersRequiringCaution(Other
Borrowers)
SubstantiallyBankruptBorrowers
BorrowersRequiringCaution(SpecialAttention
Borrowers)
Classification
Non-Performing LoansBased on the “FRL” Risk-Monitored Loans
i ) Bankrupt orDe facto Bankrupt
Non-accrualdelinquent loans
Non-Performing LoansBased on the “FRL” Risk-Monitored Loans
【596.8】

Mitsubishi UFJ Financial Group, Inc.
23
9. Progress in Disposition of Problem AssetsBTMU Non-consolidated
(1) Bankrupt or De facto Bankrupt and Doubtful Assets Based on the “FRL”(in millions of yen)
As of As of As of As ofMarch 31, 2014 March 31, 2015 March 31, 2016 (A) September 30, 2016 (B) (B) - (A)
195,312 121,427 86,518 52,946 (33,572)98,674 61,087 51,653 (9,434)
500,907 156,698 (344,208)112,817
(2) Progress in Disposition of Problem Assets(in millions of yen)
Bankrupt or De facto Bankrupt Doubtful
Liquidation 3,548 Reconstructive treatment 23,373 Upgrade due to reconstructive treatment - Loan sold to secondary market 1,495 Write-offs 32,123 Others 379,150
Collection / Repayment 47,715 Upgrade 331,434
Total 439,691 22,024 417,667
Amount in process for disposition 107,555 Note: The process for disposition consists of legal liquidation, quasi-legal liquidation, company splits to good companies and bad companies, partial direct write-offs of retail exposure to individuals and small/medium-sized companies, and trusts to The Resolution and Collection Corporation mainly for the purpose of revitalization of companies, which are scheduled to be off-balanced before their maturities.
For the first half of the fiscal year ended September 30, 2016
Assets newly categorized during fiscal 2013Assets newly categorized during fiscal 2014Assets newly categorized during fiscal 2015Assets newly categorized during fiscal 2016

Mitsubishi UFJ Financial Group, Inc.
24
MUTB Non-consolidated including Trust Account“Trust account” represents trust account with contracts indemnifying the principal amounts.
(1) Bankrupt or De facto Bankrupt and Doubtful Assets Based on the “FRL”(in millions of yen)
As of As of As of As ofMarch 31, 2014 March 31, 2015 March 31, 2016 (A) September 30, 2016 (B) (B) - (A)
6,315 3,069 2,510 743 (1,767)7,495 1,730 363 (1,367)
18,743 1,194 (17,549)1,135
(2) Progress in Disposition of Problem Assets(in millions of yen)
Bankrupt or De facto Bankrupt Doubtful
Liquidation - Reconstructive treatment - Upgrade due to reconstructive treatment - Loan sold to secondary market 1,278 Write-offs 1,579 Others 20,584
Collection / Repayment 2,223 Upgrade 18,361
Total 23,443 225 23,218
Amount in process for disposition 2,096 Note: The process for disposition consists of legal liquidation, quasi-legal liquidation, company splits to good companies and bad companies, partial direct write-offs of retail exposure to individuals and small/medium-sized companies, and trusts to The Resolution and Collection Corporation mainly for the purpose of revitalization of companies, which are scheduled to be off-balanced before their maturities.
For the first half of the fiscal year ended September 30, 2016
Assets newly categorized during fiscal 2013Assets newly categorized during fiscal 2014Assets newly categorized during fiscal 2015Assets newly categorized during fiscal 2016

Mitsubishi UFJ Financial Group, Inc.
25
10. Loans Classified by Type of Industry, Domestic Consumer Loans, Domestic Loans to Small/Medium-Sized Companies and Proprietors
BTMU and MUTB Combined including Trust Accounts
(1) Loans Classified by Type of Industry(in millions of yen)
As ofSeptember 30, 2016
(A)
Increase(Decrease)(A) - (B)
As ofMarch 31, 2016
(B)Domestic offices (excluding loans booked at offshore markets) 67,713,460 (4,975,735) 72,689,196
Manufacturing 10,519,959 (287,805) 10,807,764 Agriculture, forestry, fishery, mining, quarrying of stone and gravel 143,740 (15,718) 159,458 Construction 751,091 (69,506) 820,597 Utilities 1,598,138 18,887 1,579,251 Communication and information services 1,482,394 197,965 1,284,429 Transport and postal activities 2,167,775 (21,148) 2,188,923 Wholesale and retail 6,414,783 (27,276) 6,442,059 Finance and insurance 8,178,449 (299,878) 8,478,327 Real estate 8,771,097 59,257 8,711,840 Goods rental and leasing 1,929,191 66,142 1,863,049 Services 2,499,942 (16,825) 2,516,767 Municipal government 613,659 7,266 606,393 Other industries(including loans to the Japanese government) 22,643,227 (4,587,098) 27,230,325
Overseas offices and loans booked at offshore markets 25,556,238 (1,789,402) 27,345,641 Total 93,269,699 (6,765,137) 100,034,837
(2) Domestic Consumer Loans(in millions of yen)
As ofSeptember 30, 2016
(A)
Increase(Decrease)(A) - (B)
As ofMarch 31, 2016
(B)Total domestic consumer loans 16,446,982 80,851 16,366,131
Housing loans 15,637,906 67,120 15,570,786 Residential purpose 13,465,708 123,375 13,342,333
Other 809,075 13,731 795,344
(3) Domestic Loans to Small/Medium-Sized Companies and Proprietors(in millions of yen)
As ofSeptember 30, 2016
(A)
Increase(Decrease)(A) - (B)
As ofMarch 31, 2016
(B)Outstanding amount 39,502,972 (60,089) 39,563,061 % to total domestic loans 58.33 % 3.91 % 54.42 %

Mitsubishi UFJ Financial Group, Inc.
26
BTMU Non-consolidated
(1) Loans Classified by Type of Industry(in millions of yen)
As ofSeptember 30, 2016
(A)
Increase(Decrease)(A) - (B)
As ofMarch 31, 2016
(B)Domestic offices (excluding loans booked at offshore markets) 56,098,428 (5,638,285) 61,736,714
Manufacturing 8,531,799 (238,324) 8,770,123 Agriculture, forestry, fishery, mining, quarrying of stone and gravel 140,311 (15,273) 155,584 Construction 655,722 (60,321) 716,043 Utilities 1,206,385 (9,207) 1,215,592 Communication and information services 1,187,945 133,224 1,054,721 Transport and postal activities 1,583,189 (11,490) 1,594,679 Wholesale and retail 5,549,958 19,406 5,530,552 Finance and insurance 5,840,010 (323,464) 6,163,474 Real estate 6,864,619 (32,090) 6,896,709 Goods rental and leasing 1,209,496 45,836 1,163,660 Services 2,348,928 (22,550) 2,371,478 Municipal government 605,372 7,994 597,378 Other industries(including loans to the Japanese government) 20,374,694 (5,132,027) 25,506,721
Overseas offices and loans booked at offshore markets 23,425,145 (1,529,867) 24,955,012 Total 79,523,573 (7,168,153) 86,691,727
(2) Domestic Consumer Loans(in millions of yen)
As ofSeptember 30, 2016
(A)
Increase(Decrease)(A) - (B)
As ofMarch 31, 2016
(B)Total domestic consumer loans 15,073,065 83,288 14,989,776
Housing loans 14,269,053 69,166 14,199,887 Residential purpose 12,250,560 111,483 12,139,077
Other 804,011 14,122 789,889
(3) Domestic Loans to Small/Medium-Sized Companies and Proprietors(in millions of yen)
As ofSeptember 30, 2016
(A)
Increase(Decrease)(A) - (B)
As ofMarch 31, 2016
(B)Outstanding amount 33,718,711 (190,183) 33,908,894 % to total domestic loans 60.10% 5.18% 54.92%
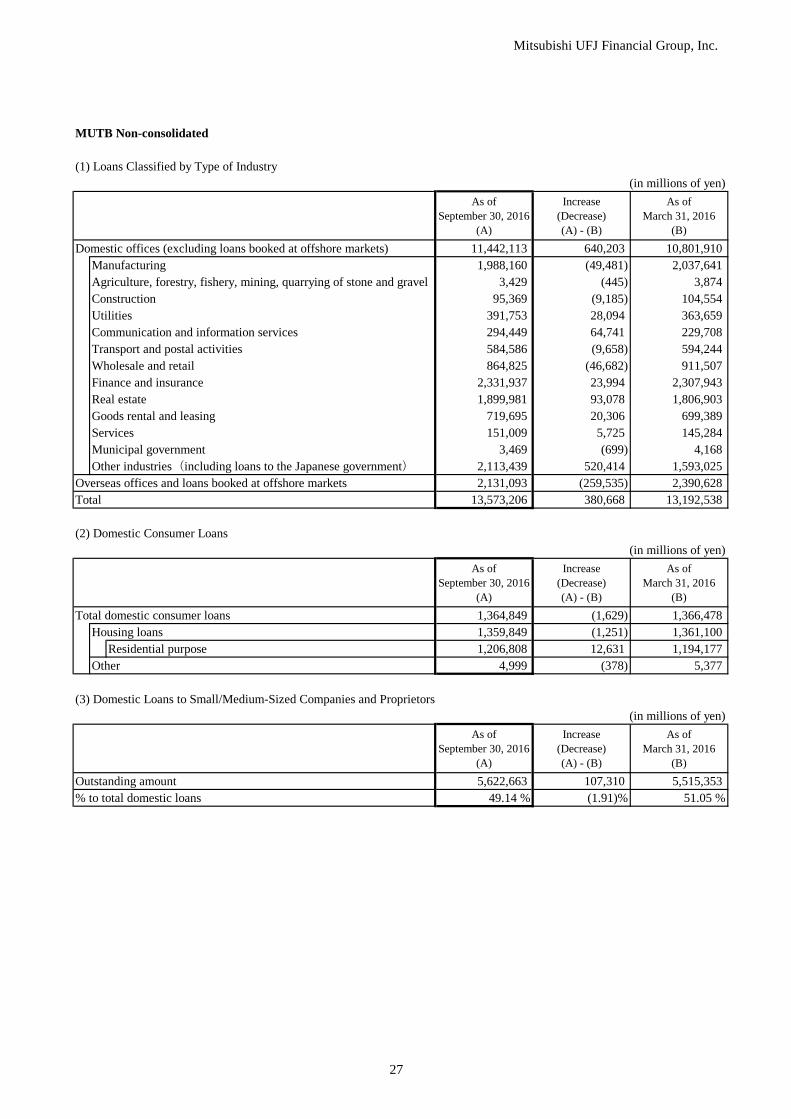
Mitsubishi UFJ Financial Group, Inc.
27
MUTB Non-consolidated
(1) Loans Classified by Type of Industry(in millions of yen)
As ofSeptember 30, 2016
(A)
Increase(Decrease)(A) - (B)
As ofMarch 31, 2016
(B)Domestic offices (excluding loans booked at offshore markets) 11,442,113 640,203 10,801,910
Manufacturing 1,988,160 (49,481) 2,037,641 Agriculture, forestry, fishery, mining, quarrying of stone and gravel 3,429 (445) 3,874 Construction 95,369 (9,185) 104,554 Utilities 391,753 28,094 363,659 Communication and information services 294,449 64,741 229,708 Transport and postal activities 584,586 (9,658) 594,244 Wholesale and retail 864,825 (46,682) 911,507 Finance and insurance 2,331,937 23,994 2,307,943 Real estate 1,899,981 93,078 1,806,903 Goods rental and leasing 719,695 20,306 699,389 Services 151,009 5,725 145,284 Municipal government 3,469 (699) 4,168 Other industries(including loans to the Japanese government) 2,113,439 520,414 1,593,025
Overseas offices and loans booked at offshore markets 2,131,093 (259,535) 2,390,628 Total 13,573,206 380,668 13,192,538
(2) Domestic Consumer Loans(in millions of yen)
As ofSeptember 30, 2016
(A)
Increase(Decrease)(A) - (B)
As ofMarch 31, 2016
(B)Total domestic consumer loans 1,364,849 (1,629) 1,366,478
Housing loans 1,359,849 (1,251) 1,361,100 Residential purpose 1,206,808 12,631 1,194,177
Other 4,999 (378) 5,377
(3) Domestic Loans to Small/Medium-Sized Companies and Proprietors(in millions of yen)
As ofSeptember 30, 2016
(A)
Increase(Decrease)(A) - (B)
As ofMarch 31, 2016
(B)Outstanding amount 5,622,663 107,310 5,515,353 % to total domestic loans 49.14 % (1.91)% 51.05 %

Mitsubishi UFJ Financial Group, Inc.
28
MUTB Non-consolidated: Trust Accounts
(1) Loans Classified by Type of Industry(in millions of yen)
As ofSeptember 30, 2016
(A)
Increase(Decrease)(A) - (B)
As ofMarch 31, 2016
(B)Domestic offices (excluding loans booked at offshore markets) 172,918 22,347 150,571
Manufacturing - - - Agriculture, forestry, fishery, mining, quarrying of stone and gravel - - - Construction - - - Utilities - - - Communication and information services - - - Transport and postal activities - - - Wholesale and retail - - - Finance and insurance 6,502 (408) 6,910 Real estate 6,497 (1,731) 8,228 Goods rental and leasing - - - Services 5 - 5 Municipal government 4,818 (29) 4,847 Other industries(including loans to the Japanese government) 155,094 24,515 130,579
Overseas offices and loans booked at offshore markets - - - Total 172,918 22,347 150,571
(2) Domestic Consumer Loans(in millions of yen)
As ofSeptember 30, 2016
(A)
Increase(Decrease)(A) - (B)
As ofMarch 31, 2016
(B)Total domestic consumer loans 9,067 (807) 9,875
Housing loans 9,003 (794) 9,798 Residential purpose 8,339 (738) 9,078
Other 63 (12) 76
(3) Domestic Loans to Small/Medium-Sized Companies and Proprietors(in millions of yen)
As ofSeptember 30, 2016
(A)
Increase(Decrease)(A) - (B)
As ofMarch 31, 2016
(B)Outstanding amount 161,598 22,784 138,814 % to total domestic loans 93.45 % 1.26 % 92.19 %

Mitsubishi UFJ Financial Group, Inc.
29
11. Overseas Loans
BTMU and MUTB Combined(in millions of yen)
As ofSeptember 30, 2016
(A)
Increase(Decrease)(A) - (B)
As ofMarch 31, 2016
(B)Asia 6,445,697 (756,542) 7,202,239
Thailand 196,907 (45,062) 241,969 Indonesia 769,257 (82,280) 851,537 Malaysia 385,988 (154,587) 540,576 Philippines 161,110 (25,517) 186,628 South Korea 496,666 (35,329) 531,996 Singapore 1,114,663 (127,497) 1,242,161 Hong Kong 1,915,789 (190,576) 2,106,366 China 137,810 (40,142) 177,953 Taiwan 388,611 10,947 377,664 Others 878,891 (66,494) 945,386
Latin America 3,793,127 (523,736) 4,316,864 Argentina 41,945 16,160 25,784 Brazil 621,327 (26,526) 647,854 Mexico 406,054 (19,250) 425,305 Caribbean countries 2,295,442 (439,739) 2,735,182 Others 428,356 (54,379) 482,736
North America 8,083,976 273,571 7,810,405 United States of America 7,425,964 (122,741) 7,548,706 Canada 658,011 396,312 261,699
Western Europe 4,859,947 (625,635) 5,485,582 United Kingdom 1,915,877 (253,646) 2,169,523 Germany 416,012 (118,637) 534,650 France 437,204 (23,028) 460,233 Netherlands 711,124 (19,825) 730,950 Spain 140,086 (36,586) 176,673 Italy 169,533 (39,273) 208,807 Others 1,070,106 (134,637) 1,204,744
Eastern Europe 153,114 (76,860) 229,974 Others 4,316,343 (96,453) 4,412,796 Total 27,652,207 (1,805,656) 29,457,864
Note: In addition to the (non-consolidated basis) loan balance stated above, five major overseas subsidiaries have the following loan balances in the consolidated financial statements. MUFG Americas Holdings Corporation :¥8,133,508 million (a 1,125,168 million yen decrease as compared with March 31, 2016.) Bank of Ayudhya Public Company Limited :¥3,131,076 million (a 337,231 million yen decrease as compared with March 31, 2016.) Bank of Tokyo-Mitsubishi UFJ (China), Ltd.:¥1,152,464 million (a 328,772 million yen decrease as compared with March 31, 2016.) MUFG Bank (Europe) N.V. :¥602,454 million (a 3,426 million yen increase as compared with March 31, 2016.) Bank of Tokyo-Mitsubishi UFJ (Malaysia) Berhad :¥419,537 million (a 50,413 million yen decrease as compared with March 31, 2016.)
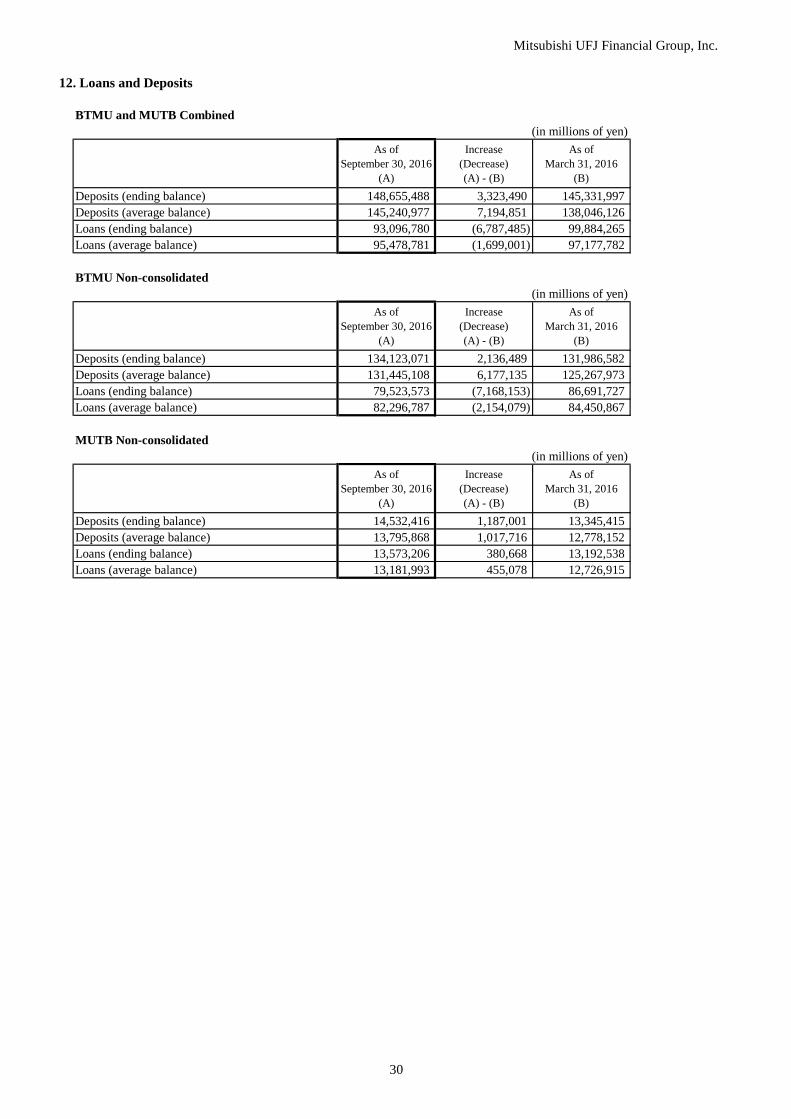
Mitsubishi UFJ Financial Group, Inc.
30
12. Loans and Deposits
BTMU and MUTB Combined(in millions of yen)
As ofSeptember 30, 2016
(A)
Increase(Decrease)(A) - (B)
As ofMarch 31, 2016
(B)Deposits (ending balance) 148,655,488 3,323,490 145,331,997 Deposits (average balance) 145,240,977 7,194,851 138,046,126 Loans (ending balance) 93,096,780 (6,787,485) 99,884,265 Loans (average balance) 95,478,781 (1,699,001) 97,177,782
BTMU Non-consolidated(in millions of yen)
As ofSeptember 30, 2016
(A)
Increase(Decrease)(A) - (B)
As ofMarch 31, 2016
(B)Deposits (ending balance) 134,123,071 2,136,489 131,986,582 Deposits (average balance) 131,445,108 6,177,135 125,267,973 Loans (ending balance) 79,523,573 (7,168,153) 86,691,727 Loans (average balance) 82,296,787 (2,154,079) 84,450,867
MUTB Non-consolidated(in millions of yen)
As ofSeptember 30, 2016
(A)
Increase(Decrease)(A) - (B)
As ofMarch 31, 2016
(B)Deposits (ending balance) 14,532,416 1,187,001 13,345,415 Deposits (average balance) 13,795,868 1,017,716 12,778,152 Loans (ending balance) 13,573,206 380,668 13,192,538 Loans (average balance) 13,181,993 455,078 12,726,915

Mitsubishi UFJ Financial Group, Inc.
31
13. Domestic Deposits
BTMU and MUTB Combined(in millions of yen)
As ofSeptember 30, 2016
(A)
Increase(Decrease)(A) - (B)
As ofMarch 31, 2016
(B)Individuals 71,268,232 199,596 71,068,636 Corporations and others 56,291,780 3,509,469 52,782,310
Domestic deposits 127,560,012 3,709,065 123,850,947 Note: Amounts do not include negotiable certificates of deposit and JOM accounts.
BTMU Non-consolidated(in millions of yen)
As ofSeptember 30, 2016
(A)
Increase(Decrease)(A) - (B)
As ofMarch 31, 2016
(B)Individuals 63,598,246 439,607 63,158,639 Corporations and others 50,814,414 2,061,769 48,752,644
Domestic deposits 114,412,660 2,501,376 111,911,283 Note: Amounts do not include negotiable certificates of deposit and JOM accounts.
MUTB Non-consolidated(in millions of yen)
As ofSeptember 30, 2016
(A)
Increase(Decrease)(A) - (B)
As ofMarch 31, 2016
(B)Individuals 7,669,986 (240,010) 7,909,997 Corporations and others 5,477,365 1,447,699 4,029,666
Domestic deposits 13,147,352 1,207,688 11,939,663 Note: Amounts do not include negotiable certificates of deposit and JOM accounts.

Mitsubishi UFJ Financial Group, Inc.
32
14. Status of Deferred Tax Assets
BTMU Non-consolidated
(1) Tax Effects of the Items Comprising Net Deferred Tax Assets (in billions of yen)
As ofSeptember 30,
2016 (A)
Increase(Decrease)(A) - (B)
As ofMarch 31,2016 (B)
Deferred tax assets 530.6 3.7 526.8 Allowance for credit losses 246.6 (21.2) 267.8 Write-down on investment securities 117.0 (0.4) 117.5 Unrealized losses on available-for-sale securities 20.8 1.5 19.2 Reserve for retirement benefits 98.6 (0.0) 98.7 Other 192.9 8.7 184.1 Valuation allowance (145.4) 15.2 (160.6)
Deferred tax liabilities 1,074.2 (20.5) 1,094.7 Unrealized gains on available-for-sale securities 741.1 (15.1) 756.3 Net deferred gains on hedges 184.6 (2.8) 187.4 Revaluation gains on securities upon merger 60.4 (1.5) 62.0
49.9 0.1 49.8 Other 37.9 (1.0) 39.0
Net deferred tax assets (543.5) 24.2 (567.8)
(2) Net operating profits before provision for general allowance for credit losses and Taxable Income(in billions of yen)
FY2011 FY2012 FY2013 FY2014 FY2015 Interim FY2016
1,022.8 1,001.5 855.9 931.4 888.1 417.0 Total credit costs (125.3) (56.6) 17.0 (70.7) (103.4) (4.7)Income before income taxes 739.5 877.4 984.7 860.2 884.7 411.9 Reconciliation to taxable income (305.1) (561.4) (336.2) (12.6) (113.3) (108.4)Taxable income 434.3 316.0 648.5 847.5 771.3 303.5
(3) Classification Based on Prior Year Operating Results as Provided in the ASBJ Guidance No.26
We are classified as “2” because we are considered to be a company showing stable financial performance.
Gains on securities contributed to employees’ retirement benefits trust
Net operating profits before provision for general allowance for credit losses

Mitsubishi UFJ Financial Group, Inc.
33
MUTB Non-consolidated
(1) Tax Effects of the Items Comprising Net Deferred Tax Assets (in billions of yen)
As ofSeptember 30,
2016 (A)
Increase(Decrease)(A) - (B)
As ofMarch 31,2016 (B)
Deferred tax assets 58.7 (2.4) 61.1 Deferred losses on hedging instruments 25.4 (4.3) 29.8
15.9 1.1 14.8 Allowance for credit losses 11.8 (0.6) 12.4 Write-down on investment securities 10.7 0.2 10.5 Other 34.0 2.9 31.0 Valuation allowance (39.3) (1.8) (37.5)
Deferred tax liabilities 308.1 (7.3) 315.4 Unrealized gains on available-for-sale securities 251.8 (7.9) 259.8 Reserve for retirement benefits 45.4 1.3 44.0 Other 10.7 (0.7) 11.5
Net deferred tax assets (249.4) 4.9 (254.3)
(2) Net operating profits before credit costs for trust accounts and provision for general allowance for credit losses and Taxable Income(in billions of yen)
FY2011 FY2012 FY2013 FY2014 FY2015 Interim FY2016
148.1 162.2 162.9 190.4 193.0 92.7 Total credit costs (9.2) (8.6) 18.0 (0.4) (0.2) 1.7 Income before income taxes 113.5 173.5 184.4 201.4 218.6 99.9 Reconciliation to taxable income (30.2) (84.9) (94.3) (40.4) (68.1) (26.5)Taxable income 83.3 88.6 90.1 160.9 150.4 73.4
(3) Classification Based on Prior Year Operating Results as Provided in the ASBJ Guidance No.26
We are classified as “2” because we are considered to be a company showing stable financial performance.
Net operating profits before credit costs for trust accounts and provision for general allowance for credit losses
Gains on securities related to employees’ retirement benefits trust

Mitsubishi UFJ Financial Group, Inc.
34
(Reference)1. Financial Statements
BTMU Non-consolidated
(1) Non-consolidated Balance SheetsAs of As of
(in millions of yen) March 31, 2016 September 30, 2016Assets:
Cash and due from banks 36,988,806 46,073,453 Call loans 196,063 248,553 Receivables under resale agreements 47,258 156,202 Receivables under securities borrowing transactions 446,292 1,741,890 Monetary claims bought 3,822,799 3,973,428 Trading assets 6,224,030 6,169,063 Money held in trust 57,656 28,120 Securities 48,913,432 45,927,197 Loans and bills discounted 86,691,727 79,523,573 Foreign exchanges 1,529,192 1,831,863 Other assets 7,881,852 7,982,573 Tangible fixed assets 858,747 852,870 Intangible fixed assets 380,570 374,915 Prepaid pension costs 258,110 262,663 Customers’ liabilities for acceptances and guarantees 6,630,945 6,206,071 Allowance for credit losses (665,588) (565,093)Total assets 200,261,895 200,787,348
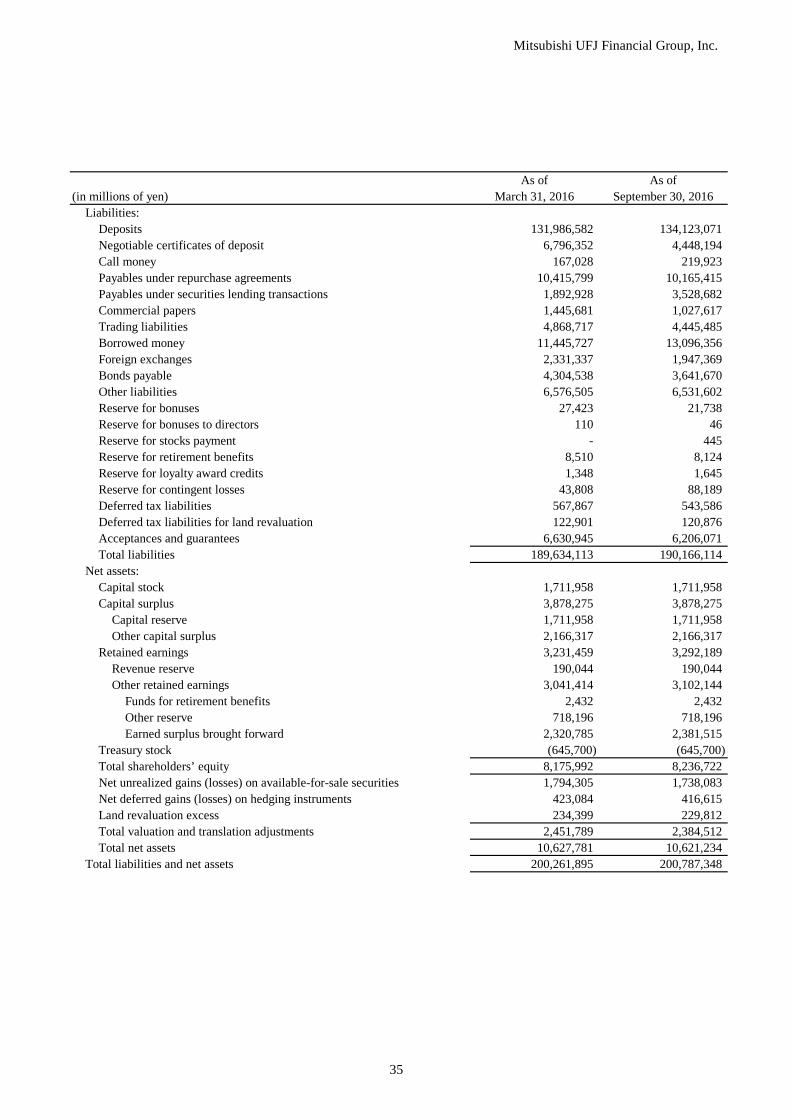
Mitsubishi UFJ Financial Group, Inc.
35
As of As of(in millions of yen) March 31, 2016 September 30, 2016
Liabilities:Deposits 131,986,582 134,123,071 Negotiable certificates of deposit 6,796,352 4,448,194 Call money 167,028 219,923 Payables under repurchase agreements 10,415,799 10,165,415 Payables under securities lending transactions 1,892,928 3,528,682 Commercial papers 1,445,681 1,027,617 Trading liabilities 4,868,717 4,445,485 Borrowed money 11,445,727 13,096,356 Foreign exchanges 2,331,337 1,947,369 Bonds payable 4,304,538 3,641,670 Other liabilities 6,576,505 6,531,602 Reserve for bonuses 27,423 21,738 Reserve for bonuses to directors 110 46 Reserve for stocks payment - 445 Reserve for retirement benefits 8,510 8,124 Reserve for loyalty award credits 1,348 1,645 Reserve for contingent losses 43,808 88,189 Deferred tax liabilities 567,867 543,586 Deferred tax liabilities for land revaluation 122,901 120,876 Acceptances and guarantees 6,630,945 6,206,071 Total liabilities 189,634,113 190,166,114
Net assets:Capital stock 1,711,958 1,711,958 Capital surplus 3,878,275 3,878,275
Capital reserve 1,711,958 1,711,958 Other capital surplus 2,166,317 2,166,317
Retained earnings 3,231,459 3,292,189 Revenue reserve 190,044 190,044 Other retained earnings 3,041,414 3,102,144
Funds for retirement benefits 2,432 2,432 Other reserve 718,196 718,196 Earned surplus brought forward 2,320,785 2,381,515
Treasury stock (645,700) (645,700)Total shareholders’ equity 8,175,992 8,236,722 Net unrealized gains (losses) on available-for-sale securities 1,794,305 1,738,083 Net deferred gains (losses) on hedging instruments 423,084 416,615 Land revaluation excess 234,399 229,812 Total valuation and translation adjustments 2,451,789 2,384,512 Total net assets 10,627,781 10,621,234
Total liabilities and net assets 200,261,895 200,787,348
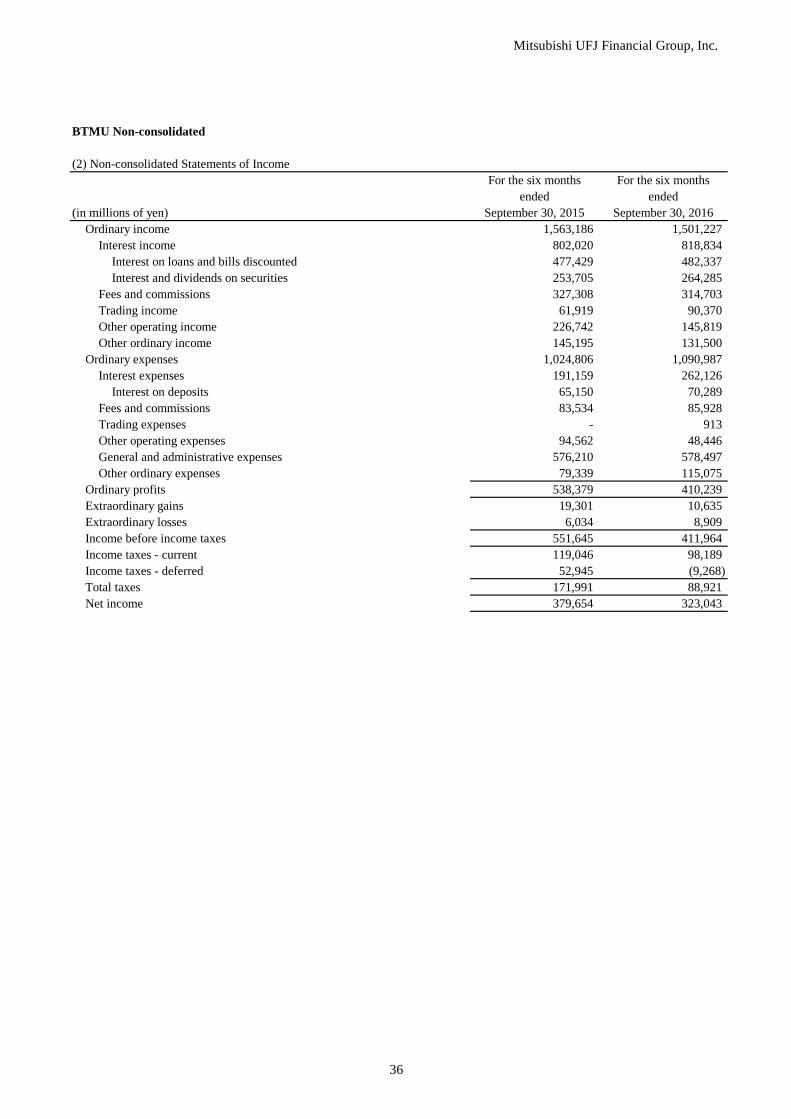
Mitsubishi UFJ Financial Group, Inc.
36
BTMU Non-consolidated
(2) Non-consolidated Statements of IncomeFor the six months For the six months
ended ended(in millions of yen) September 30, 2015 September 30, 2016
Ordinary income 1,563,186 1,501,227 Interest income 802,020 818,834
Interest on loans and bills discounted 477,429 482,337 Interest and dividends on securities 253,705 264,285
Fees and commissions 327,308 314,703 Trading income 61,919 90,370 Other operating income 226,742 145,819 Other ordinary income 145,195 131,500
Ordinary expenses 1,024,806 1,090,987 Interest expenses 191,159 262,126
Interest on deposits 65,150 70,289 Fees and commissions 83,534 85,928 Trading expenses - 913 Other operating expenses 94,562 48,446 General and administrative expenses 576,210 578,497 Other ordinary expenses 79,339 115,075
Ordinary profits 538,379 410,239 Extraordinary gains 19,301 10,635 Extraordinary losses 6,034 8,909 Income before income taxes 551,645 411,964 Income taxes - current 119,046 98,189 Income taxes - deferred 52,945 (9,268)Total taxes 171,991 88,921 Net income 379,654 323,043

Mitsubishi UFJ Financial Group, Inc.
37
MUTB Non-consolidated
(1) Non-consolidated Balance SheetsAs of As of
(in millions of yen) March 31, 2016 September 30, 2016Assets:
Cash and due from banks 6,590,057 8,078,391 Call loans 240,231 13,622 Receivables under securities borrowing transactions 886,878 - Monetary claims bought 523 251 Trading assets 372,594 555,967 Money held in trust 13,040 12,892 Securities 17,426,047 16,273,032 Loans and bills discounted 13,192,538 13,573,206 Foreign exchanges 36,875 49,378 Other assets 723,209 832,269 Tangible fixed assets 150,154 148,159 Intangible fixed assets 57,496 59,063 Prepaid pension costs 262,799 267,356 Customers’ liabilities for acceptances and guarantees 405,141 384,442 Allowance for credit losses (37,084) (34,114)Total assets 40,320,504 40,213,919

Mitsubishi UFJ Financial Group, Inc.
38
As of As of(in millions of yen) March 31, 2016 September 30, 2016
Liabilities:Deposits 13,345,415 14,532,416 Negotiable certificates of deposit 4,573,223 4,253,469 Call money 193,932 674,182 Payables under repurchase agreements 5,205,060 5,289,109 Payables under securities lending transactions 1,926,430 2,029,250 Commercial papers 628,243 395,055 Trading liabilities 150,560 148,504 Borrowed money 2,110,470 2,105,034 Foreign exchanges 418 500 Short-term bonds payable 126,993 533,999 Bonds payable 847,129 824,732 Due to trust accounts 7,152,449 5,616,214 Other liabilities 1,150,631 912,339 Reserve for bonuses 4,564 4,791 Reserve for bonuses to directors 41 19 Reserve for stocks payment - 452 Reserve for contingent losses 7,632 8,059 Deferred tax liabilities 254,316 249,411 Deferred tax liabilities for land revaluation 4,336 4,336 Acceptances and guarantees 405,141 384,442 Total liabilities 38,086,991 37,966,321
Net assets:Capital stock 324,279 324,279 Capital surplus 422,083 422,083
Capital reserve 250,619 250,619 Other capital surplus 171,464 171,464
Retained earnings 943,842 968,191 Revenue reserve 73,714 73,714 Other retained earnings 870,128 894,477
Funds for retirement benefits 710 710 Other reserve 138,495 138,495 Earned surplus brought forward 730,923 755,272
Total shareholders’ equity 1,690,205 1,714,554 Net unrealized gains (losses) on available-for-sale securities 614,205 592,310 Net deferred gains (losses) on hedging instruments (67,592) (57,774)Land revaluation excess (3,305) (1,492)Total valuation and translation adjustments 543,306 533,042 Total net assets 2,233,512 2,247,597
Total liabilities and net assets 40,320,504 40,213,919

Mitsubishi UFJ Financial Group, Inc.
39
MUTB Non-consolidated
(2) Non-consolidated Statements of IncomeFor the six months For the six months
ended ended(in millions of yen) September 30, 2015 September 30, 2016
Ordinary income 288,591 302,086 Trust fees 45,638 49,897 Interest income 133,506 128,844
Interest on loans and bills discounted 45,206 46,004 Interest and dividends on securities 84,796 76,679
Fees and commissions 65,685 65,576 Trading income 10,528 7,307 Other operating income 21,103 28,304 Other ordinary income 12,128 22,155
Ordinary expenses 189,041 196,570 Interest expenses 37,650 59,848
Interest on deposits 11,544 11,465 Fees and commissions 15,708 15,527 Trading expenses 484 60 Other operating expenses 35,952 12,117 General and administrative expenses 90,974 104,909 Other ordinary expenses 8,271 4,108
Ordinary profits 99,549 105,515 Extraordinary gains 11 36 Extraordinary losses 465 5,593 Income before income taxes 99,095 99,959 Income taxes - current 22,901 25,485 Income taxes - deferred 5,835 (1,255)Total taxes 28,736 24,230 Net income 70,359 75,728

Mitsubishi UFJ Financial Group, Inc.
40
MUTB Non-consolidated
(3) Statements of Trust Assets and LiabilitiesIncluding trust assets under service-shared co-trusteeship
As of As of(in millions of yen) March 31, 2016 September 30, 2016
Assets:Loans and bills discounted 150,571 172,918 Securities 53,614,888 52,375,631 Beneficiary rights to the trust 53,719,802 55,811,032 Securities held in custody accounts 3,339,160 3,727,280 Monetary claims 9,369,779 8,384,845 Tangible fixed assets 11,636,006 12,035,635 Intangible fixed assets 193,150 206,638 Other claims 4,364,029 3,420,159 Call loans 103,070 624,483 Due from banking account 12,745,624 7,673,408 Cash and due from banks 4,474,306 4,748,475 Total 153,710,390 149,180,508
Liabilities:Money trusts 20,470,160 19,311,414 Pension trusts 14,950,257 12,843,522 Property formation benefit trusts 8,033 7,523 Investment trusts 58,519,398 59,138,914 Money entrusted other than money trusts 3,463,944 3,316,252 Securities trusts 5,350,832 5,645,901 Monetary claim trusts 8,799,495 7,642,868 Equipment trusts 59,923 63,438 Land and fixtures trusts 65,884 65,798 Composite trusts 42,022,461 41,144,872 Total 153,710,390 149,180,508
Note: The table shown above includes master trust assets under the service-shared co-trusteeship between MUTB and The Master Trust Bank of Japan, Ltd.
Detailed information for “Money trust” with contracts indemnifying the principal amounts(including trusts for which beneficiary interests are re-entrusted)
As of As of(in millions of yen) March 31, 2016 September 30, 2016
Assets:Loans and bills discounted 23,111 20,489 Securities 116,704 110,975 Other 6,985,751 5,411,379 Total 7,125,567 5,542,844
Liabilities:Principal 7,111,058 5,532,965 Allowance for bad debts 69 64 Other 14,439 9,814 Total 7,125,567 5,542,844
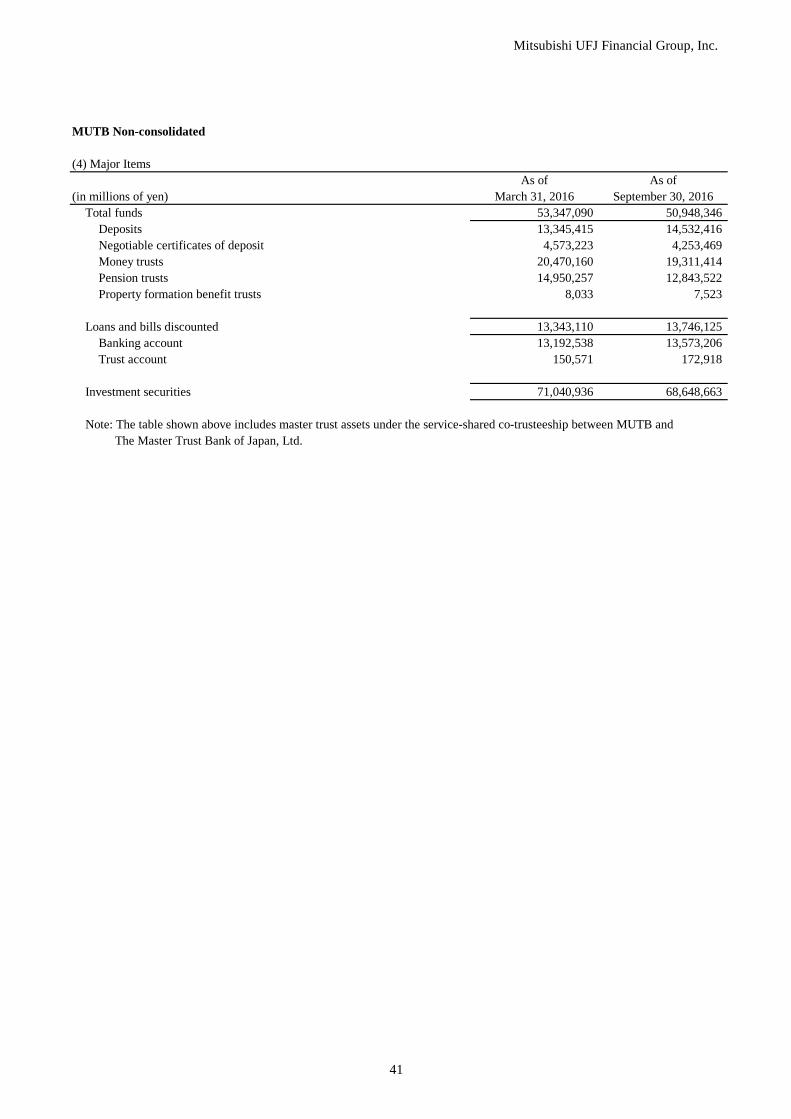
Mitsubishi UFJ Financial Group, Inc.
41
MUTB Non-consolidated
(4) Major ItemsAs of As of
(in millions of yen) March 31, 2016 September 30, 2016Total funds 53,347,090 50,948,346
Deposits 13,345,415 14,532,416 Negotiable certificates of deposit 4,573,223 4,253,469 Money trusts 20,470,160 19,311,414 Pension trusts 14,950,257 12,843,522 Property formation benefit trusts 8,033 7,523
Loans and bills discounted 13,343,110 13,746,125 Banking account 13,192,538 13,573,206 Trust account 150,571 172,918
Investment securities 71,040,936 68,648,663
Note: The table shown above includes master trust assets under the service-shared co-trusteeship between MUTB and The Master Trust Bank of Japan, Ltd.