Embed Size (px)
Citation preview
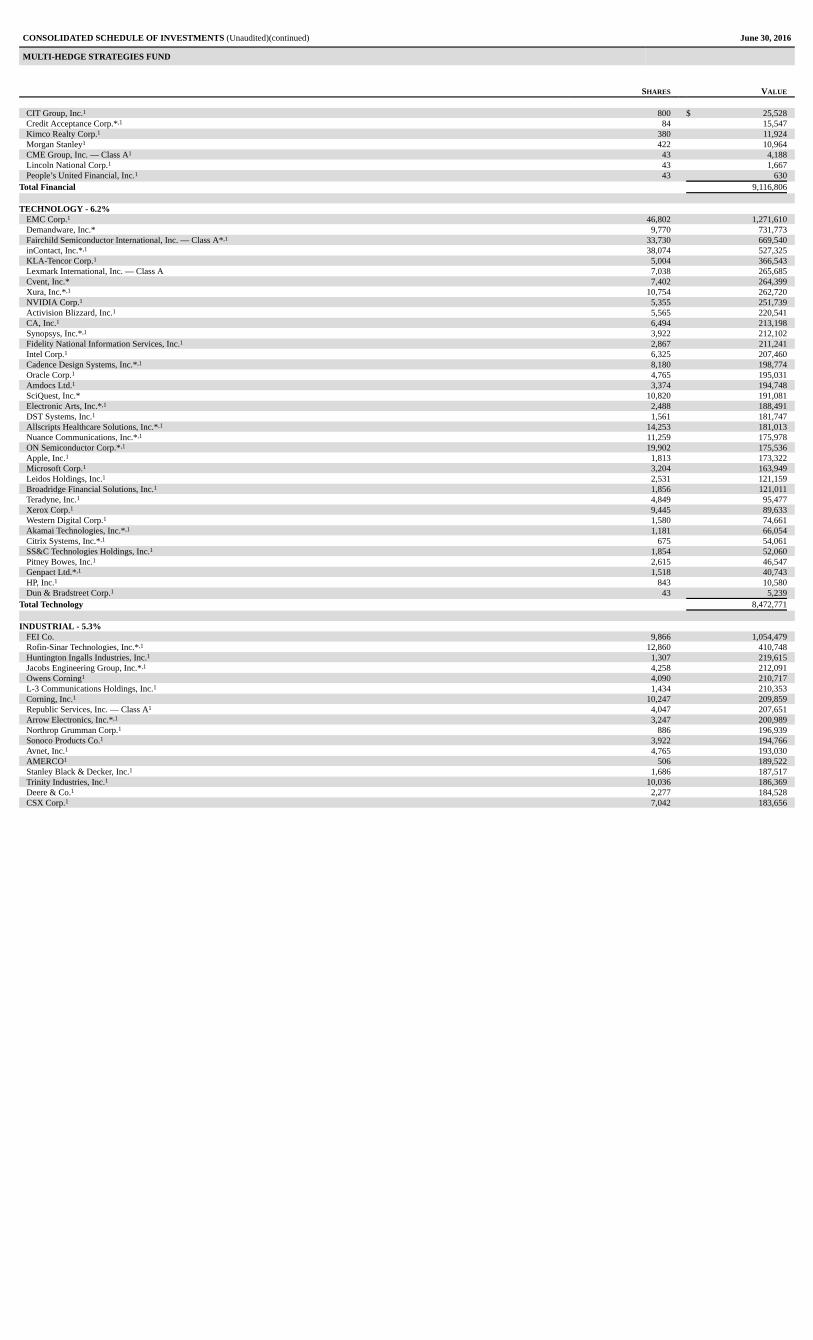
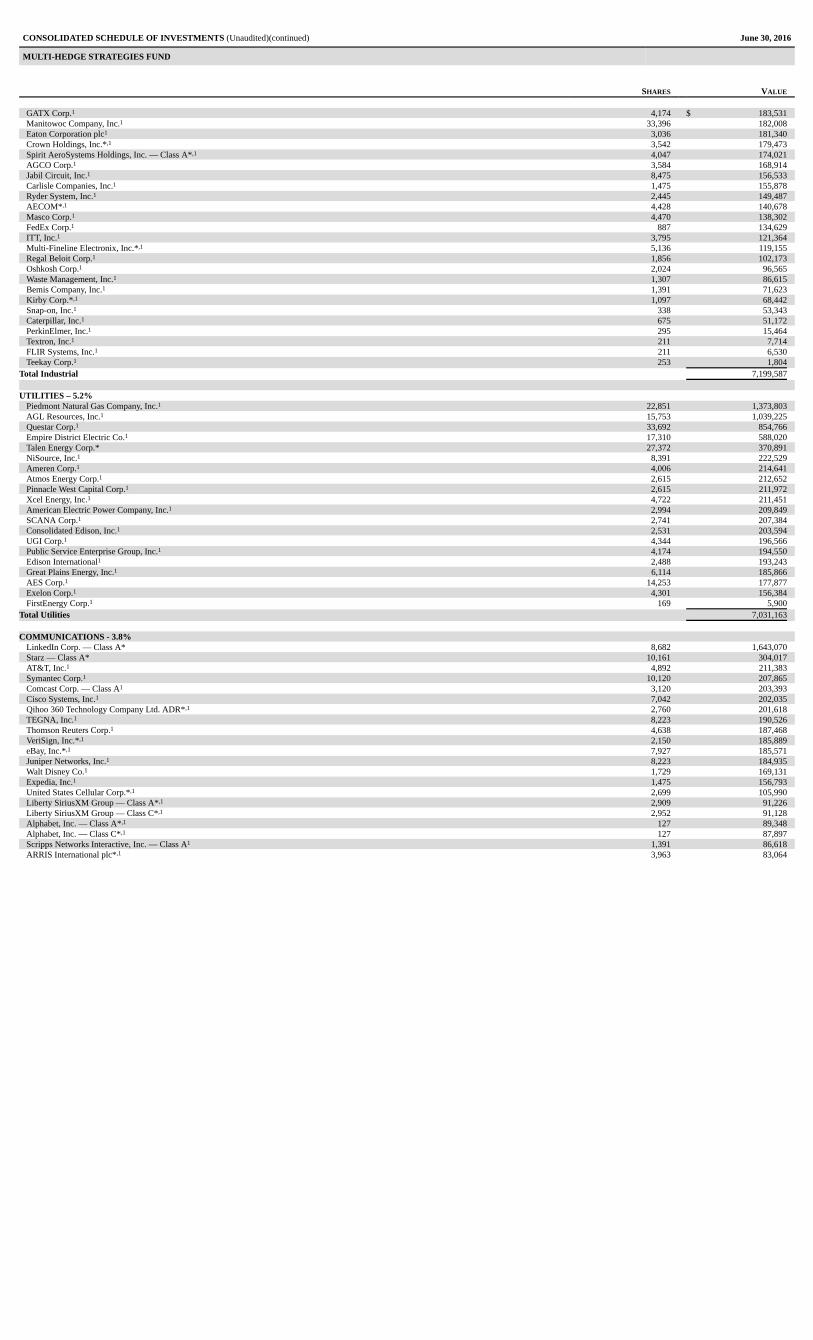
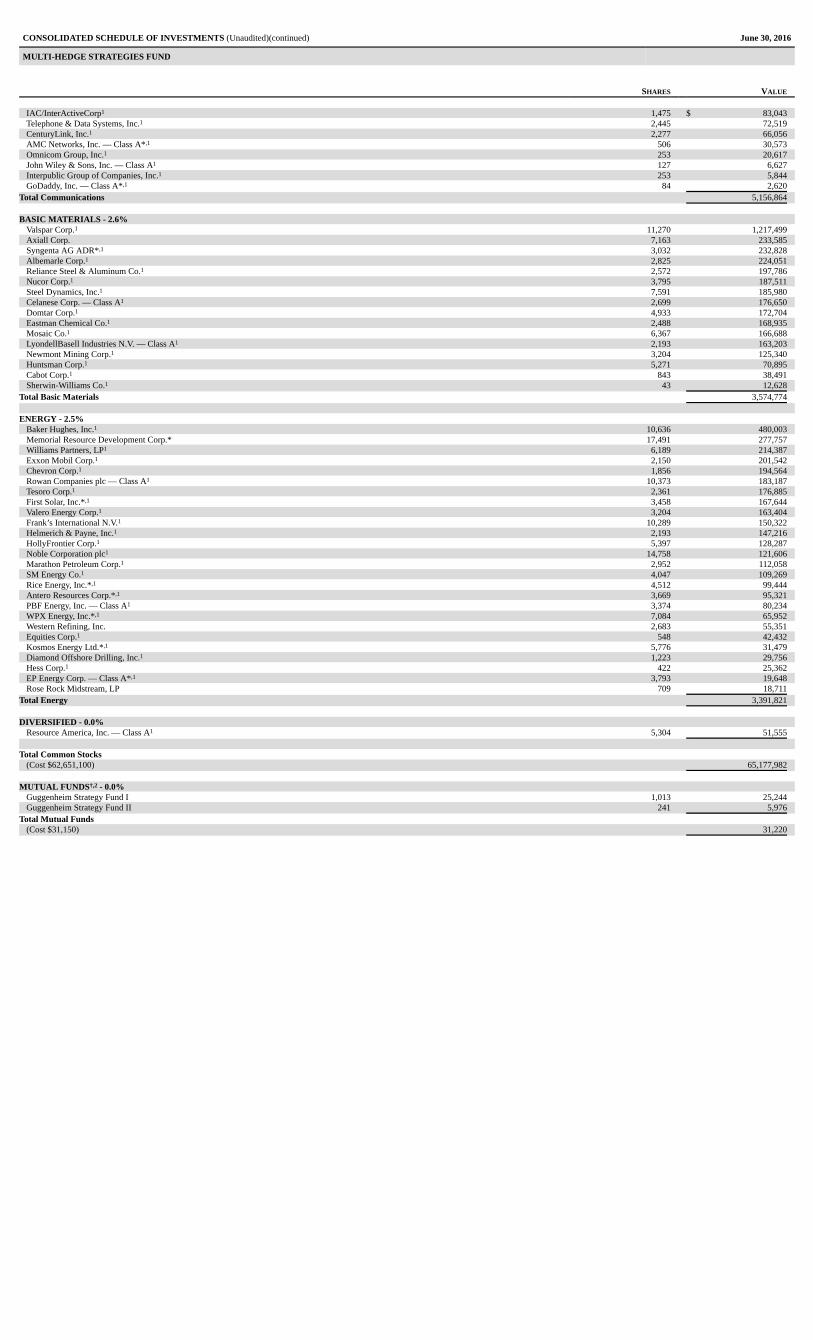
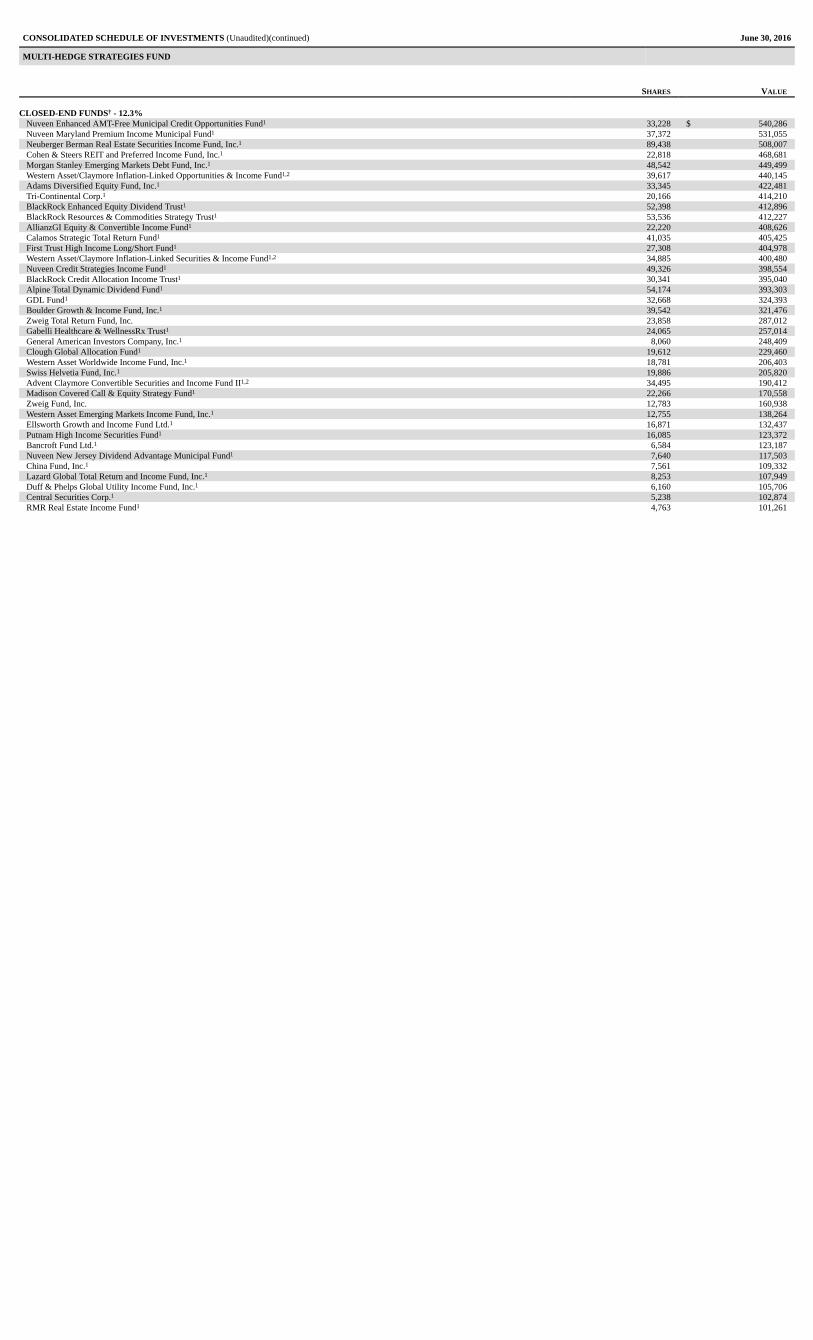
CONSOLIDATED SCHEDULE OF INVESTMENTS (Unaudited) June 30, 2016
MULTI-HEDGE STRATEGIES FUND
SHARES VALUE
COMMON STOCKS† - 47.8%
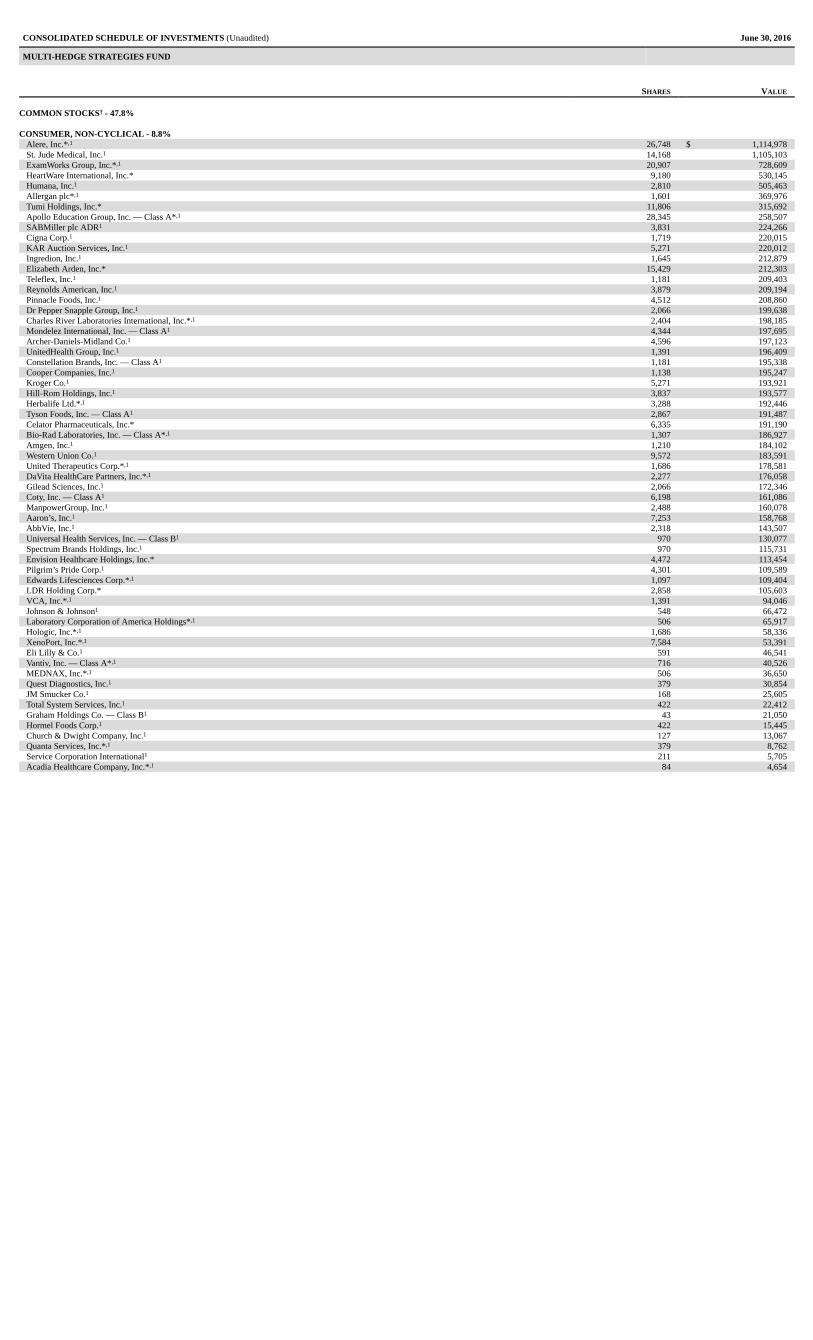
CONSUMER, NON-CYCLICAL - 8.8%Alere, Inc.*,1 26,748 $ 1,114,978St. Jude Medical, Inc.1 14,168 1,105,103ExamWorks Group, Inc.*,1 20,907 728,609HeartWare International, Inc.* 9,180 530,145Humana, Inc.1 2,810 505,463Allergan plc*,1 1,601 369,976Tumi Holdings, Inc.* 11,806 315,692Apollo Education Group, Inc. — Class A*,1 28,345 258,507SABMiller plc ADR1 3,831 224,266Cigna Corp.1 1,719 220,015KAR Auction Services, Inc.1 5,271 220,012Ingredion, Inc.1 1,645 212,879Elizabeth Arden, Inc.* 15,429 212,303Teleflex, Inc.1 1,181 209,403Reynolds American, Inc.1 3,879 209,194Pinnacle Foods, Inc.1 4,512 208,860Dr Pepper Snapple Group, Inc.1 2,066 199,638Charles River Laboratories International, Inc.*,1 2,404 198,185Mondelez International, Inc. — Class A1 4,344 197,695Archer-Daniels-Midland Co.1 4,596 197,123UnitedHealth Group, Inc.1 1,391 196,409Constellation Brands, Inc. — Class A1 1,181 195,338Cooper Companies, Inc.1 1,138 195,247Kroger Co.1 5,271 193,921Hill-Rom Holdings, Inc.1 3,837 193,577Herbalife Ltd.*,1 3,288 192,446Tyson Foods, Inc. — Class A1 2,867 191,487Celator Pharmaceuticals, Inc.* 6,335 191,190Bio-Rad Laboratories, Inc. — Class A*,1 1,307 186,927Amgen, Inc.1 1,210 184,102Western Union Co.1 9,572 183,591United Therapeutics Corp.*,1 1,686 178,581DaVita HealthCare Partners, Inc.*,1 2,277 176,058Gilead Sciences, Inc.1 2,066 172,346Coty, Inc. — Class A1 6,198 161,086ManpowerGroup, Inc.1 2,488 160,078Aaron’s, Inc.1 7,253 158,768AbbVie, Inc.1 2,318 143,507Universal Health Services, Inc. — Class B1 970 130,077Spectrum Brands Holdings, Inc.1 970 115,731Envision Healthcare Holdings, Inc.* 4,472 113,454Pilgrim’s Pride Corp.1 4,301 109,589Edwards Lifesciences Corp.*,1 1,097 109,404LDR Holding Corp.* 2,858 105,603VCA, Inc.*,1 1,391 94,046Johnson & Johnson1 548 66,472Laboratory Corporation of America Holdings*,1 506 65,917Hologic, Inc.*,1 1,686 58,336XenoPort, Inc.*,1 7,584 53,391Eli Lilly & Co.1 591 46,541Vantiv, Inc. — Class A*,1 716 40,526MEDNAX, Inc.*,1 506 36,650Quest Diagnostics, Inc.1 379 30,854JM Smucker Co.1 168 25,605Total System Services, Inc.1 422 22,412Graham Holdings Co. — Class B1 43 21,050Hormel Foods Corp.1 422 15,445Church & Dwight Company, Inc.1 127 13,067Quanta Services, Inc.*,1 379 8,762Service Corporation International1 211 5,705Acadia Healthcare Company, Inc.*,1 84 4,654
CONSOLIDATED SCHEDULE OF INVESTMENTS (Unaudited)(continued) June 30, 2016
MULTI-HEDGE STRATEGIES FUND
SHARES VALUE
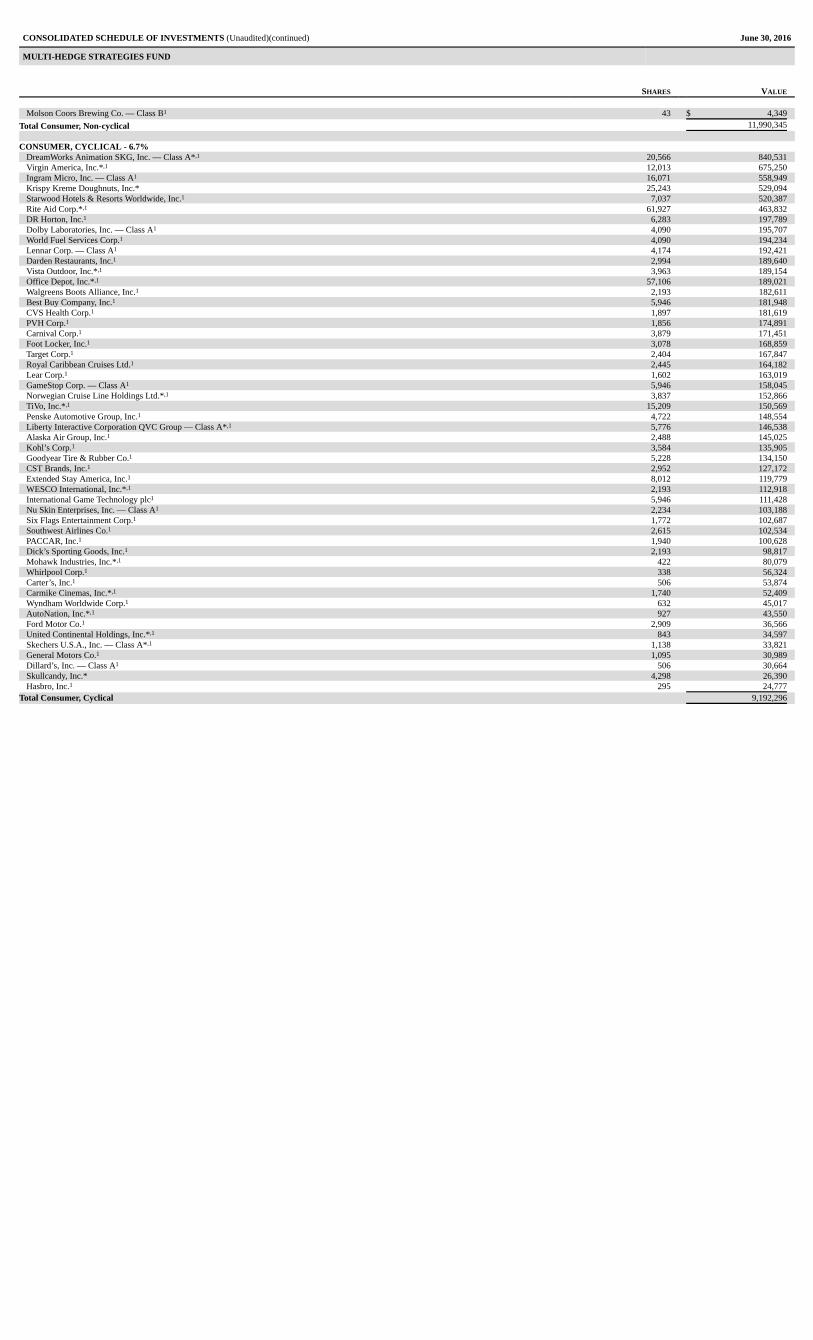
Molson Coors Brewing Co. — Class B1 43 $ 4,349
Total Consumer, Non-cyclical 11,990,345
CONSUMER, CYCLICAL - 6.7%DreamWorks Animation SKG, Inc. — Class A*,1 20,566 840,531Virgin America, Inc.*,1 12,013 675,250Ingram Micro, Inc. — Class A1 16,071 558,949Krispy Kreme Doughnuts, Inc.* 25,243 529,094Starwood Hotels & Resorts Worldwide, Inc.1 7,037 520,387Rite Aid Corp.*,1 61,927 463,832DR Horton, Inc.1 6,283 197,789Dolby Laboratories, Inc. — Class A1 4,090 195,707World Fuel Services Corp.1 4,090 194,234Lennar Corp. — Class A1 4,174 192,421Darden Restaurants, Inc.1 2,994 189,640Vista Outdoor, Inc.*,1 3,963 189,154Office Depot, Inc.*,1 57,106 189,021Walgreens Boots Alliance, Inc.1 2,193 182,611Best Buy Company, Inc.1 5,946 181,948CVS Health Corp.1 1,897 181,619PVH Corp.1 1,856 174,891Carnival Corp.1 3,879 171,451Foot Locker, Inc.1 3,078 168,859Target Corp.1 2,404 167,847Royal Caribbean Cruises Ltd.1 2,445 164,182Lear Corp.1 1,602 163,019GameStop Corp. — Class A1 5,946 158,045Norwegian Cruise Line Holdings Ltd.*,1 3,837 152,866TiVo, Inc.*,1 15,209 150,569Penske Automotive Group, Inc.1 4,722 148,554Liberty Interactive Corporation QVC Group — Class A*,1 5,776 146,538Alaska Air Group, Inc.1 2,488 145,025Kohl’s Corp.1 3,584 135,905Goodyear Tire & Rubber Co.1 5,228 134,150CST Brands, Inc.1 2,952 127,172Extended Stay America, Inc.1 8,012 119,779WESCO International, Inc.*,1 2,193 112,918International Game Technology plc1 5,946 111,428Nu Skin Enterprises, Inc. — Class A1 2,234 103,188Six Flags Entertainment Corp.1 1,772 102,687Southwest Airlines Co.1 2,615 102,534PACCAR, Inc.1 1,940 100,628Dick’s Sporting Goods, Inc.1 2,193 98,817Mohawk Industries, Inc.*,1 422 80,079Whirlpool Corp.1 338 56,324Carter’s, Inc.1 506 53,874Carmike Cinemas, Inc.*,1 1,740 52,409Wyndham Worldwide Corp.1 632 45,017AutoNation, Inc.*,1 927 43,550Ford Motor Co.1 2,909 36,566United Continental Holdings, Inc.*,1 843 34,597Skechers U.S.A., Inc. — Class A*,1 1,138 33,821General Motors Co.1 1,095 30,989Dillard’s, Inc. — Class A1 506 30,664Skullcandy, Inc.* 4,298 26,390Hasbro, Inc.1 295 24,777
Total Consumer, Cyclical 9,192,296
CONSOLIDATED SCHEDULE OF INVESTMENTS (Unaudited)(continued) June 30, 2016
MULTI-HEDGE STRATEGIES FUND
SHARES VALUE
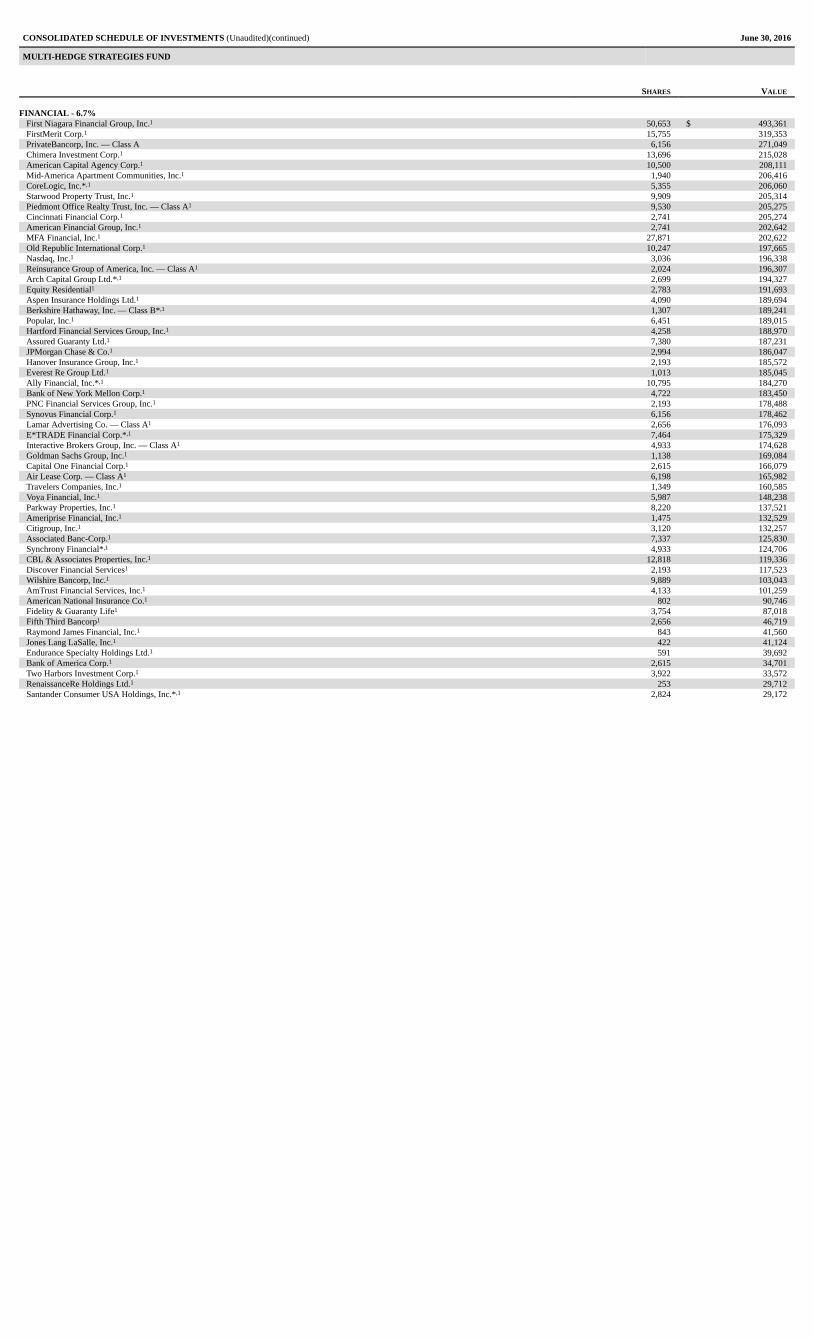
FINANCIAL - 6.7%First Niagara Financial Group, Inc.1 50,653 $ 493,361FirstMerit Corp.1 15,755 319,353PrivateBancorp, Inc. — Class A 6,156 271,049Chimera Investment Corp.1 13,696 215,028American Capital Agency Corp.1 10,500 208,111Mid-America Apartment Communities, Inc.1 1,940 206,416CoreLogic, Inc.*,1 5,355 206,060Starwood Property Trust, Inc.1 9,909 205,314Piedmont Office Realty Trust, Inc. — Class A1 9,530 205,275Cincinnati Financial Corp.1 2,741 205,274American Financial Group, Inc.1 2,741 202,642MFA Financial, Inc.1 27,871 202,622Old Republic International Corp.1 10,247 197,665Nasdaq, Inc.1 3,036 196,338Reinsurance Group of America, Inc. — Class A1 2,024 196,307Arch Capital Group Ltd.*,1 2,699 194,327Equity Residential1 2,783 191,693Aspen Insurance Holdings Ltd.1 4,090 189,694Berkshire Hathaway, Inc. — Class B*,1 1,307 189,241Popular, Inc.1 6,451 189,015Hartford Financial Services Group, Inc.1 4,258 188,970Assured Guaranty Ltd.1 7,380 187,231JPMorgan Chase & Co.1 2,994 186,047Hanover Insurance Group, Inc.1 2,193 185,572Everest Re Group Ltd.1 1,013 185,045Ally Financial, Inc.*,1 10,795 184,270Bank of New York Mellon Corp.1 4,722 183,450PNC Financial Services Group, Inc.1 2,193 178,488Synovus Financial Corp.1 6,156 178,462Lamar Advertising Co. — Class A1 2,656 176,093E*TRADE Financial Corp.*,1 7,464 175,329Interactive Brokers Group, Inc. — Class A1 4,933 174,628Goldman Sachs Group, Inc.1 1,138 169,084Capital One Financial Corp.1 2,615 166,079Air Lease Corp. — Class A1 6,198 165,982Travelers Companies, Inc.1 1,349 160,585Voya Financial, Inc.1 5,987 148,238Parkway Properties, Inc.1 8,220 137,521Ameriprise Financial, Inc.1 1,475 132,529Citigroup, Inc.1 3,120 132,257Associated Banc-Corp.1 7,337 125,830Synchrony Financial*,1 4,933 124,706CBL & Associates Properties, Inc.1 12,818 119,336Discover Financial Services1 2,193 117,523Wilshire Bancorp, Inc.1 9,889 103,043AmTrust Financial Services, Inc.1 4,133 101,259American National Insurance Co.1 802 90,746Fidelity & Guaranty Life1 3,754 87,018Fifth Third Bancorp1 2,656 46,719Raymond James Financial, Inc.1 843 41,560Jones Lang LaSalle, Inc.1 422 41,124Endurance Specialty Holdings Ltd.1 591 39,692Bank of America Corp.1 2,615 34,701Two Harbors Investment Corp.1 3,922 33,572RenaissanceRe Holdings Ltd.1 253 29,712Santander Consumer USA Holdings, Inc.*,1 2,824 29,172
CONSOLIDATED SCHEDULE OF INVESTMENTS (Unaudited)(continued) June 30, 2016
MULTI-HEDGE STRATEGIES FUND
SHARES VALUE
CIT Group, Inc.1 800 $ 25,528Credit Acceptance Corp.*,1 84 15,547Kimco Realty Corp.1 380 11,924Morgan Stanley1 422 10,964CME Group, Inc. — Class A1 43 4,188Lincoln National Corp.1 43 1,667People’s United Financial, Inc.1 43 630
Total Financial 9,116,806
TECHNOLOGY - 6.2%EMC Corp.1 46,802 1,271,610Demandware, Inc.* 9,770 731,773Fairchild Semiconductor International, Inc. — Class A*,1 33,730 669,540inContact, Inc.*,1 38,074 527,325KLA-Tencor Corp.1 5,004 366,543Lexmark International, Inc. — Class A 7,038 265,685Cvent, Inc.* 7,402 264,399Xura, Inc.*,1 10,754 262,720NVIDIA Corp.1 5,355 251,739Activision Blizzard, Inc.1 5,565 220,541CA, Inc.1 6,494 213,198Synopsys, Inc.*,1 3,922 212,102Fidelity National Information Services, Inc.1 2,867 211,241Intel Corp.1 6,325 207,460Cadence Design Systems, Inc.*,1 8,180 198,774Oracle Corp.1 4,765 195,031Amdocs Ltd.1 3,374 194,748SciQuest, Inc.* 10,820 191,081Electronic Arts, Inc.*,1 2,488 188,491DST Systems, Inc.1 1,561 181,747Allscripts Healthcare Solutions, Inc.*,1 14,253 181,013Nuance Communications, Inc.*,1 11,259 175,978ON Semiconductor Corp.*,1 19,902 175,536Apple, Inc.1 1,813 173,322Microsoft Corp.1 3,204 163,949Leidos Holdings, Inc.1 2,531 121,159Broadridge Financial Solutions, Inc.1 1,856 121,011Teradyne, Inc.1 4,849 95,477Xerox Corp.1 9,445 89,633Western Digital Corp.1 1,580 74,661Akamai Technologies, Inc.*,1 1,181 66,054Citrix Systems, Inc.*,1 675 54,061SS&C Technologies Holdings, Inc.1 1,854 52,060Pitney Bowes, Inc.1 2,615 46,547Genpact Ltd.*,1 1,518 40,743HP, Inc.1 843 10,580Dun & Bradstreet Corp.1 43 5,239
Total Technology 8,472,771
INDUSTRIAL - 5.3%FEI Co. 9,866 1,054,479Rofin-Sinar Technologies, Inc.*,1 12,860 410,748Huntington Ingalls Industries, Inc.1 1,307 219,615Jacobs Engineering Group, Inc.*,1 4,258 212,091Owens Corning1 4,090 210,717L-3 Communications Holdings, Inc.1 1,434 210,353Corning, Inc.1 10,247 209,859Republic Services, Inc. — Class A1 4,047 207,651Arrow Electronics, Inc.*,1 3,247 200,989Northrop Grumman Corp.1 886 196,939Sonoco Products Co.1 3,922 194,766Avnet, Inc.1 4,765 193,030AMERCO1 506 189,522Stanley Black & Decker, Inc.1 1,686 187,517Trinity Industries, Inc.1 10,036 186,369Deere & Co.1 2,277 184,528CSX Corp.1 7,042 183,656
CONSOLIDATED SCHEDULE OF INVESTMENTS (Unaudited)(continued) June 30, 2016
MULTI-HEDGE STRATEGIES FUND
SHARES VALUE
GATX Corp.1 4,174 $ 183,531Manitowoc Company, Inc.1 33,396 182,008Eaton Corporation plc1 3,036 181,340Crown Holdings, Inc.*,1 3,542 179,473Spirit AeroSystems Holdings, Inc. — Class A*,1 4,047 174,021AGCO Corp.1 3,584 168,914Jabil Circuit, Inc.1 8,475 156,533Carlisle Companies, Inc.1 1,475 155,878Ryder System, Inc.1 2,445 149,487AECOM*,1 4,428 140,678Masco Corp.1 4,470 138,302FedEx Corp.1 887 134,629ITT, Inc.1 3,795 121,364Multi-Fineline Electronix, Inc.*,1 5,136 119,155Regal Beloit Corp.1 1,856 102,173Oshkosh Corp.1 2,024 96,565Waste Management, Inc.1 1,307 86,615Bemis Company, Inc.1 1,391 71,623Kirby Corp.*,1 1,097 68,442Snap-on, Inc.1 338 53,343Caterpillar, Inc.1 675 51,172PerkinElmer, Inc.1 295 15,464Textron, Inc.1 211 7,714FLIR Systems, Inc.1 211 6,530Teekay Corp.1 253 1,804
Total Industrial 7,199,587
UTILITIES – 5.2%Piedmont Natural Gas Company, Inc.1 22,851 1,373,803AGL Resources, Inc.1 15,753 1,039,225Questar Corp.1 33,692 854,766Empire District Electric Co.1 17,310 588,020Talen Energy Corp.* 27,372 370,891NiSource, Inc.1 8,391 222,529Ameren Corp.1 4,006 214,641Atmos Energy Corp.1 2,615 212,652Pinnacle West Capital Corp.1 2,615 211,972Xcel Energy, Inc.1 4,722 211,451American Electric Power Company, Inc.1 2,994 209,849SCANA Corp.1 2,741 207,384Consolidated Edison, Inc.1 2,531 203,594UGI Corp.1 4,344 196,566Public Service Enterprise Group, Inc.1 4,174 194,550Edison International1 2,488 193,243Great Plains Energy, Inc.1 6,114 185,866AES Corp.1 14,253 177,877Exelon Corp.1 4,301 156,384FirstEnergy Corp.1 169 5,900
Total Utilities 7,031,163
COMMUNICATIONS - 3.8%LinkedIn Corp. — Class A* 8,682 1,643,070Starz — Class A* 10,161 304,017AT&T, Inc.1 4,892 211,383Symantec Corp.1 10,120 207,865Comcast Corp. — Class A1 3,120 203,393Cisco Systems, Inc.1 7,042 202,035Qihoo 360 Technology Company Ltd. ADR*,1 2,760 201,618TEGNA, Inc.1 8,223 190,526Thomson Reuters Corp.1 4,638 187,468VeriSign, Inc.*,1 2,150 185,889eBay, Inc.*,1 7,927 185,571Juniper Networks, Inc.1 8,223 184,935Walt Disney Co.1 1,729 169,131Expedia, Inc.1 1,475 156,793United States Cellular Corp.*,1 2,699 105,990Liberty SiriusXM Group — Class A*,1 2,909 91,226Liberty SiriusXM Group — Class C*,1 2,952 91,128Alphabet, Inc. — Class A*,1 127 89,348Alphabet, Inc. — Class C*,1 127 87,897Scripps Networks Interactive, Inc. — Class A1 1,391 86,618ARRIS International plc*,1 3,963 83,064
CONSOLIDATED SCHEDULE OF INVESTMENTS (Unaudited)(continued) June 30, 2016
MULTI-HEDGE STRATEGIES FUND
SHARES VALUE
IAC/InterActiveCorp1 1,475 $ 83,043Telephone & Data Systems, Inc.1 2,445 72,519CenturyLink, Inc.1 2,277 66,056AMC Networks, Inc. — Class A*,1 506 30,573Omnicom Group, Inc.1 253 20,617John Wiley & Sons, Inc. — Class A1 127 6,627Interpublic Group of Companies, Inc.1 253 5,844GoDaddy, Inc. — Class A*,1 84 2,620
Total Communications 5,156,864
BASIC MATERIALS - 2.6%Valspar Corp.1 11,270 1,217,499Axiall Corp. 7,163 233,585Syngenta AG ADR*,1 3,032 232,828Albemarle Corp.1 2,825 224,051Reliance Steel & Aluminum Co.1 2,572 197,786Nucor Corp.1 3,795 187,511Steel Dynamics, Inc.1 7,591 185,980Celanese Corp. — Class A1 2,699 176,650Domtar Corp.1 4,933 172,704Eastman Chemical Co.1 2,488 168,935Mosaic Co.1 6,367 166,688LyondellBasell Industries N.V. — Class A1 2,193 163,203Newmont Mining Corp.1 3,204 125,340Huntsman Corp.1 5,271 70,895Cabot Corp.1 843 38,491Sherwin-Williams Co.1 43 12,628
Total Basic Materials 3,574,774
ENERGY - 2.5%Baker Hughes, Inc.1 10,636 480,003Memorial Resource Development Corp.* 17,491 277,757Williams Partners, LP1 6,189 214,387Exxon Mobil Corp.1 2,150 201,542Chevron Corp.1 1,856 194,564Rowan Companies plc — Class A1 10,373 183,187Tesoro Corp.1 2,361 176,885First Solar, Inc.*,1 3,458 167,644Valero Energy Corp.1 3,204 163,404Frank’s International N.V.1 10,289 150,322Helmerich & Payne, Inc.1 2,193 147,216HollyFrontier Corp.1 5,397 128,287Noble Corporation plc1 14,758 121,606Marathon Petroleum Corp.1 2,952 112,058SM Energy Co.1 4,047 109,269Rice Energy, Inc.*,1 4,512 99,444Antero Resources Corp.*,1 3,669 95,321PBF Energy, Inc. — Class A1 3,374 80,234WPX Energy, Inc.*,1 7,084 65,952Western Refining, Inc. 2,683 55,351Equities Corp.1 548 42,432Kosmos Energy Ltd.*,1 5,776 31,479Diamond Offshore Drilling, Inc.1 1,223 29,756Hess Corp.1 422 25,362EP Energy Corp. — Class A*,1 3,793 19,648Rose Rock Midstream, LP 709 18,711
Total Energy 3,391,821
DIVERSIFIED - 0.0%Resource America, Inc. — Class A1 5,304 51,555
Total Common Stocks(Cost $62,651,100) 65,177,982
MUTUAL FUNDS†,2 - 0.0%Guggenheim Strategy Fund I 1,013 25,244Guggenheim Strategy Fund II 241 5,976
Total Mutual Funds(Cost $31,150) 31,220
CONSOLIDATED SCHEDULE OF INVESTMENTS (Unaudited)(continued) June 30, 2016
MULTI-HEDGE STRATEGIES FUND
SHARES VALUE
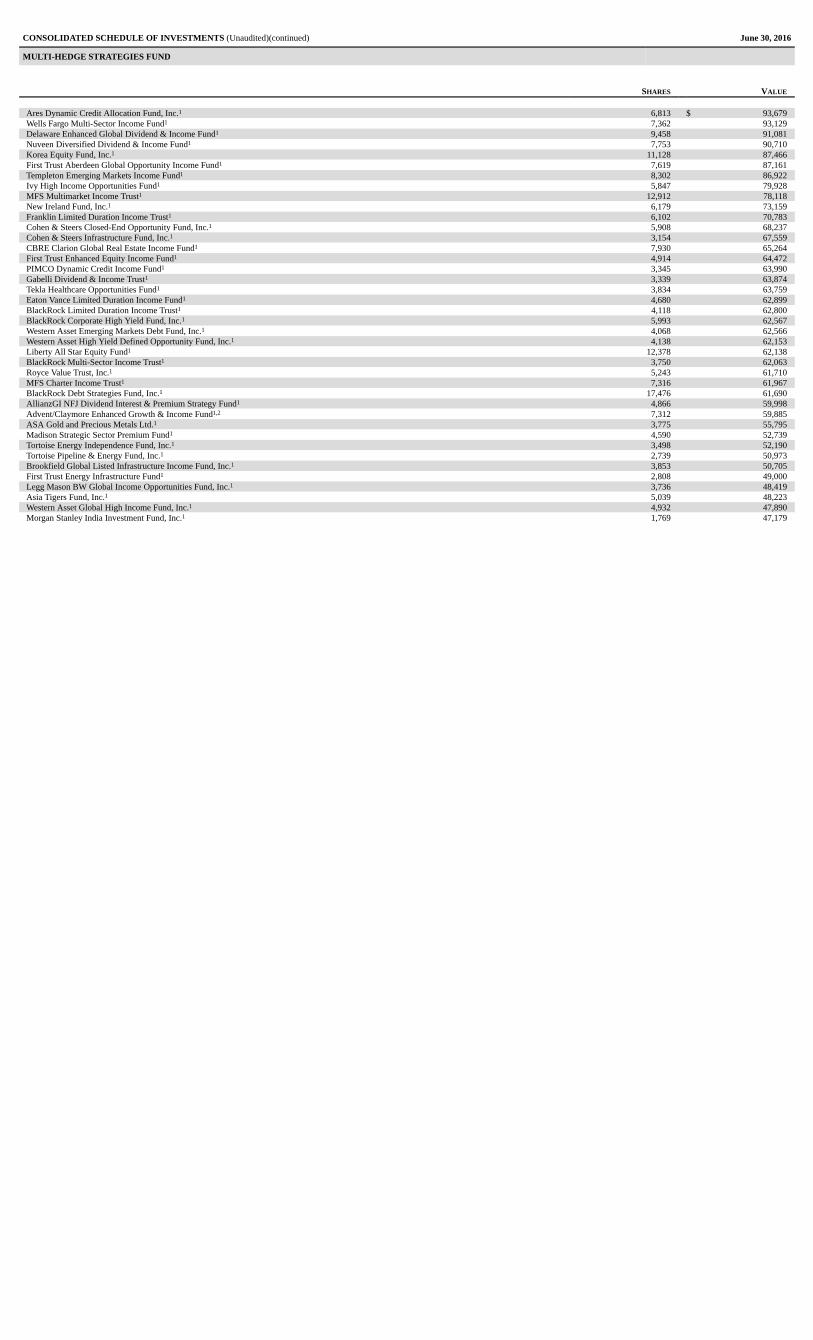
CLOSED-END FUNDS† - 12.3%Nuveen Enhanced AMT-Free Municipal Credit Opportunities Fund1 33,228 $ 540,286Nuveen Maryland Premium Income Municipal Fund1 37,372 531,055Neuberger Berman Real Estate Securities Income Fund, Inc.1 89,438 508,007Cohen & Steers REIT and Preferred Income Fund, Inc.1 22,818 468,681Morgan Stanley Emerging Markets Debt Fund, Inc.1 48,542 449,499Western Asset/Claymore Inflation-Linked Opportunities & Income Fund1,2 39,617 440,145Adams Diversified Equity Fund, Inc.1 33,345 422,481Tri-Continental Corp.1 20,166 414,210BlackRock Enhanced Equity Dividend Trust1 52,398 412,896BlackRock Resources & Commodities Strategy Trust1 53,536 412,227AllianzGI Equity & Convertible Income Fund1 22,220 408,626Calamos Strategic Total Return Fund1 41,035 405,425First Trust High Income Long/Short Fund1 27,308 404,978Western Asset/Claymore Inflation-Linked Securities & Income Fund1,2 34,885 400,480Nuveen Credit Strategies Income Fund1 49,326 398,554BlackRock Credit Allocation Income Trust1 30,341 395,040Alpine Total Dynamic Dividend Fund1 54,174 393,303GDL Fund1 32,668 324,393Boulder Growth & Income Fund, Inc.1 39,542 321,476Zweig Total Return Fund, Inc. 23,858 287,012Gabelli Healthcare & WellnessRx Trust1 24,065 257,014General American Investors Company, Inc.1 8,060 248,409Clough Global Allocation Fund1 19,612 229,460Western Asset Worldwide Income Fund, Inc.1 18,781 206,403Swiss Helvetia Fund, Inc.1 19,886 205,820Advent Claymore Convertible Securities and Income Fund II1,2 34,495 190,412Madison Covered Call & Equity Strategy Fund1 22,266 170,558Zweig Fund, Inc. 12,783 160,938Western Asset Emerging Markets Income Fund, Inc.1 12,755 138,264Ellsworth Growth and Income Fund Ltd.1 16,871 132,437Putnam High Income Securities Fund1 16,085 123,372Bancroft Fund Ltd.1 6,584 123,187Nuveen New Jersey Dividend Advantage Municipal Fund1 7,640 117,503China Fund, Inc.1 7,561 109,332Lazard Global Total Return and Income Fund, Inc.1 8,253 107,949Duff & Phelps Global Utility Income Fund, Inc.1 6,160 105,706Central Securities Corp.1 5,238 102,874RMR Real Estate Income Fund1 4,763 101,261
CONSOLIDATED SCHEDULE OF INVESTMENTS (Unaudited)(continued) June 30, 2016
MULTI-HEDGE STRATEGIES FUND
SHARES VALUE
Ares Dynamic Credit Allocation Fund, Inc.1 6,813 $ 93,679Wells Fargo Multi-Sector Income Fund1 7,362 93,129Delaware Enhanced Global Dividend & Income Fund1 9,458 91,081Nuveen Diversified Dividend & Income Fund1 7,753 90,710Korea Equity Fund, Inc.1 11,128 87,466First Trust Aberdeen Global Opportunity Income Fund1 7,619 87,161Templeton Emerging Markets Income Fund1 8,302 86,922Ivy High Income Opportunities Fund1 5,847 79,928MFS Multimarket Income Trust1 12,912 78,118New Ireland Fund, Inc.1 6,179 73,159Franklin Limited Duration Income Trust1 6,102 70,783Cohen & Steers Closed-End Opportunity Fund, Inc.1 5,908 68,237Cohen & Steers Infrastructure Fund, Inc.1 3,154 67,559CBRE Clarion Global Real Estate Income Fund1 7,930 65,264First Trust Enhanced Equity Income Fund1 4,914 64,472PIMCO Dynamic Credit Income Fund1 3,345 63,990Gabelli Dividend & Income Trust1 3,339 63,874Tekla Healthcare Opportunities Fund1 3,834 63,759Eaton Vance Limited Duration Income Fund1 4,680 62,899BlackRock Limited Duration Income Trust1 4,118 62,800BlackRock Corporate High Yield Fund, Inc.1 5,993 62,567Western Asset Emerging Markets Debt Fund, Inc.1 4,068 62,566Western Asset High Yield Defined Opportunity Fund, Inc.1 4,138 62,153Liberty All Star Equity Fund1 12,378 62,138BlackRock Multi-Sector Income Trust1 3,750 62,063Royce Value Trust, Inc.1 5,243 61,710MFS Charter Income Trust1 7,316 61,967BlackRock Debt Strategies Fund, Inc.1 17,476 61,690AllianzGI NFJ Dividend Interest & Premium Strategy Fund1 4,866 59,998Advent/Claymore Enhanced Growth & Income Fund1,2 7,312 59,885ASA Gold and Precious Metals Ltd.1 3,775 55,795Madison Strategic Sector Premium Fund1 4,590 52,739Tortoise Energy Independence Fund, Inc.1 3,498 52,190Tortoise Pipeline & Energy Fund, Inc.1 2,739 50,973Brookfield Global Listed Infrastructure Income Fund, Inc.1 3,853 50,705First Trust Energy Infrastructure Fund1 2,808 49,000Legg Mason BW Global Income Opportunities Fund, Inc.1 3,736 48,419Asia Tigers Fund, Inc.1 5,039 48,223Western Asset Global High Income Fund, Inc.1 4,932 47,890Morgan Stanley India Investment Fund, Inc.1 1,769 47,179
CONSOLIDATED SCHEDULE OF INVESTMENTS (Unaudited)(continued) June 30, 2016
MULTI-HEDGE STRATEGIES FUND
SHARES VALUE
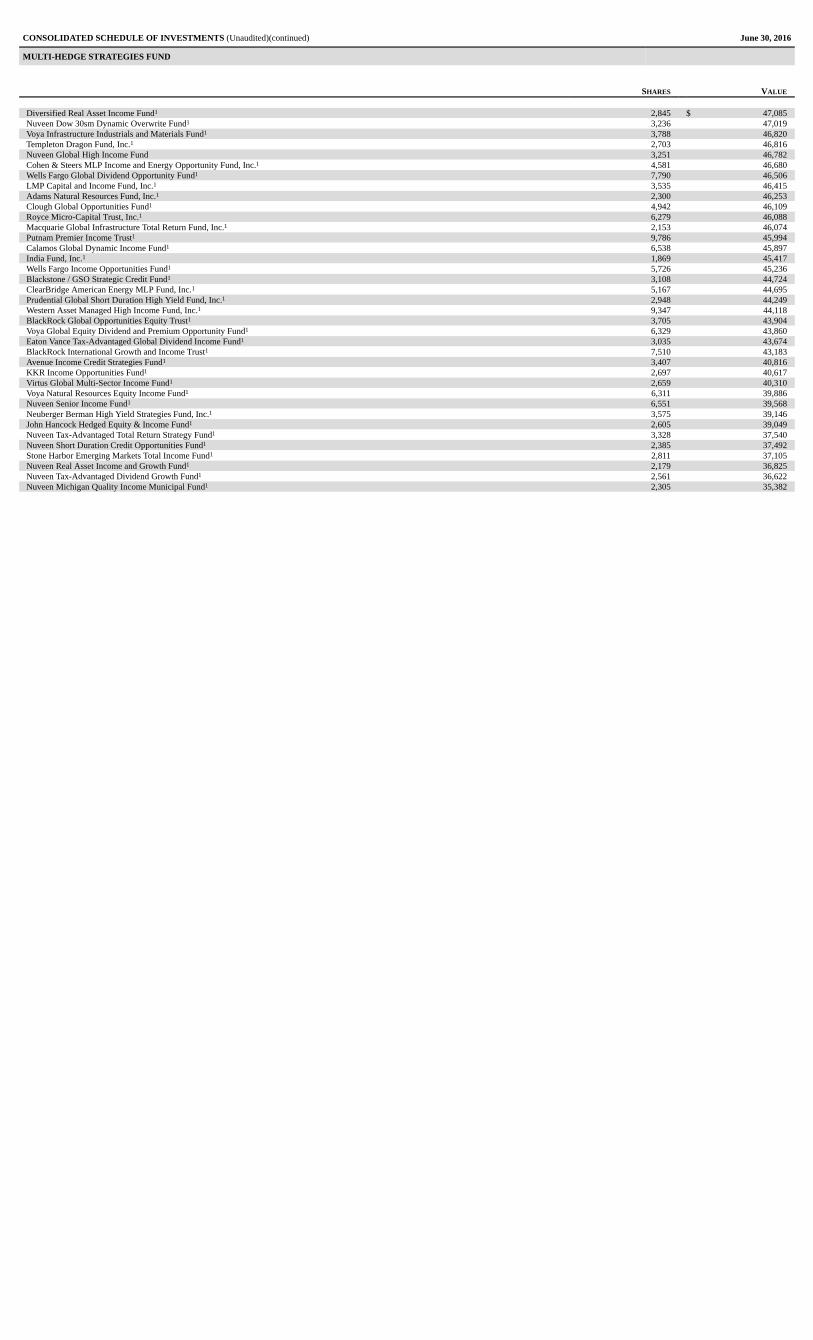
Diversified Real Asset Income Fund1 2,845 $ 47,085Nuveen Dow 30sm Dynamic Overwrite Fund1 3,236 47,019Voya Infrastructure Industrials and Materials Fund1 3,788 46,820Templeton Dragon Fund, Inc.1 2,703 46,816Nuveen Global High Income Fund 3,251 46,782Cohen & Steers MLP Income and Energy Opportunity Fund, Inc.1 4,581 46,680Wells Fargo Global Dividend Opportunity Fund1 7,790 46,506LMP Capital and Income Fund, Inc.1 3,535 46,415Adams Natural Resources Fund, Inc.1 2,300 46,253Clough Global Opportunities Fund1 4,942 46,109Royce Micro-Capital Trust, Inc.1 6,279 46,088Macquarie Global Infrastructure Total Return Fund, Inc.1 2,153 46,074Putnam Premier Income Trust1 9,786 45,994Calamos Global Dynamic Income Fund1 6,538 45,897India Fund, Inc.1 1,869 45,417Wells Fargo Income Opportunities Fund1 5,726 45,236Blackstone / GSO Strategic Credit Fund1 3,108 44,724ClearBridge American Energy MLP Fund, Inc.1 5,167 44,695Prudential Global Short Duration High Yield Fund, Inc.1 2,948 44,249Western Asset Managed High Income Fund, Inc.1 9,347 44,118BlackRock Global Opportunities Equity Trust1 3,705 43,904Voya Global Equity Dividend and Premium Opportunity Fund1 6,329 43,860Eaton Vance Tax-Advantaged Global Dividend Income Fund1 3,035 43,674BlackRock International Growth and Income Trust1 7,510 43,183Avenue Income Credit Strategies Fund1 3,407 40,816KKR Income Opportunities Fund1 2,697 40,617Virtus Global Multi-Sector Income Fund1 2,659 40,310Voya Natural Resources Equity Income Fund1 6,311 39,886Nuveen Senior Income Fund1 6,551 39,568Neuberger Berman High Yield Strategies Fund, Inc.1 3,575 39,146John Hancock Hedged Equity & Income Fund1 2,605 39,049Nuveen Tax-Advantaged Total Return Strategy Fund1 3,328 37,540Nuveen Short Duration Credit Opportunities Fund1 2,385 37,492Stone Harbor Emerging Markets Total Income Fund1 2,811 37,105Nuveen Real Asset Income and Growth Fund1 2,179 36,825Nuveen Tax-Advantaged Dividend Growth Fund1 2,561 36,622Nuveen Michigan Quality Income Municipal Fund1 2,305 35,382
CONSOLIDATED SCHEDULE OF INVESTMENTS (Unaudited)(continued) June 30, 2016
MULTI-HEDGE STRATEGIES FUND
SHARES VALUE
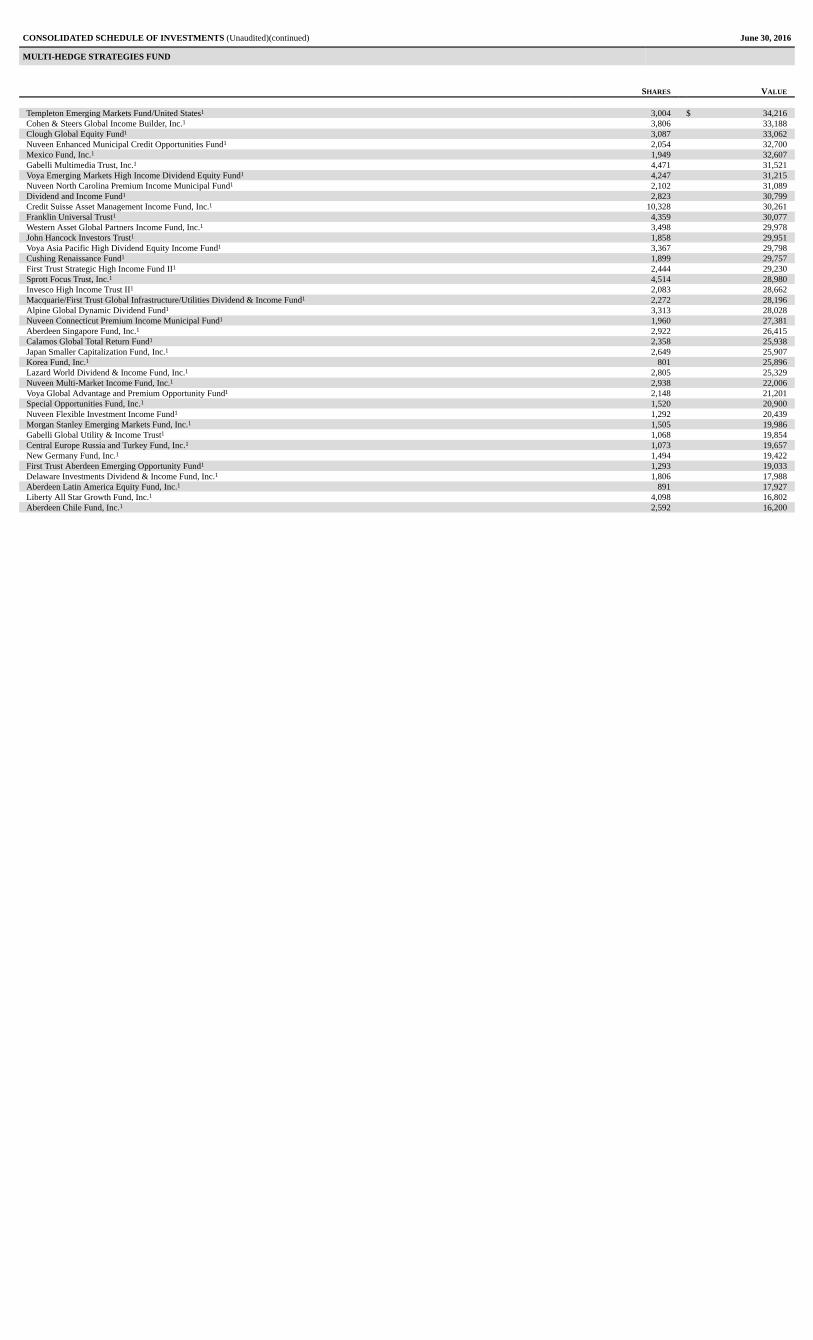
Templeton Emerging Markets Fund/United States1 3,004 $ 34,216Cohen & Steers Global Income Builder, Inc.1 3,806 33,188Clough Global Equity Fund1 3,087 33,062Nuveen Enhanced Municipal Credit Opportunities Fund1 2,054 32,700Mexico Fund, Inc.1 1,949 32,607Gabelli Multimedia Trust, Inc.1 4,471 31,521Voya Emerging Markets High Income Dividend Equity Fund1 4,247 31,215Nuveen North Carolina Premium Income Municipal Fund1 2,102 31,089Dividend and Income Fund1 2,823 30,799Credit Suisse Asset Management Income Fund, Inc.1 10,328 30,261Franklin Universal Trust1 4,359 30,077Western Asset Global Partners Income Fund, Inc.1 3,498 29,978John Hancock Investors Trust1 1,858 29,951Voya Asia Pacific High Dividend Equity Income Fund1 3,367 29,798Cushing Renaissance Fund1 1,899 29,757First Trust Strategic High Income Fund II1 2,444 29,230Sprott Focus Trust, Inc.1 4,514 28,980Invesco High Income Trust II1 2,083 28,662Macquarie/First Trust Global Infrastructure/Utilities Dividend & Income Fund1 2,272 28,196Alpine Global Dynamic Dividend Fund1 3,313 28,028Nuveen Connecticut Premium Income Municipal Fund1 1,960 27,381Aberdeen Singapore Fund, Inc.1 2,922 26,415Calamos Global Total Return Fund1 2,358 25,938Japan Smaller Capitalization Fund, Inc.1 2,649 25,907Korea Fund, Inc.1 801 25,896Lazard World Dividend & Income Fund, Inc.1 2,805 25,329Nuveen Multi-Market Income Fund, Inc.1 2,938 22,006Voya Global Advantage and Premium Opportunity Fund1 2,148 21,201Special Opportunities Fund, Inc.1 1,520 20,900Nuveen Flexible Investment Income Fund1 1,292 20,439Morgan Stanley Emerging Markets Fund, Inc.1 1,505 19,986Gabelli Global Utility & Income Trust1 1,068 19,854Central Europe Russia and Turkey Fund, Inc.1 1,073 19,657New Germany Fund, Inc.1 1,494 19,422First Trust Aberdeen Emerging Opportunity Fund1 1,293 19,033Delaware Investments Dividend & Income Fund, Inc.1 1,806 17,988Aberdeen Latin America Equity Fund, Inc.1 891 17,927Liberty All Star Growth Fund, Inc.1 4,098 16,802Aberdeen Chile Fund, Inc.1 2,592 16,200
CONSOLIDATED SCHEDULE OF INVESTMENTS (Unaudited)(continued) June 30, 2016
MULTI-HEDGE STRATEGIES FUND
SHARES VALUE
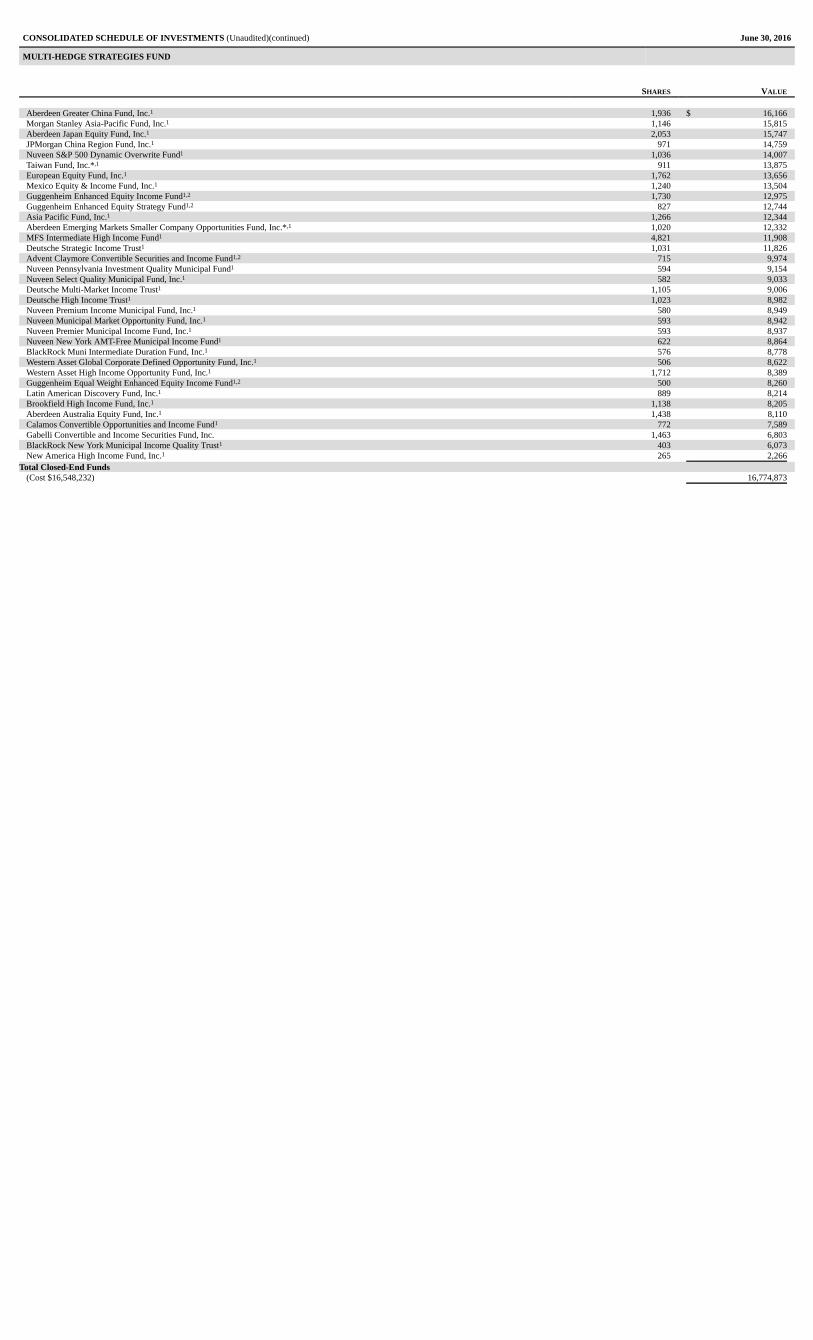
Aberdeen Greater China Fund, Inc.1 1,936 $ 16,166Morgan Stanley Asia-Pacific Fund, Inc.1 1,146 15,815Aberdeen Japan Equity Fund, Inc.1 2,053 15,747JPMorgan China Region Fund, Inc.1 971 14,759Nuveen S&P 500 Dynamic Overwrite Fund1 1,036 14,007Taiwan Fund, Inc.*,1 911 13,875European Equity Fund, Inc.1 1,762 13,656Mexico Equity & Income Fund, Inc.1 1,240 13,504Guggenheim Enhanced Equity Income Fund1,2 1,730 12,975Guggenheim Enhanced Equity Strategy Fund1,2 827 12,744Asia Pacific Fund, Inc.1 1,266 12,344Aberdeen Emerging Markets Smaller Company Opportunities Fund, Inc.*,1 1,020 12,332MFS Intermediate High Income Fund1 4,821 11,908Deutsche Strategic Income Trust1 1,031 11,826Advent Claymore Convertible Securities and Income Fund1,2 715 9,974Nuveen Pennsylvania Investment Quality Municipal Fund1 594 9,154Nuveen Select Quality Municipal Fund, Inc.1 582 9,033Deutsche Multi-Market Income Trust1 1,105 9,006Deutsche High Income Trust1 1,023 8,982Nuveen Premium Income Municipal Fund, Inc.1 580 8,949Nuveen Municipal Market Opportunity Fund, Inc.1 593 8,942Nuveen Premier Municipal Income Fund, Inc.1 593 8,937Nuveen New York AMT-Free Municipal Income Fund1 622 8,864BlackRock Muni Intermediate Duration Fund, Inc.1 576 8,778Western Asset Global Corporate Defined Opportunity Fund, Inc.1 506 8,622Western Asset High Income Opportunity Fund, Inc.1 1,712 8,389Guggenheim Equal Weight Enhanced Equity Income Fund1,2 500 8,260Latin American Discovery Fund, Inc.1 889 8,214Brookfield High Income Fund, Inc.1 1,138 8,205Aberdeen Australia Equity Fund, Inc.1 1,438 8,110Calamos Convertible Opportunities and Income Fund1 772 7,589Gabelli Convertible and Income Securities Fund, Inc. 1,463 6,803BlackRock New York Municipal Income Quality Trust1 403 6,073New America High Income Fund, Inc.1 265 2,266
Total Closed-End Funds(Cost $16,548,232) 16,774,873
CONSOLIDATED SCHEDULE OF INVESTMENTS (Unaudited)(continued) June 30, 2016
MULTI-HEDGE STRATEGIES FUND
FACE
AMOUNT VALUE
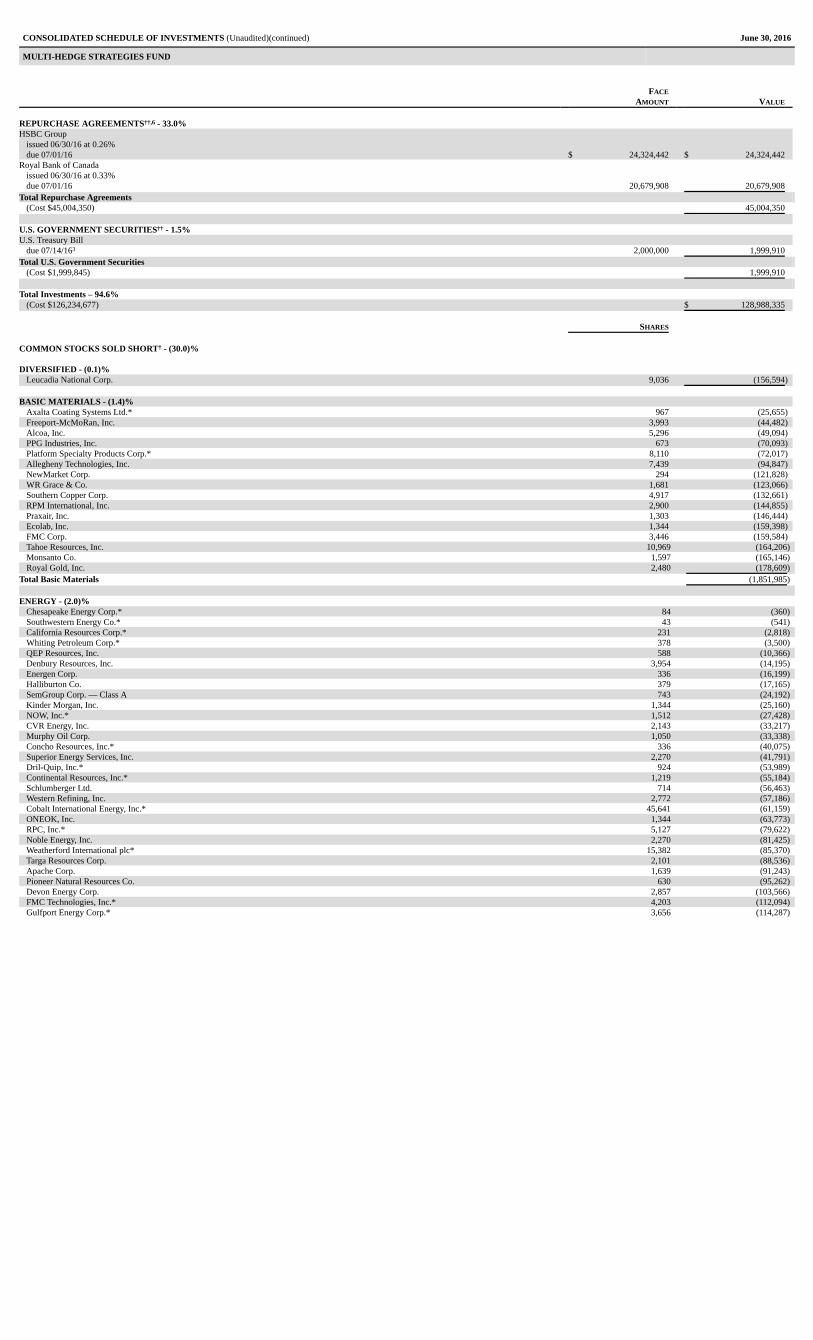
REPURCHASE AGREEMENTS††,6 - 33.0%HSBC Group
issued 06/30/16 at 0.26%due 07/01/16 $ 24,324,442 $ 24,324,442
Royal Bank of Canadaissued 06/30/16 at 0.33%due 07/01/16 20,679,908 20,679,908
Total Repurchase Agreements(Cost $45,004,350) 45,004,350
U.S. GOVERNMENT SECURITIES†† - 1.5%U.S. Treasury Bill
due 07/14/163 2,000,000 1,999,910Total U.S. Government Securities
(Cost $1,999,845) 1,999,910
Total Investments – 94.6%(Cost $126,234,677) $ 128,988,335
SHARES
COMMON STOCKS SOLD SHORT† - (30.0)%
DIVERSIFIED - (0.1)%Leucadia National Corp. 9,036 (156,594)
BASIC MATERIALS - (1.4)%Axalta Coating Systems Ltd.* 967 (25,655)Freeport-McMoRan, Inc. 3,993 (44,482)Alcoa, Inc. 5,296 (49,094)PPG Industries, Inc. 673 (70,093)Platform Specialty Products Corp.* 8,110 (72,017)Allegheny Technologies, Inc. 7,439 (94,847)NewMarket Corp. 294 (121,828)WR Grace & Co. 1,681 (123,066)Southern Copper Corp. 4,917 (132,661)RPM International, Inc. 2,900 (144,855)Praxair, Inc. 1,303 (146,444)Ecolab, Inc. 1,344 (159,398)FMC Corp. 3,446 (159,584)Tahoe Resources, Inc. 10,969 (164,206)Monsanto Co. 1,597 (165,146)Royal Gold, Inc. 2,480 (178,609)
Total Basic Materials (1,851,985)
ENERGY - (2.0)%Chesapeake Energy Corp.* 84 (360)Southwestern Energy Co.* 43 (541)California Resources Corp.* 231 (2,818)Whiting Petroleum Corp.* 378 (3,500)QEP Resources, Inc. 588 (10,366)Denbury Resources, Inc. 3,954 (14,195)Energen Corp. 336 (16,199)Halliburton Co. 379 (17,165)SemGroup Corp. — Class A 743 (24,192)Kinder Morgan, Inc. 1,344 (25,160)NOW, Inc.* 1,512 (27,428)CVR Energy, Inc. 2,143 (33,217)Murphy Oil Corp. 1,050 (33,338)Concho Resources, Inc.* 336 (40,075)Superior Energy Services, Inc. 2,270 (41,791)Dril-Quip, Inc.* 924 (53,989)Continental Resources, Inc.* 1,219 (55,184)Schlumberger Ltd. 714 (56,463)Western Refining, Inc. 2,772 (57,186)Cobalt International Energy, Inc.* 45,641 (61,159)ONEOK, Inc. 1,344 (63,773)RPC, Inc.* 5,127 (79,622)Noble Energy, Inc. 2,270 (81,425)Weatherford International plc* 15,382 (85,370)Targa Resources Corp. 2,101 (88,536)Apache Corp. 1,639 (91,243)Pioneer Natural Resources Co. 630 (95,262)Devon Energy Corp. 2,857 (103,566)FMC Technologies, Inc.* 4,203 (112,094)Gulfport Energy Corp.* 3,656 (114,287)
CONSOLIDATED SCHEDULE OF INVESTMENTS (Unaudited)(continued) June 30, 2016
MULTI-HEDGE STRATEGIES FUND
SHARES VALUE
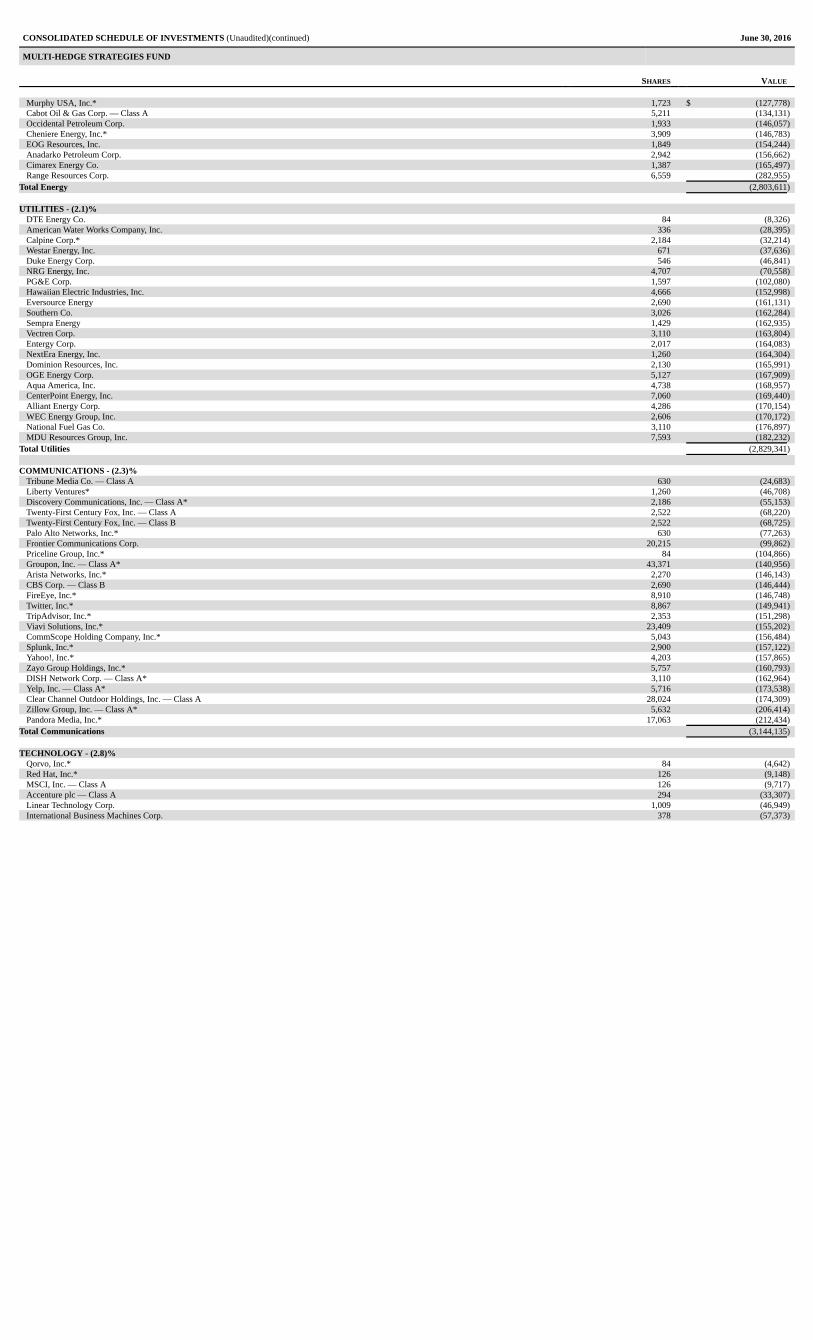
Murphy USA, Inc.* 1,723 $ (127,778)Cabot Oil & Gas Corp. — Class A 5,211 (134,131)Occidental Petroleum Corp. 1,933 (146,057)Cheniere Energy, Inc.* 3,909 (146,783)EOG Resources, Inc. 1,849 (154,244)Anadarko Petroleum Corp. 2,942 (156,662)Cimarex Energy Co. 1,387 (165,497)Range Resources Corp. 6,559 (282,955)
Total Energy (2,803,611)
UTILITIES - (2.1)%DTE Energy Co. 84 (8,326)American Water Works Company, Inc. 336 (28,395)Calpine Corp.* 2,184 (32,214)Westar Energy, Inc. 671 (37,636)Duke Energy Corp. 546 (46,841)NRG Energy, Inc. 4,707 (70,558)PG&E Corp. 1,597 (102,080)Hawaiian Electric Industries, Inc. 4,666 (152,998)Eversource Energy 2,690 (161,131)Southern Co. 3,026 (162,284)Sempra Energy 1,429 (162,935)Vectren Corp. 3,110 (163,804)Entergy Corp. 2,017 (164,083)NextEra Energy, Inc. 1,260 (164,304)Dominion Resources, Inc. 2,130 (165,991)OGE Energy Corp. 5,127 (167,909)Aqua America, Inc. 4,738 (168,957)CenterPoint Energy, Inc. 7,060 (169,440)Alliant Energy Corp. 4,286 (170,154)WEC Energy Group, Inc. 2,606 (170,172)National Fuel Gas Co. 3,110 (176,897)MDU Resources Group, Inc. 7,593 (182,232)
Total Utilities (2,829,341)
COMMUNICATIONS - (2.3)%Tribune Media Co. — Class A 630 (24,683)Liberty Ventures* 1,260 (46,708)Discovery Communications, Inc. — Class A* 2,186 (55,153)Twenty-First Century Fox, Inc. — Class A 2,522 (68,220)Twenty-First Century Fox, Inc. — Class B 2,522 (68,725)Palo Alto Networks, Inc.* 630 (77,263)Frontier Communications Corp. 20,215 (99,862)Priceline Group, Inc.* 84 (104,866)Groupon, Inc. — Class A* 43,371 (140,956)Arista Networks, Inc.* 2,270 (146,143)CBS Corp. — Class B 2,690 (146,444)FireEye, Inc.* 8,910 (146,748)Twitter, Inc.* 8,867 (149,941)TripAdvisor, Inc.* 2,353 (151,298)Viavi Solutions, Inc.* 23,409 (155,202)CommScope Holding Company, Inc.* 5,043 (156,484)Splunk, Inc.* 2,900 (157,122)Yahoo!, Inc.* 4,203 (157,865)Zayo Group Holdings, Inc.* 5,757 (160,793)DISH Network Corp. — Class A* 3,110 (162,964)Yelp, Inc. — Class A* 5,716 (173,538)Clear Channel Outdoor Holdings, Inc. — Class A 28,024 (174,309)Zillow Group, Inc. — Class A* 5,632 (206,414)Pandora Media, Inc.* 17,063 (212,434)
Total Communications (3,144,135)
TECHNOLOGY - (2.8)%Qorvo, Inc.* 84 (4,642)Red Hat, Inc.* 126 (9,148)MSCI, Inc. — Class A 126 (9,717)Accenture plc — Class A 294 (33,307)Linear Technology Corp. 1,009 (46,949)International Business Machines Corp. 378 (57,373)
CONSOLIDATED SCHEDULE OF INVESTMENTS (Unaudited)(continued) June 30, 2016
MULTI-HEDGE STRATEGIES FUND
SHARES VALUE
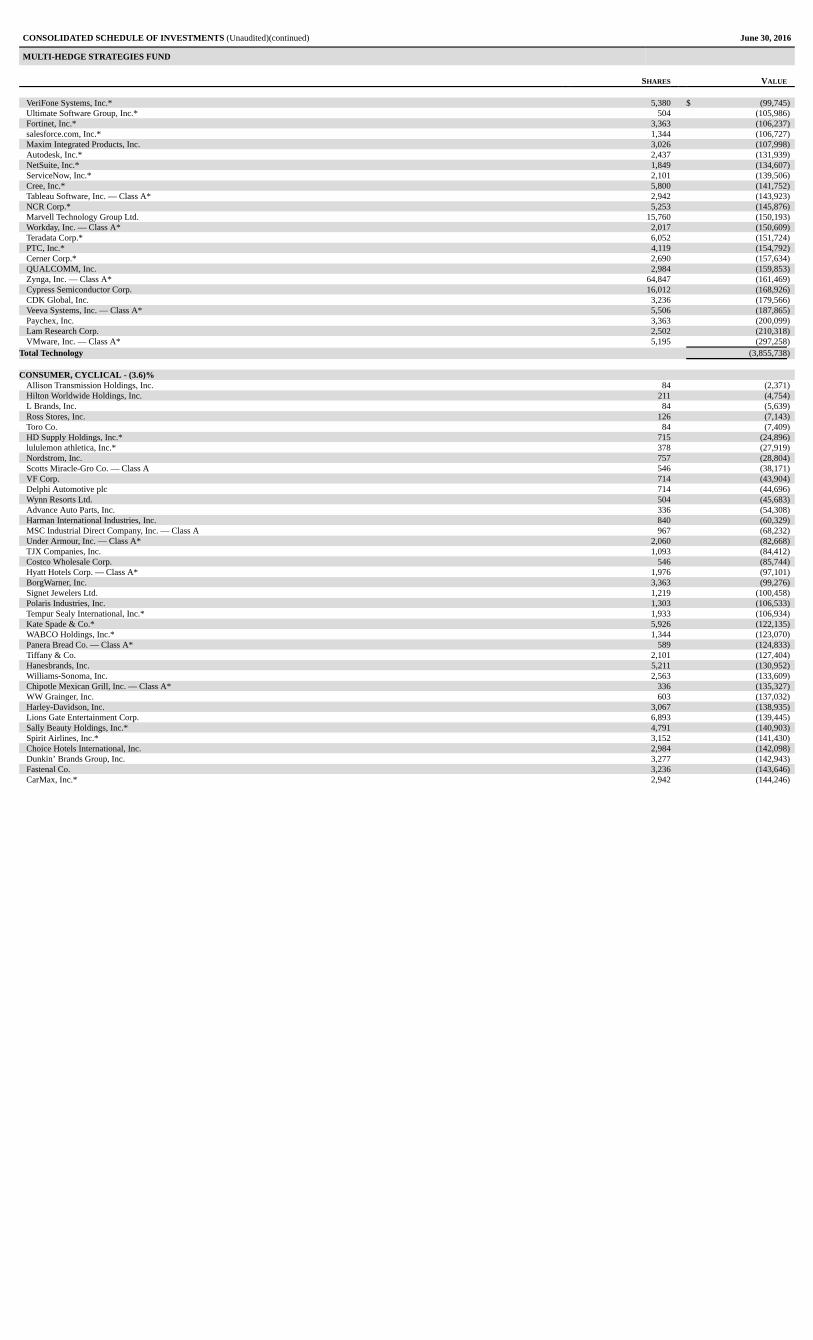
VeriFone Systems, Inc.* 5,380 $ (99,745)Ultimate Software Group, Inc.* 504 (105,986)Fortinet, Inc.* 3,363 (106,237)salesforce.com, Inc.* 1,344 (106,727)Maxim Integrated Products, Inc. 3,026 (107,998)Autodesk, Inc.* 2,437 (131,939)NetSuite, Inc.* 1,849 (134,607)ServiceNow, Inc.* 2,101 (139,506)Cree, Inc.* 5,800 (141,752)Tableau Software, Inc. — Class A* 2,942 (143,923)NCR Corp.* 5,253 (145,876)Marvell Technology Group Ltd. 15,760 (150,193)Workday, Inc. — Class A* 2,017 (150,609)Teradata Corp.* 6,052 (151,724)PTC, Inc.* 4,119 (154,792)Cerner Corp.* 2,690 (157,634)QUALCOMM, Inc. 2,984 (159,853)Zynga, Inc. — Class A* 64,847 (161,469)Cypress Semiconductor Corp. 16,012 (168,926)CDK Global, Inc. 3,236 (179,566)Veeva Systems, Inc. — Class A* 5,506 (187,865)Paychex, Inc. 3,363 (200,099)Lam Research Corp. 2,502 (210,318)VMware, Inc. — Class A* 5,195 (297,258)
Total Technology (3,855,738)
CONSUMER, CYCLICAL - (3.6)%Allison Transmission Holdings, Inc. 84 (2,371)Hilton Worldwide Holdings, Inc. 211 (4,754)L Brands, Inc. 84 (5,639)Ross Stores, Inc. 126 (7,143)Toro Co. 84 (7,409)HD Supply Holdings, Inc.* 715 (24,896)lululemon athletica, Inc.* 378 (27,919)Nordstrom, Inc. 757 (28,804)Scotts Miracle-Gro Co. — Class A 546 (38,171)VF Corp. 714 (43,904)Delphi Automotive plc 714 (44,696)Wynn Resorts Ltd. 504 (45,683)Advance Auto Parts, Inc. 336 (54,308)Harman International Industries, Inc. 840 (60,329)MSC Industrial Direct Company, Inc. — Class A 967 (68,232)Under Armour, Inc. — Class A* 2,060 (82,668)TJX Companies, Inc. 1,093 (84,412)Costco Wholesale Corp. 546 (85,744)Hyatt Hotels Corp. — Class A* 1,976 (97,101)BorgWarner, Inc. 3,363 (99,276)Signet Jewelers Ltd. 1,219 (100,458)Polaris Industries, Inc. 1,303 (106,533)Tempur Sealy International, Inc.* 1,933 (106,934)Kate Spade & Co.* 5,926 (122,135)WABCO Holdings, Inc.* 1,344 (123,070)Panera Bread Co. — Class A* 589 (124,833)Tiffany & Co. 2,101 (127,404)Hanesbrands, Inc. 5,211 (130,952)Williams-Sonoma, Inc. 2,563 (133,609)Chipotle Mexican Grill, Inc. — Class A* 336 (135,327)WW Grainger, Inc. 603 (137,032)Harley-Davidson, Inc. 3,067 (138,935)Lions Gate Entertainment Corp. 6,893 (139,445)Sally Beauty Holdings, Inc.* 4,791 (140,903)Spirit Airlines, Inc.* 3,152 (141,430)Choice Hotels International, Inc. 2,984 (142,098)Dunkin’ Brands Group, Inc. 3,277 (142,943)Fastenal Co. 3,236 (143,646)CarMax, Inc.* 2,942 (144,246)
CONSOLIDATED SCHEDULE OF INVESTMENTS (Unaudited)(continued) June 30, 2016
MULTI-HEDGE STRATEGIES FUND
SHARES VALUE
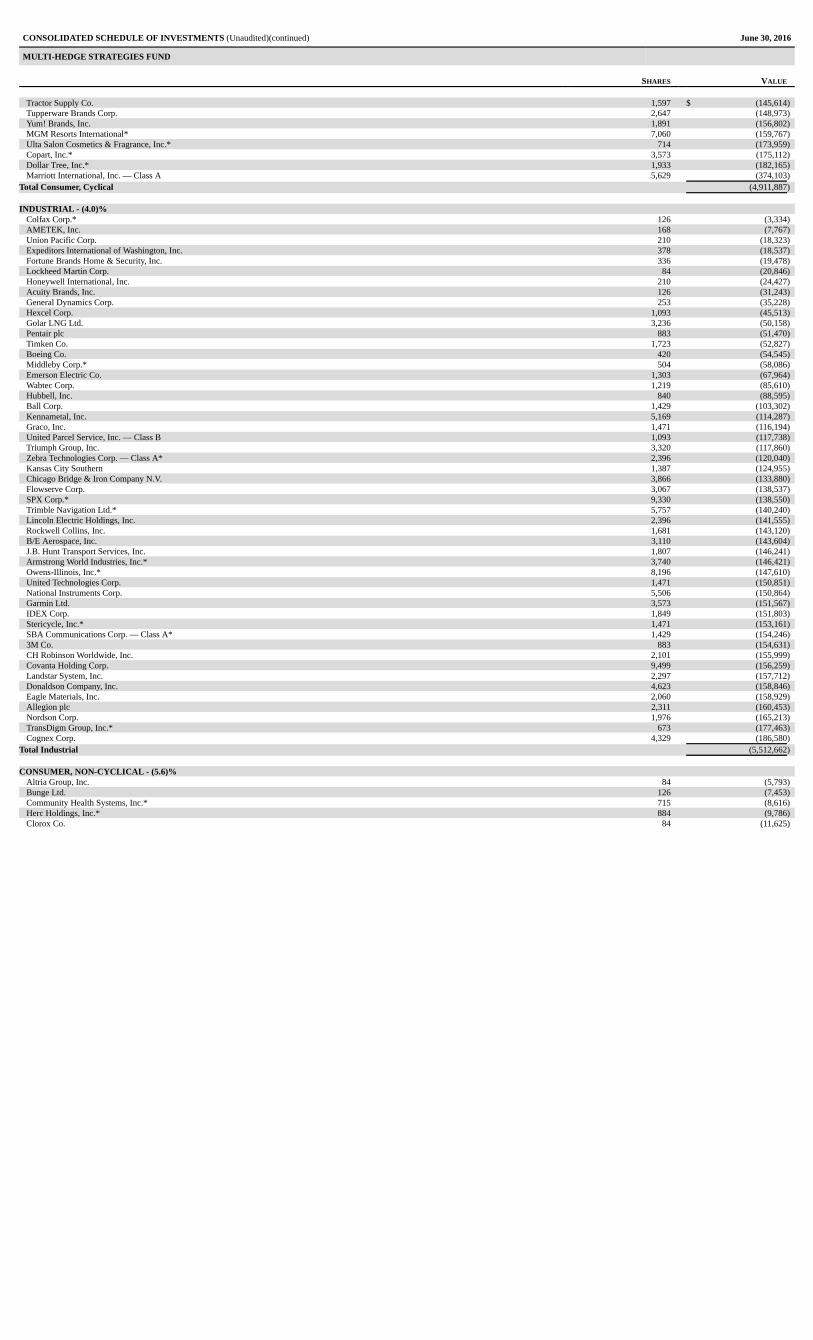
Tractor Supply Co. 1,597 $ (145,614)Tupperware Brands Corp. 2,647 (148,973)Yum! Brands, Inc. 1,891 (156,802)MGM Resorts International* 7,060 (159,767)Ulta Salon Cosmetics & Fragrance, Inc.* 714 (173,959)Copart, Inc.* 3,573 (175,112)Dollar Tree, Inc.* 1,933 (182,165)Marriott International, Inc. — Class A 5,629 (374,103)
Total Consumer, Cyclical (4,911,887)
INDUSTRIAL - (4.0)%Colfax Corp.* 126 (3,334)AMETEK, Inc. 168 (7,767)Union Pacific Corp. 210 (18,323)Expeditors International of Washington, Inc. 378 (18,537)Fortune Brands Home & Security, Inc. 336 (19,478)Lockheed Martin Corp. 84 (20,846)Honeywell International, Inc. 210 (24,427)Acuity Brands, Inc. 126 (31,243)General Dynamics Corp. 253 (35,228)Hexcel Corp. 1,093 (45,513)Golar LNG Ltd. 3,236 (50,158)Pentair plc 883 (51,470)Timken Co. 1,723 (52,827)Boeing Co. 420 (54,545)Middleby Corp.* 504 (58,086)Emerson Electric Co. 1,303 (67,964)Wabtec Corp. 1,219 (85,610)Hubbell, Inc. 840 (88,595)Ball Corp. 1,429 (103,302)Kennametal, Inc. 5,169 (114,287)Graco, Inc. 1,471 (116,194)United Parcel Service, Inc. — Class B 1,093 (117,738)Triumph Group, Inc. 3,320 (117,860)Zebra Technologies Corp. — Class A* 2,396 (120,040)Kansas City Southern 1,387 (124,955)Chicago Bridge & Iron Company N.V. 3,866 (133,880)Flowserve Corp. 3,067 (138,537)SPX Corp.* 9,330 (138,550)Trimble Navigation Ltd.* 5,757 (140,240)Lincoln Electric Holdings, Inc. 2,396 (141,555)Rockwell Collins, Inc. 1,681 (143,120)B/E Aerospace, Inc. 3,110 (143,604)J.B. Hunt Transport Services, Inc. 1,807 (146,241)Armstrong World Industries, Inc.* 3,740 (146,421)Owens-Illinois, Inc.* 8,196 (147,610)United Technologies Corp. 1,471 (150,851)National Instruments Corp. 5,506 (150,864)Garmin Ltd. 3,573 (151,567)IDEX Corp. 1,849 (151,803)Stericycle, Inc.* 1,471 (153,161)SBA Communications Corp. — Class A* 1,429 (154,246)3M Co. 883 (154,631)CH Robinson Worldwide, Inc. 2,101 (155,999)Covanta Holding Corp. 9,499 (156,259)Landstar System, Inc. 2,297 (157,712)Donaldson Company, Inc. 4,623 (158,846)Eagle Materials, Inc. 2,060 (158,929)Allegion plc 2,311 (160,453)Nordson Corp. 1,976 (165,213)TransDigm Group, Inc.* 673 (177,463)Cognex Corp. 4,329 (186,580)
Total Industrial (5,512,662)
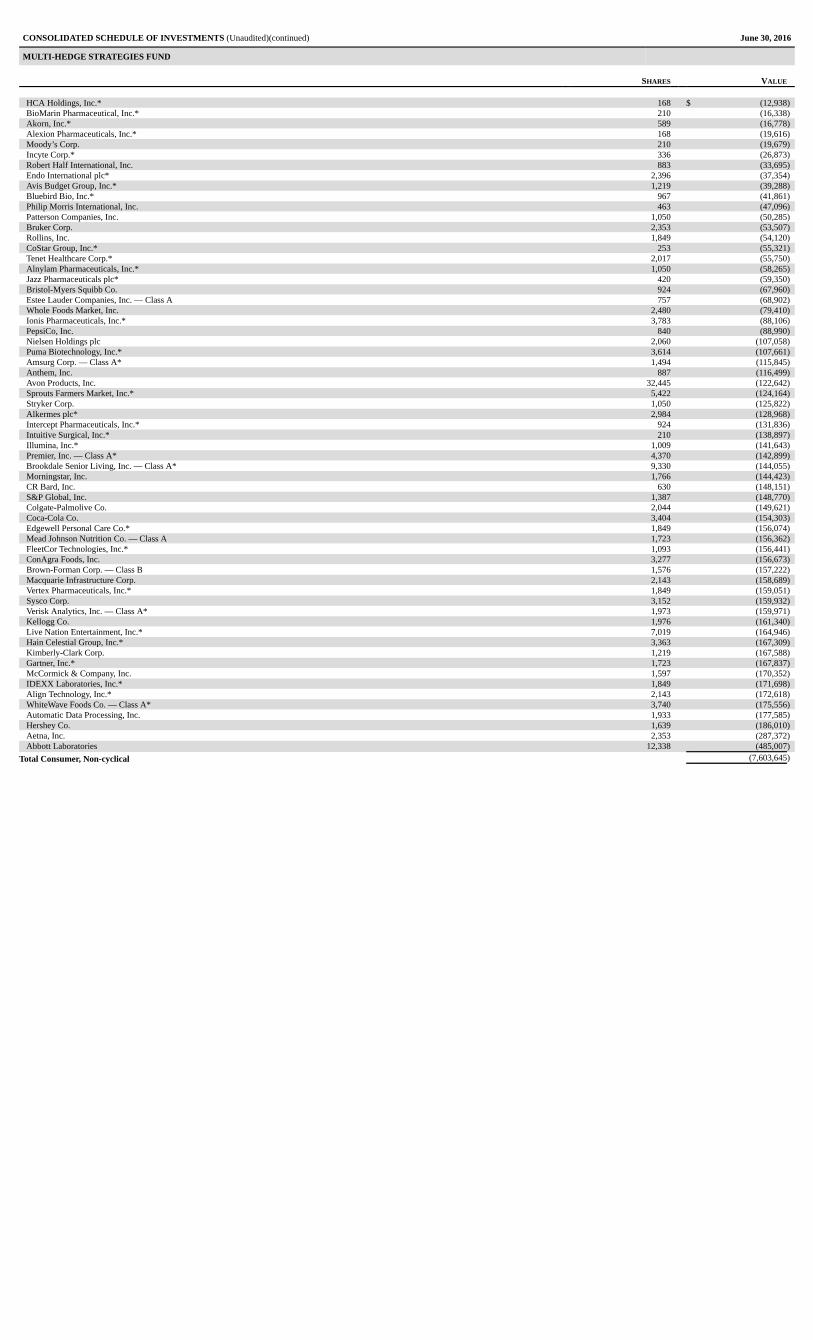
CONSUMER, NON-CYCLICAL - (5.6)%Altria Group, Inc. 84 (5,793)Bunge Ltd. 126 (7,453)Community Health Systems, Inc.* 715 (8,616)Herc Holdings, Inc.* 884 (9,786)Clorox Co. 84 (11,625)
CONSOLIDATED SCHEDULE OF INVESTMENTS (Unaudited)(continued) June 30, 2016
MULTI-HEDGE STRATEGIES FUND
SHARES VALUE
HCA Holdings, Inc.* 168 $ (12,938)BioMarin Pharmaceutical, Inc.* 210 (16,338)Akorn, Inc.* 589 (16,778)Alexion Pharmaceuticals, Inc.* 168 (19,616)Moody’s Corp. 210 (19,679)Incyte Corp.* 336 (26,873)Robert Half International, Inc. 883 (33,695)Endo International plc* 2,396 (37,354)Avis Budget Group, Inc.* 1,219 (39,288)Bluebird Bio, Inc.* 967 (41,861)Philip Morris International, Inc. 463 (47,096)Patterson Companies, Inc. 1,050 (50,285)Bruker Corp. 2,353 (53,507)Rollins, Inc. 1,849 (54,120)CoStar Group, Inc.* 253 (55,321)Tenet Healthcare Corp.* 2,017 (55,750)Alnylam Pharmaceuticals, Inc.* 1,050 (58,265)Jazz Pharmaceuticals plc* 420 (59,350)Bristol-Myers Squibb Co. 924 (67,960)Estee Lauder Companies, Inc. — Class A 757 (68,902)Whole Foods Market, Inc. 2,480 (79,410)Ionis Pharmaceuticals, Inc.* 3,783 (88,106)PepsiCo, Inc. 840 (88,990)Nielsen Holdings plc 2,060 (107,058)Puma Biotechnology, Inc.* 3,614 (107,661)Amsurg Corp. — Class A* 1,494 (115,845)Anthem, Inc. 887 (116,499)Avon Products, Inc. 32,445 (122,642)Sprouts Farmers Market, Inc.* 5,422 (124,164)Stryker Corp. 1,050 (125,822)Alkermes plc* 2,984 (128,968)Intercept Pharmaceuticals, Inc.* 924 (131,836)Intuitive Surgical, Inc.* 210 (138,897)Illumina, Inc.* 1,009 (141,643)Premier, Inc. — Class A* 4,370 (142,899)Brookdale Senior Living, Inc. — Class A* 9,330 (144,055)Morningstar, Inc. 1,766 (144,423)CR Bard, Inc. 630 (148,151)S&P Global, Inc. 1,387 (148,770)Colgate-Palmolive Co. 2,044 (149,621)Coca-Cola Co. 3,404 (154,303)Edgewell Personal Care Co.* 1,849 (156,074)Mead Johnson Nutrition Co. — Class A 1,723 (156,362)FleetCor Technologies, Inc.* 1,093 (156,441)ConAgra Foods, Inc. 3,277 (156,673)Brown-Forman Corp. — Class B 1,576 (157,222)Macquarie Infrastructure Corp. 2,143 (158,689)Vertex Pharmaceuticals, Inc.* 1,849 (159,051)Sysco Corp. 3,152 (159,932)Verisk Analytics, Inc. — Class A* 1,973 (159,971)Kellogg Co. 1,976 (161,340)Live Nation Entertainment, Inc.* 7,019 (164,946)Hain Celestial Group, Inc.* 3,363 (167,309)Kimberly-Clark Corp. 1,219 (167,588)Gartner, Inc.* 1,723 (167,837)McCormick & Company, Inc. 1,597 (170,352)IDEXX Laboratories, Inc.* 1,849 (171,698)Align Technology, Inc.* 2,143 (172,618)WhiteWave Foods Co. — Class A* 3,740 (175,556)Automatic Data Processing, Inc. 1,933 (177,585)Hershey Co. 1,639 (186,010)Aetna, Inc. 2,353 (287,372)Abbott Laboratories 12,338 (485,007)
Total Consumer, Non-cyclical (7,603,645)
CONSOLIDATED SCHEDULE OF INVESTMENTS (Unaudited)(continued) June 30, 2016
MULTI-HEDGE STRATEGIES FUND
SHARES VALUE
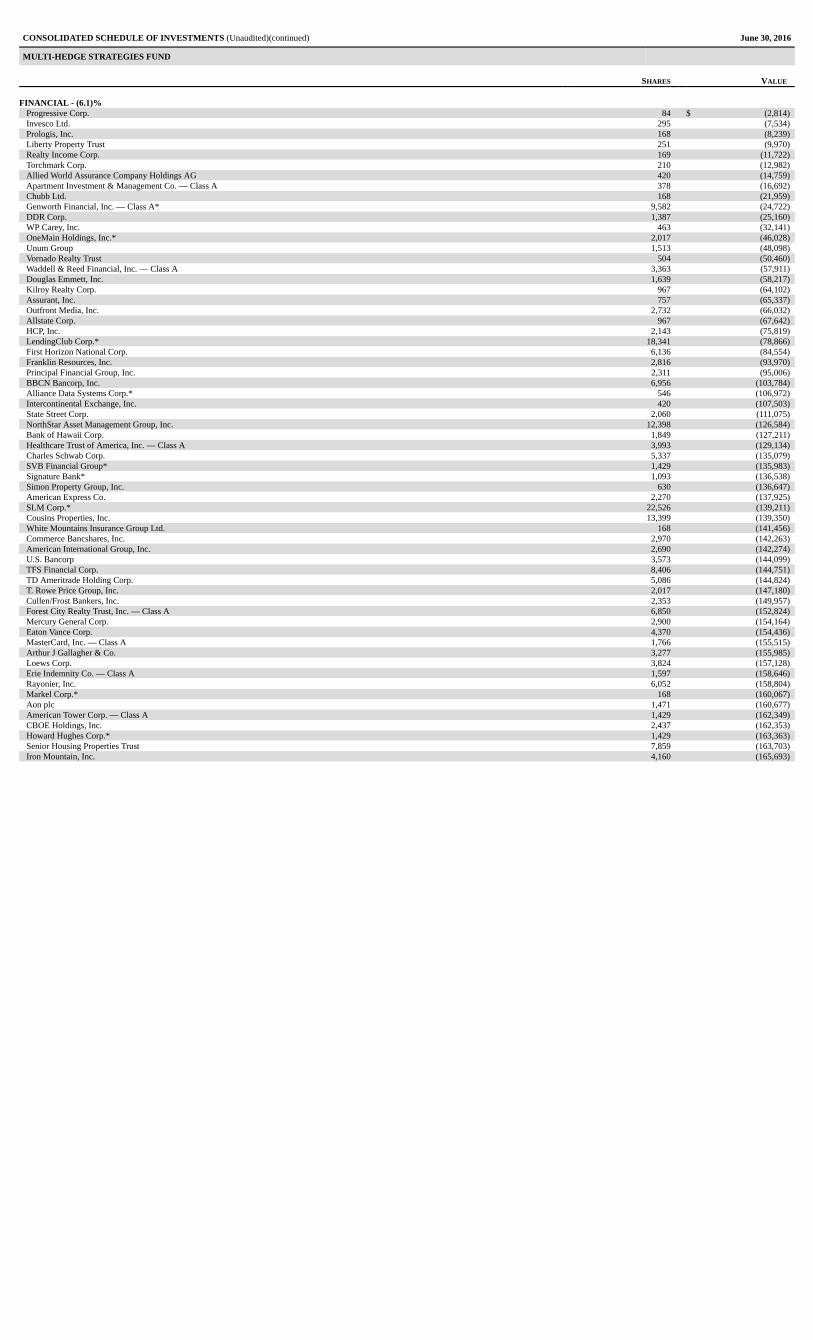
FINANCIAL - (6.1)%Progressive Corp. 84 $ (2,814)Invesco Ltd. 295 (7,534)Prologis, Inc. 168 (8,239)Liberty Property Trust 251 (9,970)Realty Income Corp. 169 (11,722)Torchmark Corp. 210 (12,982)Allied World Assurance Company Holdings AG 420 (14,759)Apartment Investment & Management Co. — Class A 378 (16,692)Chubb Ltd. 168 (21,959)Genworth Financial, Inc. — Class A* 9,582 (24,722)DDR Corp. 1,387 (25,160)WP Carey, Inc. 463 (32,141)OneMain Holdings, Inc.* 2,017 (46,028)Unum Group 1,513 (48,098)Vornado Realty Trust 504 (50,460)Waddell & Reed Financial, Inc. — Class A 3,363 (57,911)Douglas Emmett, Inc. 1,639 (58,217)Kilroy Realty Corp. 967 (64,102)Assurant, Inc. 757 (65,337)Outfront Media, Inc. 2,732 (66,032)Allstate Corp. 967 (67,642)HCP, Inc. 2,143 (75,819)LendingClub Corp.* 18,341 (78,866)First Horizon National Corp. 6,136 (84,554)Franklin Resources, Inc. 2,816 (93,970)Principal Financial Group, Inc. 2,311 (95,006)BBCN Bancorp, Inc. 6,956 (103,784)Alliance Data Systems Corp.* 546 (106,972)Intercontinental Exchange, Inc. 420 (107,503)State Street Corp. 2,060 (111,075)NorthStar Asset Management Group, Inc. 12,398 (126,584)Bank of Hawaii Corp. 1,849 (127,211)Healthcare Trust of America, Inc. — Class A 3,993 (129,134)Charles Schwab Corp. 5,337 (135,079)SVB Financial Group* 1,429 (135,983)Signature Bank* 1,093 (136,538)Simon Property Group, Inc. 630 (136,647)American Express Co. 2,270 (137,925)SLM Corp.* 22,526 (139,211)Cousins Properties, Inc. 13,399 (139,350)White Mountains Insurance Group Ltd. 168 (141,456)Commerce Bancshares, Inc. 2,970 (142,263)American International Group, Inc. 2,690 (142,274)U.S. Bancorp 3,573 (144,099)TFS Financial Corp. 8,406 (144,751)TD Ameritrade Holding Corp. 5,086 (144,824)T. Rowe Price Group, Inc. 2,017 (147,180)Cullen/Frost Bankers, Inc. 2,353 (149,957)Forest City Realty Trust, Inc. — Class A 6,850 (152,824)Mercury General Corp. 2,900 (154,164)Eaton Vance Corp. 4,370 (154,436)MasterCard, Inc. — Class A 1,766 (155,515)Arthur J Gallagher & Co. 3,277 (155,985)Loews Corp. 3,824 (157,128)Erie Indemnity Co. — Class A 1,597 (158,646)Rayonier, Inc. 6,052 (158,804)Markel Corp.* 168 (160,067)Aon plc 1,471 (160,677)American Tower Corp. — Class A 1,429 (162,349)CBOE Holdings, Inc. 2,437 (162,353)Howard Hughes Corp.* 1,429 (163,363)Senior Housing Properties Trust 7,859 (163,703)Iron Mountain, Inc. 4,160 (165,693)
CONSOLIDATED SCHEDULE OF INVESTMENTS (Unaudited)(continued) June 30, 2016
MULTI-HEDGE STRATEGIES FUND
SHARES VALUE
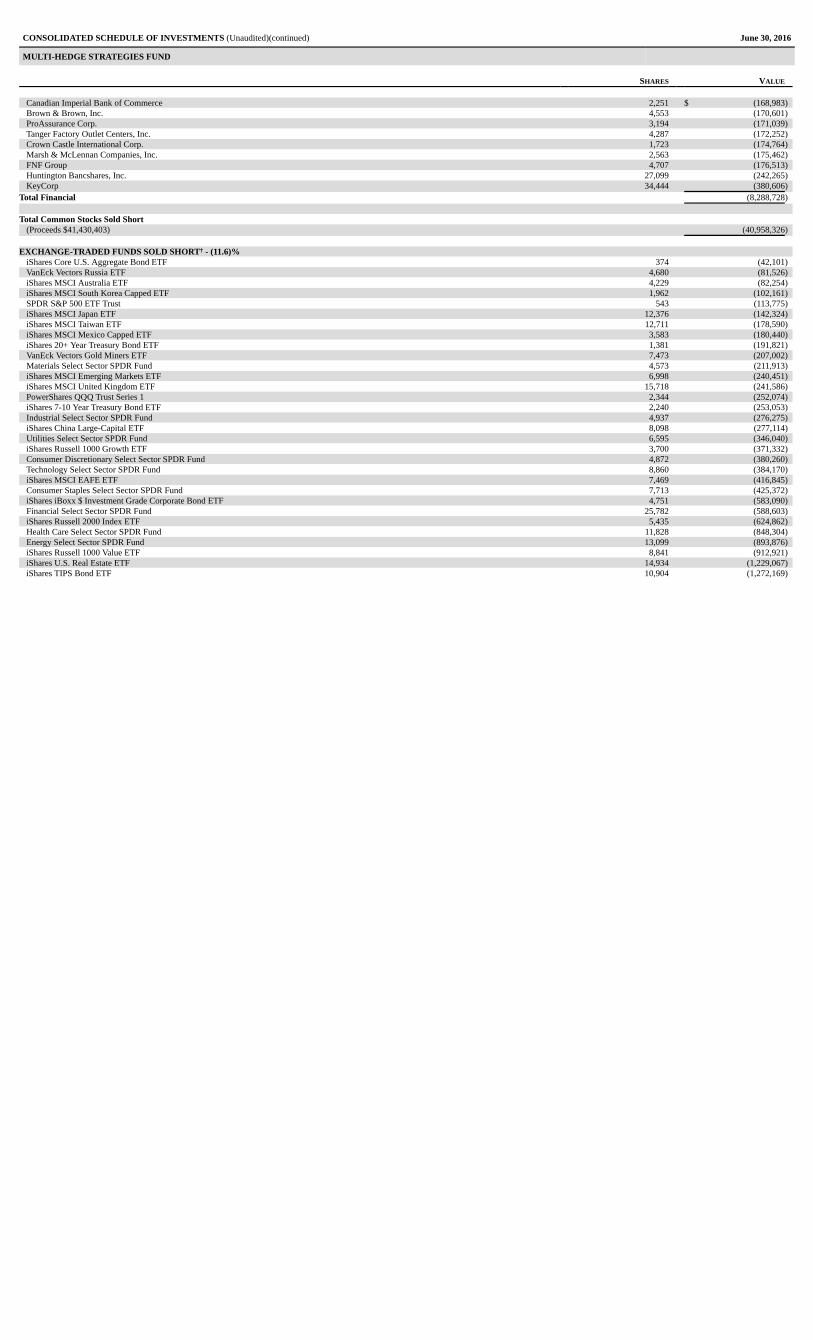
Canadian Imperial Bank of Commerce 2,251 $ (168,983)Brown & Brown, Inc. 4,553 (170,601)ProAssurance Corp. 3,194 (171,039)Tanger Factory Outlet Centers, Inc. 4,287 (172,252)Crown Castle International Corp. 1,723 (174,764)Marsh & McLennan Companies, Inc. 2,563 (175,462)FNF Group 4,707 (176,513)Huntington Bancshares, Inc. 27,099 (242,265)KeyCorp 34,444 (380,606)
Total Financial (8,288,728)
Total Common Stocks Sold Short(Proceeds $41,430,403) (40,958,326)
EXCHANGE-TRADED FUNDS SOLD SHORT† - (11.6)%iShares Core U.S. Aggregate Bond ETF 374 (42,101)VanEck Vectors Russia ETF 4,680 (81,526)iShares MSCI Australia ETF 4,229 (82,254)iShares MSCI South Korea Capped ETF 1,962 (102,161)SPDR S&P 500 ETF Trust 543 (113,775)iShares MSCI Japan ETF 12,376 (142,324)iShares MSCI Taiwan ETF 12,711 (178,590)iShares MSCI Mexico Capped ETF 3,583 (180,440)iShares 20+ Year Treasury Bond ETF 1,381 (191,821)VanEck Vectors Gold Miners ETF 7,473 (207,002)Materials Select Sector SPDR Fund 4,573 (211,913)iShares MSCI Emerging Markets ETF 6,998 (240,451)iShares MSCI United Kingdom ETF 15,718 (241,586)PowerShares QQQ Trust Series 1 2,344 (252,074)iShares 7-10 Year Treasury Bond ETF 2,240 (253,053)Industrial Select Sector SPDR Fund 4,937 (276,275)iShares China Large-Capital ETF 8,098 (277,114)Utilities Select Sector SPDR Fund 6,595 (346,040)iShares Russell 1000 Growth ETF 3,700 (371,332)Consumer Discretionary Select Sector SPDR Fund 4,872 (380,260)Technology Select Sector SPDR Fund 8,860 (384,170)iShares MSCI EAFE ETF 7,469 (416,845)Consumer Staples Select Sector SPDR Fund 7,713 (425,372)iShares iBoxx $ Investment Grade Corporate Bond ETF 4,751 (583,090)Financial Select Sector SPDR Fund 25,782 (588,603)iShares Russell 2000 Index ETF 5,435 (624,862)Health Care Select Sector SPDR Fund 11,828 (848,304)Energy Select Sector SPDR Fund 13,099 (893,876)iShares Russell 1000 Value ETF 8,841 (912,921)iShares U.S. Real Estate ETF 14,934 (1,229,067)iShares TIPS Bond ETF 10,904 (1,272,169)
CONSOLIDATED SCHEDULE OF INVESTMENTS (Unaudited)(continued) June 30, 2016
MULTI-HEDGE STRATEGIES FUND
SHARES VALUE
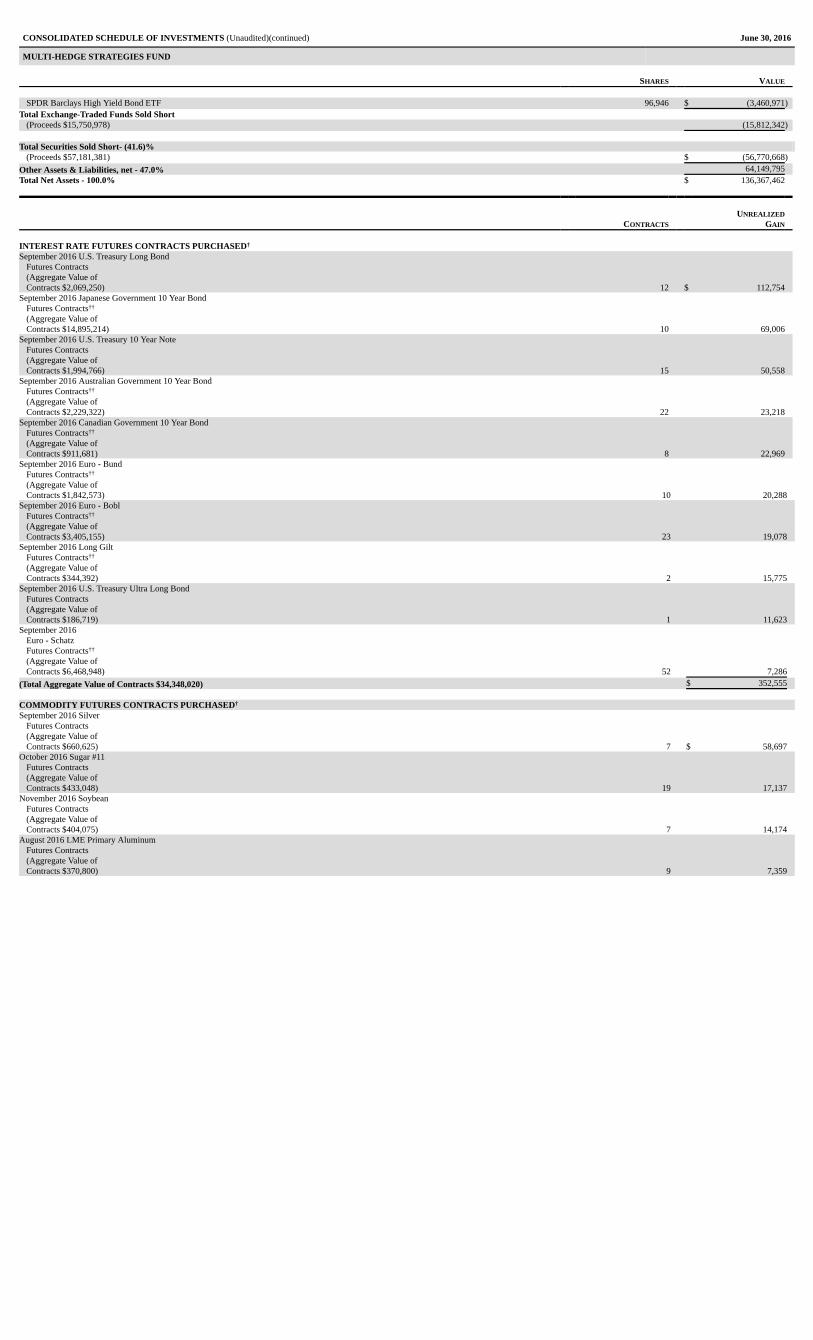
SPDR Barclays High Yield Bond ETF 96,946 $ (3,460,971)Total Exchange-Traded Funds Sold Short
(Proceeds $15,750,978) (15,812,342)
Total Securities Sold Short- (41.6)%(Proceeds $57,181,381) $ (56,770,668)
Other Assets & Liabilities, net - 47.0% 64,149,795Total Net Assets - 100.0% $ 136,367,462
CONTRACTS
UNREALIZED
GAIN
INTEREST RATE FUTURES CONTRACTS PURCHASED†
September 2016 U.S. Treasury Long BondFutures Contracts(Aggregate Value ofContracts $2,069,250) 12 $ 112,754
September 2016 Japanese Government 10 Year BondFutures Contracts††
(Aggregate Value ofContracts $14,895,214) 10 69,006
September 2016 U.S. Treasury 10 Year NoteFutures Contracts(Aggregate Value ofContracts $1,994,766) 15 50,558
September 2016 Australian Government 10 Year BondFutures Contracts††
(Aggregate Value ofContracts $2,229,322) 22 23,218
September 2016 Canadian Government 10 Year BondFutures Contracts††
(Aggregate Value ofContracts $911,681) 8 22,969
September 2016 Euro - BundFutures Contracts††
(Aggregate Value ofContracts $1,842,573) 10 20,288
September 2016 Euro - BoblFutures Contracts††
(Aggregate Value ofContracts $3,405,155) 23 19,078
September 2016 Long GiltFutures Contracts††
(Aggregate Value ofContracts $344,392) 2 15,775
September 2016 U.S. Treasury Ultra Long BondFutures Contracts(Aggregate Value ofContracts $186,719) 1 11,623
September 2016Euro - SchatzFutures Contracts††
(Aggregate Value ofContracts $6,468,948) 52 7,286
(Total Aggregate Value of Contracts $34,348,020) $ 352,555
COMMODITY FUTURES CONTRACTS PURCHASED†
September 2016 SilverFutures Contracts(Aggregate Value ofContracts $660,625) 7 $ 58,697
October 2016 Sugar #11Futures Contracts(Aggregate Value ofContracts $433,048) 19 17,137
November 2016 SoybeanFutures Contracts(Aggregate Value ofContracts $404,075) 7 14,174
August 2016 LME Primary AluminumFutures Contracts(Aggregate Value ofContracts $370,800) 9 7,359
CONSOLIDATED SCHEDULE OF INVESTMENTS (Unaudited)(continued) June 30, 2016
MULTI-HEDGE STRATEGIES FUND
CONTRACTS
UNREALIZED
GAIN (LOSS)
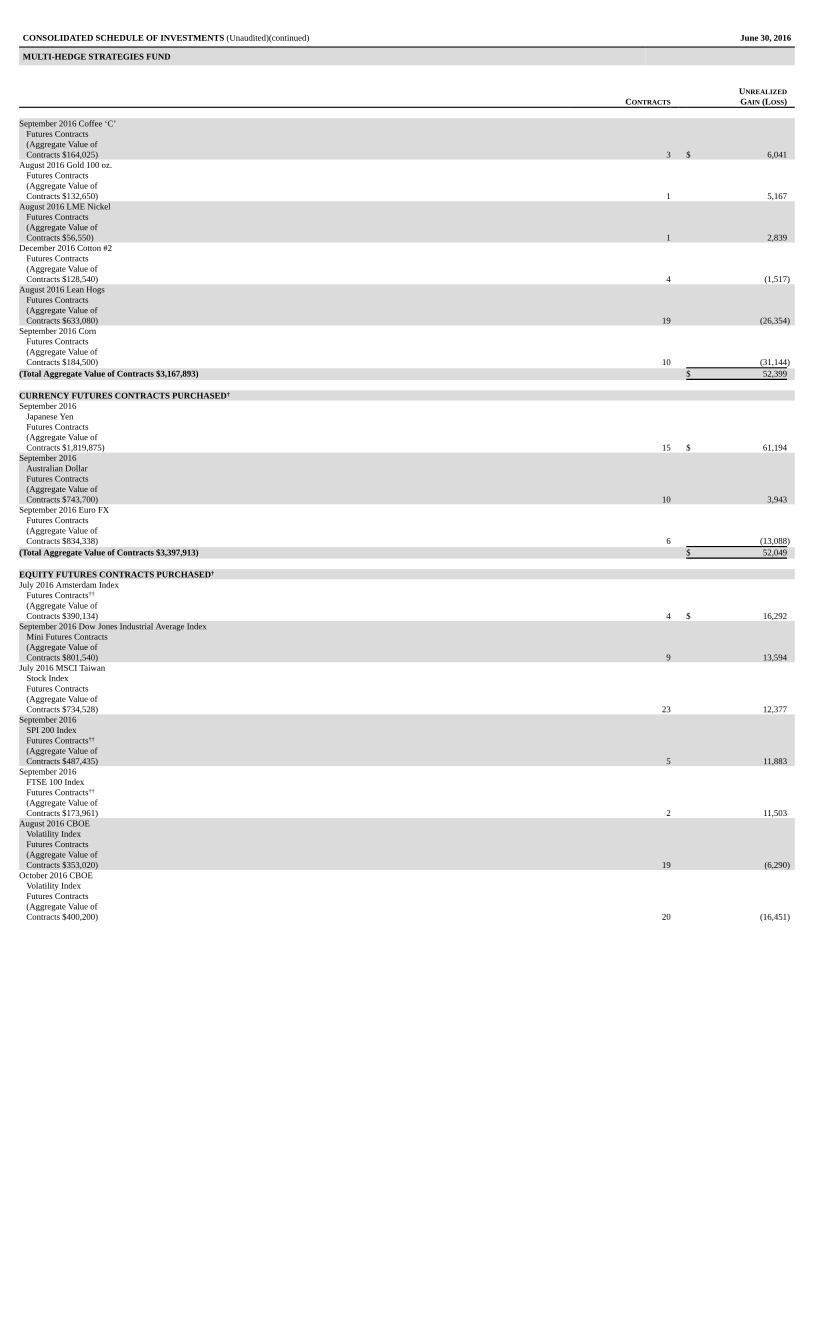
September 2016 Coffee ‘C’Futures Contracts(Aggregate Value ofContracts $164,025) 3 $ 6,041
August 2016 Gold 100 oz.Futures Contracts(Aggregate Value ofContracts $132,650) 1 5,167
August 2016 LME NickelFutures Contracts(Aggregate Value ofContracts $56,550) 1 2,839
December 2016 Cotton #2Futures Contracts(Aggregate Value ofContracts $128,540) 4 (1,517)
August 2016 Lean HogsFutures Contracts(Aggregate Value ofContracts $633,080) 19 (26,354)
September 2016 CornFutures Contracts(Aggregate Value ofContracts $184,500) 10 (31,144)
(Total Aggregate Value of Contracts $3,167,893) $ 52,399
CURRENCY FUTURES CONTRACTS PURCHASED†
September 2016Japanese YenFutures Contracts(Aggregate Value ofContracts $1,819,875) 15 $ 61,194
September 2016Australian DollarFutures Contracts(Aggregate Value ofContracts $743,700) 10 3,943
September 2016 Euro FXFutures Contracts(Aggregate Value ofContracts $834,338) 6 (13,088)
(Total Aggregate Value of Contracts $3,397,913) $ 52,049
EQUITY FUTURES CONTRACTS PURCHASED†
July 2016 Amsterdam IndexFutures Contracts††
(Aggregate Value ofContracts $390,134) 4 $ 16,292
September 2016 Dow Jones Industrial Average IndexMini Futures Contracts(Aggregate Value ofContracts $801,540) 9 13,594
July 2016 MSCI TaiwanStock IndexFutures Contracts(Aggregate Value ofContracts $734,528) 23 12,377
September 2016SPI 200 IndexFutures Contracts††
(Aggregate Value ofContracts $487,435) 5 11,883
September 2016FTSE 100 IndexFutures Contracts††
(Aggregate Value ofContracts $173,961) 2 11,503
August 2016 CBOEVolatility IndexFutures Contracts(Aggregate Value ofContracts $353,020) 19 (6,290)
October 2016 CBOEVolatility IndexFutures Contracts(Aggregate Value ofContracts $400,200) 20 (16,451)
CONSOLIDATED SCHEDULE OF INVESTMENTS (Unaudited)(continued) June 30, 2016
MULTI-HEDGE STRATEGIES FUND
CONTRACTS
UNREALIZED
GAIN (LOSS)
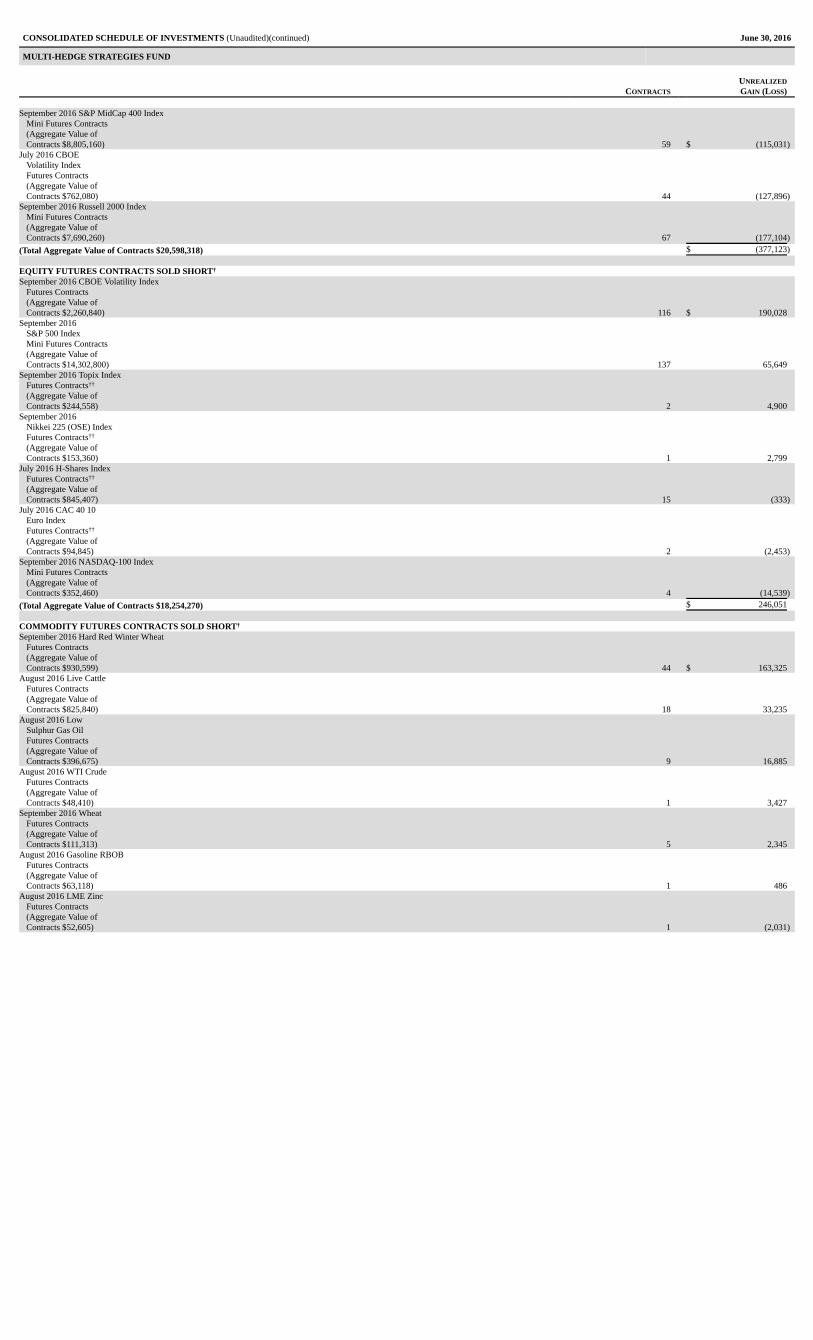
September 2016 S&P MidCap 400 IndexMini Futures Contracts(Aggregate Value ofContracts $8,805,160) 59 $ (115,031)
July 2016 CBOEVolatility IndexFutures Contracts(Aggregate Value ofContracts $762,080) 44 (127,896)
September 2016 Russell 2000 IndexMini Futures Contracts(Aggregate Value ofContracts $7,690,260) 67 (177,104)
(Total Aggregate Value of Contracts $20,598,318) $ (377,123)
EQUITY FUTURES CONTRACTS SOLD SHORT†
September 2016 CBOE Volatility IndexFutures Contracts(Aggregate Value ofContracts $2,260,840) 116 $ 190,028
September 2016S&P 500 IndexMini Futures Contracts(Aggregate Value ofContracts $14,302,800) 137 65,649
September 2016 Topix IndexFutures Contracts††
(Aggregate Value ofContracts $244,558) 2 4,900
September 2016Nikkei 225 (OSE) IndexFutures Contracts††
(Aggregate Value ofContracts $153,360) 1 2,799
July 2016 H-Shares IndexFutures Contracts††
(Aggregate Value ofContracts $845,407) 15 (333)
July 2016 CAC 40 10Euro IndexFutures Contracts††
(Aggregate Value ofContracts $94,845) 2 (2,453)
September 2016 NASDAQ-100 IndexMini Futures Contracts(Aggregate Value ofContracts $352,460) 4 (14,539)
(Total Aggregate Value of Contracts $18,254,270) $ 246,051
COMMODITY FUTURES CONTRACTS SOLD SHORT†
September 2016 Hard Red Winter WheatFutures Contracts(Aggregate Value ofContracts $930,599) 44 $ 163,325
August 2016 Live CattleFutures Contracts(Aggregate Value ofContracts $825,840) 18 33,235
August 2016 LowSulphur Gas OilFutures Contracts(Aggregate Value ofContracts $396,675) 9 16,885
August 2016 WTI CrudeFutures Contracts(Aggregate Value ofContracts $48,410) 1 3,427
September 2016 WheatFutures Contracts(Aggregate Value ofContracts $111,313) 5 2,345
August 2016 Gasoline RBOBFutures Contracts(Aggregate Value ofContracts $63,118) 1 486
August 2016 LME ZincFutures Contracts(Aggregate Value ofContracts $52,605) 1 (2,031)
CONSOLIDATED SCHEDULE OF INVESTMENTS (Unaudited)(concluded) June 30, 2016
MULTI-HEDGE STRATEGIES FUND
CONTRACTS
UNREALIZED
GAIN (LOSS)
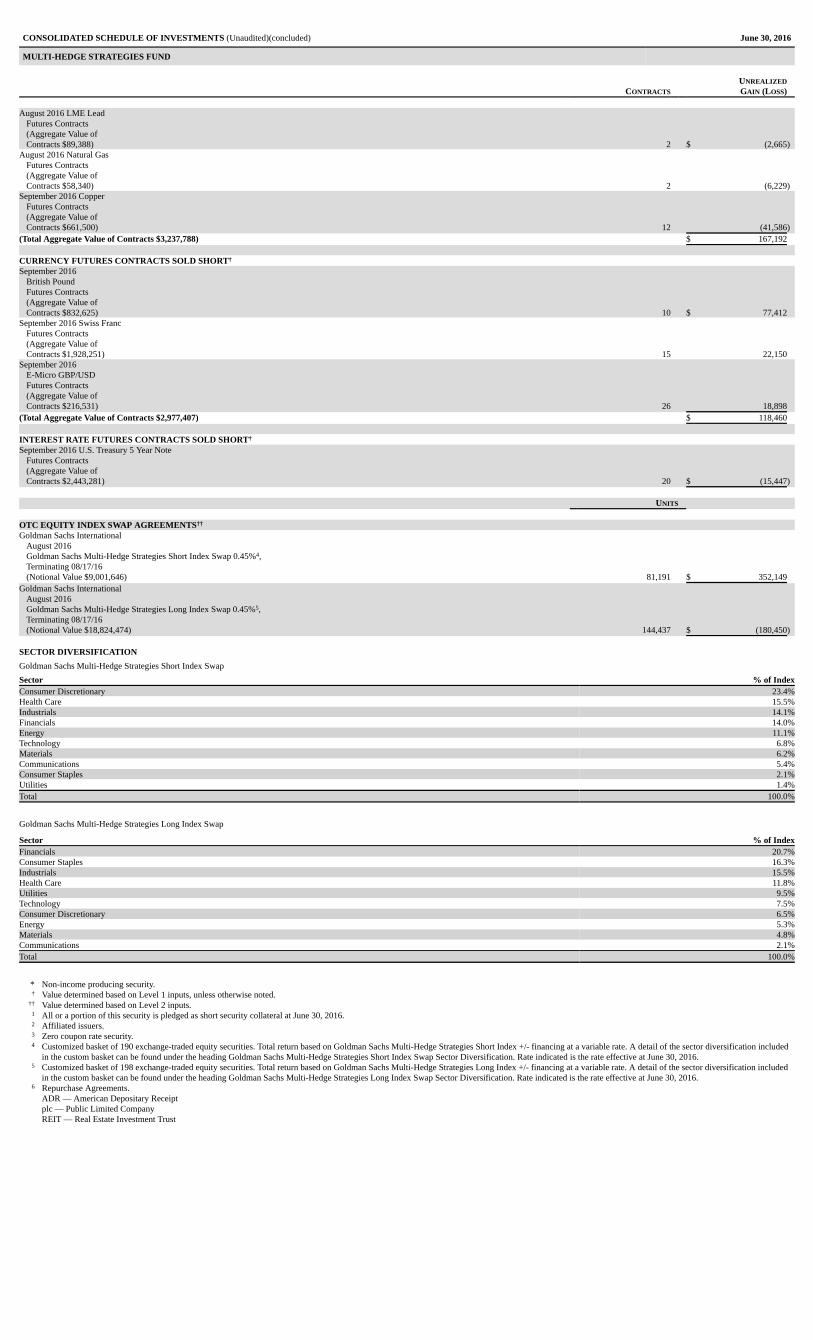
August 2016 LME LeadFutures Contracts(Aggregate Value ofContracts $89,388) 2 $ (2,665)
August 2016 Natural GasFutures Contracts(Aggregate Value ofContracts $58,340) 2 (6,229)
September 2016 CopperFutures Contracts(Aggregate Value ofContracts $661,500) 12 (41,586)
(Total Aggregate Value of Contracts $3,237,788) $ 167,192
CURRENCY FUTURES CONTRACTS SOLD SHORT†
September 2016British PoundFutures Contracts(Aggregate Value ofContracts $832,625) 10 $ 77,412
September 2016 Swiss FrancFutures Contracts(Aggregate Value ofContracts $1,928,251) 15 22,150
September 2016E-Micro GBP/USDFutures Contracts(Aggregate Value ofContracts $216,531) 26 18,898
(Total Aggregate Value of Contracts $2,977,407) $ 118,460
INTEREST RATE FUTURES CONTRACTS SOLD SHORT†
September 2016 U.S. Treasury 5 Year NoteFutures Contracts(Aggregate Value ofContracts $2,443,281) 20 $ (15,447)
UNITS
OTC EQUITY INDEX SWAP AGREEMENTS††
Goldman Sachs InternationalAugust 2016Goldman Sachs Multi-Hedge Strategies Short Index Swap 0.45%4,Terminating 08/17/16(Notional Value $9,001,646) 81,191 $ 352,149
Goldman Sachs InternationalAugust 2016Goldman Sachs Multi-Hedge Strategies Long Index Swap 0.45%5,Terminating 08/17/16(Notional Value $18,824,474) 144,437 $ (180,450)
SECTOR DIVERSIFICATION
Goldman Sachs Multi-Hedge Strategies Short Index Swap
Sector % of IndexConsumer Discretionary 23.4%Health Care 15.5%Industrials 14.1%Financials 14.0%Energy 11.1%Technology 6.8%Materials 6.2%Communications 5.4%Consumer Staples 2.1%Utilities 1.4%Total 100.0%
Goldman Sachs Multi-Hedge Strategies Long Index Swap
Sector % of IndexFinancials 20.7%Consumer Staples 16.3%Industrials 15.5%Health Care 11.8%Utilities 9.5%Technology 7.5%Consumer Discretionary 6.5%Energy 5.3%Materials 4.8%Communications 2.1%Total 100.0%
* Non-income producing security.† Value determined based on Level 1 inputs, unless otherwise noted.
†† Value determined based on Level 2 inputs.1 All or a portion of this security is pledged as short security collateral at June 30, 2016.2 Affiliated issuers.3 Zero coupon rate security.4 Customized basket of 190 exchange-traded equity securities. Total return based on Goldman Sachs Multi-Hedge Strategies Short Index +/- financing at a variable rate. A detail of the sector diversification included
in the custom basket can be found under the heading Goldman Sachs Multi-Hedge Strategies Short Index Swap Sector Diversification. Rate indicated is the rate effective at June 30, 2016.5 Customized basket of 198 exchange-traded equity securities. Total return based on Goldman Sachs Multi-Hedge Strategies Long Index +/- financing at a variable rate. A detail of the sector diversification included
in the custom basket can be found under the heading Goldman Sachs Multi-Hedge Strategies Long Index Swap Sector Diversification. Rate indicated is the rate effective at June 30, 2016.6 Repurchase Agreements.
ADR — American Depositary Receiptplc — Public Limited CompanyREIT — Real Estate Investment Trust