Embed Size (px)
Citation preview
EUROBANK ERGASIAS S.A.
C O N S O L I D A T E D P I L L A R 3 R E P O R T
FOR THE SIX MONTHS ENDED
30 June 2019
8 Othonos Street, Athens 105 57, Greece www.eurobank.gr, Tel: (+30) 210 333 7000
General Commercial Registry No: 000223001000
EUROBANK ERGASIAS S.A. Consolidated Pillar 3 Report
2 | Page 30 June 2019 Consol idated Pi l lar 3 Report
1. Introduction – General Information..................................................................................................... 6
1.1 Regulatory framework .................................................................................................................................. 7
1.2 Regulatory developments ............................................................................................................................ 8
1.3 Scope of Pillar 3 ............................................................................................................................................ 9
1.3.1 Location, timing and frequency of disclosures ........................................................................................ 10
1.4 Regulatory versus accounting consolidation .............................................................................................. 10
2. Capital Management........................................................................................................................ 12
2.1 Regulatory Capital ...................................................................................................................................... 12
2.2 IFRS 9 capital impact .................................................................................................................................. 13
2.3 Supervisory Review and Evaluation Process (SREP) capital requirements ................................................ 14
2.3 Capital requirements under Pillar 1 ........................................................................................................... 14
3. Credit Risk ....................................................................................................................................... 16
3.1 Credit risk exposures .................................................................................................................................. 17
3.2 Standardised approach .............................................................................................................................. 25
3.3 Internal Ratings Based (IRB) approach ....................................................................................................... 27
3.4 Credit risk mitigation .................................................................................................................................. 35
3.5 Securitised exposures ................................................................................................................................. 37
4. Market Risk ..................................................................................................................................... 38
4.1 Internal model – Value at Risk (VaR) model & Credit Risk (IRC) ................................................................ 38
4.2 Back testing ................................................................................................................................................ 40
4.3 Standardised approach for market risk ...................................................................................................... 41
5. Counterparty Risk ............................................................................................................................. 42
5.1 Definition .................................................................................................................................................... 42
5.2 Mitigation of counterparty risk .................................................................................................................. 42
5.3 Credit derivatives ....................................................................................................................................... 42
5.4 Counterparty risk based on the calculation methodology employed ........................................................ 43
5.5 CVA capital charge ...................................................................................................................................... 44
5.6 Exposures to CCPs ...................................................................................................................................... 45
5.7 Standardised approach – CCR exposures by regulatory portfolio and risk ................................................ 46
5.8 IRB approach – CCR exposures by portfolio and PD scale .......................................................................... 47
5.9 RWA flow statements of CCR exposures under IMM................................................................................. 48
EUROBANK ERGASIAS S.A. Consolidated Pillar 3 Report
3 | Page 30 June 2019 Consol idated Pi l lar 3 Report
5.10 Impact of netting and collateral held on exposure values ....................................................................... 48
5.11 Composition of collateral for exposures to CCR ...................................................................................... 49
6. Asset encumbrance .......................................................................................................................... 50
6.1 Assets .......................................................................................................................................................... 50
6.2 Collateral received ...................................................................................................................................... 50
6.3 Encumbered assets/collateral received and associated liabilities ............................................................. 50
7. Leverage ratio .................................................................................................................................. 51
Appendix 1: Capital instruments’ main features disclosure .................................................................... 54
EUROBANK ERGASIAS S.A. Consolidated Pillar 3 Report
4 | Page 30 June 2019 Consol idated Pi l lar 3 Report
Index of tables
1 Regulatory versus accounting consolidation 11
2 Regulatory capital 12
3 EU IFRS9 –FL – Comparison of Institutions ‘ own funds and capital and leverage ratios with and without the application of transitional arrangements for IFRS9 or analogous ECLs
13
4 EU OV1 – Overview of RWAs 14
5 INS1 – Non deducted participation in insurance undertakings 15
6 EU CR1-A – Credit quality of exposures by exposure class and instrument 17
7 EU CR2-A – Changes in the stock of general and specific credit risk adjustments 19
8 EU CR2-B – Changes in the stock of defaulted and impaired loans and debt securities 19
9 Credit quality of forborne exposures 20
10 Credit quality of performing and non-performing exposures by past due days 21
11 Performing and non-performing exposures and related provisions 22
12 Quality of non-performing exposures by geography 23
13 Credit quality of loans and advances by industry 24
14 EU CR4 – Standardised approach – Credit risk exposure and CRM effects 25
15 EU CR5 – Standardised approach by exposure class 26
16 EU CR6 – IRB approach – Credit risk exposures by exposure class and PD range 27
17 EU CR10 – IRB (specialised lending) 32
18 EU CR8 – RWA flow statements of credit risk exposures under the IRB approach 33
19 EU CR10 – IRB (equities) 34
20 EU CR7 – IRB approach – Effect on the RWAs of credit derivatives used as CRM techniques 35
21 EU CR3 – CRM techniques – Overview 36
22 Securitised exposures 37
23 EU MR2-A – Market risk under IMA 38
24 EU MR2-B – RWA flow of market risk exposures under IMA 39
25 EU MR3 – IMA values for trading portfolios 39
26 EU MR4 – Comparison of VAR estimates with gains/losses 40
27 EU MR1 – Market risk under the standardised approach 41
28 EU CCR6 – Credit derivatives exposures 42
29 EU CCR1 – Analysis of CCR exposure by approach 43
30 EU CCR2 – CVA capital charge 44
31 EU CCR8 – Exposures to CCPs 45
32 EU CCR3 – Standardised approach – CCR exposures by regulatory portfolio and risk 46
33 EU CCR4 – IRB approach – CCR exposures by portfolio and PD scale 47
34 EU CCR5-A – Impact of netting and collateral held on exposure values 48
35 EU CCR5-B – Composition of collateral for exposures to CCR 49
36 Encumbered Assets 50
37 Collateral received 50
38 Encumbered assets/collateral received and associated liabilities 50
39 Summary reconciliation of accounting assets and leverage ratio exposures 51
40 Leverage ratio common disclosure 52
EUROBANK ERGASIAS S.A. Consolidated Pillar 3 Report
5 | Page 30 June 2019 Consol idated Pi l lar 3 Report
41 Split-up on balance sheet exposures (excluding derivatives and SFT's) 53
42 Appendix 1: Capital instruments’ main features disclosure 54
EUROBANK ERGASIAS S.A. Consolidated Pillar 3 Report
Introduction - General Information
6 | Page 30 June 2019 Consol idated Pi l lar 3 Report
1. Introduction – General Information
Eurobank Ergasias S.A. (the "Bank" or the "Group") is a credit institution based in Greece and is supervised on a stand alone and consolidated basis by the European Central Bank (ECB) and the Bank of Greece (BoG). The Group is one of the four systemic banks in Greece, operating in key banking product and service markets. The Group offers a wide range of financial services to the retail and corporate clients. It has a strategic focus in Greece in fee-generating activities, such as asset management, private banking, equity brokerage, treasury sales, investment banking, leasing, factoring, real estate and trade finance. The Group is also among the leading providers of banking services and credit to SMEs, small businesses and professionals, large corporates and households. Eurobank has an international presence in six countries outside of Greece, with operations in Bulgaria, Serbia, Cyprus, Luxembourg, the United Kingdom and Romania. Romanian disposal group On 3 April 2018, Eurobank and Banca Transilvania (BT) concluded all the actions and fulfilled all the conditions precedent for the completion of the transfer of the shares held by the Group in Bancpost S.A., ERB Retail Services IFN S.A. and ERB Leasing IFN S.A. to BT. Prior to this, BT has obtained the relevant regulatory approvals from both the National Bank of Romania and the Romanian Competition Authority for the acquisition. Further information in relation to the completion of the disposal is provided in the Interim Consolidated Financial Statements note 13. Acquisition of Piraeus Bank Bulgaria A.D. by Eurobank Bulgaria A.D.On 7 November 2018, the Bank announced that it had concluded an agreement with Piraeus Bank S.A. for the acquisition of Piraeus Bank Bulgaria A.D (PBB), a subsidiary of Piraeus Bank, by Eurobank’s subsidiary in Bulgaria, Eurobank Bulgaria A.D. (“Postbank”) (the “Transaction”).. In June 2019, the Transaction was completed, following the receipt of the relevant regulatory approvals. Further information is provided in the Interim Consolidated Financial Statements note 31. Merger of Eurobank with Grivalia On 26 November 2018, the Boards of Directors (“BoD”) of the Bank and Grivalia Properties REIC (“Grivalia”) announced that they unanimously decided to commence the Merger of the two companies by absorption of Grivalia by Eurobank (the “Merger”). On 7 February 2019, the European Commission (DG Competition) decided that the Merger is in line with Eurobank’s commitments and State Aid rules considering that the strengthening of its capital base through the Merger will enable Eurobank to significantly reduce its non-performing loans in the near future. On 22 February 2019, the BoD of the Bank and Grivalia approved the Draft Merger Agreement for the absorption of Grivalia by the Bank according to the provisions of the Greek Laws 2166/1993 and 2515/1997, as in force as well as the applicable Company Law. On 5 April 2019, the Extraordinary General Meeting of the shareholders of the Bank resolved, among others, (a) the approval of the Merger of the Bank with Grivalia by absorption of the latter by the former, (b) the approval of the Draft Merger Agreement, as it was approved by the BoD of the merging companies and (c) the increase of the share capital of the Bank by € 197.3 million. The Merger was approved on 17 May 2019 by the Ministry of Finance and Development and was registered, on the same day, in the General Commercial Registry. The trading of the 1,523,163,087 new common voting shares of nominal value € 0.23 each was initiated at Athens Exchange on 23 May 2019. As a result of the Merger, Fairfax group, which before the Merger held 18.40% and 54.02% in Eurobank and Grivalia, respectively, becomes the largest shareholder in the merged entity with a 33.03% shareholding. Further information in relation to the completion of the Merger is provided in the Interim Consolidated Financial Statements note 31. Other significant events At the end of June 2019, the Bank reached a binding agreement with an international investor for the sale of 95% of the mezzanine and junior notes of a securitization of a residential mortgage loan portfolio of ca. € 2 bn gross book value (Project Pillar comprising primarily NPEs). Eurobank shall retain 100% of the senior notes, as well as 5% of the
EUROBANK ERGASIAS S.A. Consolidated Pillar 3 Report
Introduction - General Information
7 | Page 30 June 2019 Consol idated Pi l lar 3 Report
mezzanine and junior notes. Upon closing of the transaction and as a result of the notes’ disposal, the Bank will transfer substantially all risks and rewards of ownership and will derecognize the loan portfolio. Further information is provided in the Interim Consolidated Financial Statements note 15. As at 30 June 2019 and taking into account the above transaction, the Group NPEs at amortized cost have been reduced to € 14.3 bn, driving the NPE ratio to 32.8% (31 December 2018: 37%) Going forward, the Bank is in process of completing the next two steps of its plan, specifically, a) the sale of 20% of the mezzanine and junior notes of a securitization of a mixed assets portfolio of NPEs with a gross book value of ca. € 7.5 bn (Project Cairo) and b) the sale of a majority stake in Financial Planning Services S.A. (FPS), the licensed 100%-owned loan servicer of Eurobank (Project Europe). Further information is provided in the Interim Consolidated Financial Statements note 24. Corporate Transformation – Hive down In the context of the NPE reduction acceleration plan, as announced in November 2018, the BoD of the Bank (“Demerged Entity”) on 28 June 2019 decided the initiation of the hive down process of the banking business sector of Eurobank and its transfer to a new company-credit institution that will be established (“the Beneficiary”). On 31 July 2019, the BoD of the Bank approved the Draft Demerger Deed through the aforementioned hive down and establishment of a new company-credit institution, pursuant to Article 16 of Law 2515/1997 and Articles 57 (3) and 59-74 of Law 4601/2019, as currently in force. In particular, the demerger will involve the hive-down of the banking business sector of Eurobank, to which the assets and the liabilities, as described on the transformation balance sheet of the hived-down sector as at 30 June 2019 (“Transformation Date”), are included. All actions that will take place after the Transformation Date and will concern the hived down sector shall be treated as occurring on behalf of the Beneficiary. The Demerged Entity will maintain activities and assets that are not related to the main banking activities but are mainly related to the strategic planning of the administration of non-performing loans and the provision of services to the Group companies and third parties. Furthermore, the Demerged Entity will retain: a) 95% of the mezzanine and junior notes of Projects Pillar and Cairo, b) the preferred securities and c) participations in certain subsidiaries including Be Business Exchanges S.A. and real estate companies related to projects Pillar and Cairo. Upon the completion of the demerger (i.e. the date of registration with the General Commercial Registry of the relevant approval by the competent Authority), the following shall take place: a) The Beneficiary will be incorporated and the Demerged Entity shall become the shareholder of the Beneficiary by acquiring all the shares issued by the Beneficiary and b) the Beneficiary substitutes the Demerged Entity, by way of universal succession, to all the transferred assets and liabilities, as set out in the transformation balance sheet of the hived down sector and formed up to the completion of the demerger. As of 9 August 2019, the Draft Demerger Deed of the Bank, is available on its website as well as the website of the General Commercial Registry. The completion of the demerger is subject to the required by the Law approval of the General Meeting of the
shareholders of the Bank as well as the receipt of all necessary approvals by the competent Authorities.
1.1 Regulatory framework
The general Basel III framework is structured around three mutually reinforcing pillars:
• Pillar 1 defines the minimum regulatory capital requirements, based on principles, rules and methods specifying and measuring credit, market and operational risk. These requirements are covered by regulatory own funds, according to the rules and specifications of CRR.
• Pillar 2 addresses the internal processes for assessing overall capital adequacy in relation to risks Internal Capital Adequacy Assessment Process - ICAAP and Internal Liquidity Assessment Process ILAAP). Pillar 2 also introduces the Supervisory Review & Evaluation Process (SREP), which assesses the internal capital adequacy of credit institutions.
• Pillar 3 deals with market discipline by developing a set of quantitative and qualitative disclosure requirements, which allow market participants to assess key pieces of information on the scope of application, capital, risk
EUROBANK ERGASIAS S.A. Consolidated Pillar 3 Report
Introduction - General Information
8 | Page 30 June 2019 Consol idated Pi l lar 3 Report
exposures, risk assessment processes and hence the capital adequacy and the internal liquidity adequacy of credit institutions.
According to the CRD IV provisions (with gradual implementation until 2019):
Minimum Common Equity Tier 1 (CET1) ratio: 4.5%;
Minimum Tier 1 ratio: 6%;
Minimum Total Capital ratio: 8%
Furthermore, banks are required to maintain in addition to the Common Equity Tier 1 capital a capital conservation buffer equal to 2.5% (from 1 January 2019) of their total risk exposure amount calculated.
As a result the minimum ratios which must be met, including the capital conservation buffer, and which shall apply from 1 January 2019 are: a) Minimum CET1 capital ratio 7%; and b) Total capital adequacy ratio 10.5%. Additional capital buffers that CRD IV introduces are the following: a) Countercyclical buffer. The purpose of this buffer is to counteract the effects of the economic cycle on banks’
lending activity, thus making the supply of credit less volatile and possibly even reduce the probability of credit bubbles or crunches. Credit institutions are required under the CRD IV to build up an additional buffer of 0 - 2.5% of CET1 during periods of excess credit growth, according to national circumstances. According to BoG Executive Committee Acts, the countercyclical buffer was set at 0% for 2019.
b) Global systemic institution buffer (G-SIIs). CRD IV includes a mandatory systemic risk buffer of CET1 for banks that are identified by the relevant authority as globally systemically important, which is not applicable to Greek banks.
c) Other systemically important institutions buffer. On 20.03.2019 European Banking Authority (EBA) published the updated list of Other Systematically Important Institutions (O-SIIs) in the EU. O-SIIs are those institutions which are deemed systematically relevant in addition to G-SIIs, already identified. This list reflects also the additional capital buffers that the relevant authorities have set for the O-SIIs. The identification of institutions as O-SIIs is based on 2018 data and the list is disclosed on an annual basis, along with the definition of any CET1 capital buffer requirements which may need to be set. In case of higher capital requirements, these become applicable at least one year after the publication of the O-SIIs list, to give institutions enough time to adjust to the new buffer requirements.
The EBA methodology has been applied to compute the scores for all the institutions operating in Greece using consolidated data. Based on the above scoring system, all Greek O-SIIs are classified in bucket 4 which corresponds to a capital buffer of 1% which will be phased in until 2022. The date of activation was 1 January 2016 and BoG’s Executive Committee Act 151/30.10.2018 set the O-SII buffer for Greek Institutions for the year 2019 at 0.25%.
1.2 Regulatory developments
On 25 February 2019 BCBS published the Minimum capital requirements for market risk. The revised market risk framework will take effect as of 1 January 2022. On 17 April 2019, the European Parliament and the Council published the Regulation (EU) 2019/630 amending Regulation (EU) 575/2013 as regards minimum loss coverage for non performing exposures (NPEs). On the basis of a common definition of non-performing loans, the proposed new rules introduce a "prudential backstop” that is, a minimum loss coverage for the amount banks need to set aside to cover losses caused by future loans that turn to non-performing. Different coverage requirements will apply depending on the classification of the NPEs as "unsecured" or "secured" and whether the collateral is movable or immovable. The prudential backstop will be applied at an exposure-by-exposure level. For unsecured NPEs, a calendar of three years should apply, while for NPEs secured by immovable collateral and residential loans guaranteed by an eligible protection provider, a calendar of nine years should apply. For other secured NPEs a calendar of seven years should apply in order to build up full coverage. Insufficient provisions for NPEs will require corresponding deductions from the Bank's CET 1 capital (Pillar 1 measure).
EUROBANK ERGASIAS S.A. Consolidated Pillar 3 Report
Introduction - General Information
9 | Page 30 June 2019 Consol idated Pi l lar 3 Report
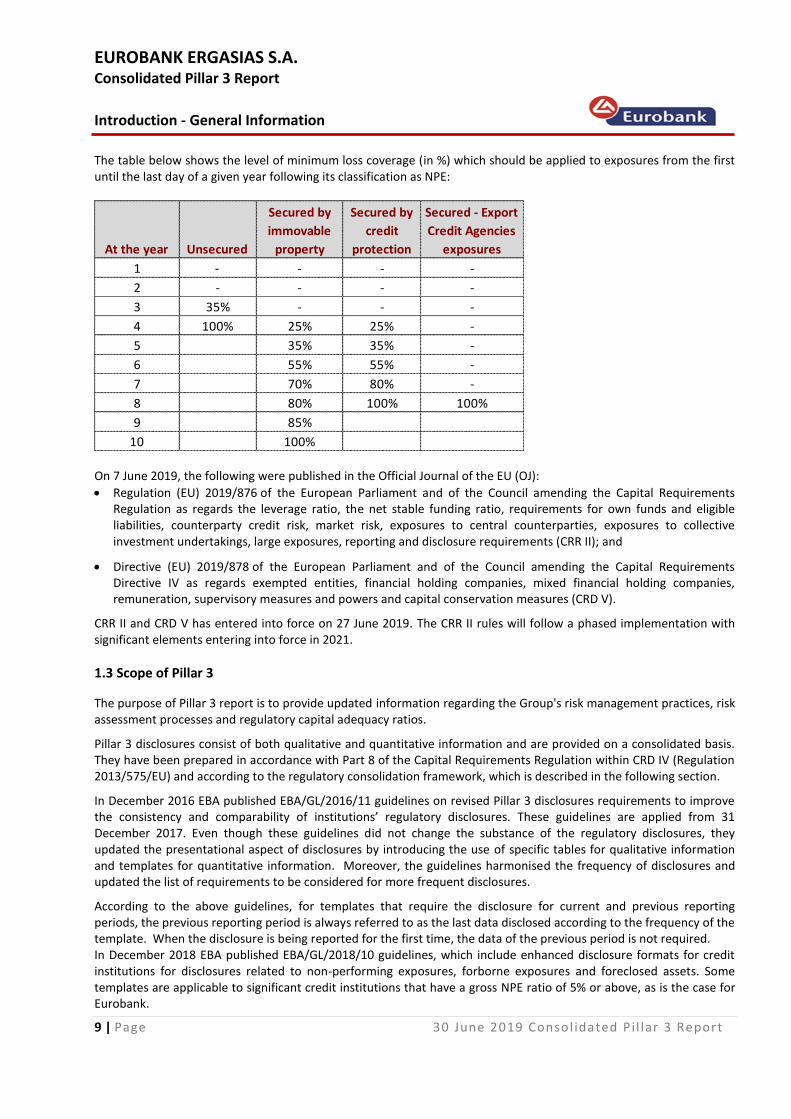
The table below shows the level of minimum loss coverage (in %) which should be applied to exposures from the first until the last day of a given year following its classification as NPE:
At the year Unsecured
Secured by
immovable
property
Secured by
credit
protection
Secured - Export
Credit Agencies
exposures
1 - - - -
2 - - - -
3 35% - - -
4 100% 25% 25% -
5 35% 35% -
6 55% 55% -
7 70% 80% -
8 80% 100% 100%
9 85%
10 100% On 7 June 2019, the following were published in the Official Journal of the EU (OJ):
Regulation (EU) 2019/876 of the European Parliament and of the Council amending the Capital Requirements Regulation as regards the leverage ratio, the net stable funding ratio, requirements for own funds and eligible liabilities, counterparty credit risk, market risk, exposures to central counterparties, exposures to collective investment undertakings, large exposures, reporting and disclosure requirements (CRR II); and
Directive (EU) 2019/878 of the European Parliament and of the Council amending the Capital Requirements
Directive IV as regards exempted entities, financial holding companies, mixed financial holding companies, remuneration, supervisory measures and powers and capital conservation measures (CRD V).
CRR II and CRD V has entered into force on 27 June 2019. The CRR II rules will follow a phased implementation with significant elements entering into force in 2021.
1.3 Scope of Pillar 3
The purpose of Pillar 3 report is to provide updated information regarding the Group's risk management practices, risk assessment processes and regulatory capital adequacy ratios. Pillar 3 disclosures consist of both qualitative and quantitative information and are provided on a consolidated basis. They have been prepared in accordance with Part 8 of the Capital Requirements Regulation within CRD IV (Regulation 2013/575/EU) and according to the regulatory consolidation framework, which is described in the following section. In December 2016 EBA published EBA/GL/2016/11 guidelines on revised Pillar 3 disclosures requirements to improve the consistency and comparability of institutions’ regulatory disclosures. These guidelines are applied from 31 December 2017. Even though these guidelines did not change the substance of the regulatory disclosures, they updated the presentational aspect of disclosures by introducing the use of specific tables for qualitative information and templates for quantitative information. Moreover, the guidelines harmonised the frequency of disclosures and updated the list of requirements to be considered for more frequent disclosures. According to the above guidelines, for templates that require the disclosure for current and previous reporting periods, the previous reporting period is always referred to as the last data disclosed according to the frequency of the template. When the disclosure is being reported for the first time, the data of the previous period is not required. In December 2018 EBA published EBA/GL/2018/10 guidelines, which include enhanced disclosure formats for credit institutions for disclosures related to non-performing exposures, forborne exposures and foreclosed assets. Some templates are applicable to significant credit institutions that have a gross NPE ratio of 5% or above, as is the case for Eurobank.
EUROBANK ERGASIAS S.A. Consolidated Pillar 3 Report
Introduction - General Information
10 | Page 30 June 2019 Consolidated Pi l lar 3 Report
Even though these guidelines apply from 31 December 2019, institutions under the scope of application of the templates subject to the 5% gross NPE have to comply with the guidelines prior to the disclosure reference date.
1.3.1 Location, timing and frequency of disclosures
Pillar 3 disclosures are provided on a quarterly basis, following the relevant recommendation of EBA Guidelines 2016/11, which did not change the approach in the EBA Guidelines 2014/14 but updated the list of requirements to be considered for more frequent disclosures. Pillar 3 disclosures are provided with reference date (corresponding period) the close of the previous quarter and in conjunction with the date of publication of the financial statements. Equivalent disclosures made by the Group under accounting, listing or other requirements are deemed to constitute compliance with the requirements of the aforementioned Regulation (EU) No 575/2013 (Part Eight) taking into consideration any existing relevant implementing Regulations as well as the European Banking Authority (EBA) guidelines. Pillar 3 disclosures are provided in a designated location on the Bank’s website (www.eurobank.gr/en/group/investor-relations/financial-results) in chronological order and cover both quantitative and qualitative information. Quantitative information, which is included in the Group’s Consolidated Financial Statements, is also provided at the above location. In this way, the Bank secures easy access of the market participants to continuous and complete information without cross-reference to other locations or media of communication. The information contained in the Pillar 3 Disclosures has been verified by the Audit Committee.
1.4 Regulatory versus accounting consolidation
There is no difference between regulatory and accounting consolidation. ERB Hellas Funding Ltd and ERB Hellas Plc are included in the calculation of the non-consolidated capital requirements and regulatory own funds of the Bank (solo consolidation). List of all subsidiary undertakings can be found in the Condensed Consolidated Interim Financial Statements note 17.
EUROBANK ERGASIAS S.A. Consolidated Pillar 3 Report
Introduction - General Information
11 | Page 30 June 2019 Consolidated Pi l lar 3 Report
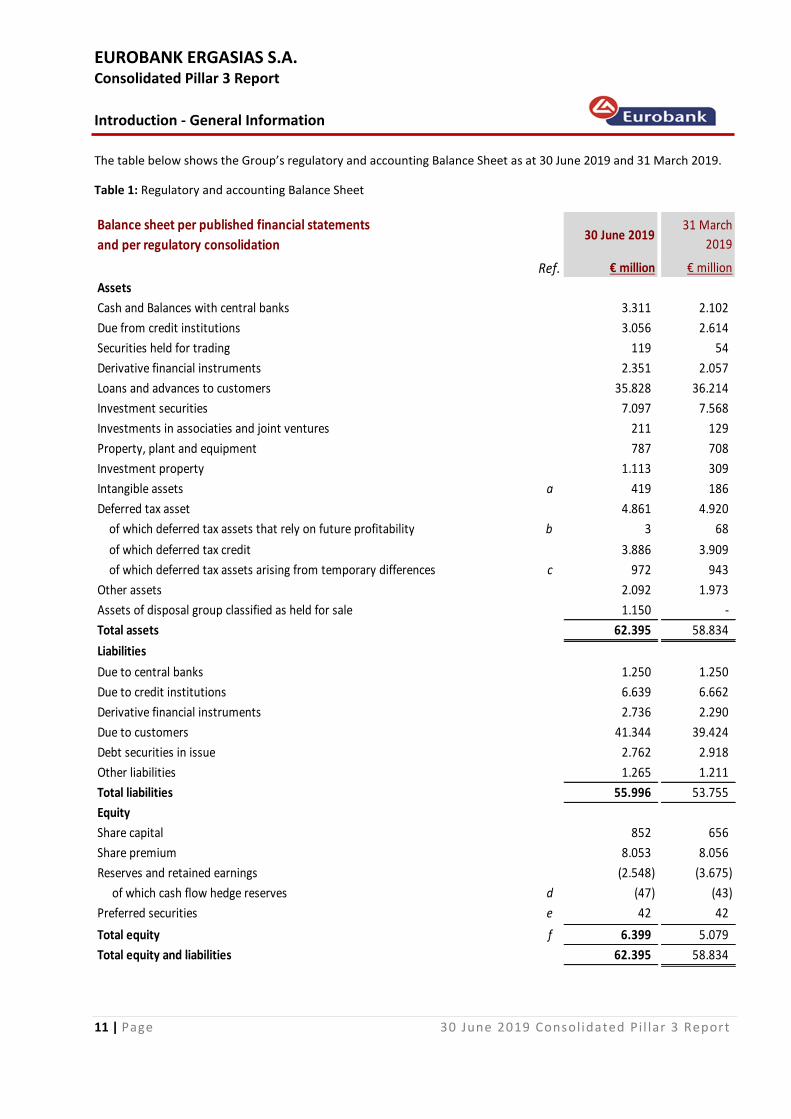
The table below shows the Group’s regulatory and accounting Balance Sheet as at 30 June 2019 and 31 March 2019.
Table 1: Regulatory and accounting Balance Sheet
Balance sheet per published financial statements
and per regulatory consolidation30 June 2019
31 March
2019
Ref. € million € million
Assets
Cash and Balances with central banks 3.311 2.102
Due from credit institutions 3.056 2.614
Securities held for trading 119 54
Derivative financial instruments 2.351 2.057
Loans and advances to customers 35.828 36.214
Investment securities 7.097 7.568
Investments in associaties and joint ventures 211 129
Property, plant and equipment 787 708
Investment property 1.113 309
Intangible assets a 419 186
Deferred tax asset 4.861 4.920
of which deferred tax assets that rely on future profitability
excluding those arising from temporary differences
b 3 68
of which deferred tax credit 3.886 3.909
of which deferred tax assets arising from temporary differences c 972 943
Other assets 2.092 1.973
Assets of disposal group classified as held for sale 1.150 -
Total assets 62.395 58.834
Liabilities
Due to central banks 1.250 1.250
Due to credit institutions 6.639 6.662
Derivative financial instruments 2.736 2.290
Due to customers 41.344 39.424
Debt securities in issue 2.762 2.918
Other liabilities 1.265 1.211
Total liabilities 55.996 53.755
Equity
Share capital 852 656
Share premium 8.053 8.056
Reserves and retained earnings (2.548) (3.675)
of which cash flow hedge reserves d (47) (43)
Preferred securities e 42 42
Non controlling interests f 42 Total equity f 6.399 5.079
Total equity and liabilities 62.395 58.834
EUROBANK ERGASIAS S.A. Consolidated Pillar 3 Report
Capital Management
12 | Page 30 June 2019 Consolidated Pi l lar 3 Report
2. Capital Management
2.1 Regulatory Capital
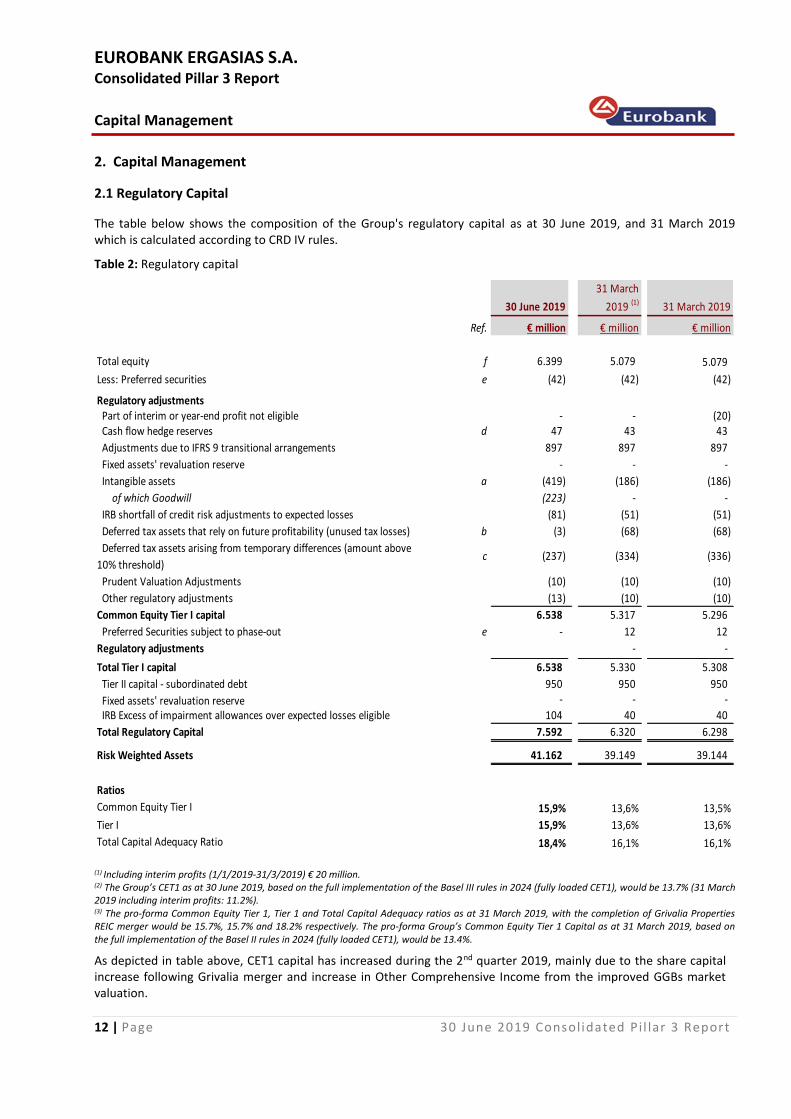
The table below shows the composition of the Group's regulatory capital as at 30 June 2019, and 31 March 2019 which is calculated according to CRD IV rules. Table 2: Regulatory capital
30 June 2019
31 March
2019 (1) 31 March 2019
Ref. € million € million € million
Total equity f 6.399 5.079 5.079
Less: Preferred securities e (42) (42) (42)
Regulatory adjustments Part of interim or year-end profit not eligible - - (20) Cash flow hedge reserves d 47 43 43
897 897 897
- - -
Intangible assets a (419) (186) (186)
of which Goodwill (223) - -
(81) (51) (51)
b (3) (68) (68)
c (237) (334) (336)
Prudent Valuation Adjustments (10) (10) (10)
(13) (10) (10)
Common Equity Tier I capital 6.538 5.317 5.296
Preferred Securities subject to phase-out e - 12 12
Regulatory adjustments - -
Total Tier I capital 6.538 5.330 5.308
Tier II capital - subordinated debt 950 950 950
Fixed assets' revaluation reserve - - -
IRB Excess of impairment allowances over expected losses eligible 104 40 40
Total Regulatory Capital 7.592 6.320 6.298
Risk Weighted Assets 41.162 39.149 39.144
Ratios
Common Equity Tier I 15,9% 13,6% 13,5%
Tier I 15,9% 13,6% 13,6%
Total Capital Adequacy Ratio 18,4% 16,1% 16,1%
Other regulatory adjustments
Deferred tax assets that rely on future profitability (unused tax losses)
Deferred tax assets arising from temporary differences (amount above
10% threshold)
Adjustments due to IFRS 9 transitional arrangements
Fixed assets' revaluation reserve
IRB shortfall of credit risk adjustments to expected losses
(1) Including interim profits (1/1/2019-31/3/2019) € 20 million. (2) The Group’s CET1 as at 30 June 2019, based on the full implementation of the Basel III rules in 2024 (fully loaded CET1), would be 13.7% (31 March 2019 including interim profits: 11.2%). (3) The pro-forma Common Equity Tier 1, Tier 1 and Total Capital Adequacy ratios as at 31 March 2019, with the completion of Grivalia Properties REIC merger would be 15.7%, 15.7% and 18.2% respectively. The pro-forma Group’s Common Equity Tier 1 Capital as at 31 March 2019, based on the full implementation of the Basel II rules in 2024 (fully loaded CET1), would be 13.4%.
As depicted in table above, CET1 capital has increased during the 2nd quarter 2019, mainly due to the share capital increase following Grivalia merger and increase in Other Comprehensive Income from the improved GGBs market valuation.
EUROBANK ERGASIAS S.A. Consolidated Pillar 3 Report
Capital Management
13 | Page 30 June 2019 Consolidated Pi l lar 3 Report
2.2 IFRS 9 capital impact
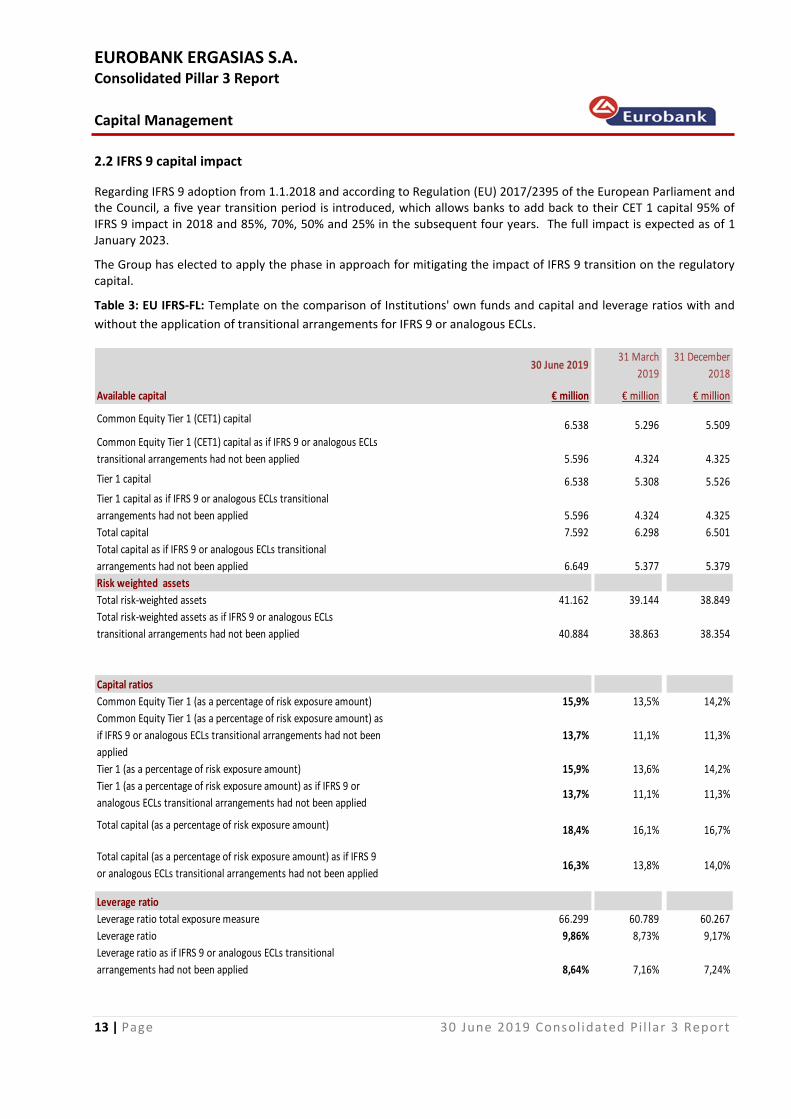
Regarding IFRS 9 adoption from 1.1.2018 and according to Regulation (EU) 2017/2395 of the European Parliament and the Council, a five year transition period is introduced, which allows banks to add back to their CET 1 capital 95% of IFRS 9 impact in 2018 and 85%, 70%, 50% and 25% in the subsequent four years. The full impact is expected as of 1 January 2023. The Group has elected to apply the phase in approach for mitigating the impact of IFRS 9 transition on the regulatory capital. Table 3: EU IFRS-FL: Template on the comparison of Institutions' own funds and capital and leverage ratios with and
without the application of transitional arrangements for IFRS 9 or analogous ECLs.
30 June 201931 March
2019
31 December
2018
Available capital € million € million € million
Common Equity Tier 1 (CET1) capital6.538 5.296 5.509
Common Equity Tier 1 (CET1) capital as if IFRS 9 or analogous ECLs
transitional arrangements had not been applied 5.596 4.324 4.325
Tier 1 capital 6.538 5.308 5.526
Tier 1 capital as if IFRS 9 or analogous ECLs transitional
arrangements had not been applied 5.596 4.324 4.325
Total capital 7.592 6.298 6.501
Total capital as if IFRS 9 or analogous ECLs transitional
arrangements had not been applied 6.649 5.377 5.379
Risk weighted assets
Total risk-weighted assets 41.162 39.144 38.849
Total risk-weighted assets as if IFRS 9 or analogous ECLs
transitional arrangements had not been applied 40.884 38.863 38.354
Capital ratios
Common Equity Tier 1 (as a percentage of risk exposure amount) 15,9% 13,5% 14,2%
Common Equity Tier 1 (as a percentage of risk exposure amount) as
if IFRS 9 or analogous ECLs transitional arrangements had not been
applied
13,7% 11,1% 11,3%
Tier 1 (as a percentage of risk exposure amount) 15,9% 13,6% 14,2%
Tier 1 (as a percentage of risk exposure amount) as if IFRS 9 or
analogous ECLs transitional arrangements had not been applied13,7% 11,1% 11,3%
Total capital (as a percentage of risk exposure amount) 18,4% 16,1% 16,7%
Total capital (as a percentage of risk exposure amount) as if IFRS 9
or analogous ECLs transitional arrangements had not been applied16,3% 13,8% 14,0%
Leverage ratio
Leverage ratio total exposure measure 66.299 60.789 60.267
Leverage ratio 9,86% 8,73% 9,17%
Leverage ratio as if IFRS 9 or analogous ECLs transitional
arrangements had not been applied 8,64% 7,16% 7,24%
EUROBANK ERGASIAS S.A. Consolidated Pillar 3 Report
Capital Management
14 | Page 30 June 2019 Consolidated Pi l lar 3 Report
2.3 Supervisory Review and Evaluation Process (SREP) capital requirements
Based on Council Regulation No. 1024/2013, the European Central Bank (ECB) conducts annually a Supervisory Review and Evaluation Process (SREP) in order to define the prudential requirements of the institutions under its supervision. The key purpose of the SREP is to ensure that institutions have adequate arrangements, strategies, processes and mechanisms as well as capital and liquidity to ensure a sound management and coverage of their risks, to which they are or might be exposed, including those revealed by stress testing and risks the institution may pose to the financial system. According to the 2018 SREP decision, starting from 1 March 2019, the Bank is required to meet on a consolidated basis and on an individual basis a Common Equity Tier 1 ratio of at least 10.25% and a Total Capital Adequacy Ratio of at least 13.75% (Overall Capital Requirements including the Capital Conservation Buffer and the Other Systemically Important Institutions Buffer).
2.3 Capital requirements under Pillar 1
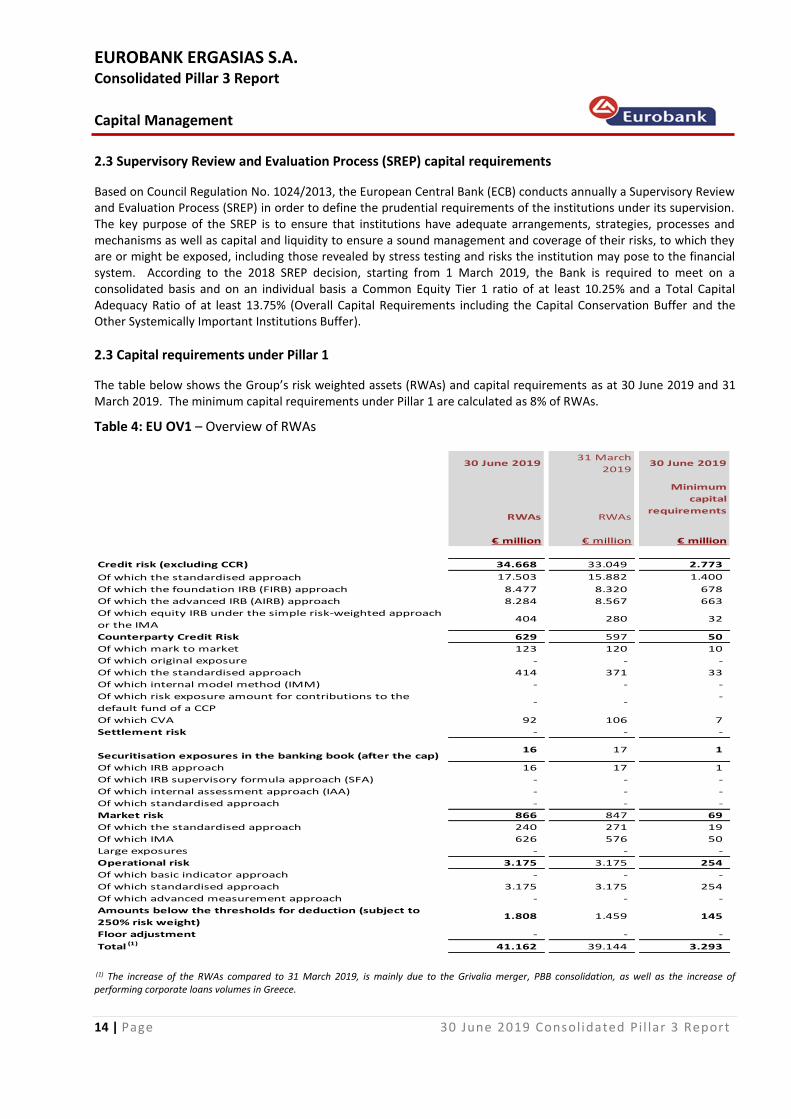
The table below shows the Group’s risk weighted assets (RWAs) and capital requirements as at 30 June 2019 and 31 March 2019. The minimum capital requirements under Pillar 1 are calculated as 8% of RWAs. Table 4: EU OV1 – Overview of RWAs
30 June 201931 March
201930 June 2019
RWAs RWAs
Minimum
capital
requirements
€ million € million € million
Credit risk (excluding CCR) 34.668 33.049 2.773
Of which the standardised approach 17.503 15.882 1.400
Of which the foundation IRB (FIRB) approach 8.477 8.320 678
Of which the advanced IRB (AIRB) approach 8.284 8.567 663
Of which equity IRB under the simple risk-weighted approach
or the IMA404 280 32
Counterparty Credit Risk 629 597 50
Of which mark to market 123 120 10
Of which original exposure - - -
Of which the standardised approach 414 371 33
Of which internal model method (IMM) - - -
Of which risk exposure amount for contributions to the
default fund of a CCP- -
-
Of which CVA 92 106 7
Settlement risk - - -
Securitisation exposures in the banking book (after the cap)16 17 1
Of which IRB approach 16 17 1
Of which IRB supervisory formula approach (SFA) - - -
Of which internal assessment approach (IAA) - - -
Of which standardised approach - - -
Market risk 866 847 69
Of which the standardised approach 240 271 19
Of which IMA 626 576 50
Large exposures - - -
Operational risk 3.175 3.175 254
Of which basic indicator approach - - -
Of which standardised approach 3.175 3.175 254
Of which advanced measurement approach - - -
Amounts below the thresholds for deduction (subject to
250% risk weight)1.808 1.459 145
Floor adjustment - - -
Total (1) 41.162 39.144 3.293
(1) The increase of the RWAs compared to 31 March 2019, is mainly due to the Grivalia merger, PBB consolidation, as well as the increase of performing corporate loans volumes in Greece.
EUROBANK ERGASIAS S.A. Consolidated Pillar 3 Report
Capital Management
15 | Page 30 June 2019 Consolidated Pi l lar 3 Report
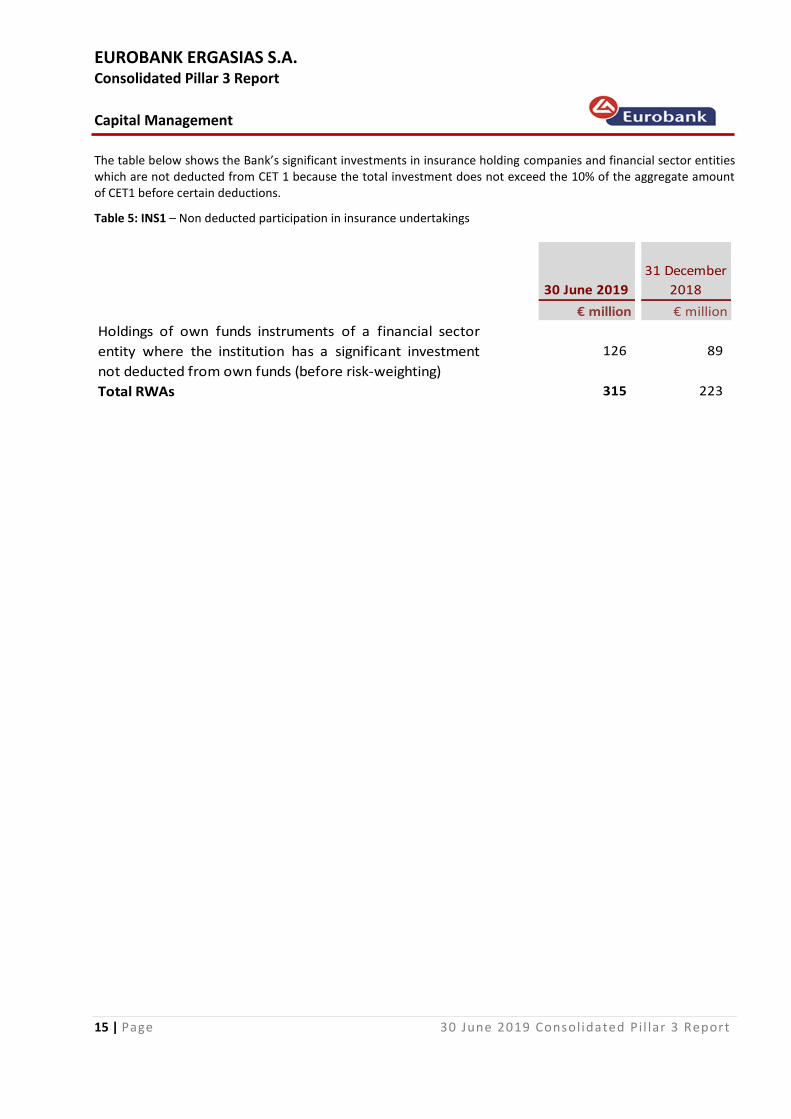
The table below shows the Bank’s significant investments in insurance holding companies and financial sector entities which are not deducted from CET 1 because the total investment does not exceed the 10% of the aggregate amount of CET1 before certain deductions. Table 5: INS1 – Non deducted participation in insurance undertakings
30 June 2019
31 December
2018
€ million € million
Holdings of own funds instruments of a financial sector
entity where the institution has a significant investment
not deducted from own funds (before risk-weighting)
126 89
Total RWAs 315 223
EUROBANK ERGASIAS S.A. Consolidated Pillar 3 Report
Credit Risk
16 | Page 30 June 2019 Consolidated Pi l lar 3 Report
3. Credit Risk
Credit risk is the risk that a counterparty will be unable to fulfill its payment obligations in full when due. Credit risk also includes country risk and settlement risk. In June 2008, the Group received the approval of BoG to use the Internal Ratings Based (IRB) approach to calculate the capital requirement for credit risk. Therefore, with effect from 1 January 2008 the Group applies: • The Foundation IRB approach to calculate risk weighted assets for the corporate loans' portfolio of Eurobank
Ergasias S.A. in Greece • The Advanced IRB for the majority of the retail loans' portfolio of the Bank, i.e. mortgages, small business lending,
credit cards and revolving credits in consumer lending. • From September 2009 the Foundation IRB approach was applied for the corporate loans' portfolio of Eurobank
Ergasias Leasing S.A. in Greece. • From March 2010 the Advanced IRB approach was applied for the Bank's portfolio of personal and car loans. The implementation of IRB covers 4 77% of the Group's lending portfolio excluding portfolio segments which are immaterial in terms of size and risk profile as well as, permanent exemptions. There is a permanent exemption from the IRB approach, up to 10% of Risk Weighted Assets, for which the Standardised approach is applied. In addition to the exemption of up to 10% of Risk Weighted Assets, permanent exemption has been granted for the following exposure classes as prescribed in the CRD:
exposures to/or guaranteed by central governments and central banks;
exposures to/or guaranteed by credit and financial institutions; and
exposures to administrative bodies and non-commercial undertakings. The Standardised approach is applied for these exposures.
EUROBANK ERGASIAS S.A. Consolidated Pillar 3 Report
Credit Risk
17 | Page 30 June 2019 Consolidated Pi l lar 3 Report
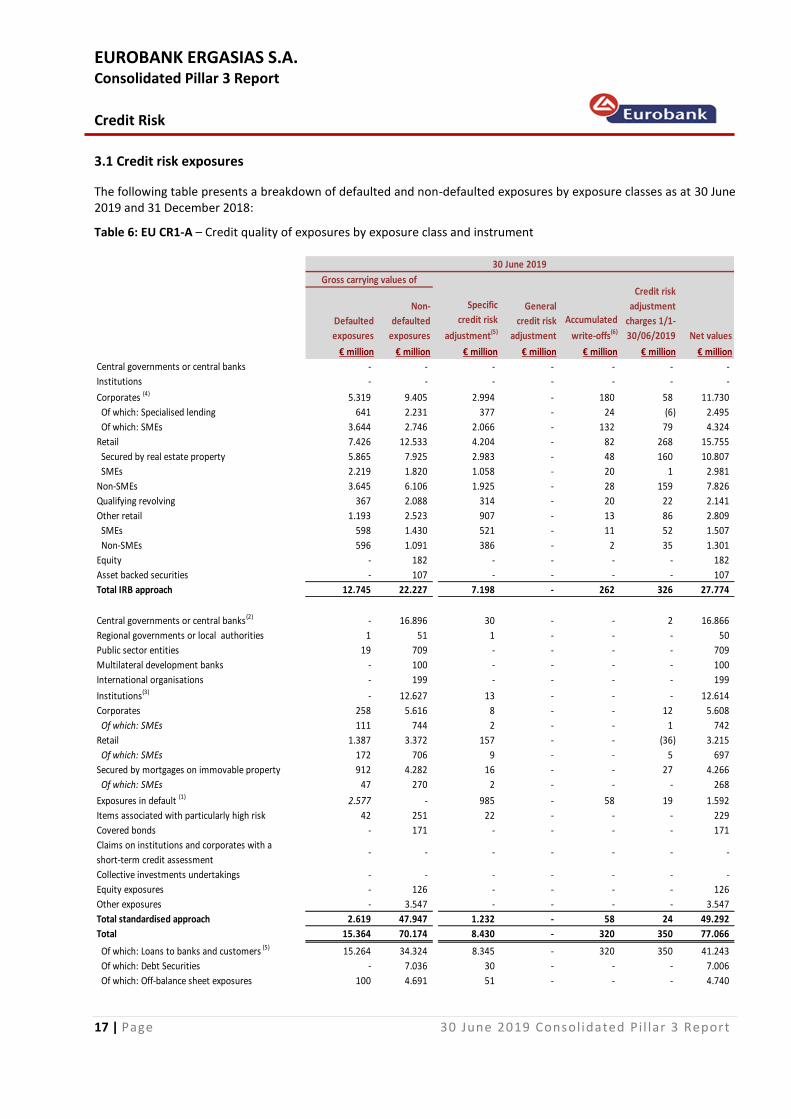
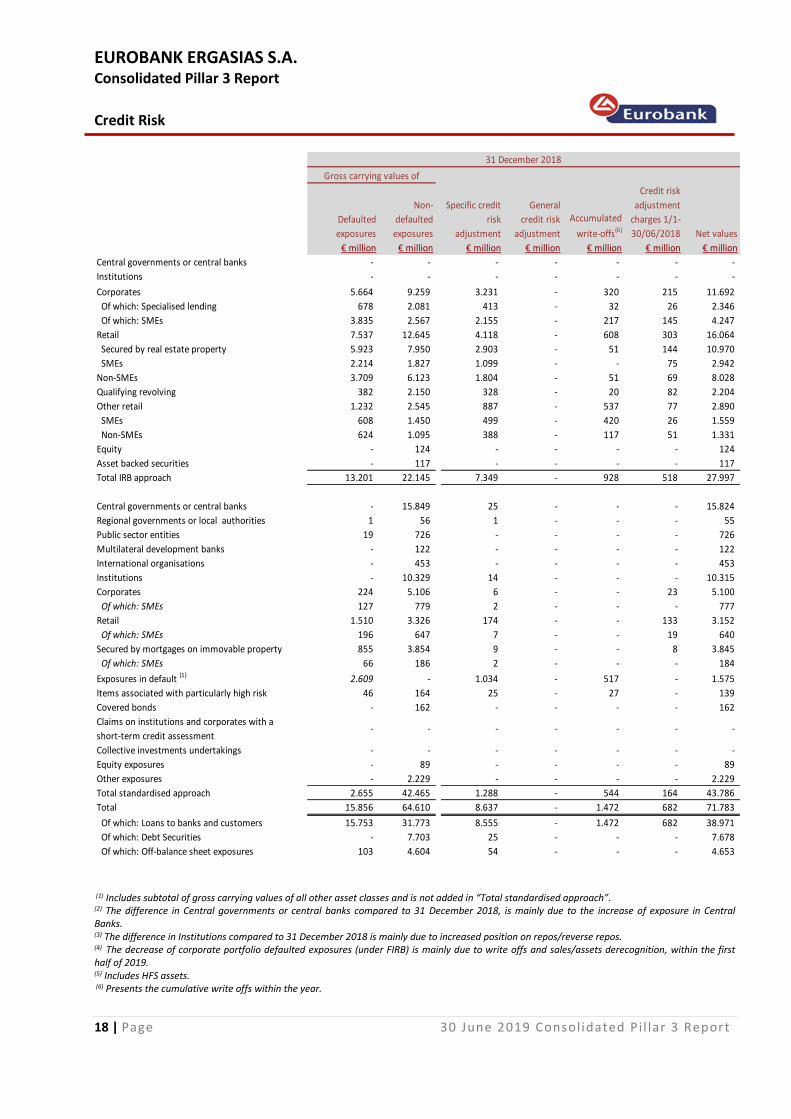
3.1 Credit risk exposures
The following table presents a breakdown of defaulted and non-defaulted exposures by exposure classes as at 30 June 2019 and 31 December 2018: Table 6: EU CR1-A – Credit quality of exposures by exposure class and instrument
Defaulted
exposures
Non-
defaulted
exposures
Specific
credit risk
adjustment(5)
General
credit risk
adjustment
Accumulated
write-offs(6)
Credit risk
adjustment
charges 1/1-
30/06/2019 Net values
€ million € million € million € million € million € million € million
Central governments or central banks - - - - - - -
Institutions - - - - - - -
Corporates (4) 5.319 9.405 2.994 - 180 58 11.730
Of which: Specialised lending 641 2.231 377 - 24 (6) 2.495
Of which: SMEs 3.644 2.746 2.066 - 132 79 4.324
Retail 7.426 12.533 4.204 - 82 268 15.755
Secured by real estate property 5.865 7.925 2.983 - 48 160 10.807
SMEs 2.219 1.820 1.058 - 20 1 2.981
Non-SMEs 3.645 6.106 1.925 - 28 159 7.826
Qualifying revolving 367 2.088 314 - 20 22 2.141
Other retail 1.193 2.523 907 - 13 86 2.809
SMEs 598 1.430 521 - 11 52 1.507
Non-SMEs 596 1.091 386 - 2 35 1.301
Equity - 182 - - - - 182
Asset backed securities - 107 - - - - 107
Total IRB approach 12.745 22.227 7.198 - 262 326 27.774
Central governments or central banks(2) - 16.896 30 - - 2 16.866
Regional governments or local authorities 1 51 1 - - - 50
Public sector entities 19 709 - - - - 709
Multilateral development banks - 100 - - - - 100
International organisations - 199 - - - - 199
Institutions(3) - 12.627 13 - - - 12.614
Corporates 258 5.616 8 - - 12 5.608
Of which: SMEs 111 744 2 - - 1 742
Retail 1.387 3.372 157 - - (36) 3.215
Of which: SMEs 172 706 9 - - 5 697
912 4.282 16 - - 27 4.266
Of which: SMEs 47 270 2 - - - 268
Exposures in default (1) 2.577 - 985 - 58 19 1.592
Items associated with particularly high risk 42 251 22 - - - 229
Covered bonds - 171 - - - - 171
Claims on institutions and corporates with a
short-term credit assessment- - - - - - -
Collective investments undertakings - - - - - - -
Equity exposures - 126 - - - - 126
Other exposures - 3.547 - - - - 3.547
Total standardised approach 2.619 47.947 1.232 - 58 24 49.292
Total 15.364 70.174 8.430 - 320 350 77.066
Of which: Loans to banks and customers (5) 15.264 34.324 8.345 - 320 350 41.243
Of which: Debt Securities - 7.036 30 - - - 7.006
Of which: Off-balance sheet exposures 100 4.691 51 - - - 4.740
30 June 2019
Gross carrying values of
Secured by mortgages on immovable property
EUROBANK ERGASIAS S.A. Consolidated Pillar 3 Report
Credit Risk
18 | Page 30 June 2019 Consolidated Pi l lar 3 Report
Defaulted
exposures
Non-
defaulted
exposures
Specific credit
risk
adjustment
General
credit risk
adjustment
Accumulated
write-offs(6)
Credit risk
adjustment
charges 1/1-
30/06/2018 Net values
€ million € million € million € million € million € million € million
Central governments or central banks - - - - - - -
Institutions - - - - - - -
Corporates 5.664 9.259 3.231 - 320 215 11.692
Of which: Specialised lending 678 2.081 413 - 32 26 2.346
Of which: SMEs 3.835 2.567 2.155 - 217 145 4.247
Retail 7.537 12.645 4.118 - 608 303 16.064
Secured by real estate property 5.923 7.950 2.903 - 51 144 10.970
SMEs 2.214 1.827 1.099 - - 75 2.942
Non-SMEs 3.709 6.123 1.804 - 51 69 8.028
Qualifying revolving 382 2.150 328 - 20 82 2.204
Other retail 1.232 2.545 887 - 537 77 2.890
SMEs 608 1.450 499 - 420 26 1.559
Non-SMEs 624 1.095 388 - 117 51 1.331
Equity - 124 - - - - 124
Asset backed securities - 117 - - - - 117
Total IRB approach 13.201 22.145 7.349 - 928 518 27.997
Central governments or central banks - 15.849 25 - - - 15.824
Regional governments or local authorities 1 56 1 - - - 55
Public sector entities 19 726 - - - - 726
Multilateral development banks - 122 - - - - 122
International organisations - 453 - - - - 453
Institutions - 10.329 14 - - - 10.315
Corporates 224 5.106 6 - - 23 5.100
Of which: SMEs 127 779 2 - - - 777
Retail 1.510 3.326 174 - - 133 3.152
Of which: SMEs 196 647 7 - - 19 640
855 3.854 9 - - 8 3.845
Of which: SMEs 66 186 2 - - - 184
Exposures in default (1) 2.609 - 1.034 - 517 - 1.575
Items associated with particularly high risk 46 164 25 - 27 - 139
Covered bonds - 162 - - - - 162
Claims on institutions and corporates with a
short-term credit assessment- - - - - - -
Collective investments undertakings - - - - - - -
Equity exposures - 89 - - - - 89
Other exposures - 2.229 - - - - 2.229
Total standardised approach 2.655 42.465 1.288 - 544 164 43.786
Total 15.856 64.610 8.637 - 1.472 682 71.783
Of which: Loans to banks and customers 15.753 31.773 8.555 - 1.472 682 38.971
Of which: Debt Securities - 7.703 25 - - - 7.678
Of which: Off-balance sheet exposures 103 4.604 54 - - - 4.653
Secured by mortgages on immovable property
31 December 2018
Gross carrying values of
(1) Includes subtotal of gross carrying values of all other asset classes and is not added in “Total standardised approach”. (2) The difference in Central governments or central banks compared to 31 December 2018, is mainly due to the increase of exposure in Central Banks. (3) The difference in Institutions compared to 31 December 2018 is mainly due to increased position on repos/reverse repos. (4) The decrease of corporate portfolio defaulted exposures (under FIRB) is mainly due to write offs and sales/assets derecognition, within the first half of 2019. (5) Includes HFS assets. (6) Presents the cumulative write offs within the year.
EUROBANK ERGASIAS S.A. Consolidated Pillar 3 Report
Credit Risk
19 | Page 30 June 2019 Consolidated Pi l lar 3 Report
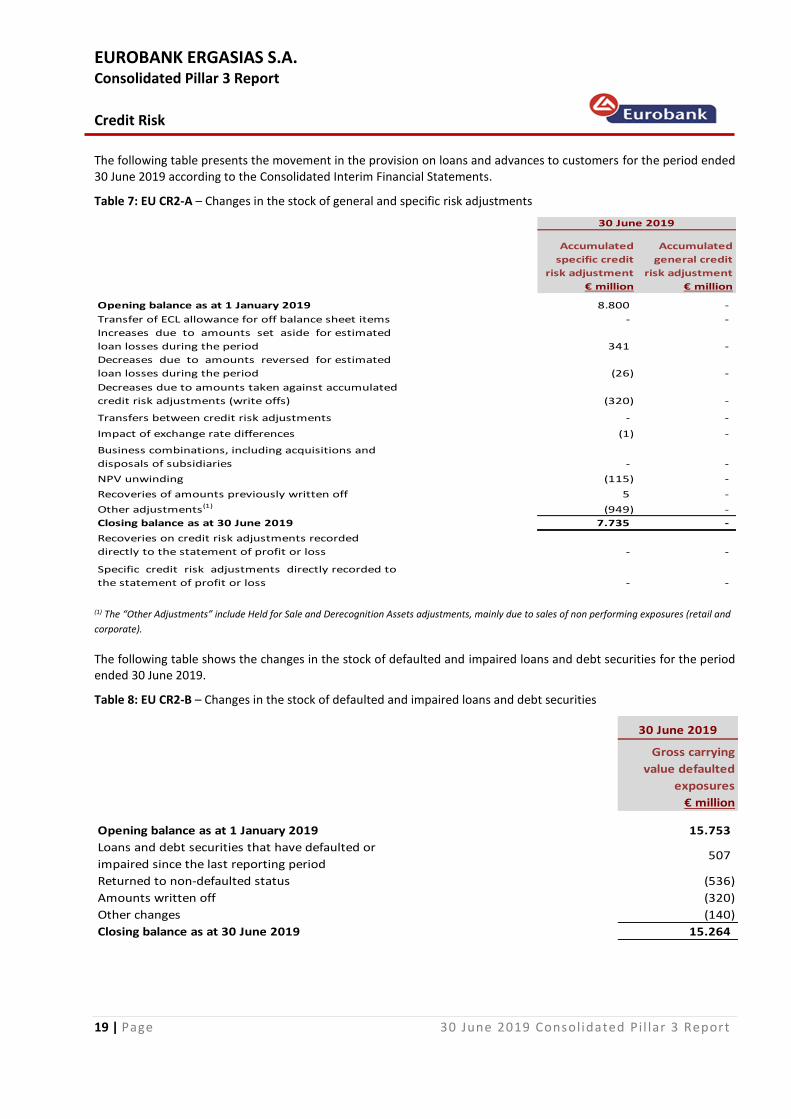
The following table presents the movement in the provision on loans and advances to customers for the period ended 30 June 2019 according to the Consolidated Interim Financial Statements. Table 7: EU CR2-A – Changes in the stock of general and specific risk adjustments
€ million € million
Opening balance as at 1 January 2019 8.800 -
Transfer of ECL allowance for off balance sheet items - -
Increases due to amounts set aside for estimated
loan losses during the period 341 -
Decreases due to amounts reversed for estimated
loan losses during the period (26) -
Decreases due to amounts taken against accumulated
credit risk adjustments (write offs) (320) -
Transfers between credit risk adjustments - -
Impact of exchange rate differences (1) -
Business combinations, including acquisitions and
disposals of subsidiaries - -
NPV unwinding (115) -
Recoveries of amounts previously written off 5 -
Other adjustments(1) (949) -
Closing balance as at 30 June 2019 7.735 -
Recoveries on credit risk adjustments recorded
directly to the statement of profit or loss - -
Specific credit risk adjustments directly recorded to
the statement of profit or loss - -
30 June 2019
Accumulated
specific credit
risk adjustment
Accumulated
general credit
risk adjustment
(1) The “Other Adjustments” include Held for Sale and Derecognition Assets adjustments, mainly due to sales of non performing exposures (retail and
corporate).
The following table shows the changes in the stock of defaulted and impaired loans and debt securities for the period ended 30 June 2019. Table 8: EU CR2-B – Changes in the stock of defaulted and impaired loans and debt securities
30 June 2019
Gross carrying
value defaulted
exposures
€ million
Opening balance as at 1 January 2019 15.753
Loans and debt securities that have defaulted or
impaired since the last reporting period507
Returned to non-defaulted status (536)
Amounts written off (320)
Other changes (140)
Closing balance as at 30 June 2019 15.264
EUROBANK ERGASIAS S.A. Consolidated Pillar 3 Report
Credit Risk
20 | Page 30 June 2019 Consolidated Pi l lar 3 Report
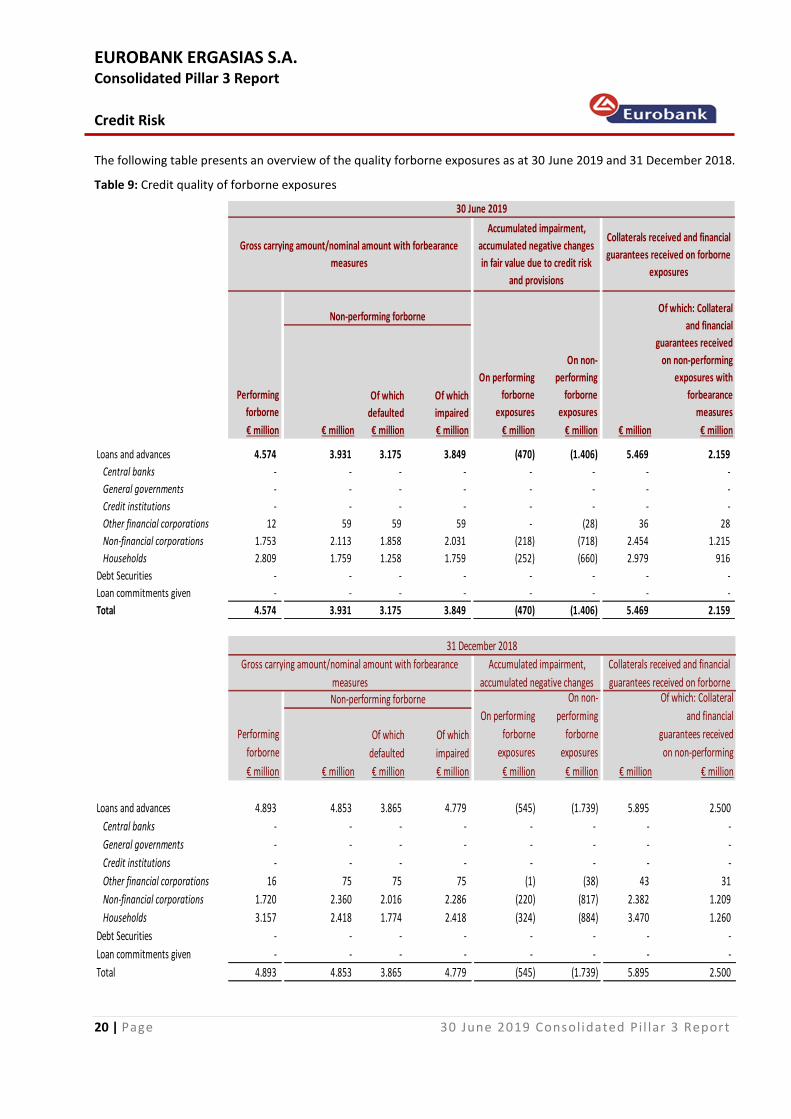
The following table presents an overview of the quality forborne exposures as at 30 June 2019 and 31 December 2018. Table 9: Credit quality of forborne exposures
€ million € million € million € million € million € million € million € million
Loans and advances 4.574 3.931 3.175 3.849 (470) (1.406) 5.469 2.159
Central banks - - - - - - - -
General governments - - - - - - - -
Credit institutions - - - - - - - -
Other financial corporations 12 59 59 59 - (28) 36 28
Non-financial corporations 1.753 2.113 1.858 2.031 (218) (718) 2.454 1.215
Households 2.809 1.759 1.258 1.759 (252) (660) 2.979 916
Debt Securities - - - - - - - -
Loan commitments given - - - - - - - -
Total 4.574 3.931 3.175 3.849 (470) (1.406) 5.469 2.159
Performing
forborne
Gross carrying amount/nominal amount with forbearance
measures
Accumulated impairment,
accumulated negative changes
in fair value due to credit risk
and provisions
Collaterals received and financial
guarantees received on forborne
exposures
30 June 2019
Of which
defaulted
Of which
impaired
Non-performing forborne
On performing
forborne
exposures
On non-
performing
forborne
exposures
Of which: Collateral
and financial
guarantees received
on non-performing
exposures with
forbearance
measures
€ million € million € million € million € million € million € million € million
Loans and advances 4.893 4.853 3.865 4.779 (545) (1.739) 5.895 2.500
Central banks - - - - - - - -
General governments - - - - - - - -
Credit institutions - - - - - - - -
Other financial corporations 16 75 75 75 (1) (38) 43 31
Non-financial corporations 1.720 2.360 2.016 2.286 (220) (817) 2.382 1.209
Households 3.157 2.418 1.774 2.418 (324) (884) 3.470 1.260
Debt Securities - - - - - - - -
Loan commitments given - - - - - - - -
Total 4.893 4.853 3.865 4.779 (545) (1.739) 5.895 2.500
31 December 2018
Gross carrying amount/nominal amount with forbearance
measures
Accumulated impairment,
accumulated negative changes
Collaterals received and financial
guarantees received on forborne
Performing
forborne
Non-performing forborneOn performing
forborne
exposures
On non-
performing
forborne
exposures
Of which: Collateral
and financial
guarantees received
on non-performing
Of which
defaulted
Of which
impaired
EUROBANK ERGASIAS S.A. Consolidated Pillar 3 Report
Credit Risk
21 | Page 30 June 2019 Consolidated Pi l lar 3 Report
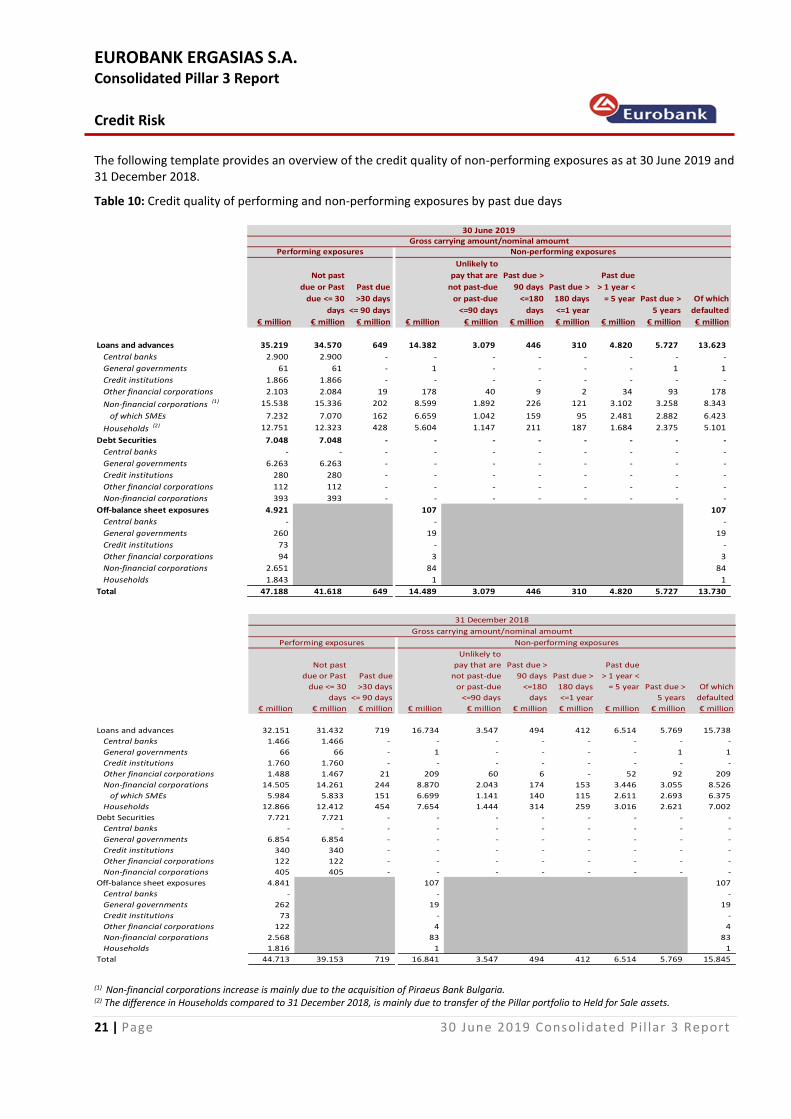
The following template provides an overview of the credit quality of non-performing exposures as at 30 June 2019 and 31 December 2018. Table 10: Credit quality of performing and non-performing exposures by past due days
Not past
due or Past
due <= 30
days
Past due
>30 days
<= 90 days
Unlikely to
pay that are
not past-due
or past-due
<=90 days
Past due >
90 days
<=180
days
Past due >
180 days
<=1 year
Past due
> 1 year <
= 5 year Past due >
5 years
Of which
defaulted
€ million € million € million € million € million € million € million € million € million € million
Loans and advances 35.219 34.570 649 14.382 3.079 446 310 4.820 5.727 13.623
Central banks 2.900 2.900 - - - - - - - -
General governments 61 61 - 1 - - - - 1 1
Credit institutions 1.866 1.866 - - - - - - - -
Other financial corporations 2.103 2.084 19 178 40 9 2 34 93 178
Non-financial corporations (1) 15.538 15.336 202 8.599 1.892 226 121 3.102 3.258 8.343
of which SMEs 7.232 7.070 162 6.659 1.042 159 95 2.481 2.882 6.423
Households (2) 12.751 12.323 428 5.604 1.147 211 187 1.684 2.375 5.101
Debt Securities 7.048 7.048 - - - - - - - -
Central banks - - - - - - - - - -
General governments 6.263 6.263 - - - - - - - -
Credit institutions 280 280 - - - - - - - -
Other financial corporations 112 112 - - - - - - - -
Non-financial corporations 393 393 - - - - - - - -
Off-balance sheet exposures 4.921 107 107
Central banks - - -
General governments 260 19 19
Credit institutions 73 - -
Other financial corporations 94 3 3
Non-financial corporations 2.651 84 84
Households 1.843 1 1
Total 47.188 41.618 649 14.489 3.079 446 310 4.820 5.727 13.730
Gross carrying amount/nominal amoumtPerforming exposures Non-performing exposures
30 June 2019
Not past
due or Past
due <= 30
days
Past due
>30 days
<= 90 days
Unlikely to
pay that are
not past-due
or past-due
<=90 days
Past due >
90 days
<=180
days
Past due >
180 days
<=1 year
Past due
> 1 year <
= 5 year Past due >
5 years
Of which
defaulted
€ million € million € million € million € million € million € million € million € million € million
Loans and advances 32.151 31.432 719 16.734 3.547 494 412 6.514 5.769 15.738
Central banks 1.466 1.466 - - - - - - - -
General governments 66 66 - 1 - - - - 1 1
Credit institutions 1.760 1.760 - - - - - - - -
Other financial corporations 1.488 1.467 21 209 60 6 - 52 92 209
Non-financial corporations 14.505 14.261 244 8.870 2.043 174 153 3.446 3.055 8.526
of which SMEs 5.984 5.833 151 6.699 1.141 140 115 2.611 2.693 6.375
Households 12.866 12.412 454 7.654 1.444 314 259 3.016 2.621 7.002
Debt Securities 7.721 7.721 - - - - - - - -
Central banks - - - - - - - - - -
General governments 6.854 6.854 - - - - - - - -
Credit institutions 340 340 - - - - - - - -
Other financial corporations 122 122 - - - - - - - -
Non-financial corporations 405 405 - - - - - - - -
Off-balance sheet exposures 4.841 107 107
Central banks - - -
General governments 262 19 19
Credit institutions 73 - -
Other financial corporations 122 4 4
Non-financial corporations 2.568 83 83
Households 1.816 1 1
Total 44.713 39.153 719 16.841 3.547 494 412 6.514 5.769 15.845
31 December 2018
Gross carrying amount/nominal amoumt
Performing exposures Non-performing exposures
(1) Non-financial corporations increase is mainly due to the acquisition of Piraeus Bank Bulgaria. (2) The difference in Households compared to 31 December 2018, is mainly due to transfer of the Pillar portfolio to Held for Sale assets.
EUROBANK ERGASIAS S.A. Consolidated Pillar 3 Report
Credit Risk
22 | Page 30 June 2019 Consolidated Pi l lar 3 Report
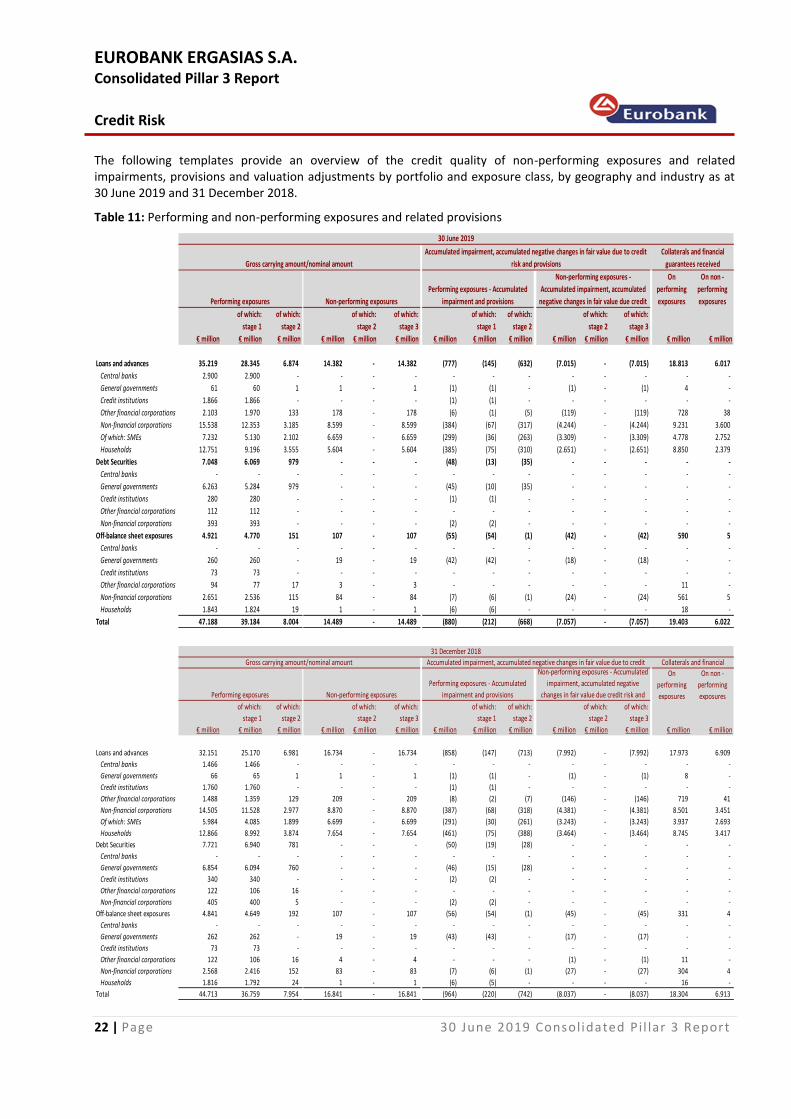
The following templates provide an overview of the credit quality of non-performing exposures and related impairments, provisions and valuation adjustments by portfolio and exposure class, by geography and industry as at 30 June 2019 and 31 December 2018. Table 11: Performing and non-performing exposures and related provisions
On
performing
exposures
On non -
performing
exposures
of which:
stage 1
of which:
stage 2
of which:
stage 2
of which:
stage 3
of which:
stage 1
of which:
stage 2
of which:
stage 2
of which:
stage 3
€ million € million € million € million € million € million € million € million € million € million € million € million € million € million
Loans and advances 35.219 28.345 6.874 14.382 - 14.382 (777) (145) (632) (7.015) - (7.015) 18.813 6.017
Central banks 2.900 2.900 - - - - - - - - - - - -
General governments 61 60 1 1 - 1 (1) (1) - (1) - (1) 4 -
Credit institutions 1.866 1.866 - - - - (1) (1) - - - - - -
Other financial corporations 2.103 1.970 133 178 - 178 (6) (1) (5) (119) - (119) 728 38
Non-financial corporations 15.538 12.353 3.185 8.599 - 8.599 (384) (67) (317) (4.244) - (4.244) 9.231 3.600
Of which: SMEs 7.232 5.130 2.102 6.659 - 6.659 (299) (36) (263) (3.309) - (3.309) 4.778 2.752
Households 12.751 9.196 3.555 5.604 - 5.604 (385) (75) (310) (2.651) - (2.651) 8.850 2.379
Debt Securities 7.048 6.069 979 - - - (48) (13) (35) - - - - -
Central banks - - - - - - - - - - - - - -
General governments 6.263 5.284 979 - - - (45) (10) (35) - - - - -
Credit institutions 280 280 - - - - (1) (1) - - - - - -
Other financial corporations 112 112 - - - - - - - - - - - -
Non-financial corporations 393 393 - - - - (2) (2) - - - - - -
Off-balance sheet exposures 4.921 4.770 151 107 - 107 (55) (54) (1) (42) - (42) 590 5
Central banks - - - - - - - - - - - - - -
General governments 260 260 - 19 - 19 (42) (42) - (18) - (18) - -
Credit institutions 73 73 - - - - - - - - - - - -
Other financial corporations 94 77 17 3 - 3 - - - - - - 11 -
Non-financial corporations 2.651 2.536 115 84 - 84 (7) (6) (1) (24) - (24) 561 5
Households 1.843 1.824 19 1 - 1 (6) (6) - - - - 18 -
Total 47.188 39.184 8.004 14.489 - 14.489 (880) (212) (668) (7.057) - (7.057) 19.403 6.022
Accumulated impairment, accumulated negative changes in fair value due to credit
risk and provisions
Collaterals and financial
guarantees received
Performing exposures Non-performing exposures
Performing exposures - Accumulated
impairment and provisions
Non-performing exposures -
Accumulated impairment, accumulated
negative changes in fair value due credit
Gross carrying amount/nominal amount
30 June 2019
On
performing
exposures
On non -
performing
exposuresof which:
stage 1
of which:
stage 2
of which:
stage 2
of which:
stage 3
of which:
stage 1
of which:
stage 2
of which:
stage 2
of which:
stage 3
€ million € million € million € million € million € million € million € million € million € million € million € million € million € million
Loans and advances 32.151 25.170 6.981 16.734 - 16.734 (858) (147) (713) (7.992) - (7.992) 17.973 6.909
Central banks 1.466 1.466 - - - - - - - - - - - -
General governments 66 65 1 1 - 1 (1) (1) - (1) - (1) 8 -
Credit institutions 1.760 1.760 - - - - (1) (1) - - - - - -
Other financial corporations 1.488 1.359 129 209 - 209 (8) (2) (7) (146) - (146) 719 41
Non-financial corporations 14.505 11.528 2.977 8.870 - 8.870 (387) (68) (318) (4.381) - (4.381) 8.501 3.451
Of which: SMEs 5.984 4.085 1.899 6.699 - 6.699 (291) (30) (261) (3.243) - (3.243) 3.937 2.693
Households 12.866 8.992 3.874 7.654 - 7.654 (461) (75) (388) (3.464) - (3.464) 8.745 3.417
Debt Securities 7.721 6.940 781 - - - (50) (19) (28) - - - - -
Central banks - - - - - - - - - - - - - -
General governments 6.854 6.094 760 - - - (46) (15) (28) - - - - -
Credit institutions 340 340 - - - - (2) (2) - - - - - -
Other financial corporations 122 106 16 - - - - - - - - - - -
Non-financial corporations 405 400 5 - - - (2) (2) - - - - - -
Off-balance sheet exposures 4.841 4.649 192 107 - 107 (56) (54) (1) (45) - (45) 331 4
Central banks - - - - - - - - - - - - - -
General governments 262 262 - 19 - 19 (43) (43) - (17) - (17) - -
Credit institutions 73 73 - - - - - - - - - - - -
Other financial corporations 122 106 16 4 - 4 - - - (1) - (1) 11 -
Non-financial corporations 2.568 2.416 152 83 - 83 (7) (6) (1) (27) - (27) 304 4
Households 1.816 1.792 24 1 - 1 (6) (5) - - - - 16 -
Total 44.713 36.759 7.954 16.841 - 16.841 (964) (220) (742) (8.037) - (8.037) 18.304 6.913
31 December 2018
Gross carrying amount/nominal amount Accumulated impairment, accumulated negative changes in fair value due to credit Collaterals and financial
Performing exposures Non-performing exposures
Performing exposures - Accumulated
impairment and provisions
Non-performing exposures - Accumulated
impairment, accumulated negative
changes in fair value due credit risk and
EUROBANK ERGASIAS S.A. Consolidated Pillar 3 Report
Credit Risk
23 | Page 30 June 2019 Consolidated Pi l lar 3 Report
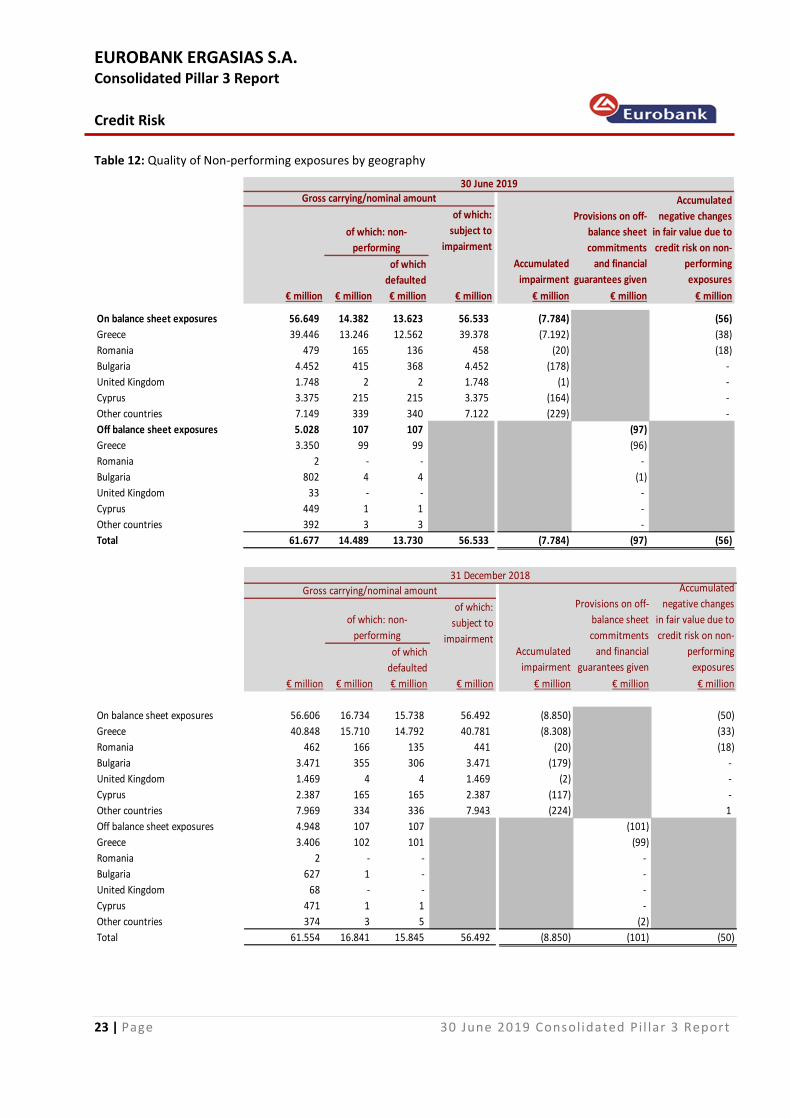
Table 12: Quality of Non-performing exposures by geography
of which:
subject to
impairment
of which
defaulted
€ million € million € million € million € million € million € million
On balance sheet exposures 56.649 14.382 13.623 56.533 (7.784) (56)
Greece 39.446 13.246 12.562 39.378 (7.192) (38)
Romania 479 165 136 458 (20) (18)
Bulgaria 4.452 415 368 4.452 (178) -
United Kingdom 1.748 2 2 1.748 (1) -
Cyprus 3.375 215 215 3.375 (164) -
Other countries 7.149 339 340 7.122 (229) -
Off balance sheet exposures 5.028 107 107 (97)
Greece 3.350 99 99 (96)
Romania 2 - - -
Bulgaria 802 4 4 (1)
United Kingdom 33 - - -
Cyprus 449 1 1 -
Other countries 392 3 3 -
Total 61.677 14.489 13.730 56.533 (7.784) (97) (56)
Gross carrying/nominal amount
Accumulated
impairment
Provisions on off-
balance sheet
commitments
and financial
guarantees given
Accumulated
negative changes
in fair value due to
credit risk on non-
performing
exposures
of which: non-
performing
30 June 2019
of which:
subject to
impairmentof which
defaulted
€ million € million € million € million € million € million € million
On balance sheet exposures 56.606 16.734 15.738 56.492 (8.850) (50)
Greece 40.848 15.710 14.792 40.781 (8.308) (33)
Romania 462 166 135 441 (20) (18)
Bulgaria 3.471 355 306 3.471 (179) -
United Kingdom 1.469 4 4 1.469 (2) -
Cyprus 2.387 165 165 2.387 (117) -
Other countries 7.969 334 336 7.943 (224) 1
Off balance sheet exposures 4.948 107 107 (101)
Greece 3.406 102 101 (99)
Romania 2 - - -
Bulgaria 627 1 - -
United Kingdom 68 - - -
Cyprus 471 1 1 -
Other countries 374 3 5 (2)
Total 61.554 16.841 15.845 56.492 (8.850) (101) (50)
31 December 2018
Gross carrying/nominal amount
Accumulated
impairment
Provisions on off-
balance sheet
commitments
and financial
guarantees given
Accumulated
negative changes
in fair value due to
credit risk on non-
performing
exposures
of which: non-
performing
EUROBANK ERGASIAS S.A. Consolidated Pillar 3 Report
Credit Risk
24 | Page 30 June 2019 Consolidated Pi l lar 3 Report
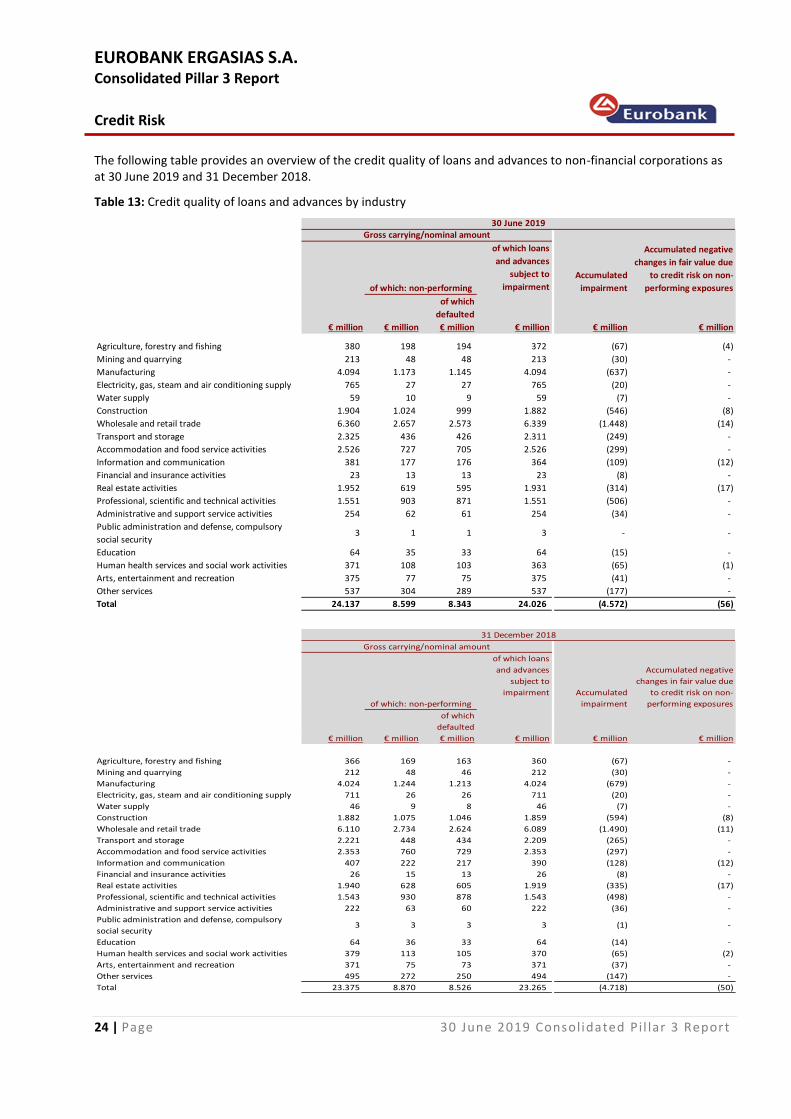
The following table provides an overview of the credit quality of loans and advances to non-financial corporations as at 30 June 2019 and 31 December 2018. Table 13: Credit quality of loans and advances by industry
of which loans
and advances
subject to
impairment
of which
defaulted
€ million € million € million € million € million € million
Agriculture, forestry and fishing 380 198 194 372 (67) (4)
Mining and quarrying 213 48 48 213 (30) -
Manufacturing 4.094 1.173 1.145 4.094 (637) -
Electricity, gas, steam and air conditioning supply 765 27 27 765 (20) -
Water supply 59 10 9 59 (7) -
Construction 1.904 1.024 999 1.882 (546) (8)
Wholesale and retail trade 6.360 2.657 2.573 6.339 (1.448) (14)
Transport and storage 2.325 436 426 2.311 (249) -
Accommodation and food service activities 2.526 727 705 2.526 (299) -
Information and communication 381 177 176 364 (109) (12)
Financial and insurance activities 23 13 13 23 (8) -
Real estate activities 1.952 619 595 1.931 (314) (17)
Professional, scientific and technical activities 1.551 903 871 1.551 (506) -
Administrative and support service activities 254 62 61 254 (34) -
Public administration and defense, compulsory
social security3 1 1 3 - -
Education 64 35 33 64 (15) -
Human health services and social work activities 371 108 103 363 (65) (1)
Arts, entertainment and recreation 375 77 75 375 (41) -
Other services 537 304 289 537 (177) -
Total 24.137 8.599 8.343 24.026 (4.572) (56)
of which: non-performing
30 June 2019Gross carrying/nominal amount
Accumulated
impairment
Accumulated negative
changes in fair value due
to credit risk on non-
performing exposures
of which loans
and advances
subject to
impairment
of which
defaulted
€ million € million € million € million € million € million
Agriculture, forestry and fishing 366 169 163 360 (67) -
Mining and quarrying 212 48 46 212 (30) -
Manufacturing 4.024 1.244 1.213 4.024 (679) -
Electricity, gas, steam and air conditioning supply 711 26 26 711 (20) -
Water supply 46 9 8 46 (7) -
Construction 1.882 1.075 1.046 1.859 (594) (8)
Wholesale and retail trade 6.110 2.734 2.624 6.089 (1.490) (11)
Transport and storage 2.221 448 434 2.209 (265) -
Accommodation and food service activities 2.353 760 729 2.353 (297) -
Information and communication 407 222 217 390 (128) (12)
Financial and insurance activities 26 15 13 26 (8) -
Real estate activities 1.940 628 605 1.919 (335) (17)
Professional, scientific and technical activities 1.543 930 878 1.543 (498) -
Administrative and support service activities 222 63 60 222 (36) -
Public administration and defense, compulsory
social security3 3 3 3 (1) -
Education 64 36 33 64 (14) -
Human health services and social work activities 379 113 105 370 (65) (2)
Arts, entertainment and recreation 371 75 73 371 (37) -
Other services 495 272 250 494 (147) -
Total 23.375 8.870 8.526 23.265 (4.718) (50)
31 December 2018
Gross carrying/nominal amount
Accumulated
impairment
Accumulated negative
changes in fair value due
to credit risk on non-
performing exposuresof which: non-performing
EUROBANK ERGASIAS S.A. Consolidated Pillar 3 Report
Credit Risk
25 | Page 30 June 2019 Consolidated Pi l lar 3 Report
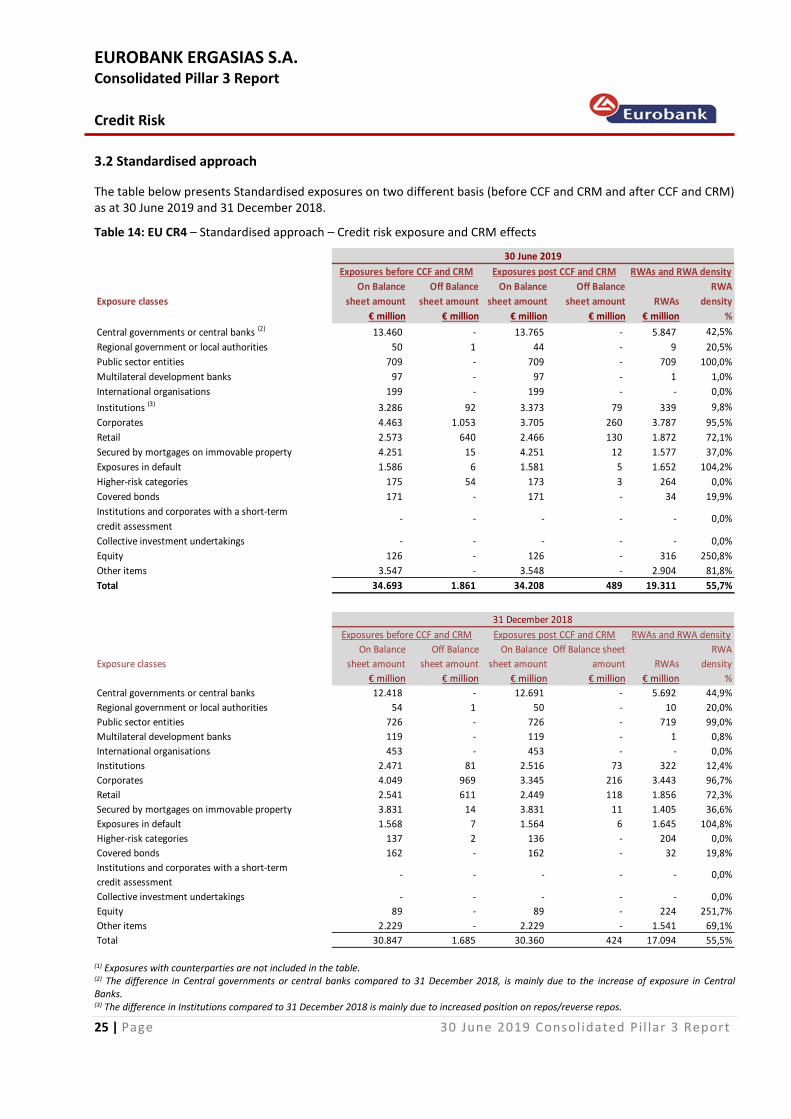
3.2 Standardised approach
The table below presents Standardised exposures on two different basis (before CCF and CRM and after CCF and CRM) as at 30 June 2019 and 31 December 2018. Table 14: EU CR4 – Standardised approach – Credit risk exposure and CRM effects
Exposure classes
On Balance
sheet amount
Off Balance
sheet amount
On Balance
sheet amount
Off Balance
sheet amount RWAs
RWA
density
€ million € million € million € million € million %
Central governments or central banks (2) 13.460 - 13.765 - 5.847 42,5%
Regional government or local authorities 50 1 44 - 9 20,5%
Public sector entities 709 - 709 - 709 100,0%
Multilateral development banks 97 - 97 - 1 1,0%
International organisations 199 - 199 - - 0,0%
Institutions (3) 3.286 92 3.373 79 339 9,8%
Corporates 4.463 1.053 3.705 260 3.787 95,5%
Retail 2.573 640 2.466 130 1.872 72,1%
Secured by mortgages on immovable property 4.251 15 4.251 12 1.577 37,0%
Exposures in default 1.586 6 1.581 5 1.652 104,2%
Higher-risk categories 175 54 173 3 264 0,0%
Covered bonds 171 - 171 - 34 19,9%
Institutions and corporates with a short-term
credit assessment- - - - - 0,0%
Collective investment undertakings - - - - - 0,0%
Equity 126 - 126 - 316 250,8%
Other items 3.547 - 3.548 - 2.904 81,8%
Total 34.693 1.861 34.208 489 19.311 55,7%
30 June 2019
Exposures before CCF and CRM Exposures post CCF and CRM RWAs and RWA density
Exposure classes
On Balance
sheet amount
Off Balance
sheet amount
On Balance
sheet amount
Off Balance sheet
amount RWAs
RWA
density
€ million € million € million € million € million %
Central governments or central banks 12.418 - 12.691 - 5.692 44,9%
Regional government or local authorities 54 1 50 - 10 20,0%
Public sector entities 726 - 726 - 719 99,0%
Multilateral development banks 119 - 119 - 1 0,8%
International organisations 453 - 453 - - 0,0%
Institutions 2.471 81 2.516 73 322 12,4%
Corporates 4.049 969 3.345 216 3.443 96,7%
Retail 2.541 611 2.449 118 1.856 72,3%
Secured by mortgages on immovable property 3.831 14 3.831 11 1.405 36,6%
Exposures in default 1.568 7 1.564 6 1.645 104,8%
Higher-risk categories 137 2 136 - 204 0,0%
Covered bonds 162 - 162 - 32 19,8%
Institutions and corporates with a short-term
credit assessment- - - - - 0,0%
Collective investment undertakings - - - - - 0,0%
Equity 89 - 89 - 224 251,7%
Other items 2.229 - 2.229 - 1.541 69,1%
Total 30.847 1.685 30.360 424 17.094 55,5%
Exposures before CCF and CRM Exposures post CCF and CRM RWAs and RWA density
31 December 2018
(1) Exposures with counterparties are not included in the table. (2) The difference in Central governments or central banks compared to 31 December 2018, is mainly due to the increase of exposure in Central Banks. (3) The difference in Institutions compared to 31 December 2018 is mainly due to increased position on repos/reverse repos.
EUROBANK ERGASIAS S.A. Consolidated Pillar 3 Report
Credit Risk
26 | Page 30 June 2019 Consolidated Pi l lar 3 Report
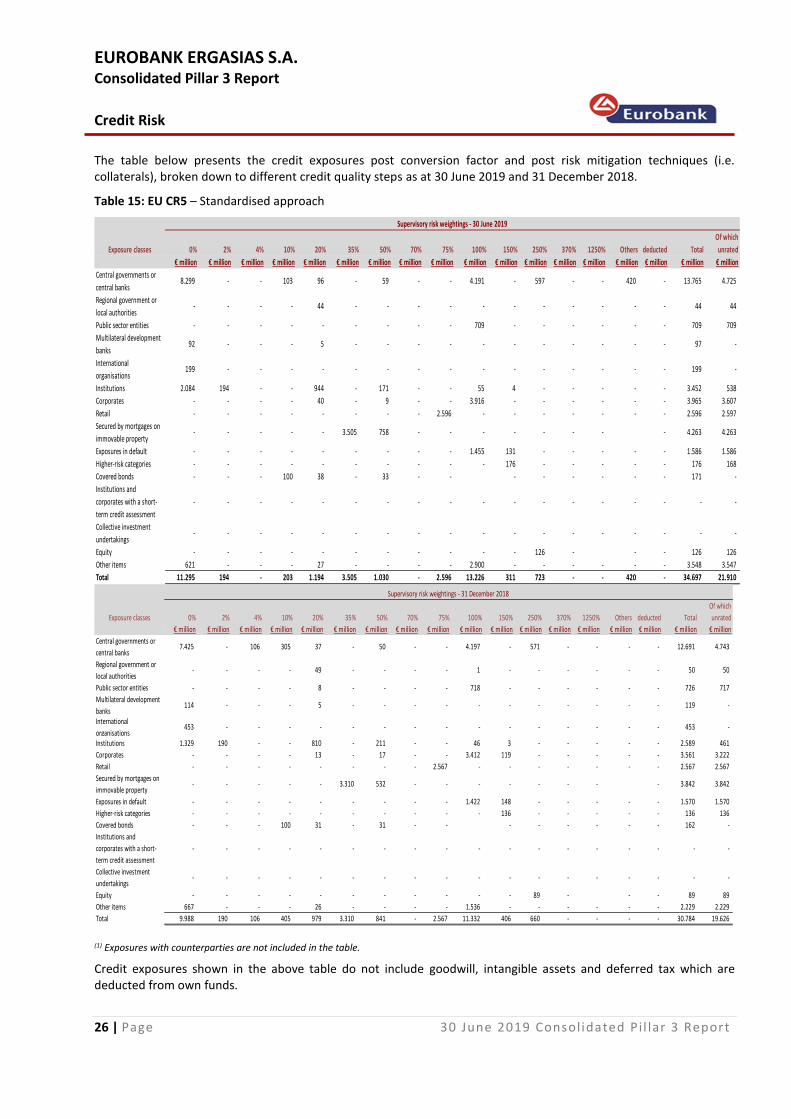
The table below presents the credit exposures post conversion factor and post risk mitigation techniques (i.e. collaterals), broken down to different credit quality steps as at 30 June 2019 and 31 December 2018. Table 15: EU CR5 – Standardised approach
Exposure classes 0% 2% 4% 10% 20% 35% 50% 70% 75% 100% 150% 250% 370% 1250% Others deducted Total
Of which
unrated
€ million € million € million € million € million € million € million € million € million € million € million € million € million € million € million € million € million € million
Central governments or
central banks8.299 - - 103 96 - 59 - - 4.191 - 597 - - 420 - 13.765 4.725
Regional government or
local authorities- - - - 44 - - - - - - - - - - - 44 44
Public sector entities - - - - - - - - - 709 - - - - - - 709 709
Multilateral development
banks92 - - - 5 - - - - - - - - - - - 97 -
International
organisations199 - - - - - - - - - - - - - - - 199 -
Institutions 2.084 194 - - 944 - 171 - - 55 4 - - - - - 3.452 538
Corporates - - - - 40 - 9 - - 3.916 - - - - - - 3.965 3.607
Retail - - - - - - - - 2.596 - - - - - - - 2.596 2.597
Secured by mortgages on
immovable property- - - - - 3.505 758 - - - - - - - - 4.263 4.263
Exposures in default - - - - - - - - - 1.455 131 - - - - - 1.586 1.586
Higher-risk categories - - - - - - - - - - 176 - - - - - 176 168
Covered bonds - - - 100 38 - 33 - - - - - - - - 171 -
Institutions and
corporates with a short-
term credit assessment
- - - - - - - - - - - - - - - - - -
Collective investment
undertakings- - - - - - - - - - - - - - - - - -
Equity - - - - - - - - - - - 126 - - - 126 126
Other items 621 - - - 27 - - - - 2.900 - - - - - - 3.548 3.547
Total 11.295 194 - 203 1.194 3.505 1.030 - 2.596 13.226 311 723 - - 420 - 34.697 21.910
Supervisory risk weightings - 30 June 2019
Exposure classes 0% 2% 4% 10% 20% 35% 50% 70% 75% 100% 150% 250% 370% 1250% Others deducted Total
Of which
unrated
€ million € million € million € million € million € million € million € million € million € million € million € million € million € million € million € million € million € million
Central governments or
central banks7.425 - 106 305 37 - 50 - - 4.197 - 571 - - - - 12.691 4.743
Regional government or
local authorities- - - - 49 - - - - 1 - - - - - - 50 50
Public sector entities - - - - 8 - - - - 718 - - - - - - 726 717
Multilateral development
banks114 - - - 5 - - - - - - - - - - - 119 -
International
organisations453 - - - - - - - - - - - - - - - 453 -
Institutions 1.329 190 - - 810 - 211 - - 46 3 - - - - - 2.589 461
Corporates - - - - 13 - 17 - - 3.412 119 - - - - - 3.561 3.222
Retail - - - - - - - - 2.567 - - - - - - - 2.567 2.567
Secured by mortgages on
immovable property- - - - - 3.310 532 - - - - - - - - 3.842 3.842
Exposures in default - - - - - - - - - 1.422 148 - - - - - 1.570 1.570
Higher-risk categories - - - - - - - - - - 136 - - - - - 136 136
Covered bonds - - - 100 31 - 31 - - - - - - - - 162 -
Institutions and
corporates with a short-
term credit assessment
- - - - - - - - - - - - - - - - - -
Collective investment
undertakings- - - - - - - - - - - - - - - - - -
Equity - - - - - - - - - - - 89 - - - 89 89
Other items 667 - - - 26 - - - - 1.536 - - - - - - 2.229 2.229
Total 9.988 190 106 405 979 3.310 841 - 2.567 11.332 406 660 - - - - 30.784 19.626
Supervisory risk weightings - 31 December 2018
(1) Exposures with counterparties are not included in the table.
Credit exposures shown in the above table do not include goodwill, intangible assets and deferred tax which are deducted from own funds.
EUROBANK ERGASIAS S.A. Consolidated Pillar 3 Report
Credit Risk
27 | Page 30 June 2019 Consolidated Pi l lar 3 Report
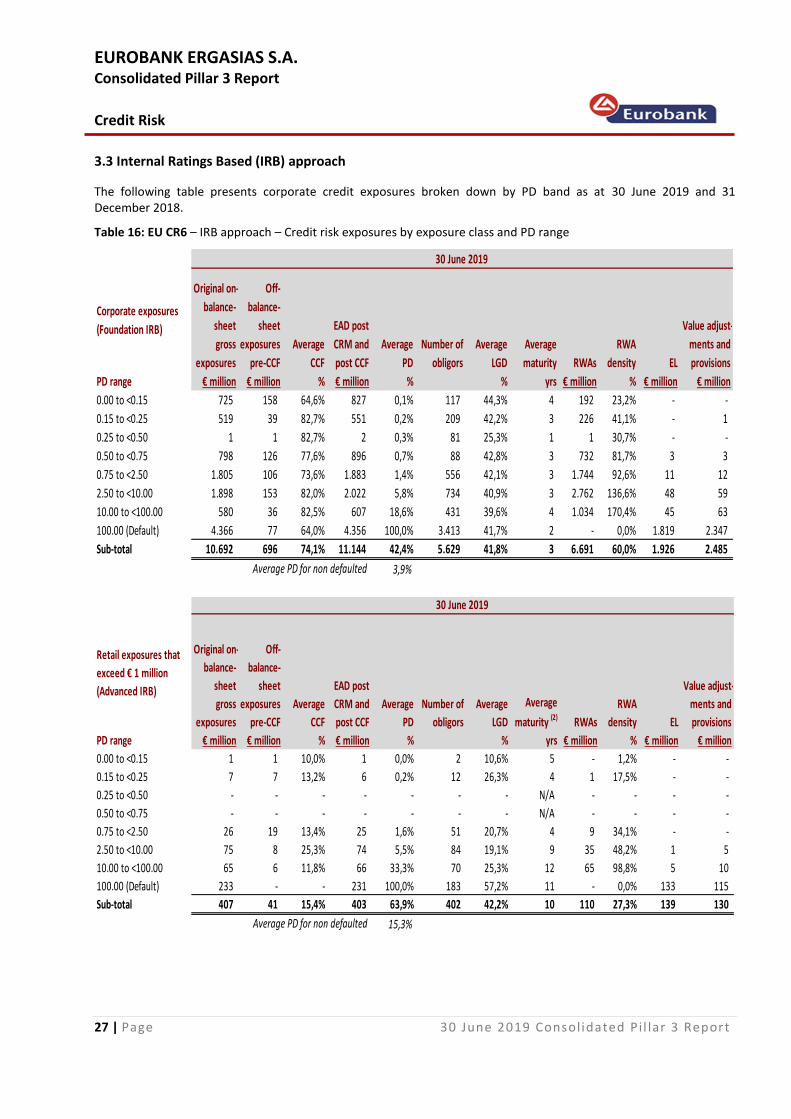
3.3 Internal Ratings Based (IRB) approach
The following table presents corporate credit exposures broken down by PD band as at 30 June 2019 and 31 December 2018. Table 16: EU CR6 – IRB approach – Credit risk exposures by exposure class and PD range
Corporate exposures
(Foundation IRB)
Original on-
balance-
sheet
gross
exposures
Off-
balance-
sheet
exposures
pre-CCF
Average
CCF
EAD post
CRM and
post CCF
Average
PD
Number of
obligors
Average
LGD
Average
maturity RWAs
RWA
density EL
Value adjust-
ments and
provisions
PD range € million € million % € million % % yrs € million % € million € million
0.00 to <0.15 725 158 64,6% 827 0,1% 117 44,3% 4 192 23,2% - -
0.15 to <0.25 519 39 82,7% 551 0,2% 209 42,2% 3 226 41,1% - 1
0.25 to <0.50 1 1 82,7% 2 0,3% 81 25,3% 1 1 30,7% - -
0.50 to <0.75 798 126 77,6% 896 0,7% 88 42,8% 3 732 81,7% 3 3
0.75 to <2.50 1.805 106 73,6% 1.883 1,4% 556 42,1% 3 1.744 92,6% 11 12
2.50 to <10.00 1.898 153 82,0% 2.022 5,8% 734 40,9% 3 2.762 136,6% 48 59
10.00 to <100.00 580 36 82,5% 607 18,6% 431 39,6% 4 1.034 170,4% 45 63
100.00 (Default) 4.366 77 64,0% 4.356 100,0% 3.413 41,7% 2 - 0,0% 1.819 2.347
Sub-total 10.692 696 74,1% 11.144 42,4% 5.629 41,8% 3 6.691 60,0% 1.926 2.485
Average PD for non defaulted 3,9%
30 June 2019
Retail exposures that
exceed € 1 million
(Advanced IRB)
Original on-
balance-
sheet
gross
exposures
Off-
balance-
sheet
exposures
pre-CCF
Average
CCF
EAD post
CRM and
post CCF
Average
PD
Number of
obligors
Average
LGD
Average
maturity (2) RWAs
RWA
density EL
Value adjust-
ments and
provisions
PD range € million € million % € million % % yrs € million % € million € million
0.00 to <0.15 1 1 10,0% 1 0,0% 2 10,6% 5 - 1,2% - -
0.15 to <0.25 7 7 13,2% 6 0,2% 12 26,3% 4 1 17,5% - -
0.25 to <0.50 - - - - - - - N/A - - - -
0.50 to <0.75 - - - - - - - N/A - - - -
0.75 to <2.50 26 19 13,4% 25 1,6% 51 20,7% 4 9 34,1% - -
2.50 to <10.00 75 8 25,3% 74 5,5% 84 19,1% 9 35 48,2% 1 5
10.00 to <100.00 65 6 11,8% 66 33,3% 70 25,3% 12 65 98,8% 5 10
100.00 (Default) 233 - - 231 100,0% 183 57,2% 11 - 0,0% 133 115
Sub-total 407 41 15,4% 403 63,9% 402 42,2% 10 110 27,3% 139 130
Average PD for non defaulted 15,3%
30 June 2019

EUROBANK ERGASIAS S.A. Consolidated Pillar 3 Report
Credit Risk
28 | Page 30 June 2019 Consolidated Pi l lar 3 Report
Secured by immovable
property non-SME
retail exposures
Original on-
balance-
sheet
gross
exposures
Off-
balance-
sheet
exposures
pre-CCF
Average
CCF
EAD post
CRM and
post CCF
Average
PD
Number of
obligors
Average
LGD
Average
maturity (2) RWAs
RWA
density EL
Value adjust-
ments and
provisions
PD range € million € million % € million % % yrs € million % € million € million
0.00 to <0.15 - - - - 0,0% - - N/A - - - -
0.15 to <0.25 - - - - 0,0% - - N/A - - - -
0.25 to <0.50 46 7 100,0% 53 0,4% 648 5,7% N/A 2 4,0% - -
0.50 to <0.75 508 - - 509 0,5% 6.968 11,7% N/A 49 9,7% - 4
0.75 to <2.50 2.448 3 100,0% 2.451 1,4% 34.312 14,2% N/A 580 23,6% 5 49
2.50 to <10.00 930 1 100,0% 931 4,7% 15.002 17,1% N/A 536 57,5% 8 35
10.00 to <100.00 2.162 - 100,0% 2.162 38,9% 39.382 25,7% N/A 2.724 126,0% 214 199
100.00 (Default) 3.646 - - 3.644 100,0% 47.118 45,0% N/A 2.007 55,1% 1.641 1.638
Sub-total 9.740 11 100,0% 9.750 46,8% 143.430 28,4% N/A 5.898 60,5% 1.868 1.925
Average PD for non defaulted 15,1%
30 June 2019
Qualifying revolving
retail exposures
Original on-
balance-
sheet
gross
exposures
Off-
balance-
sheet
exposures
pre-CCF
Average
CCF
EAD post
CRM and
post CCF
Average
PD
Number of
obligors
Average
LGD
Average
maturity (2) RWAs
RWA
density EL
Value adjust-
ments and
provisions
PD range € million € million % € million % % yrs € million % € million € million
0.00 to <0.15 78 825 63,5% 601 0,1% 414.379 67,1% N/A 18 3,0% - 4
0.15 to <0.25 31 185 83,6% 186 0,2% 50.078 67,3% N/A 12 6,7% - 1
0.25 to <0.50 61 176 55,7% 160 0,4% 100.793 73,2% N/A 23 14,3% - 1
0.50 to <0.75 50 91 70,9% 114 0,7% 56.723 78,3% N/A 27 23,2% 1 1
0.75 to <2.50 172 120 53,6% 236 1,4% 76.197 79,1% N/A 99 41,9% 3 2
2.50 to <10.00 182 50 46,0% 205 5,5% 70.225 78,7% N/A 215 105,2% 9 3
10.00 to <100.00 58 10 37,4% 62 22,8% 14.270 75,2% N/A 118 190,2% 11 7
100.00 (Default) 366 - - 366 100,0% 59.360 86,7% N/A 71 19,4% 311 295
Sub-total 998 1.457 64,0% 1.930 20,6% 842.025 75,0% N/A 583 30,2% 335 314
Average PD for non defaulted 2,0%
30 June 2019
SME retail exposures
Original on-
balance-
sheet
gross
exposures
Off-
balance-
sheet
exposures
pre-CCF
Average
CCF
EAD post
CRM and
post CCF
Average
PD
Number of
obligors
Average
LGD
Average
maturity (2) RWAs
RWA
density EL
Value adjust-
ments and
provisions
PD range € million € million % € million % % yrs € million % € million € million
0.00 to <0.15 - - - - 0,1% 3 46,9% N/A - - -
0.15 to <0.25 - - - - 0,0% - 0,0% N/A - 0,0% - -
0.25 to <0.50 - - - - - - 0,0% N/A - - - -
0.50 to <0.75 9 4 1,5% 9 0,5% 136 46,9% N/A 3 28,7% - -
0.75 to <2.50 249 303 14,1% 215 1,8% 6.324 32,0% N/A 69 32,3% 1 1
2.50 to <10.00 378 185 10,3% 326 5,1% 11.480 33,9% N/A 133 40,7% 6 18
10.00 to <100.00 249 53 5,8% 241 37,4% 9.852 43,3% N/A 179 74,7% 39 57
100.00 (Default) 598 - - 566 100,0% 25.520 77,6% N/A - 0,0% 441 445
Sub-total 1.483 545 11,9% 1.357 49,9% 53.315 53,6% N/A 384 28,3% 487 521
Average PD for non defaulted 14,0%
30 June 2019
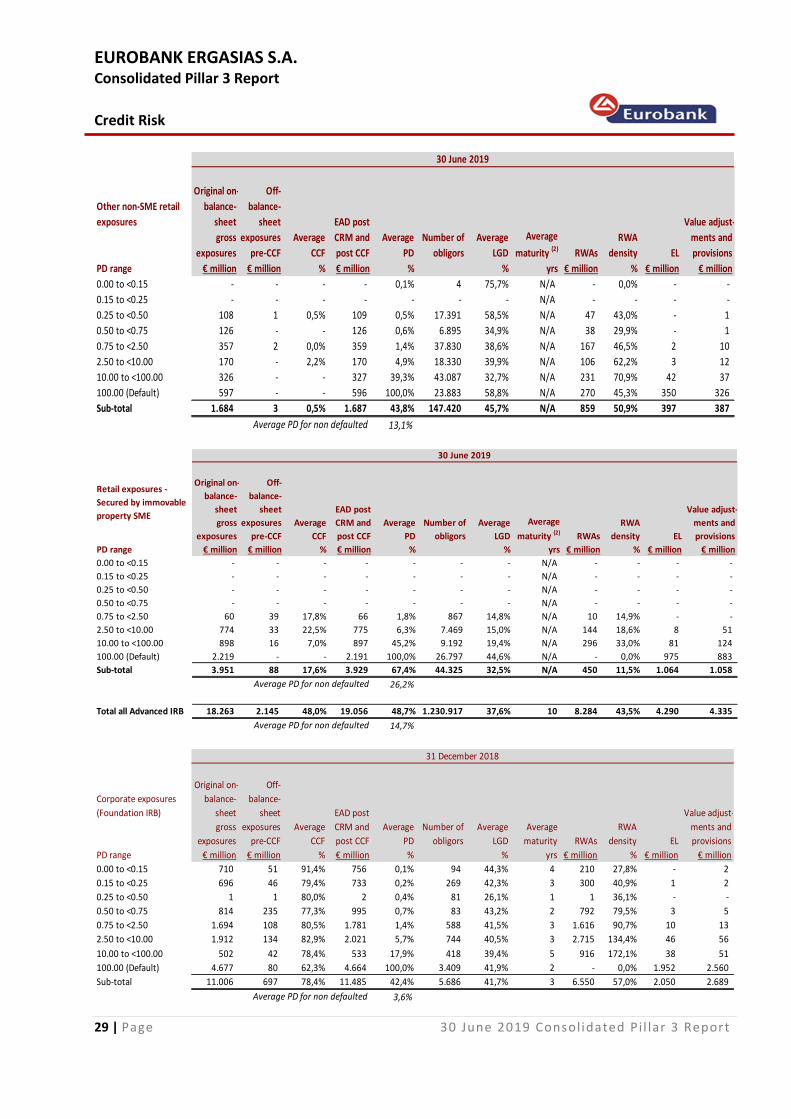
EUROBANK ERGASIAS S.A. Consolidated Pillar 3 Report
Credit Risk
29 | Page 30 June 2019 Consolidated Pi l lar 3 Report
Other non-SME retail
exposures
Original on-
balance-
sheet
gross
exposures
Off-
balance-
sheet
exposures
pre-CCF
Average
CCF
EAD post
CRM and
post CCF
Average
PD
Number of
obligors
Average
LGD
Average
maturity (2) RWAs
RWA
density EL
Value adjust-
ments and
provisions
PD range € million € million % € million % % yrs € million % € million € million
0.00 to <0.15 - - - - 0,1% 4 75,7% N/A - 0,0% - -
0.15 to <0.25 - - - - - - - N/A - - - -
0.25 to <0.50 108 1 0,5% 109 0,5% 17.391 58,5% N/A 47 43,0% - 1
0.50 to <0.75 126 - - 126 0,6% 6.895 34,9% N/A 38 29,9% - 1
0.75 to <2.50 357 2 0,0% 359 1,4% 37.830 38,6% N/A 167 46,5% 2 10
2.50 to <10.00 170 - 2,2% 170 4,9% 18.330 39,9% N/A 106 62,2% 3 12
10.00 to <100.00 326 - - 327 39,3% 43.087 32,7% N/A 231 70,9% 42 37
100.00 (Default) 597 - - 596 100,0% 23.883 58,8% N/A 270 45,3% 350 326
Sub-total 1.684 3 0,5% 1.687 43,8% 147.420 45,7% N/A 859 50,9% 397 387
Average PD for non defaulted 13,1%
30 June 2019
Retail exposures -
Secured by immovable
property SME
Original on-
balance-
sheet
gross
exposures
Off-
balance-
sheet
exposures
pre-CCF
Average
CCF
EAD post
CRM and
post CCF
Average
PD
Number of
obligors
Average
LGD
Average
maturity (2) RWAs
RWA
density EL
Value adjust-
ments and
provisions
PD range € million € million % € million % % yrs € million % € million € million
0.00 to <0.15 - - - - - - - N/A - - - -
0.15 to <0.25 - - - - - - - N/A - - - -
0.25 to <0.50 - - - - - - - N/A - - - -
0.50 to <0.75 - - - - - - - N/A - - - -
0.75 to <2.50 60 39 17,8% 66 1,8% 867 14,8% N/A 10 14,9% - -
2.50 to <10.00 774 33 22,5% 775 6,3% 7.469 15,0% N/A 144 18,6% 8 51
10.00 to <100.00 898 16 7,0% 897 45,2% 9.192 19,4% N/A 296 33,0% 81 124
100.00 (Default) 2.219 - - 2.191 100,0% 26.797 44,6% N/A - 0,0% 975 883
Sub-total 3.951 88 17,6% 3.929 67,4% 44.325 32,5% N/A 450 11,5% 1.064 1.058
Average PD for non defaulted 26,2%
Total all Advanced IRB 18.263 2.145 48,0% 19.056 48,7% 1.230.917 37,6% 10 8.284 43,5% 4.290 4.335
Average PD for non defaulted 14,7%
30 June 2019
Corporate exposures
(Foundation IRB)
Original on-
balance-
sheet
gross
exposures
Off-
balance-
sheet
exposures
pre-CCF
Average
CCF
EAD post
CRM and
post CCF
Average
PD
Number of
obligors
Average
LGD
Average
maturity RWAs
RWA
density EL
Value adjust-
ments and
provisions
PD range € million € million % € million % % yrs € million % € million € million
0.00 to <0.15 710 51 91,4% 756 0,1% 94 44,3% 4 210 27,8% - 2
0.15 to <0.25 696 46 79,4% 733 0,2% 269 42,3% 3 300 40,9% 1 2
0.25 to <0.50 1 1 80,0% 2 0,4% 81 26,1% 1 1 36,1% - -
0.50 to <0.75 814 235 77,3% 995 0,7% 83 43,2% 2 792 79,5% 3 5
0.75 to <2.50 1.694 108 80,5% 1.781 1,4% 588 41,5% 3 1.616 90,7% 10 13
2.50 to <10.00 1.912 134 82,9% 2.021 5,7% 744 40,5% 3 2.715 134,4% 46 56
10.00 to <100.00 502 42 78,4% 533 17,9% 418 39,4% 5 916 172,1% 38 51
100.00 (Default) 4.677 80 62,3% 4.664 100,0% 3.409 41,9% 2 - 0,0% 1.952 2.560
Sub-total 11.006 697 78,4% 11.485 42,4% 5.686 41,7% 3 6.550 57,0% 2.050 2.689
Average PD for non defaulted 3,6%
31 December 2018
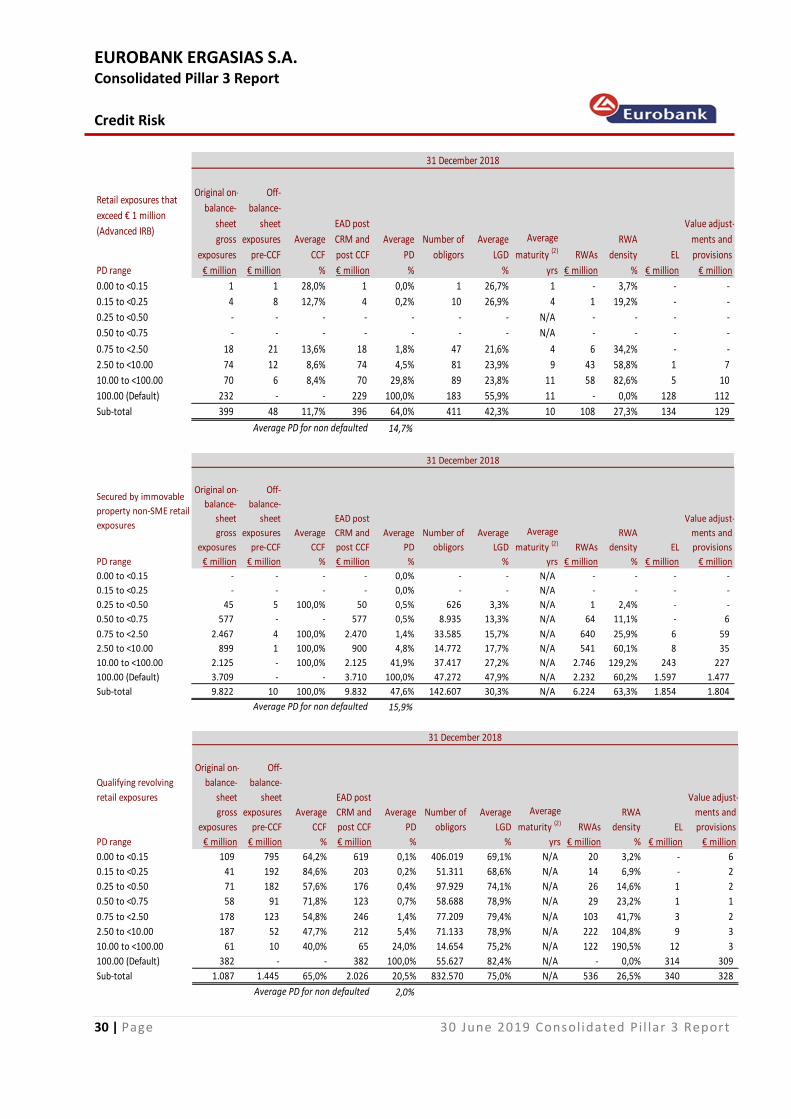
EUROBANK ERGASIAS S.A. Consolidated Pillar 3 Report
Credit Risk
30 | Page 30 June 2019 Consolidated Pi l lar 3 Report
Retail exposures that
exceed € 1 million
(Advanced IRB)
Original on-
balance-
sheet
gross
exposures
Off-
balance-
sheet
exposures
pre-CCF
Average
CCF
EAD post
CRM and
post CCF
Average
PD
Number of
obligors
Average
LGD
Average
maturity (2) RWAs
RWA
density EL
Value adjust-
ments and
provisions
PD range € million € million % € million % % yrs € million % € million € million
0.00 to <0.15 1 1 28,0% 1 0,0% 1 26,7% 1 - 3,7% - -
0.15 to <0.25 4 8 12,7% 4 0,2% 10 26,9% 4 1 19,2% - -
0.25 to <0.50 - - - - - - - N/A - - - -
0.50 to <0.75 - - - - - - - N/A - - - -
0.75 to <2.50 18 21 13,6% 18 1,8% 47 21,6% 4 6 34,2% - -
2.50 to <10.00 74 12 8,6% 74 4,5% 81 23,9% 9 43 58,8% 1 7
10.00 to <100.00 70 6 8,4% 70 29,8% 89 23,8% 11 58 82,6% 5 10
100.00 (Default) 232 - - 229 100,0% 183 55,9% 11 - 0,0% 128 112
Sub-total 399 48 11,7% 396 64,0% 411 42,3% 10 108 27,3% 134 129
Average PD for non defaulted 14,7%
31 December 2018
Secured by immovable
property non-SME retail
exposures
Original on-
balance-
sheet
gross
exposures
Off-
balance-
sheet
exposures
pre-CCF
Average
CCF
EAD post
CRM and
post CCF
Average
PD
Number of
obligors
Average
LGD
Average
maturity (2) RWAs
RWA
density EL
Value adjust-
ments and
provisions
PD range € million € million % € million % % yrs € million % € million € million
0.00 to <0.15 - - - - 0,0% - - N/A - - - -
0.15 to <0.25 - - - - 0,0% - - N/A - - - -
0.25 to <0.50 45 5 100,0% 50 0,5% 626 3,3% N/A 1 2,4% - -
0.50 to <0.75 577 - - 577 0,5% 8.935 13,3% N/A 64 11,1% - 6
0.75 to <2.50 2.467 4 100,0% 2.470 1,4% 33.585 15,7% N/A 640 25,9% 6 59
2.50 to <10.00 899 1 100,0% 900 4,8% 14.772 17,7% N/A 541 60,1% 8 35
10.00 to <100.00 2.125 - 100,0% 2.125 41,9% 37.417 27,2% N/A 2.746 129,2% 243 227
100.00 (Default) 3.709 - - 3.710 100,0% 47.272 47,9% N/A 2.232 60,2% 1.597 1.477
Sub-total 9.822 10 100,0% 9.832 47,6% 142.607 30,3% N/A 6.224 63,3% 1.854 1.804
Average PD for non defaulted 15,9%
31 December 2018
Qualifying revolving
retail exposures
Original on-
balance-
sheet
gross
exposures
Off-
balance-
sheet
exposures
pre-CCF
Average
CCF
EAD post
CRM and
post CCF
Average
PD
Number of
obligors
Average
LGD
Average
maturity (2) RWAs
RWA
density EL
Value adjust-
ments and
provisions
PD range € million € million % € million % % yrs € million % € million € million
0.00 to <0.15 109 795 64,2% 619 0,1% 406.019 69,1% N/A 20 3,2% - 6
0.15 to <0.25 41 192 84,6% 203 0,2% 51.311 68,6% N/A 14 6,9% - 2
0.25 to <0.50 71 182 57,6% 176 0,4% 97.929 74,1% N/A 26 14,6% 1 2
0.50 to <0.75 58 91 71,8% 123 0,7% 58.688 78,9% N/A 29 23,2% 1 1
0.75 to <2.50 178 123 54,8% 246 1,4% 77.209 79,4% N/A 103 41,7% 3 2
2.50 to <10.00 187 52 47,7% 212 5,4% 71.133 78,9% N/A 222 104,8% 9 3
10.00 to <100.00 61 10 40,0% 65 24,0% 14.654 75,2% N/A 122 190,5% 12 3
100.00 (Default) 382 - - 382 100,0% 55.627 82,4% N/A - 0,0% 314 309
Sub-total 1.087 1.445 65,0% 2.026 20,5% 832.570 75,0% N/A 536 26,5% 340 328
Average PD for non defaulted 2,0%
31 December 2018
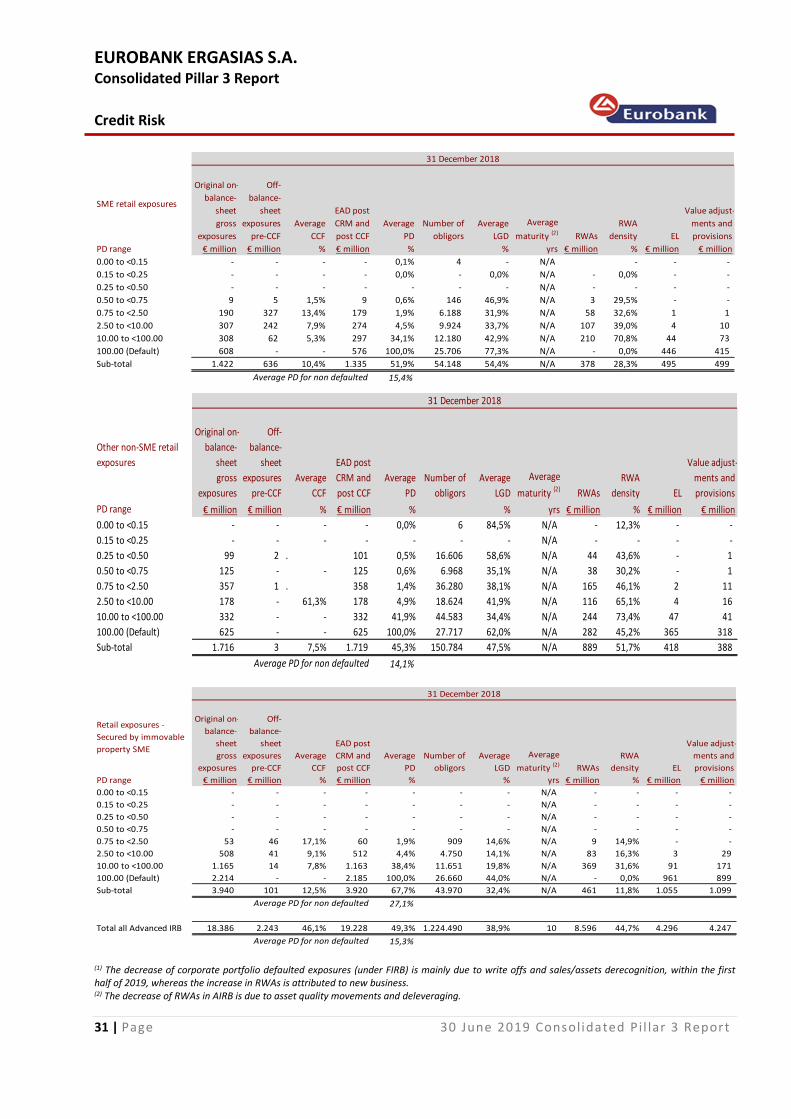
EUROBANK ERGASIAS S.A. Consolidated Pillar 3 Report
Credit Risk
31 | Page 30 June 2019 Consolidated Pi l lar 3 Report
SME retail exposures
Original on-
balance-
sheet
gross
exposures
Off-
balance-
sheet
exposures
pre-CCF
Average
CCF
EAD post
CRM and
post CCF
Average
PD
Number of
obligors
Average
LGD
Average
maturity (2) RWAs
RWA
density EL
Value adjust-
ments and
provisions
PD range € million € million % € million % % yrs € million % € million € million
0.00 to <0.15 - - - - 0,1% 4 - N/A - - -
0.15 to <0.25 - - - - 0,0% - 0,0% N/A - 0,0% - -
0.25 to <0.50 - - - - - - - N/A - - - -
0.50 to <0.75 9 5 1,5% 9 0,6% 146 46,9% N/A 3 29,5% - -
0.75 to <2.50 190 327 13,4% 179 1,9% 6.188 31,9% N/A 58 32,6% 1 1
2.50 to <10.00 307 242 7,9% 274 4,5% 9.924 33,7% N/A 107 39,0% 4 10
10.00 to <100.00 308 62 5,3% 297 34,1% 12.180 42,9% N/A 210 70,8% 44 73
100.00 (Default) 608 - - 576 100,0% 25.706 77,3% N/A - 0,0% 446 415
Sub-total 1.422 636 10,4% 1.335 51,9% 54.148 54,4% N/A 378 28,3% 495 499
Average PD for non defaulted 15,4%
31 December 2018
Other non-SME retail
exposures
Original on-
balance-
sheet
gross
exposures
Off-
balance-
sheet
exposures
pre-CCF
Average
CCF
EAD post
CRM and
post CCF
Average
PD
Number of
obligors
Average
LGD
Average
maturity (2) RWAs
RWA
density EL
Value adjust-
ments and
provisions
PD range € million € million % € million % % yrs € million % € million € million
0.00 to <0.15 - - - - 0,0% 6 84,5% N/A - 12,3% - -
0.15 to <0.25 - - - - - - - N/A - - - -
0.25 to <0.50 99 2 . 101 0,5% 16.606 58,6% N/A 44 43,6% - 1
0.50 to <0.75 125 - - 125 0,6% 6.968 35,1% N/A 38 30,2% - 1
0.75 to <2.50 357 1 . 358 1,4% 36.280 38,1% N/A 165 46,1% 2 11
2.50 to <10.00 178 - 61,3% 178 4,9% 18.624 41,9% N/A 116 65,1% 4 16
10.00 to <100.00 332 - - 332 41,9% 44.583 34,4% N/A 244 73,4% 47 41
100.00 (Default) 625 - - 625 100,0% 27.717 62,0% N/A 282 45,2% 365 318
Sub-total 1.716 3 7,5% 1.719 45,3% 150.784 47,5% N/A 889 51,7% 418 388
Average PD for non defaulted 14,1%
31 December 2018
Retail exposures -
Secured by immovable
property SME
Original on-
balance-
sheet
gross
exposures
Off-
balance-
sheet
exposures
pre-CCF
Average
CCF
EAD post
CRM and
post CCF
Average
PD
Number of
obligors
Average
LGD
Average
maturity (2) RWAs
RWA
density EL
Value adjust-
ments and
provisions
PD range € million € million % € million % % yrs € million % € million € million
0.00 to <0.15 - - - - - - - N/A - - - -
0.15 to <0.25 - - - - - - - N/A - - - -
0.25 to <0.50 - - - - - - - N/A - - - -
0.50 to <0.75 - - - - - - - N/A - - - -
0.75 to <2.50 53 46 17,1% 60 1,9% 909 14,6% N/A 9 14,9% - -
2.50 to <10.00 508 41 9,1% 512 4,4% 4.750 14,1% N/A 83 16,3% 3 29
10.00 to <100.00 1.165 14 7,8% 1.163 38,4% 11.651 19,8% N/A 369 31,6% 91 171
100.00 (Default) 2.214 - - 2.185 100,0% 26.660 44,0% N/A - 0,0% 961 899
Sub-total 3.940 101 12,5% 3.920 67,7% 43.970 32,4% N/A 461 11,8% 1.055 1.099
Average PD for non defaulted 27,1%
Total all Advanced IRB 18.386 2.243 46,1% 19.228 49,3% 1.224.490 38,9% 10 8.596 44,7% 4.296 4.247
Average PD for non defaulted 15,3%
31 December 2018
(1) The decrease of corporate portfolio defaulted exposures (under FIRB) is mainly due to write offs and sales/assets derecognition, within the first half of 2019, whereas the increase in RWAs is attributed to new business. (2) The decrease of RWAs in AIRB is due to asset quality movements and deleveraging.
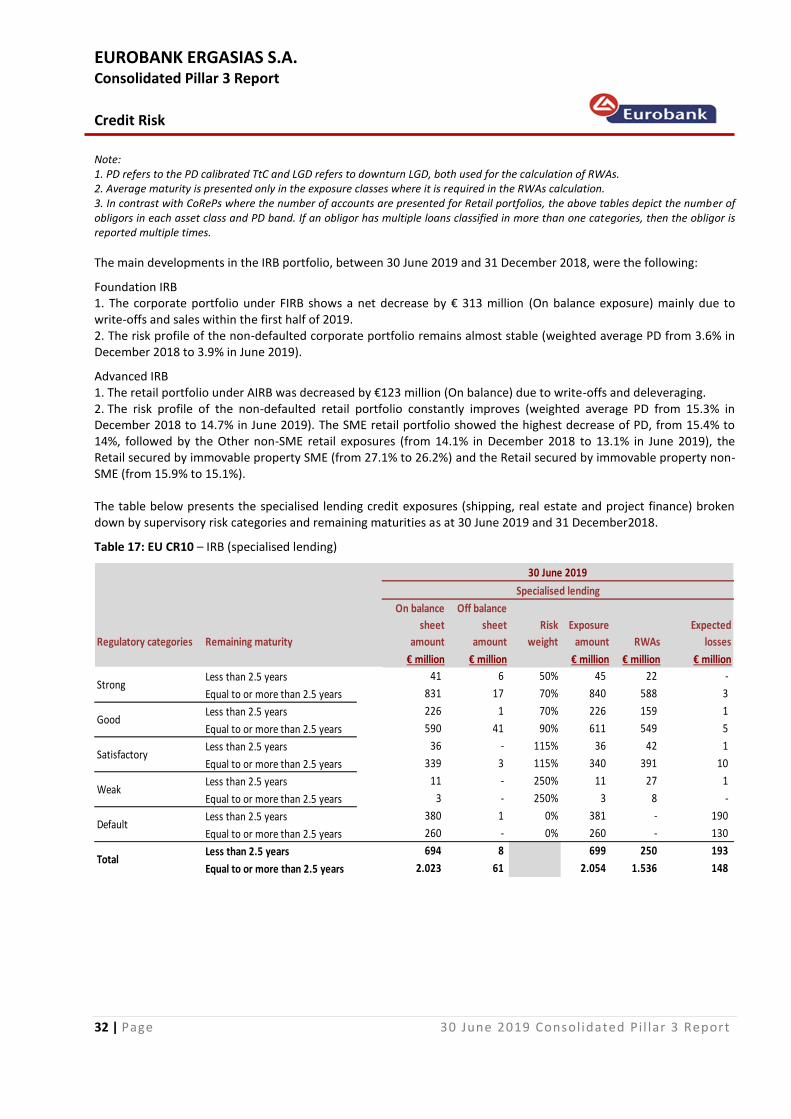
EUROBANK ERGASIAS S.A. Consolidated Pillar 3 Report
Credit Risk
32 | Page 30 June 2019 Consolidated Pi l lar 3 Report
Note: 1. PD refers to the PD calibrated TtC and LGD refers to downturn LGD, both used for the calculation of RWAs. 2. Average maturity is presented only in the exposure classes where it is required in the RWAs calculation. 3. In contrast with CoRePs where the number of accounts are presented for Retail portfolios, the above tables depict the number of obligors in each asset class and PD band. If an obligor has multiple loans classified in more than one categories, then the obligor is reported multiple times.
The main developments in the IRB portfolio, between 30 June 2019 and 31 December 2018, were the following: Foundation IRB 1. The corporate portfolio under FIRB shows a net decrease by € 313 million (On balance exposure) mainly due to write-offs and sales within the first half of 2019. 2. The risk profile of the non-defaulted corporate portfolio remains almost stable (weighted average PD from 3.6% in December 2018 to 3.9% in June 2019). Advanced IRB 1. The retail portfolio under AIRB was decreased by €123 million (On balance) due to write-offs and deleveraging. 2. The risk profile of the non-defaulted retail portfolio constantly improves (weighted average PD from 15.3% in December 2018 to 14.7% in June 2019). The SME retail portfolio showed the highest decrease of PD, from 15.4% to 14%, followed by the Other non-SME retail exposures (from 14.1% in December 2018 to 13.1% in June 2019), the Retail secured by immovable property SME (from 27.1% to 26.2%) and the Retail secured by immovable property non-SME (from 15.9% to 15.1%). The table below presents the specialised lending credit exposures (shipping, real estate and project finance) broken down by supervisory risk categories and remaining maturities as at 30 June 2019 and 31 December2018. Table 17: EU CR10 – IRB (specialised lending)
Regulatory categories Remaining maturity
On balance
sheet
amount
Off balance
sheet
amount
Risk
weight
Exposure
amount RWAs
Expected
losses
€ million € million € million € million € million
Less than 2.5 years 41 6 50% 45 22 -
Equal to or more than 2.5 years 831 17 70% 840 588 3
Less than 2.5 years 226 1 70% 226 159 1
Equal to or more than 2.5 years 590 41 90% 611 549 5
Less than 2.5 years 36 - 115% 36 42 1
Equal to or more than 2.5 years 339 3 115% 340 391 10
Less than 2.5 years 11 - 250% 11 27 1
Equal to or more than 2.5 years 3 - 250% 3 8 -
Less than 2.5 years 380 1 0% 381 - 190
Equal to or more than 2.5 years 260 - 0% 260 - 130
Less than 2.5 years 694 8 699 250 193
Equal to or more than 2.5 years 2.023 61 2.054 1.536 148
30 June 2019
Specialised lending
Strong
Good
Satisfactory
Weak
Default
Total
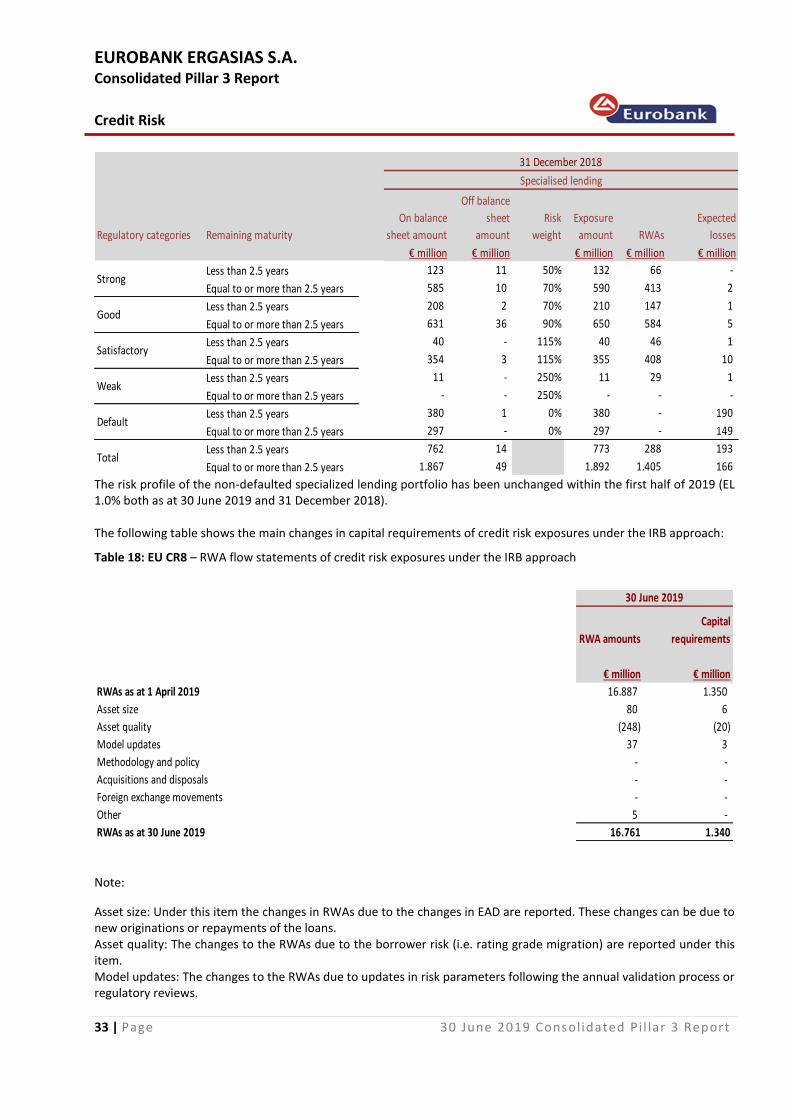
EUROBANK ERGASIAS S.A. Consolidated Pillar 3 Report
Credit Risk
33 | Page 30 June 2019 Consolidated Pi l lar 3 Report
Regulatory categories Remaining maturity
On balance
sheet amount
Off balance
sheet
amount
Risk
weight
Exposure
amount RWAs
Expected
losses
€ million € million € million € million € million
Less than 2.5 years 123 11 50% 132 66 -
Equal to or more than 2.5 years 585 10 70% 590 413 2
Less than 2.5 years 208 2 70% 210 147 1
Equal to or more than 2.5 years 631 36 90% 650 584 5
Less than 2.5 years 40 - 115% 40 46 1
Equal to or more than 2.5 years 354 3 115% 355 408 10
Less than 2.5 years 11 - 250% 11 29 1
Equal to or more than 2.5 years - - 250% - - -
Less than 2.5 years 380 1 0% 380 - 190
Equal to or more than 2.5 years 297 - 0% 297 - 149
Less than 2.5 years 762 14 773 288 193
Equal to or more than 2.5 years 1.867 49 1.892 1.405 166
Strong
31 December 2018
Specialised lending
Satisfactory
Weak
Default
Total
Good
The risk profile of the non-defaulted specialized lending portfolio has been unchanged within the first half of 2019 (EL 1.0% both as at 30 June 2019 and 31 December 2018). The following table shows the main changes in capital requirements of credit risk exposures under the IRB approach: Table 18: EU CR8 – RWA flow statements of credit risk exposures under the IRB approach
RWA amounts
Capital
requirements
€ million € million
RWAs as at 1 April 2019 16.887 1.350
Asset size 80 6
Asset quality (248) (20)
Model updates 37 3
Methodology and policy - -
Acquisitions and disposals - -
Foreign exchange movements - -
Other 5 -
RWAs as at 30 June 2019 16.761 1.340
30 June 2019
Note:
Asset size: Under this item the changes in RWAs due to the changes in EAD are reported. These changes can be due to new originations or repayments of the loans. Asset quality: The changes to the RWAs due to the borrower risk (i.e. rating grade migration) are reported under this item. Model updates: The changes to the RWAs due to updates in risk parameters following the annual validation process or regulatory reviews.
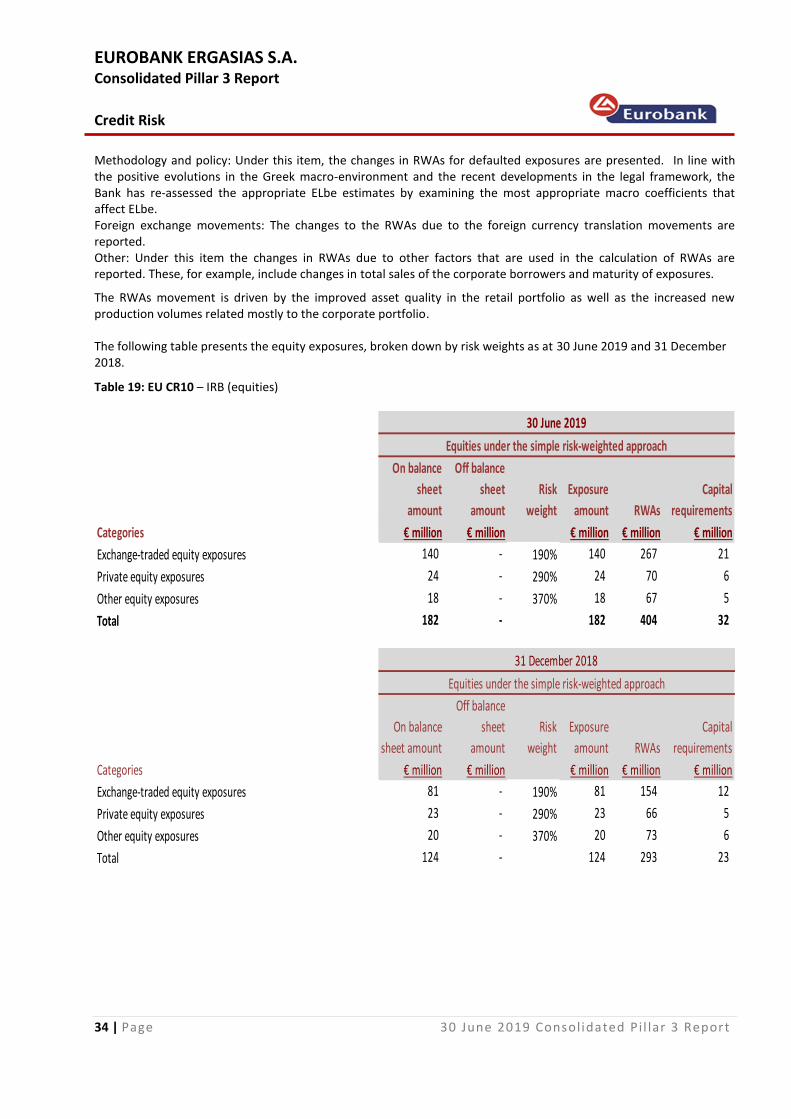
EUROBANK ERGASIAS S.A. Consolidated Pillar 3 Report
Credit Risk
34 | Page 30 June 2019 Consolidated Pi l lar 3 Report
Methodology and policy: Under this item, the changes in RWAs for defaulted exposures are presented. In line with the positive evolutions in the Greek macro-environment and the recent developments in the legal framework, the Bank has re-assessed the appropriate ELbe estimates by examining the most appropriate macro coefficients that affect ELbe. Foreign exchange movements: The changes to the RWAs due to the foreign currency translation movements are reported. Other: Under this item the changes in RWAs due to other factors that are used in the calculation of RWAs are reported. These, for example, include changes in total sales of the corporate borrowers and maturity of exposures. The RWAs movement is driven by the improved asset quality in the retail portfolio as well as the increased new production volumes related mostly to the corporate portfolio. The following table presents the equity exposures, broken down by risk weights as at 30 June 2019 and 31 December 2018. Table 19: EU CR10 – IRB (equities)
On balance
sheet
amount
Off balance
sheet
amount
Risk
weight
Exposure
amount RWAs
Capital
requirements
€ million € million € million € million € million
140 - 190% 140 267 21
24 - 290% 24 70 6
18 - 370% 18 67 5
182 - 182 404 32 Total
Other equity exposures
30 June 2019
Equities under the simple risk-weighted approach
Categories
Exchange-traded equity exposures
Private equity exposures
On balance
sheet amount
Off balance
sheet
amount
Risk
weight
Exposure
amount RWAs
Capital
requirements
Categories € million € million € million € million € million
Exchange-traded equity exposures 81 - 190% 81 154 12
Private equity exposures 23 - 290% 23 66 5
Other equity exposures 20 - 370% 20 73 6
Total 124 - 124 293 23
31 December 2018
Equities under the simple risk-weighted approach
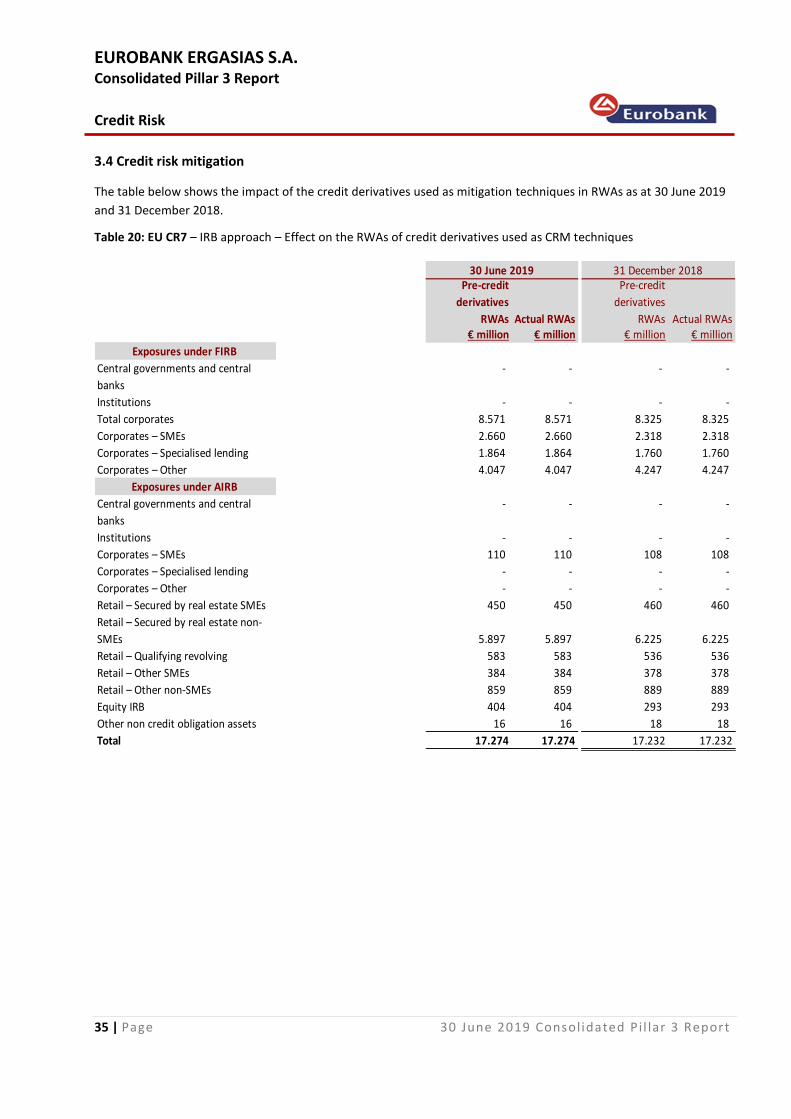
EUROBANK ERGASIAS S.A. Consolidated Pillar 3 Report
Credit Risk
35 | Page 30 June 2019 Consolidated Pi l lar 3 Report
3.4 Credit risk mitigation
The table below shows the impact of the credit derivatives used as mitigation techniques in RWAs as at 30 June 2019
and 31 December 2018. Table 20: EU CR7 – IRB approach – Effect on the RWAs of credit derivatives used as CRM techniques
Pre-credit
derivatives
RWAs Actual RWAs
Pre-credit
derivatives
RWAs Actual RWAs€ million € million € million € million
Exposures under FIRB
Central governments and central
banks
- - - -
Institutions - - - -
Total corporates 8.571 8.571 8.325 8.325
Corporates – SMEs 2.660 2.660 2.318 2.318
Corporates – Specialised lending 1.864 1.864 1.760 1.760
Corporates – Other 4.047 4.047 4.247 4.247
Exposures under AIRB
Central governments and central
banks
- - - -
Institutions - - - -
Corporates – SMEs 110 110 108 108
Corporates – Specialised lending - - - -
Corporates – Other - - - -
Retail – Secured by real estate SMEs 450 450 460 460
Retail – Secured by real estate non-
SMEs 5.897 5.897 6.225 6.225
Retail – Qualifying revolving 583 583 536 536
Retail – Other SMEs 384 384 378 378
Retail – Other non-SMEs 859 859 889 889
Equity IRB 404 404 293 293
Other non credit obligation assets 16 16 18 18
Total 17.274 17.274 17.232 17.232
31 December 201830 June 2019
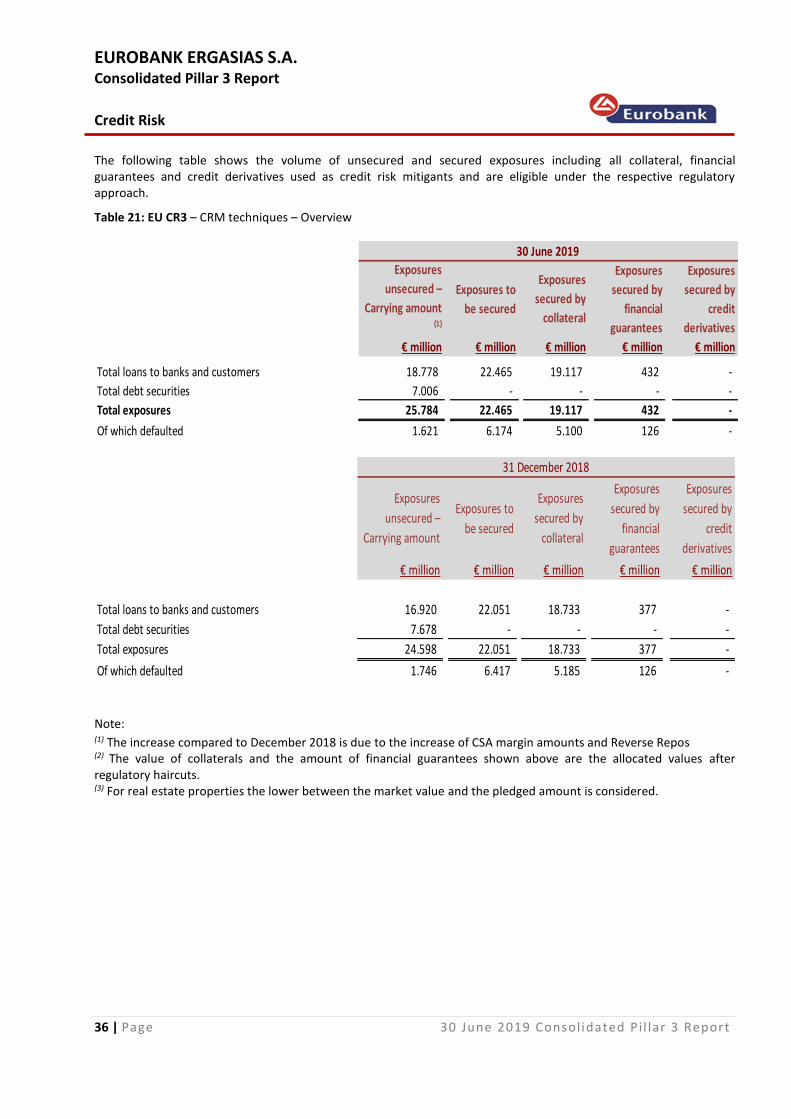
EUROBANK ERGASIAS S.A. Consolidated Pillar 3 Report
Credit Risk
36 | Page 30 June 2019 Consolidated Pi l lar 3 Report
The following table shows the volume of unsecured and secured exposures including all collateral, financial guarantees and credit derivatives used as credit risk mitigants and are eligible under the respective regulatory approach. Table 21: EU CR3 – CRM techniques – Overview
€ million € million € million € million € million
Total loans to banks and customers 18.778 22.465 19.117 432 -
Total debt securities 7.006 - - - -
Total exposures 25.784 22.465 19.117 432 -
Of which defaulted 1.621 6.174 5.100 126 -
Exposures
unsecured –
Carrying amount (1)
Exposures to
be secured
Exposures
secured by
collateral
Exposures
secured by
financial
guarantees
30 June 2019
Exposures
secured by
credit
derivatives
€ million € million € million € million € million
Total loans to banks and customers 16.920 22.051 18.733 377 -
Total debt securities 7.678 - - - -
Total exposures 24.598 22.051 18.733 377 -
Of which defaulted 1.746 6.417 5.185 126 -
31 December 2018
Exposures
unsecured –
Carrying amount
Exposures to
be secured
Exposures
secured by
collateral
Exposures
secured by
financial
guarantees
Exposures
secured by
credit
derivatives
Note: (1) The increase compared to December 2018 is due to the increase of CSA margin amounts and Reverse Repos (2) The value of collaterals and the amount of financial guarantees shown above are the allocated values after regulatory haircuts. (3) For real estate properties the lower between the market value and the pledged amount is considered.
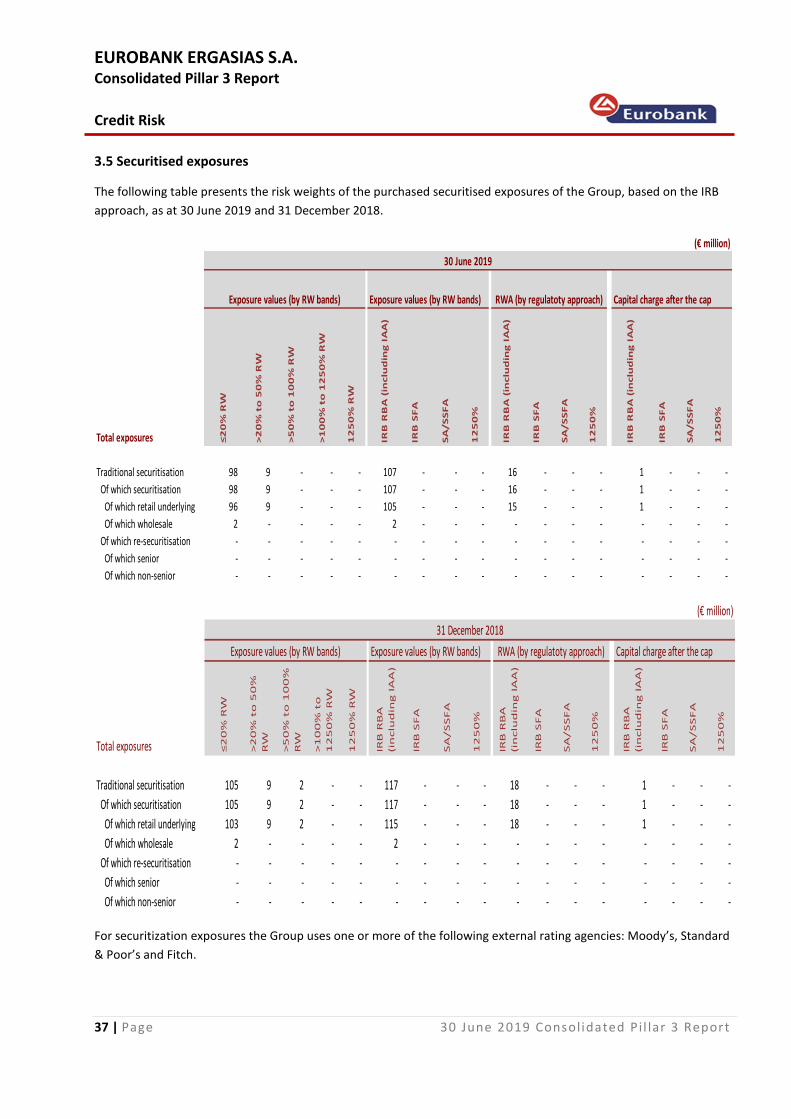
EUROBANK ERGASIAS S.A. Consolidated Pillar 3 Report
Credit Risk
37 | Page 30 June 2019 Consolidated Pi l lar 3 Report
3.5 Securitised exposures
The following table presents the risk weights of the purchased securitised exposures of the Group, based on the IRB
approach, as at 30 June 2019 and 31 December 2018.
Total exposures ≤2
0%
RW
>2
0%
to
50
% R
W
>5
0%
to
10
0%
RW
>1
00
% t
o 1
25
0%
RW
12
50
% R
W
IRB
RB
A (
inclu
din
g I
AA
)
IRB
SF
A
SA
/S
SF
A
12
50
%
IRB
RB
A (
inclu
din
g I
AA
)
IRB
SF
A
SA
/S
SF
A
12
50
%
IRB
RB
A (
inclu
din
g I
AA
)
IRB
SF
A
SA
/S
SF
A
12
50
%
Traditional securitisation 98 9 - - - 107 - - - 16 - - - 1 - - -
Of which securitisation 98 9 - - - 107 - - - 16 - - - 1 - - -
Of which retail underlying 96 9 - - - 105 - - - 15 - - - 1 - - -
Of which wholesale 2 - - - - 2 - - - - - - - - - - -
Of which re-securitisation - - - - - - - - - - - - - - - - -
Of which senior - - - - - - - - - - - - - - - - -
Of which non-senior - - - - - - - - - - - - - - - - -
Exposure values (by RW bands) Exposure values (by RW bands) RWA (by regulatoty approach) Capital charge after the cap
30 June 2019
(€ million)
Total exposures ≤2
0%
RW
>2
0%
to
50
%
RW
>5
0%
to
10
0%
RW
>1
00
% t
o
12
50
% R
W
12
50
% R
W
IRB
RB
A
(in
clu
din
g I
AA
)
IRB
SF
A
SA
/S
SF
A
12
50
%
IRB
RB
A
(in
clu
din
g I
AA
)
IRB
SF
A
SA
/S
SF
A
12
50
%
IRB
RB
A
(in
clu
din
g I
AA
)
IRB
SF
A
SA
/S
SF
A
12
50
%
Traditional securitisation 105 9 2 - - 117 - - - 18 - - - 1 - - -
Of which securitisation 105 9 2 - - 117 - - - 18 - - - 1 - - -
Of which retail underlying 103 9 2 - - 115 - - - 18 - - - 1 - - -
Of which wholesale 2 - - - - 2 - - - - - - - - - - -
Of which re-securitisation - - - - - - - - - - - - - - - - -
Of which senior - - - - - - - - - - - - - - - - -
Of which non-senior - - - - - - - - - - - - - - - - -
Exposure values (by RW bands) RWA (by regulatoty approach) Capital charge after the cap
(€ million)
31 December 2018
Exposure values (by RW bands)
For securitization exposures the Group uses one or more of the following external rating agencies: Moody’s, Standard
& Poor’s and Fitch.
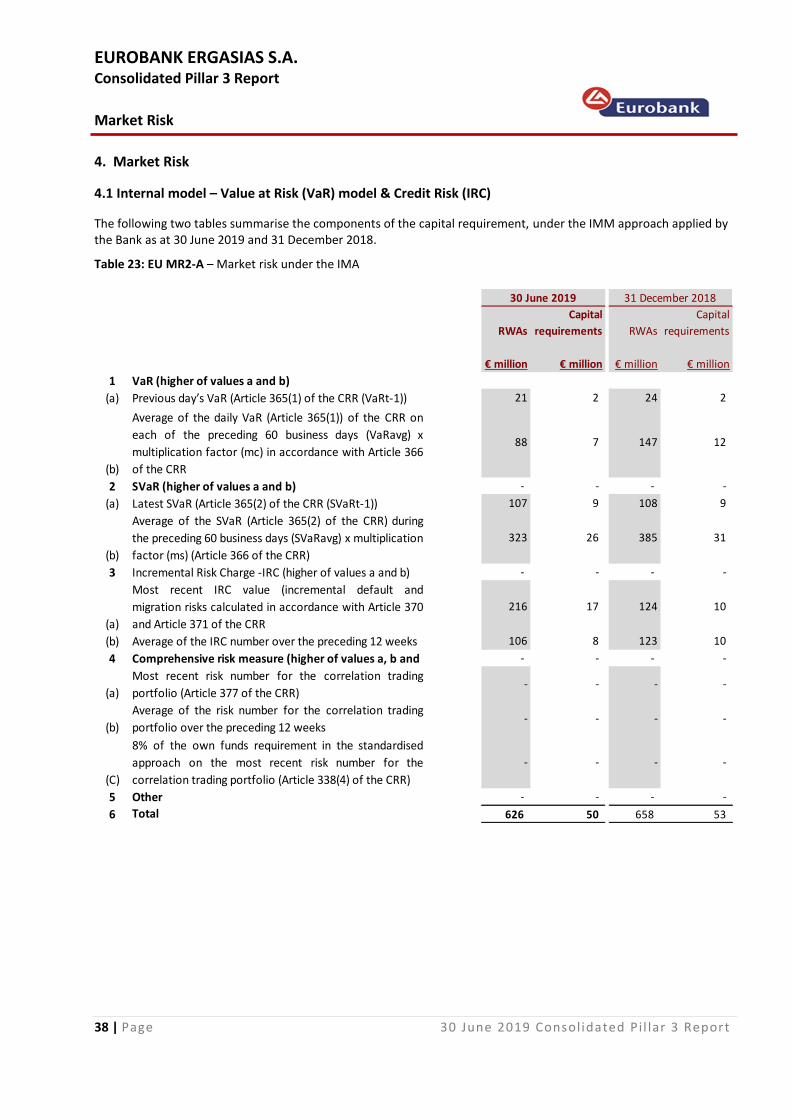
EUROBANK ERGASIAS S.A. Consolidated Pillar 3 Report
Market Risk
38 | Page 30 June 2019 Consolidated Pi l lar 3 Report
4. Market Risk
4.1 Internal model – Value at Risk (VaR) model & Credit Risk (IRC)
The following two tables summarise the components of the capital requirement, under the IMM approach applied by the Bank as at 30 June 2019 and 31 December 2018. Table 23: EU MR2-A – Market risk under the IMA
RWAs
Capital
requirements RWAs
Capital
requirements
€ million € million € million € million
1 VaR (higher of values a and b)
(a) Previous day’s VaR (Article 365(1) of the CRR (VaRt-1)) 21 2 24 2
(b)
Average of the daily VaR (Article 365(1)) of the CRR on
each of the preceding 60 business days (VaRavg) x
multiplication factor (mc) in accordance with Article 366
of the CRR
88 7 147 12
2 SVaR (higher of values a and b) - - - -
(a) Latest SVaR (Article 365(2) of the CRR (SVaRt-1)) 107 9 108 9
(b)
Average of the SVaR (Article 365(2) of the CRR) during
the preceding 60 business days (SVaRavg) x multiplication
factor (ms) (Article 366 of the CRR)
323 26 385 31
3 Incremental Risk Charge -IRC (higher of values a and b) - - - -
(a)
Most recent IRC value (incremental default and
migration risks calculated in accordance with Article 370
and Article 371 of the CRR
216 17 124 10
(b) Average of the IRC number over the preceding 12 weeks 106 8 123 10
4 Comprehensive risk measure (higher of values a, b and - - - -
(a)
Most recent risk number for the correlation trading
portfolio (Article 377 of the CRR) - - - -
(b)
Average of the risk number for the correlation trading
portfolio over the preceding 12 weeks - - - -
(C)
8% of the own funds requirement in the standardised
approach on the most recent risk number for the
correlation trading portfolio (Article 338(4) of the CRR)
- - - -
5 Other - - - -
6 Total 626 50 658 53
31 December 201830 June 2019
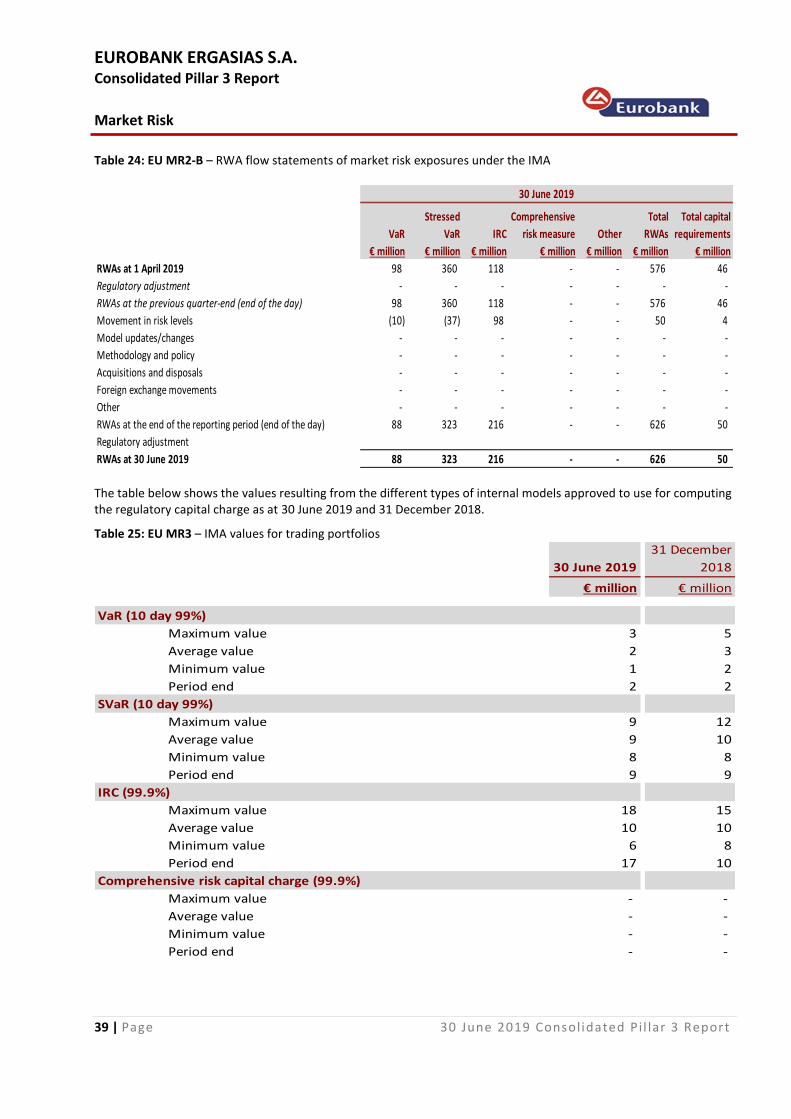
EUROBANK ERGASIAS S.A. Consolidated Pillar 3 Report
Market Risk
39 | Page 30 June 2019 Consolidated Pi l lar 3 Report
Table 24: EU MR2-B – RWA flow statements of market risk exposures under the IMA
VaR
Stressed
VaR IRC
Comprehensive
risk measure Other
Total
RWAs
Total capital
requirements
€ million € million € million € million € million € million € million
RWAs at 1 April 2019 98 360 118 - - 576 46
Regulatory adjustment - - - - - - -
RWAs at the previous quarter-end (end of the day) 98 360 118 - - 576 46
Movement in risk levels (10) (37) 98 - - 50 4
Model updates/changes - - - - - - -
Methodology and policy - - - - - - -
Acquisitions and disposals - - - - - - -
Foreign exchange movements - - - - - - -
Other - - - - - - -
RWAs at the end of the reporting period (end of the day) 88 323 216 - - 626 50
Regulatory adjustment
RWAs at 30 June 2019 88 323 216 - - 626 50
30 June 2019
The table below shows the values resulting from the different types of internal models approved to use for computing the regulatory capital charge as at 30 June 2019 and 31 December 2018. Table 25: EU MR3 – IMA values for trading portfolios
30 June 2019
31 December
2018
€ million € million
Maximum value 3 5
Average value 2 3
Minimum value 1 2
Period end 2 2
Maximum value 9 12
Average value 9 10
Minimum value 8 8
Period end 9 9
Maximum value 18 15
Average value 10 10
Minimum value 6 8
Period end 17 10
Maximum value - -
Average value - -
Minimum value - -
Period end - -
Comprehensive risk capital charge (99.9%)
VaR (10 day 99%)
SVaR (10 day 99%)
IRC (99.9%)
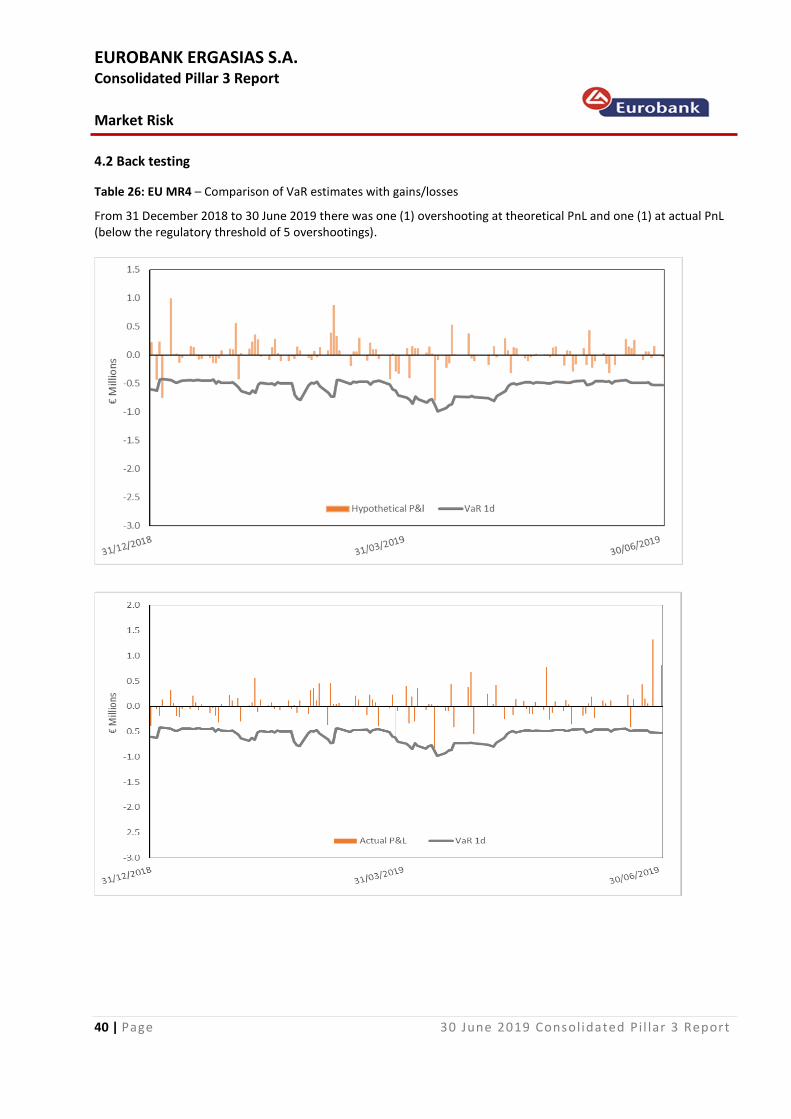
EUROBANK ERGASIAS S.A. Consolidated Pillar 3 Report
Market Risk
40 | Page 30 June 2019 Consolidated Pi l lar 3 Report
4.2 Back testing
Table 26: EU MR4 – Comparison of VaR estimates with gains/losses From 31 December 2018 to 30 June 2019 there was one (1) overshooting at theoretical PnL and one (1) at actual PnL (below the regulatory threshold of 5 overshootings).
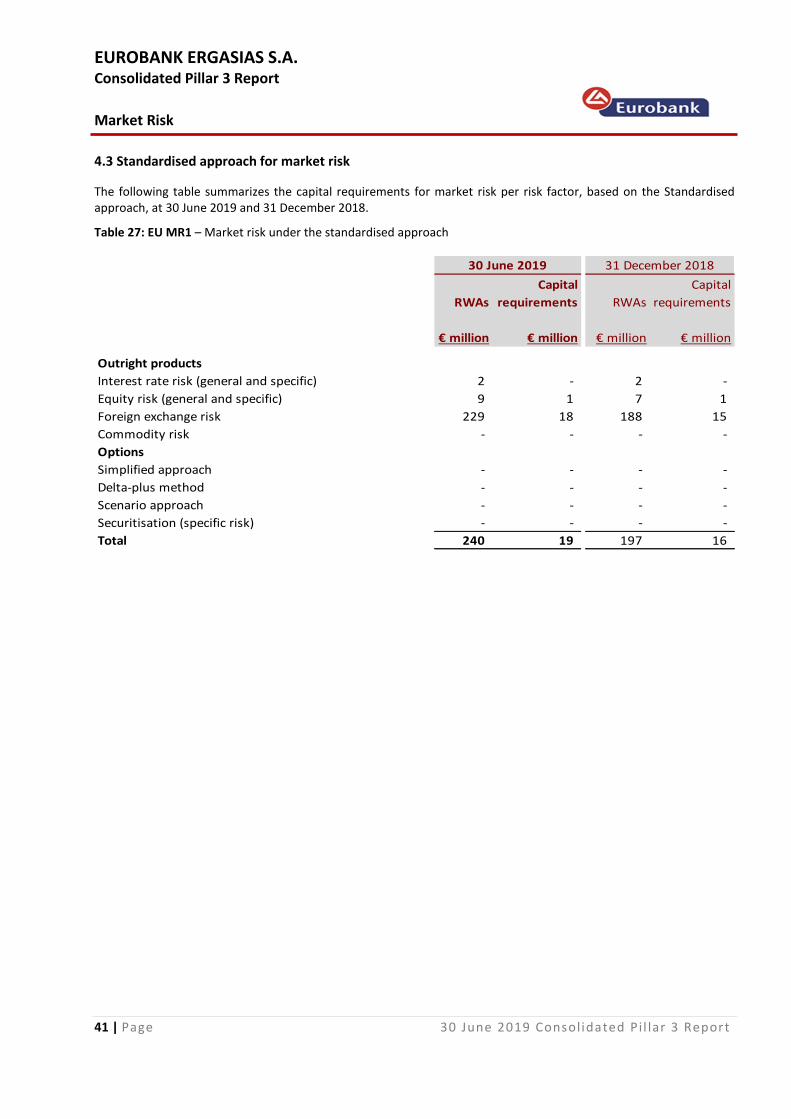
EUROBANK ERGASIAS S.A. Consolidated Pillar 3 Report
Market Risk
41 | Page 30 June 2019 Consolidated Pi l lar 3 Report
4.3 Standardised approach for market risk
The following table summarizes the capital requirements for market risk per risk factor, based on the Standardised approach, at 30 June 2019 and 31 December 2018. Table 27: EU MR1 – Market risk under the standardised approach
RWAs
Capital
requirements RWAs
Capital
requirements
€ million € million € million € million
Outright products
Interest rate risk (general and specific) 2 - 2 -
Equity risk (general and specific) 9 1 7 1
Foreign exchange risk 229 18 188 15
Commodity risk - - - -
Options
Simplified approach - - - -
Delta-plus method - - - -
Scenario approach - - - -
Securitisation (specific risk) - - - -
Total 240 19 197 16
30 June 2019 31 December 2018
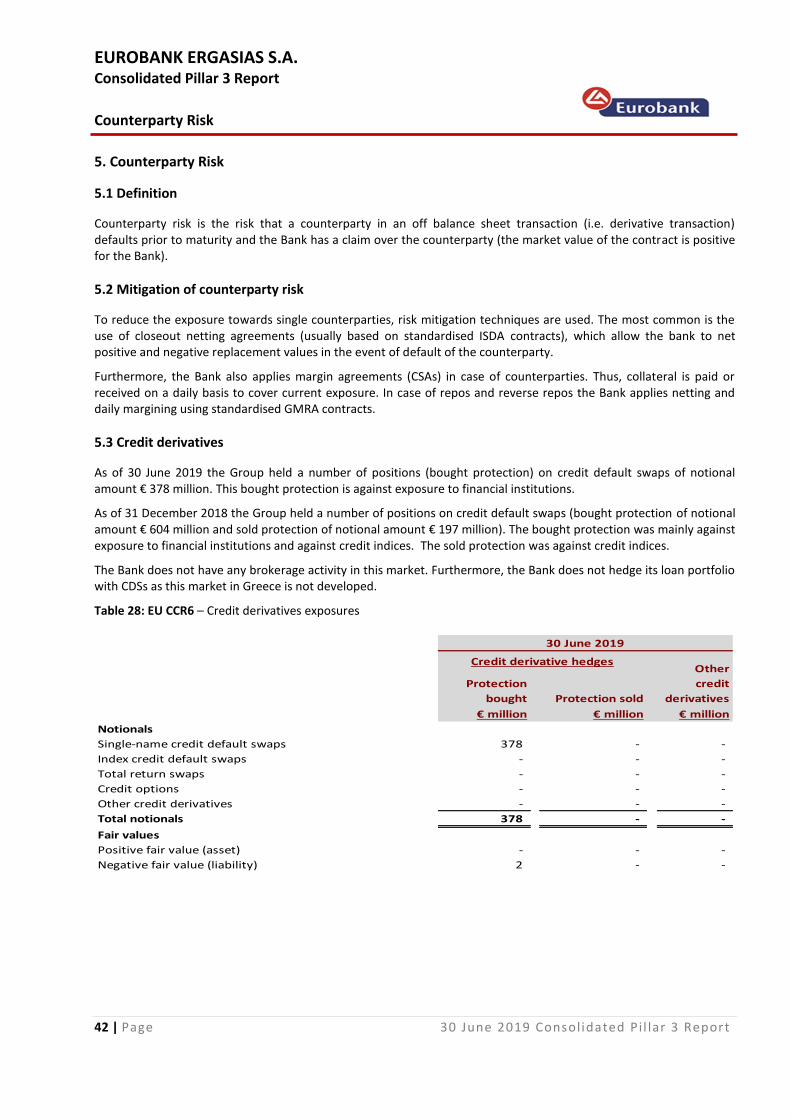
EUROBANK ERGASIAS S.A. Consolidated Pillar 3 Report
Counterparty Risk
42 | Page 30 June 2019 Consolidated Pi l lar 3 Report
5. Counterparty Risk
5.1 Definition
Counterparty risk is the risk that a counterparty in an off balance sheet transaction (i.e. derivative transaction) defaults prior to maturity and the Bank has a claim over the counterparty (the market value of the contract is positive for the Bank).
5.2 Mitigation of counterparty risk
To reduce the exposure towards single counterparties, risk mitigation techniques are used. The most common is the use of closeout netting agreements (usually based on standardised ISDA contracts), which allow the bank to net positive and negative replacement values in the event of default of the counterparty. Furthermore, the Bank also applies margin agreements (CSAs) in case of counterparties. Thus, collateral is paid or received on a daily basis to cover current exposure. In case of repos and reverse repos the Bank applies netting and daily margining using standardised GMRA contracts.
5.3 Credit derivatives
As of 30 June 2019 the Group held a number of positions (bought protection) on credit default swaps of notional amount € 378 million. This bought protection is against exposure to financial institutions. As of 31 December 2018 the Group held a number of positions on credit default swaps (bought protection of notional amount € 604 million and sold protection of notional amount € 197 million). The bought protection was mainly against exposure to financial institutions and against credit indices. The sold protection was against credit indices. The Bank does not have any brokerage activity in this market. Furthermore, the Bank does not hedge its loan portfolio with CDSs as this market in Greece is not developed. Table 28: EU CCR6 – Credit derivatives exposures
Protection
bought Protection sold
€ million € million € million
Notionals
Single-name credit default swaps 378 - -
Index credit default swaps - - -
Total return swaps - - -
Credit options - - -
Other credit derivatives - - -
Total notionals 378 - -
Fair values
Positive fair value (asset) - - -
Negative fair value (liability) 2 - -
Credit derivative hedgesOther
credit
derivatives
30 June 2019
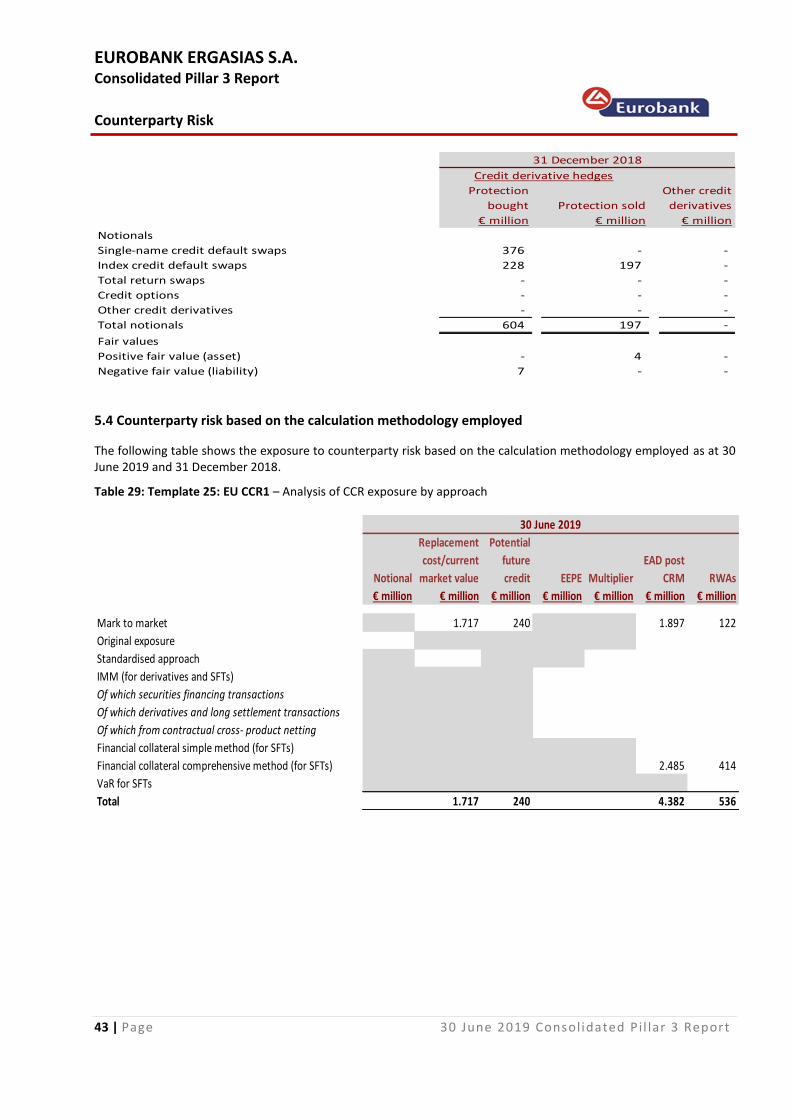
EUROBANK ERGASIAS S.A. Consolidated Pillar 3 Report
Counterparty Risk
43 | Page 30 June 2019 Consolidated Pi l lar 3 Report
Protection
bought Protection sold
€ million € million € million
Notionals
Single-name credit default swaps 376 - -
Index credit default swaps 228 197 -
Total return swaps - - -
Credit options - - -
Other credit derivatives - - -
Total notionals 604 197 -
Fair values
Positive fair value (asset) - 4 -
Negative fair value (liability) 7 - -
31 December 2018
Credit derivative hedges
Other credit
derivatives
5.4 Counterparty risk based on the calculation methodology employed
The following table shows the exposure to counterparty risk based on the calculation methodology employed as at 30 June 2019 and 31 December 2018. Table 29: Template 25: EU CCR1 – Analysis of CCR exposure by approach
Notional
Replacement
cost/current
market value
Potential
future
credit EEPE Multiplier
EAD post
CRM RWAs
€ million € million € million € million € million € million € million
Mark to market 1.717 240 1.897 122
Original exposure
Standardised approach
IMM (for derivatives and SFTs)
Of which securities financing transactions
Of which derivatives and long settlement transactions
Of which from contractual cross- product netting
Financial collateral simple method (for SFTs)
Financial collateral comprehensive method (for SFTs) 2.485 414
VaR for SFTs
Total 1.717 240 4.382 536
30 June 2019
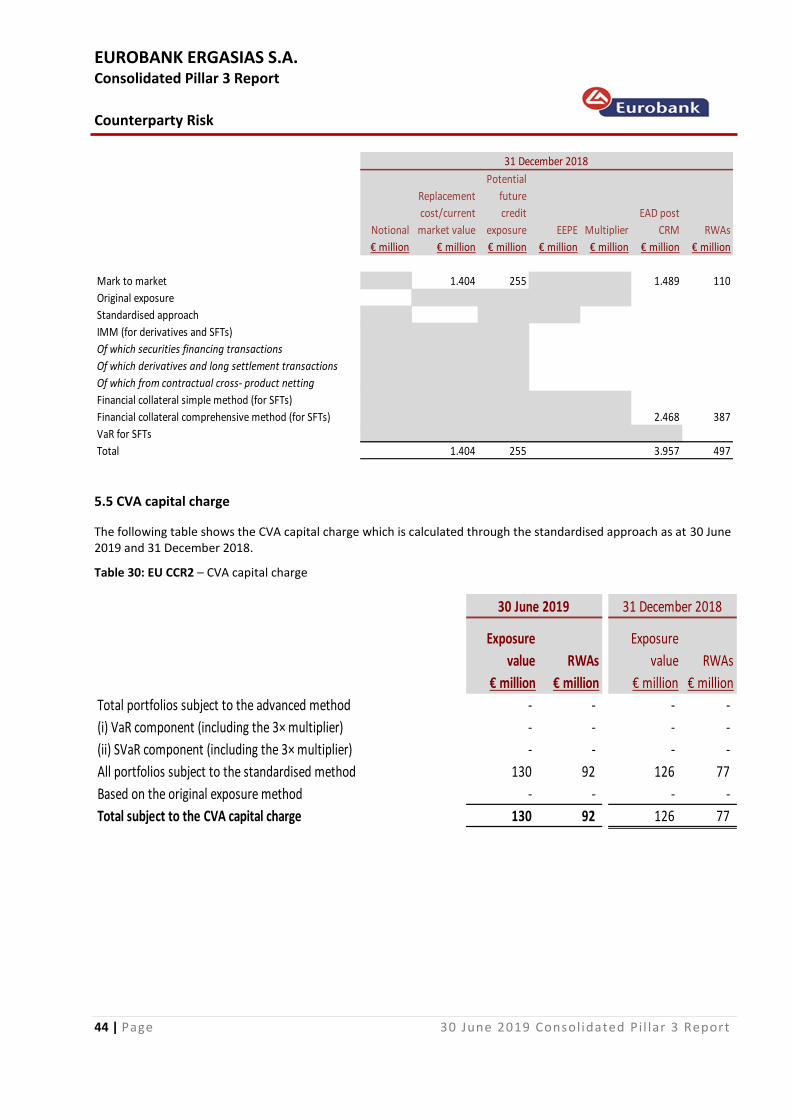
EUROBANK ERGASIAS S.A. Consolidated Pillar 3 Report
Counterparty Risk
44 | Page 30 June 2019 Consolidated Pi l lar 3 Report
Notional
Replacement
cost/current
market value
Potential
future
credit
exposure EEPE Multiplier
EAD post
CRM RWAs
€ million € million € million € million € million € million € million
Mark to market 1.404 255 1.489 110
Original exposure
Standardised approach
IMM (for derivatives and SFTs)
Of which securities financing transactions
Of which derivatives and long settlement transactions
Of which from contractual cross- product netting
Financial collateral simple method (for SFTs)
Financial collateral comprehensive method (for SFTs) 2.468 387
VaR for SFTs
Total 1.404 255 3.957 497
31 December 2018
5.5 CVA capital charge
The following table shows the CVA capital charge which is calculated through the standardised approach as at 30 June 2019 and 31 December 2018. Table 30: EU CCR2 – CVA capital charge
Exposure
value RWAs
Exposure
value RWAs
€ million € million € million € million
Total portfolios subject to the advanced method - - - -
(i) VaR component (including the 3× multiplier) - - - -
(ii) SVaR component (including the 3× multiplier) - - - -
All portfolios subject to the standardised method 130 92 126 77
Based on the original exposure method - - - -
Total subject to the CVA capital charge 130 92 126 77
30 June 2019 31 December 2018
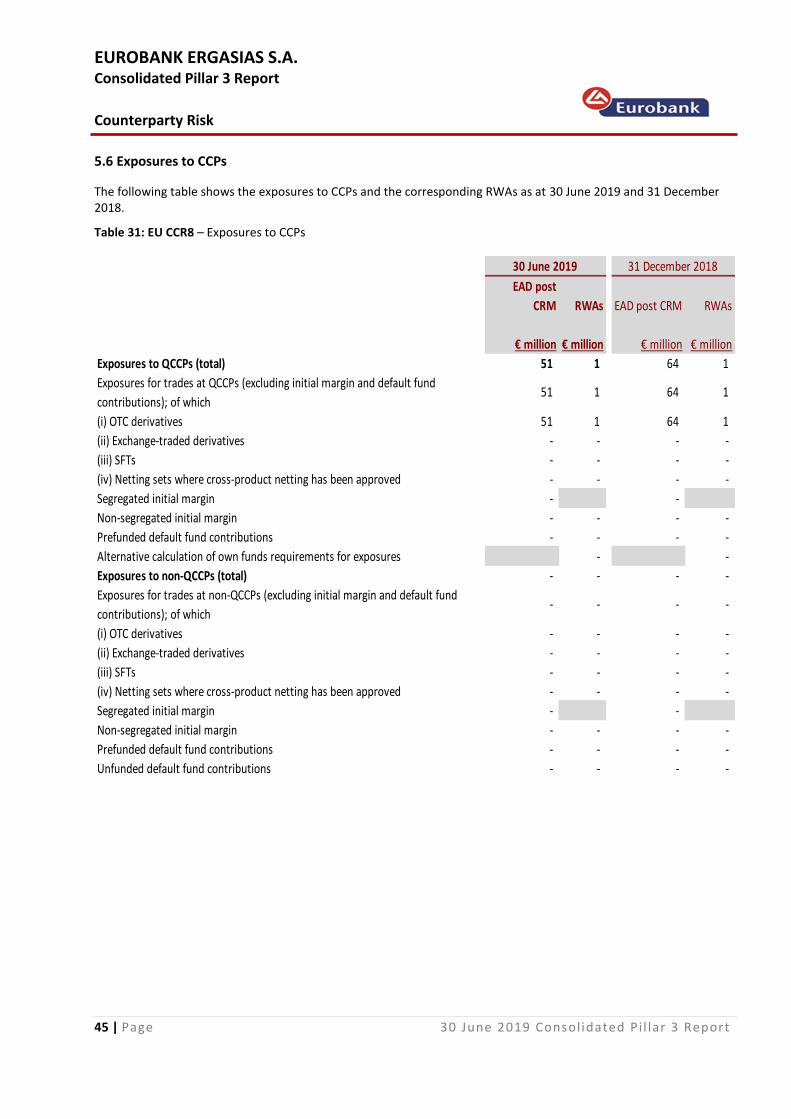
EUROBANK ERGASIAS S.A. Consolidated Pillar 3 Report
Counterparty Risk
45 | Page 30 June 2019 Consolidated Pi l lar 3 Report
5.6 Exposures to CCPs
The following table shows the exposures to CCPs and the corresponding RWAs as at 30 June 2019 and 31 December 2018. Table 31: EU CCR8 – Exposures to CCPs
EAD post
CRM RWAs EAD post CRM RWAs
€ million € million € million € million
Exposures to QCCPs (total) 51 1 64 1
Exposures for trades at QCCPs (excluding initial margin and default fund
contributions); of which51 1 64 1
(i) OTC derivatives 51 1 64 1
(ii) Exchange-traded derivatives - - - -
(iii) SFTs - - - -
(iv) Netting sets where cross-product netting has been approved - - - -
Segregated initial margin - -
Non-segregated initial margin - - - -
Prefunded default fund contributions - - - -
Alternative calculation of own funds requirements for exposures - -
Exposures to non-QCCPs (total) - - - -
Exposures for trades at non-QCCPs (excluding initial margin and default fund
contributions); of which- - - -
(i) OTC derivatives - - - -
(ii) Exchange-traded derivatives - - - -
(iii) SFTs - - - -
(iv) Netting sets where cross-product netting has been approved - - - -
Segregated initial margin - -
Non-segregated initial margin - - - -
Prefunded default fund contributions - - - -
Unfunded default fund contributions - - - -
31 December 201830 June 2019
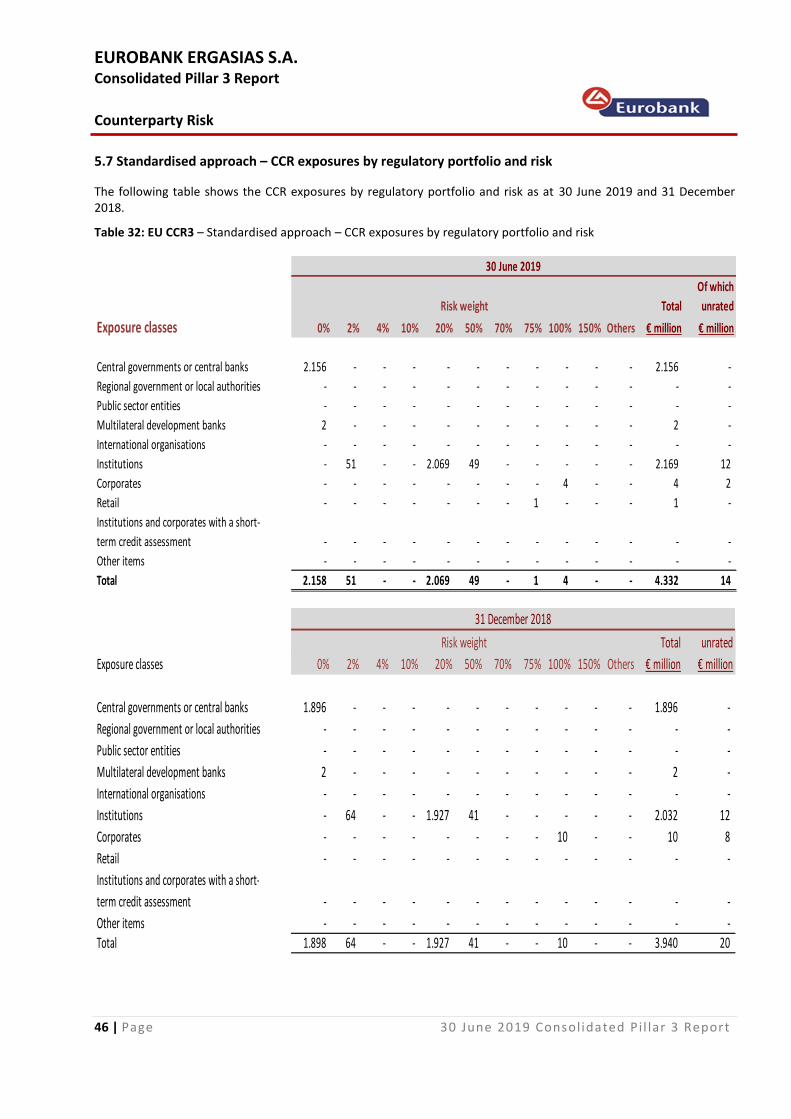
EUROBANK ERGASIAS S.A. Consolidated Pillar 3 Report
Counterparty Risk
46 | Page 30 June 2019 Consolidated Pi l lar 3 Report
5.7 Standardised approach – CCR exposures by regulatory portfolio and risk
The following table shows the CCR exposures by regulatory portfolio and risk as at 30 June 2019 and 31 December 2018. Table 32: EU CCR3 – Standardised approach – CCR exposures by regulatory portfolio and risk
Total
Of which
unrated
Exposure classes 0% 2% 4% 10% 20% 50% 70% 75% 100% 150% Others € million € million
Central governments or central banks 2.156 - - - - - - - - - - 2.156 -
Regional government or local authorities - - - - - - - - - - - - -
Public sector entities - - - - - - - - - - - - -
Multilateral development banks 2 - - - - - - - - - - 2 -
International organisations - - - - - - - - - - - - -
Institutions - 51 - - 2.069 49 - - - - - 2.169 12
Corporates - - - - - - - - 4 - - 4 2
Retail - - - - - - - 1 - - - 1 -
Institutions and corporates with a short-
term credit assessment - - - - - - - - - - - - -
Other items - - - - - - - - - - - - -
Total 2.158 51 - - 2.069 49 - 1 4 - - 4.332 14
30 June 2019
Risk weight
Total
Of which
unrated
Exposure classes 0% 2% 4% 10% 20% 50% 70% 75% 100% 150% Others € million € million
Central governments or central banks 1.896 - - - - - - - - - - 1.896 -
Regional government or local authorities - - - - - - - - - - - - -
Public sector entities - - - - - - - - - - - - -
Multilateral development banks 2 - - - - - - - - - - 2 -
International organisations - - - - - - - - - - - - -
Institutions - 64 - - 1.927 41 - - - - - 2.032 12
Corporates - - - - - - - - 10 - - 10 8
Retail - - - - - - - - - - - - -
Institutions and corporates with a short-
term credit assessment - - - - - - - - - - - - -
Other items - - - - - - - - - - - - - Total 1.898 64 - - 1.927 41 - - 10 - - 3.940 20
Risk weight
31 December 2018
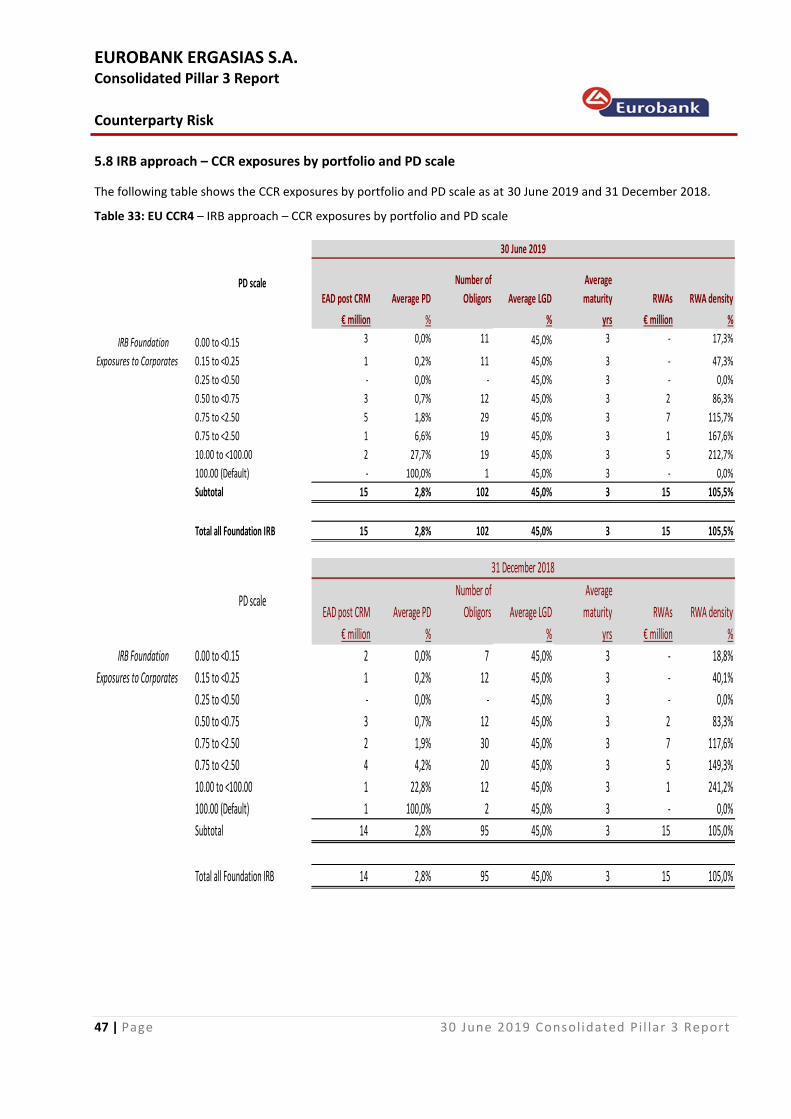
EUROBANK ERGASIAS S.A. Consolidated Pillar 3 Report
Counterparty Risk
47 | Page 30 June 2019 Consolidated Pi l lar 3 Report
5.8 IRB approach – CCR exposures by portfolio and PD scale
The following table shows the CCR exposures by portfolio and PD scale as at 30 June 2019 and 31 December 2018. Table 33: EU CCR4 – IRB approach – CCR exposures by portfolio and PD scale
PD scaleEAD post CRM Average PD
Number of
Obligors Average LGD
Average
maturity RWAs RWA density
€ million % % yrs € million %
IRB Foundation 0.00 to <0.15 3 0,0% 11 45,0% 3 - 17,3%
Exposures to Corporates 0.15 to <0.25 1 0,2% 11 45,0% 3 - 47,3%
0.25 to <0.50 - 0,0% - 45,0% 3 - 0,0%
0.50 to <0.75 3 0,7% 12 45,0% 3 2 86,3%
0.75 to <2.50 5 1,8% 29 45,0% 3 7 115,7%
0.75 to <2.50 1 6,6% 19 45,0% 3 1 167,6%
10.00 to <100.00 2 27,7% 19 45,0% 3 5 212,7%
100.00 (Default) - 100,0% 1 45,0% 3 - 0,0%
Subtotal 15 2,8% 102 45,0% 3 15 105,5%
Total all Foundation IRB 15 2,8% 102 45,0% 3 15 105,5%
30 June 2019
PD scaleEAD post CRM Average PD
Number of
Obligors Average LGD
Average
maturity RWAs RWA density
€ million % % yrs € million %
IRB Foundation 0.00 to <0.15 2 0,0% 7 45,0% 3 - 18,8%
Exposures to Corporates 0.15 to <0.25 1 0,2% 12 45,0% 3 - 40,1%
0.25 to <0.50 - 0,0% - 45,0% 3 - 0,0%
0.50 to <0.75 3 0,7% 12 45,0% 3 2 83,3%
0.75 to <2.50 2 1,9% 30 45,0% 3 7 117,6%
0.75 to <2.50 4 4,2% 20 45,0% 3 5 149,3%
10.00 to <100.00 1 22,8% 12 45,0% 3 1 241,2%
100.00 (Default) 1 100,0% 2 45,0% 3 - 0,0%
Subtotal 14 2,8% 95 45,0% 3 15 105,0%
Total all Foundation IRB 14 2,8% 95 45,0% 3 15 105,0%
31 December 2018
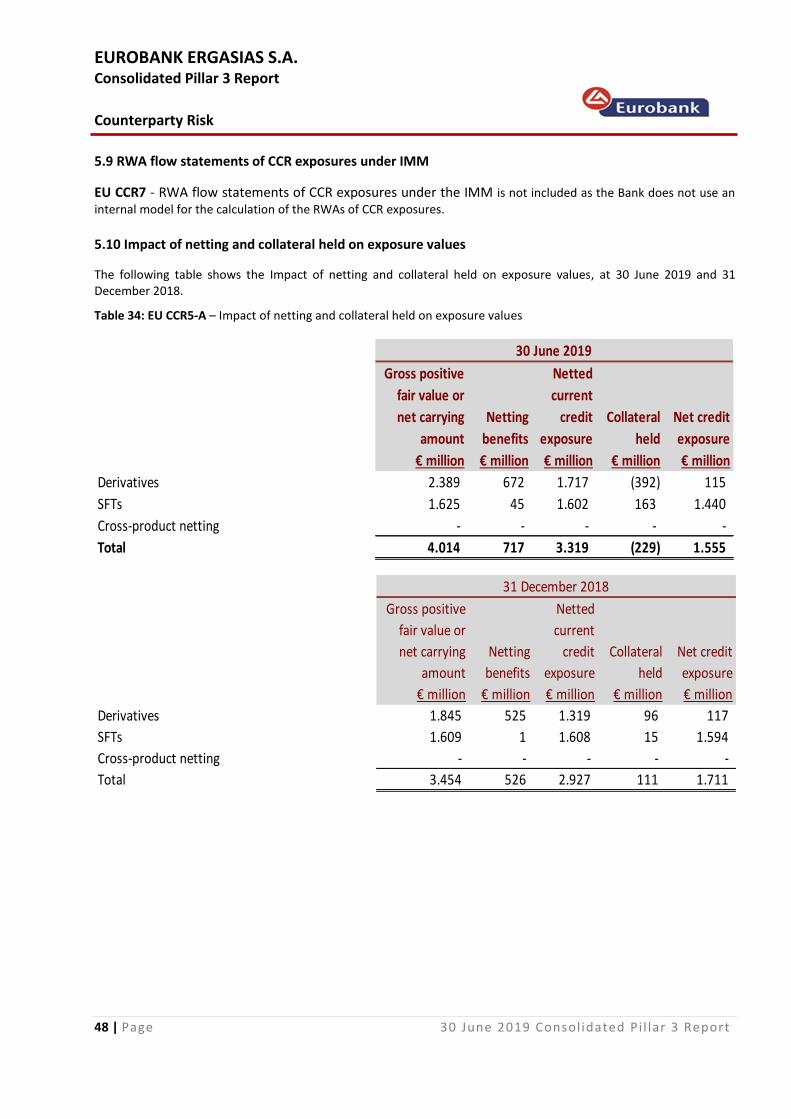
EUROBANK ERGASIAS S.A. Consolidated Pillar 3 Report
Counterparty Risk
48 | Page 30 June 2019 Consolidated Pi l lar 3 Report
5.9 RWA flow statements of CCR exposures under IMM
EU CCR7 - RWA flow statements of CCR exposures under the IMM is not included as the Bank does not use an
internal model for the calculation of the RWAs of CCR exposures.
5.10 Impact of netting and collateral held on exposure values
The following table shows the Impact of netting and collateral held on exposure values, at 30 June 2019 and 31 December 2018. Table 34: EU CCR5-A – Impact of netting and collateral held on exposure values
Gross positive
fair value or
net carrying
amount
Netting
benefits
Netted
current
credit
exposure
Collateral
held
Net credit
exposure
€ million € million € million € million € million
Derivatives 2.389 672 1.717 (392) 115
SFTs 1.625 45 1.602 163 1.440
Cross-product netting - - - - -
Total 4.014 717 3.319 (229) 1.555
30 June 2019
Gross positive
fair value or
net carrying
amount
Netting
benefits
Netted
current
credit
exposure
Collateral
held
Net credit
exposure
€ million € million € million € million € million
Derivatives 1.845 525 1.319 96 117
SFTs 1.609 1 1.608 15 1.594
Cross-product netting - - - - -
Total 3.454 526 2.927 111 1.711
31 December 2018
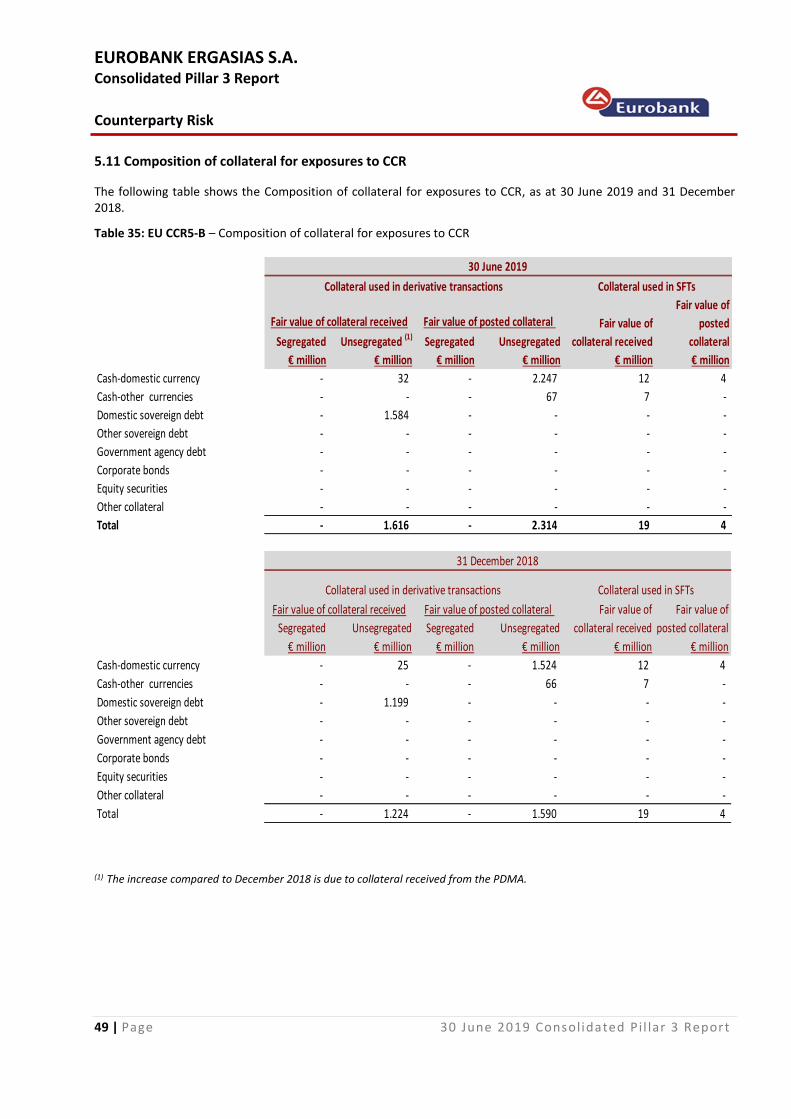
EUROBANK ERGASIAS S.A. Consolidated Pillar 3 Report
Counterparty Risk
49 | Page 30 June 2019 Consolidated Pi l lar 3 Report
5.11 Composition of collateral for exposures to CCR
The following table shows the Composition of collateral for exposures to CCR, as at 30 June 2019 and 31 December 2018. Table 35: EU CCR5-B – Composition of collateral for exposures to CCR
Segregated Unsegregated (1) Segregated Unsegregated
€ million € million € million € million € million € million
Cash-domestic currency - 32 - 2.247 12 4
Cash-other currencies - - - 67 7 -
Domestic sovereign debt - 1.584 - - - -
Other sovereign debt - - - - - -
Government agency debt - - - - - -
Corporate bonds - - - - - -
Equity securities - - - - - -
Other collateral - - - - - -
Total - 1.616 - 2.314 19 4
Fair value of
posted
collateral
Collateral used in SFTs
Fair value of collateral received Fair value of posted collateral
Collateral used in derivative transactions
Fair value of
collateral received
30 June 2019
Segregated Unsegregated Segregated Unsegregated
€ million € million € million € million € million € million
Cash-domestic currency - 25 - 1.524 12 4
Cash-other currencies - - - 66 7 -
Domestic sovereign debt - 1.199 - - - -
Other sovereign debt - - - - - -
Government agency debt - - - - - -
Corporate bonds - - - - - -
Equity securities - - - - - -
Other collateral - - - - - -
Total - 1.224 - 1.590 19 4
31 December 2018
Collateral used in derivative transactions Collateral used in SFTs
Fair value of collateral received Fair value of posted collateral Fair value of
collateral received
Fair value of
posted collateral
(1) The increase compared to December 2018 is due to collateral received from the PDMA.
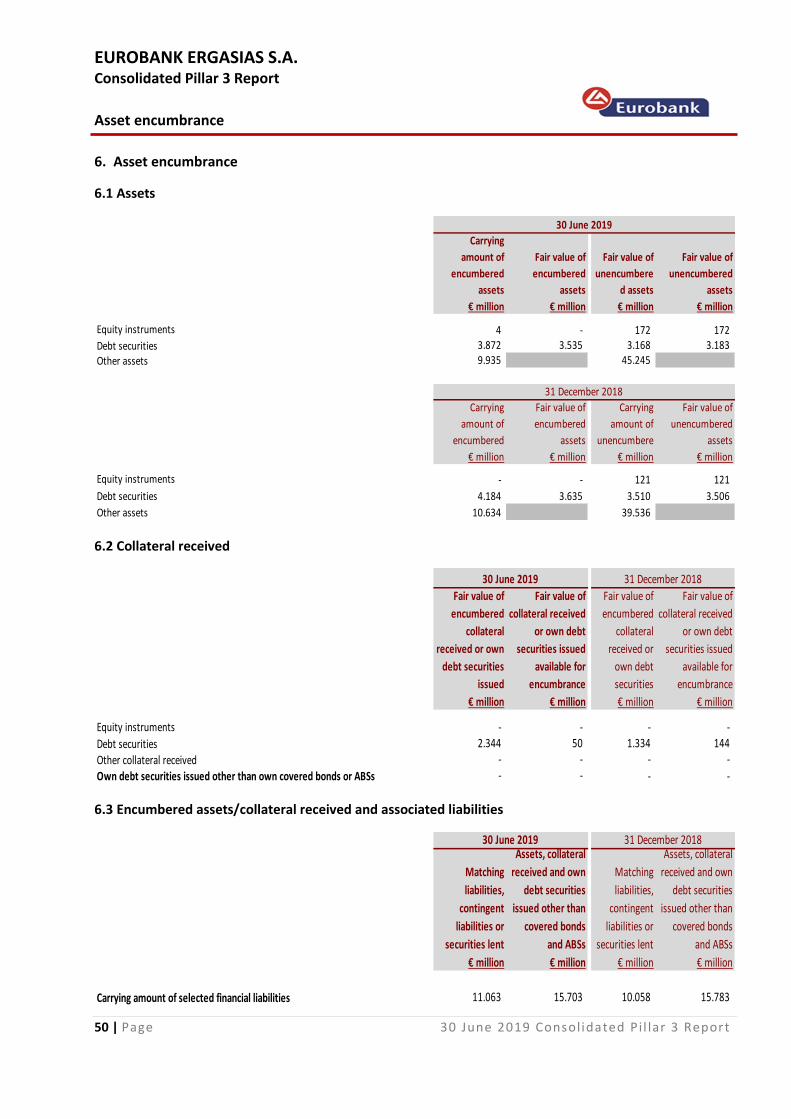
EUROBANK ERGASIAS S.A. Consolidated Pillar 3 Report
Asset encumbrance
50 | Page 30 June 2019 Consolidated Pi l lar 3 Report
6. Asset encumbrance
6.1 Assets
Carrying
amount of
encumbered
assets
Fair value of
encumbered
assets
Fair value of
unencumbere
d assets
Fair value of
unencumbered
assets
€ million € million € million € million
4 - 172 172 3.872 3.535 3.168 3.183 9.935 45.245
€ million € million € million € million
- - 121 121
4.184 3.635 3.510 3.506
10.634 39.536 Other assets
Carrying
amount of
encumbered
Fair value of
encumbered
assets
Equity instruments
Debt securities
Equity instruments
Debt securitiesOther assets
Carrying
amount of
unencumbere
31 December 2018
30 June 2019
Fair value of
unencumbered
assets
6.2 Collateral received
€ million € million € million € million
- - - - 2.344 50 1.334 144
- - - - - - - -
Equity instruments
Debt securitiesOther collateral receivedOwn debt securities issued other than own covered bonds or ABSs
31 December 2018
Fair value of
encumbered
collateral
received or
own debt
securities
Fair value of
collateral received
or own debt
securities issued
available for
encumbrance
30 June 2019
Fair value of
encumbered
collateral
received or own
debt securities
issued
Fair value of
collateral received
or own debt
securities issued
available for
encumbrance
6.3 Encumbered assets/collateral received and associated liabilities
Matching
liabilities,
contingent
liabilities or
securities lent
Assets, collateral
received and own
debt securities
issued other than
covered bonds
and ABSs
Matching
liabilities,
contingent
liabilities or
securities lent
Assets, collateral
received and own
debt securities
issued other than
covered bonds
and ABSs
€ million € million € million € million
11.063 15.703 10.058 15.783 Carrying amount of selected financial liabilities
31 December 201830 June 2019
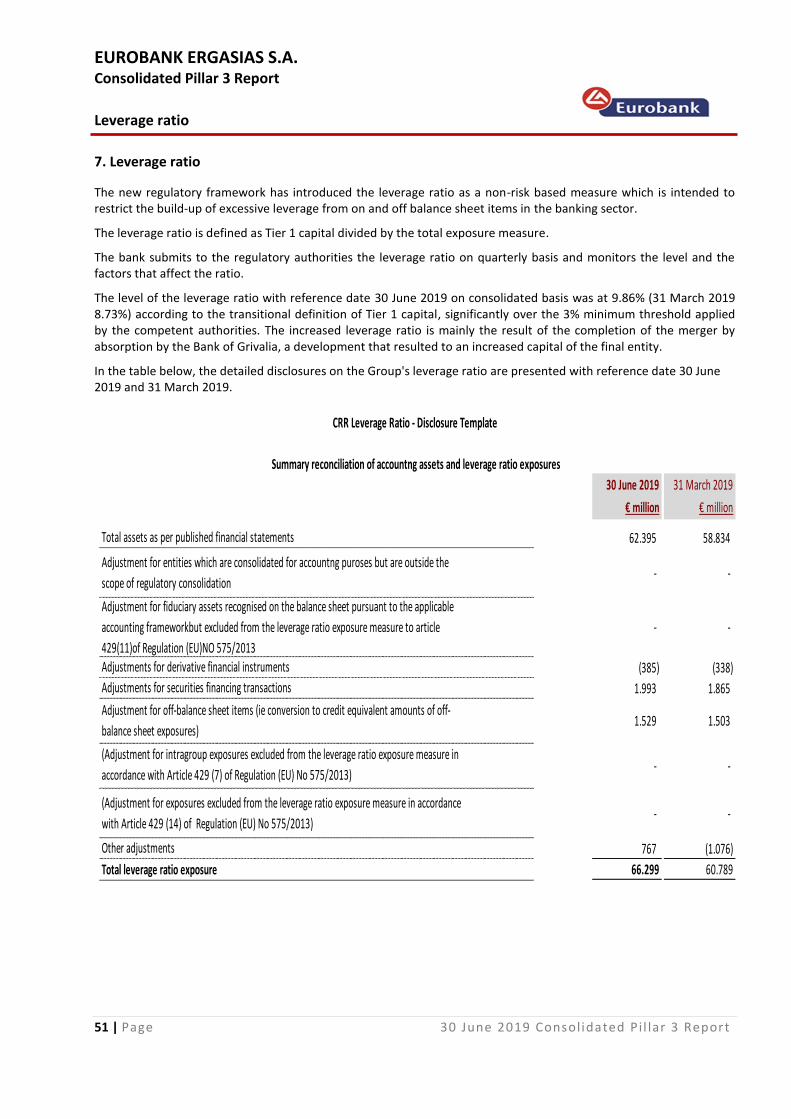
EUROBANK ERGASIAS S.A. Consolidated Pillar 3 Report
Leverage ratio
51 | Page 30 June 2019 Consolidated Pi l lar 3 Report
7. Leverage ratio
The new regulatory framework has introduced the leverage ratio as a non-risk based measure which is intended to restrict the build-up of excessive leverage from on and off balance sheet items in the banking sector. The leverage ratio is defined as Tier 1 capital divided by the total exposure measure. The bank submits to the regulatory authorities the leverage ratio on quarterly basis and monitors the level and the factors that affect the ratio. The level of the leverage ratio with reference date 30 June 2019 on consolidated basis was at 9.86% (31 March 2019 8.73%) according to the transitional definition of Tier 1 capital, significantly over the 3% minimum threshold applied by the competent authorities. The increased leverage ratio is mainly the result of the completion of the merger by absorption by the Bank of Grivalia, a development that resulted to an increased capital of the final entity. In the table below, the detailed disclosures on the Group's leverage ratio are presented with reference date 30 June 2019 and 31 March 2019.
30 June 2019 31 March 2019
€ million € million
62.395 58.834
- -
- -
(385) (338)
1.993 1.865
1.529 1.503
- -
- -
767 (1.076)
66.299 60.789
Adjustments for derivative financial instruments
Adjustments for securities financing transactions
Adjustment for off-balance sheet items (ie conversion to credit equivalent amounts of off-
balance sheet exposures)
(Adjustment for intragroup exposures excluded from the leverage ratio exposure measure in
accordance with Article 429 (7) of Regulation (EU) No 575/2013)
(Adjustment for exposures excluded from the leverage ratio exposure measure in accordance
with Article 429 (14) of Regulation (EU) No 575/2013)
Other adjustments
Total leverage ratio exposure
Adjustment for fiduciary assets recognised on the balance sheet pursuant to the applicable
accounting frameworkbut excluded from the leverage ratio exposure measure to article
429(11)of Regulation (EU)NO 575/2013
CRR Leverage Ratio - Disclosure Template
Summary reconciliation of accountng assets and leverage ratio exposures
Total assets as per published financial statements
Adjustment for entities which are consolidated for accountng puroses but are outside the
scope of regulatory consolidation
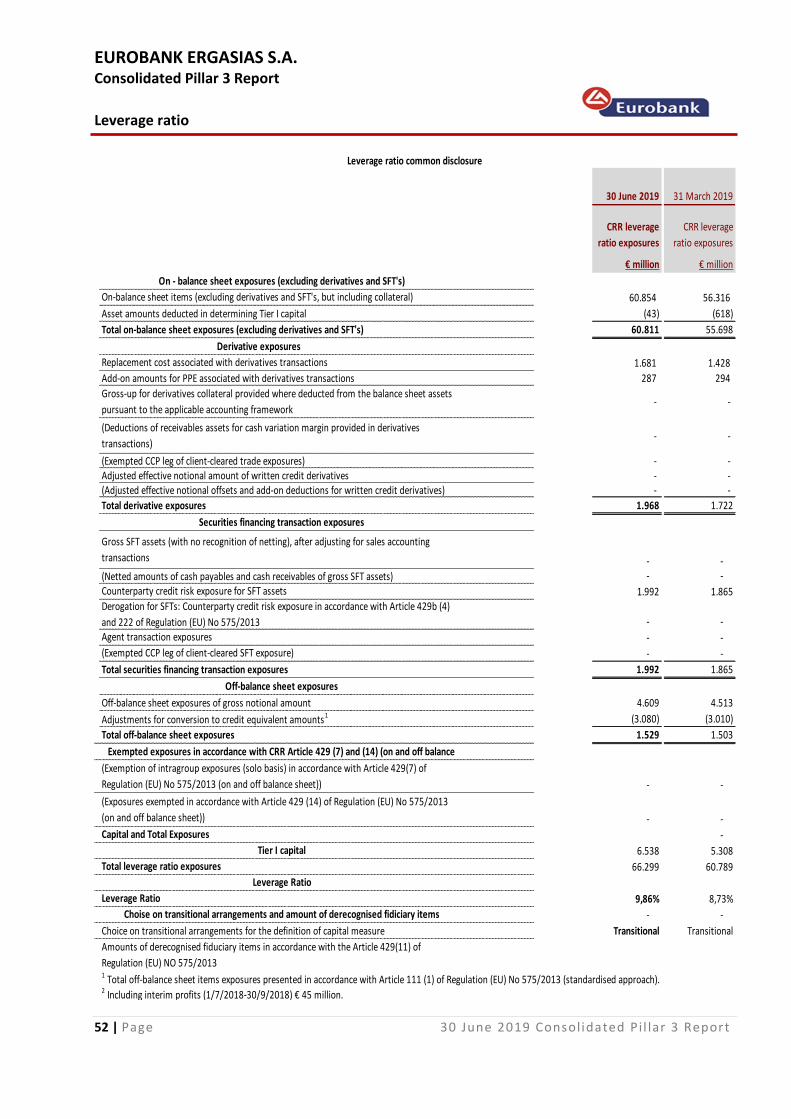
EUROBANK ERGASIAS S.A. Consolidated Pillar 3 Report
Leverage ratio
52 | Page 30 June 2019 Consolidated Pi l lar 3 Report
30 June 2019 31 March 2019
CRR leverage
ratio exposures
CRR leverage
ratio exposures
€ million € million
60.854 56.316
(43) (618)
60.811 55.698
1.681 1.428
287 294
- -
- -
- - - - - -
1.968 1.722
- - - -
1.992 1.865
- -
- -
- -
1.992 1.865
4.609 4.513
(3.080) (3.010)
1.529 1.503
- -
- -
-
6.538 5.308
66.299 60.789
9,86% 8,73%
- -
Transitional Transitional
Capital and Total Exposures
Tier I capital
Total leverage ratio exposures
Leverage Ratio
Leverage Ratio
Choise on transitional arrangements and amount of derecognised fidiciary items
Choice on transitional arrangements for the definition of capital measure
Amounts of derecognised fiduciary items in accordance with the Article 429(11) of
Regulation (EU) NO 575/2013
2 Including interim profits (1/7/2018-30/9/2018) € 45 million.
1 Total off-balance sheet items exposures presented in accordance with Article 111 (1) of Regulation (EU) No 575/2013 (standardised approach).
(Exposures exempted in accordance with Article 429 (14) of Regulation (EU) No 575/2013
(on and off balance sheet))
Counterparty credit risk exposure for SFT assets
Derogation for SFTs: Counterparty credit risk exposure in accordance with Article 429b (4)
and 222 of Regulation (EU) No 575/2013Agent transaction exposures
(Exempted CCP leg of client-cleared SFT exposure)
Total securities financing transaction exposures
Off-balance sheet exposures
Off-balance sheet exposures of gross notional amount
Adjustments for conversion to credit equivalent amounts1
Total off-balance sheet exposures
Exempted exposures in accordance with CRR Article 429 (7) and (14) (on and off balance
(Exemption of intragroup exposures (solo basis) in accordance with Article 429(7) of
Regulation (EU) No 575/2013 (on and off balance sheet))
(Netted amounts of cash payables and cash receivables of gross SFT assets)
Derivative exposures
Replacement cost associated with derivatives transactions
Add-on amounts for PPE associated with derivatives transactions
Gross-up for derivatives collateral provided where deducted from the balance sheet assets
pursuant to the applicable accounting framework
(Deductions of receivables assets for cash variation margin provided in derivatives
transactions)
(Exempted CCP leg of client-cleared trade exposures)Adjusted effective notional amount of written credit derivatives(Adjusted effective notional offsets and add-on deductions for written credit derivatives)
Total derivative exposures
Securities financing transaction exposures
Gross SFT assets (with no recognition of netting), after adjusting for sales accounting
transactions
Total on-balance sheet exposures (excluding derivatives and SFT's)
Leverage ratio common disclosure
On - balance sheet exposures (excluding derivatives and SFT's)
On-balance sheet items (excluding derivatives and SFT's, but including collateral)
Asset amounts deducted in determining Tier I capital
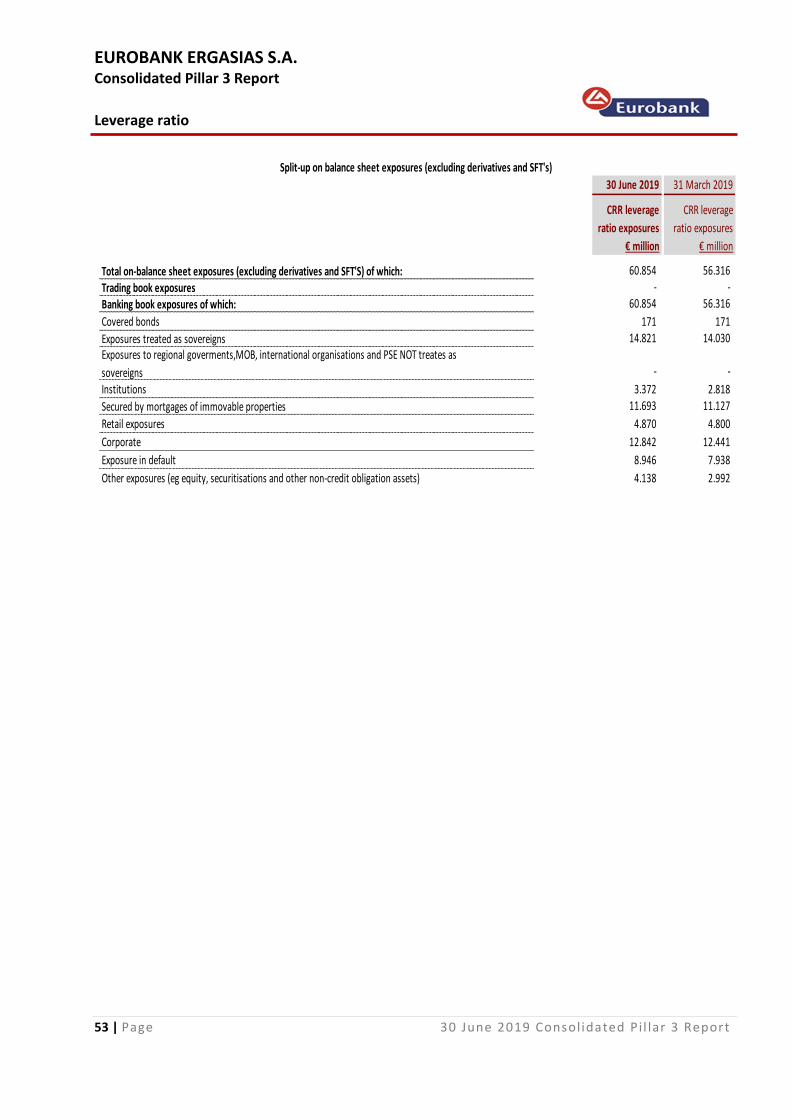
EUROBANK ERGASIAS S.A. Consolidated Pillar 3 Report
Leverage ratio
53 | Page 30 June 2019 Consolidated Pi l lar 3 Report
30 June 2019 31 March 2019
CRR leverage
ratio exposures
CRR leverage
ratio exposures
€ million € million
60.854 56.316 - -
60.854 56.316
171 171 14.821 14.030
- -
3.372 2.818 11.693 11.127
Retail exposures 4.870 4.800
12.842 12.441
8.946 7.938
4.138 2.992
Corporate
Exposure in default
Other exposures (eg equity, securitisations and other non-credit obligation assets)
Banking book exposures of which:
Covered bonds
Exposures treated as sovereignsExposures to regional goverments,MOB, international organisations and PSE NOT treates as
sovereignsInstitutions
Secured by mortgages of immovable properties
Trading book exposures
Split-up on balance sheet exposures (excluding derivatives and SFT's)
Total on-balance sheet exposures (excluding derivatives and SFT'S) of which:
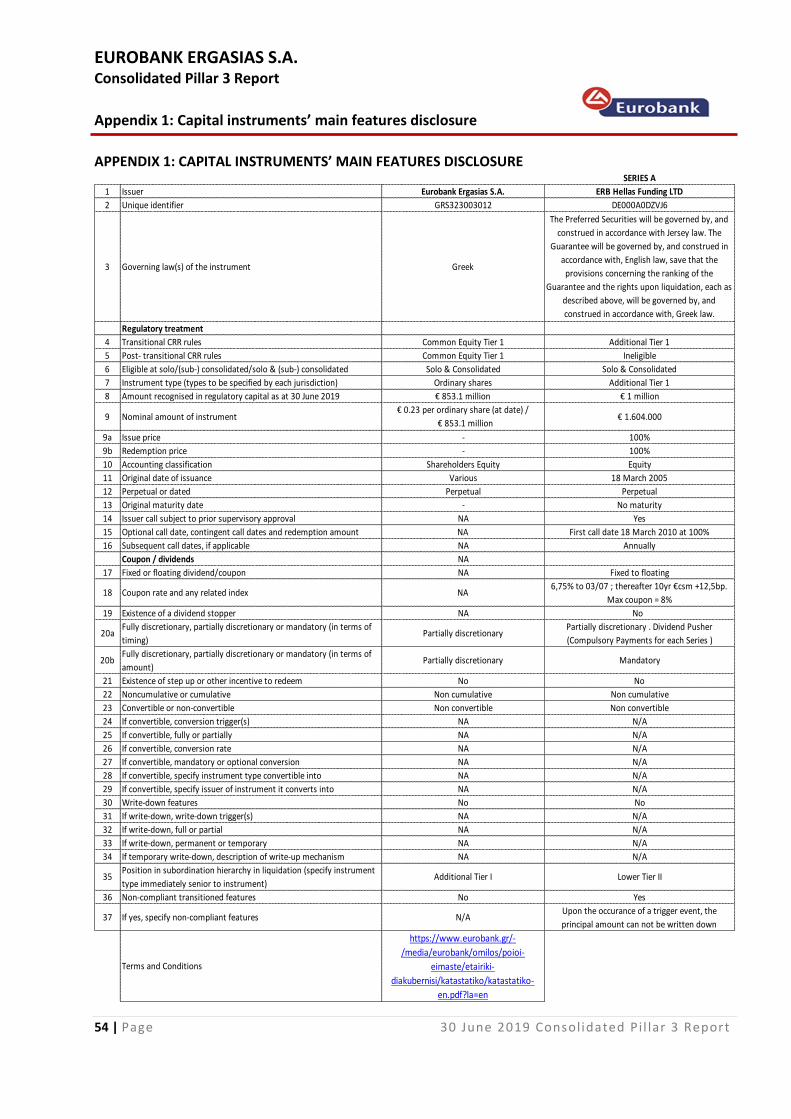
EUROBANK ERGASIAS S.A. Consolidated Pillar 3 Report
Appendix 1: Capital instruments’ main features disclosure
54 | Page 30 June 2019 Consolidated Pi l lar 3 Report
APPENDIX 1: CAPITAL INSTRUMENTS’ MAIN FEATURES DISCLOSURE SERIES A
1 Issuer Eurobank Ergasias S.A. ERB Hellas Funding LTD
2 Unique identifier GRS323003012 DE000A0DZVJ6
3 Governing law(s) of the instrument Greek
The Preferred Securities will be governed by, and
construed in accordance with Jersey law. The
Guarantee will be governed by, and construed in
accordance with, English law, save that the
provisions concerning the ranking of the
Guarantee and the rights upon liquidation, each as
described above, will be governed by, and
construed in accordance with, Greek law.
Regulatory treatment
4 Transitional CRR rules Common Equity Tier 1 Additional Tier 1
5 Post- transitional CRR rules Common Equity Tier 1 Ineligible
6 Eligible at solo/(sub-) consolidated/solo & (sub-) consolidated Solo & Consolidated Solo & Consolidated
7 Instrument type (types to be specified by each jurisdiction) Ordinary shares Additional Tier 1
8 Amount recognised in regulatory capital as at 30 June 2019 € 853.1 million € 1 million
9 Nominal amount of instrument€ 0.23 per ordinary share (at date) /
€ 853.1 million€ 1.604.000
9a Issue price - 100%
9b Redemption price - 100%
10 Accounting classification Shareholders Equity Equity
11 Original date of issuance Various 18 March 2005
12 Perpetual or dated Perpetual Perpetual
13 Original maturity date - No maturity
14 Issuer call subject to prior supervisory approval NA Yes
15 Optional call date, contingent call dates and redemption amount NA First call date 18 March 2010 at 100%
16 Subsequent call dates, if applicable NA Annually
Coupon / dividends NA
17 Fixed or floating dividend/coupon NA Fixed to floating
18 Coupon rate and any related index NA6,75% to 03/07 ; thereafter 10yr €csm +12,5bp.
Max coupon = 8%
19 Existence of a dividend stopper NA No
20aFully discretionary, partially discretionary or mandatory (in terms of
timing)Partially discretionary
Partially discretionary . Dividend Pusher
(Compulsory Payments for each Series )
20bFully discretionary, partially discretionary or mandatory (in terms of
amount)Partially discretionary Mandatory
21 Existence of step up or other incentive to redeem No No
22 Noncumulative or cumulative Non cumulative Non cumulative
23 Convertible or non-convertible Non convertible Non convertible
24 If convertible, conversion trigger(s) NA N/A
25 If convertible, fully or partially NA N/A
26 If convertible, conversion rate NA N/A
27 If convertible, mandatory or optional conversion NA N/A
28 If convertible, specify instrument type convertible into NA N/A
29 If convertible, specify issuer of instrument it converts into NA N/A
30 Write-down features No No
31 If write-down, write-down trigger(s) NA N/A
32 If write-down, full or partial NA N/A
33 If write-down, permanent or temporary NA N/A
34 If temporary write-down, description of write-up mechanism NA N/A
35Position in subordination hierarchy in liquidation (specify instrument
type immediately senior to instrument)Additional Tier I Lower Tier II
36 Non-compliant transitioned features No Yes
37 If yes, specify non-compliant features N/AUpon the occurance of a trigger event, the
principal amount can not be written down
Terms and Conditions
https://www.eurobank.gr/-
/media/eurobank/omilos/poioi-
eimaste/etairiki-
diakubernisi/katastatiko/katastatiko-
en.pdf?la=en
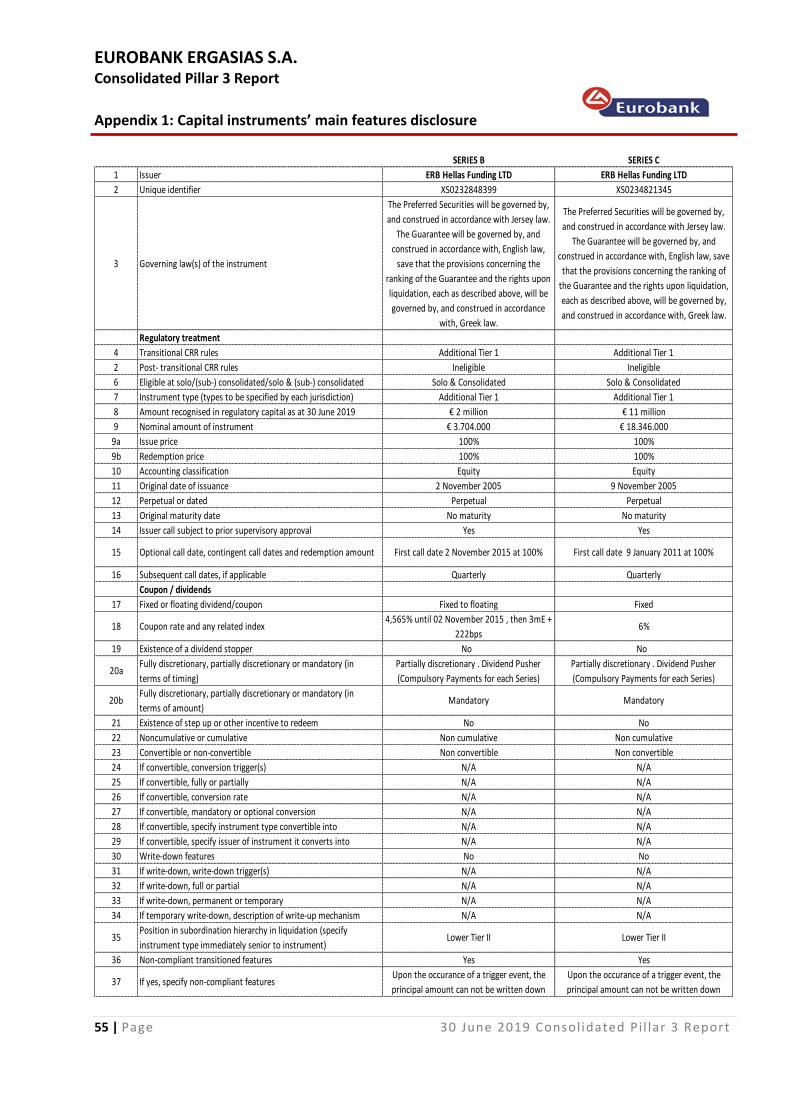
EUROBANK ERGASIAS S.A. Consolidated Pillar 3 Report
Appendix 1: Capital instruments’ main features disclosure
55 | Page 30 June 2019 Consolidated Pi l lar 3 Report
SERIES B SERIES C
1 Issuer ERB Hellas Funding LTD ERB Hellas Funding LTD
2 Unique identifier XS0232848399 XS0234821345
3 Governing law(s) of the instrument
The Preferred Securities will be governed by,
and construed in accordance with Jersey law.
The Guarantee will be governed by, and
construed in accordance with, English law,
save that the provisions concerning the
ranking of the Guarantee and the rights upon
liquidation, each as described above, will be
governed by, and construed in accordance
with, Greek law.
The Preferred Securities will be governed by,
and construed in accordance with Jersey law.
The Guarantee will be governed by, and
construed in accordance with, English law, save
that the provisions concerning the ranking of
the Guarantee and the rights upon liquidation,
each as described above, will be governed by,
and construed in accordance with, Greek law.
Regulatory treatment
4 Transitional CRR rules Additional Tier 1 Additional Tier 1
2 Post- transitional CRR rules Ineligible Ineligible
6 Eligible at solo/(sub-) consolidated/solo & (sub-) consolidated Solo & Consolidated Solo & Consolidated
7 Instrument type (types to be specified by each jurisdiction) Additional Tier 1 Additional Tier 1
8 Amount recognised in regulatory capital as at 30 June 2019 € 2 million € 11 million
9 Nominal amount of instrument € 3.704.000 € 18.346.000
9a Issue price 100% 100%
9b Redemption price 100% 100%
10 Accounting classification Equity Equity
11 Original date of issuance 2 November 2005 9 November 2005
12 Perpetual or dated Perpetual Perpetual
13 Original maturity date No maturity No maturity
14 Issuer call subject to prior supervisory approval Yes Yes
15 Optional call date, contingent call dates and redemption amount First call date 2 November 2015 at 100% First call date 9 January 2011 at 100%
16 Subsequent call dates, if applicable Quarterly Quarterly
Coupon / dividends
17 Fixed or floating dividend/coupon Fixed to floating Fixed
18 Coupon rate and any related index4,565% until 02 November 2015 , then 3mE +
222bps6%
19 Existence of a dividend stopper No No
20aFully discretionary, partially discretionary or mandatory (in
terms of timing)
Partially discretionary . Dividend Pusher
(Compulsory Payments for each Series)
Partially discretionary . Dividend Pusher
(Compulsory Payments for each Series)
20bFully discretionary, partially discretionary or mandatory (in
terms of amount)Mandatory Mandatory
21 Existence of step up or other incentive to redeem No No
22 Noncumulative or cumulative Non cumulative Non cumulative
23 Convertible or non-convertible Non convertible Non convertible
24 If convertible, conversion trigger(s) N/A N/A
25 If convertible, fully or partially N/A N/A
26 If convertible, conversion rate N/A N/A
27 If convertible, mandatory or optional conversion N/A N/A
28 If convertible, specify instrument type convertible into N/A N/A
29 If convertible, specify issuer of instrument it converts into N/A N/A
30 Write-down features No No
31 If write-down, write-down trigger(s) N/A N/A
32 If write-down, full or partial N/A N/A
33 If write-down, permanent or temporary N/A N/A
34 If temporary write-down, description of write-up mechanism N/A N/A
35Position in subordination hierarchy in liquidation (specify
instrument type immediately senior to instrument)Lower Tier II Lower Tier II
36 Non-compliant transitioned features Yes Yes
37 If yes, specify non-compliant featuresUpon the occurance of a trigger event, the
principal amount can not be written down
Upon the occurance of a trigger event, the
principal amount can not be written down
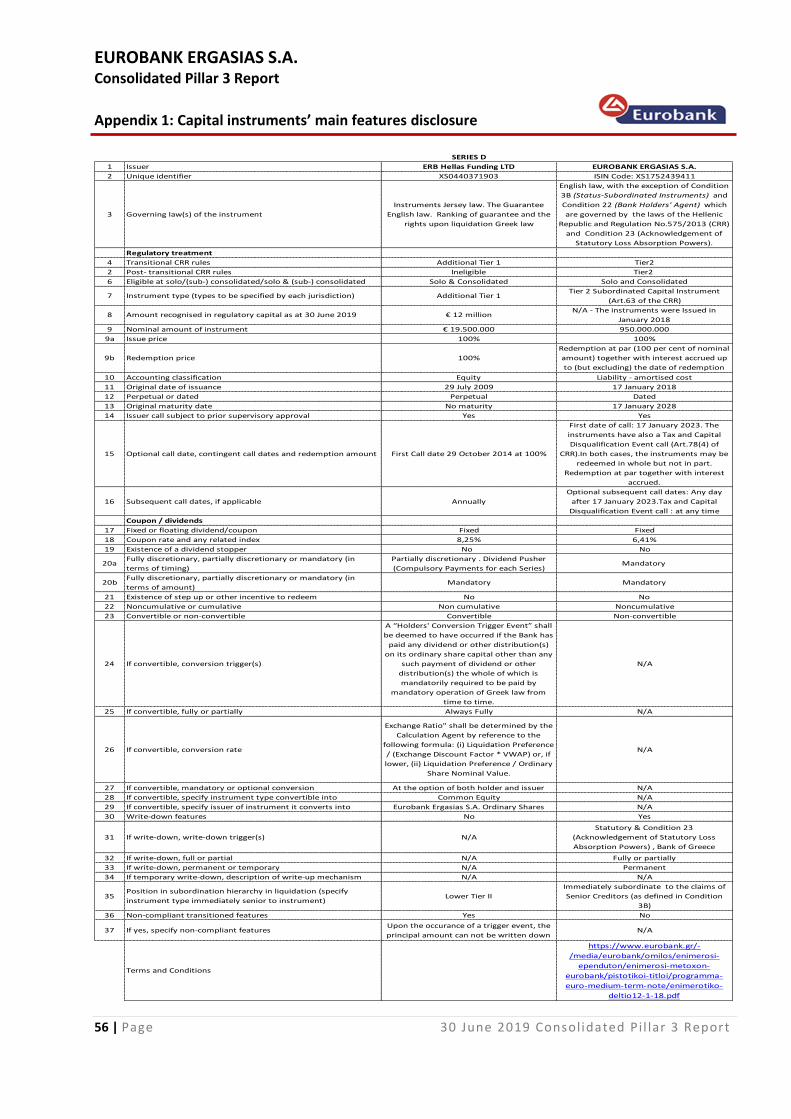
EUROBANK ERGASIAS S.A. Consolidated Pillar 3 Report
Appendix 1: Capital instruments’ main features disclosure
56 | Page 30 June 2019 Consolidated Pi l lar 3 Report
SERIES D
1 Issuer ERB Hellas Funding LTD EUROBANK ERGASIAS S.A.
2 Unique identifier XS0440371903 ISIN Code: XS1752439411
3 Governing law(s) of the instrument
Instruments Jersey law. The Guarantee
English law. Ranking of guarantee and the
rights upon liquidation Greek law
English law, with the exception of Condition
3B (Status-Subordinated Instruments) and
Condition 22 (Bank Holders' Agent) which
are governed by the laws of the Hellenic
Republic and Regulation No.575/2013 (CRR)
and Condition 23 (Acknowledgement of
Statutory Loss Absorption Powers).
Regulatory treatment
4 Transitional CRR rules Additional Tier 1 Tier2
2 Post- transitional CRR rules Ineligible Tier2
6 Eligible at solo/(sub-) consolidated/solo & (sub-) consolidated Solo & Consolidated Solo and Consolidated
7 Instrument type (types to be specified by each jurisdiction) Additional Tier 1Tier 2 Subordinated Capital Instrument
(Art.63 of the CRR)
8 Amount recognised in regulatory capital as at 30 June 2019 € 12 millionN/A - The instruments were Issued in
January 2018
9 Nominal amount of instrument € 19.500.000 950.000.000
9a Issue price 100% 100%
9b Redemption price 100%
Redemption at par (100 per cent of nominal
amount) together with interest accrued up
to (but excluding) the date of redemption
10 Accounting classification Equity Liability - amortised cost
11 Original date of issuance 29 July 2009 17 January 2018
12 Perpetual or dated Perpetual Dated
13 Original maturity date No maturity 17 January 2028
14 Issuer call subject to prior supervisory approval Yes Yes
15 Optional call date, contingent call dates and redemption amount First Call date 29 October 2014 at 100%
First date of call: 17 January 2023. The
instruments have also a Tax and Capital
Disqualification Event call (Art.78(4) of
CRR).In both cases, the instruments may be
redeemed in whole but not in part.
Redemption at par together with interest
accrued.
16 Subsequent call dates, if applicable Annually
Optional subsequent call dates: Any day
after 17 January 2023.Tax and Capital
Disqualification Event call : at any time
Coupon / dividends
17 Fixed or floating dividend/coupon Fixed Fixed
18 Coupon rate and any related index 8,25% 6,41%
19 Existence of a dividend stopper No No
20aFully discretionary, partially discretionary or mandatory (in
terms of timing)
Partially discretionary . Dividend Pusher
(Compulsory Payments for each Series)Mandatory
20bFully discretionary, partially discretionary or mandatory (in
terms of amount)Mandatory Mandatory
21 Existence of step up or other incentive to redeem No No
22 Noncumulative or cumulative Non cumulative Noncumulative
23 Convertible or non-convertible Convertible Non-convertible
24 If convertible, conversion trigger(s)
A “Holders' Conversion Trigger Event” shall
be deemed to have occurred if the Bank has
paid any dividend or other distribution(s)
on its ordinary share capital other than any
such payment of dividend or other
distribution(s) the whole of which is
mandatorily required to be paid by
mandatory operation of Greek law from
time to time.
N/A
25 If convertible, fully or partially Always Fully N/A
26 If convertible, conversion rate
Exchange Ratio" shall be determined by the
Calculation Agent by reference to the
following formula: (i) Liquidation Preference
/ (Exchange Discount Factor * VWAP) or, if
lower, (ii) Liquidation Preference / Ordinary
Share Nominal Value.
N/A
27 If convertible, mandatory or optional conversion At the option of both holder and issuer N/A
28 If convertible, specify instrument type convertible into Common Equity N/A
29 If convertible, specify issuer of instrument it converts into Eurobank Ergasias S.A. Ordinary Shares N/A
30 Write-down features No Yes
31 If write-down, write-down trigger(s) N/A
Statutory & Condition 23
(Acknowledgement of Statutory Loss
Absorption Powers) , Bank of Greece
32 If write-down, full or partial N/A Fully or partially
33 If write-down, permanent or temporary N/A Permanent
34 If temporary write-down, description of write-up mechanism N/A N/A
35Position in subordination hierarchy in liquidation (specify
instrument type immediately senior to instrument)Lower Tier II
Immediately subordinate to the claims of
Senior Creditors (as defined in Condition
3B)
36 Non-compliant transitioned features Yes No
37 If yes, specify non-compliant featuresUpon the occurance of a trigger event, the
principal amount can not be written downN/A
Terms and Conditions
https://www.eurobank.gr/-
/media/eurobank/omilos/enimerosi-
ependuton/enimerosi-metoxon-
eurobank/pistotikoi-titloi/programma-
euro-medium-term-note/enimerotiko-
deltio12-1-18.pdf