Embed Size (px)
Citation preview
CONSOLIDATED INCOME STATEMENTfor the year ended 31st December
94
HK$ million Notes 2017 2016
Turnover 6 31,642 27,346
Sales and interest income from infrastructure investments 6 6,016 5,321Other income 7 792 580Operating costs 8 (4,083) (3,972)Finance costs 9 (648) (560)Exchange gain/(loss) 120 (698)Gain on disposal of investment in securities – 781Share of results of associates 3,693 2,861Share of results of joint ventures 5,038 5,887
Profit before taxation 10 10,928 10,200Taxation 11(a) (72) 8
Profit for the year 12 10,856 10,208
Attributable to:Shareholders of the Company 10,256 9,636Owners of perpetual capital securities 626 584Non-controlling interests (26) (12)
10,856 10,208
Earnings per share 13 HK$4.07 HK$3.82
CK InfRAstRuCtuRe HoldIngs lImIted
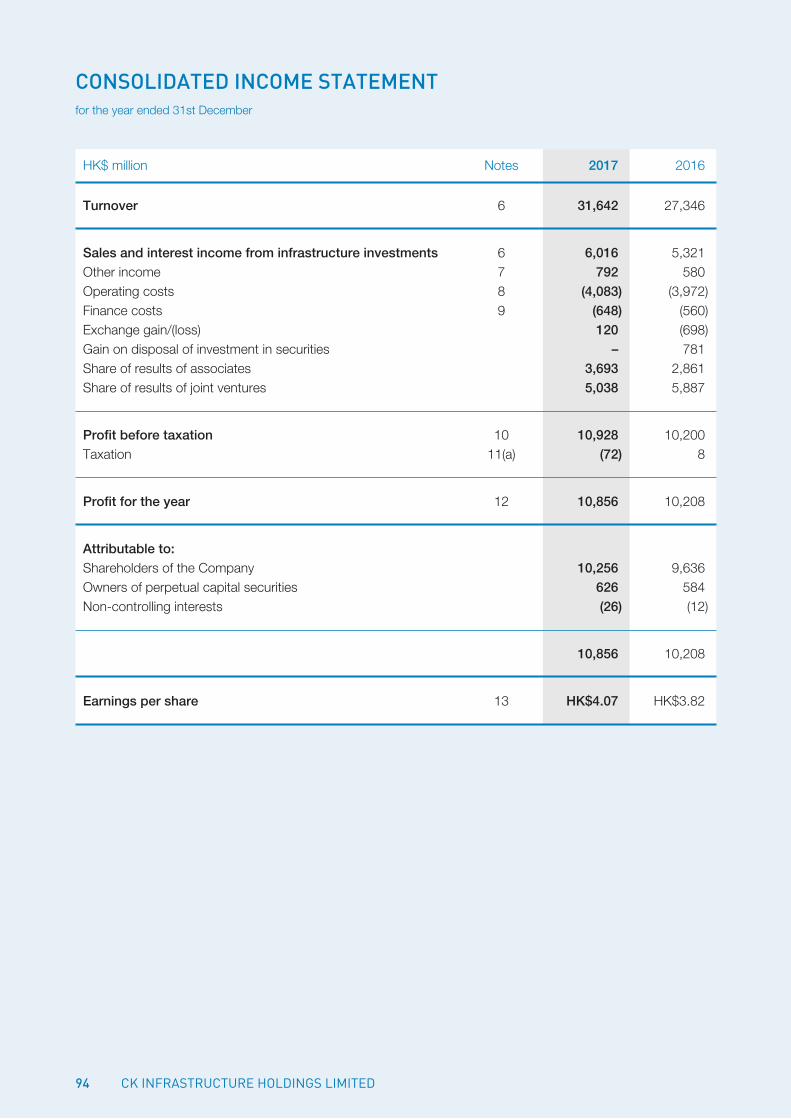
CONSOLIDATED STATEMENT OF COMPREHENSIVE INCOMEfor the year ended 31st December
95AnnuAl RepoRt 2017
HK$ million 2017 2016
Profit for the year 10,856 10,208
Other comprehensive income/(expense)
Items that may be reclassified subsequently to profit or loss:
Gain from fair value changes of available-for-sale financial assets – 219Gain/(Loss) from fair value changes of derivatives designated as effective cash flow hedges 19 (363)(Loss)/Gain from fair value changes of derivatives designated as effective net investment hedges (3,429) 4,277Exchange differences on translation of financial statements of foreign operations 4,703 (8,106)Share of other comprehensive income/(expense) of associates 402 (1,821)Share of other comprehensive income/(expense) of joint ventures 89 (1,283)Reserves released upon disposal of an associate 44 –Reserves released upon disposal of investment in securities – (790)Income tax relating to components of other comprehensive income 31 235
1,859 (7,632)
Items that will not be reclassified to profit or loss:
Actuarial gain/(loss) of defined benefit retirement plan 19 (2)Share of other comprehensive income/(expense) of associates 42 (545)Share of other comprehensive income/(expense) of joint ventures 630 (2,274)Income tax relating to components of other comprehensive income (119) 453
572 (2,368)
Other comprehensive income/(expense) for the year 2,431 (10,000)
Total comprehensive income for the year 13,287 208
Attributable to:Shareholders of the Company 12,681 (359)Owners of perpetual capital securities 626 584Non-controlling interests (20) (17)
13,287 208
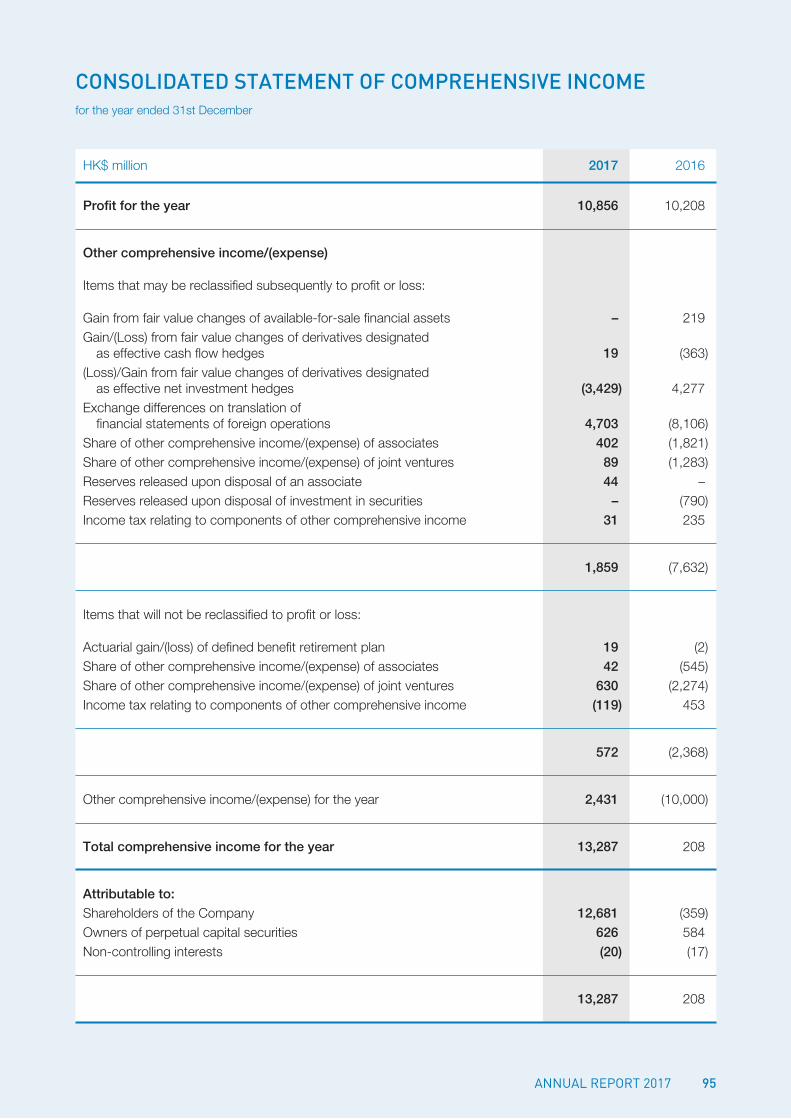
CONSOLIDATED STATEMENT OF FINANCIAL POSITIONas at 31st December
96
HK$ million Notes 2017 2016
Property, plant and equipment 15 2,462 2,404Investment properties 16 360 344Interests in associates 17 43,108 52,177Interests in joint ventures 18 98,462 53,973Investments in securities 19 702 648Derivative financial instruments 20 1,253 2,178Goodwill and intangible assets 21 2,569 2,554Deferred tax assets 27 7 29Other non-current assets 136 64
Total non-current assets 149,059 114,371
Inventories 22 170 139Derivative financial instruments 20 – 982Debtors and prepayments 23 804 628Bank balances and deposits 24 9,781 11,790
Total current assets 10,755 13,539
Bank and other loans 25 10,896 9,901Derivative financial instruments 20 417 3Creditors and accruals 26 4,242 3,837Taxation 114 96
Total current liabilities 15,669 13,837
Net current liabilities (4,914) (298)
Total assets less current liabilities 144,145 114,073
Bank and other loans 25 24,140 6,944Derivative financial instruments 20 1,287 422Deferred tax liabilities 27 468 481Other non-current liabilities 58 39
Total non-current liabilities 25,953 7,886
Net assets 118,192 106,187
Representing:Share capital 29 2,651 2,651Reserves 100,822 93,954
Equity attributable to shareholders of the Company 103,473 96,605Perpetual capital securities 30 14,701 9,544Non-controlling interests 18 38
Total equity 118,192 106,187
LI TZAR KUOI, VICTOR IP TAK CHUEN, EDMONDDirector Director
16th March, 2018
CK InfRAstRuCtuRe HoldIngs lImIted
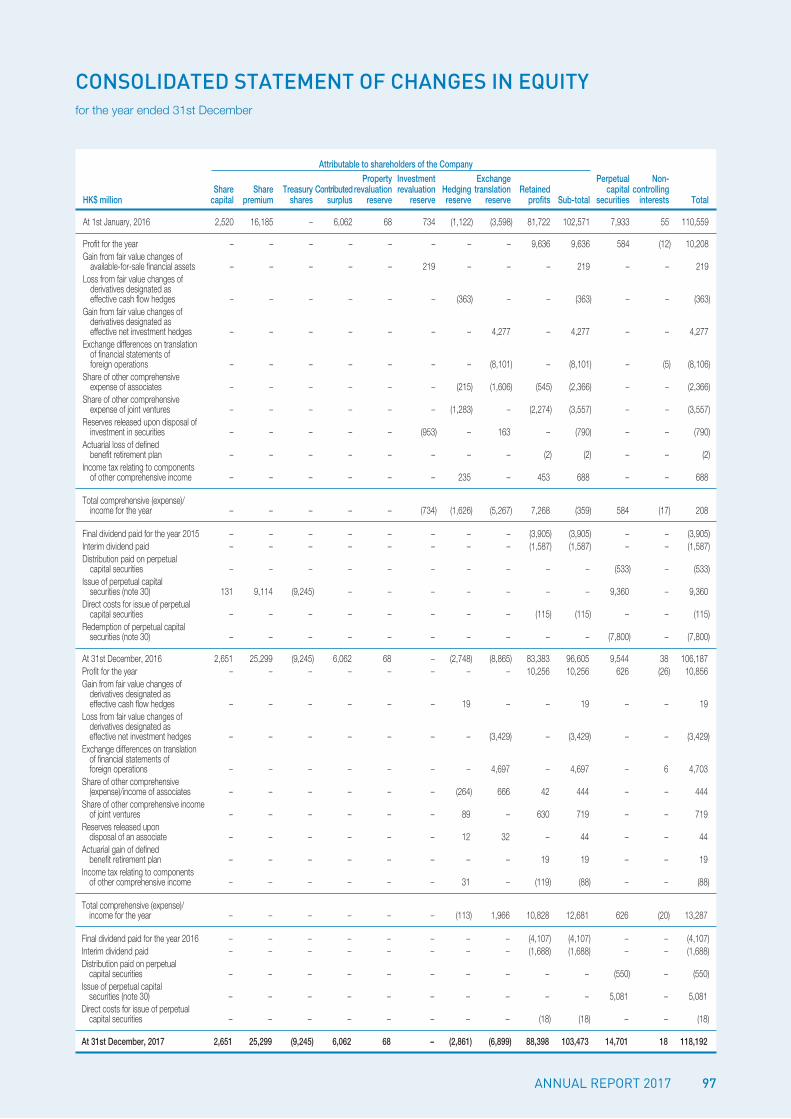
CONSOLIDATED STATEMENT OF CHANGES IN EQUITYfor the year ended 31st December
97AnnuAl RepoRt 2017
Attributable to shareholders of the Company Property Investment Exchange Perpetual Non- Share Share Treasury Contributed revaluation revaluation Hedging translation Retained capital controllingHK$ million capital premium shares surplus reserve reserve reserve reserve profits Sub-total securities interests Total
At 1st January, 2016 2,520 16,185 – 6,062 68 734 (1,122) (3,598) 81,722 102,571 7,933 55 110,559
Profit for the year – – – – – – – – 9,636 9,636 584 (12) 10,208Gain from fair value changes of available-for-sale financial assets – – – – – 219 – – – 219 – – 219Loss from fair value changes of derivatives designated as effective cash flow hedges – – – – – – (363) – – (363) – – (363)Gain from fair value changes of derivatives designated as effective net investment hedges – – – – – – – 4,277 – 4,277 – – 4,277Exchange differences on translation of financial statements of foreign operations – – – – – – – (8,101) – (8,101) – (5) (8,106)Share of other comprehensive expense of associates – – – – – – (215) (1,606) (545) (2,366) – – (2,366)Share of other comprehensive expense of joint ventures – – – – – – (1,283) – (2,274) (3,557) – – (3,557)Reserves released upon disposal of investment in securities – – – – – (953) – 163 – (790) – – (790)Actuarial loss of defined benefit retirement plan – – – – – – – – (2) (2) – – (2)Income tax relating to components of other comprehensive income – – – – – – 235 – 453 688 – – 688
Total comprehensive (expense)/ income for the year – – – – – (734) (1,626) (5,267) 7,268 (359) 584 (17) 208
Final dividend paid for the year 2015 – – – – – – – – (3,905) (3,905) – – (3,905)Interim dividend paid – – – – – – – – (1,587) (1,587) – – (1,587)Distribution paid on perpetual capital securities – – – – – – – – – – (533) – (533)Issue of perpetual capital securities (note 30) 131 9,114 (9,245) – – – – – – – 9,360 – 9,360Direct costs for issue of perpetual capital securities – – – – – – – – (115) (115) – – (115)Redemption of perpetual capital securities (note 30) – – – – – – – – – – (7,800) – (7,800)
At 31st December, 2016 2,651 25,299 (9,245) 6,062 68 – (2,748) (8,865) 83,383 96,605 9,544 38 106,187Profit for the year – – – – – – – – 10,256 10,256 626 (26) 10,856Gain from fair value changes of derivatives designated as effective cash flow hedges – – – – – – 19 – – 19 – – 19Loss from fair value changes of derivatives designated as effective net investment hedges – – – – – – – (3,429) – (3,429) – – (3,429)Exchange differences on translation of financial statements of foreign operations – – – – – – – 4,697 – 4,697 – 6 4,703Share of other comprehensive (expense)/income of associates – – – – – – (264) 666 42 444 – – 444Share of other comprehensive income of joint ventures – – – – – – 89 – 630 719 – – 719Reserves released upon disposal of an associate – – – – – – 12 32 – 44 – – 44Actuarial gain of defined benefit retirement plan – – – – – – – – 19 19 – – 19Income tax relating to components of other comprehensive income – – – – – – 31 – (119) (88) – – (88)
Total comprehensive (expense)/ income for the year – – – – – – (113) 1,966 10,828 12,681 626 (20) 13,287
Final dividend paid for the year 2016 – – – – – – – – (4,107) (4,107) – – (4,107)Interim dividend paid – – – – – – – – (1,688) (1,688) – – (1,688)Distribution paid on perpetual capital securities – – – – – – – – – – (550) – (550)Issue of perpetual capital securities (note 30) – – – – – – – – – – 5,081 – 5,081Direct costs for issue of perpetual capital securities – – – – – – – – (18) (18) – – (18)
At 31st December, 2017 2,651 25,299 (9,245) 6,062 68 – (2,861) (6,899) 88,398 103,473 14,701 18 118,192
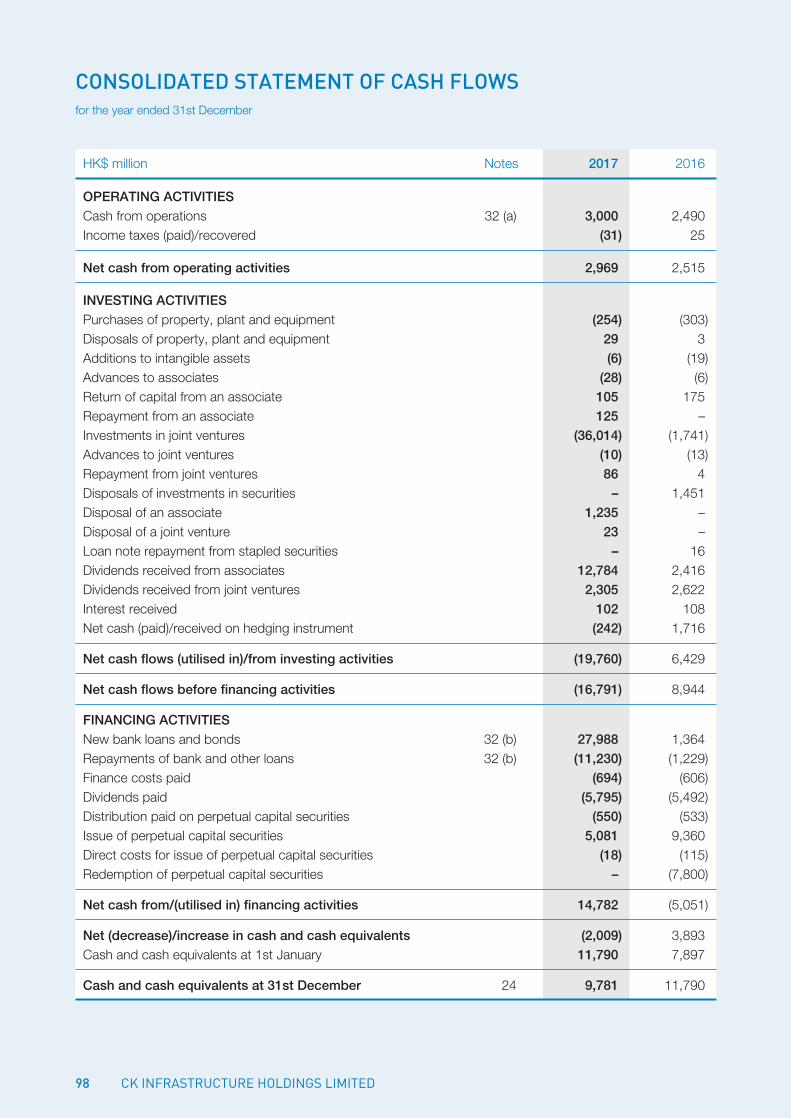
CONSOLIDATED STATEMENT OF CASH FLOWSfor the year ended 31st December
98
HK$ million Notes 2017 2016
OPERATING ACTIVITIESCash from operations 32 (a) 3,000 2,490Income taxes (paid)/recovered (31) 25
Net cash from operating activities 2,969 2,515
INVESTING ACTIVITIESPurchases of property, plant and equipment (254) (303)Disposals of property, plant and equipment 29 3Additions to intangible assets (6) (19)Advances to associates (28) (6)Return of capital from an associate 105 175Repayment from an associate 125 –Investments in joint ventures (36,014) (1,741)Advances to joint ventures (10) (13)Repayment from joint ventures 86 4Disposals of investments in securities – 1,451Disposal of an associate 1,235 –Disposal of a joint venture 23 –Loan note repayment from stapled securities – 16Dividends received from associates 12,784 2,416Dividends received from joint ventures 2,305 2,622Interest received 102 108Net cash (paid)/received on hedging instrument (242) 1,716
Net cash flows (utilised in)/from investing activities (19,760) 6,429
Net cash flows before financing activities (16,791) 8,944
FINANCING ACTIVITIESNew bank loans and bonds 32 (b) 27,988 1,364Repayments of bank and other loans 32 (b) (11,230) (1,229)Finance costs paid (694) (606)Dividends paid (5,795) (5,492)Distribution paid on perpetual capital securities (550) (533)Issue of perpetual capital securities 5,081 9,360Direct costs for issue of perpetual capital securities (18) (115)Redemption of perpetual capital securities – (7,800)
Net cash from/(utilised in) financing activities 14,782 (5,051)
Net (decrease)/increase in cash and cash equivalents (2,009) 3,893Cash and cash equivalents at 1st January 11,790 7,897
Cash and cash equivalents at 31st December 24 9,781 11,790
CK InfRAstRuCtuRe HoldIngs lImIted
NOTES TO THE CONSOLIDATED FINANCIAL STATEMENTS
99AnnuAl RepoRt 2017
1. General
The Company is a limited liability company incorporated in Bermuda and its shares are listed on The Stock Exchange of Hong Kong Limited (“Hong Kong Stock Exchange”). The addresses of its registered office and principal place of business are disclosed in the section headed “Corporate Information” of the Group’s Annual Report. The Company’s ultimate holding company is CK Hutchison Holdings Limited, a company incorporated in the Cayman Islands with limited liability, the shares of which are listed on Hong Kong Stock Exchange.
The consolidated financial statements are presented in Hong Kong dollars, which is the same as the functional currency of the Company.
The Group’s principal activities are the development, investment and operation of infrastructure businesses in Hong Kong, Mainland China, the United Kingdom, Continental Europe, Australia, New Zealand, Canada and the United States.
The Directors are of the opinion that, taking into account of the available banking facilities and internal financial resources of the Group, the Group has sufficient working capital for its present requirements within one year from the end of the reporting period. Hence, the consolidated financial statements have been prepared on a going concern basis.
2. chanGes in accountinG Policies
In the current year, the Group has adopted a number of revised Hong Kong Financial Reporting Standards (“HKFRSs”) issued by the Hong Kong Institute of Certified Public Accountants (“HKICPA”) that are effective to the Group for accounting periods beginning on or after 1st January, 2017. The adoption of those revised HKFRSs has no material impact on the Group’s results and financial position for the current or prior years and does not result in any significant change in accounting policies of the Group. Nevertheless, disclosure on reconciliation between the opening and closing balances for liabilities arising from financial activities is added in note 32(b) to the consolidated financial statements in compliance with Amendments to HKAS 7 “Statement of Cash Flows: Disclosure Initiative”.
The Group has not early adopted the following new and revised HKFRSs issued by HKICPA that have been issued but are not yet effective. The Group is continuing to assess the implication of the adoption of these standards. Except for the adoption of HKFRS 9 “Financial Instruments” and HKFRS 15 “Revenue from Contracts with Customers” as set out below and HKFRS 16 “Leases” of which the Directors are assessing the impact on the results and financial position of the Group, the Directors anticipate that the adoption of the other new and revised HKFRSs listed below will have no material impact on the results and financial position of the Group.
100
NOTES TO THE CONSOLIDATED FINANCIAL STATEMENTS
2. chanGes in accountinG Policies (cont’d)
HKFRS 2 (Amendments) Classification and Measurement of Share-based Payment TransactionsHKFRS 4 (Amendments) Applying HKFRS 9 “Financial Instruments” with HKFRS 4 “Insurance Contracts”HKFRS 9 Financial InstrumentsHKFRS 9 (Amendments) Prepayment Features with Negative CompensationHKFRS 10 and Sale or Contribution of Assets between an Investor HKAS 28 (Amendments) and its Associate or Joint VentureHKFRS 15 Revenue from Contracts with Customers and the Related AmendmentsHKFRS 16 LeasesHKFRS 17 Insurance ContractsHKAS 40 (Amendments) Transfers of Investment PropertyHKAS 28 (Amendments) As part of the Annual Improvements to HKFRSs 2014-2016 CycleHKAS 28 (Amendments) Long-term Interests in Associates and Joint VenturesHK (IFRIC)-Int 22 Foreign Currency Transactions and Advance ConsiderationHK (IFRIC)-Int 23 Uncertainty over Income Tax TreatmentsHKFRSs (Amendments) Annual Improvements to HKFRSs 2015-2017 Cycle
Based on preliminary assessment, the Group has the following updates:
HKFRS 9 “Financial Instruments”
HKFRS 9 “Financial Instruments” introduces a new classification and measurement approach for financial assets that reflects the business model in which assets are managed and their cash flow characteristics, and the new requirements on the accounting for financial liabilities that are designated at fair value through profit or loss. HKFRS 9 also replaces the “incurred loss” impairment model in HKAS 39 with a forward-looking “expected credit loss” model. HKFRS 9 is mandatory for annual periods beginning on or after 1st January, 2018.
Prior to 1st January, 2018, the Group’s investments in securities were classified as either available-for-sale financial assets or financial assets at fair value through profit or loss. From 1st January, 2018 onwards, the classification of available-for-sale financial assets would be eliminated and the existing equity and debt investments classified as available-for-sale financial assets would be classified as financial assets measured at fair value through profit or loss and amortised cost, respectively, according to the business model. All other financial assets will continue to be measured on the same basis as are currently measured under HKAS 39. The impact is not known or reasonably estimable.
HKFRS 9 also introduces new rules for hedge accounting. More hedge relationships might be eligible for hedge accounting under HKFRS 9 using a more principles-based approach. The Group selected to adopt hedge accounting under HKFRS 9 from 1st January, 2018 and the Group’s existing hedge relationships appear to qualify as continuing hedges upon the adoption of HKFRS 9. The Directors does not expect a significant impact on the accounting for its hedging relationships.
Expanded disclosure requirements and changes in presentation are also introduced. These are expected to change the nature and extent of the Group’s disclosures about its financial instruments.
CK InfRAstRuCtuRe HoldIngs lImIted
101AnnuAl RepoRt 2017
2. chanGes in accountinG Policies (cont’d)
HKFRS 15 “Revenue from Contracts with Customers”
HKFRS 15 “Revenue from Contracts with Customers” establishes a single comprehensive model in accounting for revenue arising from contracts with customers. It replaces existing revenue recognition guidance, including HKAS 18 “Revenue”, HKAS 11 “Construction Contracts” and the related Interpretations. HKFRS 15 is mandatory for annual periods beginning on or after 1st January, 2018.
HKFRS 15 requires the transaction price of a contract to be allocated to individual performance obligation (or distinct good or service). It expands disclosure requirements relating to revenue and introduces new standard on the presentation of contract assets and receivables in the statement of financial position.
The Directors do not anticipate that the application of HKFRS 15 will have a material impact on the timing and amounts of revenue recognition. However, the application of HKFRS 15 may result in more disclosures in the future.
3. PrinciPal accountinG Policies
The consolidated financial statements have been prepared in accordance with HKFRSs issued by the HKICPA. In addition, the consolidated financial statements include applicable disclosures required by the Rules Governing the Listing of Securities on Hong Kong Stock Exchange and by the Hong Kong Companies Ordinance.
The consolidated financial statements have been prepared on the historical cost basis except for certain properties and financial instruments, which are measured at fair values, as explained in the principal accounting policies set out below.
(a) Basis of Consolidation
The consolidated financial statements include the financial statements of the Company and its subsidiaries made up to the year together with the Group’s interests in associates and joint ventures on the basis set out in (e) below.
The results of subsidiaries, share of results of associates and joint ventures acquired or disposed of during the year are included in the consolidated income statement from the date the Group gains control/exercises significant influences/gains joint control until the date when the Group ceases to control/ceases to exercise significant influences/ceases to joint control, as appropriate.
(b) Goodwill
In relation to business combination that took place on or after 1st January, 2010, goodwill is measured as the excess of the sum of the consideration transferred, the amount of any non-controlling interests in the subsidiaries, and the fair value of the Group’s previously held equity interests in the subsidiaries (if any) over the net of the acquisition-date amounts of the identifiable assets acquired and the liabilities assumed.
Goodwill recognised prior to 1st January, 2010 was measured as the excess of costs of acquisition over the net fair value of the Group’s share of the identifiable assets, liabilities and contingent liabilities of the subsidiaries, associates and joint ventures acquired.
102
NOTES TO THE CONSOLIDATED FINANCIAL STATEMENTS
3. PrinciPal accountinG Policies (cont’d)
(b) Goodwill (Cont’d)
Goodwill is recognised as an asset less any identified impairment loss. Goodwill recognised in reserves prior to 1st January, 2001 continues to be held in the reserves and are transferred to retained profits when the business to which the goodwill relates is disposed of or becomes impaired.
For the purpose of impairment testing, goodwill is allocated to each of the Group’s cash-generating units that is expected to benefit from the synergies of the business acquisition. Cash-generating units to which goodwill has been allocated are tested for impairment annually, or more frequently when there is an indication that the unit may be impaired. If the recoverable amount of the cash-generating unit is less than the carrying amount of the unit, the impairment loss is allocated first to reduce the carrying amount of any goodwill allocated to the unit and then to the other assets of the unit pro-rata on the basis of the carrying amount of each asset in the unit. An impairment loss recognised for goodwill is not reversed in subsequent periods.
On disposal of a subsidiary, associate, joint venture or relevant cash-generating unit, the attributable amount of goodwill is included in the determination of the gain or loss on disposal.
(c) Intangible Assets
Intangible assets acquired in a business combination and recognised separately from goodwill are initially recognised at their fair value at the acquisition date. Subsequent to initial recognition, intangible assets acquired in a business combination are carried at cost less accumulated amortisation and accumulated impairment losses, on the same basis that are acquired separately.
Amortisation of intangible assets is provided over their estimated useful lives using the straight-line method, at the following rates per annum:
Brand name and trademarks Indefinite useful lives
Customer contracts Over the contract lives
Resource consents (excluding landfills) 4% or over the contract lives
Computer software 33% or over the license period
Others Over the contract lives
The estimated useful life and amortisation method are reviewed at the end of each reporting period, with the effect of any changes in estimate being accounted for on a prospective basis. Intangible assets with indefinite useful lives that are acquired through business combination are carried at cost less accumulated impairment losses.
The useful life of the resource consents for the landfills is dependent on the total capacity of the landfills, the level of tonnage of waste, the compacting rate and other variable. As such the landfills useful life is reassessed annually and the amortisation rate of the landfills resource consents is adjusted accordingly.
CK InfRAstRuCtuRe HoldIngs lImIted
103AnnuAl RepoRt 2017
3. PrinciPal accountinG Policies (cont’d)
(c) Intangible Assets (Cont’d)
The carrying amount of intangible assets with indefinite useful life is tested for impairment annually. The carrying amount of intangible assets with finite useful life is reviewed for indications of impairment at the end of each reporting period. An impairment loss is recognised in profit or loss if the carrying amount of an asset, or the cash-generating unit to which it belongs, exceeds its recoverable amount. An impairment loss is reversed if there has been a favourable change in the estimates used to determine the recoverable amount.
An intangible asset is derecognised on disposal, or when no future economic benefits are expected. Gains and losses arising from derecognition of an intangible asset, measured as the difference between the net disposal proceeds and the carrying amount of the asset, are recognised in profit or loss when the asset is derecognised.
(d) Subsidiaries
A subsidiary is an entity that is controlled by the Company. The Company controls an entity when it has power over the investees; it is exposed, or has rights, to variable returns from its involvement with the entity; and has the ability to affect those returns through its power over the entity.
The acquisition of a subsidiary is accounted for using the acquisition method. The cost of the acquisition is measured at the aggregate of the fair values, at the date of exchange, of assets given, liabilities incurred or assumed, and equity instruments issued by the Group in exchange for control of the acquiree. After 1st January, 2010, acquisition-related costs are generally recognised in profit or loss as incurred.
Prior to 1st January, 2010, any costs directly attributable to business combination were included as part of the cost of the acquisition.
The acquiree’s identifiable assets, liabilities and contingent liabilities, where appropriate, are recognised at their fair values at the acquisition date.
(e) Associates and Joint Ventures
An associate is a company, other than a subsidiary or joint venture, in which the Group has a long-term equity interest and over which the Group is in a position to exercise significant influence over its management, including participation in the financial and operating policy decisions.
A joint venture is a contractual arrangement whereby the venturers agree to share control of the arrangement which exists only when the decisions about the relevant activities require unanimous consent of the parties sharing control, and have rights to the net assets of the arrangement.
The results and assets and liabilities of associates/joint ventures are incorporated in the Group’s consolidated financial statements using the equity method of accounting. Under the equity method, investments in associates/joint ventures are carried in the consolidated statement of financial position at cost and adjusted thereafter to recognise the Group’s share of profit or loss and other comprehensive income of the associate or joint venture. Changes in net assets of the associate/joint venture other than profit or loss and other comprehensive income are not accounted for unless such changes resulted in changes in ownership interest held by the Group.
104
NOTES TO THE CONSOLIDATED FINANCIAL STATEMENTS
3. PrinciPal accountinG Policies (cont’d)
(e) Associates and Joint Ventures (Cont’d)
Losses of an associate/joint venture in excess of the Group’s interest in that associate/joint venture (which includes any long-term interests that, in substance, form part of the Group’s net investment in the associate/joint venture) are not recognised.
(f) Property, Plant and Equipment
Property, plant and equipment, other than freehold land, are stated at cost less accumulated depreciation and any impairment losses. The cost of an asset comprises its purchase price and any directly attributable costs of bringing the asset to its working condition and location for its intended use.
Freehold land is not depreciated. Depreciation of property, plant and equipment is provided to write off their depreciable amounts over their estimated useful lives using the straight-line method, at the following rates per annum:
Leasehold land over the unexpired lease term
Buildings 2% to 3% or over the unexpired lease terms of the land, whichever is the higher
Mains, pipes, other plant and machinery 3% to 26% or over the expected useful lives
Furniture, fixtures and others 3% to 33% or over the expected useful lives
When an asset is disposed of or retired, any gain or loss, representing the difference between the carrying value and the sales proceeds, if any, is included in the consolidated income statement.
(g) Investment Properties
Investment properties, which are properties held to earn rentals and/or for capital appreciation, are stated at its fair value at the end of the reporting period. Gains or losses arising from changes in the fair values of investment properties are recognised in the consolidated income statement for the period in which they arise.
(h) Inventories
Inventories are stated at the lower of cost, computed on a weighted-average or a first-in first-out basis as appropriate, and net realisable value. Cost includes cost of purchase and where applicable, cost of conversion and other costs that have been incurred in bringing the inventories to their present location and condition. Net realisable value is determined on the basis of anticipated sales proceeds less estimated costs to completion and selling expenses.
CK InfRAstRuCtuRe HoldIngs lImIted
105AnnuAl RepoRt 2017
3. PrinciPal accountinG Policies (cont’d)
(i) Financial Instruments
Investments in securities
The Group’s investments in securities are classified as either available-for-sale financial assets, which are measured at fair value or at cost less accumulated impairment losses when the fair value cannot be measured reliably, or financial assets at fair value through profit or loss which are measured at fair value.
The Group designates the securities intended to be held for long term strategic purposes as available-for-sale financial assets. Gains and losses arising from changes in fair values of these assets are dealt with as movements in investment revaluation reserve, until the assets are disposed of or are determined to be impaired, at which time the cumulative gains or losses previously recognised in the reserve is included in the consolidated income statement for the period. When a significant or prolonged decline in the fair value of an available-for-sale financial asset has been identified, the cumulative loss that had been recognised directly in equity shall be removed from equity and recognised in the consolidated income statement even though the financial asset has not been disposed of. Impairment losses recognised in the consolidated income statement for equity classified as available-for-sale financial assets are not subsequently reversed in the consolidated income statement.
Securities which are managed and their performances are evaluated based on a fair value basis are designated as financial assets at fair value through profit or loss. The management considers that such designation is appropriate given that the basis of internal risk assessments and performance evaluations on these assets is different from other investments and assets of the Group. Gains and losses arising from changes in fair values of these assets are dealt with in the consolidated income statement. The relevant dividend or interest accrued on the financial assets are also recognised in the consolidated income statement.
Derivative financial instruments and hedge accounting
Derivative financial instruments are initially measured at fair values on the dates at which the contracts are entered into, and are remeasured to their fair values at subsequent reporting dates.
Changes in the fair values of derivative financial instruments that are designated as effective in hedging future cash flows are recognised directly in hedging reserve. Amounts deferred in the equity are recycled in profit or loss in the periods when the hedged item is recognised in profit or loss. Any ineffective portion is recognised immediately in the consolidated income statement.
Changes in fair values of derivative financial instruments that are designated and qualify as net investment hedges are recognised directly in exchange translation reserve. Any ineffective portion is recognised immediately in the consolidated income statement.
Changes in the fair values of derivative financial instruments that do not qualify for hedge accounting are recognised in the consolidated income statement.
Hedge accounting is discontinued when the hedging instrument expires or is sold, terminated, or exercised, or the hedge no longer qualifies for hedge accounting. Any cumulative gain or loss deferred in equity at that time remains in equity and is recognised when the hedged risk associated with the hedged item is ultimately recognised in profit or loss. The cumulative gain or loss that was deferred in equity is recognised immediately in profit or loss when a forecast transaction is no longer expected to occur in relation to hedging of a forecast transaction.
106
NOTES TO THE CONSOLIDATED FINANCIAL STATEMENTS
3. PrinciPal accountinG Policies (cont’d)
(i) Financial Instruments (Cont’d)
Debtors
Debtors are classified as loans and receivables in accordance with HKAS 39, and are initially measured at fair value and subsequently measured at amortised cost using the effective interest method. Appropriate allowances for estimated irrecoverable amounts are recognised in the consolidated income statement when there is objective evidence that the assets are impaired.
Cash and cash equivalents
Cash and cash equivalents are classified as loans and receivables in accordance with HKAS 39, and comprise cash on hand and demand deposits, and other short-term highly liquid investments that are readily convertible to a known amount of cash and are subject to an insignificant risk of changes in value.
Bank and other loans
Interest-bearing bank and other loans are initially measured at fair values, and are subsequently measured at amortised cost, using the effective interest method.
Creditors
Creditors are initially measured at fair value and subsequently measured at amortised cost, using the effective interest method.
Equity instruments
Equity instruments issued by the Company are recorded at the proceeds received, net of direct issue costs.
Perpetual capital securities issued by the Group are classified as equity instruments and are initially recorded at the proceeds received.
Financial guarantee contracts
A financial guarantee contract is a contract that requires the issuer to make specified payments to reimburse the holder for a loss it incurs because a specified debtor fails to make payment when due in accordance with the original or modified terms of a debt instrument. A financial guarantee contract issued by the Group, which is not designated as a fair value through profit or loss, is recognised initially at its fair value less transaction costs directly attributable to the issue of the financial guarantee contract.
Fair value
Fair value of financial assets and financial liabilities with standard terms and conditions and traded on active liquid markets are determined with reference to quoted market prices. Fair value of derivative financial instruments and certain available-for-sale financial assets not traded on active liquid markets are determined with reference to fair value estimated by independent professionals or the present value of the estimated future cash flows discounted at the effective interest rate.
CK InfRAstRuCtuRe HoldIngs lImIted
107AnnuAl RepoRt 2017
3. PrinciPal accountinG Policies (cont’d)
(j) Revenue Recognition
Sales of goods
Revenue from sales of goods is recognised at the time when the goods are delivered or title to the goods passes to the customers. Revenue is measured at the fair value of the consideration received or receivable and is arrived at after deduction of any sales returns and discounts and taxes.
Sales of services
Sales of services including waste collection, commercial refuse and recycling services together with refuse transfer station operations and landfill operations are recognised in the accounting period in which the services are rendered, by reference to completion of the specific transaction assessed on the basis of the actual service provided as a proportion of the total services to be provided.
Interest income
Interest income from a financial asset excluding financial assets at fair value through profit or loss is accrued on a time basis, by reference to the principal outstanding and at the effective interest rate applicable, which is the rate that exactly discounts estimated future cash receipts through the expected life of the financial asset to that asset’s net carrying amount.
Income from investments in securities
Interest income from investments in securities are recognised when the Group’s right to receive payment is established.
(k) Foreign Currencies
The individual financial statements of each group entity is prepared and presented in the currency of the primary economic environment in which the entity operates (“functional currency”). For the purpose of the consolidated financial statements, the result and financial position of each entity are presented in Hong Kong dollars, which is the functional currency of the Company and the presentation currency for the consolidated financial statements.
In preparing the financial statements of the individual entities, transactions in currencies other than the entity’s functional currency (“foreign currencies”) are recorded at the rates of exchange prevailing on the dates of the transactions. At the end of the reporting period, monetary items denominated in foreign currencies are retranslated at the rates prevailing at that date. Non-monetary items carried at fair value that are denominated in foreign currencies are retranslated at the rates prevailing on the date when the fair value was measured. Non-monetary items that are measured in terms of historical cost in a foreign currency are not retranslated.
108
NOTES TO THE CONSOLIDATED FINANCIAL STATEMENTS
3. PrinciPal accountinG Policies (cont’d)
(k) Foreign Currencies (Cont’d)
Exchange differences arising on the settlement of monetary items, and on the retranslation of monetary items, are included in the consolidated income statement for the year, except for exchange differences arising on a monetary item that forms part of the Group’s net investment in a foreign operation, in which case, such exchange differences are recognised directly in equity. Exchange differences arising on the retranslation of non-monetary items carried at fair values are included in the consolidated income statement for the year except for differences arising on the retranslation of non-monetary items in respect of which gains and losses are recognised directly in equity. For such non-monetary items, any exchange component of that gain or loss is also recognised directly in other comprehensive income and accumulated in equity.
For the purpose of presenting consolidated financial statements, the assets and liabilities of the Group’s foreign operations are translated into Hong Kong dollars using exchange rates prevailing at the end of the reporting period. Income and expense items are translated at the average exchange rates for the year, unless exchange rates fluctuated significantly during that year, in which case the exchange rates at the dates of the transactions are used. Exchange differences arising, if any, are classified as equity and included in the Group’s exchange translation reserve. Such translation differences are recognised in the consolidated income statement in the year in which the foreign operation is disposed of.
Goodwill and fair value adjustments arising on the acquisition of a foreign operation are treated as assets and liabilities of the foreign operation and translated at the rate of exchange prevailing at the end of the reporting period. Exchange differences arising are recognised in the exchange translation reserve.
(l) Taxation
Hong Kong profits tax is provided for at the prevailing tax rate on the estimated assessable profits less available tax relief for losses brought forward of each individual company comprising the Group. Overseas tax is provided for at the applicable local tax rates on the estimated assessable profits less available tax losses of the individual company concerned.
Deferred tax is provided for all temporary differences arising between the carrying amounts of assets and liabilities in the financial statements and the corresponding tax bases used in the computation of taxable profit of the corresponding year. Deferred tax liabilities are generally recognised for all taxable temporary differences, and deferred tax assets are recognised for all deductible temporary differences to the extent that it is probable that taxable profits will be available against which deductible temporary differences can be utilised. Such assets and liabilities are not recognised if the temporary difference arises from initial recognition of goodwill or from the initial recognition (other than in a business combination) of other assets and liabilities in a transaction that affects neither the taxable profit nor the accounting profit.
Deferred tax liabilities are recognised for taxable temporary differences arising on investments in subsidiaries, associates and joint ventures, except where the Group is able to control the reversal of the temporary difference and it is probable that the temporary difference will not reverse in the foreseeable future.
CK InfRAstRuCtuRe HoldIngs lImIted
109AnnuAl RepoRt 2017
3. PrinciPal accountinG Policies (cont’d)
(l) Taxation (Cont’d)
The carrying amount of deferred tax assets is reviewed at the end of the reporting period and reduced to the extent that it is no longer probable that sufficient taxable profits will be available to allow all or part of the assets to be recovered.
Deferred tax is calculated at the tax rates that are expected to apply in the year when the liability is settled or the asset is realised. Deferred tax is charged or credited in the income statement, except when it relates to items charged or credited directly to equity, in which case the deferred tax is also dealt with in equity.
(m) Operating Leases
Leases where substantially all the risks and rewards of ownership of assets remain with the lessors are accounted for as operating leases. Rentals payable under operating leases are recorded in the consolidated income statement on a straight-line basis over the respective lease terms.
(n) Finance Leases
Leases that transfer substantially all the risks and rewards of ownership of the leased assets to the lessees are accounted for as finance leases.
Assets held under finance leases are recognised as assets at their fair values or, if lower, at the present value of the minimum lease payment at the dates of inception. The corresponding liabilities to the lessor are shown within bank and other loans in the consolidated statement of financial position as obligations under finance leases. Finance costs are charged to the consolidated income statement over the terms of the relevant leases so as to produce a constant periodic rate of charge on the remaining balance of the obligations for each accounting period.
(o) Employee Retirement Benefits
The Group operates defined contribution and defined benefit retirement plans for its employees.
The costs of defined contribution plans are charged to the consolidated income statement as an expense when employees have rendered service entitling them to the contributions.
The cost of providing retirement benefits under the Group’s defined benefit retirement plans is determined using the projected unit credit method, with actuarial valuations being carried out annually. Remeasurement, comprising actuarial gains and losses, the effect of the changes to the asset ceiling (if applicable) and the return on plan assets (excluding interest), is reflected immediately in the consolidated statement of financial position with a charge or credit recognised in other comprehensive income in the period in which they occur. Remeasurement recognised in other comprehensive income is reflected immediately in retained earnings and will not be reclassified to profit or loss. Past service cost is recognised in profit or loss in the period of a planned amendment. Net interest is calculated by applying the discount rate at the beginning of the period to the net defined benefit liability or asset. The amount recognised in the consolidated statement of financial position represents the actual deficit or surplus in the Group’s defined benefit plans. Any surplus resulting from this calculation is limited to the present value of available refunds and reductions in future contributions to the plans.
110
NOTES TO THE CONSOLIDATED FINANCIAL STATEMENTS
4. Financial risk manaGement oBjectives and Policies
The Group’s major financial instruments include investments in securities, derivative financial instruments, bank balances and deposits, bank and other loans, and debtors and creditors. Details of these financial instruments are disclosed in the respective notes. The risks associated with these financial instruments and the policies on how to mitigate these risks are set out below. The management manages and monitors these exposures to ensure appropriate measures are implemented on a timely and effective manner.
(a) Currency Risk
The Group is exposed to currency risk primarily arising from foreign investments and borrowings denominated in currencies other than the functional currency of individual subsidiaries, which accounted for 22 per cent of the Group’s borrowings (2016: 26 per cent). The Group generally hedges those investments with the appropriate level of borrowings denominated in the local currencies of relevant countries. The Group also entered into currency swaps to hedge most foreign investments financed by internal resources. Given this, the management considers that the net exposure to currency risk is kept to an appropriate level. Details of the currency swaps entered into by the Group at the end of the reporting period are set out in note 20.
The Group is also exposed to currency risk arising from bank deposits denominated in foreign currencies, which accounted for 90 per cent of the Group’s bank balances and deposits at the end of the reporting period (2016: 76 per cent). Those bank balances and deposits are mainly denominated in United States dollars, Australian dollars, Pounds sterling, Canadian dollars, New Zealand dollars and Euros. The management maintains the portfolio of bank deposits denominated in different currencies and the exposure to currency risk is kept to an appropriate level.
CK InfRAstRuCtuRe HoldIngs lImIted
111AnnuAl RepoRt 2017
4. Financial risk manaGement oBjectives and Policies (cont’d)
(a) Currency Risk (Cont’d)
Sensitivity analysis
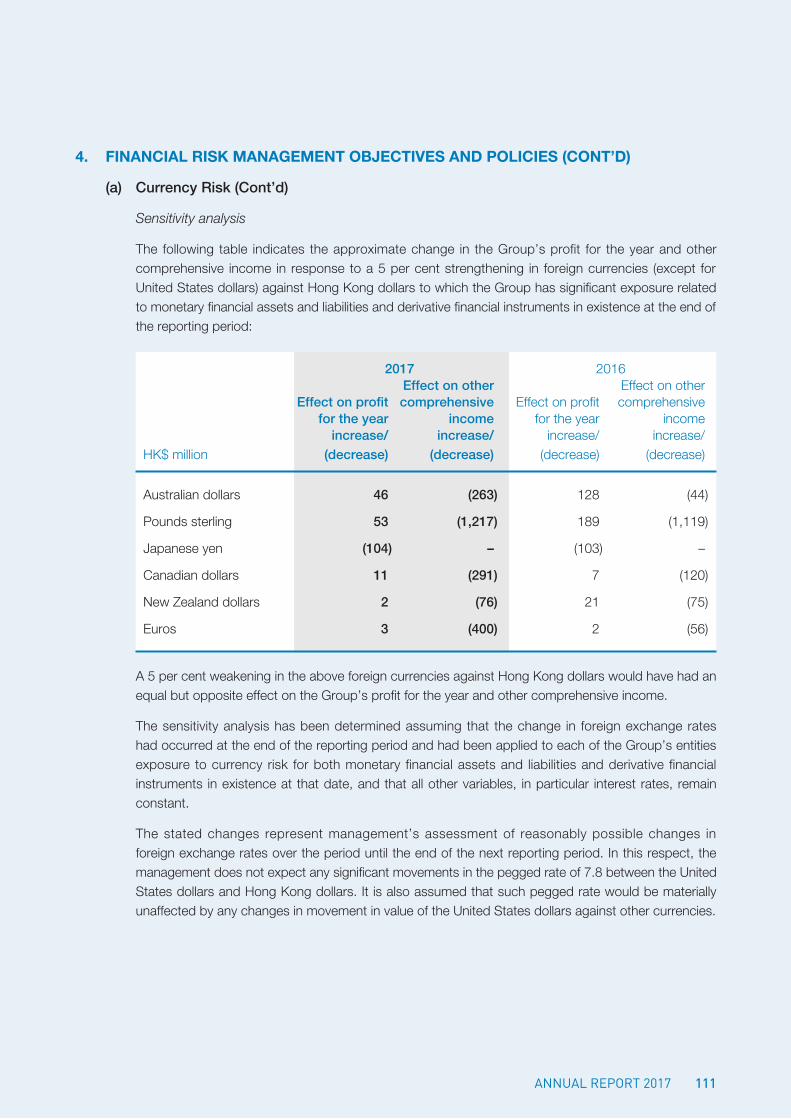
The following table indicates the approximate change in the Group’s profit for the year and other comprehensive income in response to a 5 per cent strengthening in foreign currencies (except for United States dollars) against Hong Kong dollars to which the Group has significant exposure related to monetary financial assets and liabilities and derivative financial instruments in existence at the end of the reporting period:
2017 2016 Effect on other Effect on other Effect on profit comprehensive Effect on profit comprehensive for the year income for the year income increase/ increase/ increase/ increase/HK$ million (decrease) (decrease) (decrease) (decrease)
Australian dollars 46 (263) 128 (44)
Pounds sterling 53 (1,217) 189 (1,119)
Japanese yen (104) – (103) –
Canadian dollars 11 (291) 7 (120)
New Zealand dollars 2 (76) 21 (75)
Euros 3 (400) 2 (56)
A 5 per cent weakening in the above foreign currencies against Hong Kong dollars would have had an equal but opposite effect on the Group’s profit for the year and other comprehensive income.
The sensitivity analysis has been determined assuming that the change in foreign exchange rates had occurred at the end of the reporting period and had been applied to each of the Group’s entities exposure to currency risk for both monetary financial assets and liabilities and derivative financial instruments in existence at that date, and that all other variables, in particular interest rates, remain constant.
The stated changes represent management’s assessment of reasonably possible changes in foreign exchange rates over the period until the end of the next reporting period. In this respect, the management does not expect any significant movements in the pegged rate of 7.8 between the United States dollars and Hong Kong dollars. It is also assumed that such pegged rate would be materially unaffected by any changes in movement in value of the United States dollars against other currencies.
112
NOTES TO THE CONSOLIDATED FINANCIAL STATEMENTS
4. Financial risk manaGement oBjectives and Policies (cont’d)
(b) Interest Rate Risk
The Group’s interest rate risk relates primarily to floating rate borrowings and deposits. In relation to these floating rate borrowings, the management aims at keeping borrowings at fixed rates at appropriate level by entering into interest rate swaps. In order to achieve this result, the Group entered into interest rate swaps to hedge against certain exposures to changes in interest rates of the borrowings. The management adopts a policy of ensuring that all the material borrowings of the Group are effectively on a fixed rate basis, either through the contractual terms of the loan facilities agreements or through the use of interest rate swaps.
Details of the Group’s interest rate swaps and borrowings entered into by the Group at the end of the reporting period are set out in notes 20 and 25, respectively.
Sensitivity analysis
At 31st December, 2017, it is estimated that a general increase of 100 basis points in interest rates, with all other variables held constant, would increase the Group’s profit for the year by HK$1 million (2016: HK$79 million). Other comprehensive income would increase by HK$14 million (2016: HK$20 million) in response to the general increase in interest rates. A decrease of 100 basis points in interest rate would have had an equal but opposite effect on the Group’s profit for the year and other comprehensive income.
The sensitivity analysis above has been determined assuming that the change in interest rates had occurred at the end of the reporting period and had been applied to the exposure to interest rate risk for both derivative and non-derivative financial instruments in existence at that date. The 100 basis point increase represents management’s assessment of a reasonably possible change in interest rates over the period until the end of the next reporting period. The analysis was performed on the same basis for 2016.
(c) Credit Risk
The Group’s credit risk is primarily attributable to debt securities investments, derivative financial instruments entered into for hedging purposes, bank balances and deposits, trade debtors and other receivables.
In respect of trade debtors and other receivables, local management teams of subsidiaries are responsible for monitoring the procedures to ensure that follow-up actions are taken to recover overdue debts of the subsidiaries. In addition, the teams review the recoverable amount of each individual debt at the end of the reporting period to ensure that adequate impairment losses are made for irrecoverable amounts. Normally, the Group does not obtain collateral covering the outstanding balances.
CK InfRAstRuCtuRe HoldIngs lImIted
113AnnuAl RepoRt 2017
4. Financial risk manaGement oBjectives and Policies (cont’d)
(c) Credit Risk (Cont’d)
Debt securities investments are normally liquid securities for long term strategic purposes. Transactions involving derivative financial instruments and liquid funds are also with banks or financial institutions of high credit standing.
The Group’s maximum exposure to credit risk in the event of the counterparties’ failure to perform their obligations at the end of the reporting period in relation to each class of recognised financial assets is the carrying amount of those assets as stated in the consolidated statement of financial position. Except for the guarantees given by the Group as set out in note 35, the Group does not provide any other guarantees which would expose the Group to credit risk. The maximum exposure to credit risk in respect of these guarantees at the end of the reporting period is disclosed in note 35.
Further quantitative disclosures in respect of the Group’s exposure to credit risk arising from trade debtors and other receivables are set out in note 23.
The Group has no significant concentration of credit risk, with exposure spread over a number of counterparties and customers.
(d) Liquidity Risk
The Group’s treasury activities are centralised to achieve better risk control and minimise the cost of funds. Cash is generally placed in short-term deposits mostly denominated in United States dollars, Hong Kong dollars, Australian dollars, Pounds sterling, Canadian dollars, New Zealand dollars and Euros. The management aims to maintain a balance between continuity of adequate funding and the flexibility through the use of bank and other borrowings. The Group’s liquidity and financing requirements are reviewed regularly to mitigate the effects of fluctuations in cash flows. The management will consider new financing while maintaining appropriate gearing for new investments and refinancing of existing debts.
114
NOTES TO THE CONSOLIDATED FINANCIAL STATEMENTS
4. Financial risk manaGement oBjectives and Policies (cont’d)
(d) Liquidity Risk (Cont’d)
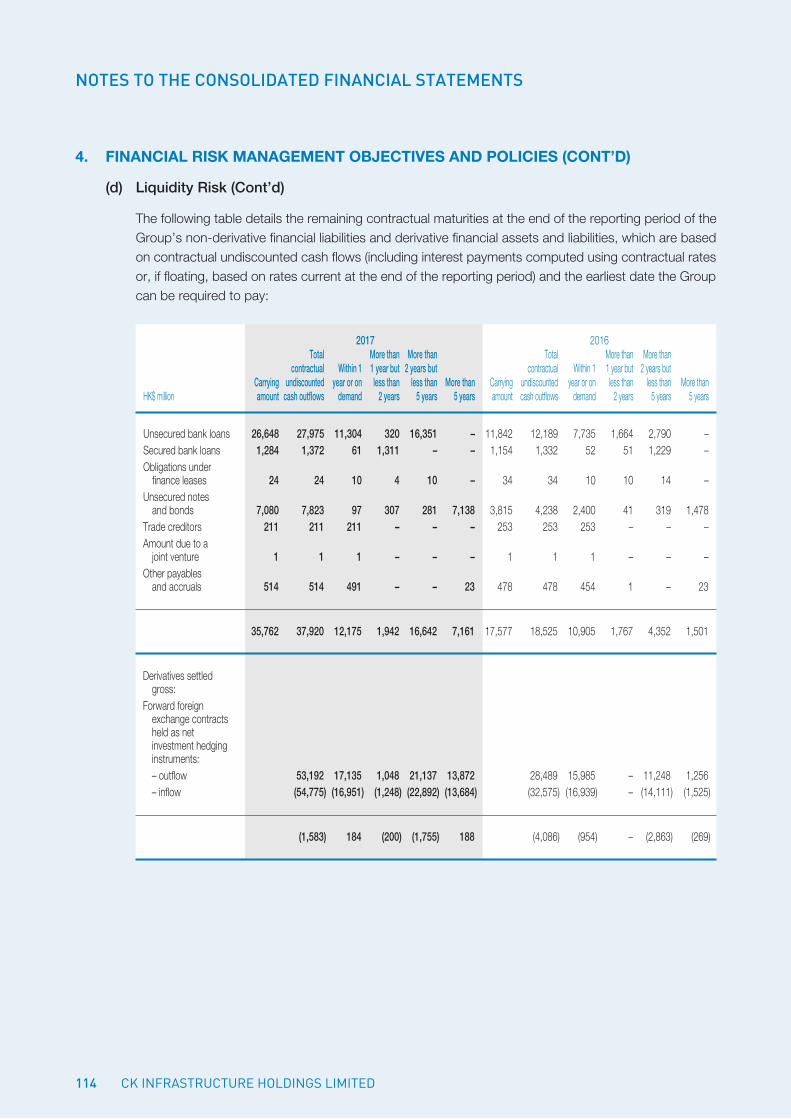
The following table details the remaining contractual maturities at the end of the reporting period of the Group’s non-derivative financial liabilities and derivative financial assets and liabilities, which are based on contractual undiscounted cash flows (including interest payments computed using contractual rates or, if floating, based on rates current at the end of the reporting period) and the earliest date the Group can be required to pay:
2017 2016 Total More than More than Total More than More than contractual Within 1 1 year but 2 years but contractual Within 1 1 year but 2 years but Carrying undiscounted year or on less than less than More than Carrying undiscounted year or on less than less than More thanHK$ million amount cash outflows demand 2 years 5 years 5 years amount cash outflows demand 2 years 5 years 5 years
Unsecured bank loans 26,648 27,975 11,304 320 16,351 – 11,842 12,189 7,735 1,664 2,790 –Secured bank loans 1,284 1,372 61 1,311 – – 1,154 1,332 52 51 1,229 –Obligations under finance leases 24 24 10 4 10 – 34 34 10 10 14 –Unsecured notes and bonds 7,080 7,823 97 307 281 7,138 3,815 4,238 2,400 41 319 1,478Trade creditors 211 211 211 – – – 253 253 253 – – –Amount due to a joint venture 1 1 1 – – – 1 1 1 – – –Other payables and accruals 514 514 491 – – 23 478 478 454 1 – 23
35,762 37,920 12,175 1,942 16,642 7,161 17,577 18,525 10,905 1,767 4,352 1,501
Derivatives settled gross:Forward foreign exchange contracts held as net investment hedging instruments: – outflow 53,192 17,135 1,048 21,137 13,872 28,489 15,985 – 11,248 1,256 – inflow (54,775) (16,951) (1,248) (22,892) (13,684) (32,575) (16,939) – (14,111) (1,525)
(1,583) 184 (200) (1,755) 188 (4,086) (954) – (2,863) (269)
CK InfRAstRuCtuRe HoldIngs lImIted
115AnnuAl RepoRt 2017
4. Financial risk manaGement oBjectives and Policies (cont’d)
(e) Other Price Risk
The Group is exposed to other price risk through its investments in securities as set out in note 19. The management manages this exposure by maintaining a portfolio of investments with different risks. For strategic purposes, the Group holds primarily equity or debt instruments operating in energy sector.
Sensitivity analysis
At 31st December, 2017, it is estimated that a 5 per cent decrease in the prices of the respective instruments, with all other variables held constant, would decrease the Group’s profit for the year by HK$2 million (2016: HK$2 million). Other comprehensive income would decrease by HK$9 million (2016: HK$8 million) in response to 5 per cent decrease in the prices. A 5 per cent increase in prices would have had an equal but opposite effect on the Group’s profit for the year and other comprehensive income.
The sensitivity analysis above has been determined assuming that the change in prices had occurred at the end of the reporting period and had been applied to the exposure to price risk for the Group’s investments in securities at fair value in existence at that date (as set out in note 19). The 5 per cent decrease in prices represents management’s assessment of a reasonably possible change in the prices of those instruments over the period until the end of the next reporting period. The analysis is performed on the same basis for 2016.
(f) Fair Value
Except for certain investments in securities which are stated at cost, the carrying values of all financial assets and financial liabilities approximate to their fair values.
The fair value of the Group’s financial instruments and non-financial instruments are grouped into Level 1 to 3 with reference to the observability and significance of the inputs used in the valuation technique as follows:
Level 1: Quoted prices (unadjusted) in active markets for identical assets or liabilities.
Level 2: Inputs other than quoted prices included within level 1 that are observable for asset or liability, either directly (i.e. as prices) or indirectly (i.e. derived from prices).
Level 3: Inputs for the asset or liability that are not based on observable market data (unobservable inputs).
116
NOTES TO THE CONSOLIDATED FINANCIAL STATEMENTS
4. Financial risk manaGement oBjectives and Policies (cont’d)
(f) Fair Value (Cont’d)
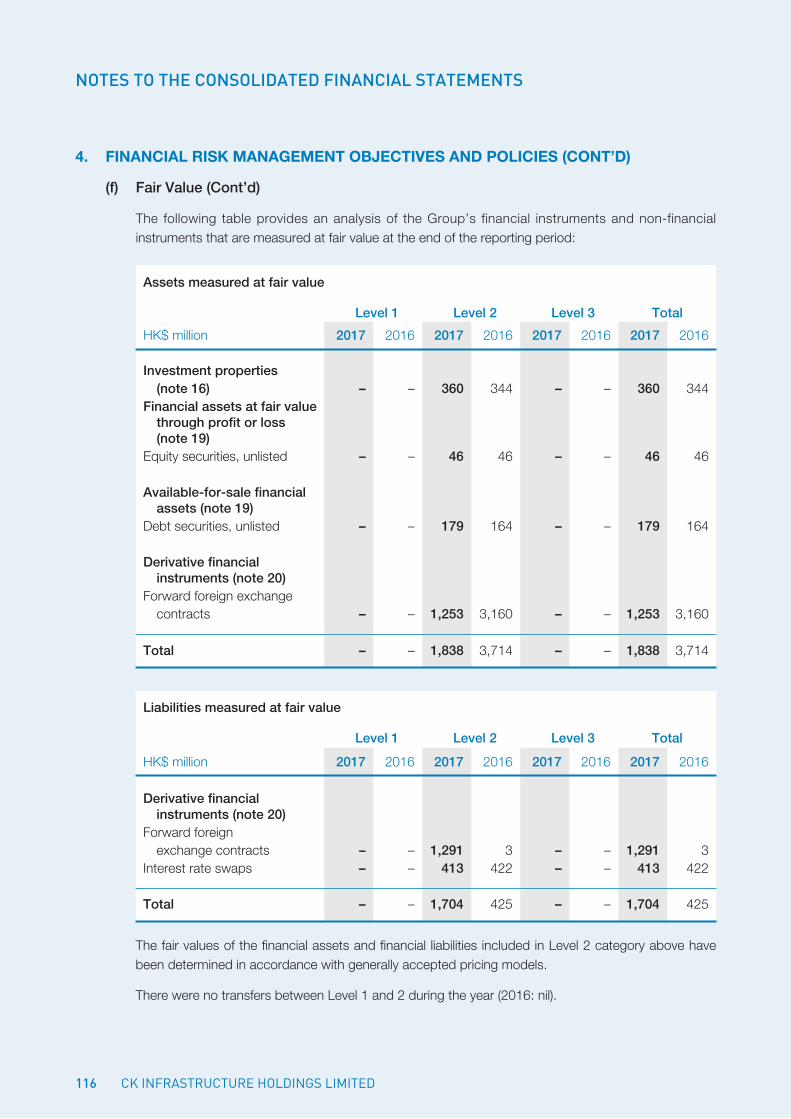
The following table provides an analysis of the Group’s financial instruments and non-financial instruments that are measured at fair value at the end of the reporting period:
Assets measured at fair value
Level 1 Level 2 Level 3 Total
HK$ million 2017 2016 2017 2016 2017 2016 2017 2016
Investment properties (note 16) – – 360 344 – – 360 344Financial assets at fair value through profit or loss (note 19)Equity securities, unlisted – – 46 46 – – 46 46
Available-for-sale financial assets (note 19)Debt securities, unlisted – – 179 164 – – 179 164
Derivative financial instruments (note 20)Forward foreign exchange contracts – – 1,253 3,160 – – 1,253 3,160
Total – – 1,838 3,714 – – 1,838 3,714
Liabilities measured at fair value
Level 1 Level 2 Level 3 Total
HK$ million 2017 2016 2017 2016 2017 2016 2017 2016
Derivative financial instruments (note 20)Forward foreign exchange contracts – – 1,291 3 – – 1,291 3Interest rate swaps – – 413 422 – – 413 422
Total – – 1,704 425 – – 1,704 425
The fair values of the financial assets and financial liabilities included in Level 2 category above have been determined in accordance with generally accepted pricing models.
There were no transfers between Level 1 and 2 during the year (2016: nil).
CK InfRAstRuCtuRe HoldIngs lImIted
117AnnuAl RepoRt 2017
4. Financial risk manaGement oBjectives and Policies (cont’d)
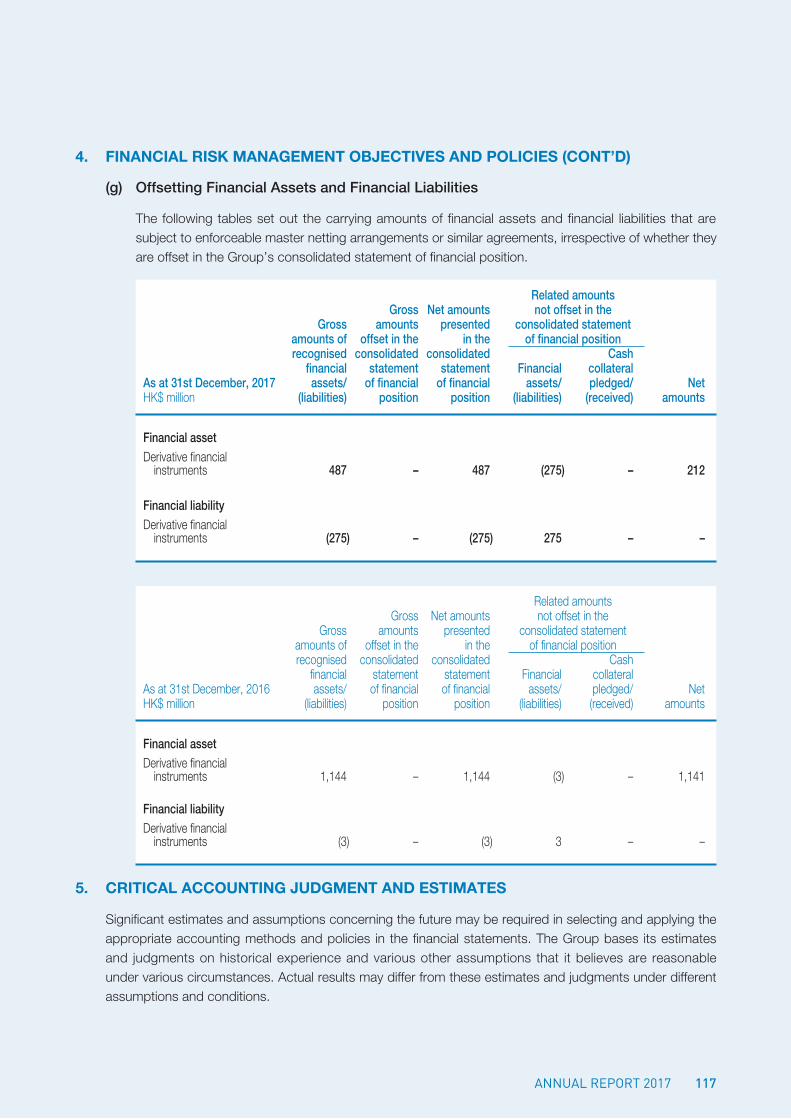
(g) Offsetting Financial Assets and Financial Liabilities
The following tables set out the carrying amounts of financial assets and financial liabilities that are subject to enforceable master netting arrangements or similar agreements, irrespective of whether they are offset in the Group’s consolidated statement of financial position.
Related amounts Gross Net amounts not offset in the Gross amounts presented consolidated statement amounts of offset in the in the of financial position recognised consolidated consolidated Cash financial statement statement Financial collateralAs at 31st December, 2017 assets/ of financial of financial assets/ pledged/ NetHK$ million (liabilities) position position (liabilities) (received) amounts
Financial assetDerivative financial instruments 487 – 487 (275) – 212
Financial liabilityDerivative financial instruments (275) – (275) 275 – –
Related amounts Gross Net amounts not offset in the Gross amounts presented consolidated statement amounts of offset in the in the of financial position recognised consolidated consolidated Cash financial statement statement Financial collateralAs at 31st December, 2016 assets/ of financial of financial assets/ pledged/ NetHK$ million (liabilities) position position (liabilities) (received) amounts
Financial assetDerivative financial instruments 1,144 – 1,144 (3) – 1,141
Financial liabilityDerivative financial instruments (3) – (3) 3 – –
5. critical accountinG judGment and estimates
Significant estimates and assumptions concerning the future may be required in selecting and applying the appropriate accounting methods and policies in the financial statements. The Group bases its estimates and judgments on historical experience and various other assumptions that it believes are reasonable under various circumstances. Actual results may differ from these estimates and judgments under different assumptions and conditions.
118
NOTES TO THE CONSOLIDATED FINANCIAL STATEMENTS
5. critical accountinG judGment and estimates (cont’d)
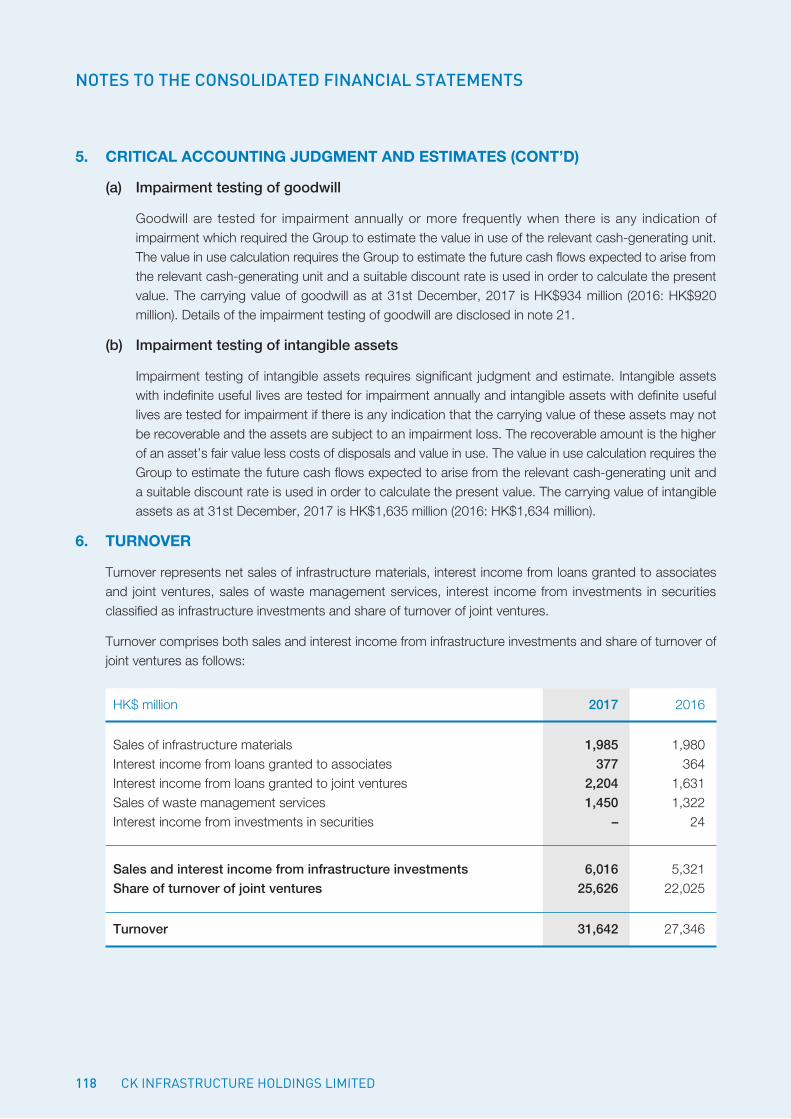
(a) Impairment testing of goodwill
Goodwill are tested for impairment annually or more frequently when there is any indication of impairment which required the Group to estimate the value in use of the relevant cash-generating unit. The value in use calculation requires the Group to estimate the future cash flows expected to arise from the relevant cash-generating unit and a suitable discount rate is used in order to calculate the present value. The carrying value of goodwill as at 31st December, 2017 is HK$934 million (2016: HK$920 million). Details of the impairment testing of goodwill are disclosed in note 21.
(b) Impairment testing of intangible assets
Impairment testing of intangible assets requires significant judgment and estimate. Intangible assets with indefinite useful lives are tested for impairment annually and intangible assets with definite useful lives are tested for impairment if there is any indication that the carrying value of these assets may not be recoverable and the assets are subject to an impairment loss. The recoverable amount is the higher of an asset’s fair value less costs of disposals and value in use. The value in use calculation requires the Group to estimate the future cash flows expected to arise from the relevant cash-generating unit and a suitable discount rate is used in order to calculate the present value. The carrying value of intangible assets as at 31st December, 2017 is HK$1,635 million (2016: HK$1,634 million).
6. turnover
Turnover represents net sales of infrastructure materials, interest income from loans granted to associates and joint ventures, sales of waste management services, interest income from investments in securities classified as infrastructure investments and share of turnover of joint ventures.
Turnover comprises both sales and interest income from infrastructure investments and share of turnover of joint ventures as follows:
HK$ million 2017 2016
Sales of infrastructure materials 1,985 1,980Interest income from loans granted to associates 377 364Interest income from loans granted to joint ventures 2,204 1,631Sales of waste management services 1,450 1,322Interest income from investments in securities – 24
Sales and interest income from infrastructure investments 6,016 5,321Share of turnover of joint ventures 25,626 22,025
Turnover 31,642 27,346
CK InfRAstRuCtuRe HoldIngs lImIted
119AnnuAl RepoRt 2017
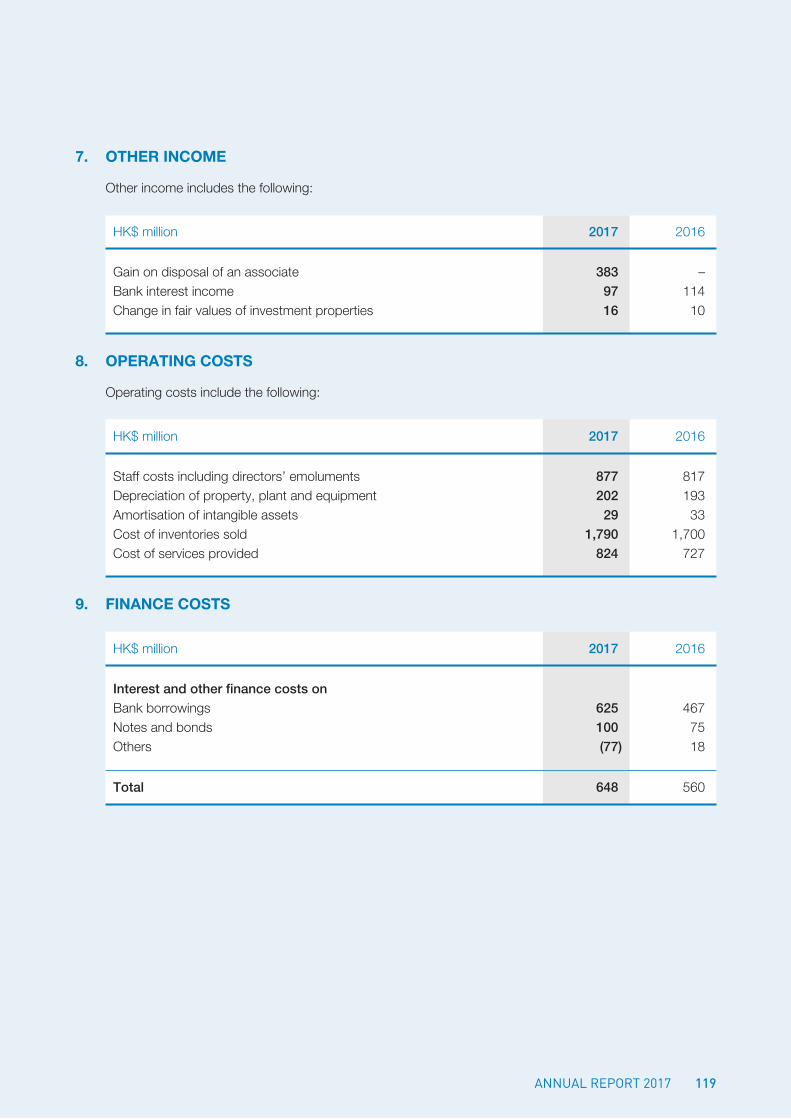
7. other income
Other income includes the following:
HK$ million 2017 2016
Gain on disposal of an associate 383 –Bank interest income 97 114Change in fair values of investment properties 16 10
8. oPeratinG costs
Operating costs include the following:
HK$ million 2017 2016
Staff costs including directors’ emoluments 877 817Depreciation of property, plant and equipment 202 193Amortisation of intangible assets 29 33Cost of inventories sold 1,790 1,700Cost of services provided 824 727
9. Finance costs
HK$ million 2017 2016
Interest and other finance costs onBank borrowings 625 467Notes and bonds 100 75Others (77) 18
Total 648 560
120
NOTES TO THE CONSOLIDATED FINANCIAL STATEMENTS
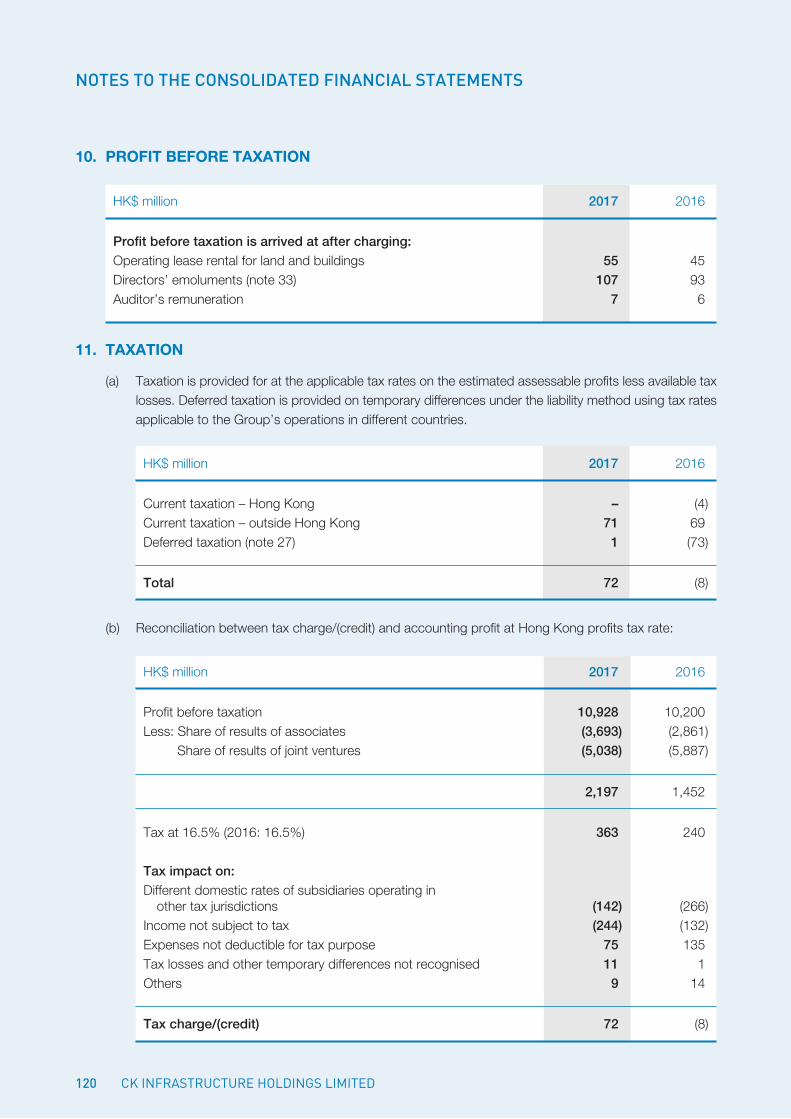
10. ProFit BeFore taxation
HK$ million 2017 2016
Profit before taxation is arrived at after charging:Operating lease rental for land and buildings 55 45Directors’ emoluments (note 33) 107 93Auditor’s remuneration 7 6
11. taxation
(a) Taxation is provided for at the applicable tax rates on the estimated assessable profits less available tax losses. Deferred taxation is provided on temporary differences under the liability method using tax rates applicable to the Group’s operations in different countries.
HK$ million 2017 2016
Current taxation – Hong Kong – (4)Current taxation – outside Hong Kong 71 69Deferred taxation (note 27) 1 (73)
Total 72 (8)
(b) Reconciliation between tax charge/(credit) and accounting profit at Hong Kong profits tax rate:
HK$ million 2017 2016
Profit before taxation 10,928 10,200Less: Share of results of associates (3,693) (2,861)
Share of results of joint ventures (5,038) (5,887)
2,197 1,452
Tax at 16.5% (2016: 16.5%) 363 240
Tax impact on:Different domestic rates of subsidiaries operating in other tax jurisdictions (142) (266)Income not subject to tax (244) (132)Expenses not deductible for tax purpose 75 135Tax losses and other temporary differences not recognised 11 1Others 9 14
Tax charge/(credit) 72 (8)
CK InfRAstRuCtuRe HoldIngs lImIted
121AnnuAl RepoRt 2017
12.
Pr
oFi
t F
or
th
e y
ea
r a
nd
se
Gm
en
t in
For
ma
tio
n
for
the
year
end
ed 3
1st D
ecem
ber
Inf
rastr
uctu
re In
vestm
ents
Inv
estm
ent in
Inf
rastr
uctu
re
Total
befo
re
Powe
r Ass
ets
Unite
d
Cont
inent
al Ma
inlan
d Ca
nada
and
New
relat
ed
unall
ocate
d Un
alloc
ated
Ho
lding
s Lim
ited
King
dom
Austr
alia
Euro
pe
China
Un
ited S
tates
Ze
aland
bu
sines
s ite
ms
items
Co
nsoli
dated
HK$ m
illion
2017
20
16
2017
20
16
2017
20
16
2017
20
16
2017
20
16
2017
20
16
2017
20
16
2017
20
16
2017
20
16
2017
20
16
2017
20
16
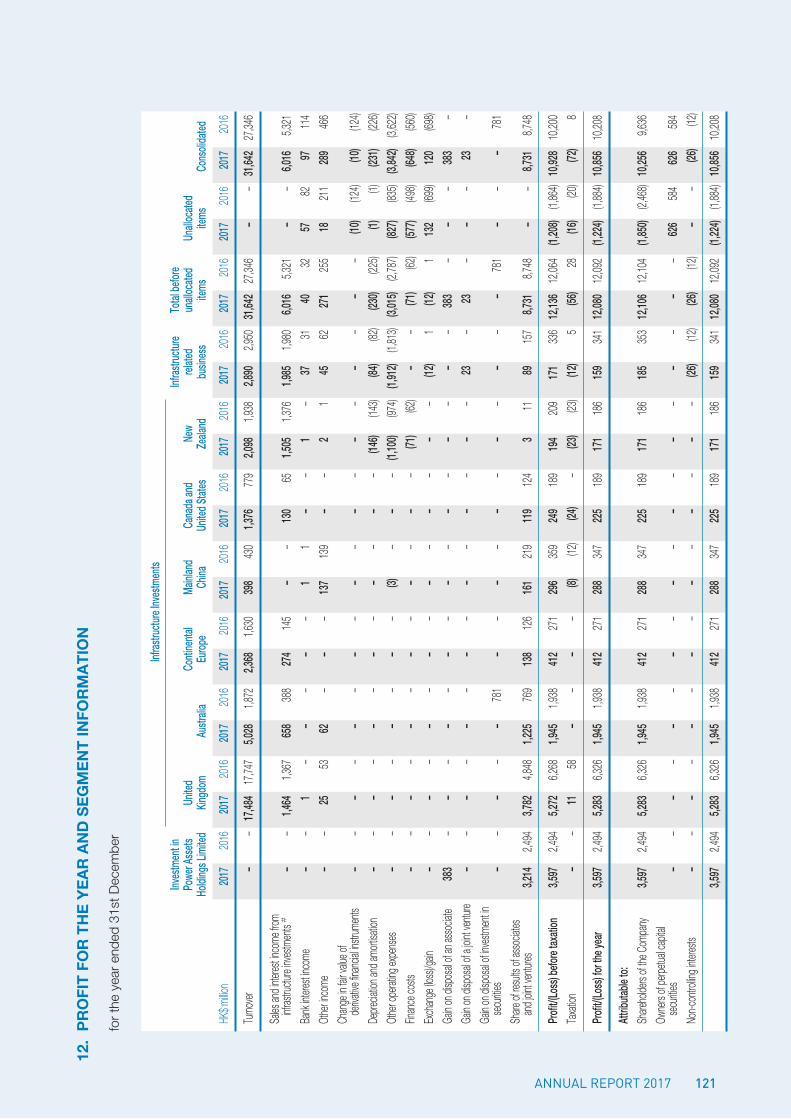
Turno
ver
– –
17,48
4 17
,747
5,028
1,8
72
2,368
1,6
30
398
430
1,376
77
9 2,0
98
1,938
2,8
90
2,950
31
,642
27,34
6 –
– 31
,642
27,34
6
Sales
and i
nteres
t inco
me fro
m
infras
tructu
re inv
estm
ents
#
– –
1,464
1,3
67
658
388
274
145
– –
130
65
1,505
1,3
76
1,985
1,9
80
6,016
5,3
21
– –
6,016
5,3
21
Bank
inter
est in
come
–
– 1
– –
– –
– 1
1 –
– 1
– 37
31
40
32
57
82
97
11
4Ot
her in
come
–
– 25
53
62
–
– –
137
139
– –
2 1
45
62
271
255
18
211
289
466
Chan
ge in
fair v
alue o
f
deriv
ative
finan
cial in
strum
ents
– –
– –
– –
– –
– –
– –
– –
– –
– –
(10)
(124)
(10)
(124)
Depre
ciatio
n and
amort
isatio
n –
– –
– –
– –
– –
– –
– (14
6) (14
3) (84
) (82
) (23
0) (22
5) (1)
(1)
(23
1) (22
6)Ot
her o
perat
ing ex
pens
es
– –
– –
– –
– –
(3)
– –
– (1,
100)
(974)
(1,91
2) (1,
813)
(3,01
5) (2,
787)
(827)
(835)
(3,84
2) (3,
622)
Finan
ce co
sts
– –
– –
– –
– –
– –
– –
(71)
(62)
– –
(71)
(62)
(577)
(498)
(648)
(560)
Exch
ange
(loss
)/gain
–
– –
– –
– –
– –
– –
– –
– (12
) 1
(12)
1 13
2 (69
9) 12
0 (69
8)Ga
in on
disp
osal
of an
asso
ciate
383
– –
– –
– –
– –
– –
– –
– –
– 38
3 –
– –
383
–Ga
in on
disp
osal
of a j
oint v
entur
e –
– –
– –
– –
– –
– –
– –
– 23
–
23
– –
– 23
–
Gain
on di
spos
al of
inves
tmen
t in
secu
rities
–
– –
– –
781
– –
– –
– –
– –
– –
– 78
1 –
– –
781
Share
of re
sults
of as
socia
tes
and j
oint v
entur
es
3,214
2,4
94
3,782
4,8
48
1,225
76
9 13
8 12
6 16
1 21
9 11
9 12
4 3
11
89
157
8,731
8,7
48
– –
8,731
8,7
48
Prof
it/(Lo
ss) b
efore
taxa
tion
3,597
2,4
94
5,272
6,2
68
1,945
1,9
38
412
271
296
359
249
189
194
209
171
336
12,13
6 12
,064
(1,20
8) (1,
864)
10,92
8 10
,200
Taxa
tion
– –
11
58
– –
– –
(8)
(12)
(24)
– (23
) (23
) (12
) 5
(56)
28
(16)
(20)
(72)
8
Prof
it/(Lo
ss) fo
r the
year
3,5
97
2,494
5,2
83
6,326
1,9
45
1,938
41
2 27
1 28
8 34
7 22
5 18
9 17
1 18
6 15
9 34
1 12
,080
12,09
2 (1,
224)
(1,88
4) 10
,856
10,20
8
Attri
butab
le to
:
Share
holde
rs of
the C
ompa
ny
3,597
2,4
94
5,283
6,3
26
1,945
1,9
38
412
271
288
347
225
189
171
186
185
353
12,10
6 12
,104
(1,85
0) (2,
468)
10,25
6 9,6
36Ow
ners
of pe
rpetua
l cap
ital
se
curiti
es
– –
– –
– –
– –
– –
– –
– –
– –
– –
626
584
626
584
Non-c
ontro
lling i
nteres
ts –
– –
– –
– –
– –
– –
– –
– (26
) (12
) (26
) (12
) –
– (26
) (12
)
3,5
97
2,494
5,2
83
6,326
1,9
45
1,938
41
2 27
1 28
8 34
7 22
5 18
9 17
1 18
6 15
9 34
1 12
,080
12,09
2 (1,
224)
(1,88
4) 10
,856
10,20
8
122
NOTES TO THE CONSOLIDATED FINANCIAL STATEMENTS
12.
Pr
oFi
t F
or
th
e y
ea
r a
nd
se
Gm
en
t in
For
ma
tio
n (c
on
t’d
)
for
the
year
end
ed 3
1st D
ecem
ber
Inf
rastr
uctu
re In
vestm
ents
Inv
estm
ent in
Inf
rastr
uctu
re
Total
befo
re
Powe
r Ass
ets
Unite
d
Cont
inent
al Ma
inlan
d Ca
nada
and
New
relat
ed
unall
ocate
d Un
alloc
ated
Ho
lding
s Lim
ited
King
dom
Austr
alia
Euro
pe
China
Un
ited S
tates
Ze
aland
bu
sines
s ite
ms
items
Co
nsoli
dated
HK$ m
illion
2017
20
16
2017
20
16
2017
20
16
2017
20
16
2017
20
16
2017
20
16
2017
20
16
2017
20
16
2017
20
16
2017
20
16
2017
20
16
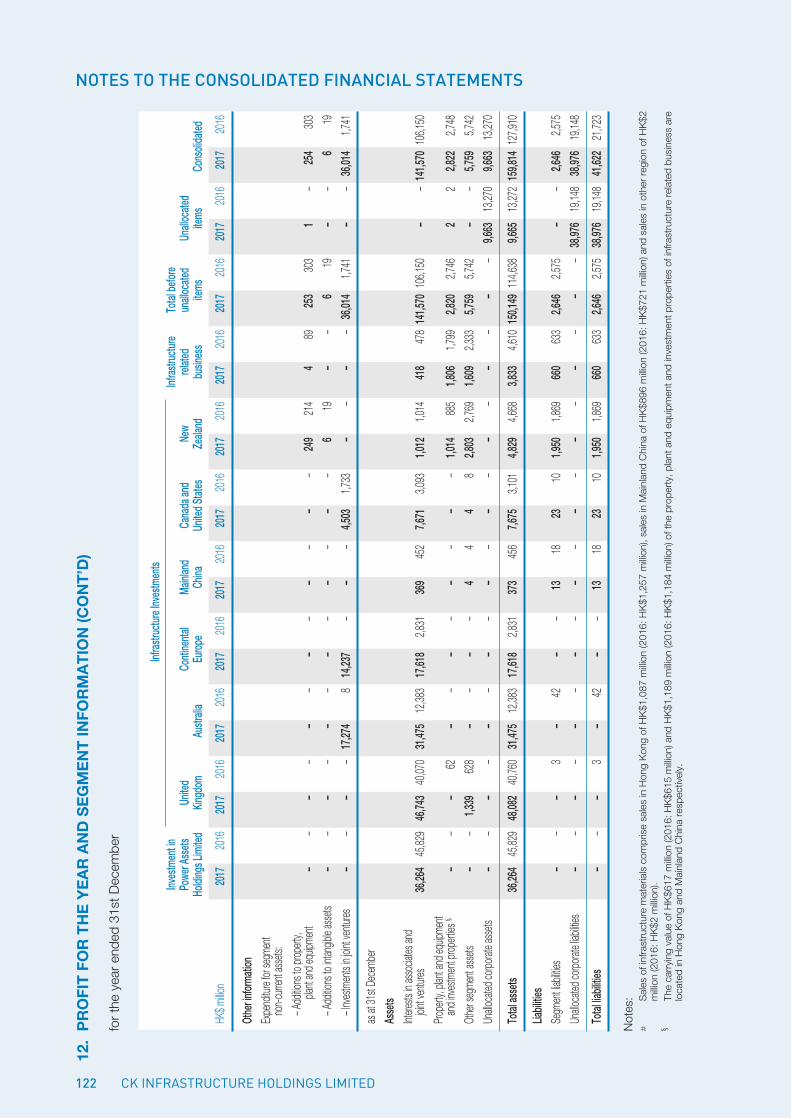
Othe
r info
rmati
on
Expe
nditu
re for
segm
ent
no
n-curr
ent a
ssets
:
– Add
itions
to pr
opert
y,
plant
and e
quipm
ent
– –
– –
– –
– –
– –
– –
249
214
4 89
25
3 30
3 1
– 25
4 30
3
– Add
itions
to in
tangib
le as
sets
– –
– –
– –
– –
– –
– –
6 19
–
– 6
19
– –
6 19
– I
nves
tmen
ts in
joint
ventu
res
– –
– –
17,27
4 8
14,23
7 –
– –
4,503
1,7
33
– –
– –
36,01
4 1,7
41
– –
36,01
4 1,7
41
as at
31st
Dece
mber
Asse
ts
Intere
sts in
asso
ciates
and
joi
nt ve
ntures
36
,264
45,82
9 46
,743
40,07
0 31
,475
12,38
3 17
,618
2,831
36
9 45
2 7,6
71
3,093
1,0
12
1,014
41
8 47
8 14
1,570
106
,150
– –
141,5
70 1
06,15
0Pr
opert
y, pla
nt an
d equ
ipmen
t
and i
nves
tmen
t prop
erties
§
– –
– 62
–
– –
– –
– –
– 1,0
14
885
1,806
1,7
99
2,820
2,7
46
2 2
2,822
2,7
48
Othe
r seg
ment
asse
ts –
– 1,3
39
628
– –
– –
4 4
4 8
2,803
2,7
69
1,609
2,3
33
5,759
5,7
42
– –
5,759
5,7
42Un
alloca
ted co
rporat
e ass
ets
– –
– –
– –
– –
– –
– –
– –
– –
– –
9,663
13
,270
9,663
13
,270
Total
asse
ts 36
,264
45,82
9 48
,082
40,76
0 31
,475
12,38
3 17
,618
2,831
37
3 45
6 7,6
75
3,101
4,8
29
4,668
3,8
33
4,610
150
,149
114,6
38
9,665
13
,272
159,8
14 1
27,91
0
Liabil
ities
Segm
ent li
abiliti
es
– –
– 3
– 42
–
– 13
18
23
10
1,9
50
1,869
66
0 63
3 2,6
46
2,575
–
– 2,6
46
2,575
Unallo
cated
corpo
rate l
iabiliti
es
– –
– –
– –
– –
– –
– –
– –
– –
– –
38,97
6 19
,148
38,97
6 19
,148
Total
liabil
ities
– –
– 3
– 42
–
– 13
18
23
10
1,9
50
1,869
66
0 63
3 2,6
46
2,575
38
,976
19,14
8 41
,622
21,72
3
Not
es:
#
Sal
es o
f inf
rast
ruct
ure
mat
eria
ls c
ompr
ise
sale
s in
Hon
g K
ong
of H
K$1
,087
milli
on (2
016:
HK
$1,2
57 m
illion
), sa
les
in M
ainl
and
Chi
na o
f HK
$896
milli
on (2
016:
HK
$721
milli
on) a
nd s
ales
in o
ther
reg
ion
of H
K$2
m
illion
(201
6: H
K$2
milli
on).
§ Th
e ca
rryi
ng v
alue
of H
K$6
17 m
illion
(201
6: H
K$6
15 m
illion
) and
HK
$1,1
89 m
illion
(201
6: H
K$1
,184
milli
on) o
f the
pro
pert
y, p
lant
and
equ
ipm
ent a
nd in
vest
men
t pro
pert
ies
of in
frast
ruct
ure
rela
ted
busi
ness
are
lo
cate
d in
Hon
g K
ong
and
Mai
nlan
d C
hina
res
pect
ivel
y.
CK InfRAstRuCtuRe HoldIngs lImIted
123AnnuAl RepoRt 2017
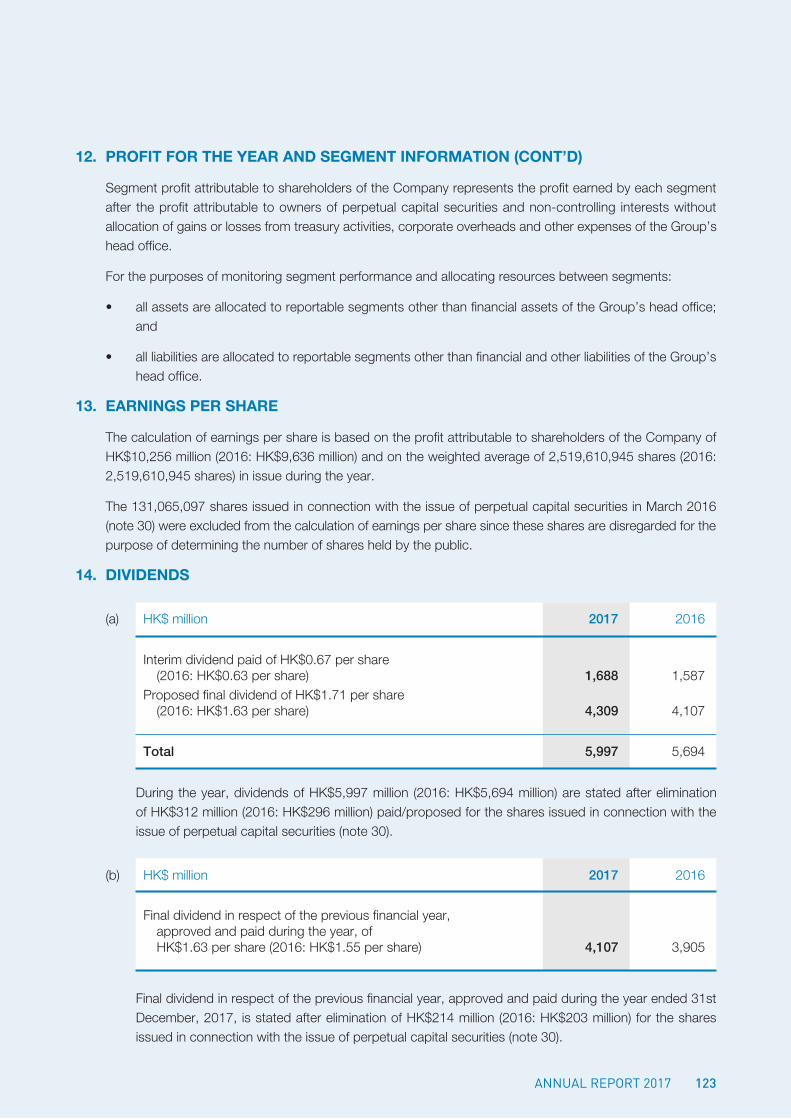
12. ProFit For the year and seGment inFormation (cont’d)
Segment profit attributable to shareholders of the Company represents the profit earned by each segment after the profit attributable to owners of perpetual capital securities and non-controlling interests without allocation of gains or losses from treasury activities, corporate overheads and other expenses of the Group’s head office.
For the purposes of monitoring segment performance and allocating resources between segments:
• allassetsareallocatedtoreportablesegmentsotherthanfinancialassetsoftheGroup’sheadoffice;and
• allliabilitiesareallocatedtoreportablesegmentsotherthanfinancialandotherliabilitiesoftheGroup’shead office.
13. earninGs Per share
The calculation of earnings per share is based on the profit attributable to shareholders of the Company of HK$10,256 million (2016: HK$9,636 million) and on the weighted average of 2,519,610,945 shares (2016: 2,519,610,945 shares) in issue during the year.
The 131,065,097 shares issued in connection with the issue of perpetual capital securities in March 2016 (note 30) were excluded from the calculation of earnings per share since these shares are disregarded for the purpose of determining the number of shares held by the public.
14. dividends
(a) HK$ million 2017 2016
Interim dividend paid of HK$0.67 per share (2016: HK$0.63 per share) 1,688 1,587Proposed final dividend of HK$1.71 per share (2016: HK$1.63 per share) 4,309 4,107
Total 5,997 5,694
During the year, dividends of HK$5,997 million (2016: HK$5,694 million) are stated after elimination of HK$312 million (2016: HK$296 million) paid/proposed for the shares issued in connection with the issue of perpetual capital securities (note 30).
(b) HK$ million 2017 2016
Final dividend in respect of the previous financial year, approved and paid during the year, of HK$1.63 per share (2016: HK$1.55 per share) 4,107 3,905
Final dividend in respect of the previous financial year, approved and paid during the year ended 31st December, 2017, is stated after elimination of HK$214 million (2016: HK$203 million) for the shares issued in connection with the issue of perpetual capital securities (note 30).
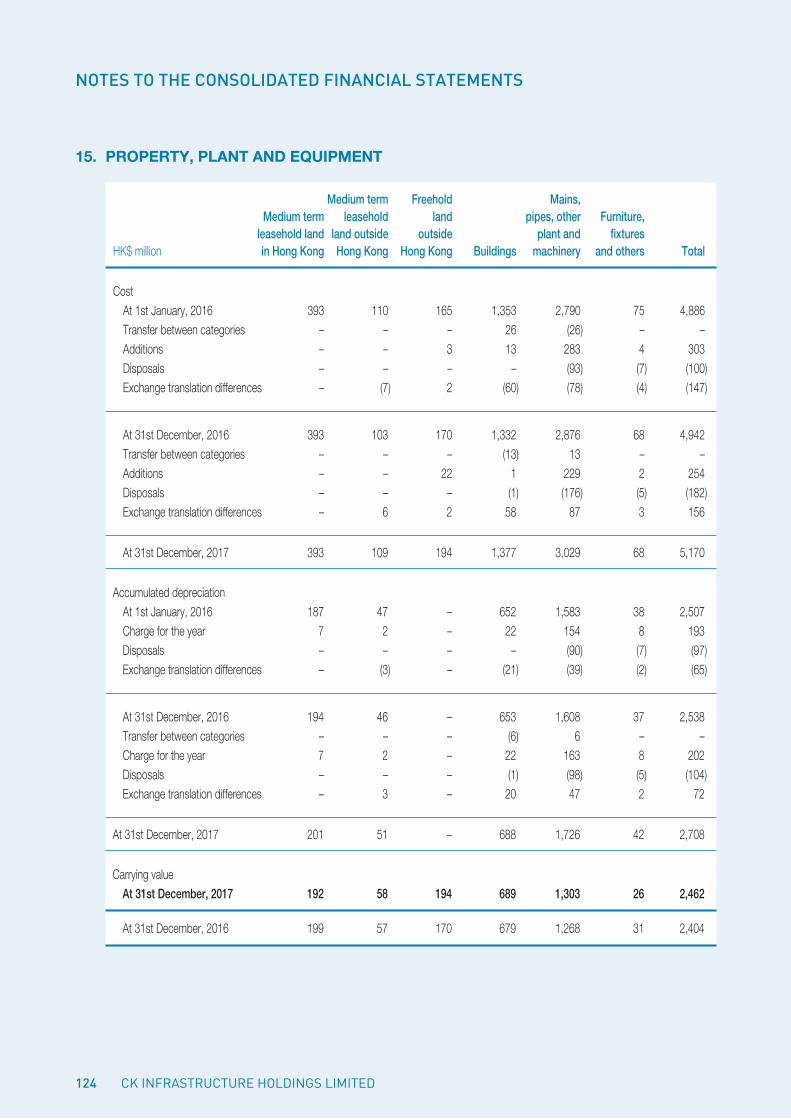
124
NOTES TO THE CONSOLIDATED FINANCIAL STATEMENTS
15. ProPerty, Plant and equiPment
Medium term Freehold Mains, Medium term leasehold land pipes, other Furniture, leasehold land land outside outside plant and fixturesHK$ million in Hong Kong Hong Kong Hong Kong Buildings machinery and others Total
Cost At 1st January, 2016 393 110 165 1,353 2,790 75 4,886 Transfer between categories – – – 26 (26) – – Additions – – 3 13 283 4 303 Disposals – – – – (93) (7) (100) Exchange translation differences – (7) 2 (60) (78) (4) (147)
At 31st December, 2016 393 103 170 1,332 2,876 68 4,942 Transfer between categories – – – (13) 13 – – Additions – – 22 1 229 2 254 Disposals – – – (1) (176) (5) (182) Exchange translation differences – 6 2 58 87 3 156
At 31st December, 2017 393 109 194 1,377 3,029 68 5,170
Accumulated depreciation At 1st January, 2016 187 47 – 652 1,583 38 2,507 Charge for the year 7 2 – 22 154 8 193 Disposals – – – – (90) (7) (97) Exchange translation differences – (3) – (21) (39) (2) (65)
At 31st December, 2016 194 46 – 653 1,608 37 2,538 Transfer between categories – – – (6) 6 – – Charge for the year 7 2 – 22 163 8 202 Disposals – – – (1) (98) (5) (104) Exchange translation differences – 3 – 20 47 2 72
At 31st December, 2017 201 51 – 688 1,726 42 2,708
Carrying value At 31st December, 2017 192 58 194 689 1,303 26 2,462
At 31st December, 2016 199 57 170 679 1,268 31 2,404
CK InfRAstRuCtuRe HoldIngs lImIted
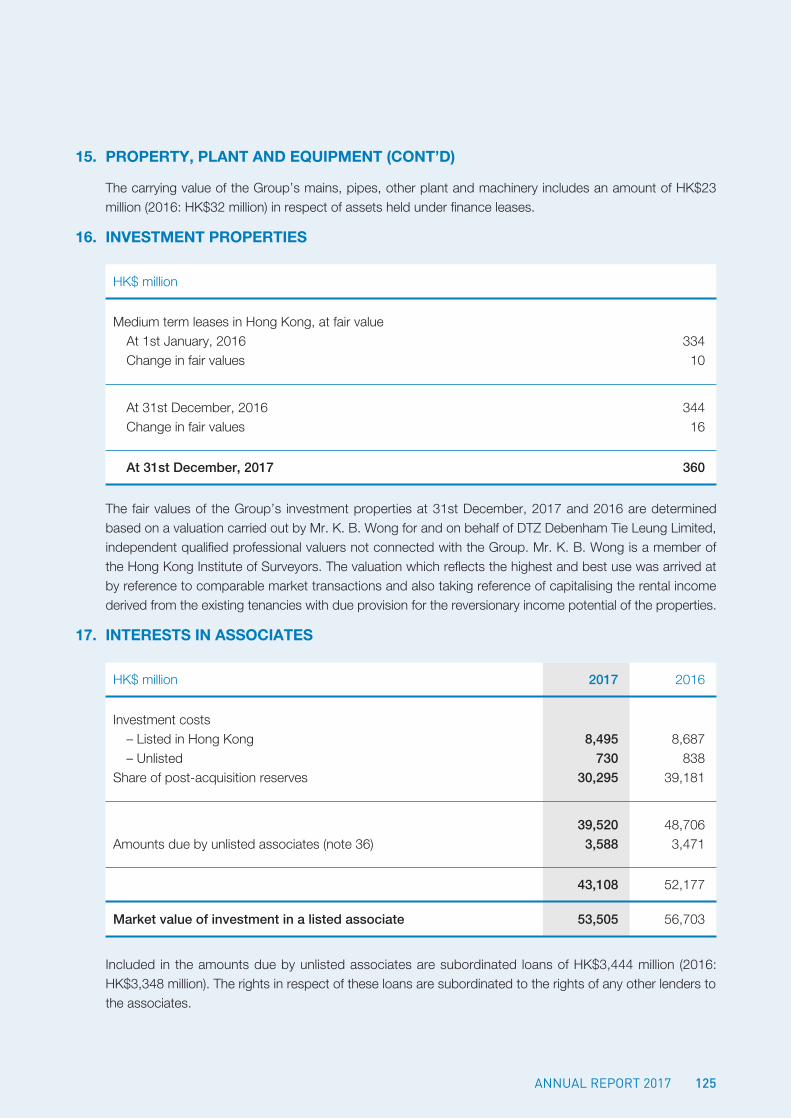
125AnnuAl RepoRt 2017
15. ProPerty, Plant and equiPment (cont’d)
The carrying value of the Group’s mains, pipes, other plant and machinery includes an amount of HK$23 million (2016: HK$32 million) in respect of assets held under finance leases.
16. investment ProPerties
HK$ million
Medium term leases in Hong Kong, at fair value At 1st January, 2016 334 Change in fair values 10
At 31st December, 2016 344 Change in fair values 16
At 31st December, 2017 360
The fair values of the Group’s investment properties at 31st December, 2017 and 2016 are determined based on a valuation carried out by Mr. K. B. Wong for and on behalf of DTZ Debenham Tie Leung Limited, independent qualified professional valuers not connected with the Group. Mr. K. B. Wong is a member of the Hong Kong Institute of Surveyors. The valuation which reflects the highest and best use was arrived at by reference to comparable market transactions and also taking reference of capitalising the rental income derived from the existing tenancies with due provision for the reversionary income potential of the properties.
17. interests in associates
HK$ million 2017 2016
Investment costs – Listed in Hong Kong 8,495 8,687 – Unlisted 730 838Share of post-acquisition reserves 30,295 39,181
39,520 48,706Amounts due by unlisted associates (note 36) 3,588 3,471
43,108 52,177
Market value of investment in a listed associate 53,505 56,703
Included in the amounts due by unlisted associates are subordinated loans of HK$3,444 million (2016: HK$3,348 million). The rights in respect of these loans are subordinated to the rights of any other lenders to the associates.
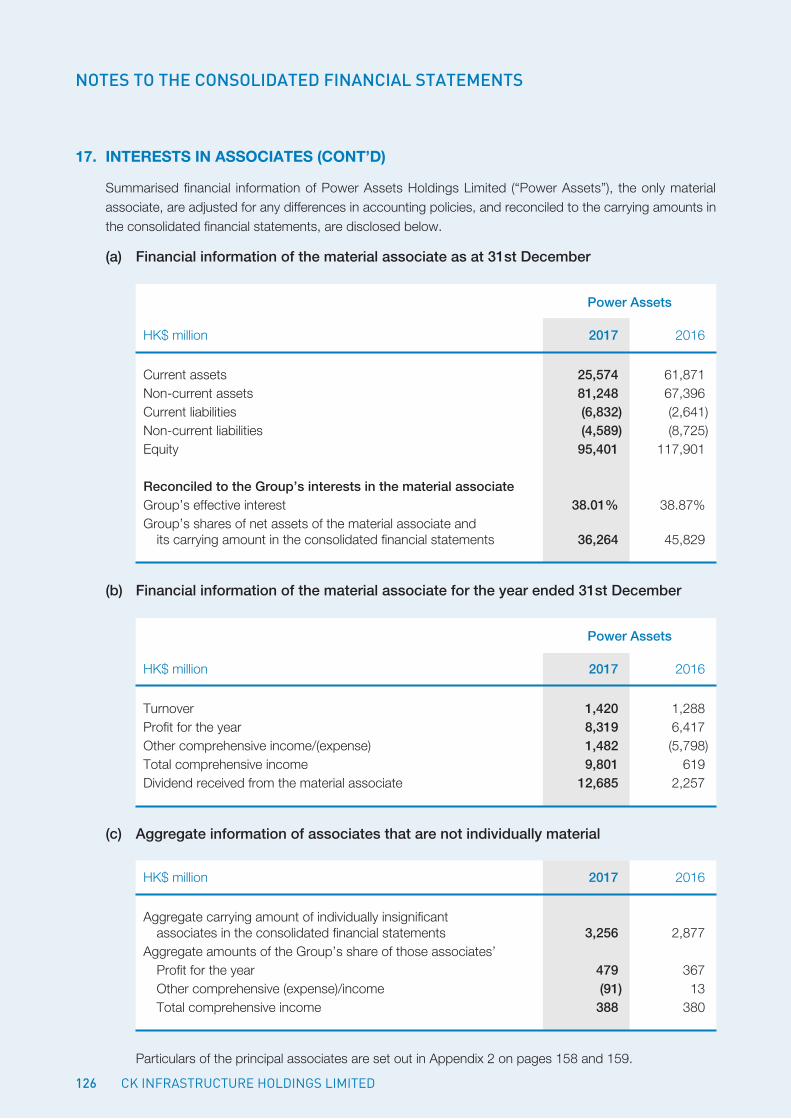
126
NOTES TO THE CONSOLIDATED FINANCIAL STATEMENTS
17. interests in associates (cont’d)
Summarised financial information of Power Assets Holdings Limited (“Power Assets”), the only material associate, are adjusted for any differences in accounting policies, and reconciled to the carrying amounts in the consolidated financial statements, are disclosed below.
(a) Financial information of the material associate as at 31st December
Power Assets
HK$ million 2017 2016
Current assets 25,574 61,871Non-current assets 81,248 67,396Current liabilities (6,832) (2,641)Non-current liabilities (4,589) (8,725)Equity 95,401 117,901
Reconciled to the Group’s interests in the material associateGroup’s effective interest 38.01% 38.87%Group’s shares of net assets of the material associate and its carrying amount in the consolidated financial statements 36,264 45,829
(b) Financial information of the material associate for the year ended 31st December
Power Assets
HK$ million 2017 2016
Turnover 1,420 1,288Profit for the year 8,319 6,417Other comprehensive income/(expense) 1,482 (5,798)Total comprehensive income 9,801 619Dividend received from the material associate 12,685 2,257
(c) Aggregate information of associates that are not individually material
HK$ million 2017 2016
Aggregate carrying amount of individually insignificant associates in the consolidated financial statements 3,256 2,877Aggregate amounts of the Group’s share of those associates’ Profit for the year 479 367 Other comprehensive (expense)/income (91) 13 Total comprehensive income 388 380
Particulars of the principal associates are set out in Appendix 2 on pages 158 and 159.
CK InfRAstRuCtuRe HoldIngs lImIted
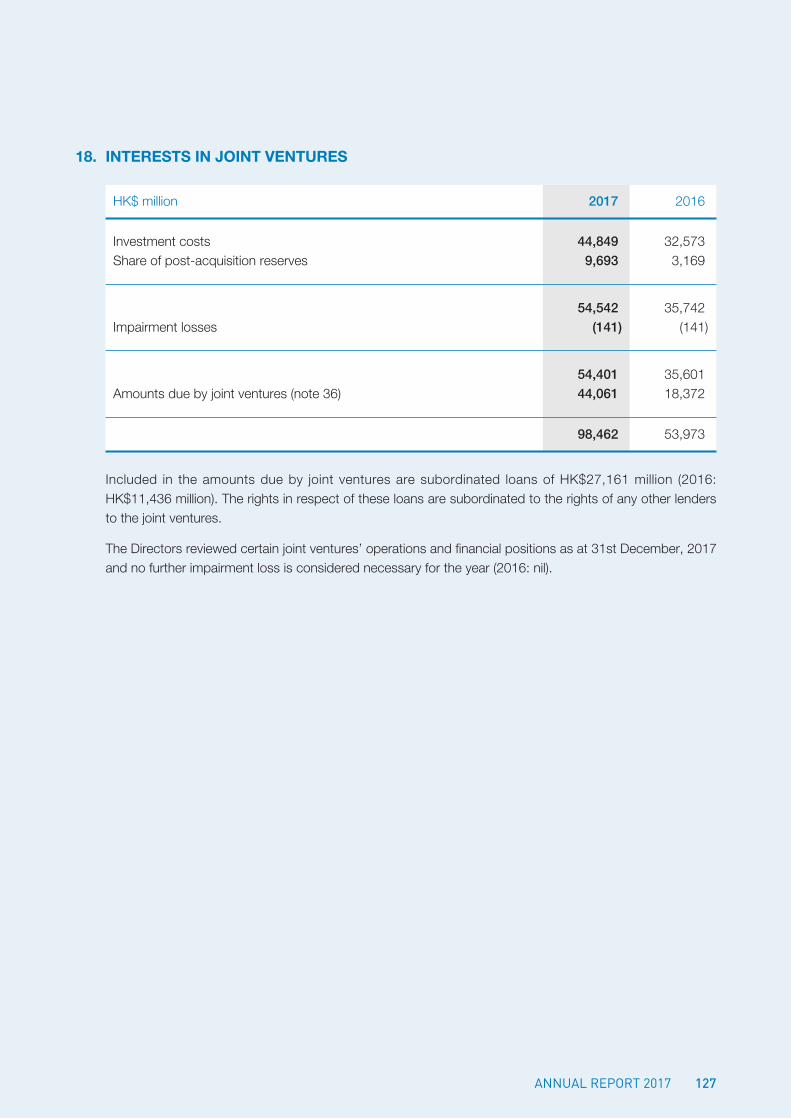
127AnnuAl RepoRt 2017
18. interests in joint ventures
HK$ million 2017 2016
Investment costs 44,849 32,573Share of post-acquisition reserves 9,693 3,169
54,542 35,742Impairment losses (141) (141)
54,401 35,601Amounts due by joint ventures (note 36) 44,061 18,372
98,462 53,973
Included in the amounts due by joint ventures are subordinated loans of HK$27,161 million (2016: HK$11,436 million). The rights in respect of these loans are subordinated to the rights of any other lenders to the joint ventures.
The Directors reviewed certain joint ventures’ operations and financial positions as at 31st December, 2017 and no further impairment loss is considered necessary for the year (2016: nil).
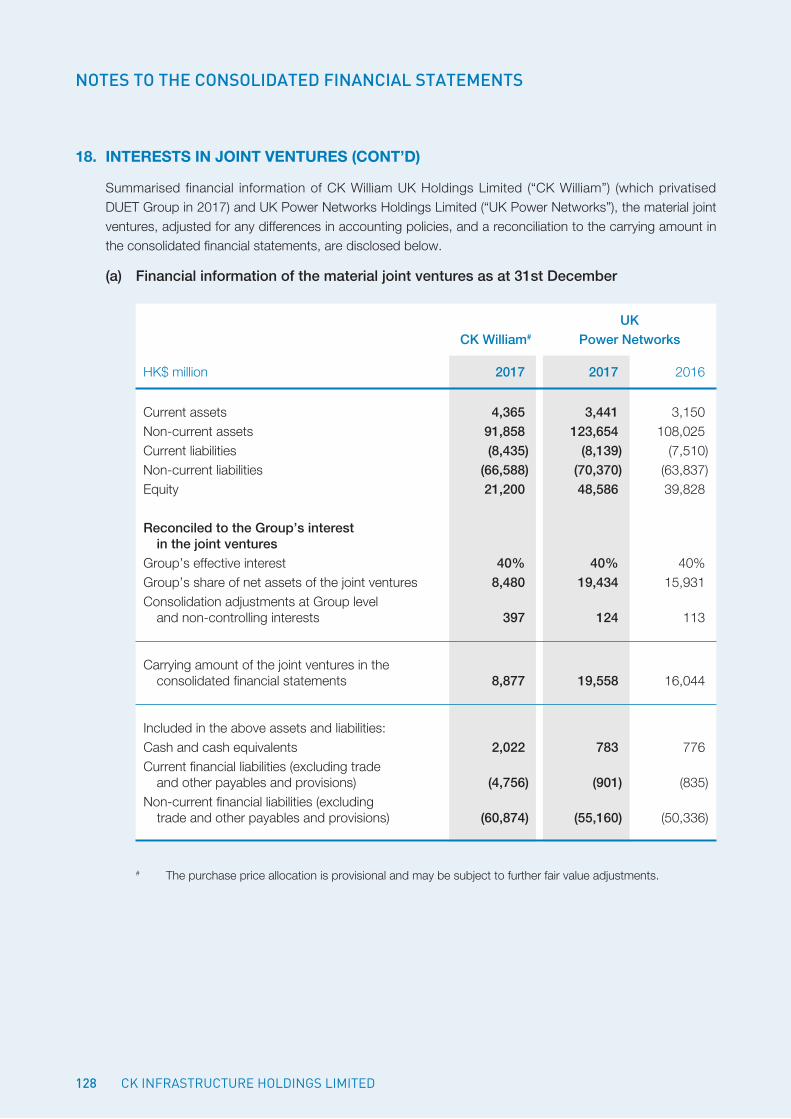
128
NOTES TO THE CONSOLIDATED FINANCIAL STATEMENTS
18. interests in joint ventures (cont’d)
Summarised financial information of CK William UK Holdings Limited (“CK William”) (which privatised DUET Group in 2017) and UK Power Networks Holdings Limited (“UK Power Networks”), the material joint ventures, adjusted for any differences in accounting policies, and a reconciliation to the carrying amount in the consolidated financial statements, are disclosed below.
(a) Financial information of the material joint ventures as at 31st December
UK CK William# Power Networks
HK$ million 2017 2017 2016
Current assets 4,365 3,441 3,150Non-current assets 91,858 123,654 108,025Current liabilities (8,435) (8,139) (7,510)Non-current liabilities (66,588) (70,370) (63,837)Equity 21,200 48,586 39,828
Reconciled to the Group’s interest in the joint venturesGroup’s effective interest 40% 40% 40%Group’s share of net assets of the joint ventures 8,480 19,434 15,931Consolidation adjustments at Group level and non-controlling interests 397 124 113
Carrying amount of the joint ventures in the consolidated financial statements 8,877 19,558 16,044
Included in the above assets and liabilities:Cash and cash equivalents 2,022 783 776Current financial liabilities (excluding trade and other payables and provisions) (4,756) (901) (835)Non-current financial liabilities (excluding trade and other payables and provisions) (60,874) (55,160) (50,336)
# The purchase price allocation is provisional and may be subject to further fair value adjustments.
CK InfRAstRuCtuRe HoldIngs lImIted
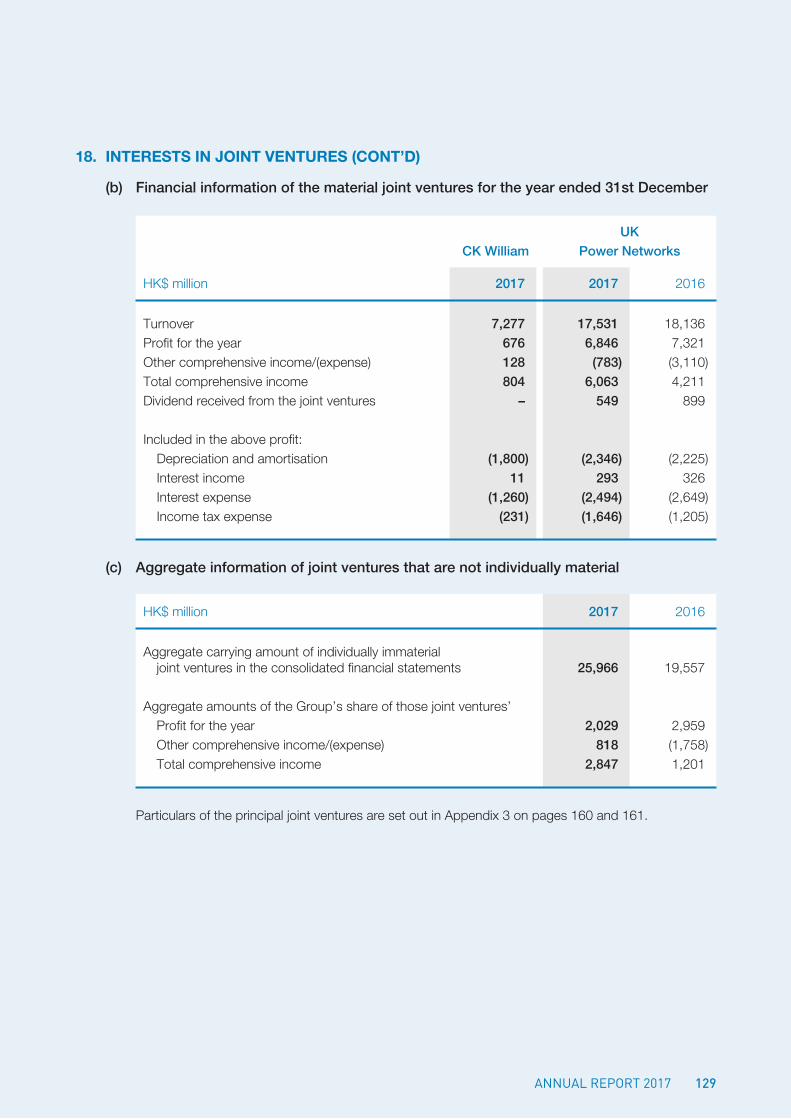
129AnnuAl RepoRt 2017
18. interests in joint ventures (cont’d)
(b) Financial information of the material joint ventures for the year ended 31st December
UK CK William Power Networks
HK$ million 2017 2017 2016
Turnover 7,277 17,531 18,136Profit for the year 676 6,846 7,321Other comprehensive income/(expense) 128 (783) (3,110)Total comprehensive income 804 6,063 4,211Dividend received from the joint ventures – 549 899
Included in the above profit: Depreciation and amortisation (1,800) (2,346) (2,225) Interest income 11 293 326 Interest expense (1,260) (2,494) (2,649) Income tax expense (231) (1,646) (1,205)
(c) Aggregate information of joint ventures that are not individually material
HK$ million 2017 2016
Aggregate carrying amount of individually immaterial joint ventures in the consolidated financial statements 25,966 19,557
Aggregate amounts of the Group’s share of those joint ventures’ Profit for the year 2,029 2,959 Other comprehensive income/(expense) 818 (1,758) Total comprehensive income 2,847 1,201
Particulars of the principal joint ventures are set out in Appendix 3 on pages 160 and 161.
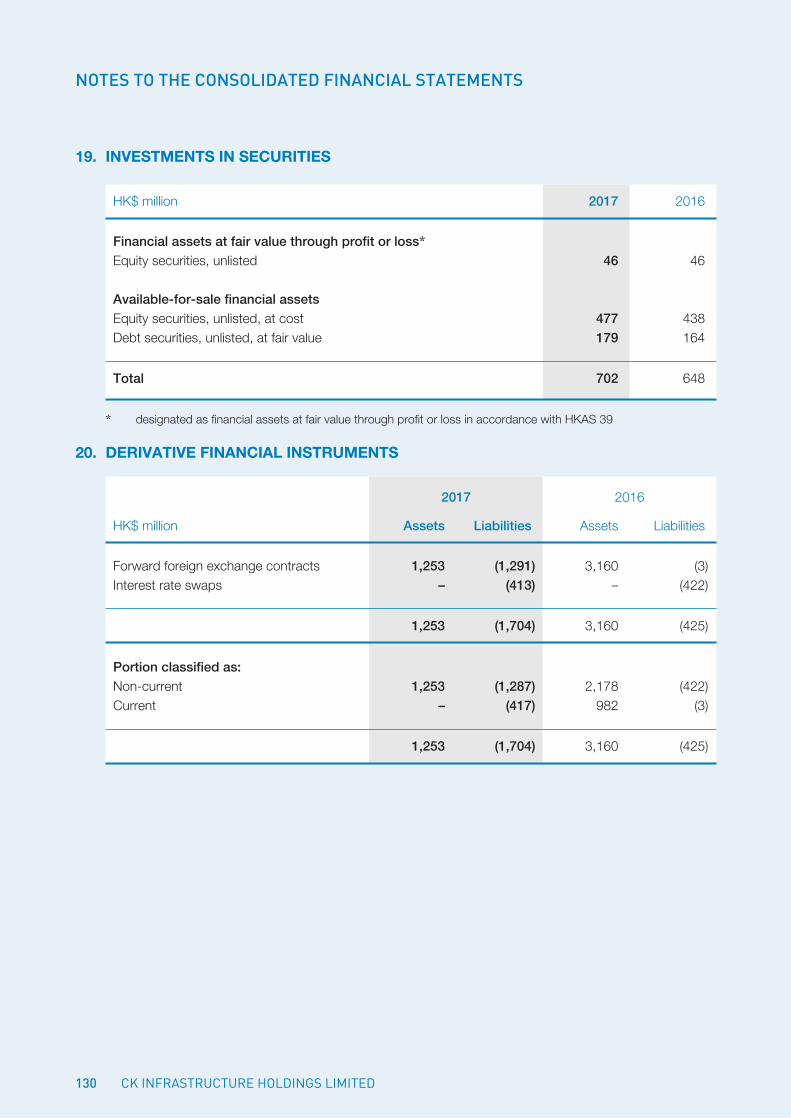
130
NOTES TO THE CONSOLIDATED FINANCIAL STATEMENTS
19. investments in securities
HK$ million 2017 2016
Financial assets at fair value through profit or loss*Equity securities, unlisted 46 46
Available-for-sale financial assetsEquity securities, unlisted, at cost 477 438Debt securities, unlisted, at fair value 179 164
Total 702 648
* designated as financial assets at fair value through profit or loss in accordance with HKAS 39
20. derivative Financial instruments
2017 2016
HK$ million Assets Liabilities Assets Liabilities
Forward foreign exchange contracts 1,253 (1,291) 3,160 (3)Interest rate swaps – (413) – (422)
1,253 (1,704) 3,160 (425)
Portion classified as:Non-current 1,253 (1,287) 2,178 (422)Current – (417) 982 (3)
1,253 (1,704) 3,160 (425)
CK InfRAstRuCtuRe HoldIngs lImIted
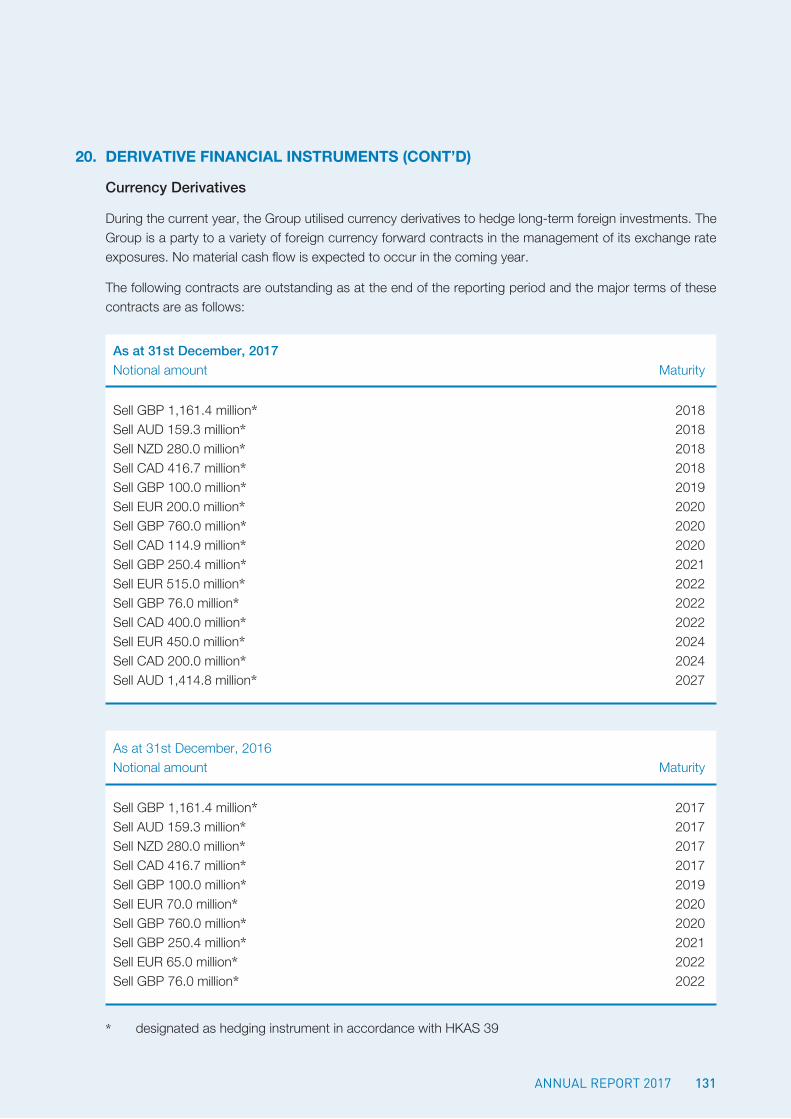
131AnnuAl RepoRt 2017
20. derivative Financial instruments (cont’d)
Currency Derivatives
During the current year, the Group utilised currency derivatives to hedge long-term foreign investments. The Group is a party to a variety of foreign currency forward contracts in the management of its exchange rate exposures. No material cash flow is expected to occur in the coming year.
The following contracts are outstanding as at the end of the reporting period and the major terms of these contracts are as follows:
As at 31st December, 2017Notional amount Maturity
Sell GBP 1,161.4 million* 2018Sell AUD 159.3 million* 2018Sell NZD 280.0 million* 2018Sell CAD 416.7 million* 2018Sell GBP 100.0 million* 2019Sell EUR 200.0 million* 2020Sell GBP 760.0 million* 2020Sell CAD 114.9 million* 2020Sell GBP 250.4 million* 2021Sell EUR 515.0 million* 2022Sell GBP 76.0 million* 2022Sell CAD 400.0 million* 2022Sell EUR 450.0 million* 2024Sell CAD 200.0 million* 2024Sell AUD 1,414.8 million* 2027
As at 31st December, 2016Notional amount Maturity
Sell GBP 1,161.4 million* 2017Sell AUD 159.3 million* 2017Sell NZD 280.0 million* 2017Sell CAD 416.7 million* 2017Sell GBP 100.0 million* 2019Sell EUR 70.0 million* 2020Sell GBP 760.0 million* 2020Sell GBP 250.4 million* 2021Sell EUR 65.0 million* 2022Sell GBP 76.0 million* 2022
* designated as hedging instrument in accordance with HKAS 39
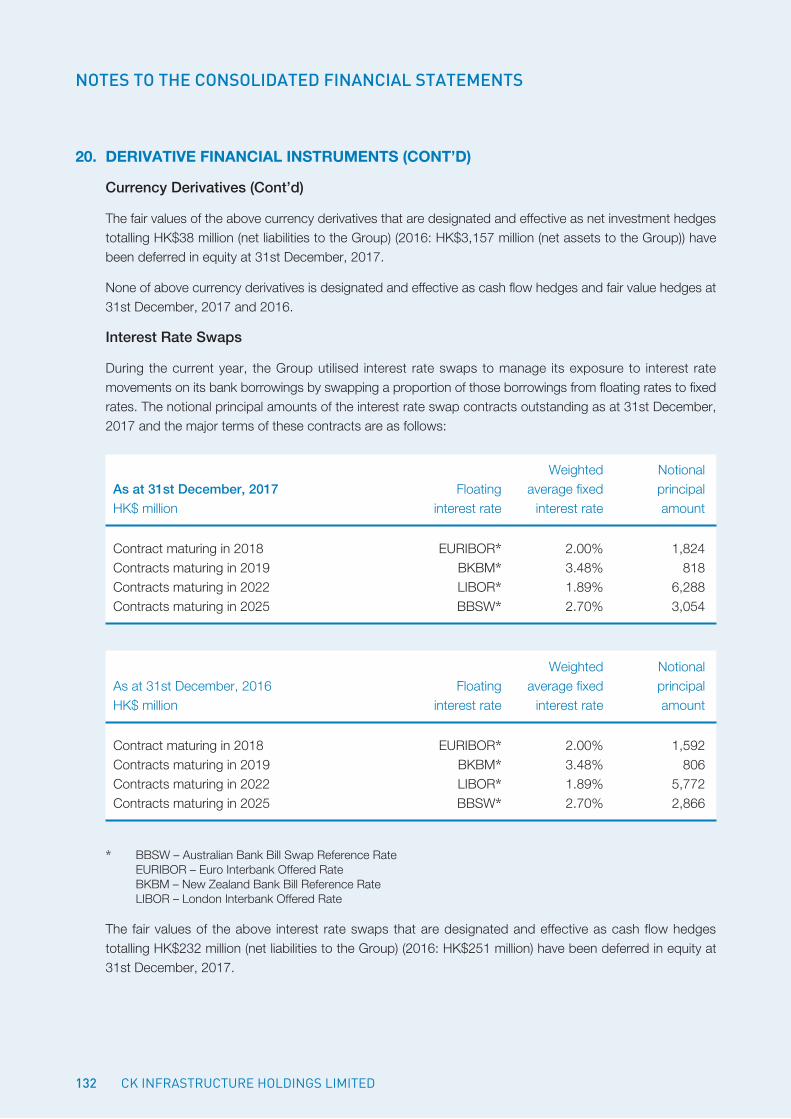
132
NOTES TO THE CONSOLIDATED FINANCIAL STATEMENTS
20. derivative Financial instruments (cont’d)
Currency Derivatives (Cont’d)
The fair values of the above currency derivatives that are designated and effective as net investment hedges totalling HK$38 million (net liabilities to the Group) (2016: HK$3,157 million (net assets to the Group)) have been deferred in equity at 31st December, 2017.
None of above currency derivatives is designated and effective as cash flow hedges and fair value hedges at 31st December, 2017 and 2016.
Interest Rate Swaps
During the current year, the Group utilised interest rate swaps to manage its exposure to interest rate movements on its bank borrowings by swapping a proportion of those borrowings from floating rates to fixed rates. The notional principal amounts of the interest rate swap contracts outstanding as at 31st December, 2017 and the major terms of these contracts are as follows:
Weighted NotionalAs at 31st December, 2017 Floating average fixed principalHK$ million interest rate interest rate amount
Contract maturing in 2018 EURIBOR* 2.00% 1,824Contracts maturing in 2019 BKBM* 3.48% 818Contracts maturing in 2022 LIBOR* 1.89% 6,288Contracts maturing in 2025 BBSW* 2.70% 3,054
Weighted NotionalAs at 31st December, 2016 Floating average fixed principalHK$ million interest rate interest rate amount
Contract maturing in 2018 EURIBOR* 2.00% 1,592Contracts maturing in 2019 BKBM* 3.48% 806Contracts maturing in 2022 LIBOR* 1.89% 5,772Contracts maturing in 2025 BBSW* 2.70% 2,866
* BBSW – Australian Bank Bill Swap Reference Rate EURIBOR – Euro Interbank Offered Rate BKBM – New Zealand Bank Bill Reference Rate LIBOR – London Interbank Offered Rate
The fair values of the above interest rate swaps that are designated and effective as cash flow hedges totalling HK$232 million (net liabilities to the Group) (2016: HK$251 million) have been deferred in equity at 31st December, 2017.
CK InfRAstRuCtuRe HoldIngs lImIted
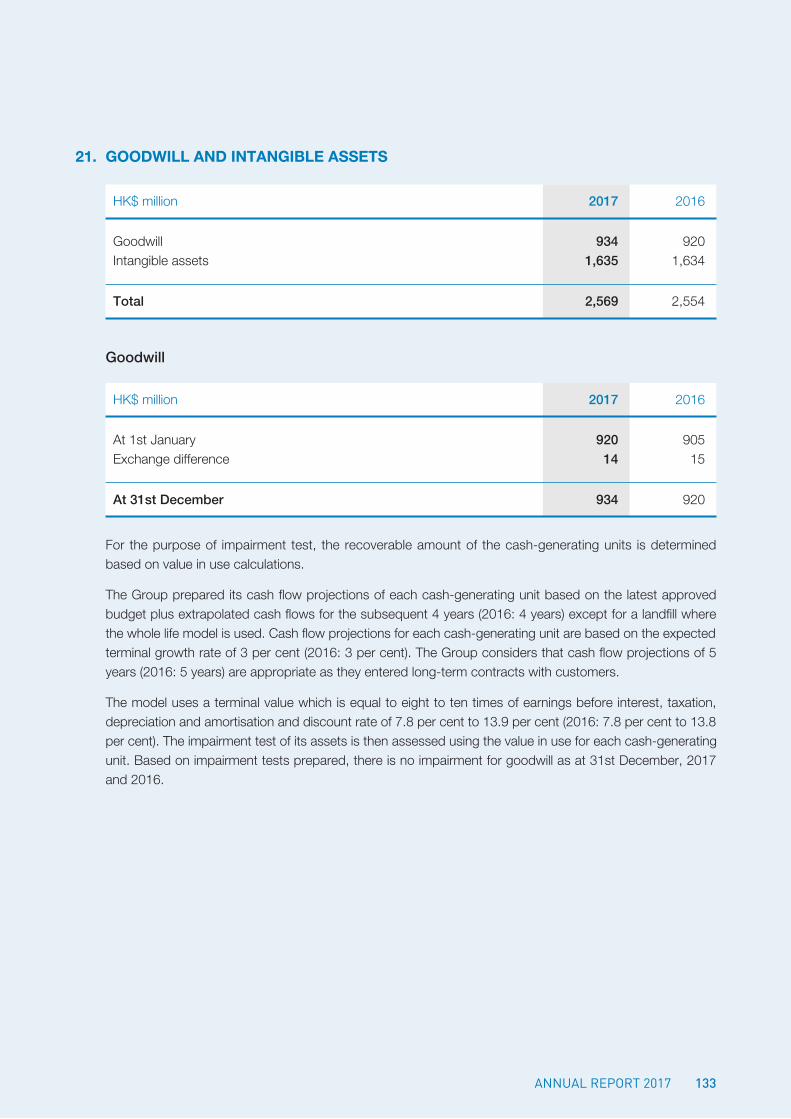
133AnnuAl RepoRt 2017
21. Goodwill and intanGiBle assets
HK$ million 2017 2016
Goodwill 934 920Intangible assets 1,635 1,634
Total 2,569 2,554
Goodwill
HK$ million 2017 2016
At 1st January 920 905Exchange difference 14 15
At 31st December 934 920
For the purpose of impairment test, the recoverable amount of the cash-generating units is determined based on value in use calculations.
The Group prepared its cash flow projections of each cash-generating unit based on the latest approved budget plus extrapolated cash flows for the subsequent 4 years (2016: 4 years) except for a landfill where the whole life model is used. Cash flow projections for each cash-generating unit are based on the expected terminal growth rate of 3 per cent (2016: 3 per cent). The Group considers that cash flow projections of 5 years (2016: 5 years) are appropriate as they entered long-term contracts with customers.
The model uses a terminal value which is equal to eight to ten times of earnings before interest, taxation, depreciation and amortisation and discount rate of 7.8 per cent to 13.9 per cent (2016: 7.8 per cent to 13.8 per cent). The impairment test of its assets is then assessed using the value in use for each cash-generating unit. Based on impairment tests prepared, there is no impairment for goodwill as at 31st December, 2017 and 2016.
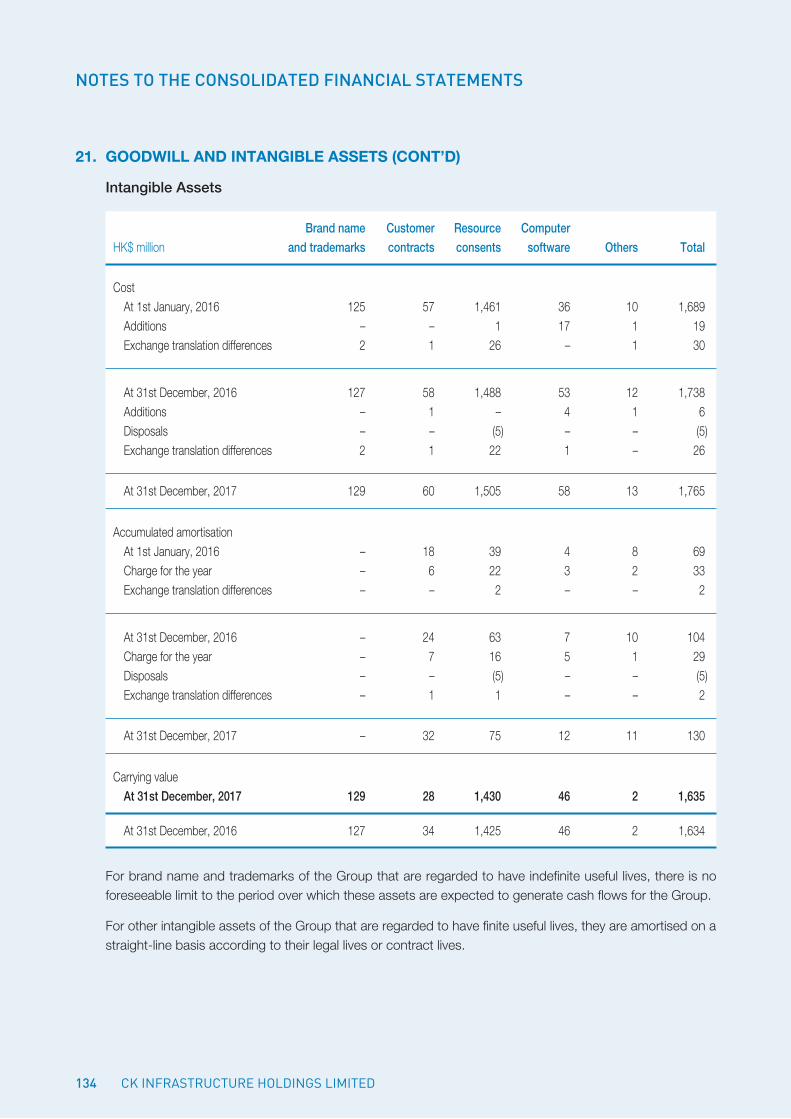
134
NOTES TO THE CONSOLIDATED FINANCIAL STATEMENTS
21. Goodwill and intanGiBle assets (cont’d)
Intangible Assets
Brand name Customer Resource ComputerHK$ million and trademarks contracts consents software Others Total
Cost At 1st January, 2016 125 57 1,461 36 10 1,689 Additions – – 1 17 1 19 Exchange translation differences 2 1 26 – 1 30
At 31st December, 2016 127 58 1,488 53 12 1,738 Additions – 1 – 4 1 6 Disposals – – (5) – – (5) Exchange translation differences 2 1 22 1 – 26
At 31st December, 2017 129 60 1,505 58 13 1,765
Accumulated amortisation At 1st January, 2016 – 18 39 4 8 69 Charge for the year – 6 22 3 2 33 Exchange translation differences – – 2 – – 2
At 31st December, 2016 – 24 63 7 10 104 Charge for the year – 7 16 5 1 29 Disposals – – (5) – – (5) Exchange translation differences – 1 1 – – 2
At 31st December, 2017 – 32 75 12 11 130
Carrying value At 31st December, 2017 129 28 1,430 46 2 1,635
At 31st December, 2016 127 34 1,425 46 2 1,634
For brand name and trademarks of the Group that are regarded to have indefinite useful lives, there is no foreseeable limit to the period over which these assets are expected to generate cash flows for the Group.
For other intangible assets of the Group that are regarded to have finite useful lives, they are amortised on a straight-line basis according to their legal lives or contract lives.
CK InfRAstRuCtuRe HoldIngs lImIted
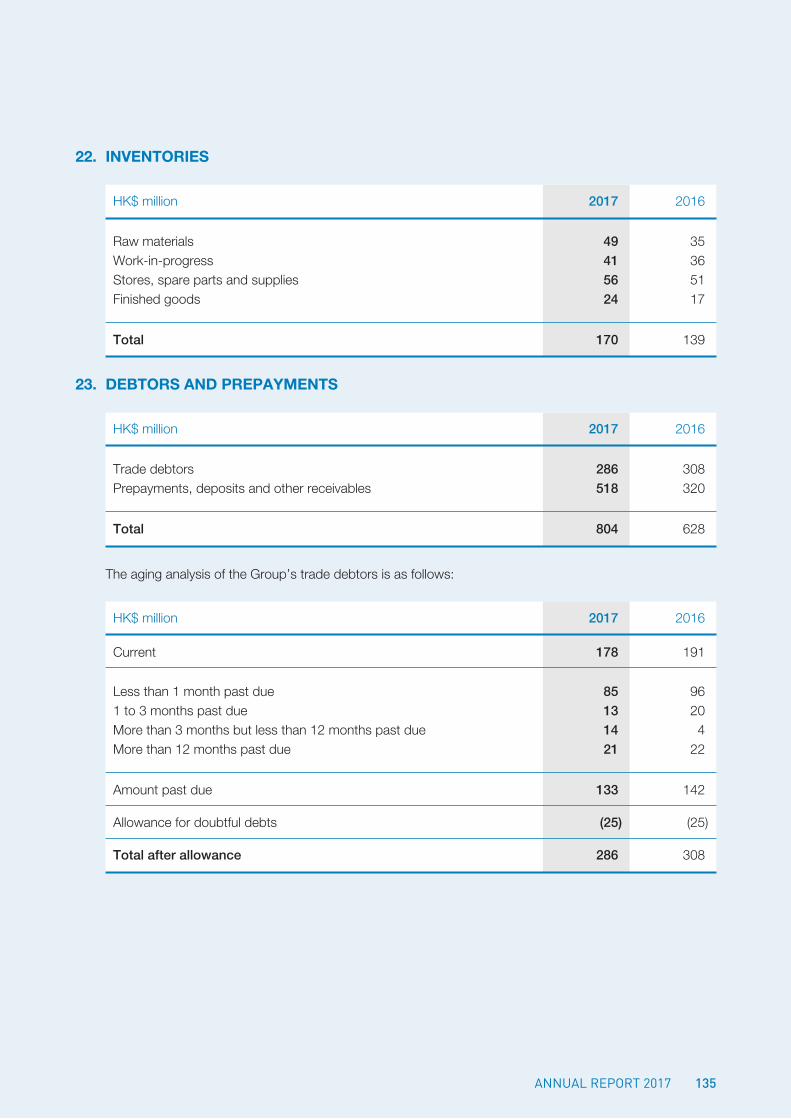
135AnnuAl RepoRt 2017
22. inventories
HK$ million 2017 2016
Raw materials 49 35Work-in-progress 41 36Stores, spare parts and supplies 56 51Finished goods 24 17
Total 170 139
23. deBtors and PrePayments
HK$ million 2017 2016
Trade debtors 286 308Prepayments, deposits and other receivables 518 320
Total 804 628
The aging analysis of the Group’s trade debtors is as follows:
HK$ million 2017 2016
Current 178 191
Less than 1 month past due 85 961 to 3 months past due 13 20More than 3 months but less than 12 months past due 14 4More than 12 months past due 21 22
Amount past due 133 142
Allowance for doubtful debts (25) (25)
Total after allowance 286 308
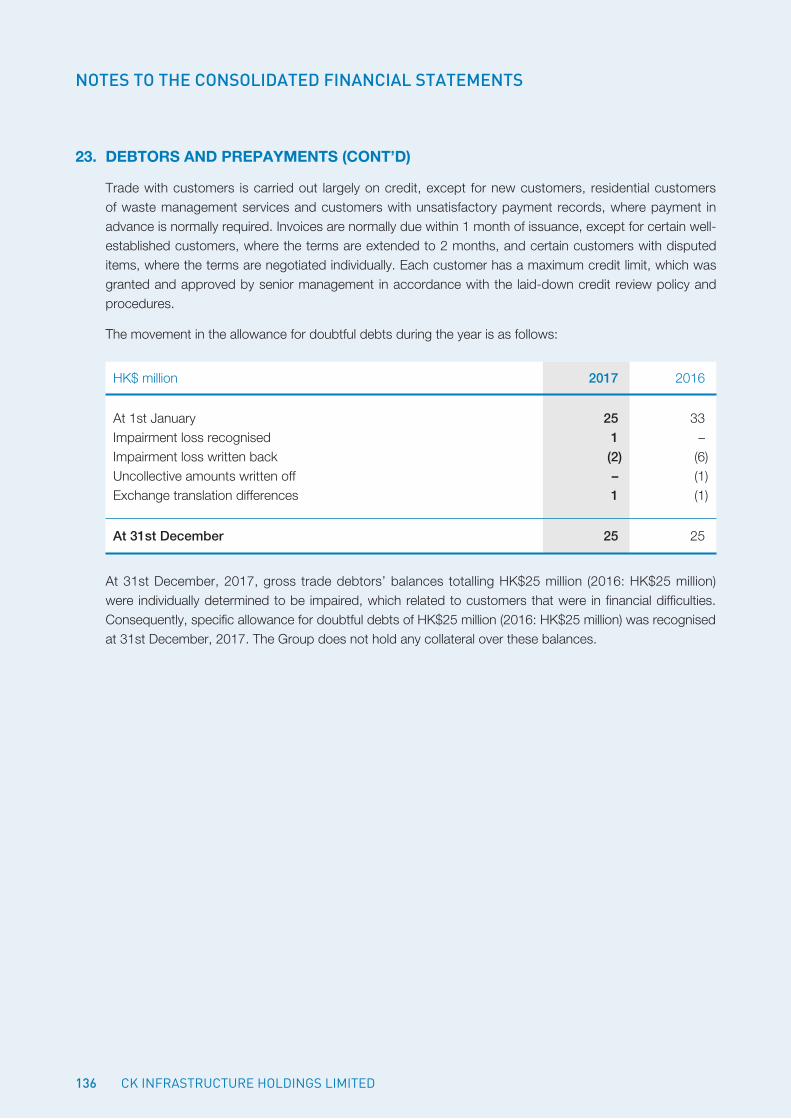
136
NOTES TO THE CONSOLIDATED FINANCIAL STATEMENTS
23. deBtors and PrePayments (cont’d)
Trade with customers is carried out largely on credit, except for new customers, residential customers of waste management services and customers with unsatisfactory payment records, where payment in advance is normally required. Invoices are normally due within 1 month of issuance, except for certain well-established customers, where the terms are extended to 2 months, and certain customers with disputed items, where the terms are negotiated individually. Each customer has a maximum credit limit, which was granted and approved by senior management in accordance with the laid-down credit review policy and procedures.
The movement in the allowance for doubtful debts during the year is as follows:
HK$ million 2017 2016
At 1st January 25 33Impairment loss recognised 1 –Impairment loss written back (2) (6)Uncollective amounts written off – (1)Exchange translation differences 1 (1)
At 31st December 25 25
At 31st December, 2017, gross trade debtors’ balances totalling HK$25 million (2016: HK$25 million) were individually determined to be impaired, which related to customers that were in financial difficulties. Consequently, specific allowance for doubtful debts of HK$25 million (2016: HK$25 million) was recognised at 31st December, 2017. The Group does not hold any collateral over these balances.
CK InfRAstRuCtuRe HoldIngs lImIted
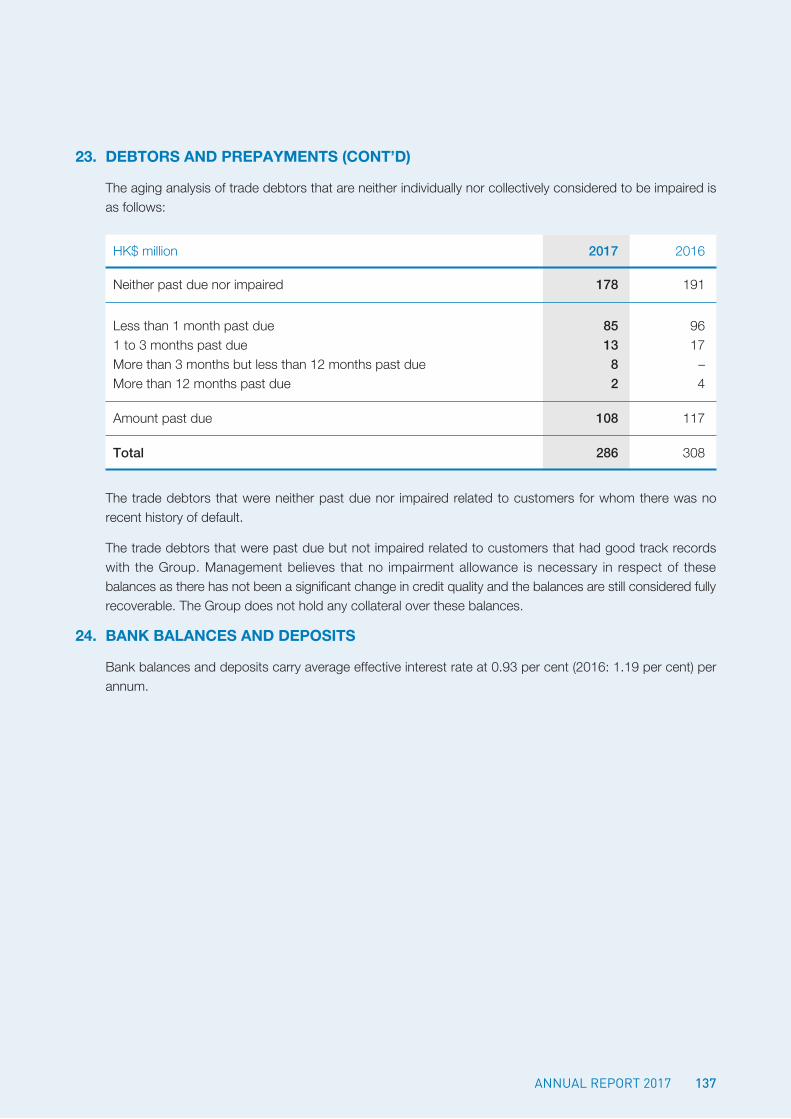
137AnnuAl RepoRt 2017
23. deBtors and PrePayments (cont’d)
The aging analysis of trade debtors that are neither individually nor collectively considered to be impaired is as follows:
HK$ million 2017 2016
Neither past due nor impaired 178 191
Less than 1 month past due 85 961 to 3 months past due 13 17More than 3 months but less than 12 months past due 8 –More than 12 months past due 2 4
Amount past due 108 117
Total 286 308
The trade debtors that were neither past due nor impaired related to customers for whom there was no recent history of default.
The trade debtors that were past due but not impaired related to customers that had good track records with the Group. Management believes that no impairment allowance is necessary in respect of these balances as there has not been a significant change in credit quality and the balances are still considered fully recoverable. The Group does not hold any collateral over these balances.
24. Bank Balances and dePosits
Bank balances and deposits carry average effective interest rate at 0.93 per cent (2016: 1.19 per cent) per annum.
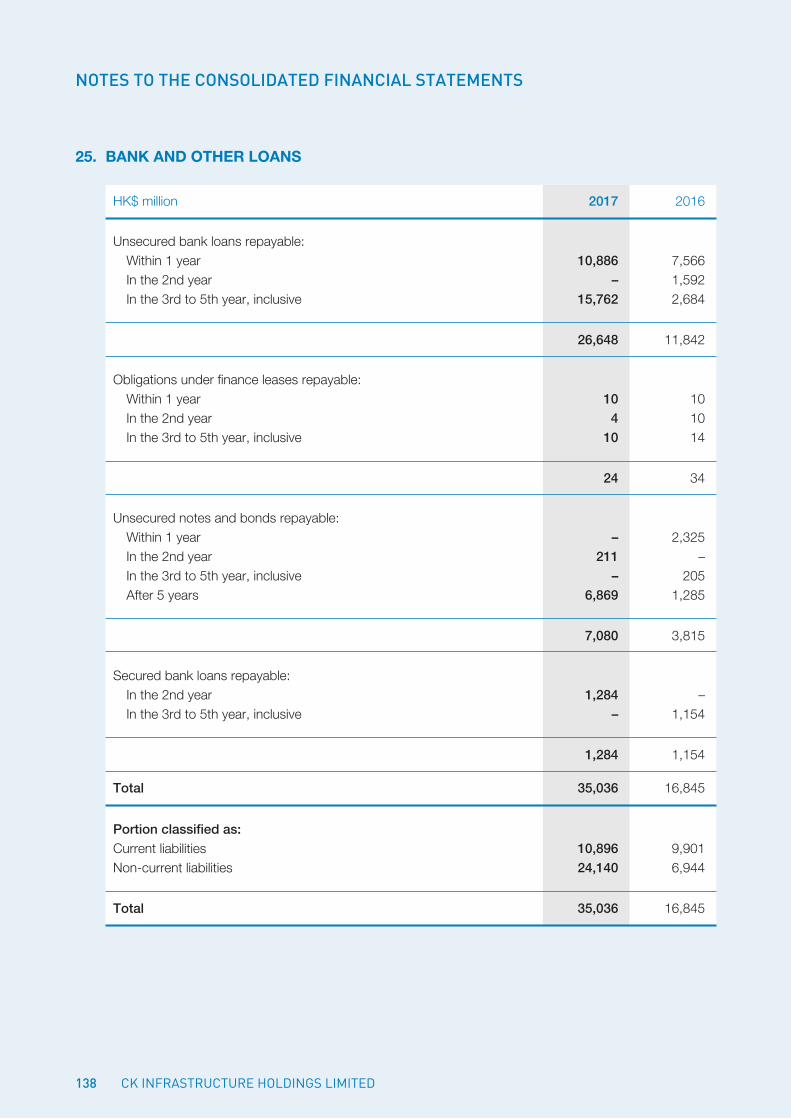
138
NOTES TO THE CONSOLIDATED FINANCIAL STATEMENTS
25. Bank and other loans
HK$ million 2017 2016
Unsecured bank loans repayable: Within 1 year 10,886 7,566 In the 2nd year – 1,592 In the 3rd to 5th year, inclusive 15,762 2,684
26,648 11,842
Obligations under finance leases repayable: Within 1 year 10 10 In the 2nd year 4 10 In the 3rd to 5th year, inclusive 10 14
24 34
Unsecured notes and bonds repayable: Within 1 year – 2,325 In the 2nd year 211 – In the 3rd to 5th year, inclusive – 205 After 5 years 6,869 1,285
7,080 3,815
Secured bank loans repayable: In the 2nd year 1,284 – In the 3rd to 5th year, inclusive – 1,154
1,284 1,154
Total 35,036 16,845
Portion classified as:Current liabilities 10,896 9,901Non-current liabilities 24,140 6,944
Total 35,036 16,845
CK InfRAstRuCtuRe HoldIngs lImIted
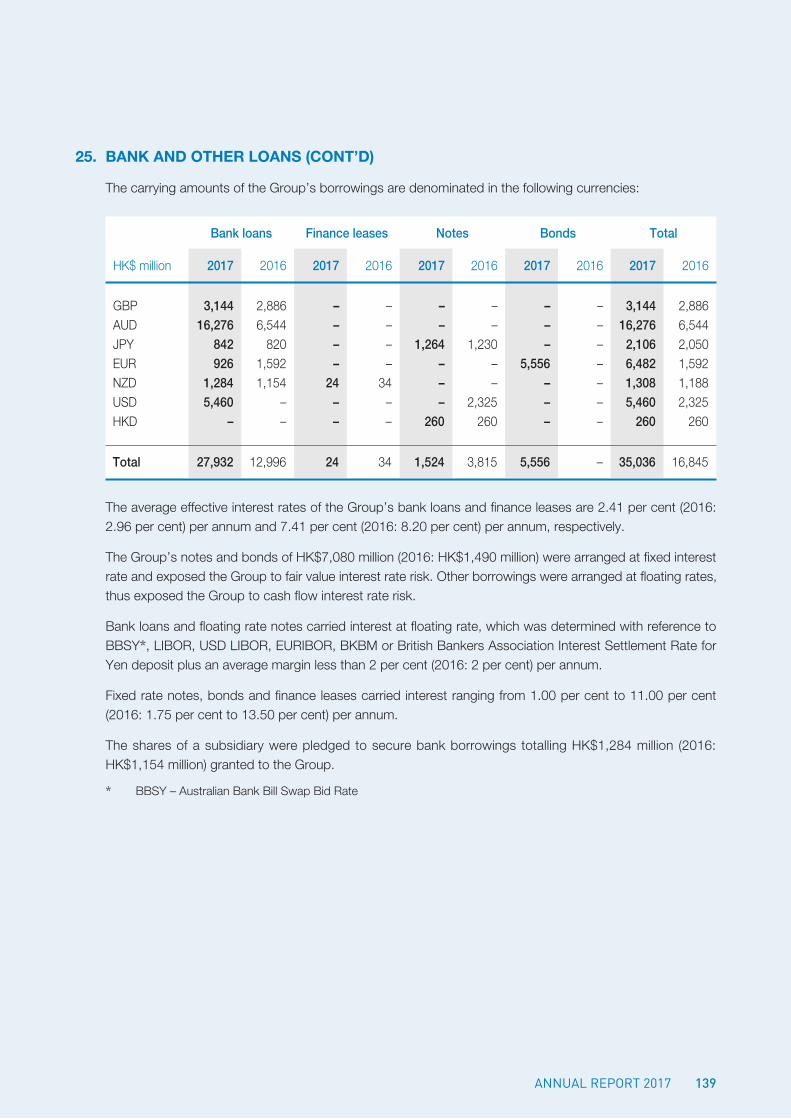
139AnnuAl RepoRt 2017
25. Bank and other loans (cont’d)
The carrying amounts of the Group’s borrowings are denominated in the following currencies:
Bank loans Finance leases Notes Bonds Total
HK$ million 2017 2016 2017 2016 2017 2016 2017 2016 2017 2016
GBP 3,144 2,886 – – – – – – 3,144 2,886AUD 16,276 6,544 – – – – – – 16,276 6,544JPY 842 820 – – 1,264 1,230 – – 2,106 2,050EUR 926 1,592 – – – – 5,556 – 6,482 1,592NZD 1,284 1,154 24 34 – – – – 1,308 1,188USD 5,460 – – – – 2,325 – – 5,460 2,325HKD – – – – 260 260 – – 260 260
Total 27,932 12,996 24 34 1,524 3,815 5,556 – 35,036 16,845
The average effective interest rates of the Group’s bank loans and finance leases are 2.41 per cent (2016: 2.96 per cent) per annum and 7.41 per cent (2016: 8.20 per cent) per annum, respectively.
The Group’s notes and bonds of HK$7,080 million (2016: HK$1,490 million) were arranged at fixed interest rate and exposed the Group to fair value interest rate risk. Other borrowings were arranged at floating rates, thus exposed the Group to cash flow interest rate risk.
Bank loans and floating rate notes carried interest at floating rate, which was determined with reference to BBSY*, LIBOR, USD LIBOR, EURIBOR, BKBM or British Bankers Association Interest Settlement Rate for Yen deposit plus an average margin less than 2 per cent (2016: 2 per cent) per annum.
Fixed rate notes, bonds and finance leases carried interest ranging from 1.00 per cent to 11.00 per cent (2016: 1.75 per cent to 13.50 per cent) per annum.
The shares of a subsidiary were pledged to secure bank borrowings totalling HK$1,284 million (2016: HK$1,154 million) granted to the Group.
* BBSY – Australian Bank Bill Swap Bid Rate
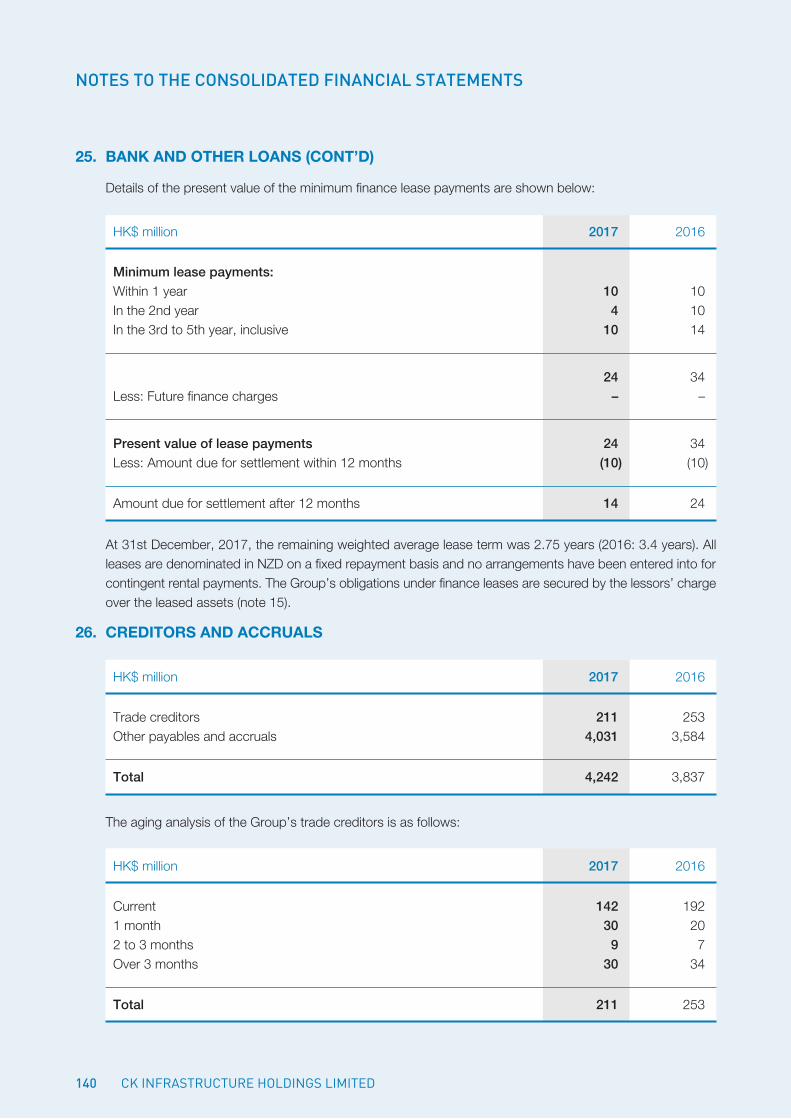
140
NOTES TO THE CONSOLIDATED FINANCIAL STATEMENTS
25. Bank and other loans (cont’d)
Details of the present value of the minimum finance lease payments are shown below:
HK$ million 2017 2016
Minimum lease payments:Within 1 year 10 10In the 2nd year 4 10In the 3rd to 5th year, inclusive 10 14
24 34Less: Future finance charges – –
Present value of lease payments 24 34Less: Amount due for settlement within 12 months (10) (10)
Amount due for settlement after 12 months 14 24
At 31st December, 2017, the remaining weighted average lease term was 2.75 years (2016: 3.4 years). All leases are denominated in NZD on a fixed repayment basis and no arrangements have been entered into for contingent rental payments. The Group’s obligations under finance leases are secured by the lessors’ charge over the leased assets (note 15).
26. creditors and accruals
HK$ million 2017 2016
Trade creditors 211 253Other payables and accruals 4,031 3,584
Total 4,242 3,837
The aging analysis of the Group’s trade creditors is as follows:
HK$ million 2017 2016
Current 142 1921 month 30 202 to 3 months 9 7Over 3 months 30 34
Total 211 253
CK InfRAstRuCtuRe HoldIngs lImIted
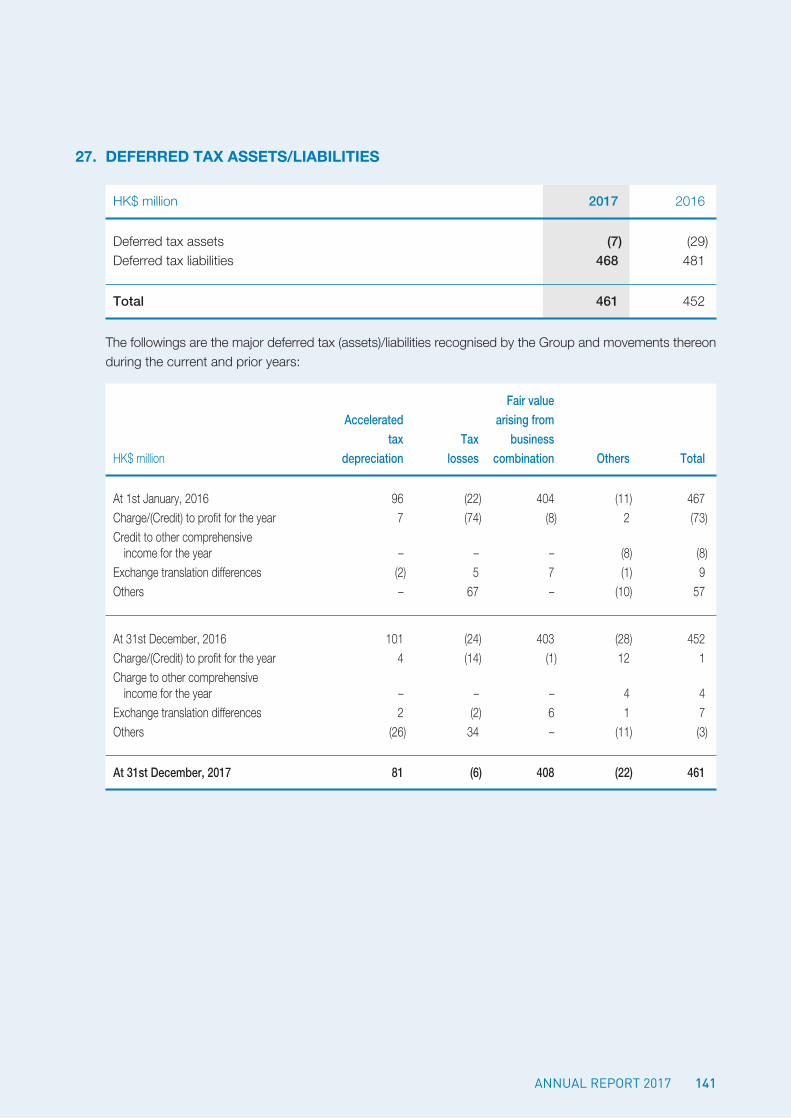
141AnnuAl RepoRt 2017
27. deFerred tax assets/liaBilities
HK$ million 2017 2016
Deferred tax assets (7) (29)Deferred tax liabilities 468 481
Total 461 452
The followings are the major deferred tax (assets)/liabilities recognised by the Group and movements thereon during the current and prior years:
Fair value Accelerated arising from tax Tax businessHK$ million depreciation losses combination Others Total
At 1st January, 2016 96 (22) 404 (11) 467Charge/(Credit) to profit for the year 7 (74) (8) 2 (73)Credit to other comprehensive income for the year – – – (8) (8)Exchange translation differences (2) 5 7 (1) 9Others – 67 – (10) 57
At 31st December, 2016 101 (24) 403 (28) 452Charge/(Credit) to profit for the year 4 (14) (1) 12 1Charge to other comprehensive income for the year – – – 4 4Exchange translation differences 2 (2) 6 1 7Others (26) 34 – (11) (3)
At 31st December, 2017 81 (6) 408 (22) 461
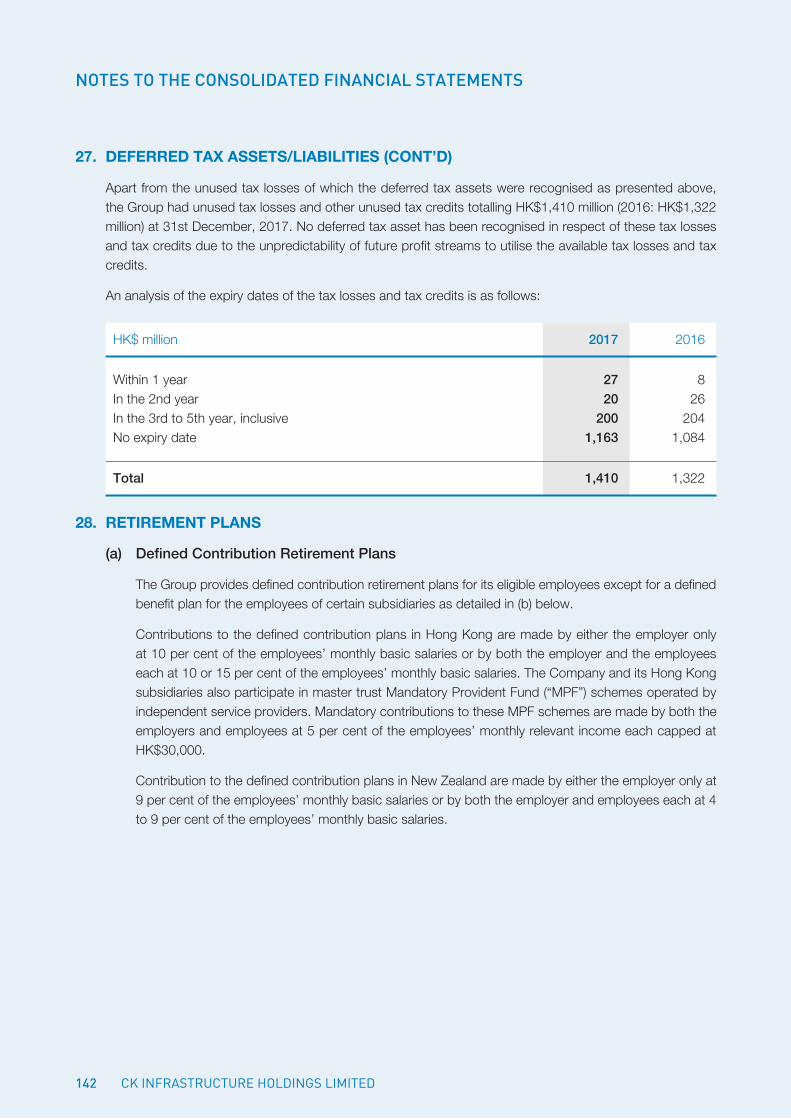
142
NOTES TO THE CONSOLIDATED FINANCIAL STATEMENTS
27. deFerred tax assets/liaBilities (cont’d)
Apart from the unused tax losses of which the deferred tax assets were recognised as presented above, the Group had unused tax losses and other unused tax credits totalling HK$1,410 million (2016: HK$1,322 million) at 31st December, 2017. No deferred tax asset has been recognised in respect of these tax losses and tax credits due to the unpredictability of future profit streams to utilise the available tax losses and tax credits.
An analysis of the expiry dates of the tax losses and tax credits is as follows:
HK$ million 2017 2016
Within 1 year 27 8In the 2nd year 20 26In the 3rd to 5th year, inclusive 200 204No expiry date 1,163 1,084
Total 1,410 1,322
28. retirement Plans
(a) Defined Contribution Retirement Plans
The Group provides defined contribution retirement plans for its eligible employees except for a defined benefit plan for the employees of certain subsidiaries as detailed in (b) below.
Contributions to the defined contribution plans in Hong Kong are made by either the employer only at 10 per cent of the employees’ monthly basic salaries or by both the employer and the employees each at 10 or 15 per cent of the employees’ monthly basic salaries. The Company and its Hong Kong subsidiaries also participate in master trust Mandatory Provident Fund (“MPF”) schemes operated by independent service providers. Mandatory contributions to these MPF schemes are made by both the employers and employees at 5 per cent of the employees’ monthly relevant income each capped at HK$30,000.
Contribution to the defined contribution plans in New Zealand are made by either the employer only at 9 per cent of the employees’ monthly basic salaries or by both the employer and employees each at 4 to 9 per cent of the employees’ monthly basic salaries.
CK InfRAstRuCtuRe HoldIngs lImIted
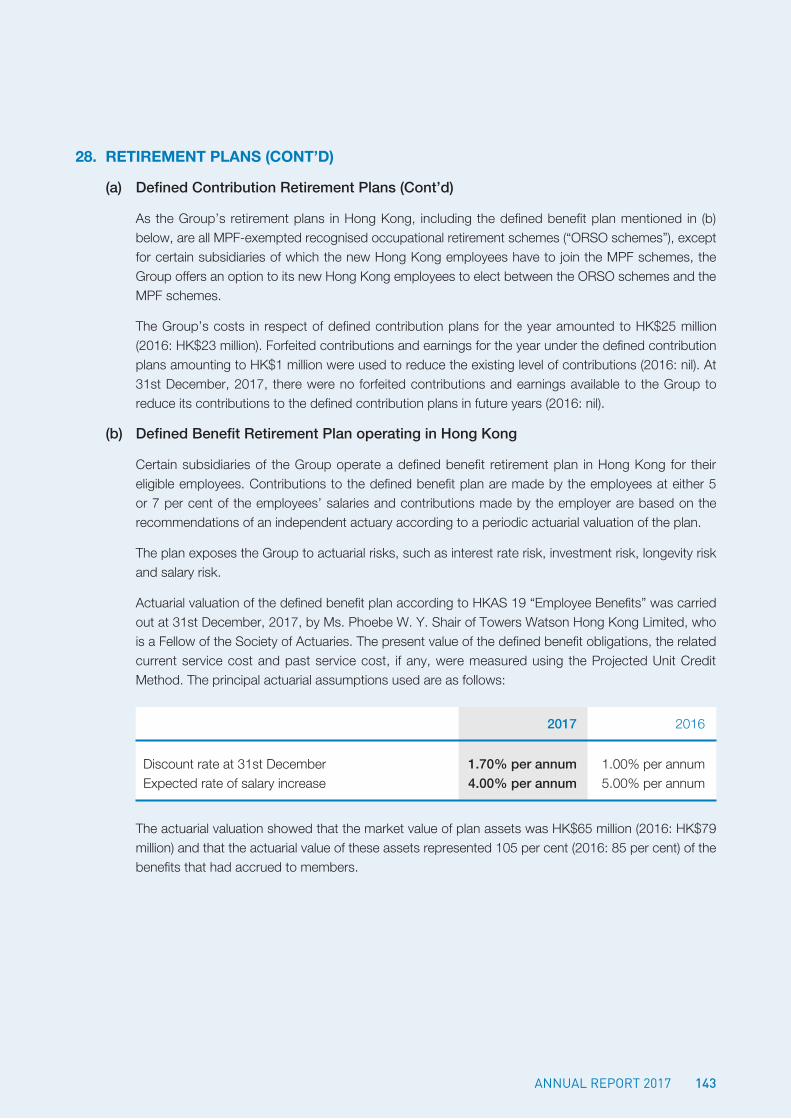
143AnnuAl RepoRt 2017
28. retirement Plans (cont’d)
(a) Defined Contribution Retirement Plans (Cont’d)
As the Group’s retirement plans in Hong Kong, including the defined benefit plan mentioned in (b) below, are all MPF-exempted recognised occupational retirement schemes (“ORSO schemes”), except for certain subsidiaries of which the new Hong Kong employees have to join the MPF schemes, the Group offers an option to its new Hong Kong employees to elect between the ORSO schemes and the MPF schemes.
The Group’s costs in respect of defined contribution plans for the year amounted to HK$25 million (2016: HK$23 million). Forfeited contributions and earnings for the year under the defined contribution plans amounting to HK$1 million were used to reduce the existing level of contributions (2016: nil). At 31st December, 2017, there were no forfeited contributions and earnings available to the Group to reduce its contributions to the defined contribution plans in future years (2016: nil).
(b) Defined Benefit Retirement Plan operating in Hong Kong
Certain subsidiaries of the Group operate a defined benefit retirement plan in Hong Kong for their eligible employees. Contributions to the defined benefit plan are made by the employees at either 5 or 7 per cent of the employees’ salaries and contributions made by the employer are based on the recommendations of an independent actuary according to a periodic actuarial valuation of the plan.
The plan exposes the Group to actuarial risks, such as interest rate risk, investment risk, longevity risk and salary risk.
Actuarial valuation of the defined benefit plan according to HKAS 19 “Employee Benefits” was carried out at 31st December, 2017, by Ms. Phoebe W. Y. Shair of Towers Watson Hong Kong Limited, who is a Fellow of the Society of Actuaries. The present value of the defined benefit obligations, the related current service cost and past service cost, if any, were measured using the Projected Unit Credit Method. The principal actuarial assumptions used are as follows:
2017 2016
Discount rate at 31st December 1.70% per annum 1.00% per annumExpected rate of salary increase 4.00% per annum 5.00% per annum
The actuarial valuation showed that the market value of plan assets was HK$65 million (2016: HK$79 million) and that the actuarial value of these assets represented 105 per cent (2016: 85 per cent) of the benefits that had accrued to members.
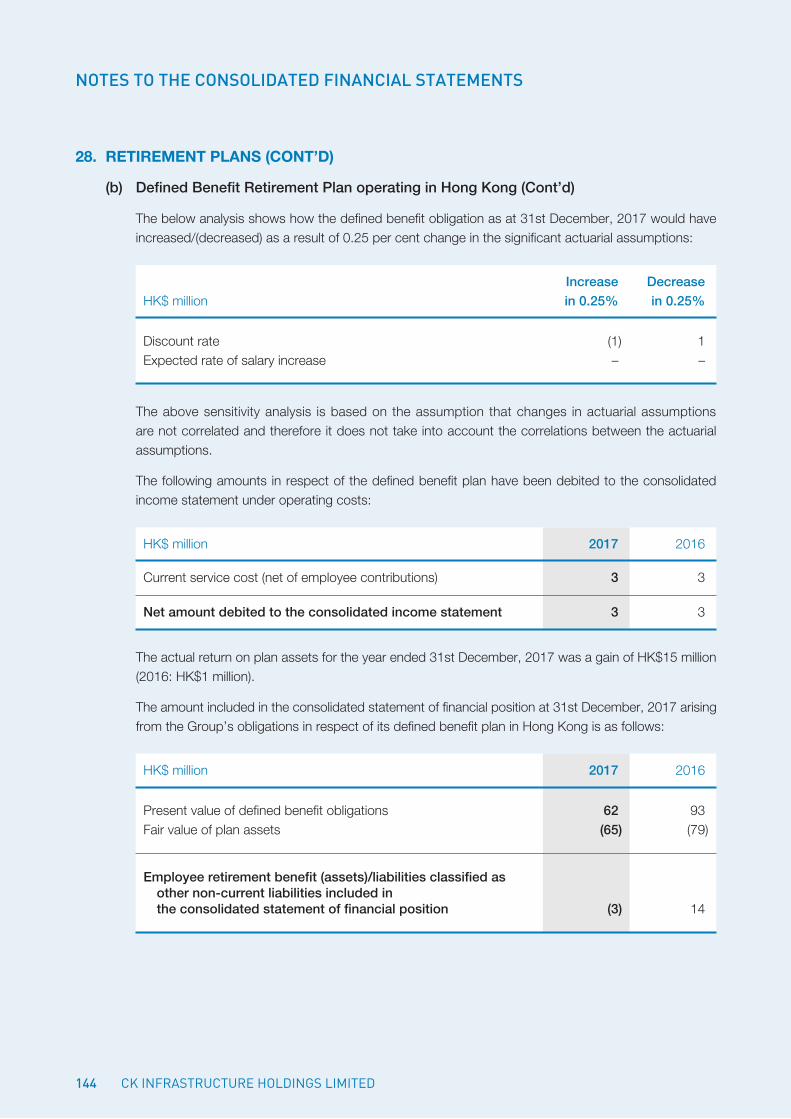
144
NOTES TO THE CONSOLIDATED FINANCIAL STATEMENTS
28. retirement Plans (cont’d)
(b) Defined Benefit Retirement Plan operating in Hong Kong (Cont’d)
The below analysis shows how the defined benefit obligation as at 31st December, 2017 would have increased/(decreased) as a result of 0.25 per cent change in the significant actuarial assumptions:
Increase DecreaseHK$ million in 0.25% in 0.25%
Discount rate (1) 1Expected rate of salary increase – –
The above sensitivity analysis is based on the assumption that changes in actuarial assumptions are not correlated and therefore it does not take into account the correlations between the actuarial assumptions.
The following amounts in respect of the defined benefit plan have been debited to the consolidated income statement under operating costs:
HK$ million 2017 2016
Current service cost (net of employee contributions) 3 3
Net amount debited to the consolidated income statement 3 3
The actual return on plan assets for the year ended 31st December, 2017 was a gain of HK$15 million (2016: HK$1 million).
The amount included in the consolidated statement of financial position at 31st December, 2017 arising from the Group’s obligations in respect of its defined benefit plan in Hong Kong is as follows:
HK$ million 2017 2016
Present value of defined benefit obligations 62 93Fair value of plan assets (65) (79)
Employee retirement benefit (assets)/liabilities classified as other non-current liabilities included in the consolidated statement of financial position (3) 14
CK InfRAstRuCtuRe HoldIngs lImIted
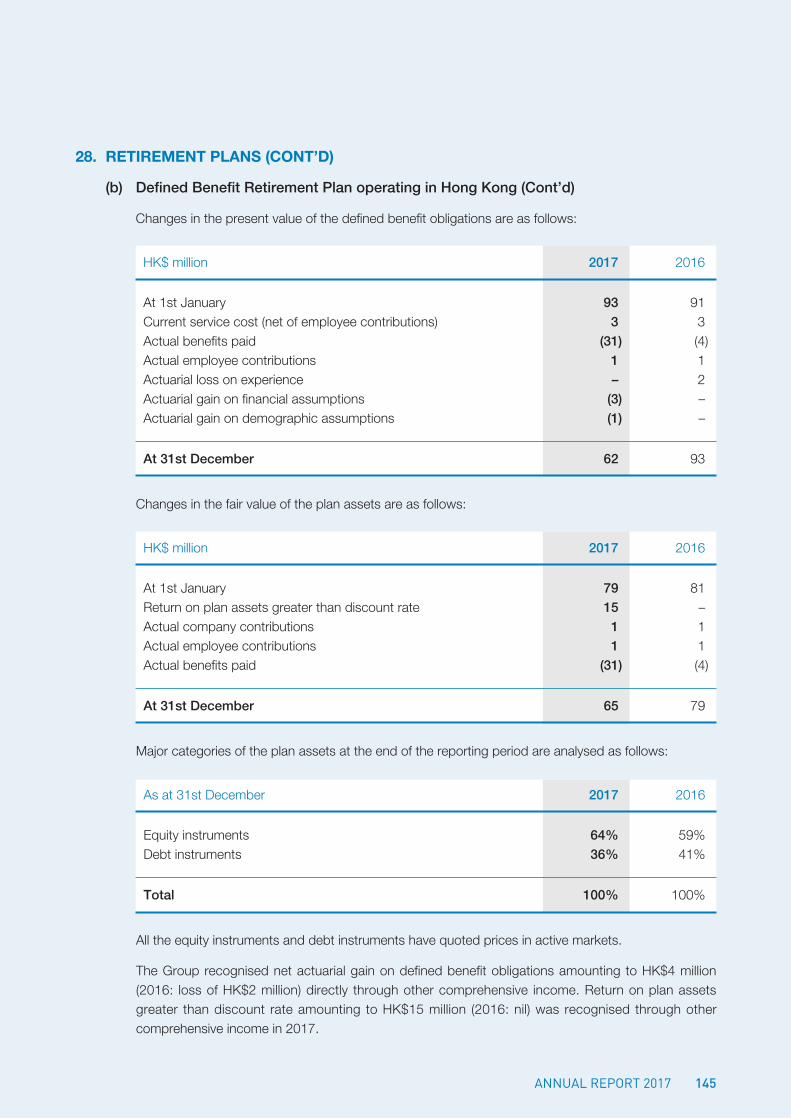
145AnnuAl RepoRt 2017
28. retirement Plans (cont’d)
(b) Defined Benefit Retirement Plan operating in Hong Kong (Cont’d)
Changes in the present value of the defined benefit obligations are as follows:
HK$ million 2017 2016
At 1st January 93 91Current service cost (net of employee contributions) 3 3Actual benefits paid (31) (4)Actual employee contributions 1 1Actuarial loss on experience – 2Actuarial gain on financial assumptions (3) –Actuarial gain on demographic assumptions (1) –
At 31st December 62 93
Changes in the fair value of the plan assets are as follows:
HK$ million 2017 2016
At 1st January 79 81Return on plan assets greater than discount rate 15 –Actual company contributions 1 1Actual employee contributions 1 1Actual benefits paid (31) (4)
At 31st December 65 79
Major categories of the plan assets at the end of the reporting period are analysed as follows:
As at 31st December 2017 2016
Equity instruments 64% 59%Debt instruments 36% 41%
Total 100% 100%
All the equity instruments and debt instruments have quoted prices in active markets.
The Group recognised net actuarial gain on defined benefit obligations amounting to HK$4 million (2016: loss of HK$2 million) directly through other comprehensive income. Return on plan assets greater than discount rate amounting to HK$15 million (2016: nil) was recognised through other comprehensive income in 2017.
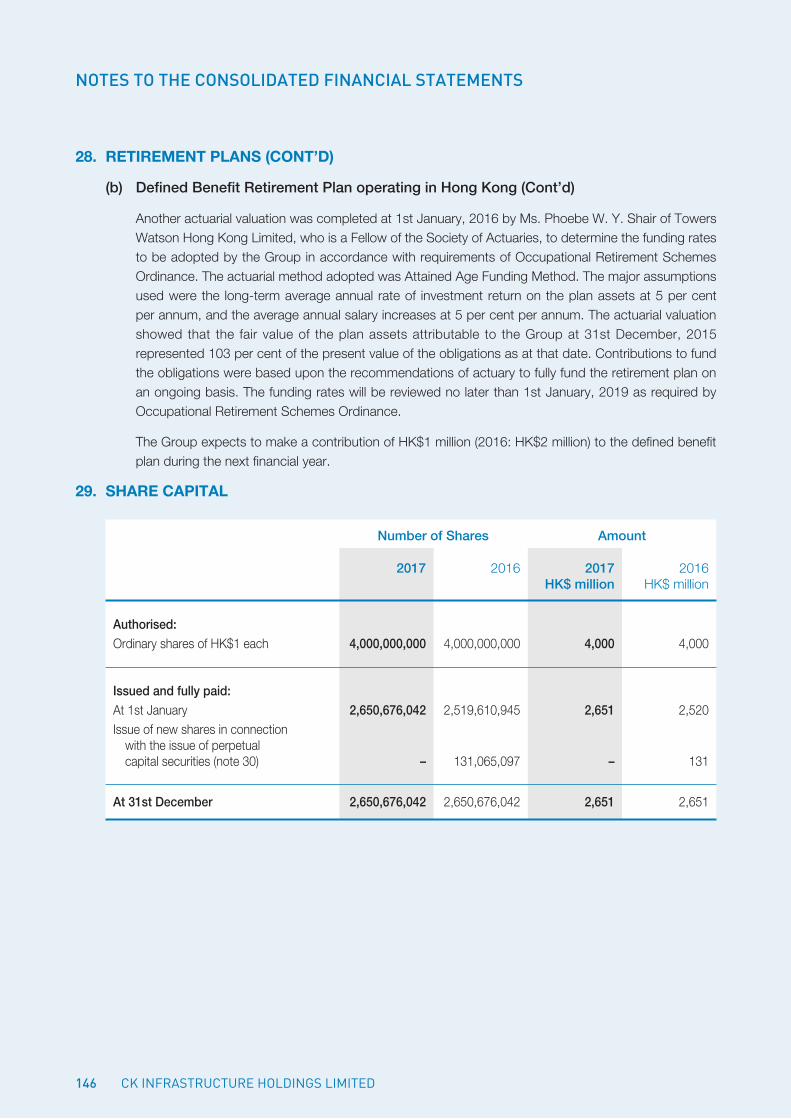
146
NOTES TO THE CONSOLIDATED FINANCIAL STATEMENTS
28. retirement Plans (cont’d)
(b) Defined Benefit Retirement Plan operating in Hong Kong (Cont’d)
Another actuarial valuation was completed at 1st January, 2016 by Ms. Phoebe W. Y. Shair of Towers Watson Hong Kong Limited, who is a Fellow of the Society of Actuaries, to determine the funding rates to be adopted by the Group in accordance with requirements of Occupational Retirement Schemes Ordinance. The actuarial method adopted was Attained Age Funding Method. The major assumptions used were the long-term average annual rate of investment return on the plan assets at 5 per cent per annum, and the average annual salary increases at 5 per cent per annum. The actuarial valuation showed that the fair value of the plan assets attributable to the Group at 31st December, 2015 represented 103 per cent of the present value of the obligations as at that date. Contributions to fund the obligations were based upon the recommendations of actuary to fully fund the retirement plan on an ongoing basis. The funding rates will be reviewed no later than 1st January, 2019 as required by Occupational Retirement Schemes Ordinance.
The Group expects to make a contribution of HK$1 million (2016: HK$2 million) to the defined benefit plan during the next financial year.
29. share caPital
Number of Shares Amount
2017 2016 2017 2016 HK$ million HK$ million
Authorised:Ordinary shares of HK$1 each 4,000,000,000 4,000,000,000 4,000 4,000
Issued and fully paid:At 1st January 2,650,676,042 2,519,610,945 2,651 2,520Issue of new shares in connection with the issue of perpetual capital securities (note 30) – 131,065,097 – 131
At 31st December 2,650,676,042 2,650,676,042 2,651 2,651
CK InfRAstRuCtuRe HoldIngs lImIted
147AnnuAl RepoRt 2017
30. PerPetual caPital securities
On 29th September, 2010, the Group issued US$1,000 million 6.625 per cent guaranteed perpetual capital securities at an issue price of 100 per cent. These perpetual capital securities were issued for general corporate funding purposes. Distributions on these perpetual capital securities are paid semi-annually in arrears from 29th March, 2011 and may be deferred at the discretion of the Group. These perpetual capital securities have no fixed maturity and are redeemable at the Group’s option on or after 29th September, 2015 at their principal amounts together with any accrued, unpaid or deferred distributions. While any distributions are unpaid or deferred, the Company will not declare, pay dividends or make distributions or similar periodic payments in respect of, or repurchase, redeem or otherwise acquire any securities of lower or equal rank.
On 29th March, 2016, the Company redeemed these perpetual capital securities by paying US$1,033.1 million, being US$1,000 million outstanding principal and US$33.1 million accrued distribution up to 29th March, 2016, to the securities owner.
On 1st March, 2016, OVPH Limited (the “Issuer”) issued US$1,200 million perpetual capital securities which are guaranteed by the Company and listed on Hong Kong Stock Exchange at an issue price of 100 per cent. Distribution is payable semi-annually in arrear based on a fixed rate, which is 5.875 per cent per annum. Distribution by the Issuer may be deferred at its sole discretion. These perpetual capital securities have no fixed maturity and are redeemable in whole, but not in part, at the Issuer’s option on 1st March, 2021, or any distribution payment date falling thereafter at their principal amounts together with any accrued, unpaid or deferred distributions. While any distributions are unpaid or deferred, the Company will not declare, pay dividends or make distributions or similar periodic payments in respect of, or repurchase, redeem or otherwise acquire any securities of lower or equal rank.
On 2nd March, 2016, the Company issued 131,065,097 new ordinary shares to the Issuer for a consideration of approximately US$1,200 million (equivalent to approximately HK$9,360 million). The net proceeds for the shares issued were approximately HK$9,245 million. The shares were issued in connection with the issue of the above perpetual capital securities. A swap agreement dated 1st March, 2016 was entered into between the Company and the Issuer under which the Issuer is obliged to act in accordance with directions from the Company on certain matters. As a result, these shares were accounted for as treasury shares.
148
NOTES TO THE CONSOLIDATED FINANCIAL STATEMENTS
30. PerPetual caPital securities (cont’d)
On 23rd August, 2017, the Group issued US$500 million 4.85 per cent guaranteed perpetual capital securities at an issue price of 100 per cent. These perpetual capital securities were issued for general corporate funding purposes. Distributions on these perpetual capital securities are paid semi-annually in arrears from 23rd August, 2017 and may be deferred at the discretion of the Group. These perpetual capital securities have no fixed maturity and are redeemable at the Group’s option on or after 23rd August, 2022 at their principal amounts together with any accrued, unpaid or deferred distributions. While any distributions are unpaid or deferred, the Company will not declare, pay dividends or make distributions or similar periodic payments in respect of, or repurchase, redeem or otherwise acquire any securities of lower or equal rank.
On 3rd November, 2017, the Group issued US$150 million 4.85 per cent guaranteed perpetual capital securities at an issue price of 100 per cent plus an amount corresponding to accrued distribution from and including 23rd August, 2017 to, but excluding 3rd November, 2017. The perpetual capital securities were issued for general corporate funding purposes. Distributions on these perpetual capital securities are paid from 23rd August, 2017 and may be deferred at the discretion of the Group. These perpetual capital securities have no fixed maturity and are redeemable at the Group’s option on or after 23rd August, 2022 at their principal amounts together with any accrued, unpaid or deferred distributions. While any distributions are unpaid or deferred, the Company will not declare, pay dividends or make distributions or similar periodic payments in respect of, or repurchase, redeem or otherwise acquire any securities of lower or equal rank.
CK InfRAstRuCtuRe HoldIngs lImIted
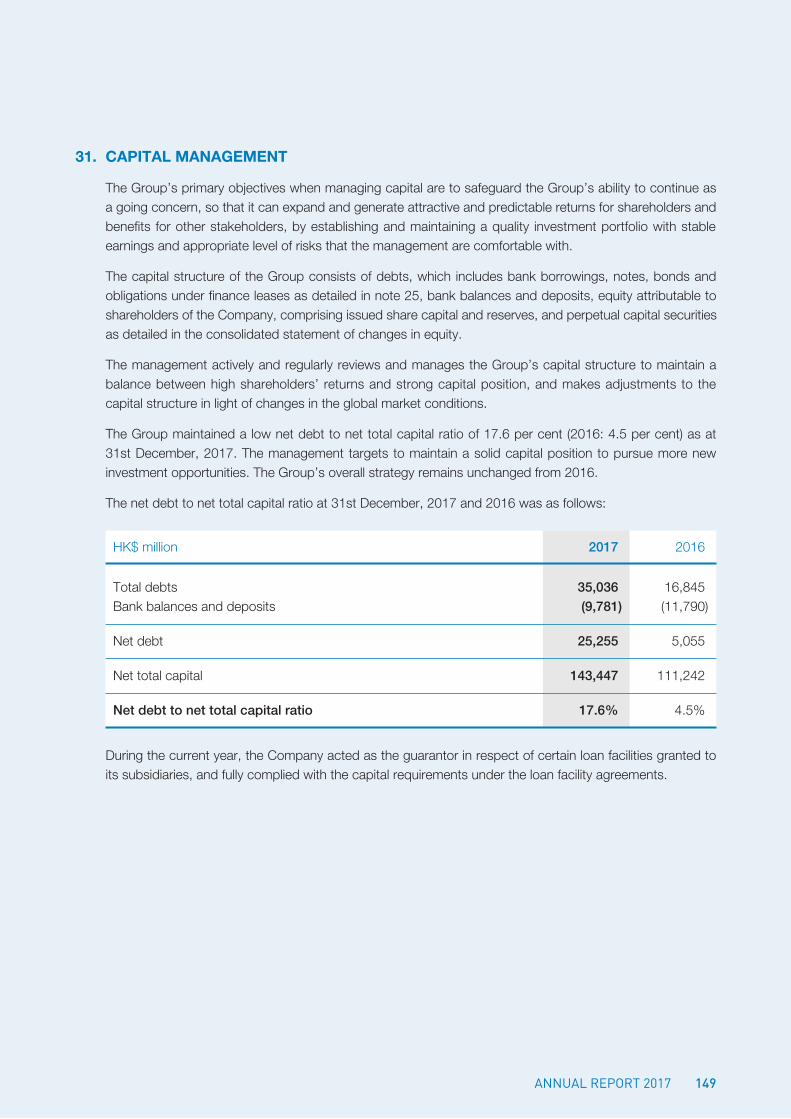
149AnnuAl RepoRt 2017
31. caPital manaGement
The Group’s primary objectives when managing capital are to safeguard the Group’s ability to continue as a going concern, so that it can expand and generate attractive and predictable returns for shareholders and benefits for other stakeholders, by establishing and maintaining a quality investment portfolio with stable earnings and appropriate level of risks that the management are comfortable with.
The capital structure of the Group consists of debts, which includes bank borrowings, notes, bonds and obligations under finance leases as detailed in note 25, bank balances and deposits, equity attributable to shareholders of the Company, comprising issued share capital and reserves, and perpetual capital securities as detailed in the consolidated statement of changes in equity.
The management actively and regularly reviews and manages the Group’s capital structure to maintain a balance between high shareholders’ returns and strong capital position, and makes adjustments to the capital structure in light of changes in the global market conditions.
The Group maintained a low net debt to net total capital ratio of 17.6 per cent (2016: 4.5 per cent) as at 31st December, 2017. The management targets to maintain a solid capital position to pursue more new investment opportunities. The Group’s overall strategy remains unchanged from 2016.
The net debt to net total capital ratio at 31st December, 2017 and 2016 was as follows:
HK$ million 2017 2016
Total debts 35,036 16,845Bank balances and deposits (9,781) (11,790)
Net debt 25,255 5,055
Net total capital 143,447 111,242
Net debt to net total capital ratio 17.6% 4.5%
During the current year, the Company acted as the guarantor in respect of certain loan facilities granted to its subsidiaries, and fully complied with the capital requirements under the loan facility agreements.
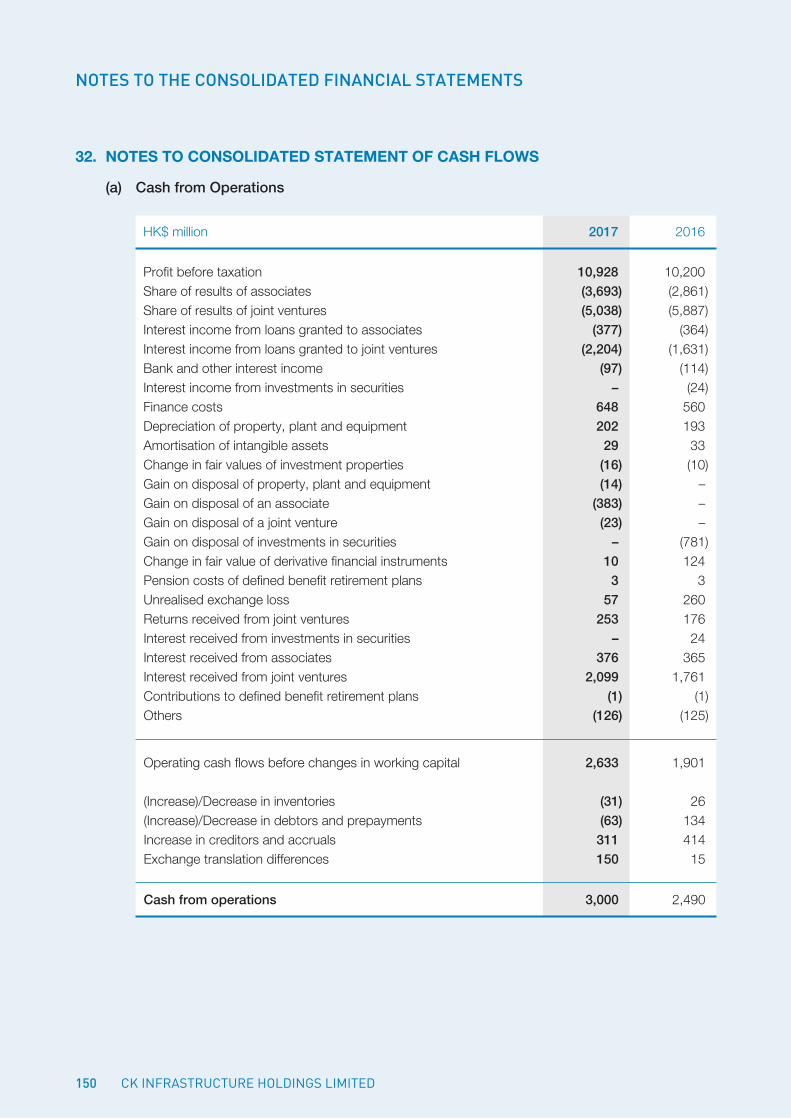
150
NOTES TO THE CONSOLIDATED FINANCIAL STATEMENTS
32. notes to consolidated statement oF cash Flows
(a) Cash from Operations
HK$ million 2017 2016
Profit before taxation 10,928 10,200Share of results of associates (3,693) (2,861)Share of results of joint ventures (5,038) (5,887)Interest income from loans granted to associates (377) (364)Interest income from loans granted to joint ventures (2,204) (1,631)Bank and other interest income (97) (114)Interest income from investments in securities – (24)Finance costs 648 560Depreciation of property, plant and equipment 202 193Amortisation of intangible assets 29 33Change in fair values of investment properties (16) (10)Gain on disposal of property, plant and equipment (14) –Gain on disposal of an associate (383) –Gain on disposal of a joint venture (23) –Gain on disposal of investments in securities – (781)Change in fair value of derivative financial instruments 10 124Pension costs of defined benefit retirement plans 3 3Unrealised exchange loss 57 260Returns received from joint ventures 253 176Interest received from investments in securities – 24Interest received from associates 376 365Interest received from joint ventures 2,099 1,761Contributions to defined benefit retirement plans (1) (1)Others (126) (125)
Operating cash flows before changes in working capital 2,633 1,901
(Increase)/Decrease in inventories (31) 26(Increase)/Decrease in debtors and prepayments (63) 134Increase in creditors and accruals 311 414Exchange translation differences 150 15
Cash from operations 3,000 2,490
CK InfRAstRuCtuRe HoldIngs lImIted
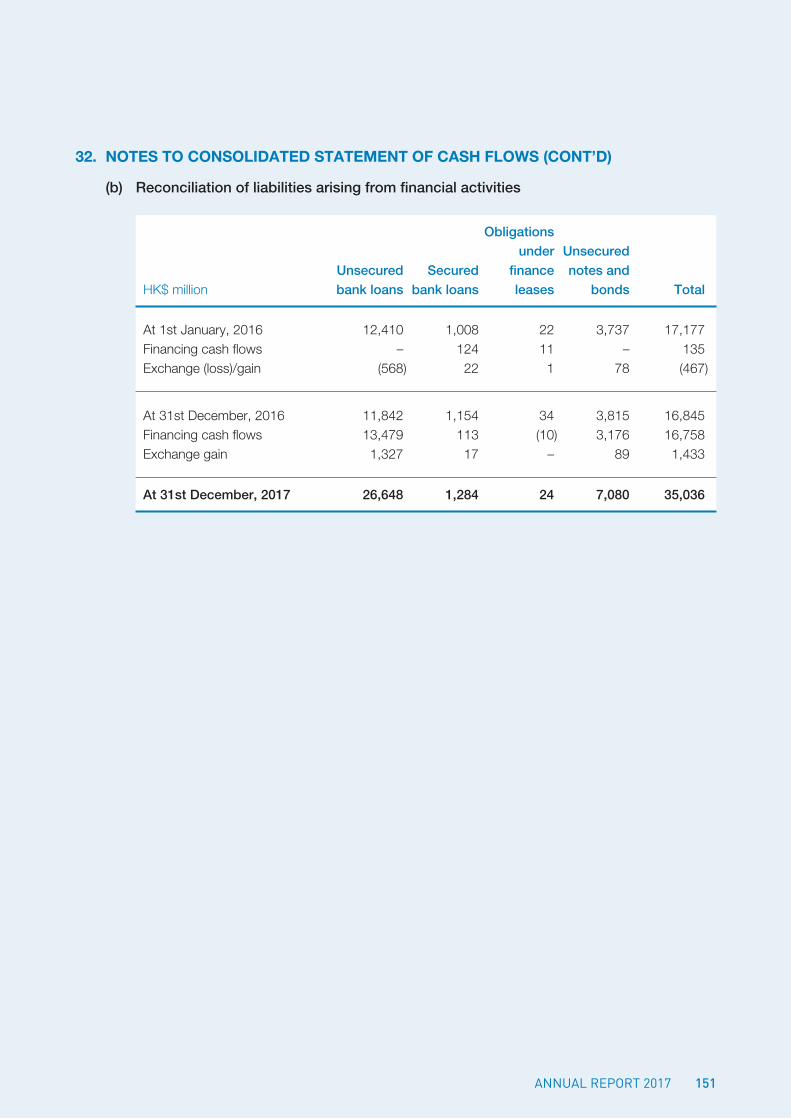
151AnnuAl RepoRt 2017
32. notes to consolidated statement oF cash Flows (cont’d)
(b) Reconciliation of liabilities arising from financial activities
Obligations under Unsecured Unsecured Secured finance notes andHK$ million bank loans bank loans leases bonds Total
At 1st January, 2016 12,410 1,008 22 3,737 17,177Financing cash flows – 124 11 – 135Exchange (loss)/gain (568) 22 1 78 (467)
At 31st December, 2016 11,842 1,154 34 3,815 16,845Financing cash flows 13,479 113 (10) 3,176 16,758Exchange gain 1,327 17 – 89 1,433
At 31st December, 2017 26,648 1,284 24 7,080 35,036
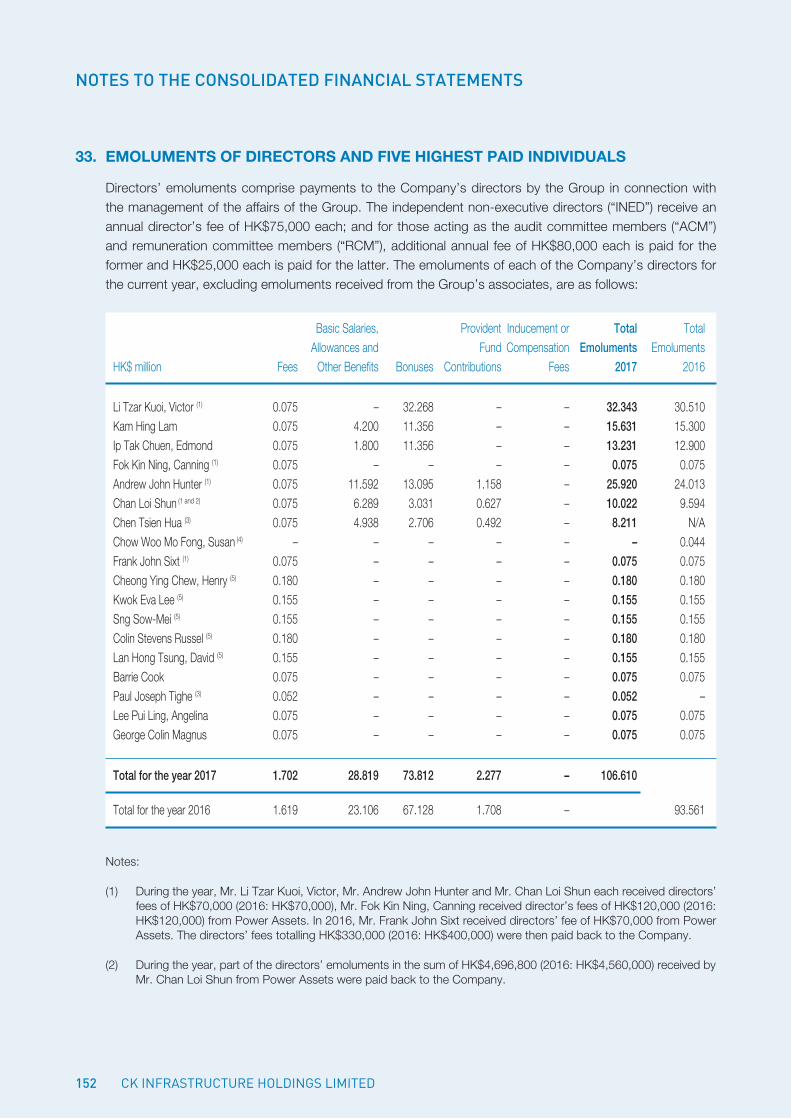
152
NOTES TO THE CONSOLIDATED FINANCIAL STATEMENTS
33. emoluments oF directors and Five hiGhest Paid individuals
Directors’ emoluments comprise payments to the Company’s directors by the Group in connection with the management of the affairs of the Group. The independent non-executive directors (“INED”) receive an annual director’s fee of HK$75,000 each; and for those acting as the audit committee members (“ACM”) and remuneration committee members (“RCM”), additional annual fee of HK$80,000 each is paid for the former and HK$25,000 each is paid for the latter. The emoluments of each of the Company’s directors for the current year, excluding emoluments received from the Group’s associates, are as follows:
Basic Salaries, Provident Inducement or Total Total Allowances and Fund Compensation Emoluments EmolumentsHK$ million Fees Other Benefits Bonuses Contributions Fees 2017 2016
Li Tzar Kuoi, Victor (1) 0.075 – 32.268 – – 32.343 30.510Kam Hing Lam 0.075 4.200 11.356 – – 15.631 15.300Ip Tak Chuen, Edmond 0.075 1.800 11.356 – – 13.231 12.900Fok Kin Ning, Canning (1) 0.075 – – – – 0.075 0.075Andrew John Hunter (1) 0.075 11.592 13.095 1.158 – 25.920 24.013Chan Loi Shun (1 and 2) 0.075 6.289 3.031 0.627 – 10.022 9.594Chen Tsien Hua (3) 0.075 4.938 2.706 0.492 – 8.211 N/AChow Woo Mo Fong, Susan (4) – – – – – – 0.044Frank John Sixt (1) 0.075 – – – – 0.075 0.075Cheong Ying Chew, Henry (5) 0.180 – – – – 0.180 0.180Kwok Eva Lee (5) 0.155 – – – – 0.155 0.155Sng Sow-Mei (5) 0.155 – – – – 0.155 0.155Colin Stevens Russel (5) 0.180 – – – – 0.180 0.180Lan Hong Tsung, David (5) 0.155 – – – – 0.155 0.155Barrie Cook 0.075 – – – – 0.075 0.075Paul Joseph Tighe (3) 0.052 – – – – 0.052 –Lee Pui Ling, Angelina 0.075 – – – – 0.075 0.075George Colin Magnus 0.075 – – – – 0.075 0.075
Total for the year 2017 1.702 28.819 73.812 2.277 – 106.610
Total for the year 2016 1.619 23.106 67.128 1.708 – 93.561
Notes:
(1) During the year, Mr. Li Tzar Kuoi, Victor, Mr. Andrew John Hunter and Mr. Chan Loi Shun each received directors’ fees of HK$70,000 (2016: HK$70,000), Mr. Fok Kin Ning, Canning received director’s fees of HK$120,000 (2016: HK$120,000) from Power Assets. In 2016, Mr. Frank John Sixt received directors’ fee of HK$70,000 from Power Assets. The directors’ fees totalling HK$330,000 (2016: HK$400,000) were then paid back to the Company.
(2) During the year, part of the directors’ emoluments in the sum of HK$4,696,800 (2016: HK$4,560,000) received by Mr. Chan Loi Shun from Power Assets were paid back to the Company.
CK InfRAstRuCtuRe HoldIngs lImIted
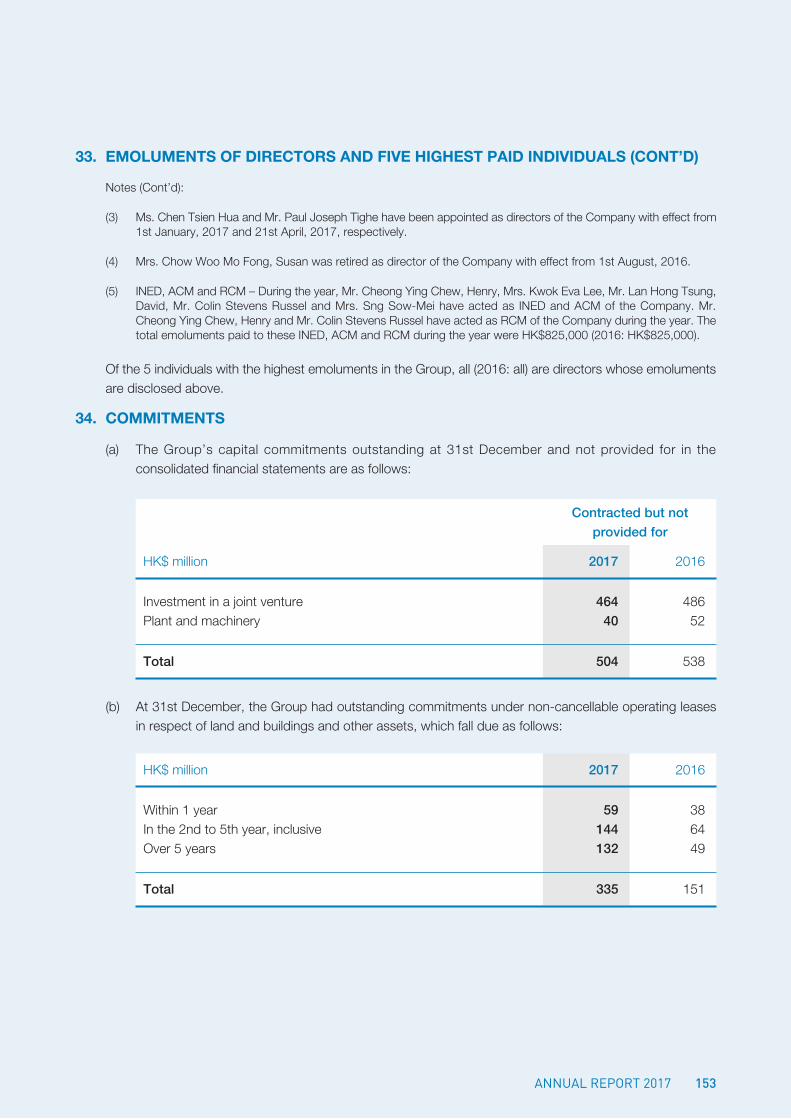
153AnnuAl RepoRt 2017
33. emoluments oF directors and Five hiGhest Paid individuals (cont’d)
Notes (Cont’d):
(3) Ms. Chen Tsien Hua and Mr. Paul Joseph Tighe have been appointed as directors of the Company with effect from 1st January, 2017 and 21st April, 2017, respectively.
(4) Mrs. Chow Woo Mo Fong, Susan was retired as director of the Company with effect from 1st August, 2016.
(5) INED, ACM and RCM – During the year, Mr. Cheong Ying Chew, Henry, Mrs. Kwok Eva Lee, Mr. Lan Hong Tsung, David, Mr. Colin Stevens Russel and Mrs. Sng Sow-Mei have acted as INED and ACM of the Company. Mr. Cheong Ying Chew, Henry and Mr. Colin Stevens Russel have acted as RCM of the Company during the year. The total emoluments paid to these INED, ACM and RCM during the year were HK$825,000 (2016: HK$825,000).
Of the 5 individuals with the highest emoluments in the Group, all (2016: all) are directors whose emoluments are disclosed above.
34. commitments
(a) The Group’s capital commitments outstanding at 31st December and not provided for in the consolidated financial statements are as follows:
Contracted but not provided for
HK$ million 2017 2016
Investment in a joint venture 464 486Plant and machinery 40 52
Total 504 538
(b) At 31st December, the Group had outstanding commitments under non-cancellable operating leases in respect of land and buildings and other assets, which fall due as follows:
HK$ million 2017 2016
Within 1 year 59 38In the 2nd to 5th year, inclusive 144 64Over 5 years 132 49
Total 335 151
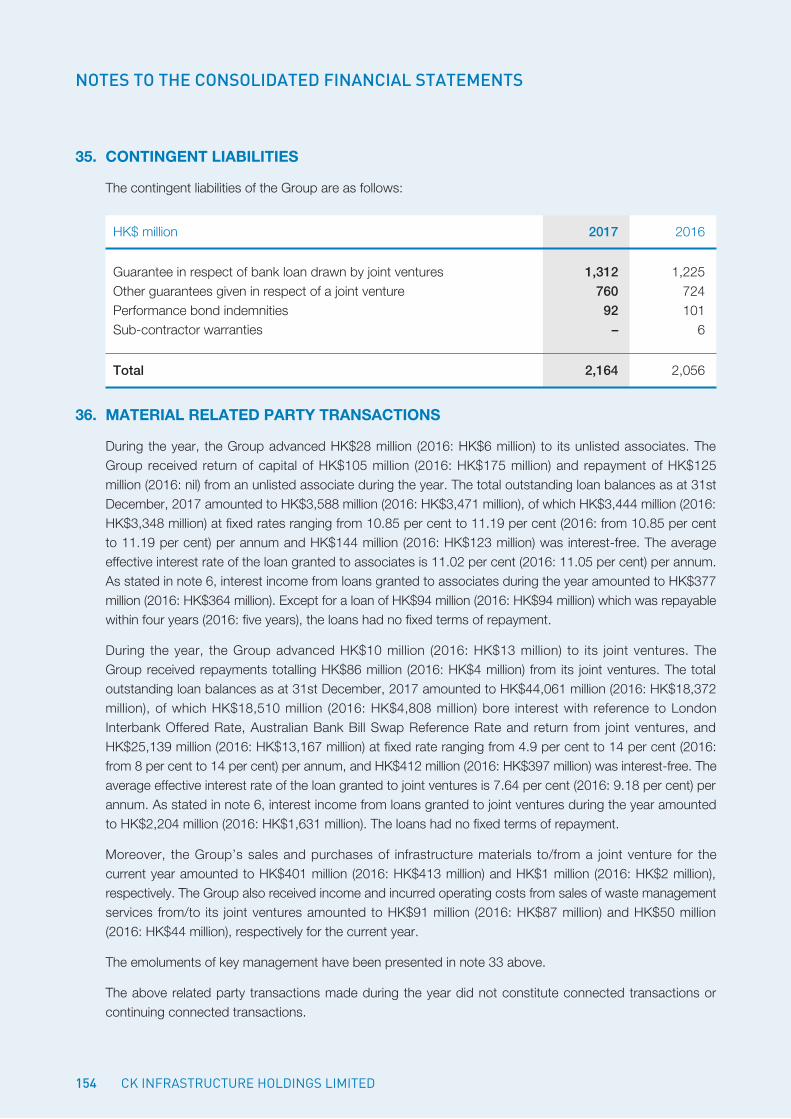
154
NOTES TO THE CONSOLIDATED FINANCIAL STATEMENTS
35. continGent liaBilities
The contingent liabilities of the Group are as follows:
HK$ million 2017 2016
Guarantee in respect of bank loan drawn by joint ventures 1,312 1,225Other guarantees given in respect of a joint venture 760 724Performance bond indemnities 92 101Sub-contractor warranties – 6
Total 2,164 2,056
36. material related Party transactions
During the year, the Group advanced HK$28 million (2016: HK$6 million) to its unlisted associates. The Group received return of capital of HK$105 million (2016: HK$175 million) and repayment of HK$125 million (2016: nil) from an unlisted associate during the year. The total outstanding loan balances as at 31st December, 2017 amounted to HK$3,588 million (2016: HK$3,471 million), of which HK$3,444 million (2016: HK$3,348 million) at fixed rates ranging from 10.85 per cent to 11.19 per cent (2016: from 10.85 per cent to 11.19 per cent) per annum and HK$144 million (2016: HK$123 million) was interest-free. The average effective interest rate of the loan granted to associates is 11.02 per cent (2016: 11.05 per cent) per annum. As stated in note 6, interest income from loans granted to associates during the year amounted to HK$377 million (2016: HK$364 million). Except for a loan of HK$94 million (2016: HK$94 million) which was repayable within four years (2016: five years), the loans had no fixed terms of repayment.
During the year, the Group advanced HK$10 million (2016: HK$13 million) to its joint ventures. The Group received repayments totalling HK$86 million (2016: HK$4 million) from its joint ventures. The total outstanding loan balances as at 31st December, 2017 amounted to HK$44,061 million (2016: HK$18,372 million), of which HK$18,510 million (2016: HK$4,808 million) bore interest with reference to London Interbank Offered Rate, Australian Bank Bill Swap Reference Rate and return from joint ventures, and HK$25,139 million (2016: HK$13,167 million) at fixed rate ranging from 4.9 per cent to 14 per cent (2016: from 8 per cent to 14 per cent) per annum, and HK$412 million (2016: HK$397 million) was interest-free. The average effective interest rate of the loan granted to joint ventures is 7.64 per cent (2016: 9.18 per cent) per annum. As stated in note 6, interest income from loans granted to joint ventures during the year amounted to HK$2,204 million (2016: HK$1,631 million). The loans had no fixed terms of repayment.
Moreover, the Group’s sales and purchases of infrastructure materials to/from a joint venture for the current year amounted to HK$401 million (2016: HK$413 million) and HK$1 million (2016: HK$2 million), respectively. The Group also received income and incurred operating costs from sales of waste management services from/to its joint ventures amounted to HK$91 million (2016: HK$87 million) and HK$50 million (2016: HK$44 million), respectively for the current year.
The emoluments of key management have been presented in note 33 above.
The above related party transactions made during the year did not constitute connected transactions or continuing connected transactions.
CK InfRAstRuCtuRe HoldIngs lImIted
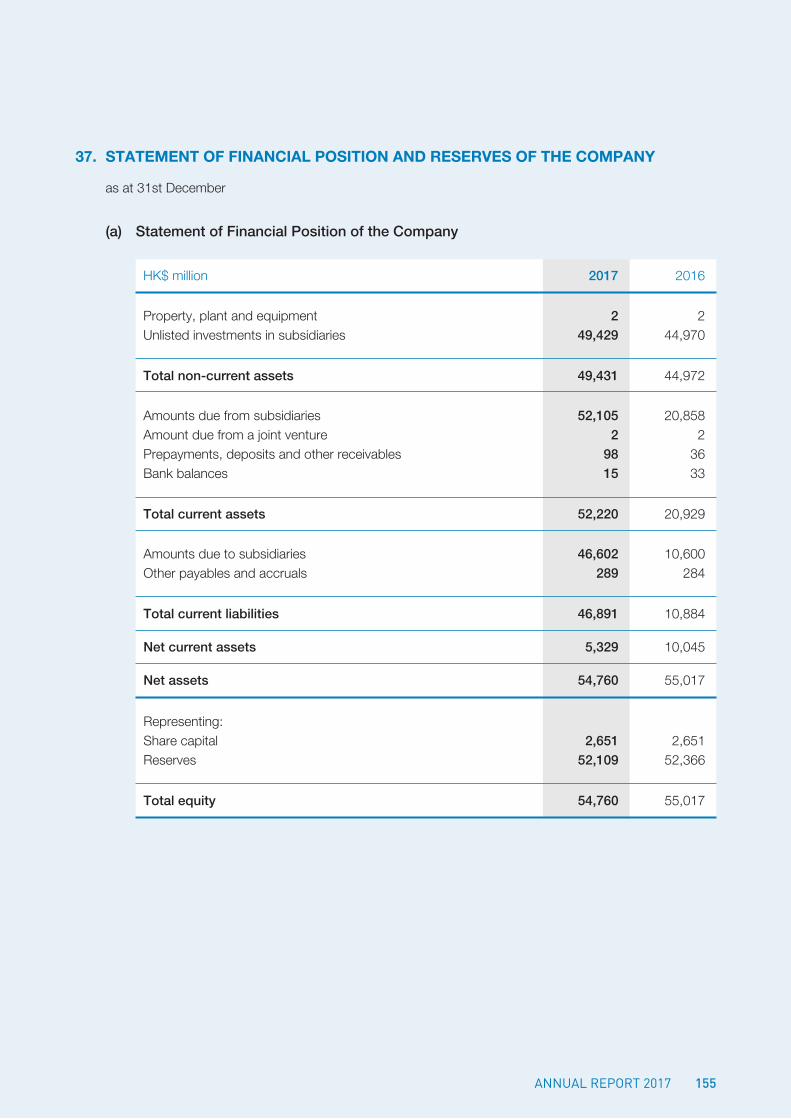
155AnnuAl RepoRt 2017
37. statement oF Financial Position and reserves oF the comPany
as at 31st December
(a) Statement of Financial Position of the Company
HK$ million 2017 2016
Property, plant and equipment 2 2Unlisted investments in subsidiaries 49,429 44,970
Total non-current assets 49,431 44,972
Amounts due from subsidiaries 52,105 20,858Amount due from a joint venture 2 2Prepayments, deposits and other receivables 98 36Bank balances 15 33
Total current assets 52,220 20,929
Amounts due to subsidiaries 46,602 10,600Other payables and accruals 289 284
Total current liabilities 46,891 10,884
Net current assets 5,329 10,045
Net assets 54,760 55,017
Representing:Share capital 2,651 2,651Reserves 52,109 52,366
Total equity 54,760 55,017
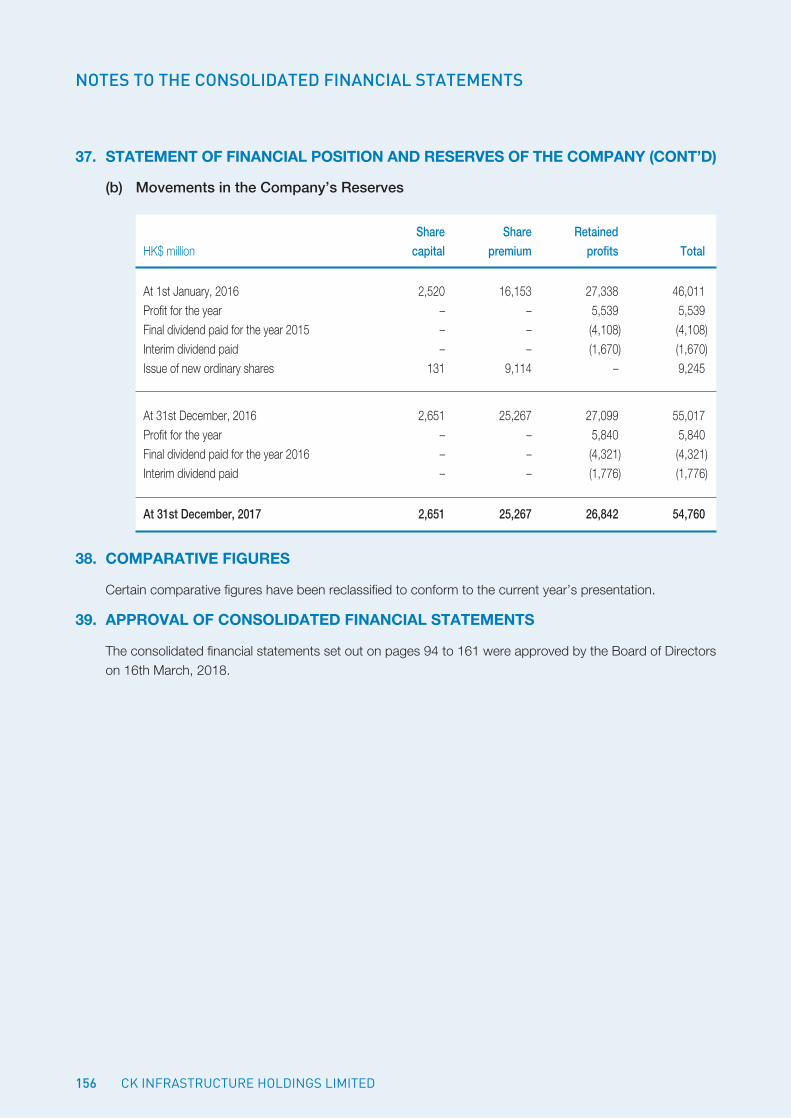
156
NOTES TO THE CONSOLIDATED FINANCIAL STATEMENTS
37. statement oF Financial Position and reserves oF the comPany (cont’d)
(b) Movements in the Company’s Reserves
Share Share RetainedHK$ million capital premium profits Total
At 1st January, 2016 2,520 16,153 27,338 46,011Profit for the year – – 5,539 5,539Final dividend paid for the year 2015 – – (4,108) (4,108)Interim dividend paid – – (1,670) (1,670)Issue of new ordinary shares 131 9,114 – 9,245
At 31st December, 2016 2,651 25,267 27,099 55,017Profit for the year – – 5,840 5,840Final dividend paid for the year 2016 – – (4,321) (4,321)Interim dividend paid – – (1,776) (1,776)
At 31st December, 2017 2,651 25,267 26,842 54,760
38. comParative FiGures
Certain comparative figures have been reclassified to conform to the current year’s presentation.
39. aPProval oF consolidated Financial statements
The consolidated financial statements set out on pages 94 to 161 were approved by the Board of Directors on 16th March, 2018.
CK InfRAstRuCtuRe HoldIngs lImIted
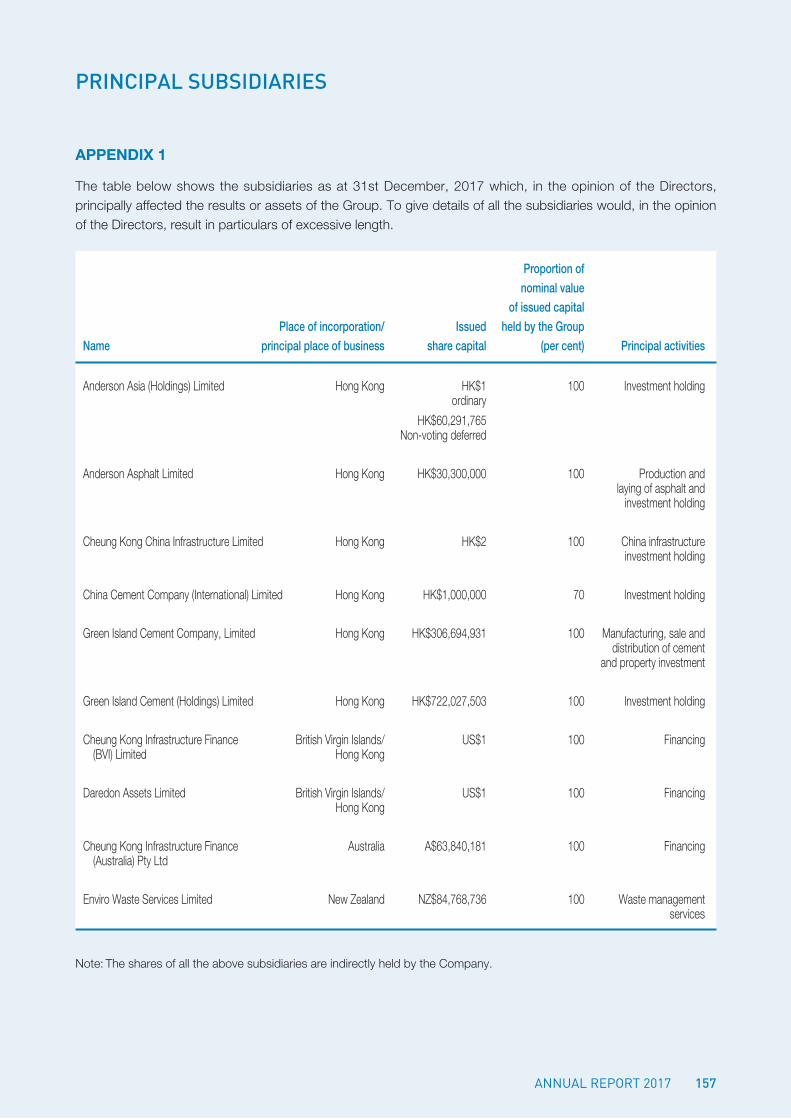
PRINCIPAL SUBSIDIARIES
157AnnuAl RepoRt 2017
aPPendix 1
The table below shows the subsidiaries as at 31st December, 2017 which, in the opinion of the Directors, principally affected the results or assets of the Group. To give details of all the subsidiaries would, in the opinion of the Directors, result in particulars of excessive length.
Proportion of nominal value of issued capital Place of incorporation/ Issued held by the GroupName principal place of business share capital (per cent) Principal activities
Anderson Asia (Holdings) Limited Hong Kong HK$1 100 Investment holding ordinary
HK$60,291,765 Non-voting deferred
Anderson Asphalt Limited Hong Kong HK$30,300,000 100 Production and laying of asphalt and investment holding
Cheung Kong China Infrastructure Limited Hong Kong HK$2 100 China infrastructure investment holding
China Cement Company (International) Limited Hong Kong HK$1,000,000 70 Investment holding
Green Island Cement Company, Limited Hong Kong HK$306,694,931 100 Manufacturing, sale and distribution of cement and property investment
Green Island Cement (Holdings) Limited Hong Kong HK$722,027,503 100 Investment holding
Cheung Kong Infrastructure Finance British Virgin Islands/ US$1 100 Financing (BVI) Limited Hong Kong
Daredon Assets Limited British Virgin Islands/ US$1 100 Financing Hong Kong
Cheung Kong Infrastructure Finance Australia A$63,840,181 100 Financing (Australia) Pty Ltd
Enviro Waste Services Limited New Zealand NZ$84,768,736 100 Waste management services
Note: The shares of all the above subsidiaries are indirectly held by the Company.
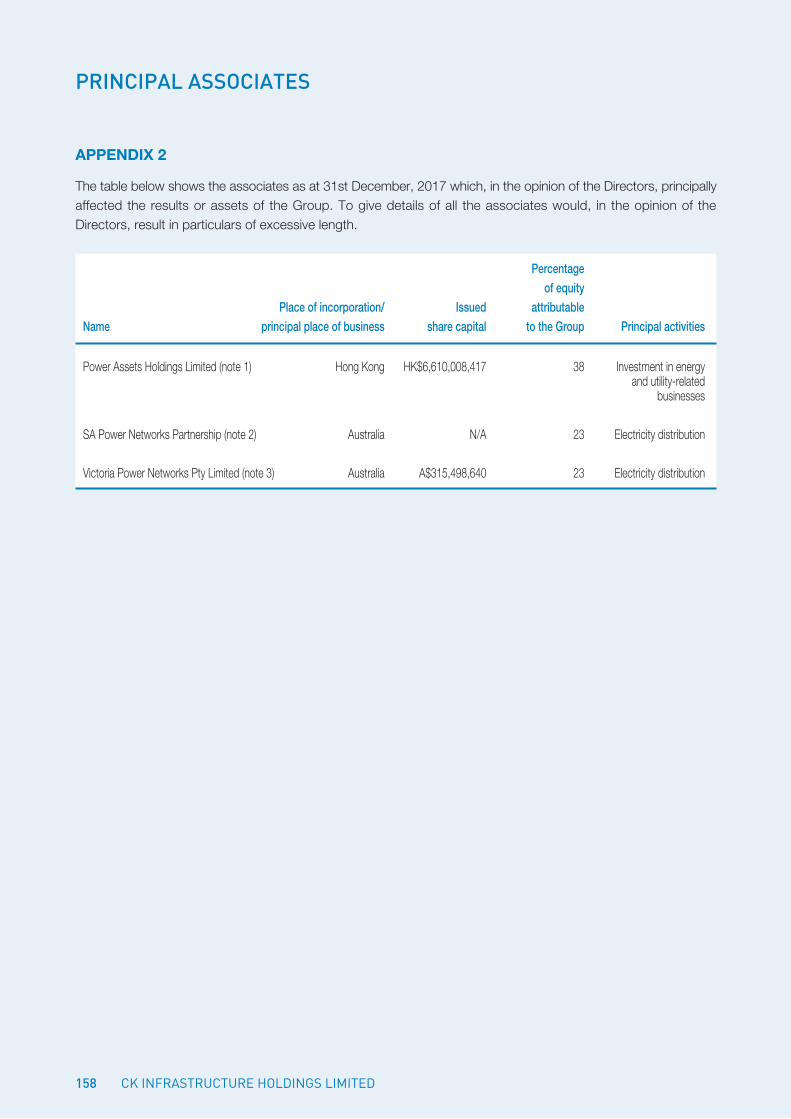
PRINCIPAL ASSOCIATES
158
aPPendix 2
The table below shows the associates as at 31st December, 2017 which, in the opinion of the Directors, principally affected the results or assets of the Group. To give details of all the associates would, in the opinion of the Directors, result in particulars of excessive length.
Percentage of equity Place of incorporation/ Issued attributableName principal place of business share capital to the Group Principal activities
Power Assets Holdings Limited (note 1) Hong Kong HK$6,610,008,417 38 Investment in energy and utility-related businesses
SA Power Networks Partnership (note 2) Australia N/A 23 Electricity distribution
Victoria Power Networks Pty Limited (note 3) Australia A$315,498,640 23 Electricity distribution
CK InfRAstRuCtuRe HoldIngs lImIted
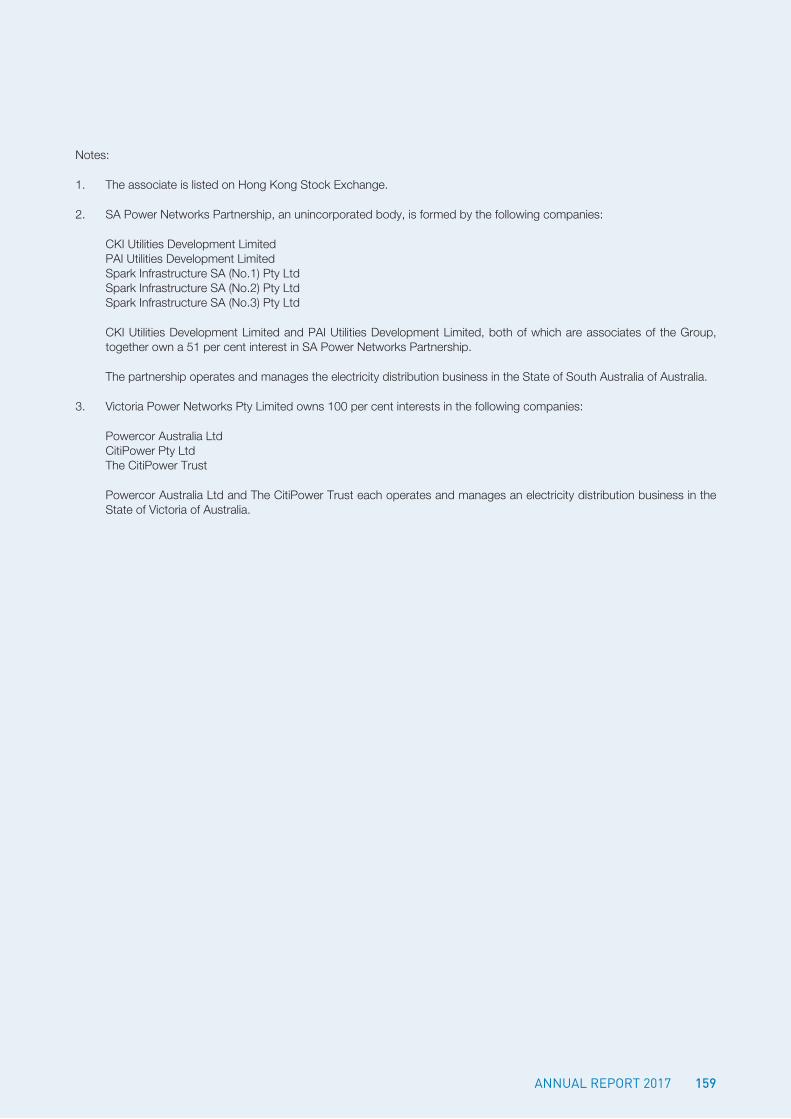
159AnnuAl RepoRt 2017
Notes:
1. The associate is listed on Hong Kong Stock Exchange.
2. SA Power Networks Partnership, an unincorporated body, is formed by the following companies:
CKI Utilities Development LimitedPAI Utilities Development LimitedSpark Infrastructure SA (No.1) Pty LtdSpark Infrastructure SA (No.2) Pty LtdSpark Infrastructure SA (No.3) Pty Ltd
CKI Utilities Development Limited and PAI Utilities Development Limited, both of which are associates of the Group, together own a 51 per cent interest in SA Power Networks Partnership.
The partnership operates and manages the electricity distribution business in the State of South Australia of Australia.
3. Victoria Power Networks Pty Limited owns 100 per cent interests in the following companies:
Powercor Australia LtdCitiPower Pty LtdThe CitiPower Trust
Powercor Australia Ltd and The CitiPower Trust each operates and manages an electricity distribution business in the State of Victoria of Australia.
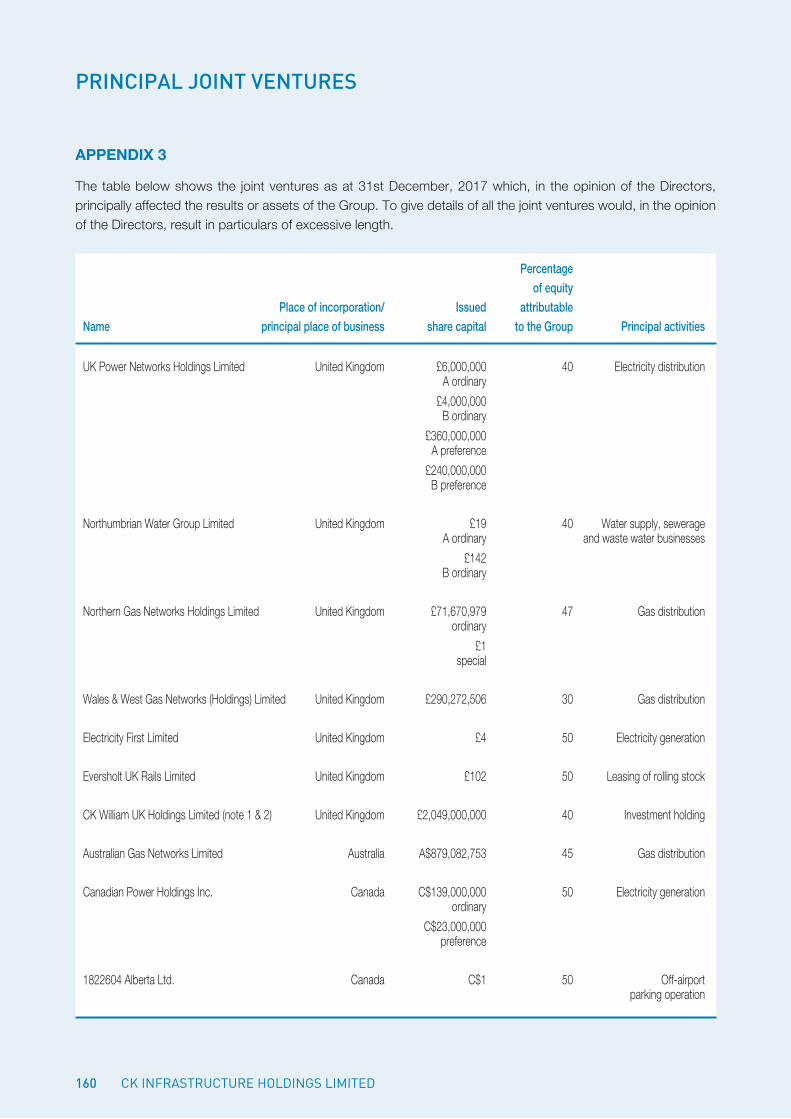
PRINCIPAL JOINT VENTURES
160
aPPendix 3
The table below shows the joint ventures as at 31st December, 2017 which, in the opinion of the Directors, principally affected the results or assets of the Group. To give details of all the joint ventures would, in the opinion of the Directors, result in particulars of excessive length.
Percentage of equity Place of incorporation/ Issued attributableName principal place of business share capital to the Group Principal activities
UK Power Networks Holdings Limited United Kingdom £6,000,000 40 Electricity distribution A ordinary
£4,000,000 B ordinary
£360,000,000 A preference
£240,000,000 B preference
Northumbrian Water Group Limited United Kingdom £19 40 Water supply, sewerage A ordinary and waste water businesses
£142 B ordinary
Northern Gas Networks Holdings Limited United Kingdom £71,670,979 47 Gas distribution ordinary
£1 special
Wales & West Gas Networks (Holdings) Limited United Kingdom £290,272,506 30 Gas distribution
Electricity First Limited United Kingdom £4 50 Electricity generation
Eversholt UK Rails Limited United Kingdom £102 50 Leasing of rolling stock
CK William UK Holdings Limited (note 1 & 2) United Kingdom £2,049,000,000 40 Investment holding
Australian Gas Networks Limited Australia A$879,082,753 45 Gas distribution
Canadian Power Holdings Inc. Canada C$139,000,000 50 Electricity generation ordinary
C$23,000,000 preference
1822604 Alberta Ltd. Canada C$1 50 Off-airport parking operation
CK InfRAstRuCtuRe HoldIngs lImIted
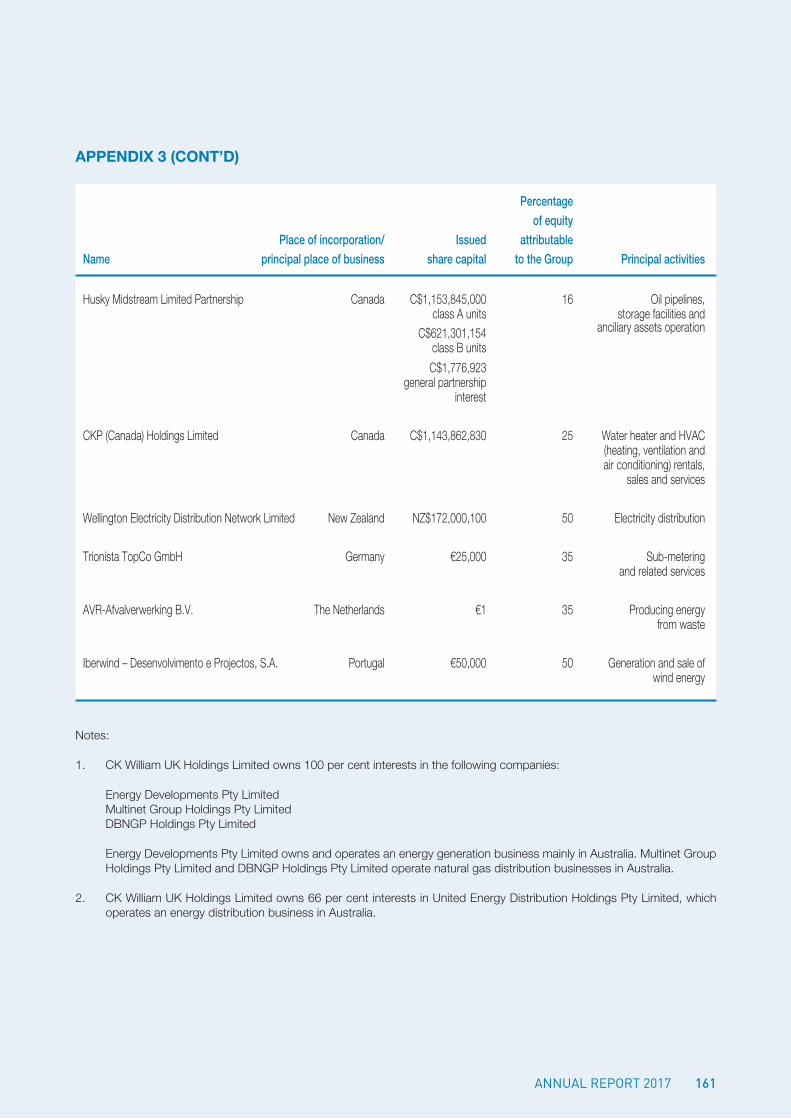
161AnnuAl RepoRt 2017
aPPendix 3 (cont’d)
Percentage of equity Place of incorporation/ Issued attributableName principal place of business share capital to the Group Principal activities
Husky Midstream Limited Partnership Canada C$1,153,845,000 16 Oil pipelines, class A units storage facilities and C$621,301,154 anciliary assets operation
class B units
C$1,776,923 general partnership interest
CKP (Canada) Holdings Limited Canada C$1,143,862,830 25 Water heater and HVAC (heating, ventilation and air conditioning) rentals, sales and services
Wellington Electricity Distribution Network Limited New Zealand NZ$172,000,100 50 Electricity distribution
Trionista TopCo GmbH Germany €25,000 35 Sub-metering and related services
AVR-Afvalverwerking B.V. The Netherlands €1 35 Producing energy from waste
Iberwind – Desenvolvimento e Projectos, S.A. Portugal €50,000 50 Generation and sale of wind energy
Notes:
1. CK William UK Holdings Limited owns 100 per cent interests in the following companies:
Energy Developments Pty LimitedMultinet Group Holdings Pty LimitedDBNGP Holdings Pty Limited
Energy Developments Pty Limited owns and operates an energy generation business mainly in Australia. Multinet Group Holdings Pty Limited and DBNGP Holdings Pty Limited operate natural gas distribution businesses in Australia.
2. CK William UK Holdings Limited owns 66 per cent interests in United Energy Distribution Holdings Pty Limited, which operates an energy distribution business in Australia.
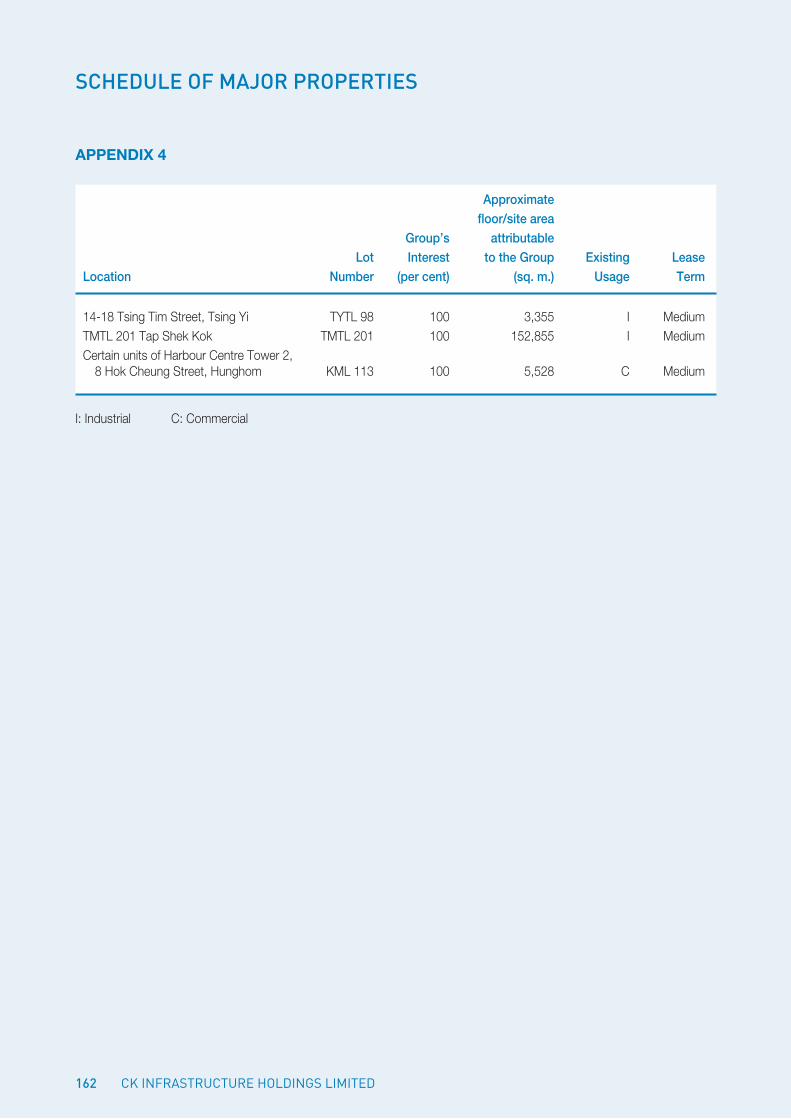
SCHEDULE OF MAJOR PROPERTIES
162
aPPendix 4
Approximate floor/site area Group’s attributable Lot Interest to the Group Existing LeaseLocation Number (per cent) (sq. m.) Usage Term
14-18 Tsing Tim Street, Tsing Yi TYTL 98 100 3,355 I MediumTMTL 201 Tap Shek Kok TMTL 201 100 152,855 I MediumCertain units of Harbour Centre Tower 2, 8 Hok Cheung Street, Hunghom KML 113 100 5,528 C Medium
I: Industrial C: Commercial
CK InfRAstRuCtuRe HoldIngs lImIted