Embed Size (px)
Citation preview
Consolidated Half-Year Financial Report 30 June 2014
Consolidated Half-year
Financial Report
30 June 2014
Board of Directors
29 August 2014
Consolidated Half-Year Financial Report 30 June 2014
(empty page)
Consolidated Half-Year Financial Report 30 June 2014
1
Corporate bodies of GE Capital Interbanca S.p.A. – Parent
Company of the GE Capital Interbanca Banking Group
Board of Directors (1)
Chairman Richard Alan Laxer
Chief Executive Officer Paolo Braghieri
Directors Enrico Maria Luigi Fagioli Marzocchi (*)
Mario Garraffo (*)
Patricia Marie Halliday
Todd Lamar Smith
Board of Statutory Auditors
Chairman Paolo Andrea Colombo
Standing Auditors Marco Giorgino
Piera Vitali (2)
Alternate Auditor Guido Sazbon
General Management
General Manager Paolo Braghieri
Executive charged with
preparing the company’s
financial reports
Ettore Colombo
(1) Director Giuseppe Recchi resigned from office effective 23 June 2014
(2) In office since 27 June 2014 replacing Auditor Alberto Dalla Libera, who resigned effective 26 June 2014
(*) Independent director
Consolidated Half-Year Financial Report 30 June 2014
2
(empty page)
Consolidated Half-Year Financial Report 30 June 2014
3
CONSOLIDATED HALF-YEAR FINANCIAL REPORT
� Corporate bodies � Introduction � Composition of the Banking Group � Scope of consolidation � Bases for preparation of the Consolidated Financial Statements � Highlights and information on the companies included in the scope of
consolidation
INTERIM REPORT ON OPERATIONS
1 5 6 6 7
7
12
� Loans and receivables 12 � Equity investments 14 � Corporate finance 14 � Tangible assets 14 � Funding 15 � Financial assets and liabilities 17 � Deferred tax assets 18 � Equity 18
CONSOLIDATED FINANCIAL RESULTS FOR THE FIRST HALF OF 2014 19
ADDITIONAL INFORMATION 25
EVENTS AFTER THE REPORTING DATE AND OUTLOOK FOR THE YEAR IN
PROGRESS
32
ABRIDGED CONSOLIDATED HALF-YEAR FINANCIAL STATEMENTS 33
� Consolidated Statements 34
EXPLANATORY NOTES 43
� Accounting Policies 44 � Information on the Balance Sheet 64 � Information on the Income Statement 83 � Consolidated Statement of Comprehensive Income 96 � Information on the credit risk 98 � Information on transactions with related parties 103 � Segment reporting 106
CERTIFICATION OF THE ABRIDGED CONSOLIDATED HALF-YEAR FINANCIAL
STATEMENTS PURSUANT TO ARTICLE 154-BIS OF ITALIAN LEGISLATIVE
DECREE NO. 58 OF 24 FEBRUARY 1998
108
OFFICES 110
Consolidated Half-Year Financial Report 30 June 2014
4
(empty page)
Consolidated Half-Year Financial Report 30 June 2014
5
INTRODUCTION
This consolidated half-year financial report was prepared in summary form in accordance with IAS
34 "Interim Financial Reporting". Therefore, this report does not include all the information required
by the annual financial statements and must be read together with the annual financial statements
prepared for the year ending at 31 December 2013.
In compliance with the afore-mentioned provisions, the half-year financial report favours information
at consolidated level; for information on the main financial and economic figures of the individual
companies included in the scope of consolidation, reference should be made to the following section
entitled “Main information on the companies included in the scope of consolidation”.
Consolidated Half-Year Financial Report 30 June 2014
6
COMPOSITION OF THE BANKING GROUP
As at 30 June 2014, the GE Capital Interbanca Banking Group consists of the following:
Parent Company:
� GE Capital Interbanca S.p.A.
Group companies:
� GE Capital Servizi Finanziari S.p.A.
� GE Capital Finance S.r.l.
� GE SPV S.r.l.
SCOPE OF CONSOLIDATION
FULLY CONSOLIDATED EQUITY INVESTMENTS
Name Registered offices
Parent Company’s
percentage of direct
investment
Banking Group’s
percentage of
investment
GE Capital Servizi Finanziari S.p.A. Mondovì – Cuneo 100 100
GE Capital Finance S.r.l. (1) Milan 60 100
GE SPV S.r.l. (2) Conegliano -
Treviso - 100
GE Capital Services S.r.l. (3) Rome 79 100
(1) the remaining 40% is owned by the Group through GE Capital Servizi Finanziari S.p.A., which is part of the GE
Capital Interbanca Banking Group, and 100% owned by GE Capital Interbanca S.p.A.
(2) the company is wholly owned by the GE Capital Interbanca Banking Group through the subsidiary GE Capital
Servizi Finanziari S.p.A.
(3) the remaining 21% is owned by the Group through GE Capital Servizi Finanziari S.p.A., which is part of the GE
Capital Interbanca Banking Group, and 100% owned by GE Capital Interbanca S.p.A.
INVESTMENTS CONSOLIDATED UNDER THE EQUITY METHOD
Name Registered offices
Parent Company’s
percentage of
direct investment
Banking Group’s
percentage of
investment
Renting Italease S.r.l. (*) Milan - 50
(*) Joint venture between Italease Gestione Beni S.p.A. and GE Capital Services S.r.l.
Consolidated Half-Year Financial Report 30 June 2014
7
BASES FOR PREPARATION OF THE CONSOLIDATED HALF-YEAR
FINANCIAL REPORT
The companies included in the scope of consolidation as at 30 June 2014 were already part of it on
31 December 2013.
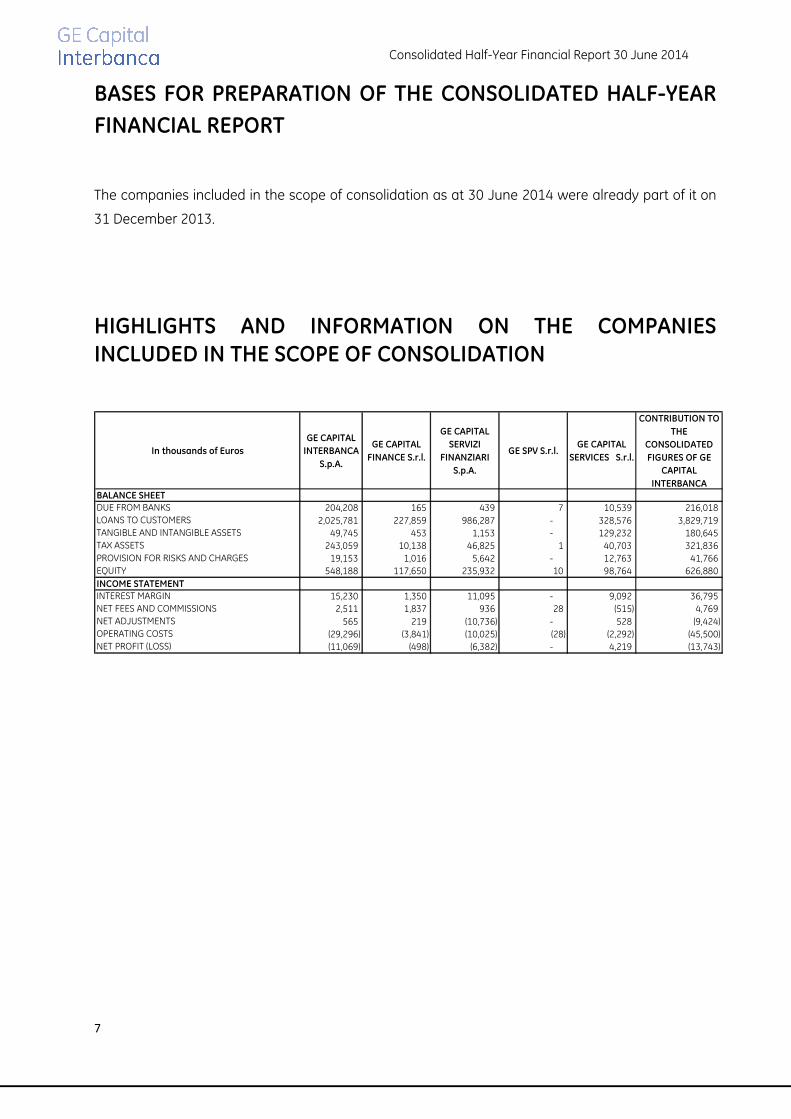
HIGHLIGHTS AND INFORMATION ON THE COMPANIES
INCLUDED IN THE SCOPE OF CONSOLIDATION
In thousands of Euros
GE CAPITAL
INTERBANCA
S.p.A.
GE CAPITAL
FINANCE S.r.l.
GE CAPITAL
SERVIZI
FINANZIARI
S.p.A.
GE SPV S.r.l.GE CAPITAL
SERVICES S.r.l.
CONTRIBUTION TO
THE
CONSOLIDATED
FIGURES OF GE
CAPITAL
INTERBANCA
BALANCE SHEET
DUE FROM BANKS 204,208 165 439 7 10,539 216,018
LOANS TO CUSTOMERS 2,025,781 227,859 986,287 - 328,576 3,829,719 TANGIBLE AND INTANGIBLE ASSETS 49,745 453 1,153 - 129,232 180,645 TAX ASSETS 243,059 10,138 46,825 1 40,703 321,836
PROVISION FOR RISKS AND CHARGES 19,153 1,016 5,642 - 12,763 41,766
EQUITY 548,188 117,650 235,932 10 98,764 626,880
INCOME STATEMENT
INTEREST MARGIN 15,230 1,350 11,095 - 9,092 36,795
NET FEES AND COMMISSIONS 2,511 1,837 936 28 (515) 4,769
NET ADJUSTMENTS 565 219 (10,736) - 528 (9,424) OPERATING COSTS (29,296) (3,841) (10,025) (28) (2,292) (45,500) NET PROFIT (LOSS) (11,069) (498) (6,382) - 4,219 (13,743)
Consolidated Half-Year Financial Report 30 June 2014
8
GE Capital Interbanca S.p.A.
GE Capital Interbanca S.p.A, Corporate Bank Parent Company of the GE Capital Interbanca Banking
Group, is dedicated to the sector of medium-sized businesses in support of entrepreneurial projects
by offering a wide range of corporate finance and commercial banking services and targeted
consultancy.
The principal financial figures show net loans to customers under assets decreasing by 4.2%, as a
result of lower disbursements with respect to loans reaching maturity and repaid.
Total disbursements in the first half of 2014 were € 136 million, down 16.5% with respect to the same
period in the previous year (€ 163 million).
With regard to portfolio quality, gross impaired loans decreased by 4.3%, similar to net loans, which
fell 1.8% from the 2013 year-end figure, leaving the coverage index essentially unchanged (-1.2%).
The decrease in absolute values of net loans, along with the growth in equity, improves the ratio
between these two financial statement components for the first time since the economic crisis
began, bringing the ratio to 97.6%, compared to 100% at the end of 2013.
As at 30 June 2014, the Equity Investment portfolio, fully classified under “available for sale",
comprised 7 active equity investments totalling € 75.9 million, an increase from € 60.3 million as at
31 December 2013, due to the adjustment of the fair value on available-for-sale financial
instruments. There were no new investment or divestment transactions during the first half of 2014.
As regards funding, which totalled € 2,416 million, € 2,075 million is represented by GE intercompany
funding, whereas bonds, in the absence of new issues, dropped to approximately € 211 million.
The intercompany debt was entirely restructured during the first half of 2014, extending the duration
to 10 years and applying market rates.
As at 30 June 2014, equity – inclusive of the loss for the period – amounted to € 548.2 million, up €
3.4 million (+ 0.6%) with respect to the figure recorded at the end of 2013.
When compared to the same period of the prior year, the GE Capital Interbanca income statement as
at 30 June 2014 was characterised, on one hand, by an increase in the cost of funding as a result of
restructuring the entire intercompany debt and, on the other, by the positive impact of loan
impairments which, conversely, have had a negative impact on the income statement since the
beginning of the financial crisis in 2008.
Although the final result is still negative, with a loss of € 11 million, this represents a substantial
improvement from the loss of € 47 million recorded for the first half of 2013.

Consolidated Half-Year Financial Report 30 June 2014
9
GE Capital Servizi Finanziari S.p.A.
The Company, enrolled in the Register pursuant to art. 107 of the Consolidated Banking Act, belongs
to the GE Capital Interbanca Banking Group and is subject to the management and coordination of
GE Capital Interbanca S.p.A. The Company is specialised in vehicle leasing and equipment leasing and
operates via a selected network of agents and suppliers/resellers of operating assets throughout
Italy.
In addition, the Company has:
• 100% of the share capital of GE SPV S.r.l.;
• 40% of the share capital of GE Capital Finance S.r.l;
• 21% of the share capital of GE Capital Services S.r.l.
The main financial figures show a slight decline in the asset category of loans to customers (€ 987
million), down 0.4% compared to the end of 2013.
The volumes of disbursements in the core business of auto leasing during the period, amounting to €
143 million, increased 8.8% compared to the same period the previous year, despite the continued
crisis in the automotive sector and confirming the Company as market leader with a 13% share. With
regard to the Equipment Lease portfolio, the volume of disbursements amounted to € 17 million
compared to € 16 million for the same period the previous year.
From a portfolio quality perspective, the ratio of net non-performing loans to total net loans was
marginally higher than the prior year, reaching 8.1% (7.9% as at 31 December 2013), while the level of
cover is 64.8% compared to 64.3% as at 31 December 2013.
The income statement for the first half of 2014 shows net interest and other banking income down €
0.5 million, due to various factors including the loss of returns from portfolios in run-off.
Net impairment losses on loans amounting to € 10.7 million should be noted, with a 39% decrease
compared to the figure recorded in June of the previous year. This improvement is mainly due to run-
off portfolios, in particular the mortgage loan portfolio, for which it was necessary to adjust the
valuation models in the first half of 2013 following the reduction in real estate prices caused by the
decline in the market.
Net of income taxes, the result for the year was a loss of € 6.4 million, an improvement over the €
10.3 million loss posted as at 30 June 2013.
Consolidated Half-Year Financial Report 30 June 2014
10
GE Capital Finance S.r.l.
The Company, enrolled in the Register pursuant to art. 107 of the Consolidated Banking Act, belongs
to the GE Capital Interbanca Banking Group, is subject to the management and coordination of GE
Capital Interbanca S.p.A., and operates in the factoring market. Over the years, the business has
gradually begun to focus on the components of service, creating internal competencies in offering a
vast array of products designed for the Italian market and, specifically, for medium to large
businesses that are seeking to optimise their credit risk profile, administrative management and
working capital.
With regard to operating results, in the first half of 2014, the Company’s overall turnover increased
66.2% over the same period in 2013, from € 490 million to € 815 million in the first half of 2014.
Net loans to customers were € 228 million, a slight decline from € 231 million at the end of 2013.
As regards portfolio quality, the ratio of net non-performing loans to total net loans remained the
same as the 2013 year-end figure, or 0.06%.
With reference to the main income statement items, the improvement in net interest and other
banking income should be noted, mainly due to increased turnover, which came to approximately €
3.2 million, up 73% compared to the first six months of 2013.
Administrative expenses (including personnel expenses) amounted to € 4 million compared to € 4.6
million in the first half of 2013. This reduction of 13.6% is mainly attributable to extraordinary costs
incurred in 2013 for the merger of GE Commercial Distribution Finance S.r.l. in GE Capital Finance S.r.l
and for non-recurring expenses related to the Company’s reorganisation process.
Net of income taxes, the loss for the year amounts to € 0.5 million, considerably less than the loss of €
2 million posted in the same period of the previous year.
GE SPV S.r.l.
The Company, a fully owned subsidiary of GE Capital Servizi Finanziari S.p.A, was established in March
2008 pursuant to art. 3 of Law no. 130 of 30 April 1999, to carry out a securitisation of performing
loans, originated by said Parent Company, in December 2010, for 70% of the auto leasing portfolio
volume or € 400 million, with the objective of simultaneously diversifying funding sources necessary
to finance the growth of business activities.
This securitisation transaction was completed, consistent with the amortisation of the underlying
portfolio, with the repayment and cancellation of the Senior Notes on 25 June 2014, the repayment
and cancellation of the Junior Notes on 21 July 2014 and the repurchasing by GE Capital Servizi
Finanziari S.p.A. of the existing vehicle as at 30 June 2014.

Consolidated Half-Year Financial Report 30 June 2014
11
The appropriate decision-taking bodies are currently evaluating the opportunity to begin the
liquidation process for the vehicle.
As at 30 June 2014, the Company’s results were breakeven.
GE Capital Services S.r.l.
Effective 31 December 2012, GE Capital Services S.r.l. is wholly owned by the Bank – through a direct
ownership stake of 79% and the remaining 21% through GE Capital Servizi Finanziari S.p.A. – and is
subject to management and coordination of the Bank, as part of the Bank’s scope of consolidation.
GE Capital Services S.r.l., classified as a “non-financial company”, operates primarily in the market of
long-term rentals of vehicles and operating assets.
The Company has an interest in Renting Italease S.r.l., which represents a joint venture with Italease
Gestione Beni S.p.A.
As regards operating results during the first half of 2014, note that the total volume disbursed
amounts to € 116 million, a 2.5% decrease over the same period in the previous year. The Company
posted a profit of € 4.2 million as at 30 June 2014, characterised by the absence of loan impairments
due to the improvement in portfolio quality, while maintain a coverage level of 93%.
Consolidated Half-Year Financial Report 30 June 2014
12
INTERIM REPORT ON OPERATIONS
LOANS AND RECEIVABLES
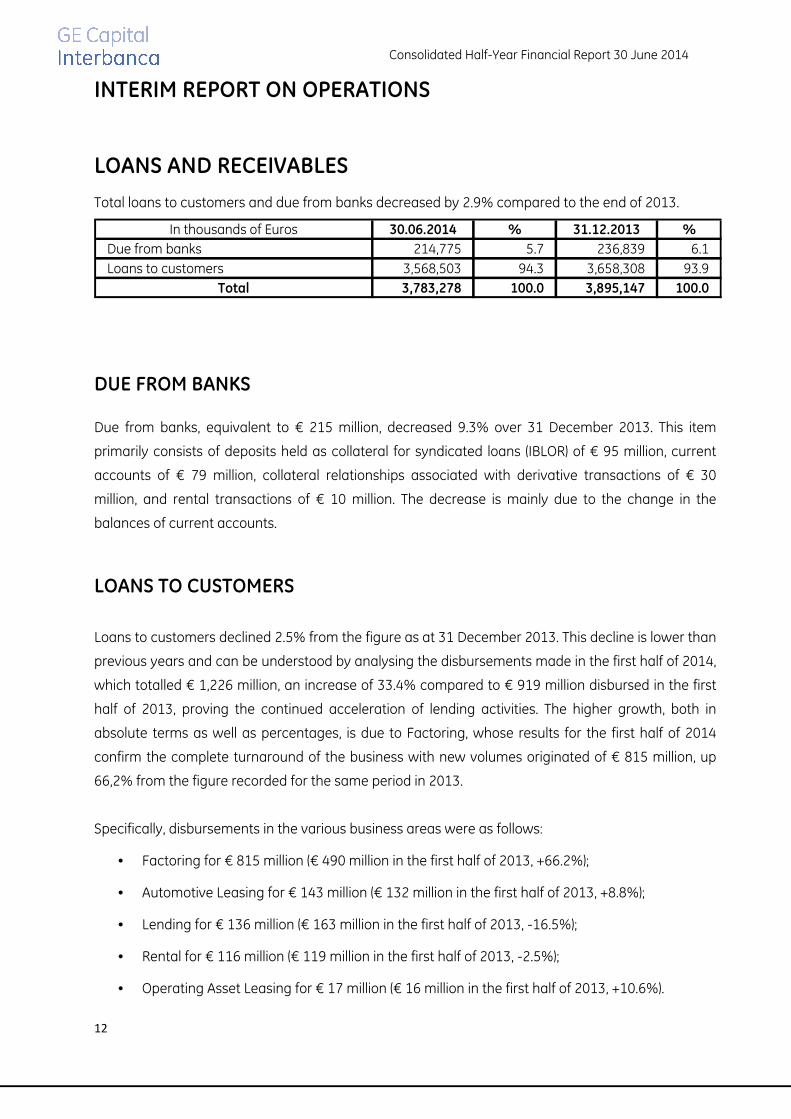
Total loans to customers and due from banks decreased by 2.9% compared to the end of 2013.
In thousands of Euros 30.06.2014 % 31.12.2013 %
Due from banks 214,775 5.7 236,839 6.1
Loans to customers 3,568,503 94.3 3,658,308 93.9
Total 3,783,278 100.0 3,895,147 100.0
DUE FROM BANKS
Due from banks, equivalent to € 215 million, decreased 9.3% over 31 December 2013. This item
primarily consists of deposits held as collateral for syndicated loans (IBLOR) of € 95 million, current
accounts of € 79 million, collateral relationships associated with derivative transactions of € 30
million, and rental transactions of € 10 million. The decrease is mainly due to the change in the
balances of current accounts.
LOANS TO CUSTOMERS
Loans to customers declined 2.5% from the figure as at 31 December 2013. This decline is lower than
previous years and can be understood by analysing the disbursements made in the first half of 2014,
which totalled € 1,226 million, an increase of 33.4% compared to € 919 million disbursed in the first
half of 2013, proving the continued acceleration of lending activities. The higher growth, both in
absolute terms as well as percentages, is due to Factoring, whose results for the first half of 2014
confirm the complete turnaround of the business with new volumes originated of € 815 million, up
66,2% from the figure recorded for the same period in 2013.
Specifically, disbursements in the various business areas were as follows:
• Factoring for € 815 million (€ 490 million in the first half of 2013, +66.2%);
• Automotive Leasing for € 143 million (€ 132 million in the first half of 2013, +8.8%);
• Lending for € 136 million (€ 163 million in the first half of 2013, -16.5%);
• Rental for € 116 million (€ 119 million in the first half of 2013, -2.5%);
• Operating Asset Leasing for € 17 million (€ 16 million in the first half of 2013, +10.6%).
Consolidated Half-Year Financial Report 30 June 2014
13
ENDORSEMENTS AND GUARANTEES
Endorsements and guarantees of € 153 million include sureties issued of € 100 million (of which € 95
million for related IBLOR loan transactions) and a pledge recognised on shares of the Bank’s equity
portfolio of € 53 million.
The total reserve covering endorsements and guarantees amounts to € 18.1 million as at 30 June
2014 and is recorded under the liabilities in the item “other liabilities”.
CREDIT REVIEW
Performing loans
The performing loans portfolios of the various elements of the Banking Group are subject to
collective valuations, whose various calculation criteria are mainly based on long-term statistical
data together with estimates referring to the Loss Given Default (LGD); the results of these processes
led to a collective write-down of the balances of approximately € 79.5 million, which corresponds to
coverage of the entire performing loans portfolio of 2.5%, compared to 2.7% recorded at the end of
2013.
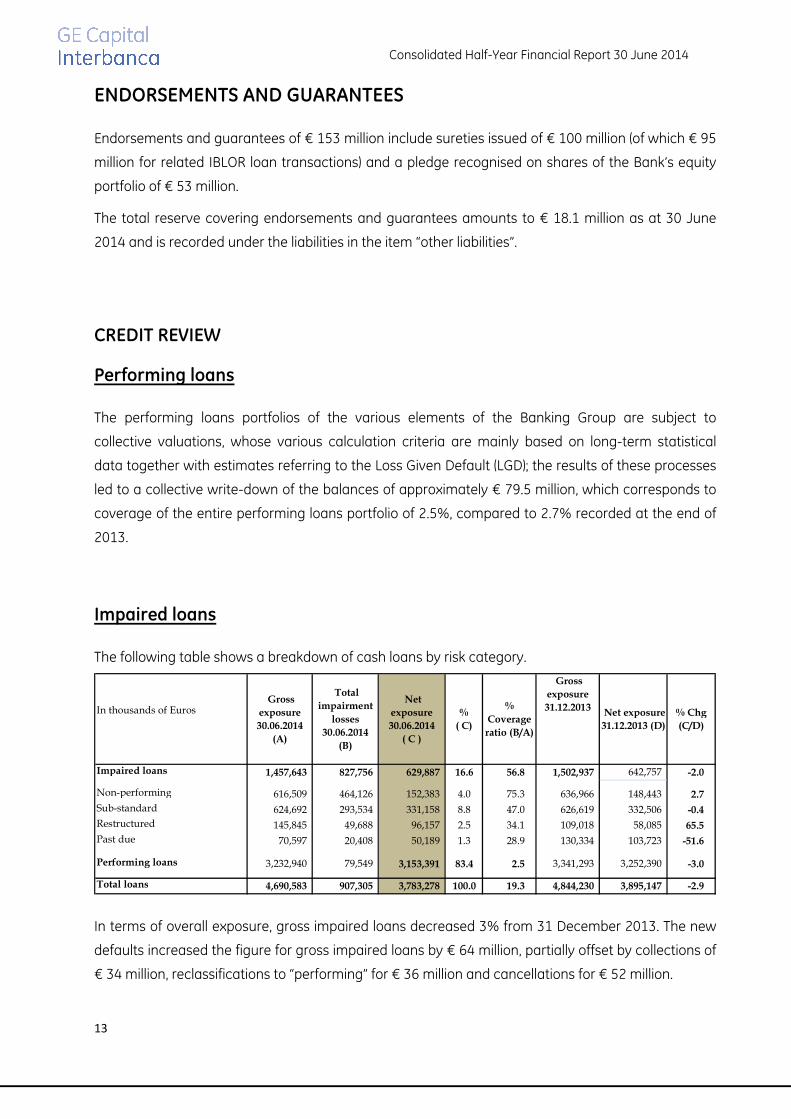
Impaired loans
The following table shows a breakdown of cash loans by risk category.
In thousands of Euros
Impaired loans 1,457,643 827,756 629,887 16.6 56.8 1,502,937 642,757 -2.0
Non-performing 616,509 464,126 152,383 4.0 75.3 636,966 148,443 2.7
Sub-standard 624,692 293,534 331,158 8.8 47.0 626,619 332,506 -0.4
Restructured 145,845 49,688 96,157 2.5 34.1 109,018 58,085 65.5
Past due 70,597 20,408 50,189 1.3 28.9 130,334 103,723 -51.6
Performing loans 3,232,940 79,549 3,153,391 83.4 2.5 3,341,293 3,252,390 -3.0
Total loans 4,690,583 907,305 3,783,278 100.0 19.3 4,844,230 3,895,147 -2.9
Net exposure
31.12.2013 (D)
% Chg
(C/D)
Gross
exposure
30.06.2014
(A)
Total
impairment
losses
30.06.2014
(B)
Net
exposure
30.06.2014
( C )
%
( C)
%
Coverage
ratio (B/A)
Gross
exposure
31.12.2013
In terms of overall exposure, gross impaired loans decreased 3% from 31 December 2013. The new
defaults increased the figure for gross impaired loans by € 64 million, partially offset by collections of
€ 34 million, reclassifications to “performing” for € 36 million and cancellations for € 52 million.
Consolidated Half-Year Financial Report 30 June 2014
14
Thus, the decrease in gross exposures affected net exposures by 2% compared to the figure at the
end of 2013; the percentage of coverage is currently at 56.8%, slightly down from 57.2% recorded at
the previous year-end.
The decrease in net exposures in absolute terms, along with the growth in equity – due to higher
positive changes in the valuation reserves compared to the loss recognised for the period – brought
about an improvement in the ratio of these two financial statement items for the first time since the
financial crisis began in 2008, with a ratio of 110.3% compared to 112.7% at the end of 2013.
EQUITY INVESTMENTS
Note that the sole equity investment at the consolidated level refers to Renting Italease S.r.l., a joint
venture with Italease Gestione Beni S.p.A., recognised at a value of € 754 thousand.
CORPORATE FINANCE
EQUITY INVESTMENT
As at 30 June 2014, the Equity Investment portfolio, fully classified under “available for sale",
comprised 7 active equity investments totalling € 75.9 million, an increase from € 60.3 million as at
31 December 2013, due to the fair value adjustment of financial instruments.
There were no new investment or divestment transactions during the first half of 2014.
OTHER EQUITY INTERESTS
At the end of the first half of 2014, the “Other equity interests” portfolio, fully classified under
“available for sale", amounted to approximately € 8.6 million, and was mainly made up of
restructuring transactions for businesses in temporary financial difficulty, which resulted in part of
the debt being converted to capital or similar equity instruments.
TANGIBLE ASSETS
Tangible assets amount to € 177.5 million as at 30 June 2014 and consist of long-term rented assets
of € 129 million (vehicles and machinery) and real estate in Milan and Turin owned by the Parent
Company for € 47.5 million.

Consolidated Half-Year Financial Report 30 June 2014
15
FUNDING
MAIN FUNDING ITEMS
In thousands of Euros 30.06.2014 % 31.12.2013 %
Due to banks 9,379 0.2 11,957 0.3
Due to customers 3,551,895 94.2 3,629,261 94.0
Securities in issue 210,686 5.6 219,705 5.7
Total 3,771,960 100.0 3,860,923 100.0 Total funding (including subordinated liabilities) decreased 2.3% from 31 December 2013, consistent
with the decline in loans during the first half of 2014.
Due to banks
Due to banks, which amounts to € 9.4 million, is essentially made up of short-term collections on the
MID (Market for Interbank Deposit).
The Banking Group did not take advantage of the sources of financing made available by the ECB.
Due to customers
In thousands of Euros 30.06.2014 % 31.12.2013 % Group loans 3,347,640 94.2 3,362,422 92.6 Corporate deposits and demand deposits 120,585 3.4 110,792 3.1 Intercompany deposits and demand deposits 61,165 1.7 104,049 2.9 Other liabilities 22,505 0.6 15,891 0.4 Securitisation - - 36,107 1.0
Total 3,551,895 100.0 3,629,261 100.0
The financing lines consist of intercompany funding granted by GE Capital Group financial
companies.
During the first half of 2014, the entire intercompany debt of the Parent Company Bank was subject
to a restructuring process that involved 16 contracts for revolving credit lines outstanding as at April
2014. Effective 24 April, the Bank’s intercompany debt consisted of 11 senior revolving credit lines for
a total nominal value of € 1.8 billion, extending the duration to 10 years and applying market rates,
as well as 3 subordinated revolving credit lines, for a total nominal value of € 100 million, with a 10-
year duration at market rates. Furthermore, the Bank was granted 9 new revolving credit lines for a
total amount of € 875 million, with a duration of 10 years at market rates.
Consolidated Half-Year Financial Report 30 June 2014
16
The item “Group loans” includes the subordinated loan for € 200 million originally granted by ABN
Amro Bank NV and, following the change in ownership, first by Santander and now General Electric
Group.
Liquidity generated from corporate customers – a service to support businesses in managing excess
liquidity and optimising yields through time deposits – increased during the first half of 2014 with
respect to the previous year, caused by dynamics in liquidity management on the part of said
customers.
The item “Intercompany deposits and demand deposits” consists of cash pooling funds used for
temporary liquidity needs with financial companies of the GE Capital Group.
The financing line obtained following the securitisation transaction was closed, consistent with the
amortisation of the underlying portfolio, with the repayment and cancellation of the Senior Notes on
25 June 2014, the repayment and cancellation of the Junior Notes on 21 July 2014 and the
repurchasing by GE Capital Servizi Finanziari S.p.A. of the existing vehicle as at 30 June 2014.
Securities in issue
In thousands of Euros 30.06.2014 % 31.12.2013 %
Bonds 208,533 99.0 216,509 98.5
Certificates of deposit 2,153 1.0 3,196 1.5
Total 210,686 100.0 219,705 100.0
This item consists almost entirely of bonds. As at 30 June 2014, there were 7 bonds in issue, of which
2 were listed for a total value of € 74.3 million.
No bond issues were carried out during the first half of 2014.
Consolidated Half-Year Financial Report 30 June 2014
17
FINANCIAL ASSETS AND LIABILITIES
In thousands of Euros 30.06.2014 31.12.2013
Debt securities 45,515 45,404 - available for sale 45,515 45,404
Derivatives recognised as assets 56,455 50,504
- held for trading 56,176 50,010 - held for hedging 279 494
Derivatives recognised as liabilities 58,458 53,668
- held for trading 58,458 53,668
Debt securities
The final balance of debt securities includes Italian Treasury Certificates (CCT) and Long-Term
Treasury Bonds (BTP) for € 45.5 million, used as collateral in favour of Bank of Italy to operate on the
Interbank Deposit Market (MID) and the Collateralised Interbank Market (MIC).
Derivatives held for trading
Almost all derivatives recognised as assets and liabilities held for trading as at 30 June 2014 were
tied to interest rate and currency contracts, traded with Corporate customers of the Parent Company
through 2009, to provide these customers with tools for hedging risks associated with business
operations, such as fluctuations in interest rates and exchange rates. At the same time, the Bank
closed individual positions with leading financial institutions.
Write-downs on impaired positions total € 6.3 million, while the credit value adjustment on the
performing positions totals approximately € 1.3 million. This component, remaining at insignificant
levels, does not affect the current classification of the fair value of the derivatives portfolio as
belonging to Level 2, in that the value is substantially determined based on valuation models using
observable inputs in active markets.
Hedging derivatives
As at 30 June 2014, there was only one outstanding derivative transaction as a hedge on the interest
rate risk of a bond issue.
Consolidated Half-Year Financial Report 30 June 2014
18
DEFERRED TAX ASSETS The balance for this item, equivalent to € 250.8 million, decreased € 37.9 million from 31 December
2013. This is largely due to the conversion of deferred tax assets into tax credits pursuant to Law no.
214/2011. The assets were recognised as at 31 December 2013 in association with loan impairments
deductible over 5 years (over 18 years until 31 December 2012).
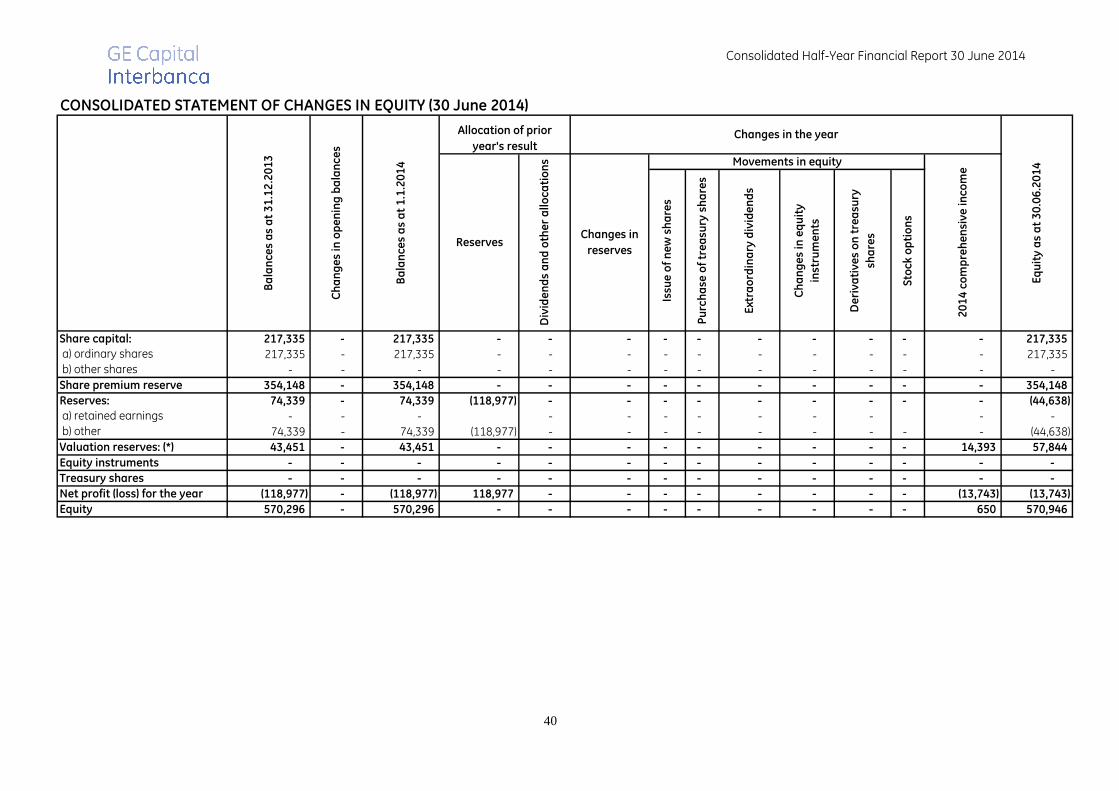
EQUITY
As at 30 June 2014, share capital and reserves – inclusive of the loss for the period – amounted to €
570.9 million, an increase of € 0.6 million (+0.1%) with respect to the same figure recorded at the end
of 2013.
The principal changes relate to:
• positively, valuation reserves, with a balance of € 14.3 million, in relation to the adjustment of
the fair value on available-for-sale financial instruments and actuarial changes for the
severance indemnity for the period;
• negatively, the loss for the period, equal to € 13.7 million.
Consolidated Half-Year Financial Report 30 June 2014
19
FINANCIAL RESULTS FOR THE FIRST HALF OF 2014
During the first half of 2014, the international macroeconomic scenario, albeit showing slight signs of
recovery arising from global trade and industrial production, still showed signs of uncertainty
involving both emerging countries (so-called “BRICs”) whose GDPs, though still high, are declining,
and the USA, where the recovery continues at a much slower pace than anticipated. The Euro zone
presented conflicting data, with the GDP improving during the first quarter of 2014 and indications of
a recovery in industrial production, but with confidence levels that were slightly lower.
In Italy, the GDP trend returned to negative levels in the first half of 2014, and continues to cause a
contraction in consumption and investments that is reflected in a persistent reduction in bank loans
to households and businesses, while existing loans show increased deterioration in quality, with the
gross non-performing loans at € 168 billion, a sharp increase from the previous year (Source: ABI
Monthly Outlook).
Within this framework of economic instability, GE Capital Interbanca Banking Group has continued to
restructure and rebuild the business, confirming its competitive position in the market, as evidenced
by total disbursements during the first half of the year that increased 33.4% compared to the
previous year, proof that the Group’s commercial activities are continuing to recover. Specifically, the
Factoring company posted a 66.7% increase in volumes in the first six months of the year.
GE Capital Interbanca Banking Group’s income statement, although showing a loss of € 13.7 million,
improved significantly compared to the considerable loss in the same period of the previous year (-€
61.1 million).
There were several factors, mainly positive, that caused this improvement: the primary factor is the
significant reduction in loan impairments, down more than € 71 million compared to 30 June 2013,
particularly associated with the Bank’s lending portfolio; secondary in amount but not in importance
was the decline in operating costs of 4.5% despite the existence of extraordinary charges.
Conversely, net interest and banking income was down 11.6%, affected by higher funding costs
resulting from the restructuring of the entire intercompany debt of the Parent Company GE Capital
Interbanca, which, however, now has a more solid structure, with an extension of the duration to 10
years for new funding lines.
Consolidated Half-Year Financial Report 30 June 2014
20
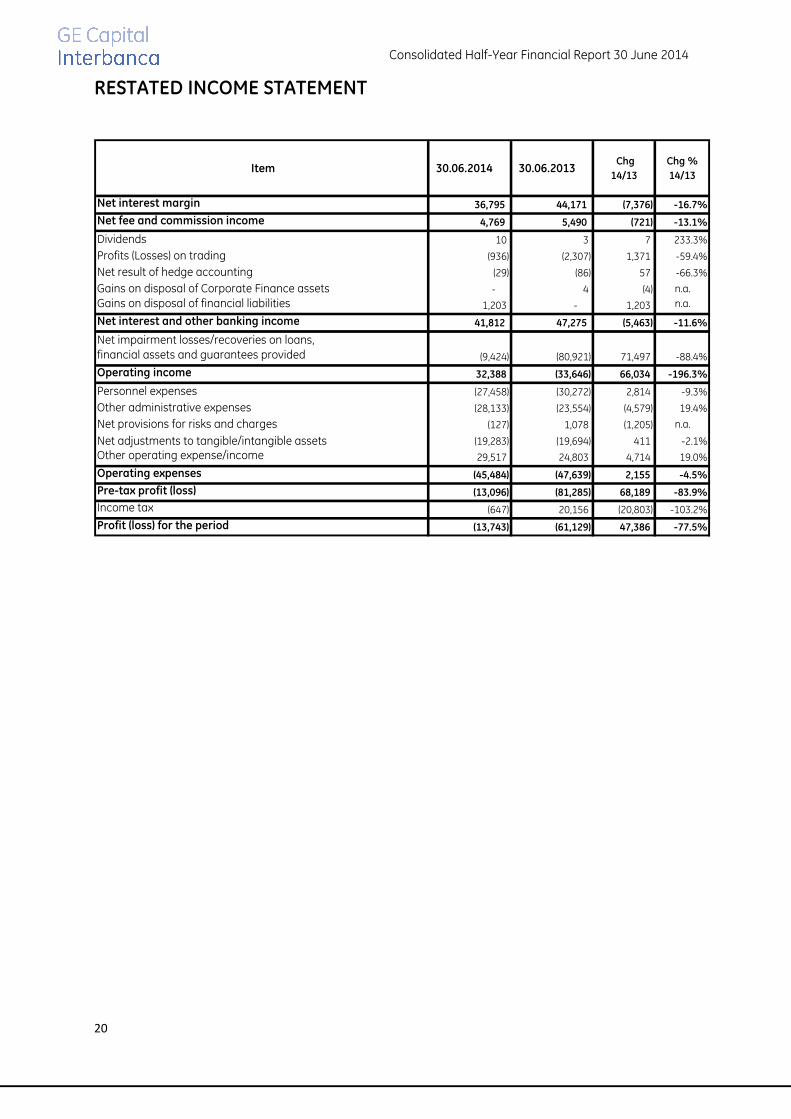
RESTATED INCOME STATEMENT
Item 30.06.2014 30.06.2013 Chg
14/13
Chg %
14/13
Net interest margin 36,795 44,171 (7,376) -16.7%
Net fee and commission income 4,769 5,490 (721) -13.1%
Dividends 10 3 7 233.3%
Profits (Losses) on trading (936) (2,307) 1,371 -59.4%
Net result of hedge accounting (29) (86) 57 -66.3%
Gains on disposal of Corporate Finance assets - 4 (4) n.a.
Gains on disposal of financial liabilities 1,203 - 1,203 n.a.
Net interest and other banking income 41,812 47,275 (5,463) -11.6%
Net impairment losses/recoveries on loans,financial assets and guarantees provided (9,424) (80,921) 71,497 -88.4%
Operating income 32,388 (33,646) 66,034 -196.3%
Personnel expenses (27,458) (30,272) 2,814 -9.3%
Other administrative expenses (28,133) (23,554) (4,579) 19.4%
Net provisions for risks and charges (127) 1,078 (1,205) n.a.
Net adjustments to tangible/intangible assets (19,283) (19,694) 411 -2.1%
Other operating expense/income 29,517 24,803 4,714 19.0%
Operating expenses (45,484) (47,639) 2,155 -4.5%
Pre-tax profit (loss) (13,096) (81,285) 68,189 -83.9%
Income tax (647) 20,156 (20,803) -103.2%
Profit (loss) for the period (13,743) (61,129) 47,386 -77.5%
Consolidated Half-Year Financial Report 30 June 2014
21
Net interest margin
The net contribution of the interest margin amounted to € 36.8 million, a decrease from € 44.2 million
achieved at the end of the first half of 2013.
The negative variation in mainly due to the higher funding cost as a result of the restructuring of all
of the Bank's financing lines with GE Capital Group, together with a drop in assets.
Net fee and commission income
Net fee and commission income amounted to € 4.8 million, down 13.1% over the figure for the first
half of 2013.
This decrease is mainly due to lower restructuring and settlement commissions, consistent with
fewer requests for rescheduling and/or restructuring in the Bank's loan portfolio.
Dividends
Dividends collected during the first half of 2014 of € 10 thousand are fully attributable to the equity
investment in S.I.A. S.p.A.
Profits (losses) on trading
Trading consists of derivative transactions carried out for Corporate customers until 2009, in order to
provide them with hedges for business operating risks, while the Bank carried out a counter-
transaction with leading financial institutions.
The period result revealed a negative balance of € 0.9 million, down 59% with respect to the figure
achieved as at 30 June 2013 and amounting to a loss of € 2.3 million; in particular, this figure was
affected by lower analytic write-downs of impaired positions.
Net result of hedge accounting
This income statement item, showing a marginal loss of € 29 thousand, reflects changes in fair value
of hedging derivatives and the underlying assets and liabilities; moreover, it reflects the effects from
the buyback and retirement of our own fully hedged bonds (item 100 d) as well as the early closing of
the derivatives linked to them.
Consolidated Half-Year Financial Report 30 June 2014
22
Gains on disposal of financial liabilities
The positive result for the first half, equivalent to € 1.2 million, is due solely to the gains recognised
from the early settlement of the financing lines with GE Capital Group.
Net impairments, charge-offs and reversals of loans, financial assets and
guarantees provided
Net impairments, charge-offs / reversals
Analysis of the performance of net impairments on loans shows a negative balance of € 9.4 million,
with a positive variation of more than € 71 million, specifically linked to the Bank’s lending portfolio
which, for the first time since 2008 when the financial crisis began, showed recoveries higher than
impairments.
Net impairments / reversals of available-for-sale financial assets
Valuation activities for available-for-sale financial assets, which essentially reflect equity interests
and related convertible loans for the Corporate Finance department, did not show significant
variations in the first half of 2014 with an impact on the income statement.
Operating expenses
Personnel expenses
This item shows a decline of € 2.8 million from the first half of 2013 (-9.3%), related to the decrease in
average number of employees for € 1.1 million, affecting both the fixed and variable salary
components and the charges incurred in the first half of 2013 for departure incentives for € 1.7
million, of which € 0.6 million for adjustments to the 2009 redundancy programme, for extension of
the inclusion in the Banking Sector Solidarity Fund.
Consolidated Half-Year Financial Report 30 June 2014
23
Other administrative expenses
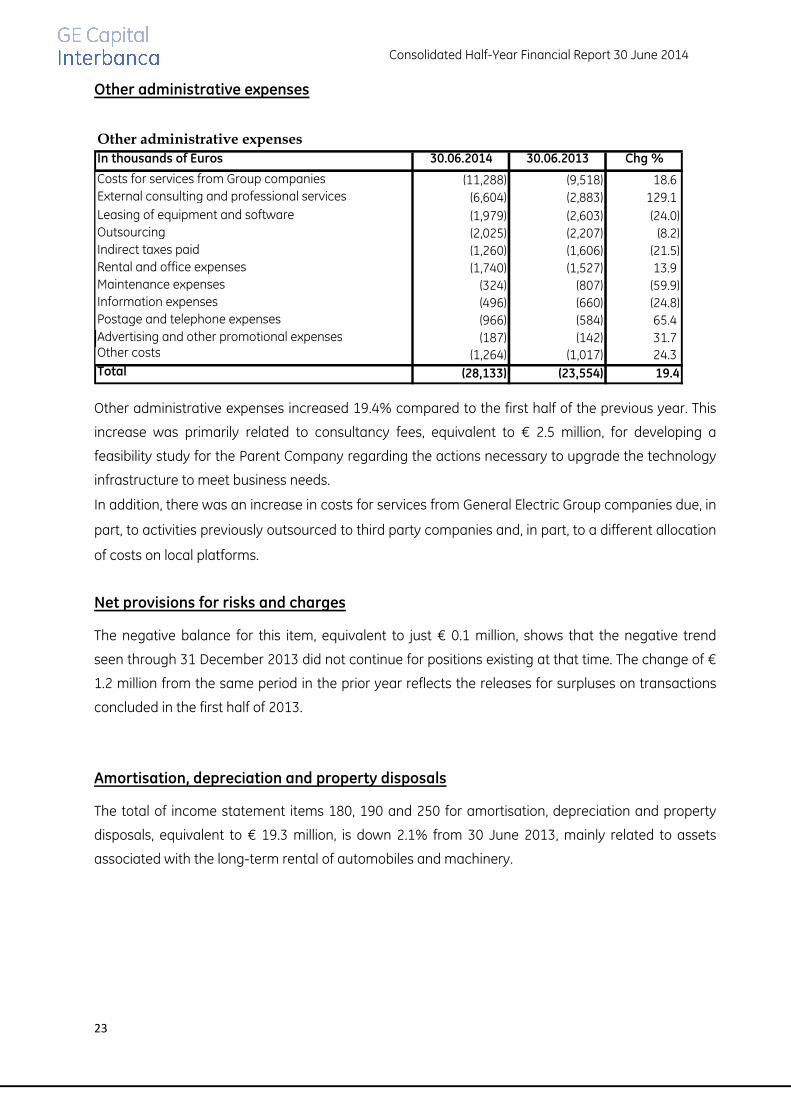
Other administrative expenses
In thousands of Euros 30.06.2014 30.06.2013 Chg %
Costs for services from Group companies (11,288) (9,518) 18.6 External consulting and professional services (6,604) (2,883) 129.1
Leasing of equipment and software (1,979) (2,603) (24.0) Outsourcing (2,025) (2,207) (8.2) Indirect taxes paid (1,260) (1,606) (21.5) Rental and office expenses (1,740) (1,527) 13.9 Maintenance expenses (324) (807) (59.9) Information expenses (496) (660) (24.8) Postage and telephone expenses (966) (584) 65.4 Advertising and other promotional expenses (187) (142) 31.7 Other costs (1,264) (1,017) 24.3 Total (28,133) (23,554) 19.4
Other administrative expenses increased 19.4% compared to the first half of the previous year. This
increase was primarily related to consultancy fees, equivalent to € 2.5 million, for developing a
feasibility study for the Parent Company regarding the actions necessary to upgrade the technology
infrastructure to meet business needs.
In addition, there was an increase in costs for services from General Electric Group companies due, in
part, to activities previously outsourced to third party companies and, in part, to a different allocation
of costs on local platforms.
Net provisions for risks and charges
The negative balance for this item, equivalent to just € 0.1 million, shows that the negative trend
seen through 31 December 2013 did not continue for positions existing at that time. The change of €
1.2 million from the same period in the prior year reflects the releases for surpluses on transactions
concluded in the first half of 2013.
Amortisation, depreciation and property disposals
The total of income statement items 180, 190 and 250 for amortisation, depreciation and property
disposals, equivalent to € 19.3 million, is down 2.1% from 30 June 2013, mainly related to assets
associated with the long-term rental of automobiles and machinery.
Consolidated Half-Year Financial Report 30 June 2014
24
Other operating expense/income
This item shows an increase of € 4.7 million compared to 30 June 2013, mainly due to the higher
contribution from invoicing of rental fees for fleet vehicles and other rental assets for € 1.8 million, as
well as charges incurred in the first half of 2013 for € 2.9 million following the settlement of tax
disputes with the Revenue Agency.
Income tax and net profit (loss) for the period
The pre-tax loss amounts to € 13.1 million and was heavily influenced by higher structural costs
compared to the revenue generated by ordinary activities.
Income tax, negative for € 0.6 million, is directly related to the prudent decision to not recognise
deferred tax assets defined according to assumptions other than those in the governing regulations
that result in the transformation to tax credits.
Therefore, net of income taxes, the loss for the period amounts to € 13.7 million, a marked
improvement compared to the result of the same period of the previous financial year that showed a
loss of € 61.1 million, caused by the positive trend in loan write-downs.
Consolidated Half-Year Financial Report 30 June 2014
25
ADDITIONAL INFORMATION
HUMAN RESOURCES
Breakdown of Personnel
The employees of the companies belonging to the scope of consolidation amount in total to 629,
including 56 with part-time contracts, compared to 621 employees present as at 31 December 2013.
Collective dismissal procedure set forth in Italian Law 223/91
The collective dismissal procedure, initiated 5 April 2013 for GE Capital Services S.r.l, was completed
on 30 June 2014 after the last employees identified as redundant in March 2014 left the company, as
provided for in the agreement signed with the trade unions on 18 June 2013 at the Ministry of
Labour.
In implementing this agreement, 17 employees were reassigned to other Group companies, 27
employees were declared redundant, and 1 employee will conclude his/her employment relationship
with the company at the end of the effective period for Law no. 104/92.
CORPORATE GOVERNANCE
The overall corporate governance framework of the Bank and all of the GE Capital Interbanca
Banking Group companies, intended as the system of rules and procedures to which corporate
bodies refer to guide their behaviour and fulfil their responsibilities, was defined in consideration of
governing legislation as well as regulations prescribed by Bank of Italy.
The Parent Company Bank and all of the companies in the GE Capital Interbanca Banking Group use
the “traditional” model that, in applying the principle of organisational independence and
proportionality, the Parent Company Bank deems the most suitable model to ensure management
independence, operating efficiency and effectiveness of controls to achieve sound and prudent
management, allowing a clear distinction of roles and responsibilities, an appropriate division of
powers and balanced composition of bodies.
Modifications to the current internal corporate governance rules are currently being defined to
reflect recent regulations issued by the supervisory authority.
MANAGEMENT AND COORDINATION ACTIVITIES As at 30 June 2014, GE Capital Interbanca S.p.A. performs management and coordination activities
for the companies of the GE Capital Interbanca Banking Group, in accordance with Article 2497 et
sequitur of the Italian Civil Code. In performing these activities, GE Capital Interbanca S.p.A., as Parent
Company of the GE Capital Interbanca Banking Group, issues directives to Group companies for
Consolidated Half-Year Financial Report 30 June 2014
26
carrying out instructions issued by Bank of Italy to maintain the Banking Group stability in
accordance with art. 61 of Italian Legislative Decree no. 385/93.
As Parent Company, the Bank decided not to have an ad-hoc department for the management and
coordination of the GE Capital Interbanca Banking Group and for the management of equity
investments in the companies belonging to the Group. This choice was justified by the GE Capital
Interbanca Banking Group’s size and the current level of organisational complexity.
However, it was deemed necessary to equip the Parent Company and the GE Capital Interbanca
Banking Group with a management and control structure based on two pillars: the senior
management of the Parent Company and the GE Capital Interbanca Banking Group companies and
an internal set of rules.
The General Meeting of Shareholders of the Parent Company Bank resolved on 31 January 2012 to
approve the Articles of Association that define GE Capital Corporation as the company performing
activities of management and coordination for GE Capital Interbanca S.p.A., pursuant to art. 2497-bis
of the Italian Civil Code.
RELATIONS WITH SUPERVISORY BODIES
The GE Capital Interbanca Banking Group fulfils reporting requirements with Bank of Italy (and other
supervisory authorities) according to the imposed methodologies and timing.
Specifically, note that, in the first the first half of 2014, there were new supervisory regulations for
reporting on internal audit systems, information systems and operational continuity, as set out in
Bank of Italy Circular no. 263/2006 and subsequent amendments.
Following the Supervisory Review and Evaluation Process (SREP) conducted in 2013, Bank of Italy, in
reviewing the capital objectives for leading intermediaries in the banking system, requested GE
Capital Interbanca S.p.A. (in Protocol no. 144784/14 of 10 February 2014), as Parent Company, to
maintain a consolidated Common Equity Tier 1 ratio greater than 9.5% and a consolidated Total
Capital ratio of at least 11.5%. The Parent Company Bank's Board of Directors and Board of Statutory
Auditors were informed of this request by the competent internal departments during the Parent
Company Bank’s Board of Directors meeting held on 27 February 2014.
During the first half of 2014, the Parent Company Bank also periodically informed Bank of Italy
regarding the process, currently underway, of strengthening the Bank’s Common Equity Tier 1 ratio.

Consolidated Half-Year Financial Report 30 June 2014
27
RELATIONS WITH THE REVENUE AGENCY
Note that tax assessment notices and notifications of penalties were received by GE Capital Servizi
Finanziari S.p.A and GE Capital Services S.r.l, related to the claim that the companies had not properly
applied withholding taxes on interest expense paid to the Hungarian lender for funding provided
during the 2007 and 2008 tax years.
In reference to said withholding taxes, the Group companies, including the Parent Company,
responded to specific questionnaires from the Revenue Agency regarding interest paid in 2009.
Subsequently, on 16 May 2014, GE Capital Services S.r.l. received a tax assessment notice and
notification of penalty for the 2009 tax year. The only hearing that had been set so far in relation to
the 2007 tax year for GE Capital Servizi Finanziari S.p.A. was rescheduled on petition by both parties.
Furthermore, note that GE Capital Servizi Finanziari S.p.A. is involved in a dispute for the 2004-2008
period in relation to loan impairments/losses and pro-rated VAT. The company has filed petitions
against all of the tax assessment notices with the appropriate levels of jurisdiction. At present, the
dispute regarding the non-deductibility of the loan write-downs for 2005 was definitively resolved
with the ruling in the Bank’s favour, while a positive ruling was issued by the Provincial Tax
Commission for 2007. As regards the 2004 tax year, the positive ruling in the first instance was
overturned in the second instance and an appeal is underway with the Court of Cassation. The
hearing set for the 2008 tax year was postponed until December 2014. With regard to the dispute
involving the pro-rated VAT, the Bank will appeal the negative ruling issued in the first instance for
the 2007 tax year, for which external tax consultants agree that the Bank has a strong case.
At the time these consolidated financial statements were being drafted, the aforementioned
companies, confident that the findings in the tax assessment notices were baseless, submitted,
within the timing prescribed by law, tax settlement proposals, appeals and statements in their
defence in relation to the penalties applied, and paid one-third of the tax amount pending the
resolution of the dispute, amounting to € 14.3 million. This amount was recognised in the financial
statements under "Other assets".
Finally, note that on 10 March 2014, the Revenue Agency – Milan Office of Major Taxpayers - initiated
a tax audit at GE Capital Interbanca S.p.A.
The audit covers direct taxes (IRES, IRAP), VAT and required substitute taxes for the 2010 and 2011
tax years. On 4 June 2014, the audit was extended to the 2009 tax year, solely with regard to the
correct application of withholding taxes on intercompany interest expense.
The findings report, issued 31 July 2014, claimed that withholding taxes had not been applied on
interest expense paid in the 2009, 2010 and 2011 tax years to GE Holding Hungary, GE Infrastucture
and GE Hungary KFT for loans disbursed to the Bank.
Moreover, note that, upon receiving that tax assessment notice for the respective tax years, GE
Capital Interbanca S.p.A. will take all appropriate and necessary actions to challenge and refute, at
the pertinent judicial level, the claims and any allegations by the financial administration in terms of
Consolidated Half-Year Financial Report 30 June 2014
28
both higher withholdings as well as penalties and interest, as has already been undertaken for the
other companies mentioned above.
TAX CONSOLIDATION
The current scope of the National Tax Consolidation Scheme includes GE Capital Interbanca S.p.A. (as
consolidating company), together with GE Capital Servizi Finanziari S.p.A., GE Capital Finance S.r.l., GE
SPV S.r.l. and GE Capital Services S.r.l. (as consolidated companies).
Consistent with adopted General Electric Group practices, the consolidation agreements in effect
within the Italian tax group envisage that any tax losses brought into the tax consolidation by
individual companies are not reimbursed to said companies. In addition, the agreements envisage
that taxes on any taxable income due from individual entities making up the tax group are
reimbursed only if, and to the extent that, they are effectively paid to tax authorities by the
consolidating body, on the basis of the results of the Group’s tax consolidation.
Consolidated Half-Year Financial Report 30 June 2014
29
SHAREHOLDERS AND SHARES
As at 22 December 2009, GE Capital Corporation became the shareholder of GE Capital Interbanca
S.p.A., with a 99.99% shareholding.
On 24 April 2014, GE Capital Corporation transferred to the subsidiary GE Capital Global Financial
Holding Inc. 5% of its investment in GE Capital Interbanca S.p.A, which represents approximately
4.99% of the total share capital of the latter.
As a result, as at 30 June 2014, the primary shareholders of GE Capital Interbanca S.p.A. are:
• GE Capital Corporation, with registered office in the United States of America, wholly owned
by General Electric Company;
• GE Capital Global Financial Holdings Inc., with registered office in the United States of
America, a subsidiary of GE Capital Corporation; the financial data of GE Capital Global
Financial Holdings Inc. is included in the consolidated financial statements of GE Capital
Corporation.
Since 2011, GE Capital Corporation and GE Capital Global Financial Holding Inc. are subject to
supervision by the Federal Reserve.
Note that on 16 April 2014, the Board of Directors of GE Capital Interbanca S.p.A. resolved to
restructure the intercompany debt of the Parent Company Bank, as previously indicated, as well as
to recapitalise the company through the injection of capital (to be included in the Bank’s Common
Equity Tier 1) equivalent to € 550 million from the controlling shareholder GE Capital Corporation Inc.,
or a subsidiary of the latter.
Consolidated Half-Year Financial Report 30 June 2014
30
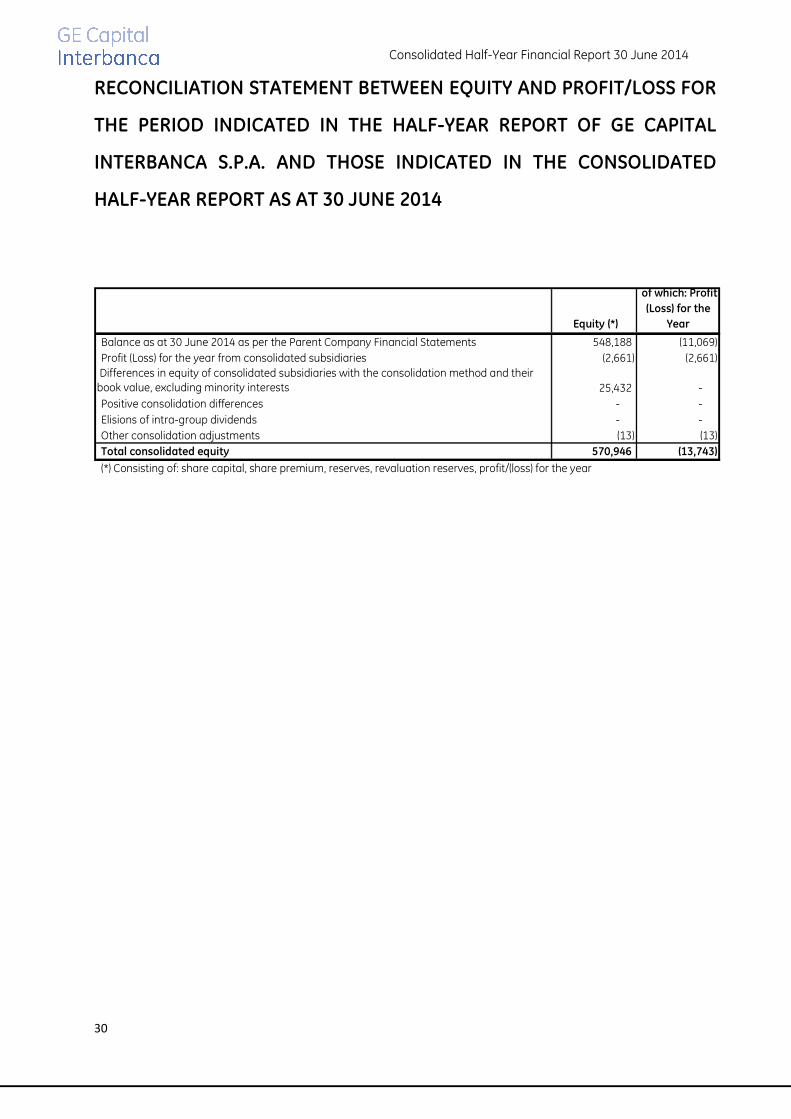
RECONCILIATION STATEMENT BETWEEN EQUITY AND PROFIT/LOSS FOR
THE PERIOD INDICATED IN THE HALF-YEAR REPORT OF GE CAPITAL
INTERBANCA S.P.A. AND THOSE INDICATED IN THE CONSOLIDATED
HALF-YEAR REPORT AS AT 30 JUNE 2014
Equity (*)
of which: Profit
(Loss) for the
Year
Balance as at 30 June 2014 as per the Parent Company Financial Statements 548,188 (11,069)
Profit (Loss) for the year from consolidated subsidiaries (2,661) (2,661)
Differences in equity of consolidated subsidiaries with the consolidation method and their
book value, excluding minority interests 25,432 -
Positive consolidation differences - -
Elisions of intra-group dividends - -
Other consolidation adjustments (13) (13)
Total consolidated equity 570,946 (13,743)
(*) Consisting of: share capital, share premium, reserves, revaluation reserves, profit/(loss) for the year
Consolidated Half-Year Financial Report 30 June 2014
31
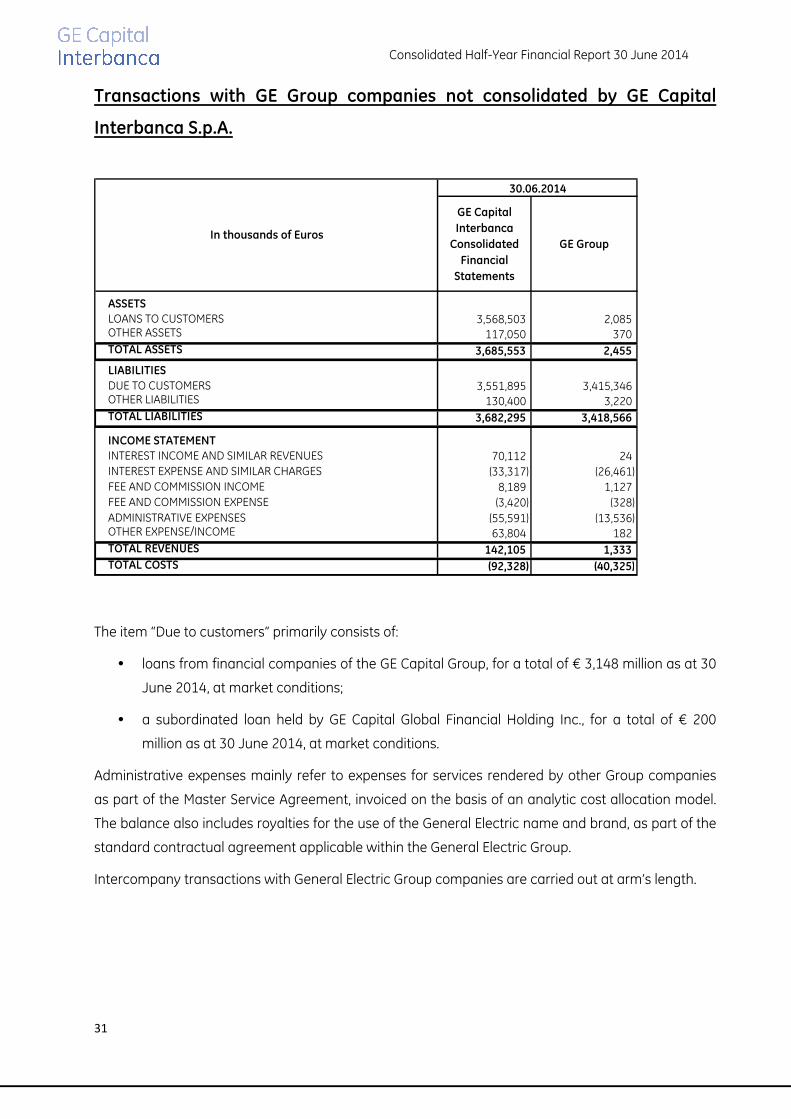
Transactions with GE Group companies not consolidated by GE Capital
Interbanca S.p.A.
GE Capital
Interbanca
Consolidated
Financial
Statements
GE Group
ASSETS
LOANS TO CUSTOMERS 3,568,503 2,085OTHER ASSETS 117,050 370TOTAL ASSETS 3,685,553 2,455
LIABILITIES
DUE TO CUSTOMERS 3,551,895 3,415,346 OTHER LIABILITIES 130,400 3,220 TOTAL LIABILITIES 3,682,295 3,418,566
INCOME STATEMENT
INTEREST INCOME AND SIMILAR REVENUES 70,112 24 INTEREST EXPENSE AND SIMILAR CHARGES (33,317) (26,461) FEE AND COMMISSION INCOME 8,189 1,127 FEE AND COMMISSION EXPENSE (3,420) (328)
ADMINISTRATIVE EXPENSES (55,591) (13,536) OTHER EXPENSE/INCOME 63,804 182 TOTAL REVENUES 142,105 1,333
TOTAL COSTS (92,328) (40,325)
In thousands of Euros
30.06.2014
The item “Due to customers” primarily consists of:
• loans from financial companies of the GE Capital Group, for a total of € 3,148 million as at 30
June 2014, at market conditions;
• a subordinated loan held by GE Capital Global Financial Holding Inc., for a total of € 200
million as at 30 June 2014, at market conditions.
Administrative expenses mainly refer to expenses for services rendered by other Group companies
as part of the Master Service Agreement, invoiced on the basis of an analytic cost allocation model.
The balance also includes royalties for the use of the General Electric name and brand, as part of the
standard contractual agreement applicable within the General Electric Group.
Intercompany transactions with General Electric Group companies are carried out at arm’s length.

Consolidated Half-Year Financial Report 30 June 2014
32
EVENTS AFTER THE REPORTING DATE AND OUTLOOK FOR THE
YEAR IN PROGRESS
Not applicable.
Business outlook
In the coming months, global market conditions indicate a situation of relative uncertainty and
stagnation for businesses in Europe, and to a larger degree, Italy.
This situation will continue to have a negative impact on both consumption and investments in the
country during the second half of 2014.
To counteract these trends, the ECB is ready to launch the new LTRO (Long Term Refinancing
Operations) programme that will inject liquidity into the banking system and facilitate access to
credit for businesses at a lower cost.
Italian banks have already requested € 52 billion in new loans from the ECB, which they will be
required to disburse to businesses.
If, on one hand, this new low-cost liquidity will likely bring about a contraction in margins, on the
other, it is hoped that it will generate a virtuous increase in credit demand from companies, with a
return in confidence for new investments.
Within this context, GE Capital Interbanca Banking Group will operate in a scenario of profitable
growth and a stable competitive recovery in its activities.
Consolidated Half-Year Financial Report 30 June 2014
33
ABRIDGED CONSOLIDATED
HALF-YEAR FINANCIAL STATEMENTS

Consolidated Half-Year Financial Report 30 June 2014
34
CONSOLIDATED STATEMENTS
Consolidated Half-Year Financial Report 30 June 2014
35
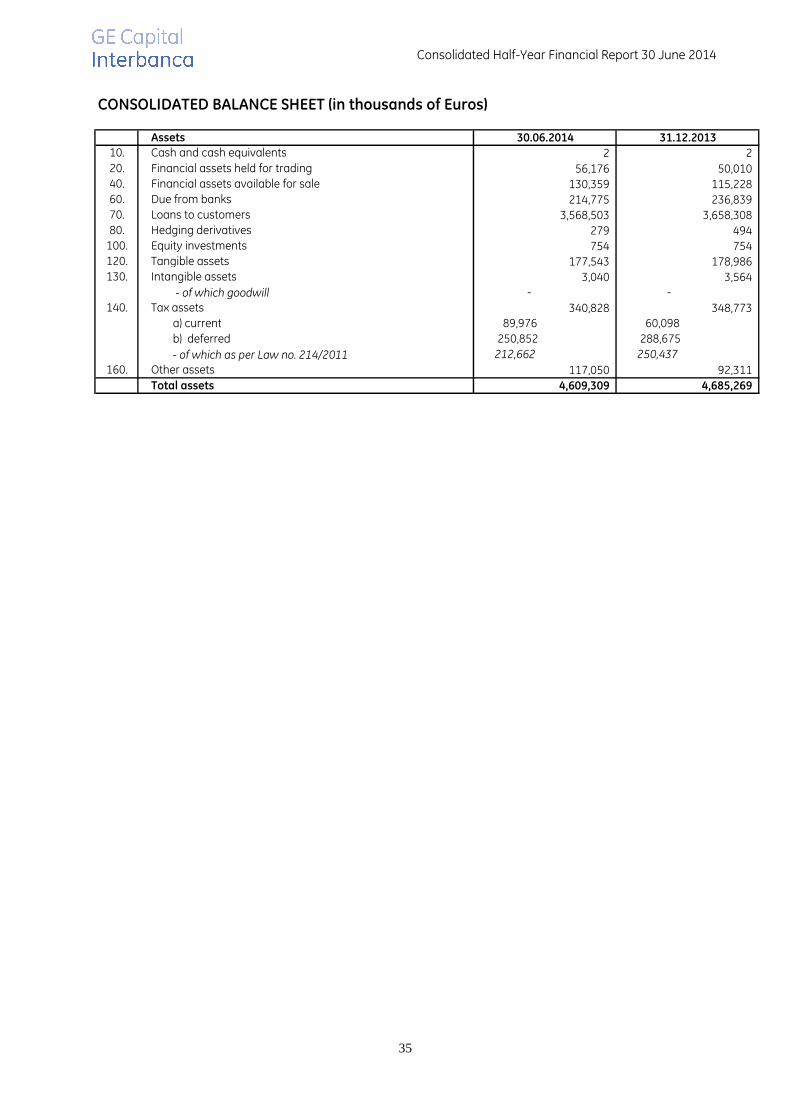
Assets
10. Cash and cash equivalents 2 2
20. Financial assets held for trading 56,176 50,010 40. Financial assets available for sale 130,359 115,228 60. Due from banks 214,775 236,839 70. Loans to customers 3,568,503 3,658,308 80. Hedging derivatives 279 494
100. Equity investments 754 754 120. Tangible assets 177,543 178,986 130. Intangible assets 3,040 3,564
- of which goodwill - -
140. Tax assets 340,828 348,773
a) current 89,976 60,098
b) deferred 250,852 288,675
- of which as per Law no. 214/2011 212,662 250,437
160. Other assets 117,050 92,311
Total assets 4,609,309 4,685,269
30.06.2014 31.12.2013
CONSOLIDATED BALANCE SHEET (in thousands of Euros)
Consolidated Half-Year Financial Report 30 June 2014
36
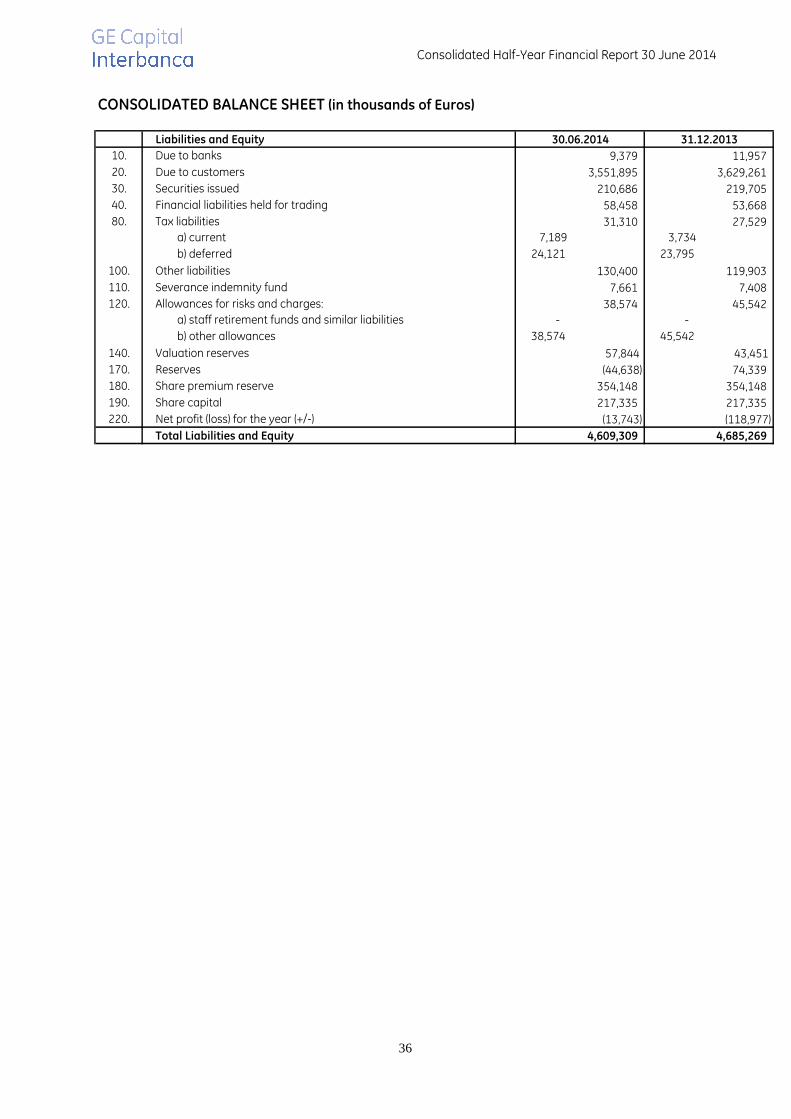
Liabilities and Equity
10. Due to banks 9,379 11,957
20. Due to customers 3,551,895 3,629,261
30. Securities issued 210,686 219,705
40. Financial liabilities held for trading 58,458 53,668
80. Tax liabilities 31,310 27,529
a) current 7,189 3,734
b) deferred 24,121 23,795
100. Other liabilities 130,400 119,903
110. Severance indemnity fund 7,661 7,408
120. Allowances for risks and charges: 38,574 45,542
a) staff retirement funds and similar liabilities - -
b) other allowances 38,574 45,542
140. Valuation reserves 57,844 43,451
170. Reserves (44,638) 74,339
180. Share premium reserve 354,148 354,148
190. Share capital 217,335 217,335
220. Net profit (loss) for the year (+/-) (13,743) (118,977)
Total Liabilities and Equity 4,609,309 4,685,269
31.12.201330.06.2014
CONSOLIDATED BALANCE SHEET (in thousands of Euros)
Consolidated Half-Year Financial Report 30 June 2014
37
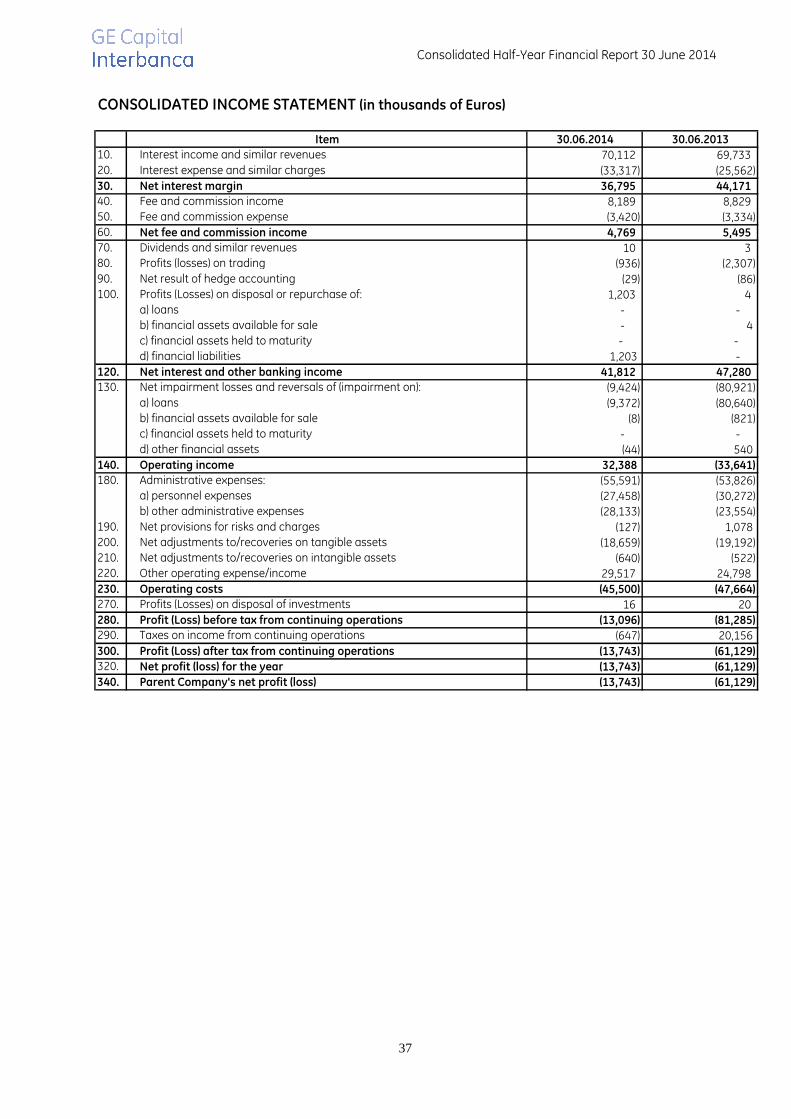
Item 30.06.2014 30.06.2013
10. Interest income and similar revenues 70,112 69,733
20. Interest expense and similar charges (33,317) (25,562)
30. Net interest margin 36,795 44,171
40. Fee and commission income 8,189 8,829 50. Fee and commission expense (3,420) (3,334) 60. Net fee and commission income 4,769 5,495
70. Dividends and similar revenues 10 3 80. Profits (losses) on trading (936) (2,307)
90. Net result of hedge accounting (29) (86) 100. Profits (Losses) on disposal or repurchase of: 1,203 4
a) loans - - b) financial assets available for sale - 4 c) financial assets held to maturity - - d) financial liabilities 1,203 -
120. Net interest and other banking income 41,812 47,280
130. Net impairment losses and reversals of (impairment on): (9,424) (80,921)
a) loans (9,372) (80,640) b) financial assets available for sale (8) (821) c) financial assets held to maturity - - d) other financial assets (44) 540
140. Operating income 32,388 (33,641)
180. Administrative expenses: (55,591) (53,826) a) personnel expenses (27,458) (30,272) b) other administrative expenses (28,133) (23,554)
190. Net provisions for risks and charges (127) 1,078 200. Net adjustments to/recoveries on tangible assets (18,659) (19,192) 210. Net adjustments to/recoveries on intangible assets (640) (522) 220. Other operating expense/income 29,517 24,798
230. Operating costs (45,500) (47,664)
270. Profits (Losses) on disposal of investments 16 20
280. Profit (Loss) before tax from continuing operations (13,096) (81,285)
290. Taxes on income from continuing operations (647) 20,156
300. Profit (Loss) after tax from continuing operations (13,743) (61,129)
320. Net profit (loss) for the year (13,743) (61,129)
340. Parent Company's net profit (loss) (13,743) (61,129)
CONSOLIDATED INCOME STATEMENT (in thousands of Euros)
Consolidated Half-Year Financial Report 30 June 2014
38
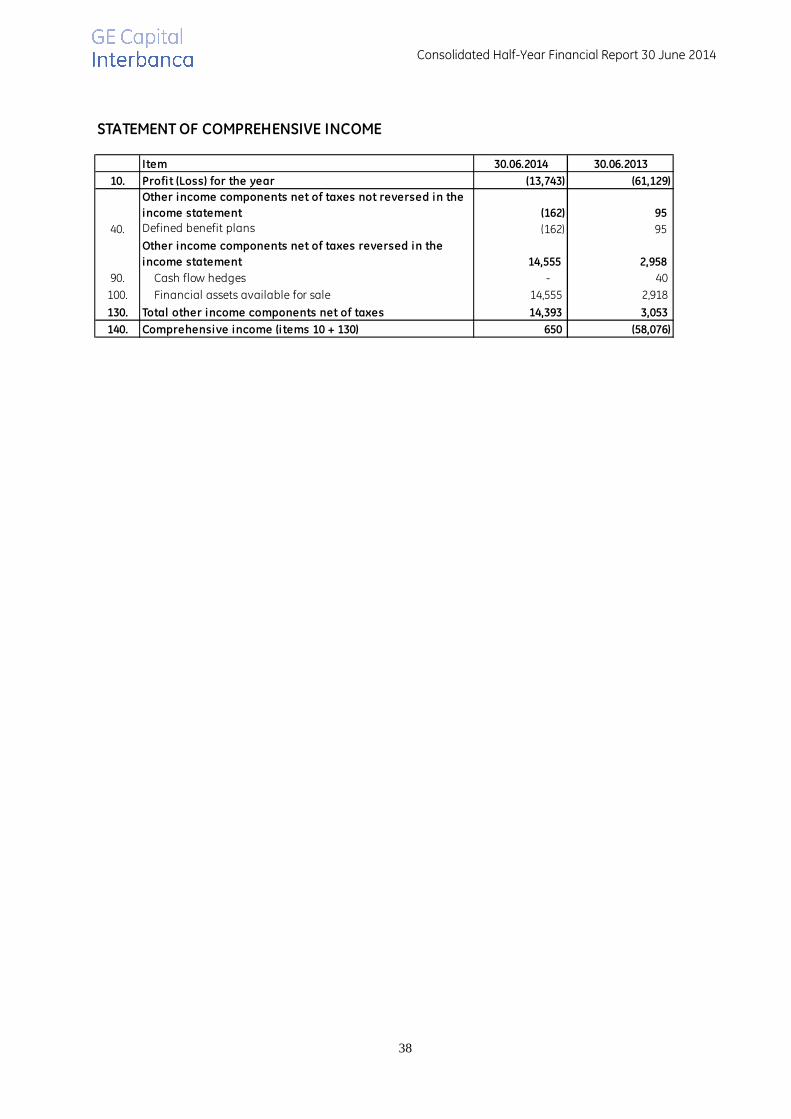
Item 30.06.2014 30.06.2013
10. Profit (Loss) for the year (13,743) (61,129)
Other income components net of taxes not reversed in the
income statement (162) 95
40. Defined benefit plans (162) 95
Other income components net of taxes reversed in the
income statement 14,555 2,958
90. Cash flow hedges - 40
100. Financial assets available for sale 14,555 2,918
130. Total other income components net of taxes 14,393 3,053
140. Comprehensive income (items 10 + 130) 650 (58,076)
STATEMENT OF COMPREHENSIVE INCOME

Consolidated Half-Year Financial Report 30 June 2014
39
STATEMENT OF CHANGES IN CONSOLIDATED EQUITY
Issu
e o
f n
ew
sh
are
s
Pu
rch
ase
of
tre
asu
ry s
ha
res
Ext
rao
rdin
ary
div
ide
nd
s
Ch
an
ge
s in
eq
uit
y
inst
rum
en
ts
De
riv
ati
ve
s o
n t
rea
sury
sha
res
Sto
ck o
pti
on
s
Share capital: 217,335 - 217,335 - - - - - - - - - - 217,335
a) ordinary shares 217,335 - 217,335 - - - - - - - - - - 217,335 b) other shares - - - - - - - - - - - - - -
Share premium reserve 354,148 - 354,148 - - - - - - - - - - 354,148
Reserves: 243,047 - 243,047 (168,707) - - - - - - - - - 74,340
a) retained earnings 168,155 - 168,155 (168,707) - - - - - - (552) b) other 74,892 - 74,892 - - - - - - - - - - 74,892
Valuation reserves: (*) 39,133 - 39,133 3,053 42,186
Equity instruments - - - - - - - - - - - - - -
Treasury shares - - - - - - - - - - - - - -
Net profit (loss) for the year (168,707) - (168,707) 168,707 - - - - - - - - (61,129) (61,129)
Equity 684,956 - 684,956 - - - - - - - - - (58,076) 626,880
CONSOLIDATED STATEMENT OF CHANGES IN EQUITY (30 June 2013)
Ba
lan
ces
as
at
31
.12
.20
12
Ch
an
ge
s in
op
en
ing
ba
lan
ce
s
Ba
lan
ces
as
at
1.1
.20
13
Allocation of prior
year's resultChanges in the year
Eq
uit
y a
s a
t 3
0.0
6.2
01
3
Reserves
Div
ide
nd
s a
nd
oth
er
all
oca
tio
ns
Changes in
reserves
Movements in equity
20
13
co
mp
reh
en
siv
e in
com
e
Consolidated Half-Year Financial Report 30 June 2014
40
Issu
e o
f n
ew
sh
are
s
Pu
rch
ase
of
tre
asu
ry s
ha
res
Ext
rao
rdin
ary
div
ide
nd
s
Ch
an
ge
s in
eq
uit
y
inst
rum
en
ts
De
riv
ati
ve
s o
n t
rea
sury
sha
res
Sto
ck o
pti
on
s
Share capital: 217,335 - 217,335 - - - - - - - - - - 217,335
a) ordinary shares 217,335 - 217,335 - - - - - - - - - - 217,335 b) other shares - - - - - - - - - - - - - -
Share premium reserve 354,148 - 354,148 - - - - - - - - - - 354,148
Reserves: 74,339 - 74,339 (118,977) - - - - - - - - - (44,638)
a) retained earnings - - - - - - - - - - - - b) other 74,339 - 74,339 (118,977) - - - - - - - - - (44,638)
Valuation reserves: (*) 43,451 - 43,451 - - - - - - - - - 14,393 57,844
Equity instruments - - - - - - - - - - - - - -
Treasury shares - - - - - - - - - - - - - -
Net profit (loss) for the year (118,977) - (118,977) 118,977 - - - - - - - - (13,743) (13,743)
Equity 570,296 - 570,296 - - - - - - - - - 650 570,946
Div
ide
nd
s a
nd
oth
er
all
oca
tio
ns
Changes in
reserves
Movements in equity
20
14
co
mp
reh
en
siv
e in
com
e
CONSOLIDATED STATEMENT OF CHANGES IN EQUITY (30 June 2014)
Ba
lan
ces
as
at
31
.12
.20
13
Ch
an
ge
s in
op
en
ing
ba
lan
ce
s
Ba
lan
ces
as
at
1.1
.20
14
Allocation of prior
year's resultChanges in the year
Eq
uit
y a
s a
t 3
0.0
6.2
01
4
Reserves
Consolidated Half-Year Financial Report 30 June 2014
41
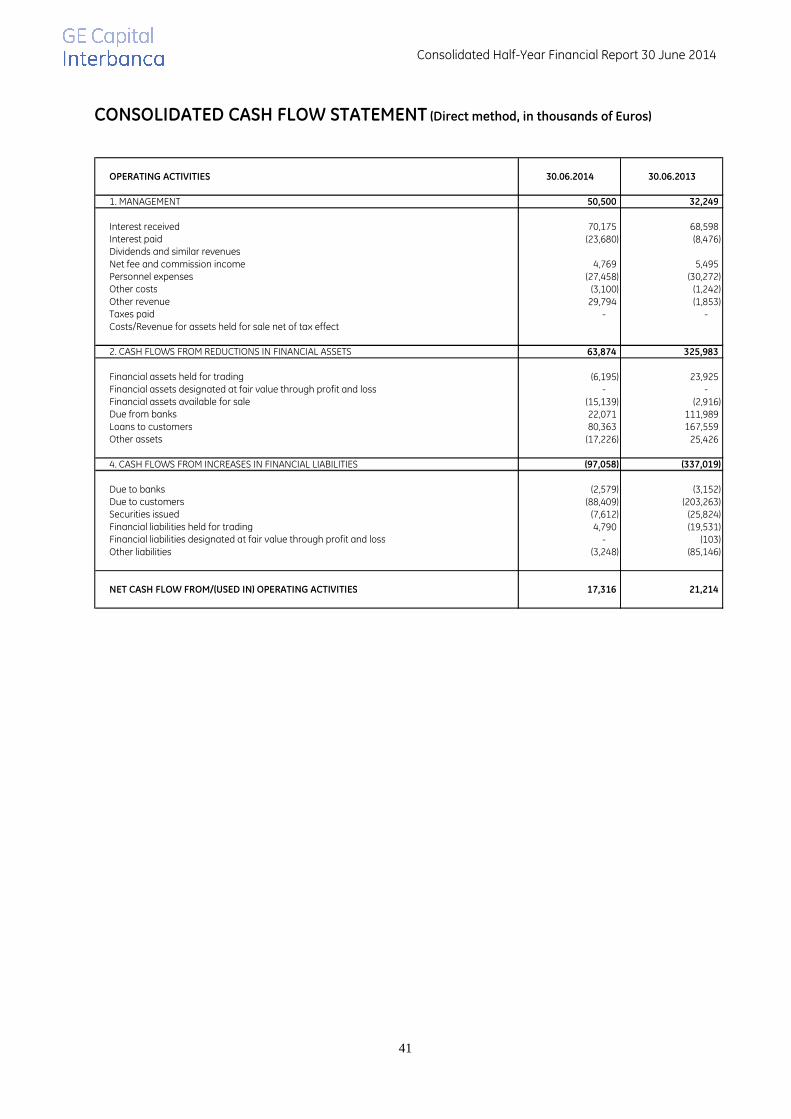
CONSOLIDATED CASH FLOW STATEMENT (Direct method, in thousands of Euros)
OPERATING ACTIVITIES 30.06.2014 30.06.2013
1. MANAGEMENT 50,500 32,249
Interest received 70,175 68,598 Interest paid (23,680) (8,476) Dividends and similar revenuesNet fee and commission income 4,769 5,495 Personnel expenses (27,458) (30,272) Other costs (3,100) (1,242) Other revenue 29,794 (1,853) Taxes paid - - Costs/Revenue for assets held for sale net of tax effect
2. CASH FLOWS FROM REDUCTIONS IN FINANCIAL ASSETS 63,874 325,983
Financial assets held for trading (6,195) 23,925 Financial assets designated at fair value through profit and loss - - Financial assets available for sale (15,139) (2,916) Due from banks 22,071 111,989 Loans to customers 80,363 167,559 Other assets (17,226) 25,426
4. CASH FLOWS FROM INCREASES IN FINANCIAL LIABILITIES (97,058) (337,019)
Due to banks (2,579) (3,152) Due to customers (88,409) (203,263) Securities issued (7,612) (25,824) Financial liabilities held for trading 4,790 (19,531) Financial liabilities designated at fair value through profit and loss - (103) Other liabilities (3,248) (85,146)
NET CASH FLOW FROM/(USED IN) OPERATING ACTIVITIES 17,316 21,214

Consolidated Half-Year Financial Report 30 June 2014
42
INVESTING ACTIVITIES 30.06.2014 30.06.2013
1. CASH FLOW FROM 16 1,520
Sale of equity investmentsDividends received 1,500Sale/Repayment of financial assets held to maturitySale of tangible assets 16 20 Sale of intangible assetsSale of business units
2. CASH FLOW USED IN 17,332 22,735
Acquisition of equity investments - 0Acquisition of financial assets held to maturityAcquisition of tangible assets 17,216 22,185 Acquisition of intangible assets 116 550 Acquisition of business units
NET CASH FLOW FROM/(USED IN) INVESTING ACTIVITIES (17,316) (21,215)
FINANCING ACTIVITIES
1. CASH FLOW FROM - -
Proceeds from the issue of share capital / repurchase of treasury sharesProceeds from the issue of equity instruments / repurchase of equity instruments Dividends paid - -
NET CASH FLOW FROM/(USED IN) FINANCING ACTIVITIES - -
NET INCREASE (DECREASE) IN CASH AND CASH EQUIVALENTS DURING THE YEAR - (1)
RECONCILIATION 30.06.2014 30.06.2013
Cash and cash equivalents at beginning of the year 2 1
Total increase/(decrease) in cash and cash equivalents during the year - (1)
Cash and cash equivalents at end of the year 2 -
Consolidated Half-Year Financial Report 30 June 2014
43
EXPLANATORY NOTES
Consolidated Half-Year Financial Report 30 June 2014
44
ACCOUNTING POLICIES
BASES FOR PREPARATION, PRESENTATION AND VALUATION
In preparing the Consolidated Half-Year Financial Report, the same accounting principles for the preparation of the financial statements as at 31 December 2013 were applied. The consolidated financial statements were prepared in accordance with the IFRS issued by the International Accounting Standards Board (IASB) and endorsed by the European Union pursuant to Regulation No. 1606/2002. These abridged consolidated half-year financial statements were prepared in summary form in accordance with IAS 34 "Interim Financial Reporting". Therefore, these abridged half-year financial statements do not include all the information required for the annual financial statements and must be read together with the annual financial statements prepared for the year ending on 31 December 2013. In compliance with IAS 34, the report consists of the balance sheet, the income statement, the statement of comprehensive income, the statement of changes in equity, the cash flow statement and all information needed to understand the business and equity situation and the results for the period. It is also accompanied by the Directors’ Report. Unless otherwise stated, the half-year report has been prepared in thousands of Euros and is based on the following overall considerations set by IAS 1.
� Going concern. Assets, liabilities, and off-balance sheet transactions are valued assuming the entity’s ability to continue as a going concern.
� Accrual basis of accounting. Costs and revenues are accrued and are recognised when they satisfy the definitions and recognition criteria.
� Consistency of presentation. The presentation and classification of items in the financial statements are retained from one period to the next unless a change is justified by a requirement of a new international accounting standard (IAS/IFRS) or an interpretation (SIC) or where it is deemed necessary to increase the relevance and reliability of the accounting presentation. In the event of change, the new criteria will be adopted retrospectively – as far as possible – providing details of the nature, reason and amount of the affected items. The presentation and classification of the items comply with the regulations prescribed by the Bank of Italy with regard to banks’ financial statements.
� Materiality and aggregation. In accordance with the regulations prescribed by the Bank of Italy for banks’ financial statements, each material class of similar items is presented separately. Dissimilar items, instead, are aggregated unless they are material.
� Offsetting is not allowed. The Group’s assets and liabilities, income and expenses are not offset unless required or permitted by an international accounting standard (IAS/IFRS), an interpretation (SIC) or the regulations prescribed by the Bank of Italy.
� Comparative figures. Comparative data for the previous year is provided with regard to all the information provided in these financial statements – also qualitative information where deemed useful for a better understanding of the Group’s situation – unless otherwise required and permitted by an international accounting standard or a related interpretation.
Consolidated Half-Year Financial Report 30 June 2014
45
Notes on the Principal Accounting Items
Financial assets held for trading
Classification criteria This category includes debt and equity securities and the positive fair value of derivative contracts, held with the intention of generating short-term profits from price changes in said instruments. Derivative contracts include those embedded in combined financial instruments that are separately recognised where: � the economic characteristics and risks of the embedded derivative are not closely related to the
economic characteristics and risks of the host contract; � a separate instrument with the same conditions as the embedded derivative would meet the
definition of a derivative; � the (combined) hybrid instrument is not recorded among financial assets and liabilities held for
trading. An embedded derivative financial instrument is the component of a (combined) hybrid instrument that also includes a non-derivative host contract, with the effect that some of the cash flows of the combined instrument vary in a manner similar to those of the stand-alone derivative.
Initial recognition and subsequent derecognition criteria Financial assets such as debt and equity securities are initially recognised on the settlement date whereas derivative contracts are recognised on the subscription date. Financial assets held for trading are initially recognised at cost, deemed as the fair value of the instrument, without considering any transaction costs or revenues directly attributable to the instrument. The embedded derivative in the structured instruments not closely related to the host contract and that meets the definition of a derivative instrument is recorded separately from the host contract and measured at fair value whereas the host contract is accounted for in accordance with the requirements of the relevant IFRS. Financial assets are derecognised when the contractual rights to the cash flows from those financial assets expire or when the financial assets are sold, transferring substantially all the risks and benefits of ownership.
Measurement criteria After initial recognition, financial assets held for trading are recorded at fair value. Fair value is determined by reference to the prices recorded in active markets, prices provided by market operators or internal valuation models commonly used by market participants, which take into account all risk factors related to the instruments and are based on observable market data. Specifically, the instruments included in this item are unlisted derivative instruments that are valued using generally accepted valuation models populated on the basis of market parameters. Counterparty risk related to existing derivatives with corporate counterparties was estimated using the PD and LGD parameters on which the model for collective loan impairment was based.
Consolidated Half-Year Financial Report 30 June 2014
46
Financial assets available for sale
Classification criteria Available-for-sale financial assets are those non-derivative financial assets that are designated as available for sale or are not classified as Loans and receivables, Assets held for trading or Assets held to maturity. In particular, this category includes all securities that act as liquidity reserves for the Bank, securities relating to investments in guarantee and placement syndicates, convertible notes held by the Bank as part of its equity investment activities, shareholdings held by the Group, excluded from the trading book and that cannot be classified as interests in subsidiaries, associates, or joint ventures, including private equity investments as well as shares of subscribed syndicated loans that are originally designated as available for sale.
Initial recognition and subsequent derecognition criteria Initial recognition of financial assets under this category occurs on the settlement date for debt securities and equity instruments and on the disbursement date for loans. Financial assets are initially recognised at cost, deemed as the fair value of the instrument, inclusive of any transaction cost or revenue directly attributable to the instrument. Financial assets are derecognised when the contractual rights to the cash flows from those financial assets expire or when the financial assets are sold, essentially transferring all the risks and benefits of ownership related to them.
Measurement criteria Subsequent to initial recognition, financial assets available for sale are measured at fair value, the interest (as per application of amortised cost) is recognised in the income statement whereas any gain and loss arising from changes in fair value is recorded in a specific Equity reserve until the financial asset is derecognised or an impairment loss is recorded. When the financial assets are sold or become impaired, the cumulative gain or loss is transferred to the income statement. Capital instruments for which fair value cannot be reliably measured according to the above guidelines are stated at cost. The fair value of debt instruments included in this category is calculated based on market prices for listed instruments, or, for unlisted instruments, based on the discounted contractual cash flows using interest rates representing the credit risk of the security being valued, derived from the market. The fair value of equity instruments included in this category is calculated, for listed instruments, based on market prices, or, for unlisted instruments, based on commonly used valuation models with parameters taken from the market. At each balance sheet date or interim report date, the financial assets included in this portfolio are assessed for indication of impairment. In the event of impairment, the loss is recognised in the income statement as the difference between the value on initial recognition and the fair value on the reference date. The impairment indicators on equity instruments can be divided into two categories: � internal factors inherent to the company in question, and therefore, qualitative; � external factors resulting from the business market value (only for listed equity instruments), and
therefore quantitative.
The qualitative indicators include the following factors deemed significant: a significant variance from budget or forecast objectives as per long-term business plans, the announcement or initiation of restructuring plans or insolvency or bankruptcy proceedings. Among the quantitative factors external to the company, the following are important indicators of potential issues for equity instruments: the listing of the security under the initial recognition value by more than 20% or for an on-going period of more than 9 months.
Consolidated Half-Year Financial Report 30 June 2014
47
The presence of a listing more than 20% lower than the initial recognition value or for a continuous period of more than 9 months results in the recognition of impairment. In the other cases, the recognition of the loss in value must be corroborated also by the result of specific analysis relating to the security and the investment. For debt instruments, objective evidence of impairment is ascribable to events following the initial recognition that negatively affect the estimate of future cash flows of the investment. If, in a subsequent period, the reasons for impairment cease to exist following an event occurring after the impairment was recognised, the previously recognised impairment loss is reversed, the reversal being recognised in the income statement in the case of loans or debt securities or under equity in the case of equity instruments. The amount of the reversal cannot, in any case, exceed the amortised cost the instrument would have had in the absence of said adjustments.
Loans and receivables
Classification criteria Loans and receivables represent loans to customers and amounts due from banks, both directly provided and acquired from third parties, with fixed or determinable payments, that are not listed on an active market and other than those that upon initial recognition are designated as available for sale. They also include trade receivables – other than those associated with payment for goods and services provided, classified under “other assets” – repurchase agreements, receivables originating from finance lease transactions and securities acquired by subscription or private placement, with fixed or determinable payments, that are not listed in active markets. Loans and receivables acquired without recourse are included under loans and receivables only upon verification that no contractual clauses would significantly invalidate the transfer of all risks and benefits to the transferee company.
Initial recognition and subsequent derecognition criteria Loans and receivables are initially recognised on the date they are disbursed or, in the case of debt securities, on the settlement date, on the basis of the fair value of the financial instrument, equal to the amount disbursed, or the subscription price, including any cost and revenue directly attributable to the loans and determinable from the inception of the transaction, even when settled at a later date. Costs that, even with the aforementioned characteristics, are reimbursed by the borrower or classified as ordinary internal administrative expenses are excluded. Where the net disbursement amount differs from the fair value of the asset, as a result of the application of a lower interest rate than the one prevailing on the market or the one commonly applied to loans with similar features, the loan is initially recognised for an amount equal to the present value of future cash flows using an appropriate discount rate. The difference between the fair value and the amount disbursed or the subscription price is booked directly to the income statement. Securities purchased under agreements to resell (reverse repurchase agreements) and securities sold under agreements to repurchase (repurchase agreements) are generally treated as collateralised financing transactions (funding or investment transactions). In particular, spot sales and forward repurchases are recognised as payables for the spot amount received, while spot purchases and forward sales are recognised as receivables for the spot amount paid. Any transferred loan is derecognised from financial statement assets only where the sale essentially transferred all the risks and benefits related to the loans. Where, instead, all the risks and benefits related to the loan have been retained, the latter continue to be recognised as assets in the financial statements even if legal ownership has effectively been transferred. If it is not possible to verify whether the risks and benefits have been essentially transferred, the loans are derecognised from the financial statements if no control whatsoever has been retained over them. On the contrary, where even partial control is retained, loans are maintained in the financial statements with respect to the residual involvement, at an amount determined by the exposure to the variability in the amounts of the loans transferred and the changes in the related cash flows. Finally, transferred loans are derecognised from the financial statements where the contractual rights to receive the related
Consolidated Half-Year Financial Report 30 June 2014
48
cash flows are maintained assuming a contractual obligation to pay such cash flows and only such cash flows, to third parties. Finance lease contracts are recognised based on the financial method established in IAS 17, which envisages that the lessor recognise the assets included in the finance lease as a receivable at a value equivalent to the net investment in the lease. A lease is classified as a finance lease if essentially all of the risks and benefits from ownership of the asset is transferred. According to IAS 17, lessors must include initial direct costs incurred during lease negotiations in the initial amount of the financing. Initial direct costs to be charged as an increase in the net investment include only those costs, such as commission expenses, that are directly attributable to the finance lease transaction and are, most importantly, certain and immediately quantifiable at the moment in which the leasing receivable is recognised.
Measurement criteria After initial recognition, loans are measured at amortised cost, using the effective interest rate method. Amortised cost is the amount at which loans are measured upon initial recognition plus or minus any principal repayment, write-down, write-back and amortisation – calculated using the effective interest rate method – of the difference between the initial amount disbursed and the amount repayable on maturity represented by any income or charge directly attributable to the individual loan. The effective interest rate is the rate that exactly discounts estimated future cash flows generated by the loan, in terms of both principal and interest, to the disbursed amount including any revenue and charge related to the loan itself. This measurement method, which follows a financial approach, allows the allocation of the economic effect of the costs or revenues through the expected residual life of the loan. The estimated cash flows and contractual term of the loan take into account all the contractual clauses that may affect the amounts and maturity dates, without, however, considering any loss expected thereon. The effective interest rate initially recorded (original contract rate) is the rate that is used to discount the estimated cash flows and, as a result, it determines the amortised cost after initial recognition. The amortised cost method is not used for short-term loans whose short maturity implies that the application of the discounting approach leads to immaterial effects. These loans are valued at historical cost and income and charges related to them are recognised in the income statement on a straight-line basis over the contractual term of the loan. A similar valuation criterion is adopted for loans with unspecified maturity or repayable with notice period. At every close of annual or interim financial statements, the loans are reassessed to identify those that, following events occurring after initial recognition, show objective evidence of possible impairment. A loan is considered impaired when it is probable that all contractual principal and interest payments due in accordance with the terms of the original loan agreement or an equivalent amount will not be collected. Non-performing, sub-standard, restructured loans, and loans past due by 90 days or more are all reviewed for impairment in accordance with the rules issued by the Bank of Italy, consistent with IAS provisions. Non-performing loans are assessed individually, the adjustments made to the individual loans being equal to the difference between the carrying amount of the loan at the time of valuation (amortised cost) and the present value of the expected future cash flows, calculated using the original effective interest rate. The expected cash flows take into account the estimated recovery time, the estimated realisable value of any guarantee received as well as costs that may be sustained for the recovery of the exposure. The original effective interest rate of each loan remains unchanged over time even where a restructuring may have given rise to a change in the contractual rate and even though the loan no longer bears contractual interest. The write-down is recognised in the income statement.
Consolidated Half-Year Financial Report 30 June 2014
49
The write-downs are reversed and the amount of the loan restated to its original value if, in following years, the circumstances that had given rise to the write-down cease to exist, as long as the valuation can be objectively related to an event occurring after the impairment was recognised. The reversal is recognised in the income statement; however, it cannot exceed the amortised cost of the instrument if impairment loss had not occurred. Restructuring transactions on impaired loans that include the partial or full conversion of the loans into equity of the borrowing company are assessed based on the fair value of the shares received in compensation of the loan, as provided for in IFRIC 19; the fair value of said shares are assessed by applying the same methodologies used for equity investments, based on their classification in the financial statements. For other renegotiation transactions, with the exception of those defined as “restructuring” transactions, when the changes to contractual terms are substantial, Group companies derecognise the credit position and recognise a new financial asset. Transactions that are considered “restructured” include credit positions with customers in financial difficulties for which the renegotiation resulted in a financial loss for the Group companies. In this case, the specific write-down is calculated based in the original interest rate. Loans for which no individual objective evidence of impairment was assessed, that is, generally, performing loans, including loans to counterparties in countries at risk, are collectively evaluated for impairment. For the purposes of a collective evaluation of impairment, loans are grouped on the basis of similar credit risk characteristics and the related loss percentages are estimated taking into account historical loss experience, based on observable data as of the measurement date that allow estimation of the intrinsic loss for each loan category. Impairment losses of collectively assessed loans are recognised in the income statement. At each balance sheet date or interim report date, any additional write-down or write-back is separately calculated with reference to the entire performing loan portfolio at the same date.
Hedging transactions
Recognition criteria
Hedging transactions are aimed at offsetting potential losses arising on a specific item or group of items (hedged item) due to a specific risk, against the profits achieved on another instrument or group of instruments (hedging instrument) in the event that specific risk actually occurs. IAS 39 recognises the following types of hedges: � fair value hedge: its purpose is to hedge the exposure to changes in fair value of an asset or
liability attributable to a particular risk; � cash flow hedge: its purpose is to hedge the exposure to variability in future cash flows
attributable to particular risks associated with assets and liabilities; � hedge of a net investment in a foreign currency: pertaining to the hedging of the risks of an
investment in a foreign company expressed in foreign currency.
Measurement criteria
Hedging derivatives are measured at fair value. In the case of a fair value hedge, the change in fair value of the hedged item is offset by the change in fair value of the hedging instrument. This offsetting is recognised by recording in the income statement the changes in fair value relating to both the hedged item (as regards the changes attributable to the underlying risk factor) and the hedging instrument. Any difference, which represents the partial ineffectiveness of the hedge, is the net economic effect. In the case of cash flow hedges, changes in fair value of the derivative, to the extent the hedge is effective, are recognised under equity and reclassified in the income statement only when – with reference to the item hedged – the change in the cash flows to be offset manifests. Fair value is determined by reference to the prices recorded in active markets, as previously defined, prices provided by market operators or internal valuation models commonly used by market
Consolidated Half-Year Financial Report 30 June 2014
50
participants, which take into account all risk factors related to the instruments and are based on observable market data such as: � methods based on the valuation of listed instruments with the same characteristics; � calculation of the present value of the cash flows generated by the instrument; � option pricing models. A derivative instrument is designated as a hedging instrument if the hedging relationship between the hedged item and the hedging instrument is formally documented and if such relationship is highly effective at the inception of the hedge and on an ongoing basis. The effectiveness of the hedging relationship depends on the ability of the derivative to generate changes in fair value that offset changes in the fair value of the hedged item or the related cash flows. The effectiveness is assessed at each balance sheet date or interim report date using: � prospective testing, which justifies the application of hedge accounting as it proves its expected
effectiveness; � retrospective testing, which highlights the degree of hedge effectiveness achieved in the period
to which it relates. In other words, the testing measures to what extent actual results differ from the perfect hedge.
If the hedge fails the effectiveness test, hedge accounting, according to the methods stated above, is discontinued and the derivative is reclassified under financial instruments held for trading.
Tangible assets
Classification criteria This item includes land, buildings used for business, investment properties, technical plants, furniture, fittings, and sundry equipment. Own-used buildings are buildings owned by the Group for the purpose of providing services or for administrative purposes whereas investment property is property held to earn rental income or for capital appreciation or both. These are tangible assets held for use in the production or supply of goods and services, for rental to others or for administrative purposes and that are expected to be used during more than one period.
Initial recognition and subsequent derecognition criteria Tangible assets are initially recognised at cost, which includes the purchase price and any cost directly attributable to the purchase and set-up costs. Tangible assets are derecognised from the balance sheet on disposal or when the asset is permanently withdrawn from use and when no future economic benefits are expected from its use or disposal. Extraordinary maintenance expenses that give rise to an increase in future economic benefits are added to the value of the assets whereas ordinary maintenance costs are charged directly to the income statement. Rented assets are recognised at the purchase cost net of additional discounts, plus accessory charges, less accumulated depreciation, which considers the technical residual economic life of the individual assets.
Measurement criteria Subsequent to initial recognition, tangible fixed assets, including buildings not used for business purposes, are carried at cost less accumulated depreciation and any impairment loss. They are systematically depreciated over their estimated useful life, on a straight-line basis, excluding land. Land purchased vacant or with buildings has an indefinite useful life and is therefore not depreciated. If the value of the land is incorporated in the value of the building erected thereon, then, by virtue of
Consolidated Half-Year Financial Report 30 June 2014
51
the application of the components approach, it is considered as an asset separate from the buildings. With regard to fully owned buildings and where the ownership percentage is deemed significant, the allocation of the total value between the land and the buildings is made on the basis of an evaluation made by an expert appraiser. At each balance sheet date or interim report date, where there is objective evidence that an asset may be impaired, its carrying value is compared to its recoverable value, equal to the higher of fair value less costs to sell, and its value in use, that is, the present value of future cash flows expected to be derived from the asset. Impairment losses are recognised in the income statement. If and when the circumstances that gave rise to the impairment cease to exist, a recovery value is recorded, which, however, cannot exceed the value that the asset would have had, net of depreciation, determined in the absence of previous impairments.
Intangible assets
Classification criteria Intangible assets are recorded as balance sheet assets only if: � they are identifiable; � they are controlled by the entity; � it is probable that the expected future economic benefits that are attributable to the asset will
flow to the entity; � the cost of the asset can be reliably measured. Intangible assets include application software that will be used over the long-term. Other assets are recorded as intangible assets if they are identifiable and arise from contractual or other legal rights.
Initial recognition and subsequent derecognition criteria Intangible assets are stated at cost, as adjusted by any incidental charges, only if it is probable that the future economic benefits attributable to the assets will flow from the assets and if their cost can be measured reliably. If that is not the case, the cost of the intangible asset is recognised in the income statement for the year in which it was incurred. Intangible assets are derecognised from the balance sheet on disposal and if no future economic benefits are expected from the assets.
Measurement criteria The cost of intangible assets with defined useful lives is amortised on a straight-line basis over the expected useful life of the asset. Where the expected useful life is indefinite, then the assets are not amortised but are systematically tested for impairment. At each balance sheet date, where an indication of impairment exists, the company estimates the recoverable amount of the assets in question. The impairment loss, recognised in the income statement, is equal to the difference between the carrying value of the asset and its recoverable amount.
Consolidated Half-Year Financial Report 30 June 2014
52
Current and deferred tax
Income taxes are calculated in accordance with tax regulations currently in force. Tax expense is the aggregate amount included in the determination of profit and loss for the period in respect of current tax and deferred tax. Income taxes are recorded in the income statement with the exception of those relating to items that are directly debited or credited to equity. Income tax provisions are calculated based on a prudent estimate of the current tax charges, deferred tax assets and deferred tax liabilities. Deferred tax assets and deferred tax liabilities are calculated taking into account the temporary differences between the carrying amount of an asset or liability pursuant to the Italian Civil Code criteria and their tax base, with no time limitation. Deferred tax assets represent the amounts of income taxes recoverable in future periods in respect of: � deductible temporary differences; � the carry-forward of unused tax losses; � the carry-forward of unused tax credits. Deferred tax liabilities represent the amounts of income taxes payable in future periods in respect of taxable temporary differences. All deferred tax liabilities are included in the financial statements. Deferred tax assets and liabilities are systematically reviewed to take into account any change in tax rates or regulations as well as any change in the tax status of Group companies, including agreements related to the National Tax Consolidation scheme.
Effects of tax consolidation The tax consolidation agreements, effective in Italy beginning in 2011 for companies participating in the consolidation scheme, envisage, among other items, that any tax loss brought to the tax consolidation by individual companies is not remunerated to said companies by the consolidating body. Similarly, the agreements provide that taxes due for any taxable income produced by the individual entities making up the tax consolidation are paid only if, and to the extent that, the taxes are effectively paid to the tax authorities by the consolidating body, based on the tax consolidation. IAS 12 does not govern the accounting methods for the effects of the tax consolidation on the individual financial statements of either the consolidating body or the companies included in the consolidation. Taking into account the specific provisions envisaged in the tax consolidation agreements referenced above, among the accounting models that were deemed applicable in such circumstances based on prevailing professional opinions and considering statutory regulations, the Group defined the following methodology for the accounting representation of the IRES effects of the tax consolidation for individual financial statements: • Each entity will recognise its tax burden accrued for the year in the income taxes item, in current
taxes if there is taxable income or in deferred taxes in the event of tax losses, in application of IAS 12;
• These effects are corrected directly in the income statements in the same tax item (current or deferred) in the same year and in the amount that would result in no financial settlement between the entities and the Group as a result of the tax consolidation agreements;
• The detailed transactions for accrued taxes will include separate information on its impact on the effective taxes for each individual entity that is attributable to the national tax consolidation scheme;
• Unused tax losses that each year should be definitively transferred from the subsidiaries to the tax consolidating body will be included in the estimate of recoverability for the financial statements of the consolidating body.
Consolidated Half-Year Financial Report 30 June 2014
53
Allowances for risks and charges
Classification criteria This item includes provisions for actual obligations arising as a result of a past event, the settlement of which is certain or highly probable, but in respect of which uncertainties exist about the timing or amount required in settlement.
Recognition criteria A provision is recognised if it meets the following criteria: � a legal obligation (actual or implicit) exists as a result of a past event; � it is probable that an outflow of resources embodying economic benefits will be required to settle
the obligation; � a reasonable estimate can be made of the amount of the obligation. In the event the time factor is significant, the provisions are discounted using discount rates that reflect current market rates. The effect of discounting is recognised in the income statement.
Liabilities, securities issued
Classification criteria Due to banks, Due to customers, Securities issued and Subordinated loans encompass the various types of interbank funding and deposits from customers as well as the funding through certificates of deposit and debt securities in issue, less any amount repurchased.
Initial recognition and subsequent derecognition criteria
Initial recognition of such financial liabilities occurs at the time of collection of the sums deposited or on the issue of debt securities. Initial recognition is based on the fair value of the liabilities, normally equal to the amount collected or the issue price, increased by any income or charge directly attributable to each deposit or issue transaction and not reimbursed by the funding counterpart. Internal administrative expenses are excluded. Financial liabilities are derecognised from the financial statements when the relevant obligation has expired or has been extinguished. Derecognition also occurs for repurchase of previously issued securities. The difference between the carrying amount of the liability and the amount paid to repurchase it is recognised in the income statement. Own securities placed on the market subsequent to their repurchase are treated as a new issue recognised at the new placement price with no impact on the income statement.

Consolidated Half-Year Financial Report 30 June 2014
54
Measurement criteria Subsequent to initial recognition, financial liabilities are carried at amortised cost using the effective interest rate method. An exception is made for short-term liabilities, where time is irrelevant. These are stated at the amount collected and related costs, if any, are recognised in the income statement on a straight-line basis over the contractual term of the liability.
Financial liabilities held for trading This item includes the negative value of derivative contracts held for trading, valued at fair value, of implicit contracts in other financial instruments. It also includes other liabilities, designated at fair value, which originate from uncovered short positions generated by security trading activities. The measurement, recognition and derecognition criteria are equivalent to those for financial assets held for trading.
Foreign currency transactions
Recognition criteria
Foreign currency transactions are initially recognised in the functional currency, by applying the spot exchange rate on the transaction date to the foreign currency amount.
Measurement criteria At each balance sheet date or interim report date, financial statement items denominated in foreign currency are translated as follows: � Monetary amounts are translated using the closing rate; � Non-monetary items that are measured in terms of historical cost are translated using the
exchange rate at the date of the transaction; � Non-monetary items that are measured at fair value are translated using the exchange rate on
the closing date. Exchange differences arising on the settlement of monetary items or on translating monetary items at rates different from those at which they were translated on initial recognition or in previous financial statements are recognised in the income statement relating the period in which they arise. When a gain or loss on a non-monetary item is recognised directly under equity, any exchange component of that gain or loss is also recognised under equity. Conversely, when a gain or loss on a non-monetary item is recognised in the income statement, any exchange component of that gain or loss is also recognised in the income statement.
Leasehold improvements
Leasehold improvements are capitalised in consideration of the fact that the company enjoying the use of the premises has control over the assets and the future economic benefits generated by it over the entire term of the lease. Leasehold improvements are amortised for a period not exceeding the term of the lease.
Severance indemnity fund The severance indemnity fund is initially recognised based on its actuarial value. For the purposes of defining actuarial value, the Projected Unit Credit Method is used, which involves the estimate of future payments based on historical statistical analyses, the demographic curve and the present value of those cash flows using a market interest rate. The contributions paid in each financial year are considered as separate units, separately measured and recorded to build up the final post-
Consolidated Half-Year Financial Report 30 June 2014
55
employment benefit obligation. The current service costs of the plan are accounted for under personnel expenses as the net amount of contributions paid, contributions of prior years not yet recorded, accrued interest cost, expected return on plan assets, and actuarial gains and losses. With Regulation no. 475/2012, the European Commission endorsed, among other things, the new version of IAS 19, which has the objective of enhancing the clarity and comparability of financial statements, particularly in reference to defined benefit plans. As from 1 January 2013, the elimination of the "corridor method" has an impact on the Bank’s net equity at the date of the first application of the new standard, in the amount equivalent to the actuarial losses not recognised in applying the corridor method; this amendment to the standard resulted in a decrease in valuation reserves of equity as at 31 December 2012 of € 646 thousand. In the first half of the year, actuarial losses were reduced by a net amount of € 95 thousand, decreasing the relevant valuation reserve to € 551 thousand. Following the reform of supplementary social security as per Italian Legislative Decree no. 252/2005, supplemented by the innovations made by the 2007 Finance Law and its subsequent implementing decrees:
• Employee termination indemnities accrued as at 31 December 2006 remain with the company and continue to be considered a “defined benefit plan”: the obligation for the benefits accrued by the employees is valued by using actuarial techniques;
• Employee termination benefits under accrual as at 1 January 2007 are considered a “defined contribution plan” irrespective of allocation by employee to supplementary social security or to the Treasury allowance at INPS. The obligation is determined by the amounts to be contributed for each period.
Also, other employee benefits such as seniority bonuses and pension fund contributions, provided for by IAS 19, are recorded as liabilities by estimating the single amount to be paid to each employee using actuarial calculation methods.
Stock options Stock option plans on shares in the Parent Company General Electric Company, which are currently assigned to some of the Banking Group’s employees, are directly regulated in the balance sheet of the Parent Company. Charges related to said plans are calculated based on the fair value of the options at the balance sheet date, allocated across the vesting period.
Dividends and revenue recognition Revenues are recognised when received or at least when it is probable that future benefits will be received and that such benefits can be measured reliably. In particular: � Default interest, if provided for in the terms of the contract, is recognised in the income statement
only when actually collected; � Dividends are recognised in the income statement when the right to receive payment is
established; � Revenues generated through brokerage of traded financial instruments, calculated as the
difference between the transaction price and the fair value of the instruments, are recognised in the income statement when the transaction is recorded if the fair value can be determined by reference to recent parameters or transactions observable on the same market where the instrument is traded. Income related to financial instruments for which the above measurement is not possible is recognised in the income statement over the entire duration of the transaction.
Consolidated Half-Year Financial Report 30 June 2014
56
Additional information
Use of estimates and assumptions in preparing the half-year financial
report
Amounts in the financial statements were valued based on the principles indicated above. In applying said principles, if the value of certain financial statement items could not be determined precisely, estimates and assumptions were used that have a significant impact on the values recorded in the balance sheet and income statement.
While reaffirming that the use of reasonable estimates is a fundamental part of preparing the financial statements, without negatively affecting its fairness, the list below details the items in the financial statements that make significant use of estimates and assumptions:
� loan valuations; � valuation of financial instruments not listed on active markets; � valuation of intangible assets and equity investments; � quantification of provisions to allowances for risks and charges; � quantification of deferred taxes; � definition of the depreciation/amortisation rate of tangible and intangible assets with a defined
useful life.
Furthermore, an estimate may be adjusted following changes in the circumstances on which the estimate was based, upon receiving new information, or as a result of more experience. Any change in the estimate is applied on an ongoing basis and therefore has an impact on the income statement for the year in which the change occurred and, possibly, on future income statements. There were no significant changes during the period to the estimation criteria that were applied in preparing the financial statements as at 31 December 2013.
Consolidated Half-Year Financial Report 30 June 2014
57
SCOPE AND METHODS OF CONSOLIDATION
The companies included in the scope of consolidation as at 30 June 2014 were already part of it on 31
December 2013.
Stakeholder % Share
A. Companies
A.1. Fully consolidated
1. GE Capital Servizi Finanziari S.p.A. Mondovì (Cuneo) 1 GE Capital Interbanca S.p.A. 100% 100%2. GE Capital Finance S.r.l. Milan 1 GE Capital Interbanca S.p.A. 60% 100%2. GE Capital Finance S.r.l. Milan GE Capital Servizi Finanziari S.p.A. 40% 100%3. GE SPV S.r.l. Conegliano (Treviso) 1 GE Capital Servizi Finanziari S.p.A. 100% 100%4. GE Capital Services S.r.l. Rome 1 GE Capital Interbanca S.p.A. 79% 100%4. GE Capital Services S.r.l. Rome GE Capital Servizi Finanziari S.p.A. 21% 100%(*) 1= majority of voting rights at the shareholders' meeting
1. Equity investments in subsidiaries, wholly-owned or under joint control (proportionally consolidated)
Effective
voting rights
%
Type of
relationship
(*)
Registered officeName of company
Investment ratio
Consolidated Half-Year Financial Report 30 June 2014
58
Fair Value Disclosure
Qualitative disclosure
This section contains the fair value disclosure as requested by IFRS 13 “Fair Value Measurement”, a new accounting standard that came into force as from 1 January 2013, in its joint interpretation with IAS 34 and IFRS 7.
The fair value is the price that would be received to sell an asset, or paid to transfer a liability, in an ordinary transaction between market counterparts in the main market at the date of measurement (exit price).
The fair value of a financial liability that is due (for example, a sight deposit) cannot be less than the amount payable on demand, discounted from the first date on which payment may be required.
In the case of financial instruments quoted on active markets, the fair value is determined on the basis of the official prices of the main (or most favourable) market to which the company has access (Mark to Market).
A financial instrument is considered to be quoted in an active market if the quotations are immediately and duly available in a listing, dealers, brokers, pricing agency or regulatory authorities, and these prices represent actual market transactions that occur regularly in normal trading. If the official price in an active market does not exist for a financial instrument as a whole, but there are active markets for the parts forming it, the fair value is measured on the basis of the relevant market prices for the parts forming it.
If market prices or other observable inputs, such as the quoted price of a similar asset in a market that is not active, are not available, alternative valuation models are used:
• Market valuation method: uses market prices of liabilities or similar equity instruments held as assets by other market players;
• Cost method: reflects the amount - replacement cost - that would be required currently to replace the service capacity of an asset;
• Profit method: discounted value technique based on future cash flows expected by a market counterpart that holds a liability of an equity instrument as assets.
The valuation methods (Mark to Model) used are in line with the methods generally accepted and used by the market. The valuation models include techniques based on the discounting of future cash flows and on the estimation of volatility and are reviewed during their development and periodically, in order to ensure their full consistency with the objectives of the valuation.
These methods use inputs based on prices formed in recent transactions in the instrument being assessed and/or prices/listings of instruments with similar characteristics in terms of risk profile.
These prices/listings are important for determining the significant parameters, in terms of credit risk, liquidity risk, price risk and any other relevant risk, related to the instrument being assessed.
The reference to such “market” parameters allows to limit the degree of discretion in the valuation, while ensuring the verifiability of the resulting fair value.
Consolidated Half-Year Financial Report 30 June 2014
59
Fair Value Levels 2 and 3: valuation techniques and input used
Valuation techniques are used to measure positions for which market sources do not provide a
market price. GE Capital Interbanca uses valuation techniques common on the market to determine
the fair value of financial and non-financial instruments, which are not listed and actively traded on
the market. The valuation techniques used for Level 2 assets and liabilities are described below.
Discounted cash flow
The valuation techniques based on the discounted cash flow generally consist in determining an
estimate of the future cash flows expected over the life of the instrument. The model requires the
estimate of cash flows and the adoption of market parameters for the discount: the discount rate or
margin reflects the credit and/or funding spread required by the market for instruments with similar
risk and liquidity profiles, in order to define a "discounted value". The fair value of the contract is the
sum of the discounted future cash flows.
Option Pricing Model
Option pricing model are generally used for instruments in which the holder has a contingent right or
obligation based on the occurrence of a future event, such as the exceeding of a set strike price by
the price of a reference asset.
Option models estimate the probability a specific event will occur, including assumptions such as the
volatility of the estimates, the price of the underlying instrument and the expected rate of return.
Market Approach
A valuation technique that uses prices generated by market transactions involving assets, liabilities
or groups of identical or comparable assets and liabilities.
Valuation processes and sensitivity For processes, refer to Part E - Section 2 Market Risks.
The Bank has no Level 3 financial assets or liabilities and related input that cannot be readily observed.
Fair value hierarchy
IFRS 13 requires classification according to the degree of observability of the inputs analysed for pricing.
In particular, three levels are provided:
• Level 1: the fair value of instruments classified in this level is measured based on quoted prices in active markets;
• Level 2: the fair value of instruments classified in this level is measured based on valuation models that use inputs observable in active markets;
• Level 3: the fair value of instruments classified in this level is measured based on valuation models that use mainly inputs unobservable in active markets.
There were no transfers between the various levels of the fair value hierarchy.
Consolidated Half-Year Financial Report 30 June 2014
60
Additional information
Assets and liabilities measured at fair value
The information required by IFRS 13 on accounting portfolios measured at fair value on a recurring
basis is shown below.
Fixed-income bonds
Fixed-income bonds are measured through two main processes based on the liquidity of the
reference market. Liquid instruments in active markets are assessed at market price (Mark-to-
Market) and therefore these instruments are classified at Level 1 of the fair value hierarchy.
The instruments not traded in active markets are assessed at Mark-to-Model by using the implicit
credit spread curves related to the rating of the issuer and to the business segment. The model
maximises the use of observable parameters and minimises the use of non-observable parameters.
Equity securities
Equity securities are assigned to Level 1 when a market price is available and to Level 2 or 3,
depending on the level of observability of the inputs used in the valuation, when there are no prices
or the prices have been suspended permanently. In this case, the valuations are carried out with a
Market Approach by applying the model of market multiples assumed from observable comparables
and using the DCF model as a control method.
Equity instruments measured at cost may be impaired if the carrying amount exceeds the present
value of future cash flows significantly and/or for a long time.
Derivatives
Significant inputs of the valuation techniques used and mainly based on methods of net present
value of future flows are observable or derived from observable data; these instruments are
classified as level 2.
Financial assets and liabilities not measured at fair value whose fair value
disclosure is provided Financial instruments not measured at fair value, such as customer loans and deposits, are not
managed on the basis of fair value; for these instruments, the fair value is calculated only for the
purposes of disclosure and has no impact on the balance sheet and income statement values.
Moreover, since these instruments are not generally traded, the fair value measurement includes
assumptions of the management with regard to important variables.
Due from banks
Due from banks include the balance of active current accounts and deposits held as collateral for
syndicated loans (the so-called IBLOR). For active current accounts, the book value can be considered
a good proxy of the fair value.
The fair value of IBLOR deposits is measured with the same method used for loans to customers described below.
Consolidated Half-Year Financial Report 30 June 2014
61
Loans to customers
The fair value of due from banks and loans to customers, recognised at amortised cost, is measured
by using the discounted cash flow model, which includes the best estimate of the elements required
for reflecting the current market conditions.
The cash flows include payments of principal, interest payments and all other costs, and depend on
the contractual terms and market conditions (see interest rates).
The discount rate includes the risk-free rate, which represents the amount of interest that the market
would require for risk-free investments over a certain period, and the Credit Spread (CS), which
represents the excess return that a market player would ask for an investment with a certain degree
of risk. The CSs for unlisted products cannot be derived from observable market prices and are,
therefore, estimated based on specific factors of the counterparty and/or transaction.
Non-performing loans
With reference to non-performing loans, based on interest rates, recovery curves, funding and
operating costs, the book value can be considered a good proxy of fair value in that the current
measurement already includes the best estimate of the discounted expected recoveries.
Liabilities - Subordinated loan
The fair value of the liability, recognised at amortised cost, is measured using a DCF model, such as
L&R, by using a discount rate that includes the risk-free rate, which represents the amount of interest
that the market would require for risk-free investments over a certain period, and a spread
comparable to the rate expressing the cost of funding for similar duration.
Liabilities – Revolving loans
Since these are revolving credit lines with continuous and predetermined drawdowns, the book value
can be considered a good proxy of the fair value of the liability, recognised at amortised cost.
Securities issued
For debt securities issued by the Bank measured at amortised cost that have a price in an active
market, the fair value is measured by using the market price of the same securities; for unlisted
securities, the fair value is measured by using a DCF model. The fair value of structured finance
products is measured using the appropriate measurement method given the nature of the
incorporated structure.
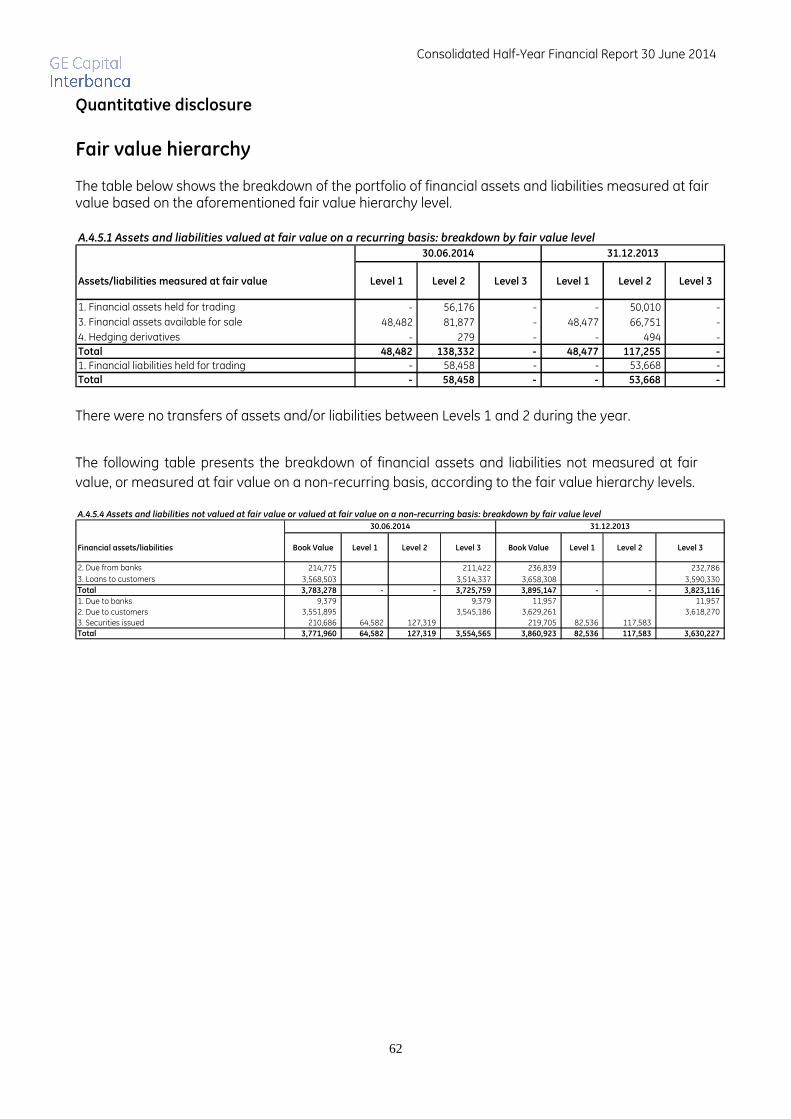
Consolidated Half-Year Financial Report 30 June 2014
62
Quantitative disclosure
Fair value hierarchy The table below shows the breakdown of the portfolio of financial assets and liabilities measured at fair value based on the aforementioned fair value hierarchy level.
Assets/liabilities measured at fair value Level 1 Level 2 Level 3 Level 1 Level 2 Level 3
1. Financial assets held for trading - 56,176 - - 50,010 -
3. Financial assets available for sale 48,482 81,877 - 48,477 66,751 -
4. Hedging derivatives - 279 - - 494 -
Total 48,482 138,332 - 48,477 117,255 -
1. Financial liabilities held for trading - 58,458 - - 53,668 -
Total - 58,458 - - 53,668 -
A.4.5.1 Assets and liabilities valued at fair value on a recurring basis: breakdown by fair value level31.12.201330.06.2014
There were no transfers of assets and/or liabilities between Levels 1 and 2 during the year.
The following table presents the breakdown of financial assets and liabilities not measured at fair
value, or measured at fair value on a non-recurring basis, according to the fair value hierarchy levels.
Financial assets/liabilities Book Value Level 1 Level 2 Level 3 Book Value Level 1 Level 2 Level 3
2. Due from banks 214,775 211,422 236,839 232,786
3. Loans to customers 3,568,503 3,514,337 3,658,308 3,590,330
Total 3,783,278 - - 3,725,759 3,895,147 - - 3,823,116
1. Due to banks 9,379 9,379 11,957 11,957
2. Due to customers 3,551,895 3,545,186 3,629,261 3,618,270
3. Securities issued 210,686 64,582 127,319 219,705 82,536 117,583
Total 3,771,960 64,582 127,319 3,554,565 3,860,923 82,536 117,583 3,630,227
30.06.2014 31.12.2013
A.4.5.4 Assets and liabilities not valued at fair value or valued at fair value on a non-recurring basis: breakdown by fair value level
Consolidated Half-Year Financial Report 30 June 2014
63
Disclosure on “day one profit/loss”
As provided in IFRS 7, section 28 and IAS 39 AG 76, a financial instrument must be initially recognised
at its fair value, which is equivalent to the price paid/collected at trading, unless there is evidence to
the contrary. In practice, there are cases in which the two values differ. The aforementioned principle
governs such situations, stating that the recognition of a financial instrument at a fair value other
than the amount paid/collected is legitimate, only if the fair value is calculated:
� by making reference to current and observable market transactions on the same instrument;
� through valuation techniques that use only data from observable markets as variables.
In other words, the IAS 39 assumption, according to which the fair value is equivalent to the price
paid/collected, can be circumvented only if objective evidence exists that the price paid/collected
does not represent the real market value of the financial instrument traded.
Said evidence must be inferred only from objective and irrefutable parameters, thereby eliminating
any discretion on the part of the assessor.
Exclusively under the conditions indicated above, the difference between the fair value and the
traded price represents the “day one profit” and is immediately recognised in the income statement.
There were no transactions of this type undertaken by GE Capital as part of its activities during the
reporting period.
Consolidated Half-Year Financial Report 30 June 2014
64
INFORMATION
ON THE BALANCE SHEET
ASSETS
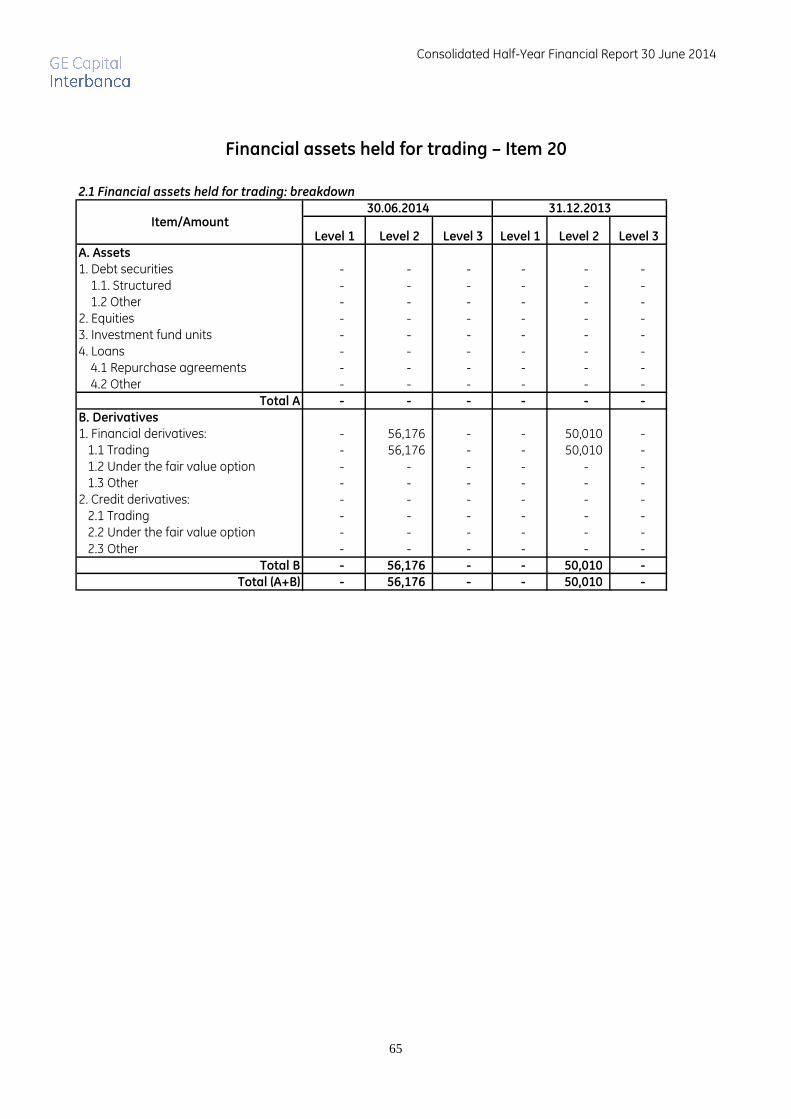
Consolidated Half-Year Financial Report 30 June 2014
65
Financial assets held for trading – Item 20
Level 1 Level 2 Level 3 Level 1 Level 2 Level 3
A. Assets
1. Debt securities - - - - - - 1.1. Structured - - - - - - 1.2 Other - - - - - - 2. Equities - - - - - - 3. Investment fund units - - - - - - 4. Loans - - - - - - 4.1 Repurchase agreements - - - - - - 4.2 Other - - - - - -
Total A - - - - - -
B. Derivatives
1. Financial derivatives: - 56,176 - - 50,010 - 1.1 Trading - 56,176 - - 50,010 - 1.2 Under the fair value option - - - - - - 1.3 Other - - - - - - 2. Credit derivatives: - - - - - - 2.1 Trading - - - - - - 2.2 Under the fair value option - - - - - - 2.3 Other - - - - - -
Total B - 56,176 - - 50,010 -
Total (A+B) - 56,176 - - 50,010 -
2.1 Financial assets held for trading: breakdown
Item/Amount30.06.2014 31.12.2013
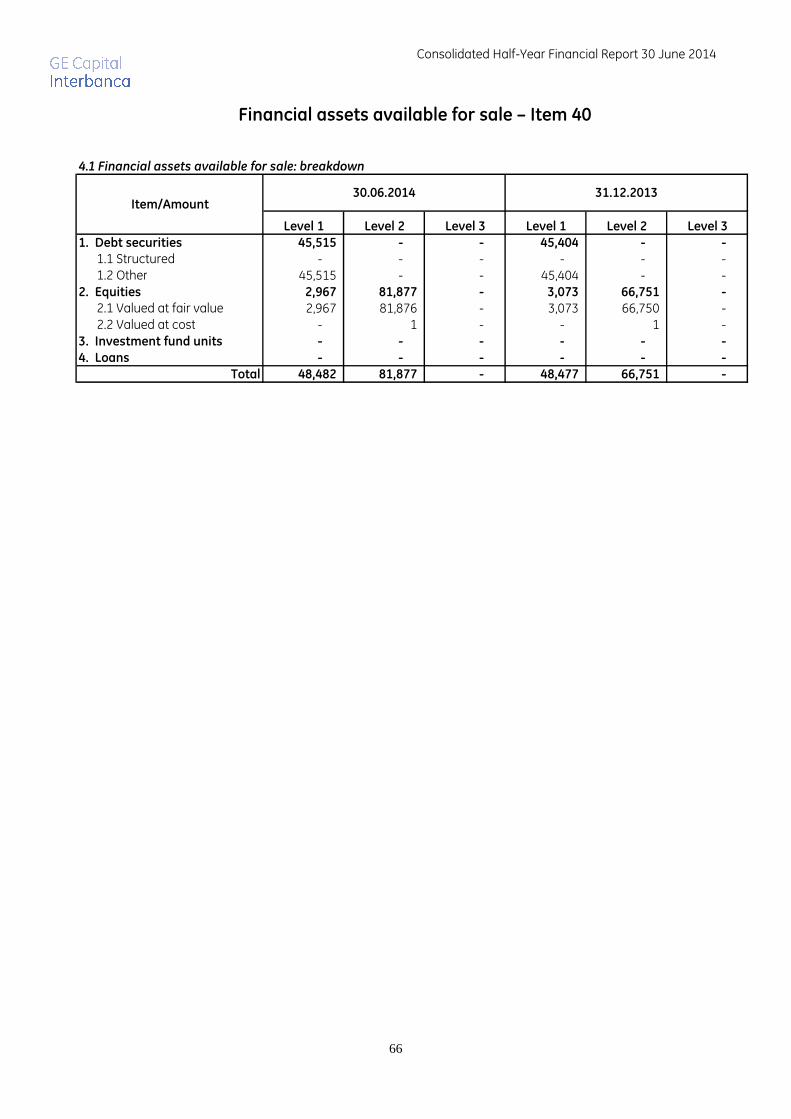
Consolidated Half-Year Financial Report 30 June 2014
66
Financial assets available for sale – Item 40
4.1 Financial assets available for sale: breakdown
Level 1 Level 2 Level 3 Level 1 Level 2 Level 3
1. Debt securities 45,515 - - 45,404 - -
1.1 Structured - - - - - - 1.2 Other 45,515 - - 45,404 - - 2. Equities 2,967 81,877 - 3,073 66,751 -
2.1 Valued at fair value 2,967 81,876 - 3,073 66,750 - 2.2 Valued at cost - 1 - - 1 - 3. Investment fund units - - - - - -
4. Loans - - - - - -
Total 48,482 81,877 - 48,477 66,751 -
Item/Amount30.06.2014 31.12.2013
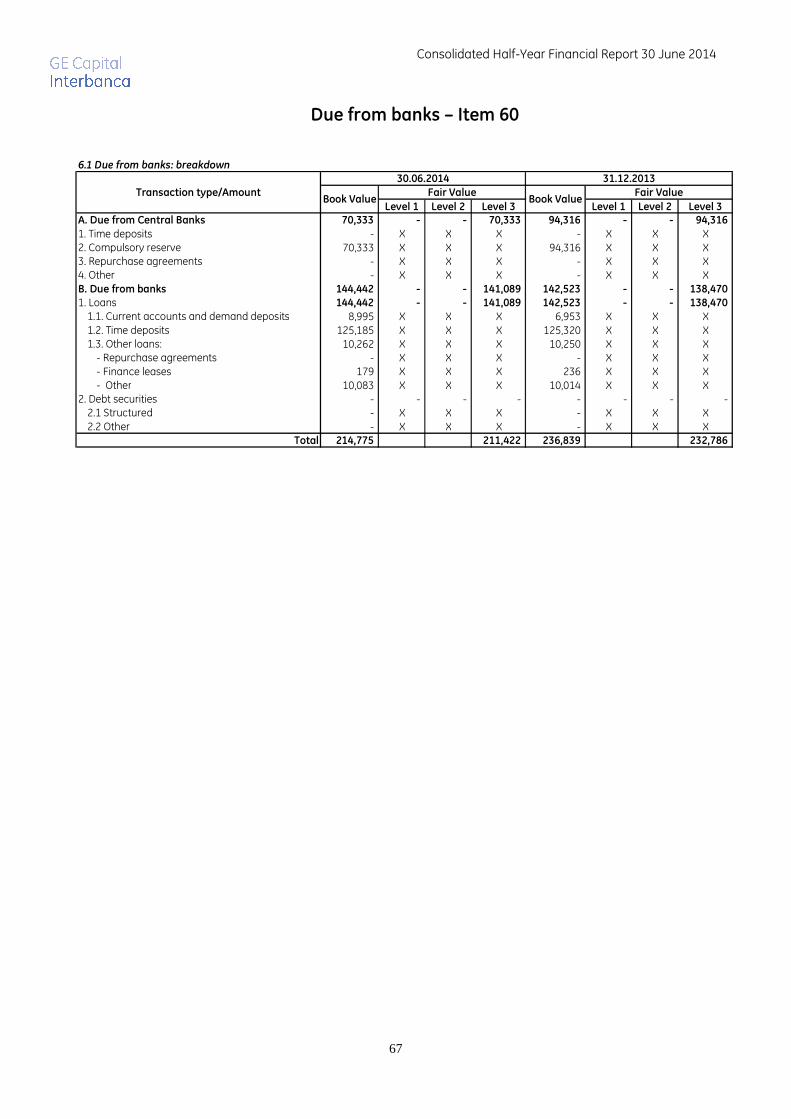
Consolidated Half-Year Financial Report 30 June 2014
67
Due from banks – Item 60
6.1 Due from banks: breakdown
Level 1 Level 2 Level 3 Level 1 Level 2 Level 3
A. Due from Central Banks 70,333 - - 70,333 94,316 - - 94,316
1. Time deposits - X X X - X X X2. Compulsory reserve 70,333 X X X 94,316 X X X3. Repurchase agreements - X X X - X X X4. Other - X X X - X X XB. Due from banks 144,442 - - 141,089 142,523 - - 138,470
1. Loans 144,442 - - 141,089 142,523 - - 138,470
1.1. Current accounts and demand deposits 8,995 X X X 6,953 X X X1.2. Time deposits 125,185 X X X 125,320 X X X1.3. Other loans: 10,262 X X X 10,250 X X X
- Repurchase agreements - X X X - X X X- Finance leases 179 X X X 236 X X X- Other 10,083 X X X 10,014 X X X
2. Debt securities - - - - - - - - 2.1 Structured - X X X - X X X2.2 Other - X X X - X X X
Total 214,775 211,422 236,839 232,786
Transaction type/Amount
30.06.2014 31.12.2013
Fair Value Fair ValueBook Value Book Value

Consolidated Half-Year Financial Report 30 June 2014
68
Loans to customers – Item 70
7.1 Loans to customers: breakdown
Transaction type/Amount
Purchased Other Purchased OtherLoans 2,947,596 - 609,662 - - 3,489,665 3,021,558 80,004 544,829 - - 3,578,798 1. Current accounts - - - X X X - - - X X X2. Repurchase agreements - - - X X X - - - X X X3. Mortgages 1,659,231 - 579,471 X X X 1,738,375 51,492 544,829 X X X4. Credit card loans and personal loans, inc. loans guaranteed by salary 58,054 - 5,348 X X X
72,275 5,361 - X X X
5. Finance leases 675,699 - 19,011 X X X 652,347 21,514 - X X X6. Factoring 210,917 - 1,074 X X X 228,940 1,137 - X X X7. Other loans 343,695 - 4,758 X X X 329,621 500 - X X XDebt securities - - 11,245 - - 11,532 11,917 - - - - 11,532
8. Structured - - - X X X - - - X X X9. Other - - 11,245 X X X 11,917 - - X X X
Total 2,947,596 - 620,907 3,500,525 3,033,475 80,004 544,829 3,590,330
30.06.2014 31.12.2013
L2PerformingImpaired
L2 L3 PerformingImpaired
L1 L3
Book Value Fair Value Book Value Fair Value
L1
Item “7. Other loans” mainly consists of long-term lease contracts of operating assets, signed by GE
Capital Services S.r.l., which under IAS 17 are classified as financial leasing transactions.

Consolidated Half-Year Financial Report 30 June 2014
69
Hedging derivatives – Item 80
Level 1 Level 2 Level 3 Level 1 Level 2 Level 3
A) Financial derivatives - 279 - 15,000 - 494 - 25,000
1) Fair value - 279 - 15,000 - 494 - 25,000 2) Cash flow - - - - - - - - 3) Foreign investments - - - - - - - -
B) Credit derivatives - - - - - - - - 1) Fair value - - - - - - - - 2) Cash flow - - - - - - - -
Total - 279 - 15,000 - 494 - 25,000
Notional
value
31.12.2013
8.1 Hedging derivatives: breakdown by type of hedging and fair value hierarchies
Fair value 30.06.2014 Notional
value
30.06.2014
Fair value 31.12.2013
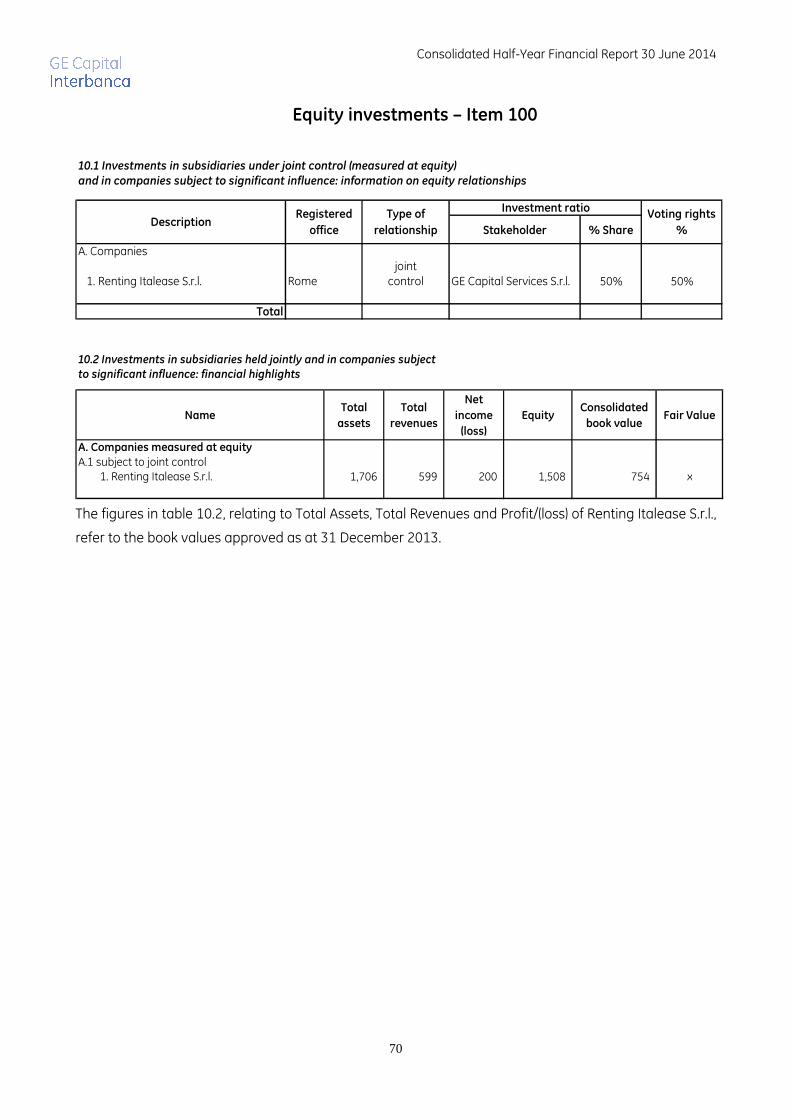
Consolidated Half-Year Financial Report 30 June 2014
70
Equity investments – Item 100
10.1 Investments in subsidiaries under joint control (measured at equity) and in companies subject to significant influence: information on equity relationships
Stakeholder % Share
A. Companies
1. Renting Italease S.r.l. Romejoint
control GE Capital Services S.r.l. 50% 50%
Total
Voting rights
%Description
Registered
office
Type of
relationship
Investment ratio
10.2 Investments in subsidiaries held jointly and in companies subject to significant influence: financial highlights
NameTotal
assets
Total
revenues
Net
income
(loss)
EquityConsolidated
book valueFair Value
A. Companies measured at equity
A.1 subject to joint control 1. Renting Italease S.r.l. 1,706 599 200 1,508 754 x
The figures in table 10.2, relating to Total Assets, Total Revenues and Profit/(loss) of Renting Italease S.r.l.,
refer to the book values approved as at 31 December 2013.
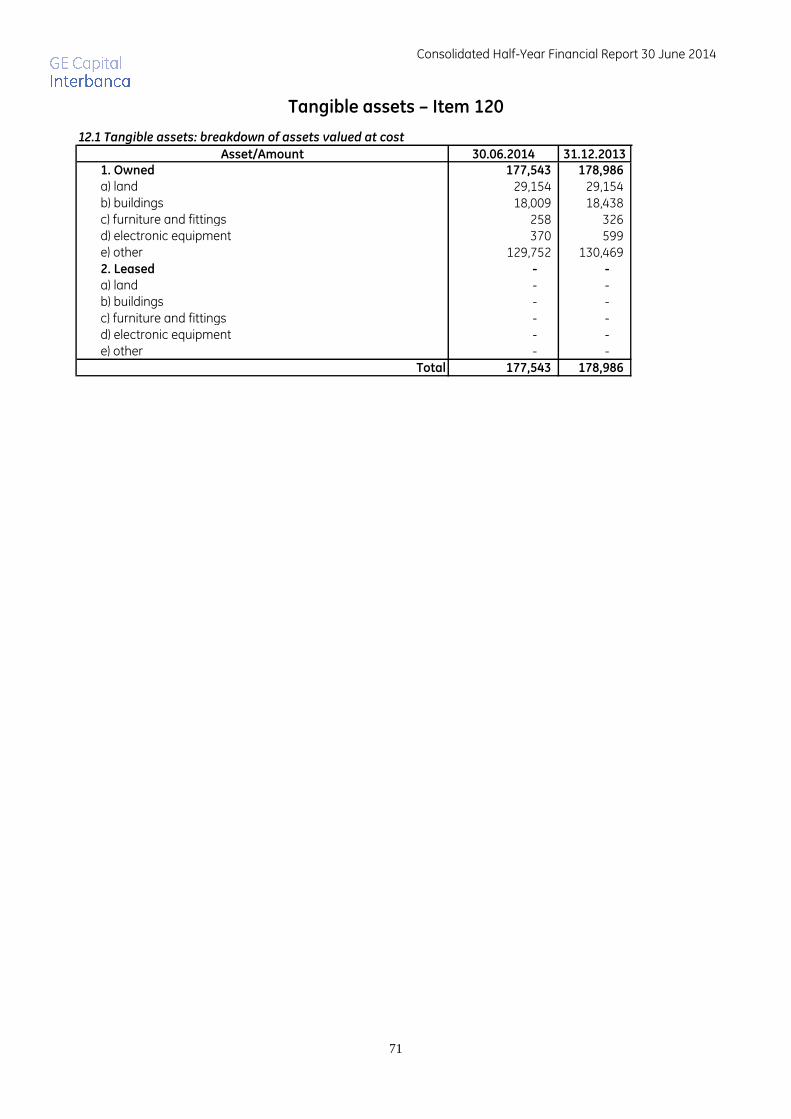
Consolidated Half-Year Financial Report 30 June 2014
71
Tangible assets – Item 120
Asset/Amount 30.06.2014 31.12.20131. Owned 177,543 178,986
a) land 29,154 29,154 b) buildings 18,009 18,438 c) furniture and fittings 258 326 d) electronic equipment 370 599 e) other 129,752 130,469 2. Leased - -
a) land - - b) buildings - - c) furniture and fittings - - d) electronic equipment - - e) other - -
Total 177,543 178,986
12.1 Tangible assets: breakdown of assets valued at cost
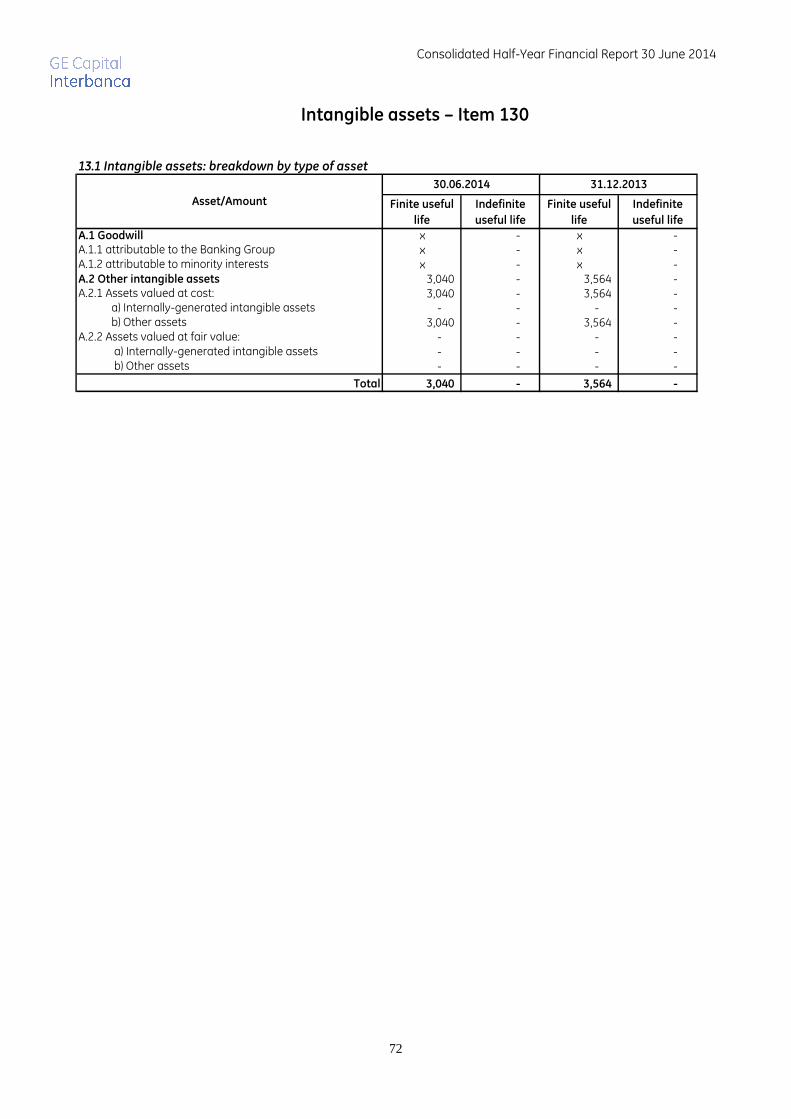
Consolidated Half-Year Financial Report 30 June 2014
72
Intangible assets – Item 130
Finite useful
life
Indefinite
useful life
Finite useful
life
Indefinite
useful life
A.1 Goodwill x - x - A.1.1 attributable to the Banking Group x - x - A.1.2 attributable to minority interests x - x - A.2 Other intangible assets 3,040 - 3,564 - A.2.1 Assets valued at cost: 3,040 - 3,564 -
a) Internally-generated intangible assets - - - - b) Other assets 3,040 - 3,564 -
A.2.2 Assets valued at fair value: - - - - a) Internally-generated intangible assets - - - - b) Other assets - - - -
Total 3,040 - 3,564 -
Asset/Amount
30.06.2014 31.12.2013
13.1 Intangible assets: breakdown by type of asset
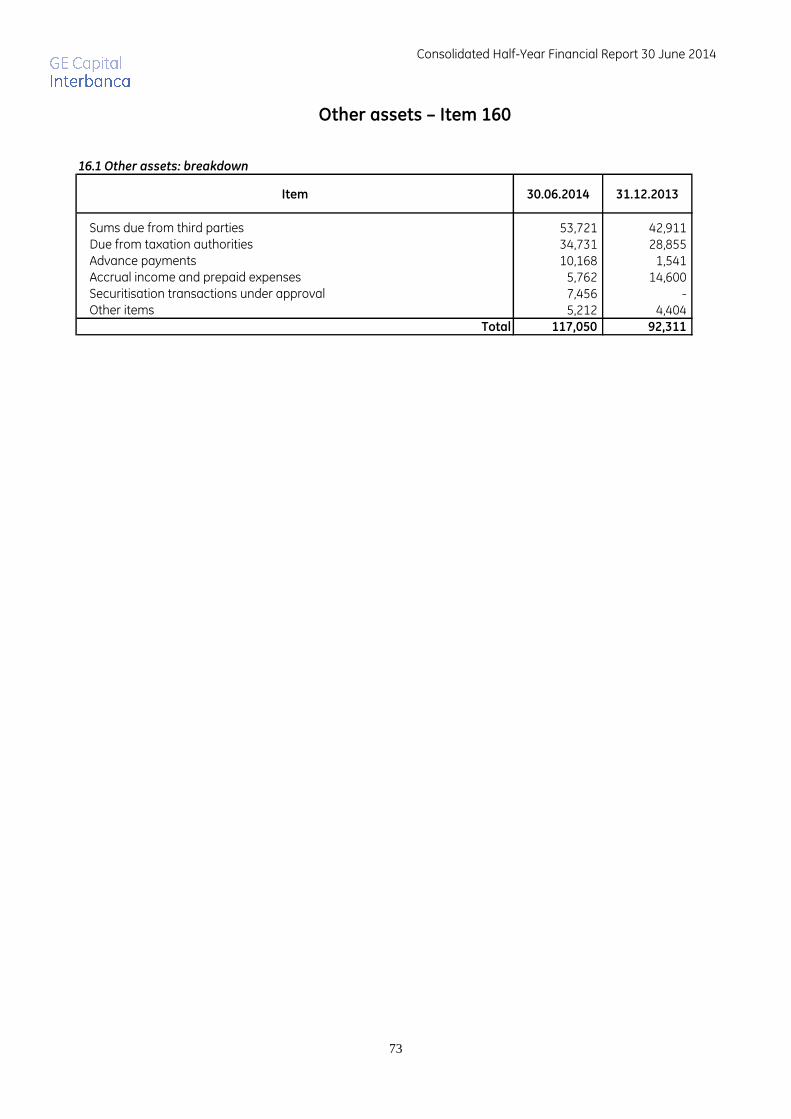
Consolidated Half-Year Financial Report 30 June 2014
73
Other assets – Item 160
Item 30.06.2014 31.12.2013
Sums due from third parties 53,721 42,911 Due from taxation authorities 34,731 28,855 Advance payments 10,168 1,541 Accrual income and prepaid expenses 5,762 14,600 Securitisation transactions under approval 7,456 - Other items 5,212 4,404
Total 117,050 92,311
16.1 Other assets: breakdown
Consolidated Half-Year Financial Report 30 June 2014
74
LIABILITIES
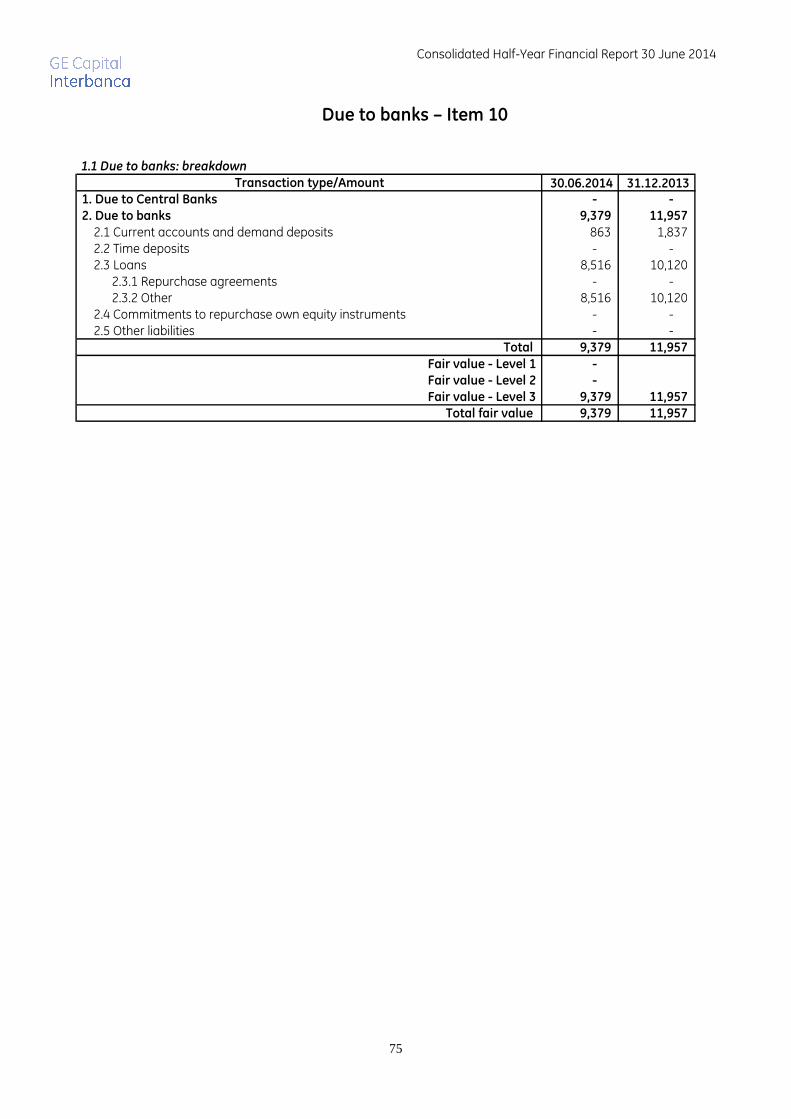
Consolidated Half-Year Financial Report 30 June 2014
75
Due to banks – Item 10
Transaction type/Amount 30.06.2014 31.12.2013 1. Due to Central Banks - -
2. Due to banks 9,379 11,957
2.1 Current accounts and demand deposits 863 1,837 2.2 Time deposits - - 2.3 Loans 8,516 10,120 2.3.1 Repurchase agreements - - 2.3.2 Other 8,516 10,120 2.4 Commitments to repurchase own equity instruments - - 2.5 Other liabilities - -
Total 9,379 11,957
Fair value - Level 1 -
Fair value - Level 2 -
Fair value - Level 3 9,379 11,957
Total fair value 9,379 11,957
1.1 Due to banks: breakdown
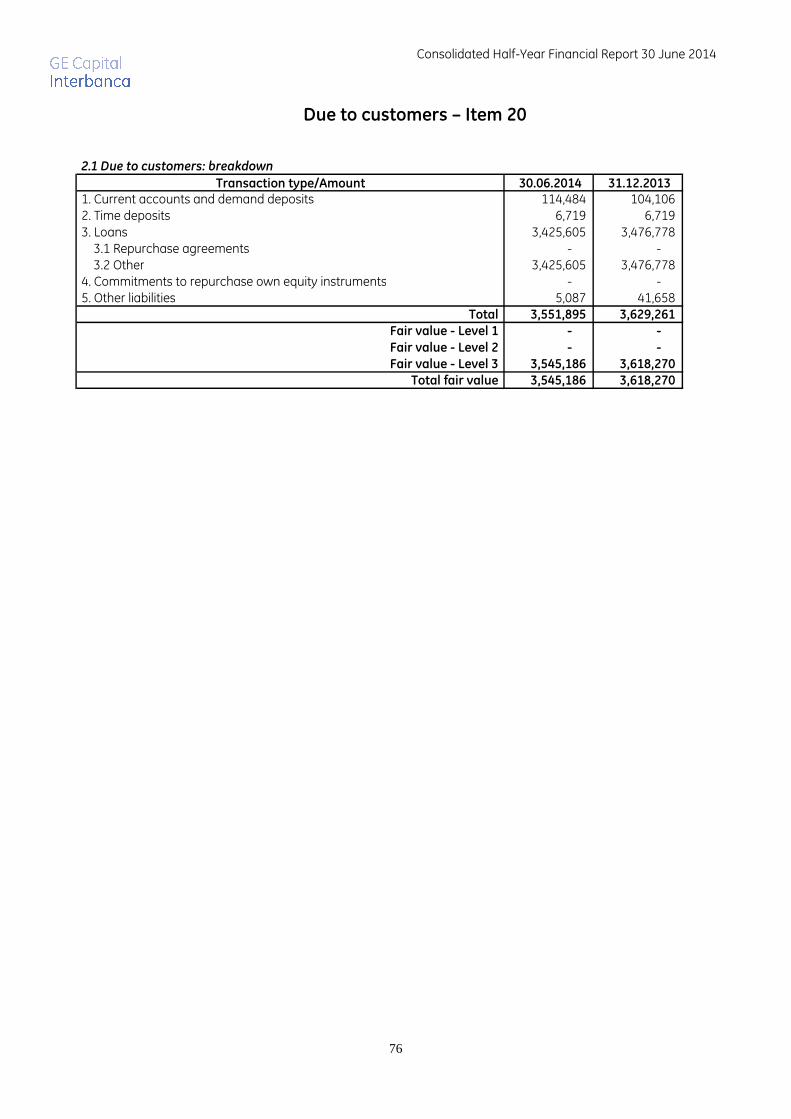
Consolidated Half-Year Financial Report 30 June 2014
76
Due to customers – Item 20
Transaction type/Amount 30.06.2014 31.12.2013 1. Current accounts and demand deposits 114,484 104,106 2. Time deposits 6,719 6,719 3. Loans 3,425,605 3,476,778 3.1 Repurchase agreements - - 3.2 Other 3,425,605 3,476,778 4. Commitments to repurchase own equity instruments - - 5. Other liabilities 5,087 41,658
Total 3,551,895 3,629,261
Fair value - Level 1 - -
Fair value - Level 2 - -
Fair value - Level 3 3,545,186 3,618,270
Total fair value 3,545,186 3,618,270
2.1 Due to customers: breakdown
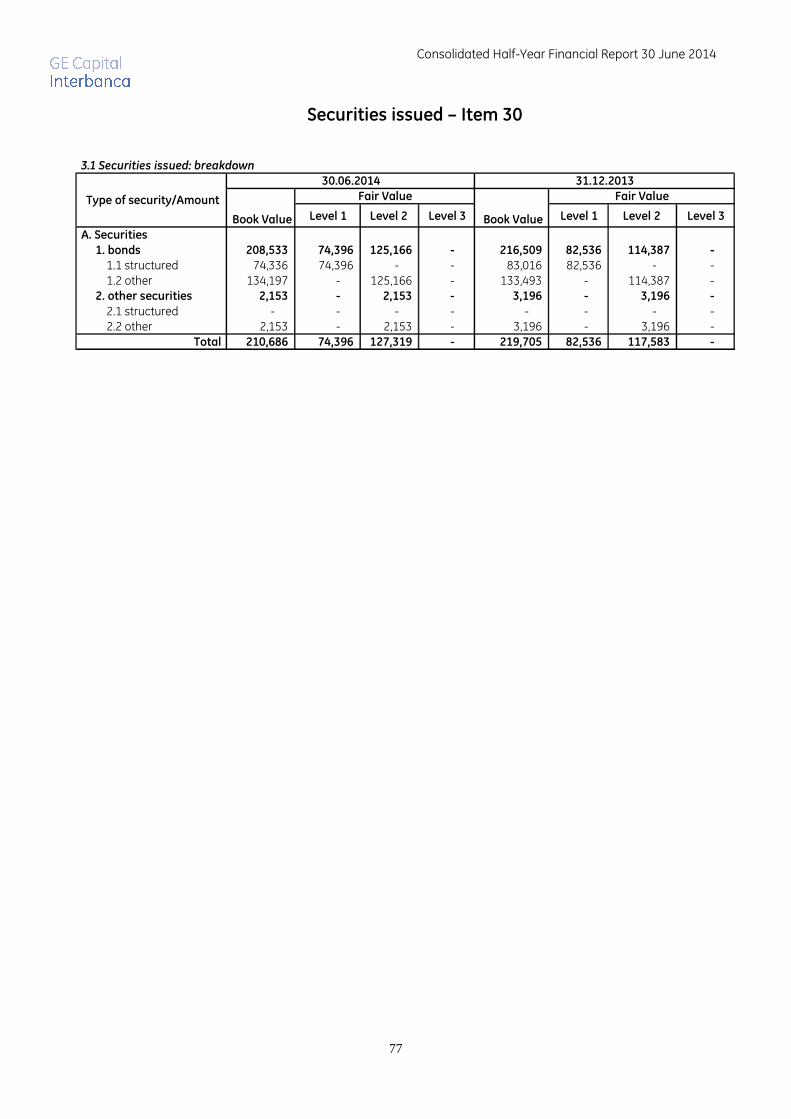
Consolidated Half-Year Financial Report 30 June 2014
77
Securities issued – Item 30
Level 1 Level 2 Level 3 Level 1 Level 2 Level 3
A. Securities
1. bonds 208,533 74,396 125,166 - 216,509 82,536 114,387 -
1.1 structured 74,336 74,396 - - 83,016 82,536 - - 1.2 other 134,197 - 125,166 - 133,493 - 114,387 - 2. other securities 2,153 - 2,153 - 3,196 - 3,196 -
2.1 structured - - - - - - - - 2.2 other 2,153 - 2,153 - 3,196 - 3,196 -
Total 210,686 74,396 127,319 - 219,705 82,536 117,583 -
3.1 Securities issued: breakdown
Type of security/Amount
30.06.2014 31.12.2013
Book Value
Fair Value
Book Value
Fair Value

Consolidated Half-Year Financial Report 30 June 2014
78
Financial liabilities held for trading – Item 40
4.1 Financial liabilities held for trading: breakdown
L1 L2 L3 L1 L2 L3
A. Financial liabilities (non-derivatives)
1. Due to banks - - - - - - - - - - 2. Due to customers - - - - - - - - 3. Debt securities - - - - - - - - - - 3.1 Bonds - - - - - - - - - - 3.1.1 Structured - - - - x - - - - x 3.1.2 Other - - - - x - - - - x 3.2 Other securities - - - - - - - - - - 3.2.1 Structured - - - - x - - - - x 3.2.2 Other - - - - x - - - - x
Total A - - - - - - - - - -
B. Derivatives
1. Financial derivatives 292,624 - 58,458 - - 339,737 - 53,668 - - 1.1 Trading x - 58,458 - x x - 53,668 - x 1.2 Under the fair value option x - - - x x - - - x 1.3 Other x - - - x x - - - x 2. Credit derivatives - - - - - - - - - - 2.1 Trading x - - - x x - - - x 2.2 Under the fair value option x - - - x x - - - x 2.3 Other x - - - x x - - - x
Total B x - 58,458 - x x - 53,668 - x
Total (A+B) x - 58,458 - x x - 53,668 - x
FV = fair valueFV* = fair value calculation without adjustments for credit ratingNV = nominal or notional valueL1 = Level 1L2 = Level 2L3 = Level 3
31.12.2013 Transaction
Type/
Amount NV FV*
30.06.2014
FV NV FV FV*
Consolidated Half-Year Financial Report 30 June 2014
79
Hedging derivatives – Item 60
Level 1 Level 2 Level 3 Level 1 Level 2 Level 3
A) Financial derivatives - - - - - - - - 1) Fair value - - - - - - - - 2) Cash flow - - - - - - - - 3) Foreign investments - - - - - - - -
B) Credit derivatives - - - - - - - - 1) Fair value - - - - - - - - 2) Cash flow - - - - - - - -
Total - - - - - - - -
Notional
value
31.12.2013
6.1 Hedging derivatives: breakdown by type of hedging and fair value hierarchies
Fair value 30.06.2014 Notional
value
30.06.2014
Fair value 31.12.2013
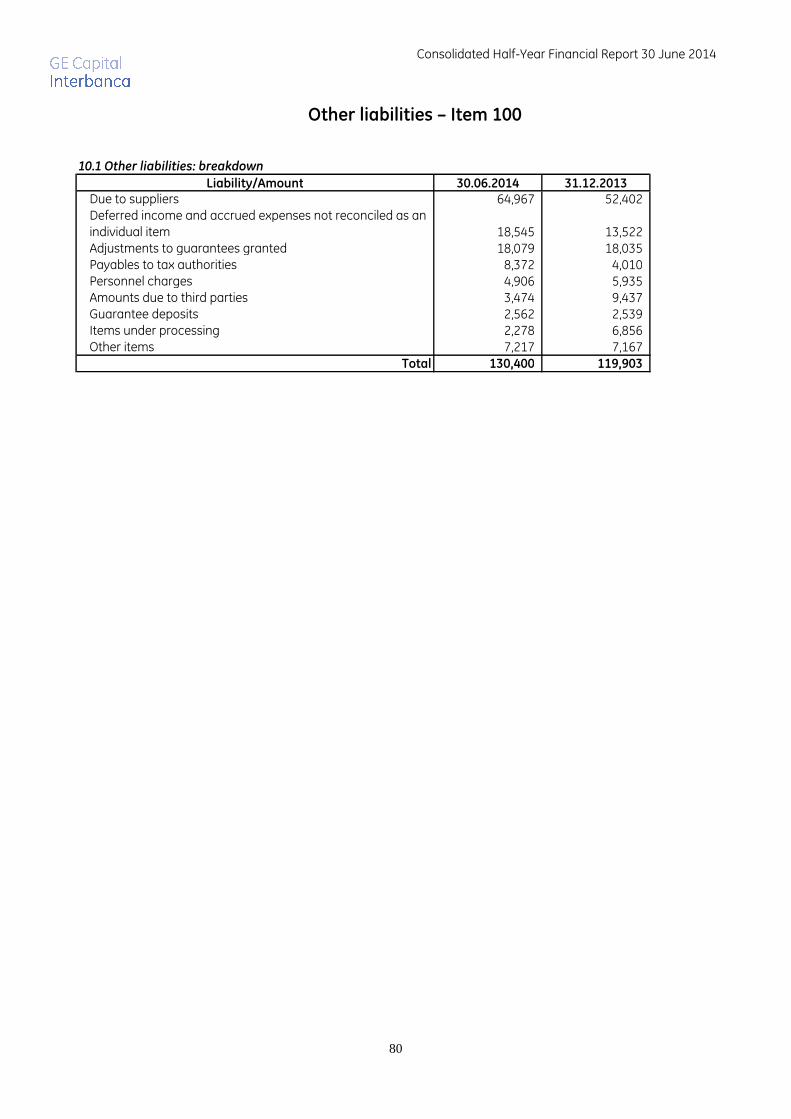
Consolidated Half-Year Financial Report 30 June 2014
80
Other liabilities – Item 100
Liability/Amount 30.06.2014 31.12.2013Due to suppliers 64,967 52,402 Deferred income and accrued expenses not reconciled as an individual item 18,545 13,522 Adjustments to guarantees granted 18,079 18,035 Payables to tax authorities 8,372 4,010 Personnel charges 4,906 5,935 Amounts due to third parties 3,474 9,437 Guarantee deposits 2,562 2,539 Items under processing 2,278 6,856 Other items 7,217 7,167
Total 130,400 119,903
10.1 Other liabilities: breakdown
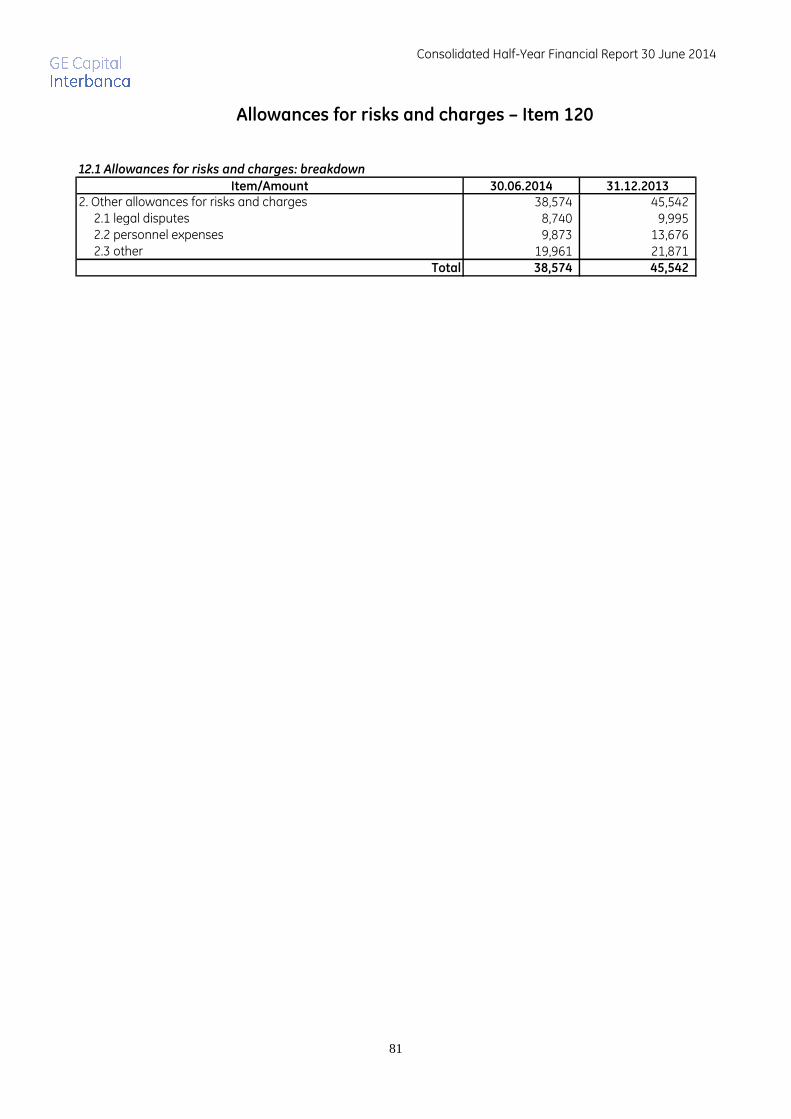
Consolidated Half-Year Financial Report 30 June 2014
81
Allowances for risks and charges – Item 120
12.1 Allowances for risks and charges: breakdown
Item/Amount 30.06.2014 31.12.20132. Other allowances for risks and charges 38,574 45,542 2.1 legal disputes 8,740 9,995 2.2 personnel expenses 9,873 13,676 2.3 other 19,961 21,871
Total 38,574 45,542
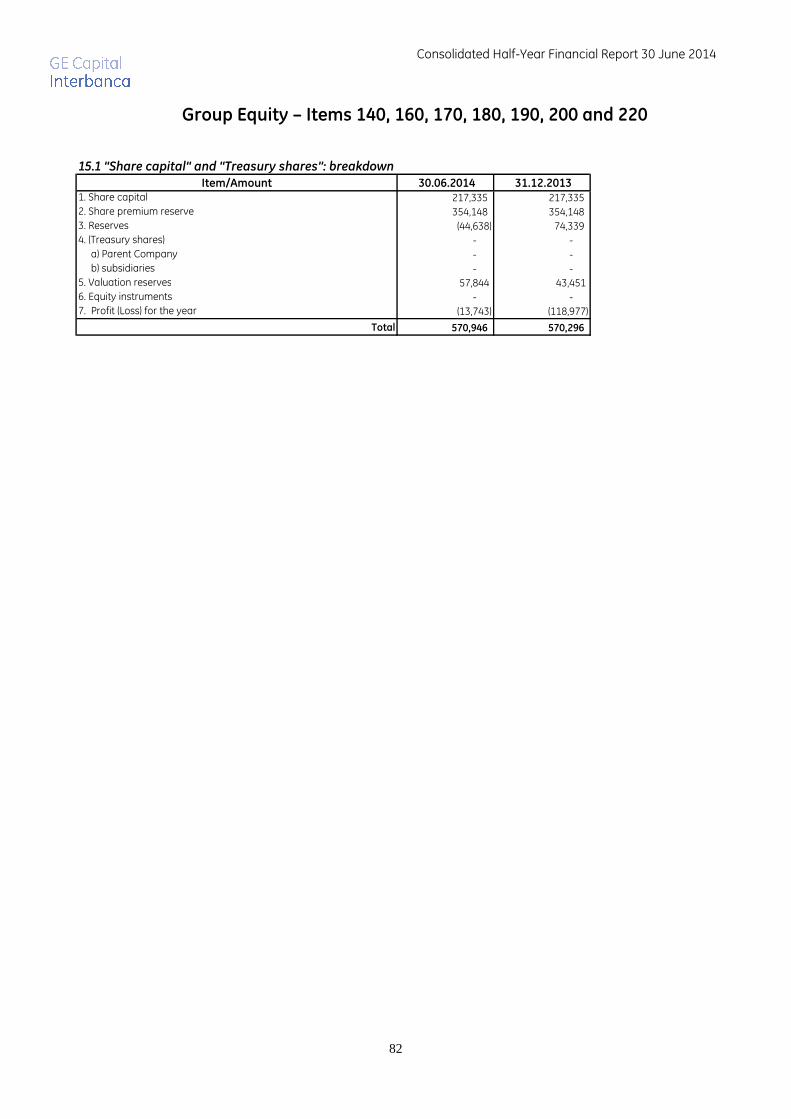
Consolidated Half-Year Financial Report 30 June 2014
82
Group Equity – Items 140, 160, 170, 180, 190, 200 and 220
15.1 “Share capital“ and “Treasury shares”: breakdown
Item/Amount 30.06.2014 31.12.20131. Share capital 217,335 217,335
2. Share premium reserve 354,148 354,148
3. Reserves (44,638) 74,339
4. (Treasury shares) - -
a) Parent Company - -
b) subsidiaries - -
5. Valuation reserves 57,844 43,451
6. Equity instruments - -
7. Profit (Loss) for the year (13,743) (118,977)
Total 570,946 570,296

Consolidated Half-Year Financial Report 30 June 2014
83
INFORMATION ON THE INCOME STATEMENT
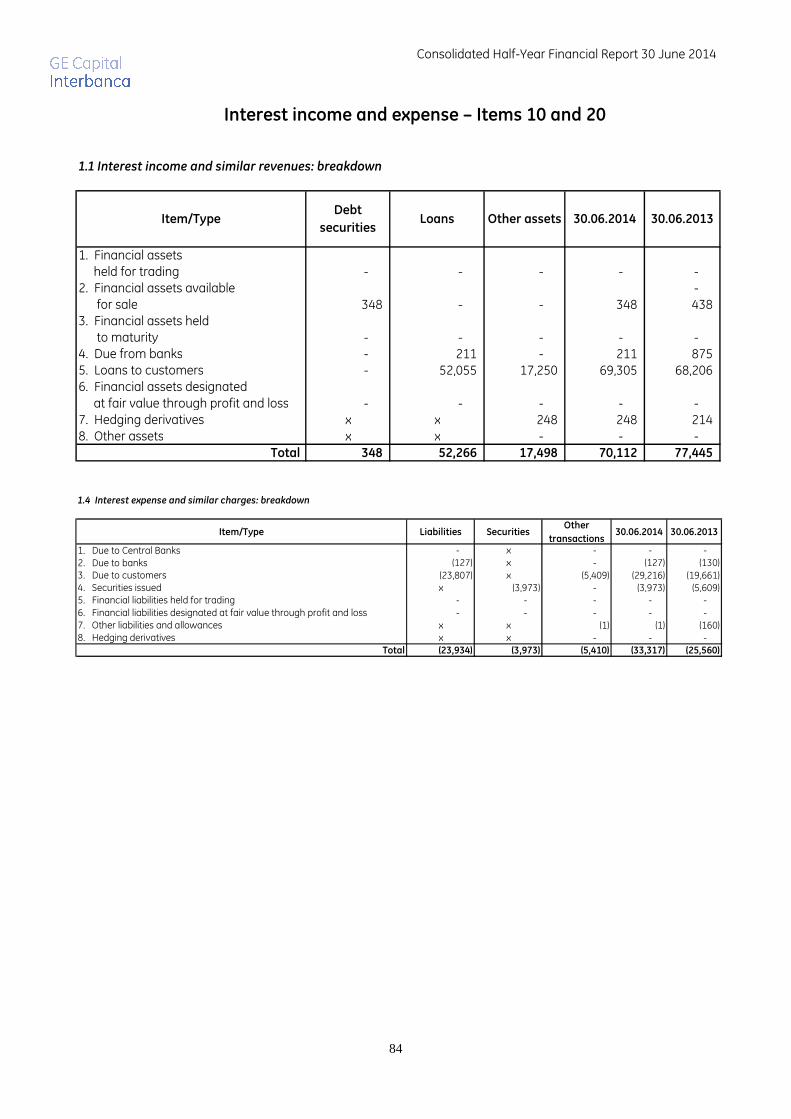
Consolidated Half-Year Financial Report 30 June 2014
84
Interest income and expense – Items 10 and 20
1.1 Interest income and similar revenues: breakdown
1. Financial assets held for trading - - - - - 2. Financial assets available - for sale 348 - - 348 438 3. Financial assets held to maturity - - - - - 4. Due from banks - 211 - 211 875 5. Loans to customers - 52,055 17,250 69,305 68,206 6. Financial assets designated at fair value through profit and loss - - - - - 7. Hedging derivatives x x 248 248 214 8. Other assets x x - - -
Total 348 52,266 17,498 70,112 77,445
30.06.2013Item/Type Other assets 30.06.2014Debt
securitiesLoans
Item/Type Liabilities SecuritiesOther
transactions30.06.2014 30.06.2013
1. Due to Central Banks - x - - - 2. Due to banks (127) x - (127) (130) 3. Due to customers (23,807) x (5,409) (29,216) (19,661) 4. Securities issued x (3,973) - (3,973) (5,609) 5. Financial liabilities held for trading - - - - - 6. Financial liabilities designated at fair value through profit and loss - - - - - 7. Other liabilities and allowances x x (1) (1) (160) 8. Hedging derivatives x x - - -
Total (23,934) (3,973) (5,410) (33,317) (25,560)
1.4 Interest expense and similar charges: breakdown
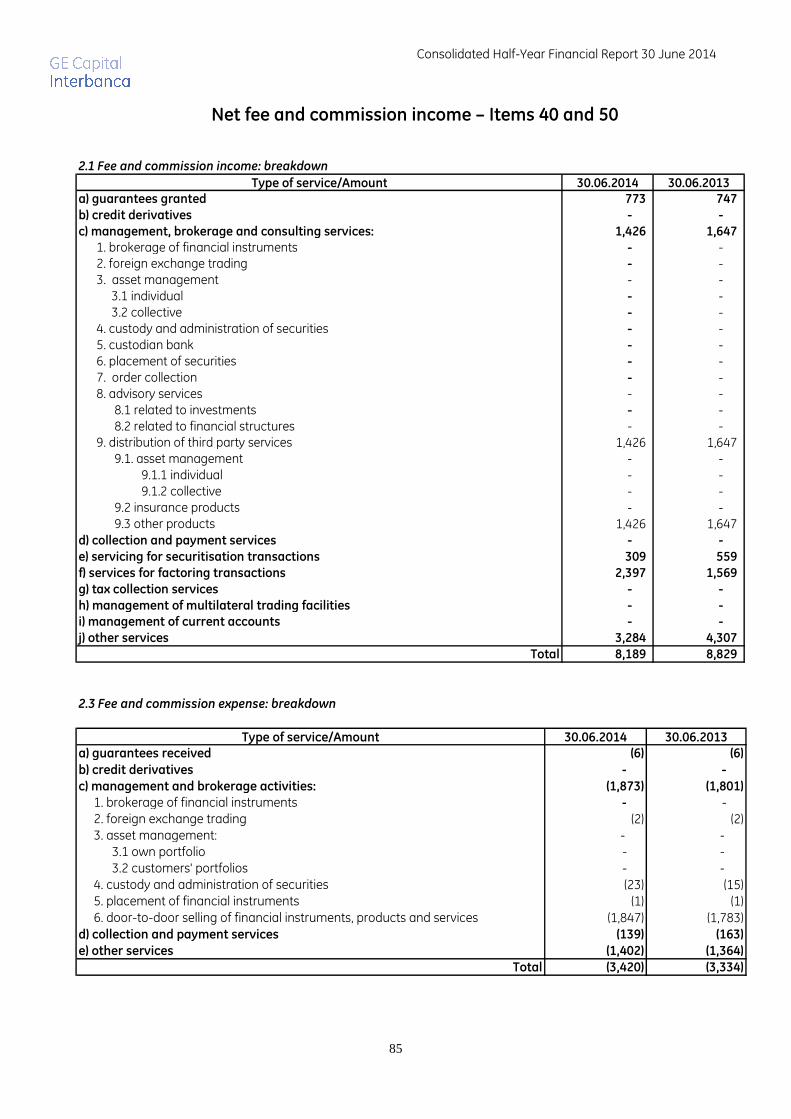
Consolidated Half-Year Financial Report 30 June 2014
85
Net fee and commission income – Items 40 and 50
Type of service/Amount 30.06.2014 30.06.2013a) guarantees granted 773 747
b) credit derivatives - -
c) management, brokerage and consulting services: 1,426 1,647
1. brokerage of financial instruments - - 2. foreign exchange trading - - 3. asset management - - 3.1 individual - - 3.2 collective - - 4. custody and administration of securities - - 5. custodian bank - - 6. placement of securities - - 7. order collection - - 8. advisory services - - 8.1 related to investments - - 8.2 related to financial structures - - 9. distribution of third party services 1,426 1,647 9.1. asset management - - 9.1.1 individual - - 9.1.2 collective - - 9.2 insurance products - - 9.3 other products 1,426 1,647 d) collection and payment services - -
e) servicing for securitisation transactions 309 559
f) services for factoring transactions 2,397 1,569
g) tax collection services - -
h) management of multilateral trading facilities - -
i) management of current accounts - -
j) other services 3,284 4,307
Total 8,189 8,829
2.1 Fee and commission income: breakdown
Type of service/Amount 30.06.2014 30.06.2013a) guarantees received (6) (6)
b) credit derivatives - -
c) management and brokerage activities: (1,873) (1,801)
1. brokerage of financial instruments - - 2. foreign exchange trading (2) (2) 3. asset management: - - 3.1 own portfolio - - 3.2 customers' portfolios - - 4. custody and administration of securities (23) (15) 5. placement of financial instruments (1) (1) 6. door-to-door selling of financial instruments, products and services (1,847) (1,783) d) collection and payment services (139) (163)
e) other services (1,402) (1,364)
Total (3,420) (3,334)
2.3 Fee and commission expense: breakdown
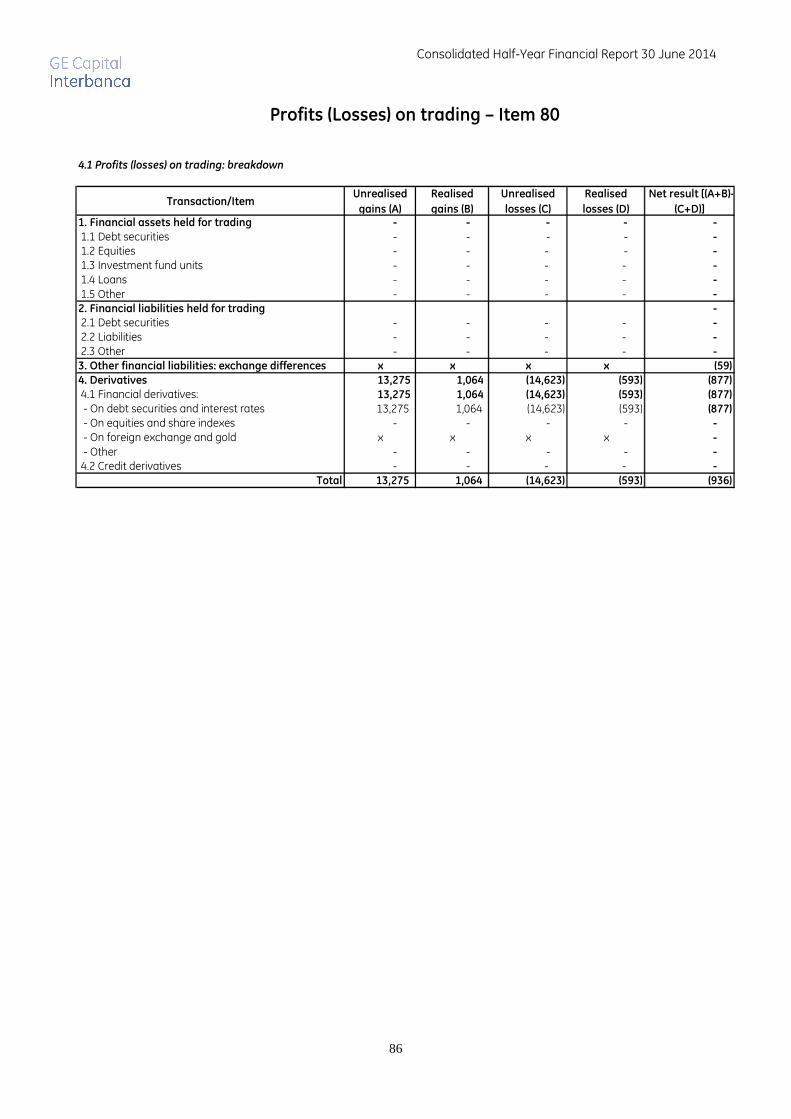
Consolidated Half-Year Financial Report 30 June 2014
86
Profits (Losses) on trading – Item 80
Transaction/Item Unrealised
gains (A)
Realised
gains (B)
Unrealised
losses (C)
Realised
losses (D)
Net result [(A+B)-
(C+D)]1. Financial assets held for trading - - - - -
1.1 Debt securities - - - - -
1.2 Equities - - - - -
1.3 Investment fund units - - - - -
1.4 Loans - - - - -
1.5 Other - - - - -
2. Financial liabilities held for trading -
2.1 Debt securities - - - - -
2.2 Liabilities - - - - -
2.3 Other - - - - -
3. Other financial liabilities: exchange differences x x x x (59)
4. Derivatives 13,275 1,064 (14,623) (593) (877)
4.1 Financial derivatives: 13,275 1,064 (14,623) (593) (877)
- On debt securities and interest rates 13,275 1,064 (14,623) (593) (877)
- On equities and share indexes - - - - -
- On foreign exchange and gold x x x x -
- Other - - - - -
4.2 Credit derivatives - - - - -
Total 13,275 1,064 (14,623) (593) (936)
4.1 Profits (losses) on trading: breakdown
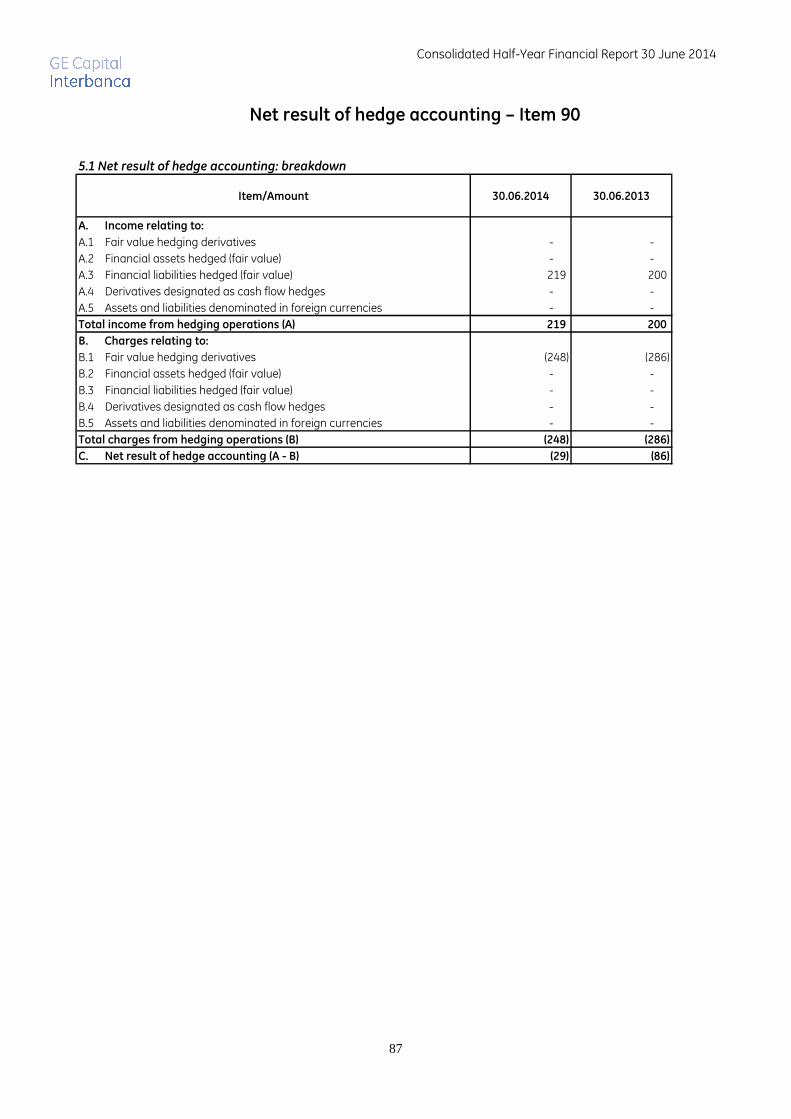
Consolidated Half-Year Financial Report 30 June 2014
87
Net result of hedge accounting – Item 90
Item/Amount 30.06.2014 30.06.2013
A. Income relating to:
A.1 Fair value hedging derivatives - -
A.2 Financial assets hedged (fair value) - -
A.3 Financial liabilities hedged (fair value) 219 200
A.4 Derivatives designated as cash flow hedges - -
A.5 Assets and liabilities denominated in foreign currencies - -
Total income from hedging operations (A) 219 200
B. Charges relating to:
B.1 Fair value hedging derivatives (248) (286)
B.2 Financial assets hedged (fair value) - -
B.3 Financial liabilities hedged (fair value) - -
B.4 Derivatives designated as cash flow hedges - -
B.5 Assets and liabilities denominated in foreign currencies - -
Total charges from hedging operations (B) (248) (286)
C. Net result of hedge accounting (A - B) (29) (86)
5.1 Net result of hedge accounting: breakdown
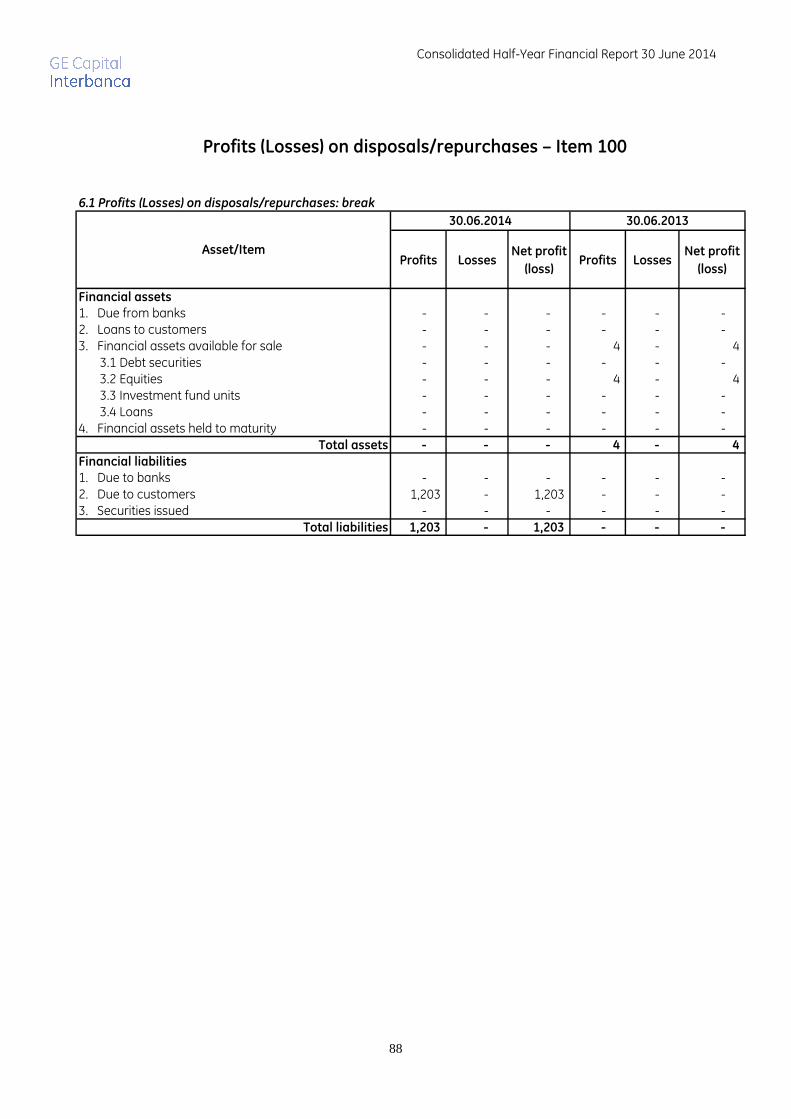
Consolidated Half-Year Financial Report 30 June 2014
88
Profits (Losses) on disposals/repurchases – Item 100
Profits LossesNet profit
(loss)Profits Losses
Net profit
(loss)
Financial assets
1. Due from banks - - - - - - 2. Loans to customers - - - - - - 3. Financial assets available for sale - - - 4 - 4 3.1 Debt securities - - - - - - 3.2 Equities - - - 4 - 4 3.3 Investment fund units - - - - - - 3.4 Loans - - - - - - 4. Financial assets held to maturity - - - - - -
Total assets - - - 4 - 4
Financial liabilities
1. Due to banks - - - - - - 2. Due to customers 1,203 - 1,203 - - - 3. Securities issued - - - - - -
Total liabilities 1,203 - 1,203 - - -
Asset/Item
30.06.2014 30.06.2013
6.1 Profits (Losses) on disposals/repurchases: break
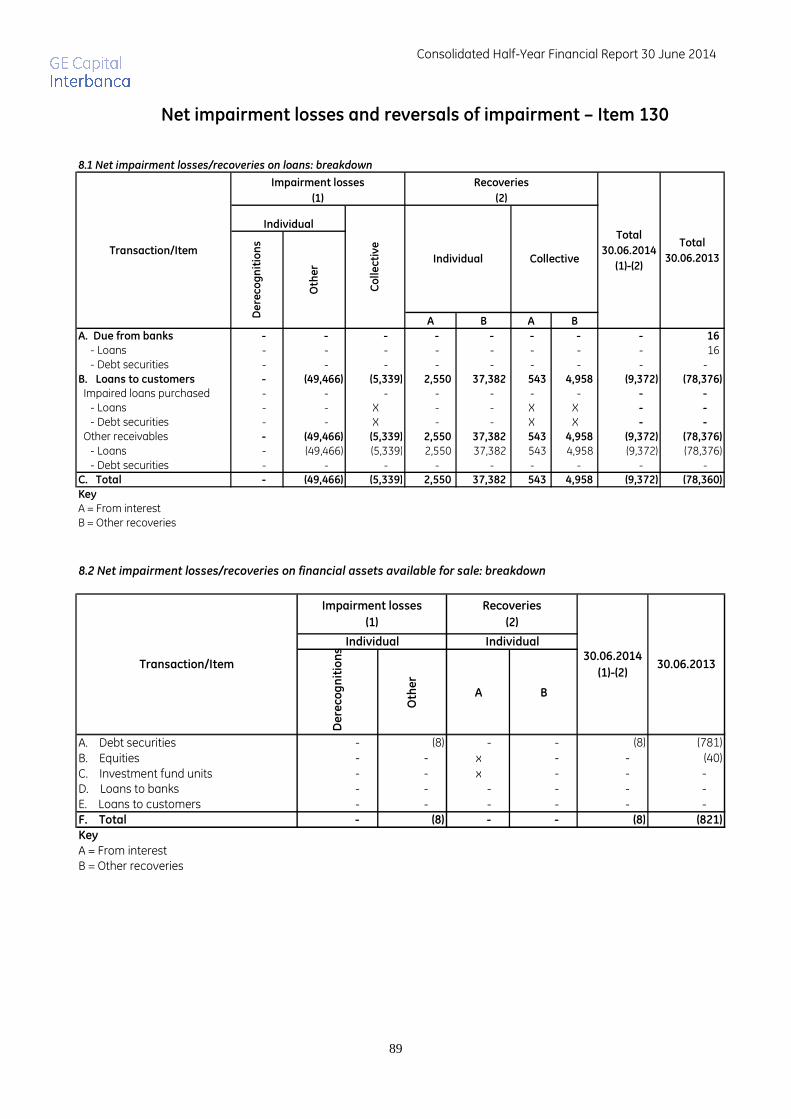
Consolidated Half-Year Financial Report 30 June 2014
89
Net impairment losses and reversals of impairment – Item 130
A B A B
A. Due from banks - - - - - - - - 16
- Loans - - - - - - - - 16 - Debt securities - - - - - - - - -
B. Loans to customers - (49,466) (5,339) 2,550 37,382 543 4,958 (9,372) (78,376)
Impaired loans purchased - - - - - - - - -
- Loans - - X - - X X - -
- Debt securities - - X - - X X - -
Other receivables - (49,466) (5,339) 2,550 37,382 543 4,958 (9,372) (78,376)
- Loans - (49,466) (5,339) 2,550 37,382 543 4,958 (9,372) (78,376) - Debt securities - - - - - - - - -
C. Total - (49,466) (5,339) 2,550 37,382 543 4,958 (9,372) (78,360)
Key
A = From interestB = Other recoveries
8.1 Net impairment losses/recoveries on loans: breakdown
Transaction/Item
Impairment losses
(1)
Individual
De
reco
gn
itio
ns
Oth
er
Co
lle
ctiv
e
Collective
Total
30.06.2014
(1)-(2)
Total
30.06.2013Individual
Recoveries
(2)
De
reco
gn
itio
ns
Oth
er
A B
A. Debt securities - (8) - - (8) (781)
B. Equities - - x - - (40)
C. Investment fund units - - x - - - D. Loans to banks - - - - - - E. Loans to customers - - - - - - F. Total - (8) - - (8) (821)
Key
A = From interestB = Other recoveries
8.2 Net impairment losses/recoveries on financial assets available for sale: breakdown
30.06.2014
(1)-(2)30.06.2013Transaction/Item
Individual Individual
Impairment losses
(1)
Recoveries
(2)

Consolidated Half-Year Financial Report 30 June 2014
90
A B A B
A. Guarantees granted - - (44) - - - - (44) 540
B. Credit derivatives - - - - - - - - -
C. Commitments to grant
financing - - - - - - - - -
D. Other transactions - - - - - - - - -
E. Total - - (44) - - - - (44) 540
Key
A = From interest
B = Other recoveries
Collective
De
rec
og
nit
ion
s
Oth
er
Transaction/Item
Impairment losses
(1)
Recoveries
(2)
8.4 Net impairment losses/recoveries on other financial transactions
30.06.2014
(1)-(2)30.06.2013
Individual
CollectiveIndividual
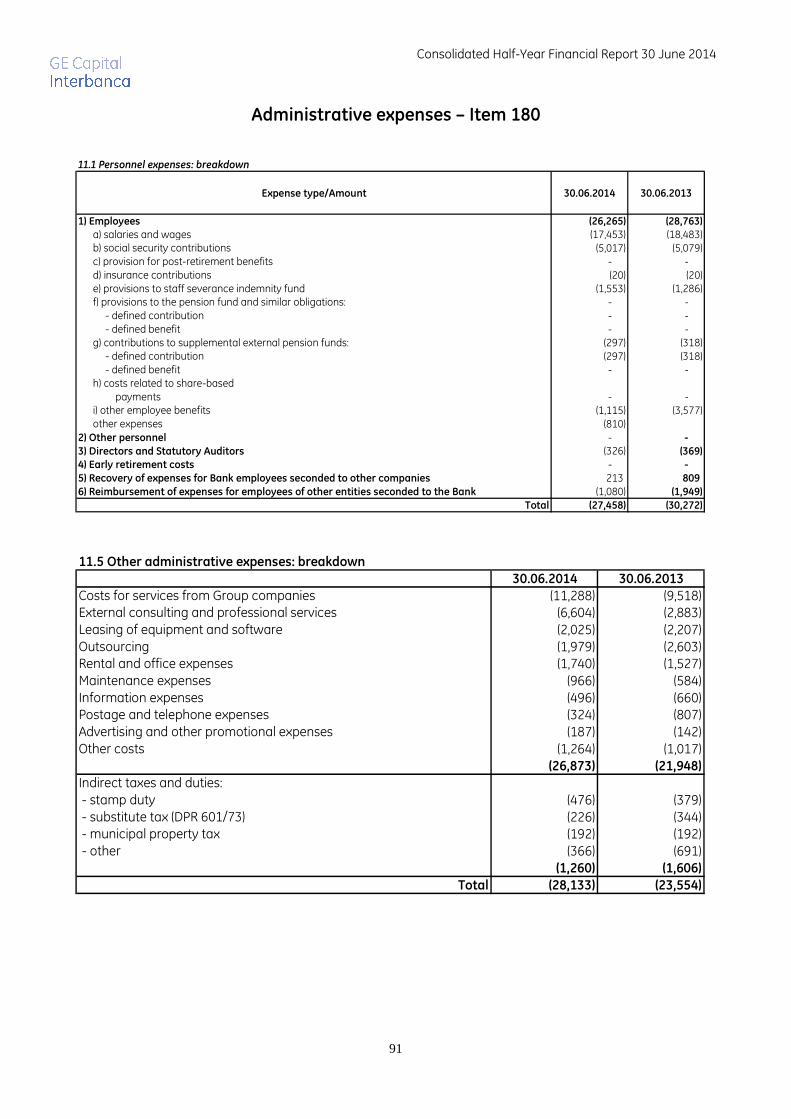
Consolidated Half-Year Financial Report 30 June 2014
91
Administrative expenses – Item 180
11.1 Personnel expenses: breakdown
Expense type/Amount 30.06.2014 30.06.2013
1) Employees (26,265) (28,763)
a) salaries and wages (17,453) (18,483) b) social security contributions (5,017) (5,079) c) provision for post-retirement benefits - - d) insurance contributions (20) (20) e) provisions to staff severance indemnity fund (1,553) (1,286) f) provisions to the pension fund and similar obligations: - - - defined contribution - - - defined benefit - - g) contributions to supplemental external pension funds: (297) (318) - defined contribution (297) (318) - defined benefit - - h) costs related to share-based payments - - i) other employee benefits (1,115) (3,577) other expenses (810) 2) Other personnel - -
3) Directors and Statutory Auditors (326) (369)
4) Early retirement costs - -
5) Recovery of expenses for Bank employees seconded to other companies 213 809
6) Reimbursement of expenses for employees of other entities seconded to the Bank (1,080) (1,949)
Total (27,458) (30,272)
11.5 Other administrative expenses: breakdown
30.06.2014 30.06.2013
Costs for services from Group companies (11,288) (9,518) External consulting and professional services (6,604) (2,883) Leasing of equipment and software (2,025) (2,207) Outsourcing (1,979) (2,603) Rental and office expenses (1,740) (1,527) Maintenance expenses (966) (584) Information expenses (496) (660) Postage and telephone expenses (324) (807) Advertising and other promotional expenses (187) (142) Other costs (1,264) (1,017)
(26,873) (21,948)
Indirect taxes and duties: - stamp duty (476) (379) - substitute tax (DPR 601/73) (226) (344) - municipal property tax (192) (192) - other (366) (691)
(1,260) (1,606)
Total (28,133) (23,554)
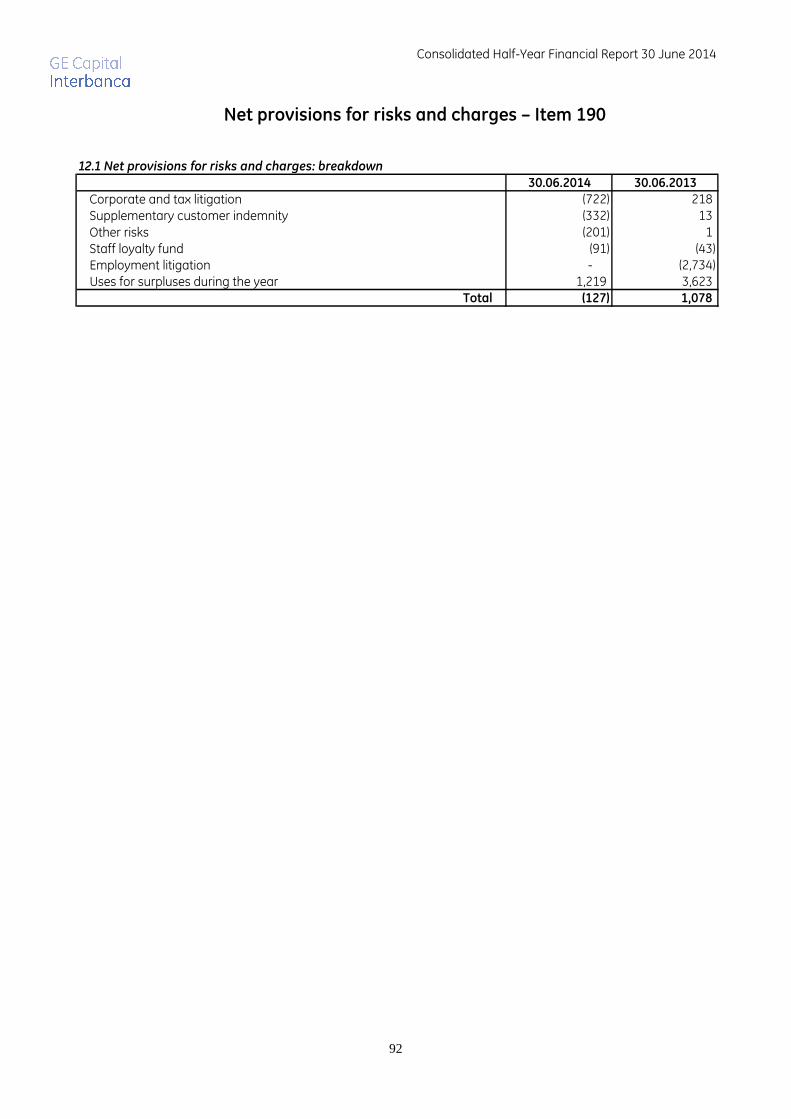
Consolidated Half-Year Financial Report 30 June 2014
92
Net provisions for risks and charges – Item 190
30.06.2014 30.06.2013
Corporate and tax litigation (722) 218 Supplementary customer indemnity (332) 13
Other risks (201) 1 Staff loyalty fund (91) (43) Employment litigation - (2,734) Uses for surpluses during the year 1,219 3,623
Total (127) 1,078
12.1 Net provisions for risks and charges: breakdown
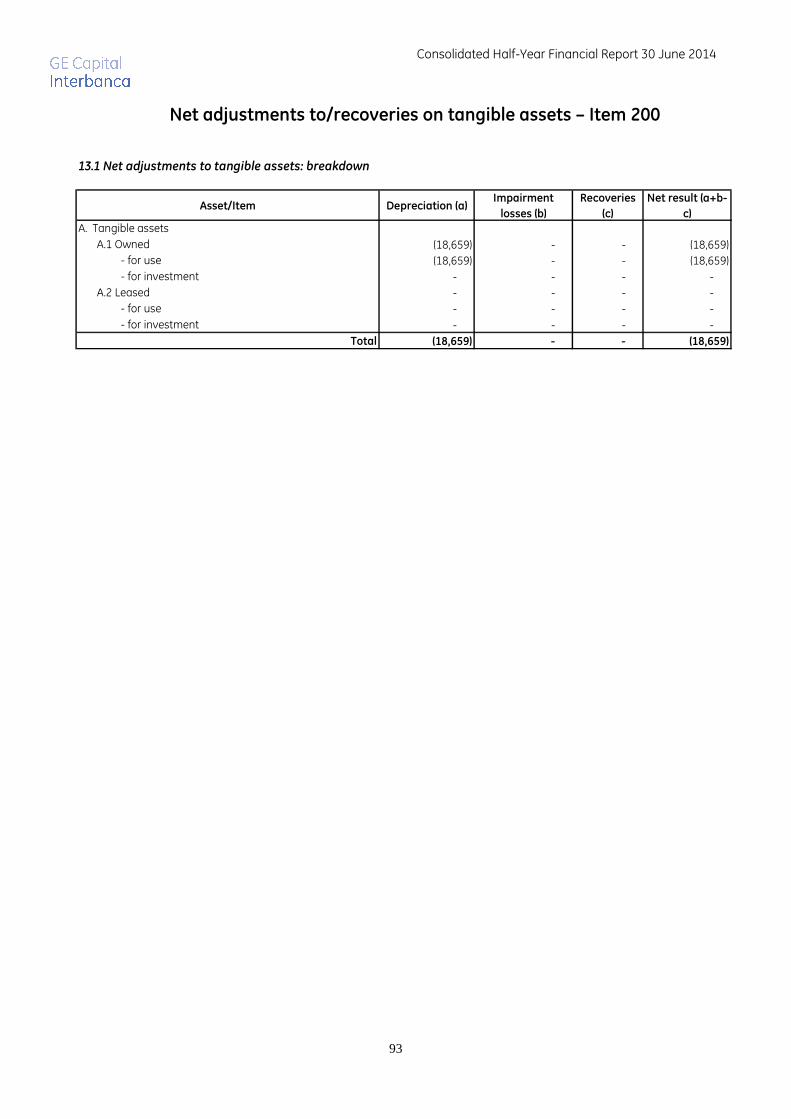
Consolidated Half-Year Financial Report 30 June 2014
93
Net adjustments to/recoveries on tangible assets – Item 200
Asset/Item Depreciation (a)Impairment
losses (b)
Recoveries
(c)
Net result (a+b-
c)
A. Tangible assets
A.1 Owned (18,659) - - (18,659)
- for use (18,659) - - (18,659)
- for investment - - - -
A.2 Leased - - - -
- for use - - - -
- for investment - - - -
Total (18,659) - - (18,659)
13.1 Net adjustments to tangible assets: breakdown

Consolidated Half-Year Financial Report 30 June 2014
94
Net adjustments to/recoveries on intangible assets – Item 210
Asset/Item Amortisation (a)Impairment
losses (b)
Recoveries
(c)
Net result
(a+b-c)A. Intangible assets A.1 Owned (640) - - (640) - Internally generated - - - - - Other (640) - - (640) A.2 Leased - - - -
Total (640) - - (640)
14.1 Net adjustments to intangible assets: breakdown

Consolidated Half-Year Financial Report 30 June 2014
95
Other operating expense/income – Item 220
15.1 Other operating expense: breakdown
30.06.2014 30.06.2013
Charges relating to rental transactions (23,193) (23,375) Charges relating to leasing transactions (10,177) (9,602) Charges relating to company/tax transactions - (2,877) Other charges (917) (1,043)
Total (34,287) (36,897)
30.06.2014 30.06.2013
Rental revenue and recovery 48,955 47,340 Leasing revenue and recovery 13,803 13,432 Other income 1,046 928
Total 63,804 61,695
15.2. Other operating income: breakdown
Consolidated Half-Year Financial Report 30 June 2014
96
CONSOLIDATED STATEMENT OF COMPREHENSIVE INCOME
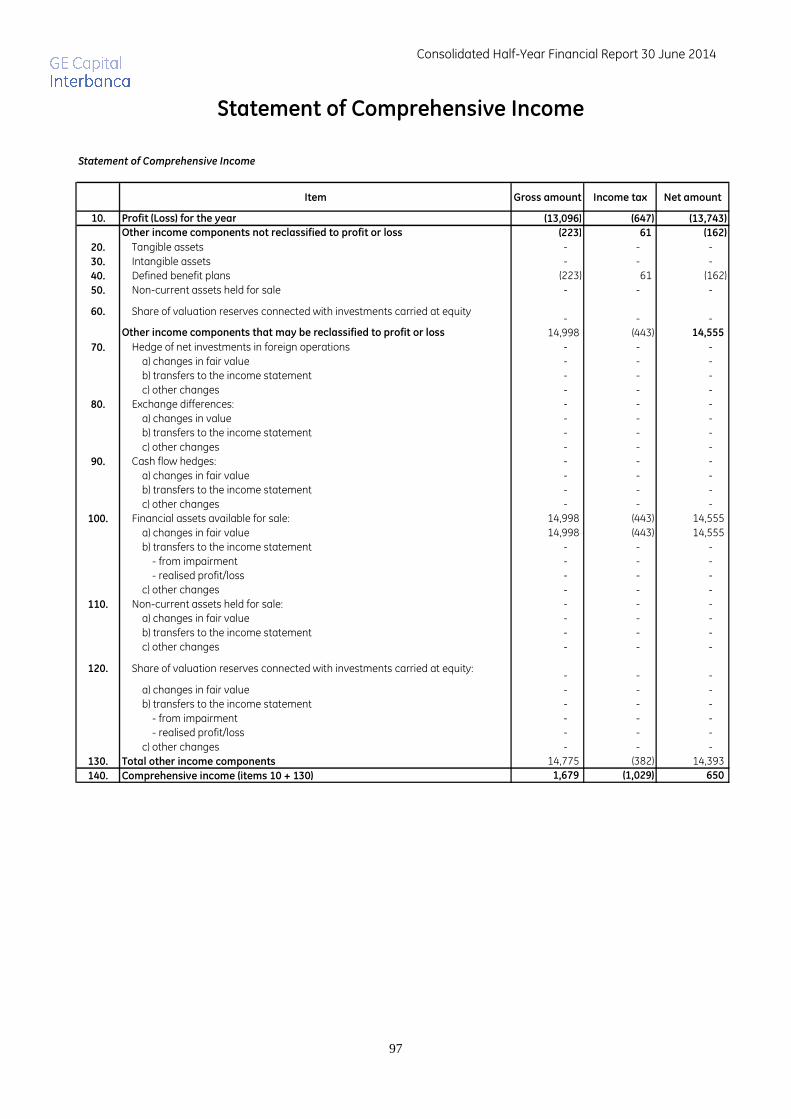
Consolidated Half-Year Financial Report 30 June 2014
97
Statement of Comprehensive Income
Statement of Comprehensive Income
Item Gross amount Income tax Net amount
10. Profit (Loss) for the year (13,096) (647) (13,743)
Other income components not reclassified to profit or loss (223) 61 (162)
20. Tangible assets - - -
30. Intangible assets - - -
40. Defined benefit plans (223) 61 (162)
50. Non-current assets held for sale - - -
60. Share of valuation reserves connected with investments carried at equity- - -
Other income components that may be reclassified to profit or loss 14,998 (443) 14,555
70. Hedge of net investments in foreign operations - - -
a) changes in fair value - - -
b) transfers to the income statement - - -
c) other changes - - -
80. Exchange differences: - - -
a) changes in value - - -
b) transfers to the income statement - - -
c) other changes - - -
90. Cash flow hedges: - - -
a) changes in fair value - - -
b) transfers to the income statement - - -
c) other changes - - -
100. Financial assets available for sale: 14,998 (443) 14,555
a) changes in fair value 14,998 (443) 14,555
b) transfers to the income statement - - -
- from impairment - - -
- realised profit/loss - - -
c) other changes - - -
110. Non-current assets held for sale: - - -
a) changes in fair value - - -
b) transfers to the income statement - - -
c) other changes - - -
120. Share of valuation reserves connected with investments carried at equity:- - -
a) changes in fair value - - -
b) transfers to the income statement - - -
- from impairment - - -
- realised profit/loss - - -
c) other changes - - -
130. Total other income components 14,775 (382) 14,393
140. Comprehensive income (items 10 + 130) 1,679 (1,029) 650
Consolidated Half-Year Financial Report 30 June 2014
98
INFORMATION ON CREDIT RISK Quantitative information relating to tables A1.3, A1.6, A1.7 and A1.8 refer only to the companies belonging to the Banking Group and therefore exclude the non-regulated companies included in the scope of consolidation.

Consolidated Half-Year Financial Report 30 June 2014
99
Quantitative disclosure
Total
No
n-
pe
rfo
rmin
g
Su
b-s
tan
da
rd
Re
stru
ctu
red
Imp
air
ed
Pa
st
du
e
No
t Im
pa
ire
d
Pa
st d
ue
Oth
er
ass
ets
Imp
air
ed
Oth
er
1. Financial assets held for trading - 6,635 - - 6,859 42,682 - - 56,176
2. Financial assets available for sale - - - - - 45,515 - - 45,515
3. Financial assets held to maturity - - - - - - - - -
4. Due from banks - - - - 165 204,071 - 10,539 214,775
5. Loans to customers 152,056 330,289 96,157 37,981 402,925 2,220,519 4,426 324,150 3,568,503
6. Financial assets designated at fair value through profit and loss - - - - - - - - -
7. Financial assets under disposal - - - - - - - - -
8. Hedging derivatives - - - - - 279 - - 279
Total 30.06.2014 152,056 336,924 96,157 37,981 409,949 2,513,066 4,426 334,689 3,885,248
Total 31.12.2013 148,099 337,145 58,085 87,226 1,268,490 1,760,415 17,922 313,673 3,991,055
A.1.1 Breakdown of financial assets by portfolio classification and credit quality (book value)
Portfolio/Quality
Banking Group Other companies
G
ross
exp
osu
re
Ind
ivid
ua
l
ad
just
me
nts
Ne
t e
xpo
sure
Gro
ss e
xpo
sure
Co
lle
ctiv
e
ad
just
me
nts
Ne
t e
xpo
sure
A. Banking Group
1. Financial assets held for trading 13,075 6,440 6,635 x x 49,541 56,176
2. Financial assets available for sale 15,252 15,252 - 45,515 - 45,515 45,515
3. Financial assets held to maturity - - - - - - -
4. Due from banks - - - 204,814 2 204,812 204,812
5. Loans to customers 1,377,661 761,177 616,484 2,697,071 73,629 2,623,442 3,239,926
6. Financial assets designated at fair value through profit and loss - - - x x - -
7. Financial assets under disposal - - - - - - -
8. Hedging derivatives - - - x x 624 624
Total A 1,405,988 782,869 623,119 2,947,400 73,631 2,923,934 3,547,053
B. Other companies included in the consolidation
1. Financial assets held for trading - - - x x - -
2. Financial assets available for sale - - - - - - -
3. Financial assets held to maturity - - - - - - -
4. Due from banks - - - 10,218 135 10,083 10,083
5. Loans to customers 71,003 66,577 4,426 329,935 5,784 324,151 328,577
6. Financial assets designated at fair value through profit and loss - - - x x - -
7. Financial assets under disposal - - - - - - -
8. Hedging derivatives - - - x x - -
Total B 71,003 66,577 4,426 340,153 5,919 334,234 338,660
Total 30.06.2014 1,476,991 849,446 627,545 3,287,553 79,550 3,258,168 3,885,713
Total 31.12.2013 1,529,837 881,360 648,477 3,386,699 88,903 3,342,578 3,991,055
A.1.2 Breakdown of financial assets by portfolio classification and credit quality (gross and net values)
Portfolio/Quality
Impaired assets Performing
To
tal (
ne
t e
xpo
sure
)
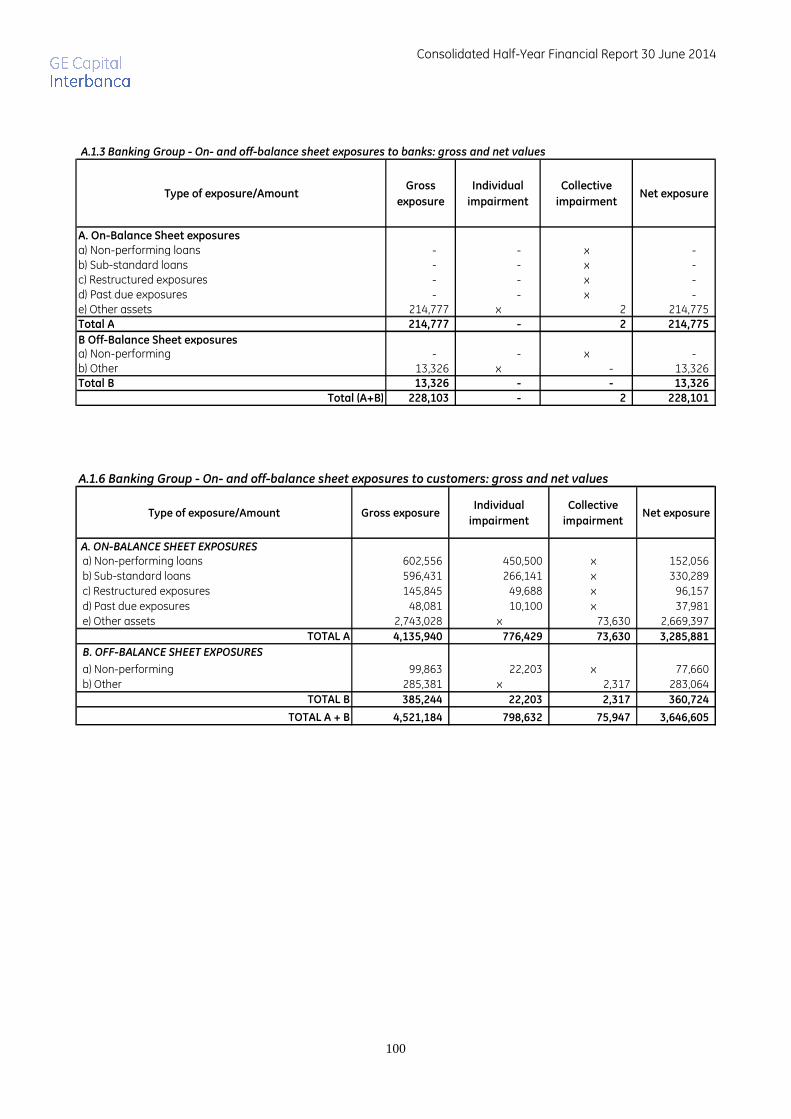
Consolidated Half-Year Financial Report 30 June 2014
100
Type of exposure/AmountGross
exposure
Individual
impairment
Collective
impairmentNet exposure
A. On-Balance Sheet exposures
a) Non-performing loans - - x - b) Sub-standard loans - - x - c) Restructured exposures - - x - d) Past due exposures - - x - e) Other assets 214,777 x 2 214,775 Total A 214,777 - 2 214,775
B Off-Balance Sheet exposures a) Non-performing - - x - b) Other 13,326 x - 13,326 Total B 13,326 - - 13,326
Total (A+B) 228,103 - 2 228,101
A.1.3 Banking Group - On- and off-balance sheet exposures to banks: gross and net values
Type of exposure/Amount Gross exposureIndividual
impairment
Collective
impairmentNet exposure
A. ON-BALANCE SHEET EXPOSURES a) Non-performing loans 602,556 450,500 x 152,056
b) Sub-standard loans 596,431 266,141 x 330,289
c) Restructured exposures 145,845 49,688 x 96,157
d) Past due exposures 48,081 10,100 x 37,981
e) Other assets 2,743,028 x 73,630 2,669,397
TOTAL A 4,135,940 776,429 73,630 3,285,881
B. OFF-BALANCE SHEET EXPOSURES
a) Non-performing 99,863 22,203 x 77,660
b) Other 285,381 x 2,317 283,064
TOTAL B 385,244 22,203 2,317 360,724
TOTAL A + B 4,521,184 798,632 75,947 3,646,605
A.1.6 Banking Group - On- and off-balance sheet exposures to customers: gross and net values
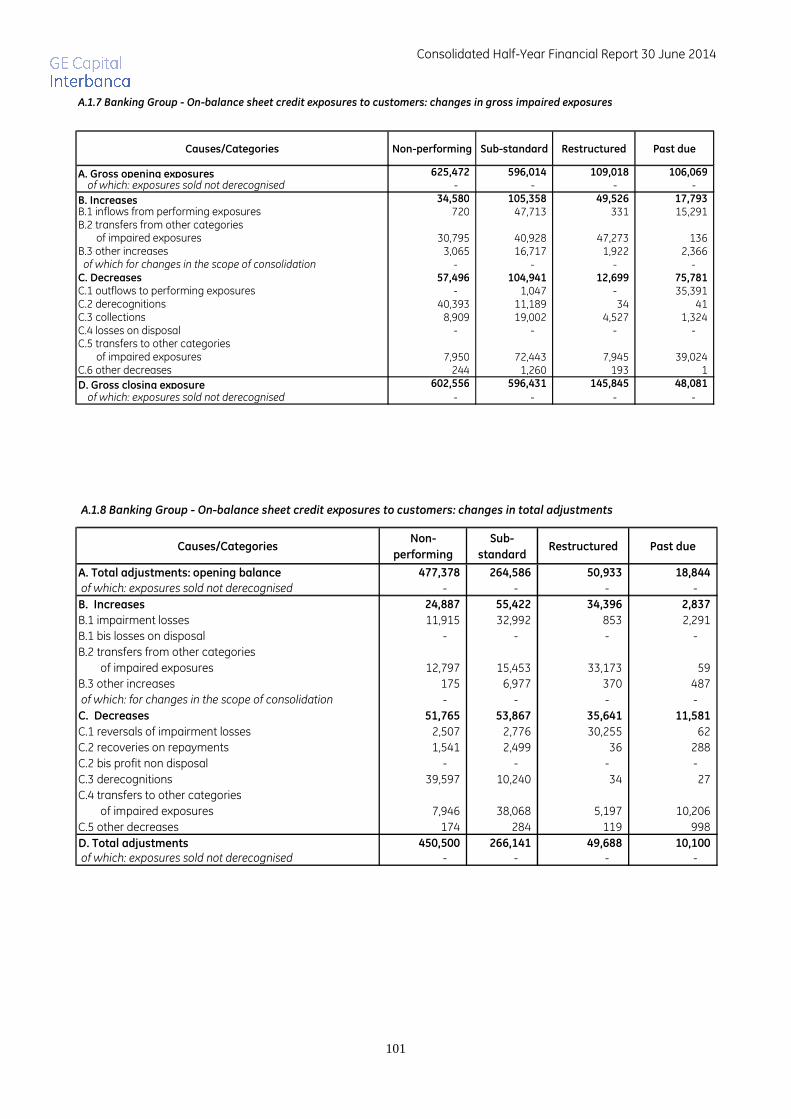
Consolidated Half-Year Financial Report 30 June 2014
101
Causes/Categories Non-performing Sub-standard Restructured Past due
A. Gross opening exposures 625,472 596,014 109,018 106,069 of which: exposures sold not derecognised - - - -
B. Increases 34,580 105,358 49,526 17,793 B.1 inflows from performing exposures 720 47,713 331 15,291 B.2 transfers from other categories of impaired exposures 30,795 40,928 47,273 136 B.3 other increases 3,065 16,717 1,922 2,366 of which for changes in the scope of consolidation - - - - C. Decreases 57,496 104,941 12,699 75,781 C.1 outflows to performing exposures - 1,047 - 35,391 C.2 derecognitions 40,393 11,189 34 41 C.3 collections 8,909 19,002 4,527 1,324 C.4 losses on disposal - - - - C.5 transfers to other categories of impaired exposures 7,950 72,443 7,945 39,024 C.6 other decreases 244 1,260 193 1
D. Gross closing exposure 602,556 596,431 145,845 48,081
of which: exposures sold not derecognised - - - -
A.1.7 Banking Group - On-balance sheet credit exposures to customers: changes in gross impaired exposures
Causes/CategoriesNon-
performing
Sub-
standardRestructured Past due
A. Total adjustments: opening balance 477,378 264,586 50,933 18,844
of which: exposures sold not derecognised - - - -
B. Increases 24,887 55,422 34,396 2,837
B.1 impairment losses 11,915 32,992 853 2,291
B.1 bis losses on disposal - - - -
B.2 transfers from other categories
of impaired exposures 12,797 15,453 33,173 59
B.3 other increases 175 6,977 370 487
of which: for changes in the scope of consolidation - - - -
C. Decreases 51,765 53,867 35,641 11,581
C.1 reversals of impairment losses 2,507 2,776 30,255 62
C.2 recoveries on repayments 1,541 2,499 36 288
C.2 bis profit non disposal - - - -
C.3 derecognitions 39,597 10,240 34 27
C.4 transfers to other categories
of impaired exposures 7,946 38,068 5,197 10,206
C.5 other decreases 174 284 119 998
D. Total adjustments 450,500 266,141 49,688 10,100
of which: exposures sold not derecognised - - - -
A.1.8 Banking Group - On-balance sheet credit exposures to customers: changes in total adjustments

Consolidated Half-Year Financial Report 30 June 2014
102
Securitisation transactions and sale of business units
The securitisation transaction initiated in 2010 by GE Capital Servizi Finanziari, in accordance with Italian
Law no. 130/99, involving the sale of leasing contracts stipulated with Italian residents, was concluded
on 25 June 2014 with the repayment of the Senior Notes, consistent with the amortisation of the
underlying portfolio.
Consolidated Half-Year Financial Report 30 June 2014
103
INFORMATION ON TRANSACTIONS WITH RELATED PARTIES

Consolidated Half-Year Financial Report 30 June 2014
104
PARENT COMPANY
GE Capital Corporation
COMPANIES BELONGING TO THE BANKING GROUP
GE Capital Interbanca S.p.A. - Parent Company of the Banking Group
GE Capital Servizi Finanziari S.p.A.
GE Capital Finance S.r.l.
GE SPV S.r.l.
SUBSIDIARIES NOT BELONGING TO THE BANKING GROUP INCLUDED IN THE SCOPE OF
CONSOLIDATION
GE Capital Services S.r.l.
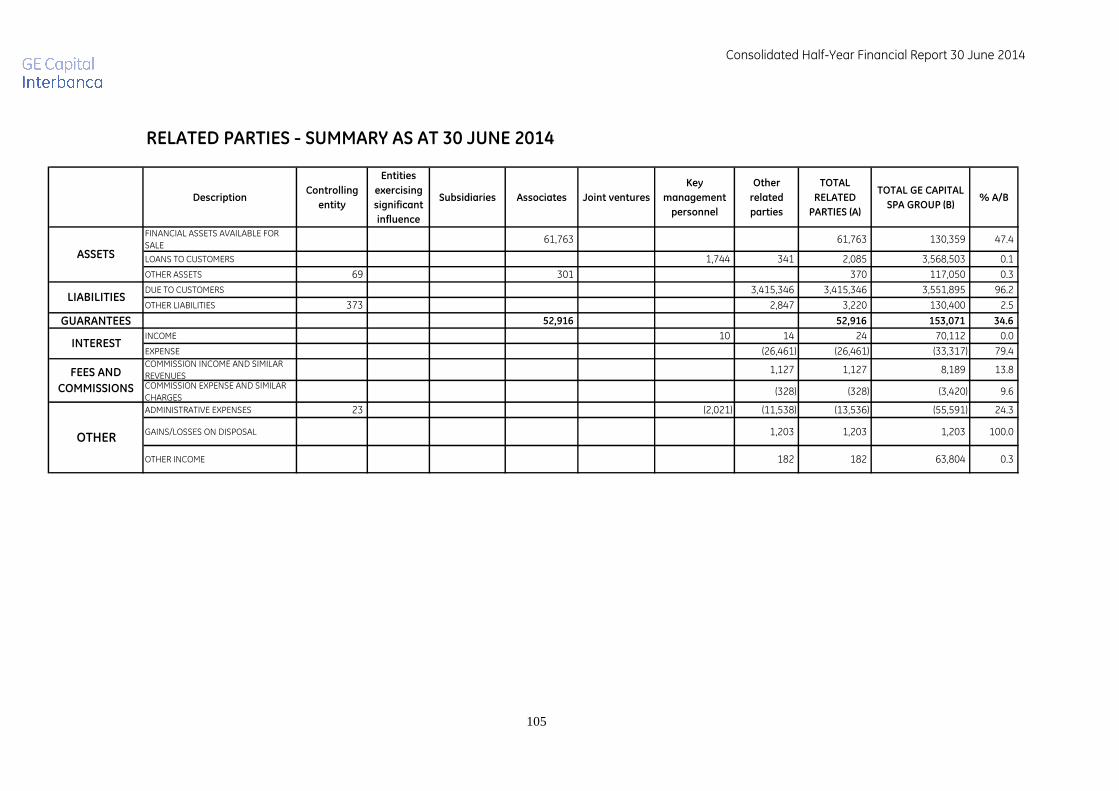
Consolidated Half-Year Financial Report 30 June 2014
105
RELATED PARTIES - SUMMARY AS AT 30 JUNE 2014
DescriptionControlling
entity
Entities
exercising
significant
influence
Subsidiaries Associates Joint ventures
Key
management
personnel
Other
related
parties
TOTAL
RELATED
PARTIES (A)
TOTAL GE CAPITAL
SPA GROUP (B)% A/B
FINANCIAL ASSETS AVAILABLE FOR
SALE61,763 61,763 130,359 47.4
LOANS TO CUSTOMERS 1,744 341 2,085 3,568,503 0.1
OTHER ASSETS 69 301 370 117,050 0.3
DUE TO CUSTOMERS 3,415,346 3,415,346 3,551,895 96.2
OTHER LIABILITIES 373 2,847 3,220 130,400 2.5
GUARANTEES 52,916 52,916 153,071 34.6
INCOME 10 14 24 70,112 0.0
EXPENSE (26,461) (26,461) (33,317) 79.4 COMMISSION INCOME AND SIMILAR
REVENUES1,127 1,127 8,189 13.8
COMMISSION EXPENSE AND SIMILAR
CHARGES(328) (328) (3,420) 9.6
ADMINISTRATIVE EXPENSES 23 (2,021) (11,538) (13,536) (55,591) 24.3
GAINS/LOSSES ON DISPOSAL 1,203 1,203 1,203 100.0
OTHER INCOME 182 182 63,804 0.3
OTHER
ASSETS
LIABILITIES
INTEREST
FEES AND
COMMISSIONS
Consolidated Half-Year Financial Report 30 June 2014
106
SEGMENT REPORTING
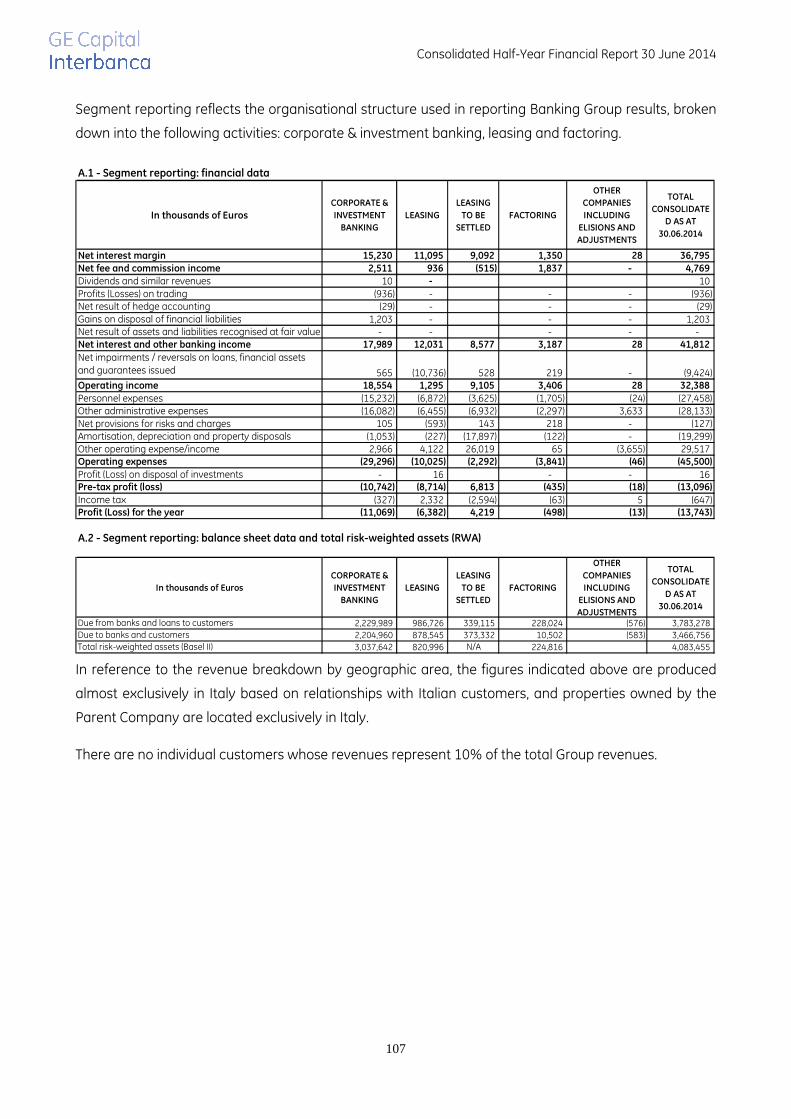
Consolidated Half-Year Financial Report 30 June 2014
107
Segment reporting reflects the organisational structure used in reporting Banking Group results, broken
down into the following activities: corporate & investment banking, leasing and factoring.
A.1 - Segment reporting: financial data
In thousands of Euros
CORPORATE &
INVESTMENT
BANKING
LEASING
LEASING
TO BE
SETTLED
FACTORING
OTHER
COMPANIES
INCLUDING
ELISIONS AND
ADJUSTMENTS
TOTAL
CONSOLIDATE
D AS AT
30.06.2014
Net interest margin 15,230 11,095 9,092 1,350 28 36,795
Net fee and commission income 2,511 936 (515) 1,837 - 4,769
Dividends and similar revenues 10 - 10 Profits (Losses) on trading (936) - - - (936) Net result of hedge accounting (29) - - - (29) Gains on disposal of financial liabilities 1,203 - - - 1,203 Net result of assets and liabilities recognised at fair value - - - - - Net interest and other banking income 17,989 12,031 8,577 3,187 28 41,812
Operating income 18,554 1,295 9,105 3,406 28 32,388
Personnel expenses (15,232) (6,872) (3,625) (1,705) (24) (27,458) Other administrative expenses (16,082) (6,455) (6,932) (2,297) 3,633 (28,133) Net provisions for risks and charges 105 (593) 143 218 - (127) Amortisation, depreciation and property disposals (1,053) (227) (17,897) (122) - (19,299) Other operating expense/income 2,966 4,122 26,019 65 (3,655) 29,517 Operating expenses (29,296) (10,025) (2,292) (3,841) (46) (45,500)
Profit (Loss) on disposal of investments - 16 - - 16 Pre-tax profit (loss) (10,742) (8,714) 6,813 (435) (18) (13,096)
Income tax (327) 2,332 (2,594) (63) 5 (647) Profit (Loss) for the year (11,069) (6,382) 4,219 (498) (13) (13,743)
A.2 - Segment reporting: balance sheet data and total risk-weighted assets (RWA)
In thousands of Euros
CORPORATE &
INVESTMENT
BANKING
LEASING
LEASING
TO BE
SETTLED
FACTORING
OTHER
COMPANIES
INCLUDING
ELISIONS AND
ADJUSTMENTS
TOTAL
CONSOLIDATE
D AS AT
30.06.2014
Due from banks and loans to customers 2,229,989 986,726 339,115 228,024 (576) 3,783,278
Due to banks and customers 2,204,960 878,545 373,332 10,502 (583) 3,466,756
Total risk-weighted assets (Basel II) 3,037,642 820,996 N/A 224,816 4,083,455
(9,424) 528
Net impairments / reversals on loans, financial assets and guarantees issued 565 (10,736) 219 -
In reference to the revenue breakdown by geographic area, the figures indicated above are produced
almost exclusively in Italy based on relationships with Italian customers, and properties owned by the
Parent Company are located exclusively in Italy.
There are no individual customers whose revenues represent 10% of the total Group revenues.
Consolidated Half-Year Financial Report 30 June 2014
108
CERTIFICATION OF THE ABRIDGED CONSOLIDATED
HALF-YEAR FINANCIAL STATEMENTS PURSUANT TO
ARTICLE 154-BIS OF ITALIAN LEGISLATIVE DECREE NO.
58 OF 24 FEBRUARY 1998
Consolidated Half-Year Financial Report 30 June 2014
109
Certification of the Abridged Consolidated Half-year Financial Statements pursuant to Article 154- bis, para. 3 and 4 of Italian Legislative Decree No. 58 of 24 February 1998
The undersigned, Paolo Braghieri and Ettore Colombo, in their capacities as Chief Executive Officer and Executive charged with preparing the financial reports of GE Capital S.p.A., in accordance with the provisions of Article 154-bis, para. 3 and 4 of Italian Legislative Decree No. 58 of 24 February 1998, do certify:
• its adequacy with regard to the characteristics of the business and • the actual implementation of the administrative and accounting procedures for preparing the Abridged Consolidated Half-year Financial Statements from 1 January 2014 to 30 June 2014
Furthermore, we attest that the Abridged Consolidated Half-year Financial Statements:
a) have been prepared under international accounting standards recognised by the European Commission in compliance with (EC) Regulation no. 1606/2002 of the European Parliament and European Council of 19 July 2002; b) correspond to the books and accounting entries; c) provide a true and correct representation of the equity, economic and financial position of the Issuer and all the businesses included in the consolidation.
The Interim Report on Operations refers to important events that occurred in the first six months of the financial year and their impact on the Abridged consolidated half-year financial statements, whilst also describing the main risks and uncertainties for the remaining six months of the financial year. Milan, 29 August 2014 [signature] [signature] Paolo Braghieri Ettore Colombo Chief Executive Officer Executive charged with preparing the company's financial reports

Consolidated Half-Year Financial Report 30 June 2014
110
OFFICES
Consolidated Half-Year Financial Report 30 June 2014
111
GE Capital Interbanca S.p.A.
Registered office and General Management Corso Venezia 56 – 20121 Milan, Italy
North West Area Branch
Corso Venezia 56 – 20121 Milan
Central South Area Branch
Via Federico Cesi, 72 – 00193 Rome
Bologna Branch
Via Emilia Ponente – 40125 Bologna
GE Capital Finance S.r.l. Registered office Via Borghetto 5 – 20121 Milan
Operating headquarters Piazza Indro Montanelli 20 – 20099 Sesto San Giovanni (Milan)
GE Capital Servizi Finanziari S.p.A. Registered office and operating headquarters Via Vecchia di Cuneo 136 – 12084 Loc. Pogliola Mondovì
(Cuneo)
GE Capital Services S.r.l. Registered office Via Giuseppe Rosaccio, 33 - 00156 Rome
Operating headquarters Piazza Indro Montanelli 20 – 20099 Sesto San Giovanni (Milan)


![ImageandVisionComputing ...agamenon.tsc.uah.es/Investigacion/gram/publications/imavis2016-gil.pdf · cal flow fields, as in [5–7]. In [8], Sazbon et al. recall that, for a camera](https://img.pdfslide.us/doc/110x75/5bc3493509d3f299608c537c/imageandvisioncomputing-cal-ow-elds-as-in-57-in-8-sazbon.jpg)


![Monocular Obstacle Avoidance for Blind People using ... · Monocular Obstacle Avoidance for Blind People using Probabilistic Focus of Expansion Estimation ... Sazbon et al. [32] are](https://img.pdfslide.us/doc/110x75/5bc3493409d3f299608c5354/monocular-obstacle-avoidance-for-blind-people-using-monocular-obstacle-avoidance.jpg)