Embed Size (px)
Citation preview
Consolidated Financial Statements
Yodogawa Steel Works, Ltd.
and Consolidated Subsidiaries
March 31, 2017
with Independent Auditor’s Report
Yodogawa Steel Works, Ltd. and Consolidated Subsidiaries
Consolidated Financial Statements
March 31, 2017
Contents
Independent Auditor’s Report ............................................................................................. 1
Consolidated Financial Statements
Consolidated Balance Sheet ................................................................................................ 2
Consolidated Statement of Operations ................................................................................ 4
Consolidated Statement of Comprehensive Income ........................................................... 5
Consolidated Statement of Changes in Net Assets ............................................................. 6
Consolidated Statement of Cash Flows ............................................................................... 8
Notes to Consolidated Financial Statements ..................................................................... 10


Yodogawa Steel Works, Ltd. and Consolidated Subsidiaries
2
Consolidated Balance Sheet
March 31, 2017
Millions of yen
Thousands of U.S. dollars
(Note 4)
2016 2017 2017
Assets Current assets:
Cash and deposits (Notes 5, 6 and 12) ¥ 46,503 ¥ 40,762 $ 363,330 Marketable securities (Notes 6 and 7) 100 – – Notes and accounts receivable (Note 6):
Unconsolidated subsidiaries and affiliates (Note 23) 14,191 14,719 131,197
Trade 23,489 26,384 235,173 Less allowance for doubtful receivables (112) (114) (1,016)
Inventories (Note 8) 25,189 25,508 227,364 Deferred income taxes (Note 15) 546 529 4,715 Other current assets (Note 5) 7,647 6,400 57,046
Total current assets 117,553 114,188 1,017,809
Property, plant and equipment:
Land (Notes 9, 18 and 24) 18,385 18,686 166,557 Buildings and structures (Notes 9 and 24) 58,637 59,869 533,639 Machinery, equipment and vehicles (Note 9) 141,798 142,692 1,271,878 Leased assets (Note 20) 1,500 1,409 12,559 Construction in progress 659 766 6,828 Less accumulated depreciation (170,341) (172,534) (1,537,873)
Property, plant and equipment, net (Note 25) 50,638 50,888 453,588
Investments and other assets:
Investments in securities (Notes 6, 7 and 12) 29,918 37,558 334,771 Investments in unconsolidated subsidiaries and affiliates (Note 25) 4,879 5,017 44,719
Goodwill (Notes 9 and 25) 14 11 98 Deferred income taxes (Note 15) 782 403 3,592 Intangible assets 1,274 1,417 12,630 Other assets (Note 12) 802 496 4,421
Total investments and other assets 37,669 44,902 400,231
Total assets (Note 25) ¥ 205,860 ¥ 209,978 $ 1,871,628

See accompanying notes to consolidated financial statements. 3
Millions of yen
Thousands of U.S. dollars
(Note 4)
2016 2017 2017 Liabilities and net assets Current liabilities:
Current portion of finance lease obligations (Note 10) ¥ 173 ¥ 177 $ 1,578
Notes and accounts payable (Note 6): Unconsolidated subsidiaries and affiliates 302 499 4,448 Trade 16,072 17,301 154,212 Construction 1,654 2,695 24,022
Short-term loans (Note 10) 7,153 670 5,972 Accrued expenses 2,236 2,405 21,437 Income tax payable (Note 15) 1,758 2,626 23,407 Provision for bonuses to employees 939 1,052 9,377 Other current liabilities (Note 12) 2,809 3,023 26,944
Total current liabilities 33,096 30,448 271,397
Long-term liabilities: Liability for retirement benefits (Note 14) 10,638 8,279 73,794 Provision for retirement benefits for directors and audit & supervisory board members 112 94 838
Guarantee deposits (Note 10) 3,068 3,053 27,213 Finance lease obligations, less current portion (Note 10) 931 743 6,623
Deferred income taxes (Note 15) 2,673 3,943 35,146 Deferred income taxes on land revaluation reserve (Note 15) 856 856 7,630
Other long-term liabilities 1,087 1,187 10,579 Total long-term liabilities 19,365 18,155 161,823 Contingent liabilities (Note 13) Net assets:
Shareholders’ equity (Note 17): Common stock: Authorized: 143,000,000 shares in 2016 and 2017 Issued: 35,837,230 shares in 2016 and 2017 23,221 23,221 206,979 Capital surplus 21,432 20,388 181,728 Retained earnings(Note 26) 90,590 95,665 852,705 Treasury stock, at cost – 5,363,079 shares in 2016 and 6,028,845 shares in 2017 (10,399) (12,199) (108,735)
Total shareholders’ equity 124,844 127,075 1,132,677 Accumulated other comprehensive income:
Unrealized holding gain on securities (Note 7) 10,756 14,477 129,040 Land revaluation reserve (Note 18) 1,627 1,626 14,493 Translation adjustments 1,860 1,581 14,092 Retirement benefit liability adjustments (Note 14) (1,938) (1,517) (13,521)
Total accumulated other comprehensive income 12,305 16,167 144,104 Stock acquisition rights (Note 17) 178 205 1,827 Non-controlling interests 16,072 17,928 159,800
Total net assets 153,399 161,375 1,438,408
Total liabilities and net assets ¥ 205,860 ¥ 209,978 $ 1,871,628

Yodogawa Steel Works, Ltd. and Consolidated Subsidiaries
See accompanying notes to consolidated financial statements. 4
Consolidated Statement of Operations
Year ended March 31, 2017
Millions of yen
Thousands of
U.S. dollars
(Note 4)
2016 2017 2017
Net sales (Notes 23, 24 and 25) ¥ 159,214 ¥ 154,221 $ 1,374,641
Cost of sales (Notes 8 and 24) 134,978 123,884 1,104,234
Gross profit 24,236 30,337 270,407
Selling, general and administrative expenses
(Notes 17, 19 and 24) 16,934 17,168 153,026
Operating income (Note 25) 7,302 13,169 117,381
Other income (expenses):
Interest and dividend income 1,031 923 8,227
Interest expense (215) (158) (1,408)
Insurance income 93 105 936
Foreign exchange loss, net (612) (200) (1,783)
Equity in earnings of an affiliate 337 300 2,674
Gain (loss) on revaluation of derivatives 32 (2) (18)
Gain (loss) on sales of investments in securities,
net (Note 7) 497 (6) (53)
Expenses related to employees seconded to
overseas unconsolidated subsidiaries (255) (261) (2,326)
Expenses for disposal of PCB waste – (231) (2,059)
Loss on sales or disposal of property, plant and
equipment, net (77) (90) (802)
Loss on impairment of investments in securities
(Note 7) (1,828) (135) (1,203)
Loss on impairment of fixed assets
(Notes 9 and 25)
(6,603)
(737)
(6,569)
Gain on insurance claim 1 – –
Other, net (Note 7) 193 124 1,104
(Loss) profit before income taxes (104) 12,801 114,101
Income taxes (Note 15):
Current 2,941 4,126 36,777
Deferred (333) 74 659
2,608 4,200 37,436
(Loss) profit (2,712) 8,601 76,665
(Loss) profit attributable to:
Non-controlling interests 59 1,866 16,633
Owners of parent ¥ (2,771) ¥ 6,735 $ 60,032

Yodogawa Steel Works, Ltd. and Consolidated Subsidiaries
See accompanying notes to consolidated financial statements. 5
Consolidated Statement of Comprehensive Income
Year ended March 31, 2017
Millions of yen
Thousands of
U.S. dollars
(Note 4)
2016 2017 2017
(Loss) profit ¥ (2,712) ¥ 8,601 $ 76,665
Other comprehensive (loss) income (Note 16):
Unrealized holding (loss) gain on securities (3,422) 3,725 33,203
Land revaluation reserve (4) – –
Translation adjustments (1,120) (735) (6,552)
Retirement benefit liability adjustments (752) 310 2,763
Share of other comprehensive (loss) income of
an affiliate accounted for by the equity
method (10) 22 196
Total other comprehensive (loss) income (5,308) 3,322 29,610
Comprehensive (loss) income ¥ (8,020) ¥ 11,923 $106,275
Total comprehensive (loss) income attributable to:
Owners of parent ¥ (7,530) ¥ 10,597 $ 94,456
Non-controlling interests (490) 1,326 11,819

Yodogawa Steel Works, Ltd. and Consolidated Subsidiaries
6
Consolidated Statement of Changes in Net Assets
Year ended March 31, 2017
Millions of yen
Number of shares issued Common stock Capital surplus Retained earnings
Treasury stock, at cost
Total shareholders’ equity
Balance at April 1, 2015 179,186,153 ¥ 23,221 ¥ 21,210 ¥ 94,908 ¥ (9,186) ¥ 130,153 Cash dividends – – – (1,542) – (1,542) Loss attributable to owners of parent
for the year – – – (2,771) – (2,771) Acquisition of treasury stock – – – – (1,238) (1,238) Disposition of treasury stock – – (8) – 25 17 Increase due to change in ownership
interest resulting from capital increase of a consolidated subsidiary – – 198 – – 198
Increase due to change in ownership interest resulting from acquisition of investments in a consolidated subsidiary – – 32 – – 32
Reversal of land revaluation reserve – – – (5) – (5)
Other change (143,348,923) – – – – –
Balance at April 1, 2016 35,837,230 ¥ 23,221 ¥ 21,432 ¥ 90,590 ¥ (10,399) ¥ 124,844
Cash dividends – – – (1,661) – (1,661) Profit attributable to owners of parent
for the year – – – 6,735 – 6,735 Acquisition of treasury stock – – – – (1,810) (1,810) Disposition of treasury stock – – (2) – 10 8 Decrease due to change in ownership
interest resulting from capital increase of a consolidated subsidiary – – (1,048) – – (1,048)
Increase due to change in ownership interest resulting from acquisition of investments in a consolidated subsidiary – – 6 – – 6
Reversal of land revaluation reserve – – – 1 – 1
Other changes – – – – – –
Balance at March 31, 2017 35,837,230 ¥ 23,221 ¥ 20,388 ¥ 95,665 ¥ (12,199) ¥ 127,075
Millions of yen
Unrealized holding gain on securities
Land revaluation
reserve Translation adjustments
Retirement benefit liability
adjustments
Total accumulated
other comprehensive
income
Stock acquisition
rights
Non- controlling
interests Total net
assets
Balance at April 1, 2015 ¥ 14,150 ¥ 1,615 ¥ 2,554 ¥ (1,260) ¥ 17,059 ¥ 166 ¥ 17,522 ¥ 164,900 Cash dividends – – – – – – – (1,542) Loss attributable to owners of parent
for the year – – – – – – – (2,771) Acquisition of treasury stock – – – – – – – (1,238) Disposition of treasury stock – – – – – – – 17 Increase due to change in ownership
interest resulting from capital increase of a consolidated subsidiary – – – – – – – 198
Increase due to change in ownership interest resulting from acquisition of investments in a consolidated subsidiary – – – – – – – 32
Reversal of land revaluation reserve – – – – – – – (5)
Other changes (3,394) 12 (694) (678) (4,754) 12 (1,450) (6,192)
Balance at April 1, 2016 ¥ 10,756 ¥ 1,627 ¥ 1,860 ¥ (1,938) ¥ 12,305 ¥ 178 ¥ 16,072 ¥ 153,399
Cash dividends – – – – – – – (1,661) Profit attributable to owners of parent
for the year – – – – – – – 6,735 Acquisition of treasury stock – – – – – – – (1,810) Disposition of treasury stock – – – – – – – 8 Decrease due to change in ownership
interest resulting from capital increase of a consolidated subsidiary – – – – – – – (1,048)
Increase due to change in ownership interest resulting from acquisition of investments in a consolidated subsidiary – – – – – – – 6
Reversal of land revaluation reserve – – – – – – – 1
Other changes 3,721 (1) (279) 421 3,862 27 1,856 5,745
Balance at March 31, 2017 ¥ 14,477 ¥ 1,626 ¥ 1,581 ¥ (1,517) ¥ 16,167 ¥ 205 ¥ 17,928 ¥ 161,375

Yodogawa Steel Works, Ltd. and Consolidated Subsidiaries
See accompanying notes to consolidated financial statements. 7
Consolidated Statement of Changes in Net Assets (continued)
Year ended March 31, 2017
Thousands of U.S. dollars (Note 4)
Common stock Capital surplus Retained earnings
Treasury stock,
at cost
Total shareholders’
equity
Balance at April 1, 2016 $ 206,979 $ 191,033 $ 807,469 $ (92,691) $ 1,112,790
Cash dividends – – (14,805) – (14,805) Profit attributable to owners of parent
for the year – – 60,032 – 60,032
Acquisition of treasury stock – – – (16,133) (16,133) Disposition of treasury stock – (17) – 89 72
Decrease due to change in ownership
interest resulting from capital increase of a consolidated subsidiary – (9,341) – – (9,341)
Increase due to change in ownership
interest resulting from acquisition of investments in a consolidated
subsidiary – 53 – – 53
Reversal of land revaluation reserve – – 9 – 9
Other changes – – – – –
Balance at March 31, 2017 $ 206,979 $ 181,728 $ 852,705 $ (108,735) $ 1,132,677
Thousands of U.S. dollars (Note 4)
Unrealized
holding gain
on securities
Land
revaluation
reserve
Translation
adjustments
Retirement benefit
liability
adjustment
Total
accumulated other
comprehensive
income
Stock
acquisition
rights
Non-
controlling
interests
Total net
assets
Balance at April 1, 2016 $ 95,873 $ 14,502 $ 16,579 $ (17,274) $ 109,680 $ 1,587 $ 143,257 $ 1,367,314
Cash dividends – – – – – – – (14,805) Profit attributable to owners of parent
for the year – – – – – – – 60,032
Acquisition of treasury stock – – – – – – – (16,133) Disposition of treasury stock – – – – – – – 72
Decrease due to change in ownership
interest resulting from capital increase of a consolidated subsidiary – – – – – – – (9,341)
Increase due to change in ownership
interest resulting from acquisition of investments in a consolidated
subsidiary – – – – – – – 53
Reversal of land revaluation reserve – – – – – – – 9
Other changes 33,167 (9) (2,487) 3,753 34,424 240 16,543 51,207
Balance at March 31, 2017 $ 129,040 $ 14,493 $ 14,092 $ (13,521) $ 144,104 $ 1,827 $ 159,800 $ 1,438,408

Yodogawa Steel Works, Ltd. and Consolidated Subsidiaries
8
Consolidated Statement of Cash Flows
Year ended March 31, 2017
Millions of yen
Thousands of U.S. dollars
(Note 4)
2016 2017 2017
Cash flows from operating activities: (Loss) profit before income taxes ¥ (104) ¥ 12,801 $ 114,101 Adjustments for:
Depreciation and amortization 4,312 4,169 37,160
Amortization of goodwill 22 3 27 Equity in earnings of an affiliate (337) (300) (2,674) Increase (decrease) in liability for retirement benefits 83 (1,630) (14,529)
Increase (decrease) in provision for retirement benefits for directors and audit & supervisory board members 19 (18) (160)
Increase in provision for bonuses to employees 109 114 1,016 (Decrease) increase in allowance for doubtful receivables (77) 2 18
Interest and dividend income (1,031) (923) (8,227) Interest expense 215 158 1,408 Insurance income (94) (105) (936) (Gain) loss on revaluation of derivatives (32) 2 18 (Gain) loss on sales of investments in securities, net (497) 6 53
Loss on impairment of investments in securities 1,828 135 1,203 Loss on sales or disposal of property, plant and equipment, net 77 90 802
Loss on impairment of fixed assets 6,603 737 6,569 Decrease (increase) in notes and accounts receivable 3,472 (3,398) (30,288)
Decrease (increase) in inventories 6,783 (484) (4,314) (Decrease) increase in notes and accounts payable (1,417) 1,460 13,014
Other, net 933 (159) (1,417)
Subtotal 20,867 12,660 112,844 Insurance dividends and claims received 94 105 936 Interest and dividends received 1,079 957 8,530 Interest paid (213) (162) (1,444)
Income taxes paid (2,422) (3,342) (29,788)
Net cash provided by operating activities ¥ 19,405 ¥ 10,218 $ 91,078

Yodogawa Steel Works, Ltd. and Consolidated Subsidiaries
See accompanying notes to consolidated financial statements. 9
Consolidated Statement of Cash Flows (continued)
Year ended March 31, 2017
Millions of yen
Thousands of
U.S. dollars
(Note 4)
2016 2017 2017
Cash flows from investing activities:
Investments in time deposits ¥ (11,041) ¥ (1,261) $ (11,240)
Proceeds from time deposits 2,721 6,816 60,754 Proceeds from sales or redemption of marketable
securities 300 100 891
Purchases of property, plant and equipment (2,810) (4,769) (42,508) Proceeds from sales of property, plant and
equipment 11 11 98
Purchases of intangible assets (194) (299) (2,665) Purchases of investments in securities (1,526) (3,308) (29,485) Proceeds from sales of investments in securities 2,188 1,359 12,113
Payment for loans receivable (112) (424) (3,779) Collection of loans receivable 184 215 1,916
Other 0 – –
Net cash used in investing activities (10,279) (1,560) (13,905)
Cash flows from financing activities:
Net increase (decrease) in short-term bank loans 431 (5,737) (51,136) Proceeds from sales of treasury stock 1 0 0 Purchases of treasury stock (1,235) (1,807) (16,107)
Cash dividends paid to owners of parent (1,556) (1,676) (14,939) Cash dividends paid to non-controlling interests (721) (512) (4,564) Repayment of lease obligations (177) (164) (1,462)
Purchases of investments in a subsidiary not
resulting in change in scope of consolidation (8) (1) (9)
Net cash used in financing activities (3,265) (9,897) (88,217) Effect of exchange rate changes on cash and cash
equivalents (269) (504) (4,493)
Net increase (decrease) in cash and cash
equivalents 5,592 (1,743) (15,537) Cash and cash equivalents at the beginning of the
year 35,198 40,790 363,580
Cash and cash equivalents at the end of the year
(Note 5) ¥ 40,790 ¥ 39,047 $ 348,043

Yodogawa Steel Works, Ltd. and Consolidated Subsidiaries
Notes to Consolidated Financial Statements
10
March 31, 2017
1. Summary of Significant Accounting Policies
(a) Basis of preparation
Yodogawa Steel Works, Ltd. (the “Company”) and its domestic subsidiaries maintain
their books of account and records in accordance with accounting principles generally
accepted in Japan, and its overseas subsidiaries maintain their books of account in
conformity with those of their respective countries of domicile.
The accompanying consolidated financial statements of the Company and its consolidated
subsidiaries (collectively, the “Group”) are prepared on the basis of accounting principles
generally accepted in Japan, which are different in certain respects as to the application
and disclosure requirements of International Financial Reporting Standards, and have
been compiled from the consolidated financial statements prepared by the Company as
required by the Financial Instruments and Exchange Act of Japan.
In preparing the accompanying consolidated financial statements, certain reclassifications
and rearrangements have been made to the consolidated financial statements issued
domestically in order to present them in a format which is more familiar to readers outside
Japan.
(b) Basis of consolidation
The accompanying consolidated financial statements include the accounts of the
Company and all subsidiaries over which substantial control is exerted through either
majority ownership of voting stock and/or by other means. All significant intercompany
balances and transactions have been eliminated in consolidation.
An investment in one affiliate (a company over which the Company has the ability to
exercise significant influence) is stated at cost plus equity in its undistributed earnings or
undisposed loss. Consolidated net income or loss includes the Company’s equity in the
current net income or loss of this company after the elimination of unrealized
intercompany profits.
The financial statements of certain consolidated subsidiaries whose fiscal year end is
December 31 have been included in consolidation on the basis of a full fiscal year after
making the necessary adjustments for significant transactions during the period from their
fiscal year end to the Company’s balance sheet date.

Yodogawa Steel Works, Ltd. and Consolidated Subsidiaries
Notes to Consolidated Financial Statements (continued)
11
1. Summary of Significant Accounting Policies (continued)
(c) Foreign currency translation
Monetary assets and liabilities denominated in foreign currencies are translated into yen
at the rates of exchange in effect at the balance sheet date. Other assets and liabilities
denominated in foreign currencies are translated at their historical rates. All revenues
and expenses associated with foreign currencies are translated at the rates of exchange
prevailing when such transactions were made. The resulting exchange gain or loss is
credited or charged to profit or loss.
The balance sheet accounts of the overseas consolidated subsidiaries (except for net assets
excluding non-controlling interests) are translated into yen at the rate of exchange in effect
at the balance sheet date. The components of net assets excluding non-controlling
interests are translated at their respective historical rates of exchange. Revenue and
expense accounts are translated into yen at the average rate of exchange in effect during
the year.
Differences arising from translation are reflected in “Translation adjustments” and “Non-
controlling interests” in the accompanying consolidated balance sheet and statement of
changes in net assets.
(d) Cash and cash equivalents
Cash and cash equivalents consist of cash on hand, deposits with banks withdrawable on
demand, and short-term investments which are readily convertible into cash subject to an
insignificant risk of any changes in their value and which were purchased with an original
maturity of three months or less.
(e) Securities
The accounting standard for financial instruments requires that securities other than those
of subsidiaries and affiliates be classified into three categories: trading securities, held-to-
maturity debt securities or other securities. Under this standard, trading securities are
carried at fair value and gain or loss, both realized and unrealized, is credited or charged
to income. Held-to-maturity debt securities are carried at amortized cost. Marketable
securities classified as other securities are carried at fair value with any changes in
unrealized holding gain or loss, net of the applicable income taxes, included directly in
net assets. Non-marketable securities classified as other securities are carried at cost.
Cost of securities sold is determined principally by the moving average method.

Yodogawa Steel Works, Ltd. and Consolidated Subsidiaries
Notes to Consolidated Financial Statements (continued)
12
1. Summary of Significant Accounting Policies (continued)
(f) Derivatives
Derivatives are measured at fair value.
(g) Inventories
Inventories of the Company and its domestic consolidated subsidiaries are principally
stated at the lower of cost or net selling value, cost being determined by the average
method. Inventories of overseas consolidated subsidiaries are stated at the lower of cost
or net selling value, cost being determined by the moving average method.
(h) Property, plant and equipment and depreciation (except for leased assets)
Depreciation of property, plant and equipment at the Company and its domestic
consolidated subsidiaries is calculated by the declining-balance method over the estimated
useful lives of the respective assets, except that the straight-line method is applied to
buildings (other than facilities attached to the buildings) acquired on or after April 1, 1998,
and facilities attached to the buildings and other structures acquired on or after April 1,
2016.
Depreciation of property, plant and equipment at overseas consolidated subsidiaries is
calculated by the straight-line method.
The useful lives adopted for calculating depreciation are principally as follows:
Buildings and structures 3 to 60 years
Machinery, equipment and vehicles 3 to 36 years
(i) Intangible assets (except for leased assets)
Amortization of intangible assets is calculated by the straight-line method over the
estimated useful lives of the respective assets.
Expenditures related to computer software development for internal use are expensed as
incurred, unless these contribute to the generation of future income or cost savings. Such
expenditures are capitalized as assets and amortized by the straight-line method over their
estimated useful life of 5 years.
(j) Goodwill
All assets and liabilities of the consolidated subsidiaries are revalued on acquisition, if applicable.
The difference between the cost of investments in subsidiaries and the equity in their net assets at
their respective dates of acquisition is amortized over a period of 5 years on a straight-line basis.

Yodogawa Steel Works, Ltd. and Consolidated Subsidiaries
Notes to Consolidated Financial Statements (continued)
13
1. Summary of Significant Accounting Policies (continued)
(k) Research and development costs
Research and development costs are expensed as incurred.
(l) Leases
Leased assets under finance lease transactions that transfer ownership to the lessee are
depreciated by the same method used for owned fixed assets.
Leased assets under finance lease transactions which do not transfer ownership of the
leased assets to the lessee are depreciated to a residual value of zero by the straight-line
method using the contract term as the useful life.
(m) Allowance for doubtful receivables
The Group provides an allowance for doubtful receivables at an amount calculated based
on their historical experience of bad debts on ordinary receivables plus an additional
estimate of probable specific bad debts from customers experiencing financial difficulties.
(n) Provision for bonuses to employees
The Company and its domestic consolidated subsidiaries provide for payments of bonuses
to employees based on the estimated amount to be paid to employees after the balance
sheet date, which is attributable to the current fiscal year. There are no bonuses to
employees at overseas consolidated subsidiaries to be provided.
(o) Provision for retirement benefits for directors and audit & supervisory board
members
The directors and audit & supervisory board members of the Company’s domestic
consolidated subsidiaries have customarily been entitled to lump-sum payments under the
unfunded retirement benefit plans. Provision for retirement benefits for these directors
and audit & supervisory board members have been provided at an estimated amount based
on each consolidated subsidiary’s internal rules.

Yodogawa Steel Works, Ltd. and Consolidated Subsidiaries
Notes to Consolidated Financial Statements (continued)
14
1. Summary of Significant Accounting Policies (continued)
(p) Retirement benefits
In calculating the retirement benefit obligation, the benefit formula basis is applied for the
attribution of expected retirement benefits to each period up to the end of the current year.
Prior service cost is being amortized as incurred by the straight-line method over a period
of principally 10 years, which is within the estimated average remaining years of service
of the eligible employees.
Actuarial gain or loss is amortized in the year following the year in which the gain or loss
is recognized by the straight-line method over a period of principally 10 years, which is
within the estimated average remaining years of service of the eligible employees.
Certain consolidated subsidiaries calculate liability for retirement benefits and retirement
benefit expenses for the defined benefit corporate pension plans and the retirement lump-
sum plans based on the amount which would be payable at the year end if all eligible
employees terminated their services voluntarily (“simplified method”).
(q) Income taxes
Deferred income taxes are provided for temporary differences between the balances of
assets and liabilities for financial reporting purposes and the corresponding balances for
tax reporting purposes.
(r) Consumption taxes
Transactions subject to consumption taxes are recorded at amounts exclusive of
consumption taxes. Consumption taxes and local consumption taxes paid not offset by
consumption taxes and local consumption taxes received in accordance with Consumption
Tax Act of Japan are expensed when incurred.
(s) Recognition of revenues and costs of construction contracts
Revenues and costs of construction contracts of which the percentage of completion can
be reliably estimated, are recognized by the percentage-of-completion method. The
percentage of completion is calculated at the cost incurred as a percentage of the estimated
total cost. The completed-contract method continues to be adopted for contracts for
which the percentage of completion cannot be reliably estimated.

Yodogawa Steel Works, Ltd. and Consolidated Subsidiaries
Notes to Consolidated Financial Statements (continued)
15
1. Summary of Significant Accounting Policies (continued)
(t) Hedge accounting
Gain or loss on derivatives designated as hedging instruments is deferred until the loss or
gain on the underlying hedged items is recognized. Receivables or payable hedged by
forward foreign exchange contracts which meet certain conditions are translated at the
corresponding foreign exchange contract rates (“Allocation method”). The evaluation
of effectiveness of such forward foreign exchange contracts is omitted because significant
terms of the hedging instruments and underlying hedged items are the same and the
Company and certain consolidated subsidiaries assumes that movements of cash flows are
completely offset.
2. Change in Accounting Policy
Application of Practical Solution on a Change in Depreciation Method Due to Tax
Reform 2016
Effective April 1, 2016, Company and its domestic consolidated subsidiaries adopted
“Practical Solution on a Change in Depreciation Method Due to Tax Reform 2016”
(Accounting Standards Board of Japan (“ASBJ”) Practical Issues Task Force (“PITF”) No.32
issued on June 17, 2016) in accordance with the revision of the Corporation Tax Act of Japan.
Accordingly, Company and its domestic consolidated subsidiaries changed the depreciation
method for both facilities attached to buildings and other structures acquired on or after April
1, 2016 from the declining-balance method to the straight-line method.
The effect of this change on operating income and profit before income taxes for the year
ended March 31, 2017 was immaterial.
3. Additional Information
Implementation Guidance on Recoverability of Deferred Tax Assets
Effective April 1, 2016, the Company and its domestic consolidated subsidiaries adopted
“Revised Implementation Guidance on Recoverability of Deferred Tax Assets” (ASBJ
Guidance No. 26 of March 28, 2016).

Yodogawa Steel Works, Ltd. and Consolidated Subsidiaries
Notes to Consolidated Financial Statements (continued)
16
4. U.S. Dollar Amounts
The translation of yen amounts into U.S. dollar amounts is included solely for the convenience
of readers outside Japan and has been made at the rate of ¥112.19 = U.S.$1.00, the approximate
exchange rate prevailing on March 31, 2017. The translation should not be construed as a
representation that yen have been, could have been, or could in the future be, converted into
U.S. dollars at the above or any other rate.
5. Cash and Cash Equivalents
A reconciliation of cash and deposits shown in the accompanying consolidated balance sheet
as of March 31, 2016 and 2017 to cash and cash equivalents shown in the accompanying
consolidated statement of cash flows for the years ended March 31, 2016 and 2017 is presented
as follows:
Millions of yen
Thousands of U.S. dollars
2016 2017 2017
Cash and deposits ¥ 46,503 ¥ 40,762 $ 363,330 Trust beneficiary rights included in “Other current assets” 500 – –
Time deposits with a maturity of more than three months (6,213) (1,715) (15,287)
Cash and cash equivalents ¥ 40,790 ¥ 39,047 $ 348,043
6. Financial Instruments
Overview
(a) Policy for financial instruments
In consideration of plans for capital investment, the Group primarily utilizes its own funds.
In case its own funds are insufficient, the Group raises funds by bank or bond issuances.
The Group manages temporary cash surpluses through low-risk financial assets. The
Group uses derivatives for the purpose of reducing risk and does not enter into derivatives
for speculative purposes.

Yodogawa Steel Works, Ltd. and Consolidated Subsidiaries
Notes to Consolidated Financial Statements (continued)
17
6. Financial Instruments (continued)
Overview (continued)
(b) Types of financial instruments and related risk
Trade receivables, notes and accounts receivables, are exposed to credit risk of customers.
In addition, the Group is exposed to foreign currency exchange risk arising from trade
receivables denominated in foreign currencies.
Investments in securities and marketable securities are exposed to volatility risk of market
price. The former is composed mainly of the shares of common stock of the companies
with which the Group has business relationships, held-to-maturity debt securities and
hybrid financial instruments containing embedded derivatives. The latter is composed
mainly of commercial paper and negotiable certificates of deposits.
Trade payables, notes and accounts payable, have payment due dates within six months.
The Group is exposed to foreign currency exchange risk arising from trade payables
denominated in foreign currencies.
Regarding derivatives, the Group enters into forward foreign exchange contracts to reduce
the foreign currency exchange risk arising from trade receivables, trade payables and
loans receivables denominated in foreign currencies for the purpose of efficient risk
management.
Information regarding the hedging instruments and hedged items, the hedging policy and
the method of the evaluation of the effectiveness of hedging is addressed in Note 1(t).
Yodogawa Steel Works, Ltd. and Consolidated Subsidiaries
Notes to Consolidated Financial Statements (continued)
18
6. Financial Instruments (continued)
Overview (continued)
(c) Risk management for financial instruments
For trade receivables, each related division monitors the credit worthiness of their main
customers periodically, and monitors due dates and outstanding balances by customer.
In addition, the Company and its domestic consolidated subsidiaries are making efforts to
identify at an early point and mitigate risks of bad debts from customers who have
financial difficulties. The overseas consolidated subsidiaries request customers to issue
non-cancelable letters of credit to hedge credit risk.
The Group only acquires held-to-maturity debt securities and commercial paper issued by
companies with high credit ratings or sound credit profiles. Accordingly, the Group
believes that the credit risk deriving from such securities is insignificant. The Group
also believes that the credit risk of derivatives is insignificant as the Group enters into
derivative transactions only with financial institutions with high credit ratings.
For trade receivables and trade payables denominated in foreign currencies, the Group
enters into forward foreign exchange contracts to hedge the risks arising from fluctuations
in foreign exchanges rates.
For marketable securities and investments in securities, the Group periodically reviews
the fair value of such financial instruments and the financial position of the issuers. In
addition, the Group continuously evaluates whether or not securities other than those
classified as held-to-maturity debt securities should be maintained taking into account
their fair value and relationships with the issuers.
The Group enters into derivative transactions based on internal regulations and establishes
the reporting and approval system which set forth the purpose, contents, counterparties,
holding risk, maximum upper limit of loss amount and risk amounts.
Based on a report from each division, the Group prepares and updates its cash flow plans
on a timely basis and maintains sufficient solvency to manage liquidity risk. In order to
provide for unexpected cash requirements, the Company has entered into the line-of-credit
agreements with certain financial institutions and its overseas consolidated subsidiaries
are able to obtain credit limit of short-term borrowings from certain financial institutions.

Yodogawa Steel Works, Ltd. and Consolidated Subsidiaries
Notes to Consolidated Financial Statements (continued)
19
6. Financial Instruments (continued)
Overview (continued)
(d) Supplementary explanation of the estimated fair value of financial instruments
The fair value of financial instruments is based on their quoted market prices, if available.
When there are no quoted market prices available, fair value is reasonably estimated.
Since various assumptions and factors are reflected in estimating the fair value, different
assumptions and factors could result in different fair value.
(e) Concentration of credit risk
There is no concentration of credit risk for the year ended March 31, 2017.
Estimated Fair Value of Financial Instruments
Carrying value of financial instruments on the consolidated balance sheet, estimated fair value
and unrealized gain as of March 31, 2016 and 2017 are shown in the following table. The
following table does not include financial instruments for which it is extremely difficult to
determine the fair value.
Millions of yen
2016
Carrying value
Estimated fair value Difference
Assets: Cash and deposits ¥ 46,503 ¥ 46,503 ¥ – Notes and accounts receivable:
Unconsolidated subsidiaries and affiliates 14,191 14,191 –
Trade 23,489 23,489 – Marketable securities and investments in securities 29,667 29,774 107
Total assets ¥ 113,850 ¥ 113,957 ¥ 107
Liabilities:
Notes and accounts payable: Unconsolidated subsidiaries and affiliates ¥ 302 ¥ 302 ¥ –
Trade 16,072 16,072 –
Total liabilities ¥ 16,374 ¥ 16,374 ¥ –
Derivatives* ¥ – ¥ – ¥ –

Yodogawa Steel Works, Ltd. and Consolidated Subsidiaries
Notes to Consolidated Financial Statements (continued)
20
6. Financial Instruments (continued)
Estimated Fair Value of Financial Instruments (continued)
Millions of yen
2017
Carrying value
Estimated fair value Difference
Assets: Cash and deposits ¥ 40,762 ¥ 40,762 ¥ – Notes and accounts receivable:
Unconsolidated subsidiaries and affiliates 14,719 14,719 –
Trade 26,384 26,384 – Marketable securities and investments in securities 37,294 37,414 120
Total assets ¥ 119,159 ¥ 119,279 ¥ 120
Liabilities:
Notes and accounts payable: Unconsolidated subsidiaries and affiliates ¥ 499 ¥ 499 ¥ –
Trade 17,301 17,301 –
Total liabilities ¥ 17,800 ¥ 17,800 ¥ –
Derivatives (*) – – –
Thousands of U.S. dollars
2017
Carrying value
Estimated fair value Difference
Assets: Cash and deposits $ 363,330 $ 363,330 $ – Notes and accounts receivable
Unconsolidated subsidiaries and affiliates 131,197 131,197 –
Trade 235,173 235,173 – Marketable securities and investments in securities 332,418 333,488 1,070
Total assets $ 1,062,118 $ 1,063,188 $ 1,070
Liabilities:
Notes and accounts payable Unconsolidated subsidiaries and affiliates $ 4,448 $ 4,448 $ –
Trade 154,212 154,212 –
Total liabilities $ 158,660 $ 158,660 $ –
Derivatives (*) – – –
(*) The value of assets and liabilities arising from derivative transactions is shown at net value,
and with the amount in parentheses representing net liability position.

Yodogawa Steel Works, Ltd. and Consolidated Subsidiaries
Notes to Consolidated Financial Statements (continued)
21
6. Financial Instruments (continued)
Estimated Fair Value of Financial Instruments (continued)
Calculation method of estimated fair value of financial instruments is as follows:
Cash and deposits, notes and accounts receivable
Since these items are settled in a short period of time, their carrying value approximates the
fair value.
Marketable securities and investments in securities
The fair value of equity securities is based on quoted market prices. The fair value of debt
securities is based on either quoted market prices or the prices provided by the financial
institutions. For information on securities classified by holding purpose, please refer to Note
7.
Notes and accounts payable
Since this item is settled in a short period of time, its carrying value approximates the fair
value.
Derivative transactions
Please refer to Note 21.
The carrying value of financial instruments without determinable market value as of March
31, 2016 and 2017 is presented as follows:
Millions of yen
Thousands of
U.S. dollars
2016 2017 2017
Unlisted stocks ¥ 244 ¥ 244 $ 2,175
Investment in limited liability
partnership 59 20 178
Preferred stocks 48 – –
Total ¥ 351 ¥ 264 $ 2,353
Because no quoted market price is available, it is extremely difficult to determine the fair value.
Therefore, the above financial instruments are not included as part of the amounts presented
in the preceding fair value of financial instruments table.
Yodogawa Steel Works, Ltd. and Consolidated Subsidiaries
Notes to Consolidated Financial Statements (continued)
22
6. Financial Instruments (continued)
Estimated Fair Value of Financial Instruments (continued)
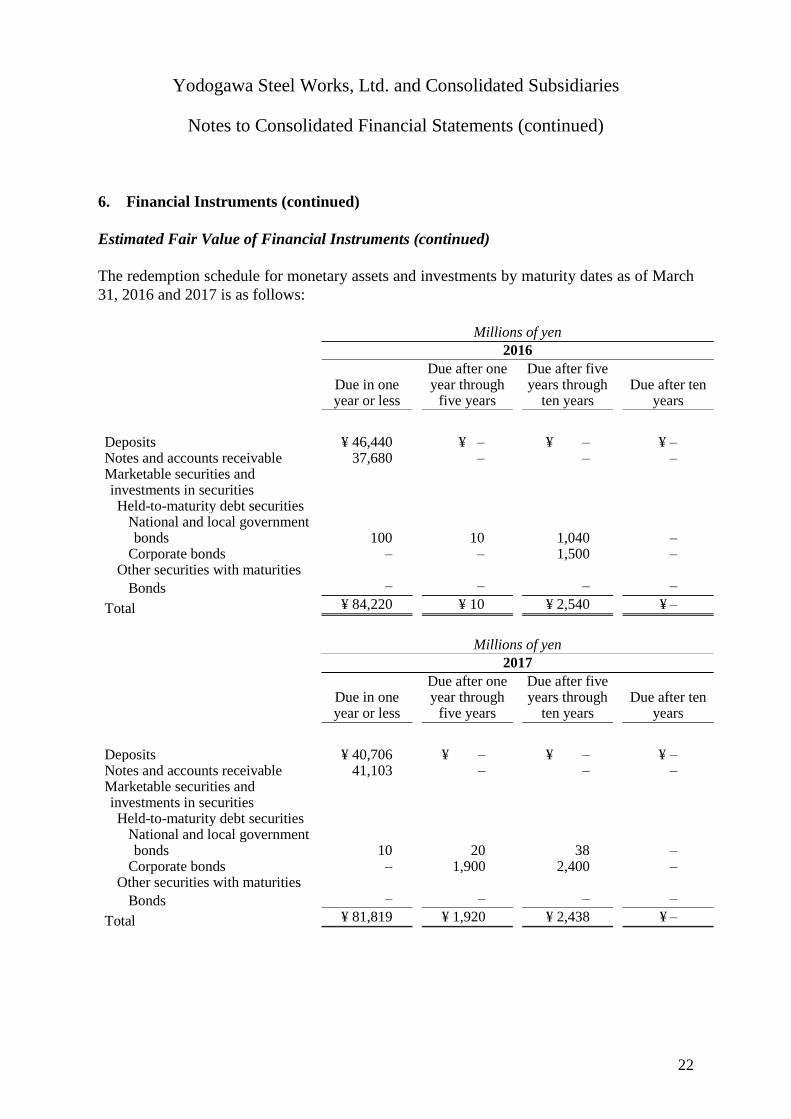
The redemption schedule for monetary assets and investments by maturity dates as of March
31, 2016 and 2017 is as follows:
Millions of yen 2016
Due in one year or less
Due after one year through
five years
Due after five years through
ten years Due after ten
years
Deposits ¥ 46,440 ¥ – ¥ – ¥ – Notes and accounts receivable 37,680 – – – Marketable securities and investments in securities Held-to-maturity debt securities
National and local government bonds 100 10 1,040 –
Corporate bonds – – 1,500 – Other securities with maturities
Bonds – – – –
Total ¥ 84,220 ¥ 10 ¥ 2,540 ¥ –
Millions of yen 2017
Due in one year or less
Due after one year through
five years
Due after five years through
ten years Due after ten
years
Deposits ¥ 40,706 ¥ – ¥ – ¥ – Notes and accounts receivable 41,103 – – – Marketable securities and investments in securities Held-to-maturity debt securities
National and local government bonds 10 20 38 –
Corporate bonds – 1,900 2,400 – Other securities with maturities
Bonds – – – –
Total ¥ 81,819 ¥ 1,920 ¥ 2,438 ¥ –

Yodogawa Steel Works, Ltd. and Consolidated Subsidiaries
Notes to Consolidated Financial Statements (continued)
23
6. Financial Instruments (continued)
Estimated Fair Value of Financial Instruments (continued)
Thousands of U.S. dollars
2017
Due in one year or less
Due after one year through
five years
Due after five years through
ten years Due after ten
years
Deposits $ 362,831 $ – $ – $ – Notes and accounts receivable 366,370 – – – Marketable securities and investments in securities Held-to-maturity debt securities
National and local government bonds 89 178 339 –
Corporate bonds – 16,936 21,392 – Other securities with maturities
Bonds – – – –
Total $ 729,290 $ 17,114 $ 21,731 $ –
7. Securities
Marketable securities classified as held-to-maturity debt securities as of March 31, 2016 and
2017 are summarized as follows:
Millions of yen
2016
Carrying
value
Estimated
fair value Difference
Securities whose estimated fair value exceeds
their carrying value:
National and local government bonds ¥ 1,058 ¥ 1,068 ¥ 10
Corporate bonds 452 559 107
1,510 1,627 117
Securities whose estimated fair value does not
exceed their carrying value:
National and local government bonds 110 100 (10)
Corporate bonds 488 488 –
598 588 (10)
Total ¥ 2,108 ¥ 2,215 ¥ 107

Yodogawa Steel Works, Ltd. and Consolidated Subsidiaries
Notes to Consolidated Financial Statements (continued)
24
7. Securities (continued)
Millions of yen
2017
Carrying
value
Estimated
fair value Difference
Securities whose estimated fair value
exceeds their carrying value:
National and local government bonds ¥ 68 ¥ 71 ¥ 3
Corporate bonds 1458 1,575 117
1,526 1,646 120
Securities whose estimated fair value
does not exceed their carrying value:
National and local government bonds – – –
Corporate bonds 685 685 0
685 685 0
Total ¥ 2,211 ¥ 2,331 ¥ 120
Thousands of U.S. dollars
2017
Carrying
value
Estimated
fair value Difference
Securities whose estimated fair value
exceeds their carrying value:
National and local government bonds $ 606 $ 633 $ 27
Corporate bonds 12,996 14,039 1,043
13,602 14,672 1,070
Securities whose estimated fair value
does not exceed their carrying value:
National and local government bonds – – –
Corporate bonds 6,105 6,105 0
6,105 6,105 0
Total $ 19,707 $ 20,777 $ 1,070
Hybrid financial instruments containing an embedded derivative that cannot be separated are
stated at fair value in corporate bonds whose estimated fair value does not exceed their
carrying value in the above table and the resulting gains or losses are included in other, net as
a part of other income (expense) in the consolidated statement of operations.

Yodogawa Steel Works, Ltd. and Consolidated Subsidiaries
Notes to Consolidated Financial Statements (continued)
25
7. Securities (continued)
Other securities with determinable market value as of March 31, 2016 and 2017 are
summarized as follows:
Millions of yen
2016
Carrying
value
Acquisition
costs Difference
Securities whose carrying value exceeds
their acquisition costs:
Equity securities ¥ 23,610 ¥ 8,525 ¥ 15,085
Corporate bonds 402 400 2
Other 120 97 23
24,132 9,022 15,110
Securities whose carrying value does not
exceed their acquisition costs:
Equity securities 3,328 3,465 (137)
Corporate bonds 99 101 (2)
3,427 3,566 (139)
Total ¥ 27,559 ¥ 12,588 ¥ 14,971
Millions of yen
2017
Carrying
value
Acquisition
costs Difference
Securities whose carrying value exceeds
their acquisition costs:
Equity securities ¥ 31,672 ¥ 11,630 ¥ 20,042
Corporate bonds 617 600 17
Other 421 397 24
32,710 12,627 20,083
Securities whose carrying value does not
exceed their acquisition costs:
Equity securities 892 910 (18)
Corporate bonds 1,481 1,501 (20)
2,373 2,411 (38)
Total ¥ 35,083 ¥ 15,038 ¥ 20,045

Yodogawa Steel Works, Ltd. and Consolidated Subsidiaries
Notes to Consolidated Financial Statements (continued)
26
7. Securities (continued)
Thousands of U.S. dollars
2017
Carrying value Acquisition
costs Difference
Securities whose carrying value exceeds their acquisition costs: Equity securities $ 282,306 $ 103,663 $ 178,643 Corporate bonds 5,500 5,348 152
Other 3,753 3,539 214
291,559 112,550 179,009 Securities whose carrying value does not exceed their acquisition costs: Equity securities 7,951 8,111 (160)
Corporate bonds 13,201 13,379 (178)
21,152 21,490 (338)
Total $ 312,711 $ 134,040 $ 178,671 Because no quoted market price is available and it is extremely difficult to estimate the
corresponding future cash flow, unlisted stocks of ¥351 million and ¥264 million ($2,353
thousand) as of March 31, 2016 and 2017, respectively, are not included in the above table.
Sales of corporate bonds classified as held-to-maturity debt securities for the years ended
March 31, 2016 and 2017 are summarized as follows:
Millions of yen
Thousands of U.S. dollars
2016 2017 2017
Sales ¥ 1,505 ¥ 500 $ 4,457 Cost of securities sold 1,496 500 4,457 Net gain 9 – –
The reason for the sales was due to the exercise of the early redemption option by the issuer. Sales of securities classified as other securities for the years ended March 31, 2016 and 2017
are summarized as follows:
Millions of yen
Thousands of U.S. dollars
2016 2017 2017
Sales ¥ 636 ¥ 10 $ 89 Aggregate gain 484 5 45
The Group recorded loss on impairment of investments in securities with determinable market
value of ¥1,181 million for the year ended, March 31, 2016. Loss on impairment is recorded
at the amount deemed necessary on securities whose fair value has declined by 50% on more,
or whose fair value has declined by 30% on more, but less than 50%, if the decline is deemed
to be irrecoverable considering the movements of individual stock prices and recoverability.

Yodogawa Steel Works, Ltd. and Consolidated Subsidiaries
Notes to Consolidated Financial Statements (continued)
27
8. Inventories
The following is a summary of inventories as of March 31, 2016 and 2017:
Millions of yen
Thousands of
U.S. dollars
2016 2017 2017
Merchandises and finished goods ¥ 12,175 ¥ 11,403 $ 101,639
Work in process 3,296 3,458 30,823
Raw materials and supplies 9,718 10,647 94,902
¥ 25,189 ¥ 25,508 $ 227,364
Gain on reversal of devaluation of inventories is included in cost of sales of ¥135 million and
¥340 million ($3,031 thousand) for the years ended March 31, 2016 and 2017, respectively.
9. Loss on Impairment of Fixed Assets
The Group recognized loss on impairment of fixed assets for the years ended March 31, 2016
and 2017 as follows:
Location Use Classification
Millions of yen
Thousands of
U.S. dollars
2016 2017 2017
Nishiwaki City,
Hyogo Prefecture
Golf course Land, buildings,
structures,
machinery,
equipment and
vehicles ¥ 600 ¥ – $ –
Miyazaki City,
Miyazaki Prefecture Idle assets Land
18 23 205
Suzaka City,
Nagano Prefecture Idle assets Land
0 0 0
China Anhui Manufacturing
facilities
Buildings,
machinery and
equipment 5,809 714 6,364
China Anhui – Goodwill 162 – –
Ikoma City,
Nara Prefecture Idle assets Land 14 0 0
Total ¥ 6,603 ¥ 737 $ 6,569

Yodogawa Steel Works, Ltd. and Consolidated Subsidiaries
Notes to Consolidated Financial Statements (continued)
28
9. Loss on Impairment of Fixed Assets (continued)
The Group mainly groups fixed assets by managerial accounting segment, each of which
continuously records cash receipts and payments. Consequently, the Group has written down the carrying values of manufacturing facilities of
YSS and the golf course and its asset group of Yodokokohatsu Co., Ltd. whose operating
incomes have been continuously negative to their respective net recoverable values, and has
recorded a related loss on impairment of fixed assets of ¥6,409 million for the year ended
March 31, 2016, which consisted of machinery and equipment of ¥5,809 million for the
manufacturing facilities of YSS and land of ¥442 million, building and structures of ¥123
million, machinery, equipment and vehicles of ¥22 million and others of ¥13 million. Also,
the Group recorded loss on impairment of goodwill for YSS of ¥162 million for the year ended
March 31, 2016.
In addition, the Group has written down the carrying values of manufacturing facilities of YSS
whose operating incomes have been continuously negative to their respective net recoverable
values, and has recorded a related loss on impairment of fixed assets of ¥714 million ($6,364
thousand) for the year ended March 31, 2017, which consisted of machinery of ¥679 million
($6,052 thousand) and building of ¥35 million ($312 thousand).
The Group has written down the carrying values of the idle assets of land owned by the Group,
which are not expected to be utilized in the future, to their respective net recoverable values,
and has recorded a related loss on impairment of ¥32 million and ¥23 million ($205 thousand)
for the years ended March 31, 2016 and 2017, respectively.
The recoverable amounts of machinery and equipment and goodwill in China Anhui for the
year ended March 31, 2016 were measured at the value in use based on estimated future cash
flows discounted at the rate of 11%, and the recoverable amounts of machinery and equipment
in China Anhui for the year ended March 31, 2017 were measured at estimated net selling
value based on residual value.
The recoverable amounts of assets other than machinery, equipment and goodwill were
measured at estimated net selling value based on appraisals conducted by real estate appraisers
and the values assessed for property tax purposes.

Yodogawa Steel Works, Ltd. and Consolidated Subsidiaries
Notes to Consolidated Financial Statements (continued)
29
10. Short-Term Bank Loans, Guarantee Deposits and Finance Lease Obligations
The average annual interest rates on short-term loans were 1.55% and 3.26% as of March 31,
2016 and 2017.
Guarantee deposits consisted of interest-free deposits, most of which were golf-club
membership deposits, and interest-bearing deposits, which were principally deposits from
customers at average annual interest rates of 0.79% and 0.81% at March 31, 2016 and 2017,
respectively.
Interest-free deposits and interest-bearing deposits as of March 31, 2016 and 2017 are as
follows:
Millions of yen
Thousands of
U.S. dollars
2016 2017 2017
Interest-free deposits ¥ 2,196 ¥ 2,186 $ 19,485
Interest-bearing deposits 872 867 7,728
¥ 3,068 ¥ 3,053 $ 27,213
The average annual interest rate on financial lease obligations was 4.48% as of March 31,
2016 and 2017.
The aggregate annual maturities of finance lease obligations subsequent to March 31, 2017
are summarized as follows:
Millions of yen
Thousands of
U.S. dollars
Year ending March 31, 2017
2018 ¥ 177 $ 1,578
2019 727 6,480
2020 14 125
2021 2 18
2022 0 0
2023 0 0
2024 0 0
¥ 920 $ 8,201

Yodogawa Steel Works, Ltd. and Consolidated Subsidiaries
Notes to Consolidated Financial Statements (continued)
30
11. Line-of-credit Agreements
In order to achieve more efficient and flexible financing, the Company has concluded line-of-
credit agreements with certain financial institutions. The status of these lines of credit as of
March 31, 2016 and 2017 is as follows:
Millions of yen
Thousands of
U.S. dollars
2016 2017 2017
Lines of credit ¥ 18,950 ¥ 17,950 $ 159,996 Credit utilized – – –
Available credit ¥ 18,950 ¥ 17,950 $ 159,996
12. Pledged Assets
Assets pledged as collateral for indebtedness as of March 31, 2017 are summarized as follows:
Millions of yen
Thousands of
U.S. dollars
2017
Cash and deposits ¥ 60 $ 535
Investments in securities 17 152
Other assets 83 739
¥ 160 $ 1,426
Indebtedness secured by these assets as collateral was ¥52 million ($463 thousand), a
component of other current liabilities at March 31, 2017.
13. Contingent Liabilities
The Company was contingently liable for guarantees of borrowings from financial institutions
and others of unconsolidated subsidiaries in the aggregate amount of ¥131 million ($1,168
thousand) as of March 31, 2017.
In addition, the Company repaired machinery supplied to a customer located in Africa due to
a product defect, damages during the shipment and other reasons. The Company was
contingently liable for additional repair costs in the amount of approximately ¥300 million
($2,674 thousand), as of March 31, 2017. The total amount to be paid by the Company will
depend on future negotiations with the manufacturer of the machinery.

Yodogawa Steel Works, Ltd. and Consolidated Subsidiaries
Notes to Consolidated Financial Statements (continued)
31
14. Retirement Benefits Plans
The Company and its domestic consolidated subsidiaries have defined benefit retirement
plans: a defined benefit pension plan and a lump sum payment plan. Moreover, certain
overseas consolidated subsidiaries have a defined benefit pension plan and defined
contribution plans. Furthermore, the Company has adopted a retirement benefit trust.
Certain consolidated domestic subsidiaries are accounted for using “simplified method” for
calculating liability for retirement benefits and retirement benefit expenses.
The changes in the retirement benefit obligation for the years ended March 31, 2016 and 2017
are as follows:
Millions of yen
Thousands of
U.S. dollars
2016 2017 2017
Retirement benefit obligation at
the beginning of year ¥ 14,763 ¥15,655 $ 139,540
Service cost (*) 728 687 6,124
Interest cost 191 87 775
Actuarial differences 1,099 290 2,585
Retirement benefit paid (983) (936) (8,343)
Prior service cost (143) (46) (410)
Retirement benefit obligation at
the end of year ¥ 15,655 ¥ 15,737 $ 140,271
(*) Retirement benefit expenses for certain consolidated subsidiaries, whose benefit
obligation is calculated by the simplified method, have been included in service cost.

Yodogawa Steel Works, Ltd. and Consolidated Subsidiaries
Notes to Consolidated Financial Statements (continued)
32
14. Retirement Benefits Plans (continued)
The changes in plan assets at fair value for the years ended March 31, 2016 and 2017 are as
follows:
Millions of yen
Thousands of
U.S. dollars
2016 2017 2017
Plan assets at fair value at the
beginning of year ¥ 5,121 ¥ 5,017 $ 44,719
Expected return on plan assets 93 103 918
Actuarial differences (269) 151 1,346
Contributions by the employers 554 2,491 22,203
Retirement benefit paid (468) (446) (3,975)
Other (*) (14) 142 1,266
Plan assets at fair value at the
end of year ¥ 5,017 ¥ 7,458 $ 66,477
(*) “Other” mainly consists of the effect of foreign currency exchange translation adjustments
on pension plan assets at fair value attributable to an overseas subsidiary and the
difference of actual and expected returns on plan assets at fair value from the retirement
benefit plans of consolidated subsidiaries to which the simplified method applied.
The following table sets forth the funded status of the plans and the amounts recognized in the
consolidated balance sheet as of March 31, 2016 and 2017 for the Company’s and the
consolidated subsidiaries’ defined benefit plans:
Millions of yen
Thousands of
U.S. dollars
2016 2017 2017
Funded retirement benefit obligation ¥ 15,634 ¥ 15,706 $ 139,995
Plan assets at fair value (5,017) (7,458) (66,477)
10,617 8,248 73,518
Unfunded retirement benefit
obligation 21 31 276
Liability for retirement benefits in the
consolidated balance sheet, net 10,638 8,279 73,794
Liability for retirement benefits 10,638 8,279 73,794
Liability for retirement benefits in the
consolidated balance sheet, net ¥ 10,638 ¥ 8,279 $ 73,794
Note: The above includes retirement benefit plans calculated under the simplified method.

Yodogawa Steel Works, Ltd. and Consolidated Subsidiaries
Notes to Consolidated Financial Statements (continued)
33
14. Retirement Benefits Plans (continued)
The components of retirement benefit expenses for the years ended March 31, 2016 and 2017
are as follows:
Millions of yen
Thousands of
U.S. dollars
2016 2017 2017
Service cost ¥ 724 ¥ 676 $ 6,025
Interest cost 191 87 775
Expected return on plan assets (93) (103) (918)
Amortization of actuarial differences 310 644 5,741
Amortization of prior service cost (1) (1) (9)
Retirement benefit expenses ¥ 1,131 ¥ 1,303 $ 11,614
The components of retirement benefit liability adjustments recognized in other comprehensive
income (before tax effect) for the years ended March 31, 2016 and 2017 are as follows:
Millions of yen
Thousands of
U.S. dollars
2016 2017 2017
Prior service cost ¥ 1 ¥ 2 $ 17
Actuarial differences 1,027 (503) (4,483)
Total ¥ 1,028 ¥ (501) $ (4,466)
The components of retirement benefit liability adjustments recognized in accumulated other
comprehensive income (before tax effect) as of March 31, 2016 and 2017 are as follows:
Millions of yen
Thousands of
U.S. dollars
2016 2017 2017
Unrecognized prior service cost ¥ (8) ¥ (6) $ (53)
Unrecognized actuarial differences 3,148 2,645 23,576
Total ¥ 3,140 ¥ 2,639 $ 23,523
Yodogawa Steel Works, Ltd. and Consolidated Subsidiaries
Notes to Consolidated Financial Statements (continued)
34
14. Retirement Benefits Plans (continued)
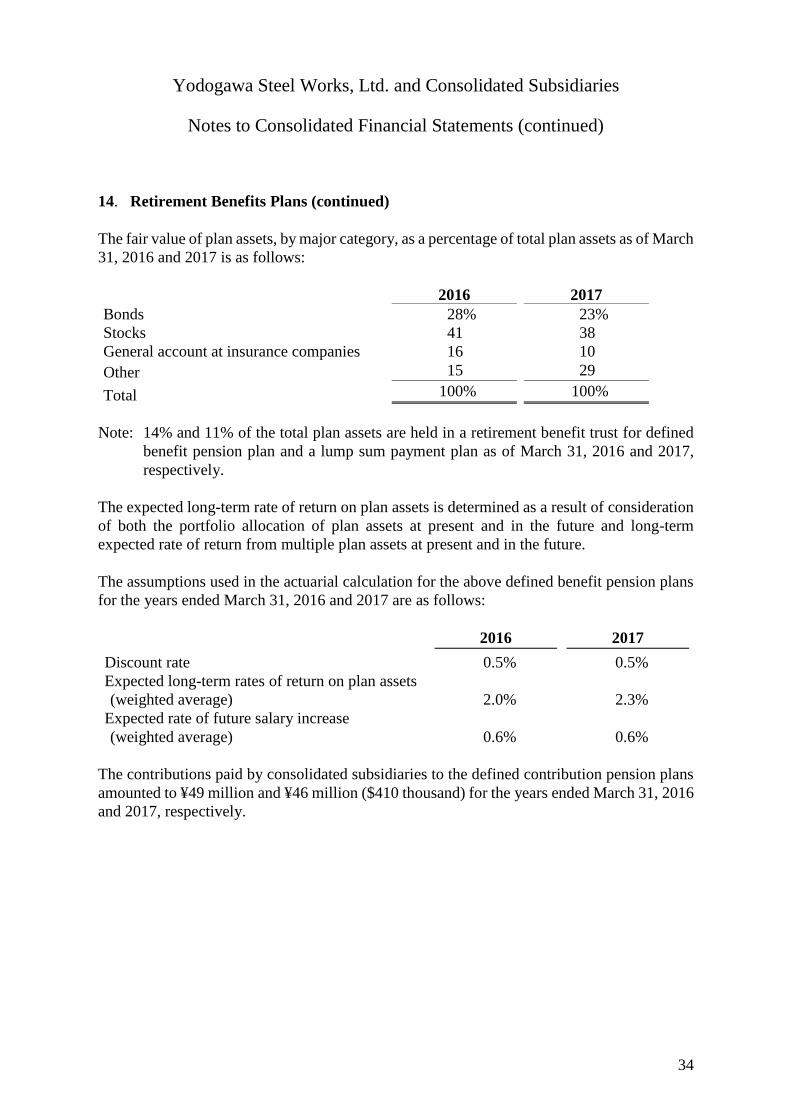
The fair value of plan assets, by major category, as a percentage of total plan assets as of March
31, 2016 and 2017 is as follows:
2016 2017
Bonds 28% 23%
Stocks 41 38
General account at insurance companies 16 10
Other 15 29
Total 100% 100%
Note: 14% and 11% of the total plan assets are held in a retirement benefit trust for defined
benefit pension plan and a lump sum payment plan as of March 31, 2016 and 2017,
respectively.
The expected long-term rate of return on plan assets is determined as a result of consideration
of both the portfolio allocation of plan assets at present and in the future and long-term
expected rate of return from multiple plan assets at present and in the future.
The assumptions used in the actuarial calculation for the above defined benefit pension plans
for the years ended March 31, 2016 and 2017 are as follows:
2016 2017
Discount rate 0.5% 0.5%
Expected long-term rates of return on plan assets
(weighted average) 2.0% 2.3%
Expected rate of future salary increase
(weighted average) 0.6% 0.6%
The contributions paid by consolidated subsidiaries to the defined contribution pension plans
amounted to ¥49 million and ¥46 million ($410 thousand) for the years ended March 31, 2016
and 2017, respectively.

Yodogawa Steel Works, Ltd. and Consolidated Subsidiaries
Notes to Consolidated Financial Statements (continued)
35
15. Income Taxes
Income taxes applicable to the Company and its domestic consolidated subsidiaries comprise
corporation, enterprise and inhabitants’ taxes which, in the aggregate, resulted in statutory tax
rates of approximately 32.1% and 30.8% for the years ended March 31, 2016 and 2017,
respectively.
A reconciliation of the statutory tax rate and the effective tax rate for the year ended March 31,
2016 was omitted because the Company recorded loss before income taxes.
A reconciliation of the statutory tax rate and the effective tax rate for the year ended March 31,
2017 as a percentage of profit before income taxes is as follows:
2017
Statutory tax rate 30.8%
Permanently non-deductible expenses 0.3
Per capita portion of inhabitants’ taxes 0.4
Differences in tax rates applicable to the overseas
consolidated subsidiaries (3.3)
Foreign tax credit 0.7
Tax loss carryforwards of consolidated
subsidiaries 3.8
Increase in valuation allowance 0.5
Equity in earnings of an affiliate (0.8)
Other 0.4
Effective tax rate 32.8%

Yodogawa Steel Works, Ltd. and Consolidated Subsidiaries
Notes to Consolidated Financial Statements (continued)
36
15. Income Taxes (continued)
The significant components of the deferred tax assets and liabilities of the Group as of March
31, 2016 and 2017 are summarized as follows:
Millions of yen Thousands of U.S. dollars
2016 2017 2017
Deferred tax assets: Accrued enterprise taxes ¥ 120 ¥ 126 $ 1,123 Provision for bonuses to employees 289 324 2,888 Loss on impairment of investments in securities and golf-club memberships 2,905 2,996 26,705
Loss on devaluation of inventories 185 78 695 Allowance for doubtful receivables 34 35 312 Liability for retirement benefits 2,877 2,424 21,606 Tax loss carryforwards 803 857 7,639 Loss on impairment of fixed assets 517 1,961 17,479
Other 945 968 8,628
Gross deferred tax assets 8,675 9,769 87,075
Less valuation allowance (4,882) (6,300) (56,155)
Total deferred tax assets 3,793 3,469 30,920 Deferred tax liabilities:
Dividends from an overseas consolidated subsidiary (126) (175) (1,560)
Land revaluation reserve (856) (856) (7,630) Unrealized holding gain on securities (4,227) (5,598) (49,897) Deferred gain on property for tax purpose (443) (427) (3,806) Reserve for special depreciation (342) (280) (2,496)
Other 0 0 0
Total deferred tax liabilities (5,994) (7,336) (65,389)
Net deferred tax liabilities ¥ (2,201) ¥ (3,867) $ (34,469)
Note: Net deferred tax liabilities as of March 31, 2016 and 2017 are reflected in the following
accounts in the consolidated balance sheet:
Millions of yen Thousands of U.S. dollars
2016 2017 2017
Current assets ¥ 546 ¥ 529 $ 4,715 Investments and other assets 782 403 3,592 Long-term liabilities – Deferred income taxes (2,673) (3,943) (35,146)
– Deferred income taxes on land revaluation reserve (856) (856) (7,630)

Yodogawa Steel Works, Ltd. and Consolidated Subsidiaries
Notes to Consolidated Financial Statements (continued)
37
16. Other Comprehensive Income
Reclassification adjustments and tax effects of other comprehensive (loss) income for the
years ended March 31, 2016 and 2017 are summarized as follows:
Millions of yen
Thousands of
U.S. dollars
2016 2017 2017
Unrealized holding (loss) gain securities: Amount arising during the year ¥ (6,363) ¥ 5,090 $ 45,370
Reclassification adjustments 1,061 6 53
Before tax effect (5,302) 5,096 45,423
Tax effect 1,880 (1,371) (12,220)
Unrealized holding (loss) gain on
securities (3,422) 3,725 33,203
Land revaluation reserve:
Tax effect (4) – –
Land revaluation reserve (4) – –
Translation adjustments:
Amount arising during the year (1,120) (735) (6,552)
Translation adjustments: (1,120) (735) (6,552)
Retirement benefit liability adjustment:
Amount arising during the year (1,183) 222 1,979
Reclassification adjustments 155 279 2,486
Before tax effect (1,028) 501 4,465
Tax effect 276 (191) (1,702)
Retirement benefit liability adjustments (752) 310 2,763
Share of other comprehensive (loss) income
of an affiliate accounted for by the equity
method:
Amount arising during the year (10) 22 196
Share of other comprehensive (loss)
income of an affiliate accounted for by
the equity method (10) 22 196
Total other comprehensive (loss) income ¥ (5,308) ¥ 3,322 $ 29,610

Yodogawa Steel Works, Ltd. and Consolidated Subsidiaries
Notes to Consolidated Financial Statements (continued)
38
17. Shareholders’ Equity
The Companies Act of Japan (the “Act”) provides that an amount equal to 10% of the amount
to be disbursed as distributions of capital surplus (other than the capital reserve) and retained
earnings (other than the legal reserve) be transferred to the capital reserve and the legal reserve,
respectively, until the sum of the capital reserve and the legal reserve equals 25% of the capital
stock account. Such distributions can be made at any time by resolution of the shareholders,
or by the Board of Directors if certain conditions are met.
The capital reserve of the Company amounted to ¥58,050 million ($517,426 thousand) as of
March 31, 2016 and 2017.
The legal reserve of the Company was nil as of March 31, 2016 and 2017.
Stock options
The Company has stock option plans. The following stock option plans for certain directors
and executive officers of the Company were approved at annual general meetings of the
shareholders for the 2004 and the 2005 plans in accordance with the former Commercial Code
of Japan and meetings of the Board of Directors for the 2006 plan through to the 2016 plan in
accordance with the Act.
Stock option expenses, included in selling, general and administrative expenses, charged to
profit or loss for the years ended March 31, 2016 and 2017 amounted to ¥29 million and ¥35
million ($312 thousand), respectively.

Yodogawa Steel Works, Ltd. and Consolidated Subsidiaries
Notes to Consolidated Financial Statements (continued)
39
17. Shareholders’ Equity (continued)
The stock option plans of the Company as of March 31 2017 are summarized as follows:
The 2004 plan The 2005 plan The 2006 plan
Individuals covered by the plan
5 Directors
10 Executive officers (other than directors who concurrently serve as executive officers
6 Directors
9 Executive officers (other than directors who concurrently serve as executive officers
5 Directors
8 Executive officers (other than directors who concurrently serve as executive officers
Class and number of options granted
Common stock 16,200 shares
Common stock 12,400 shares
Common stock 10,600 shares
Grant date July 12, 2004 July 14, 2005 July 31, 2006
Vesting conditions (1) In the event a grantee resigns from both positions of director and executive officer, the options are exercisable from the day following their resignation.
(2) Regardless of (1) above, a grantee can exercise the options from June 30, 2023 if the grantee does not resign from the Company until June 29, 2023.
(1) In the event a grantee resigns from both positions of director and executive officer, the options are exercisable from the day following their resignation.
(2) Regardless of (1) above, a grantee can exercise the options from June 30, 2024 if the grantee does not resign from the Company until June 29, 2024.
(1) In the event a grantee resigns from both positions of director and executive officer, the options are exercisable from the day following their resignation.
(2) Regardless of (1) above, a grantee can exercise the options from June 30, 2025 if the grantee does not resign from the Company until June 29, 2025.
Vesting period for services received
From July 12, 2004 to the date of the annual general meeting of the shareholders for the fiscal year ended March 31, 2005
From July 14, 2005 to the date of the annual general meeting of the shareholders for the fiscal year ended March 31, 2006
From July 31, 2006 to the date of the annual general meeting of the shareholders for the fiscal year ended March 31, 2007
Exercisable period From July 13, 2004 to June 29, 2024
From July 15, 2005 to June 29, 2025
From August 31, 2006 to June 29, 2026

Yodogawa Steel Works, Ltd. and Consolidated Subsidiaries
Notes to Consolidated Financial Statements (continued)
40
17. Shareholders’ Equity (continued)
The 2007 plan The 2008 plan The 2009 plan
Individuals covered by the plan
4 Directors
8 Executive officers (other than directors who concurrently serve as executive officers)
4 Directors
7 Executive officers (other than directors who concurrently serve as executive officers)
5 Directors
7 Executive officers (other than directors who concurrently serve as executive officers)
Class and number of options granted
Common stock 8,600 shares
Common stock 12,000 shares
Common stock 13,800 shares
Grant date August 1, 2007 July 30, 2008 July 30, 2009
Vesting conditions (1) In the event a grantee resigns from both positions of director and executive officer, the options are exercisable from the day following their resignation.
(2) Regardless of (1) above, a grantee can exercise the options from June 30, 2026 if the grantee does not resign from the Company until June 29, 2026.
(1) In the event a grantee resigns from both positions of director and executive officer, the options are exercisable from the day following their resignation.
(2) Regardless of (1) above, a grantee can exercise the options from June 30, 2027 if the grantee does not resign from the Company until June 29, 2027.
(1) In the event a grantee resigns from both positions of director and executive officer, the options are exercisable from the day following their resignation.
(2) Regardless of (1) above, a grantee can exercise the options from June 30, 2028 if the grantee does not resign from the Company until June 29, 2028.
Vesting period for services received
From August 1, 2007 to the date of the annual general meeting of the shareholders for the fiscal year ended March 31, 2008
From August 1, 2008 to the date of the annual general meeting of the shareholders for the fiscal year ended March 31, 2009
From August 1, 2009 to the date of the annual general meeting of the shareholders for the fiscal year ended March 31, 2010
Exercisable period From August 2, 2007 to June 29, 2027
From July 31, 2008 to June 29, 2028
From July 31, 2009 to June 29, 2029

Yodogawa Steel Works, Ltd. and Consolidated Subsidiaries
Notes to Consolidated Financial Statements (continued)
41
17. Shareholders’ Equity (continued)
The 2010 plan The 2011 plan The 2012 plan
Individuals covered by the plan
5 Directors
7 Executive officers (other than directors who concurrently serve as executive officers)
5 Directors
6 Executive officers (other than directors who concurrently serve as executive officers)
5 Directors
9 Executive officers (other than directors who concurrently serve as executive officers)
Class and number of options granted
Common stock 20,400 shares
Common stock 19,600 shares
Common stock 15,400 shares
Grant date July 29, 2010 August 1, 2011 August 1, 2012
Vesting conditions (1) In the event a grantee resigns from both positions of director and executive officer, the options are exercisable from the day following their resignation.
(2) Regardless of (1) above, a grantee can exercise the options from June 30, 2029 if the grantee does not resign from the Company until June 29, 2029.
(1) In the event a grantee resigns from both positions of director and executive officer, the options are exercisable from the day following their resignation.
(2) Regardless of (1) above, a grantee can exercise the options from June 30, 2030 if the grantee does not resign from the Company until June 29, 2030.
(1) In the event a grantee resigns from both positions of director and executive officer, the options are exercisable from the day following their resignation.
(2) Regardless of (1) above, a grantee can exercise the options from June 30, 2031 if the grantee does not resign from the Company until June 29, 2031.
Vesting period for services received
From July 29, 2010 to the date of the annual general meeting of the shareholders for the fiscal year ended March 31, 2011
From August 2, 2011 to the date of the annual general meeting of the shareholders for the fiscal year ended March 31, 2012
From August 2, 2012 to the date of the annual general meeting of the shareholders for the fiscal year ended March 31, 2013
Exercisable period From July 30, 2010 to June 29, 2030
From August 2, 2011 to June 29, 2031
From August 2, 2012 to June 29, 2032

Yodogawa Steel Works, Ltd. and Consolidated Subsidiaries
Notes to Consolidated Financial Statements (continued)
42
17. Shareholders’ Equity (continued)
The 2013 plan The 2014 plan The 2015 Plan
Individuals covered by the plan
5 Directors
9 Executive officers (other than directors who concurrently serve as executive officers)
5 Directors
8 Executive officers (other than directors who concurrently serve as executive officers)
4 Directors
7 Executive officers (other than directors who concurrently serve as executive officers)
Class and number of options granted
Common stock 14,400 shares
Common stock 14,400 shares
Common stock 14,200 shares
Grant date January 31, 2014 July 31, 2014 July 30, 2015
Vesting conditions (1) In the event a grantee resigns from both positions of director and executive officer, the options are exercisable from the day following their resignation.
(2) Regardless of (1) above, a grantee can exercise the options from June 30, 2032 if the grantee does not resign from the Company until June 29, 2032.
(1) In the event a grantee resigns from both positions of director and executive officer, the options are exercisable from the day following their resignation.
(2) Regardless of (1) above, a grantee can exercise the options from June 30, 2033 if the grantee does not resign from the Company until June 29, 2033.
(1) In the event a grantee resigns from both positions of director and executive officer, the options are exercisable from the day following their resignation.
(2) Regardless of (1) above, a grantee can exercise the options from June 30, 2034 if the grantee does not resign from the Company until June 29, 2034.
Vesting period for services received
From July 29, 2013 to the date of the annual general meeting of the shareholders for the fiscal year ended March 31, 2014
From August 1, 2014 to the date of the annual general meeting of the shareholders for the fiscal year ended March 31, 2015
From July 30, 2015 to the date of the annual general meeting of the shareholders for the fiscal year ended March 31, 2016
Exercisable period From February 1, 2014 to June 29, 2033
From August 1, 2014 to June 29, 2034
From July 31, 2015 to June 29, 2035

Yodogawa Steel Works, Ltd. and Consolidated Subsidiaries
Notes to Consolidated Financial Statements (continued)
43
17. Shareholders’ Equity (continued)
The 2016 Plan
Individuals covered by the plan
4 Directors
10 Executive officers (other than directors who concurrently serve as executive officers)
Class and number of options granted
Common stock 15,800 shares
Grant date July 28, 2016
(3) Vesting conditions (4) In the event a grantee resigns from both positions of director and executive officer, the options are exercisable from the day following their resignation.
(5) Regardless of (1) above, a grantee can exercise the options from June 30, 2035 if the grantee does not resign from the Company until June 29, 2035.
Vesting period for services received
From July 28, 2016 to the date of the annual general meeting of the shareholders for the fiscal year ended March 31, 2017
Exercisable period From July 29, 2016 to June 29, 2036
The number of common stock for stock options in the description outlined above was adjusted
due to the consolidation of five shares into one share on October 1, 2015.

Yodogawa Steel Works, Ltd. and Consolidated Subsidiaries
Notes to Consolidated Financial Statements (continued)
44
17. Shareholders’ Equity (continued)
Stock option activity under the stock option plans referred above is summarized as follows:
The
2004
plan
The
2005
plan
The
2006
plan
The
2007
plan
The
2008
plan
The
2009
plan
The
2010
plan
The
2011
plan
The
2012
plan
The
2013
plan
The
2014
plan
The
2015
plan
The
2016
plan
Number of stock
options which are
not yet vested:
Outstanding at
April 1, 2016 2,400 2,000 3,400 3,400 5,000 6,600 7,800 8,200 11,600 11,200 11,800 14,200 –
Granted – – – – – – – – – – – – 15,800
Forfeited – – – – – – – – – – – – –
Vested – – – – – – – – – – – – –
Outstanding at
March 31, 2017 2,400 2,000 3,400 3,400 5,000 6,600 7,800 8,200 11,600 11,200 11,800 14,200 15,800
Number of stock
options which have
already been
vested:
Outstanding at
April 1, 2016 – – – 400 1,200 3,000 4,400 3,600 3,800 3,200 2,200 – –
Vested – – – – – – – – – – – – –
Exercised – – – 400 1,200 1,800 – 800 – – – – –
Forfeited – – – – – – – – – – – – –
Outstanding at
March 31, 2017 – – – – – 1,200 4,400 2,800 3,800 3,200 2,200 – –
The unit price of the stock options for the stock option plans of the Company during the year
ended March 31, 2017 is summarized as follows:
Yen
The
2004
plan
The
2005
plan
The
2006
plan
The
2007
plan
The
2008
plan
The
2009
plan
The
2010
plan
The
2011
plan
The
2012
plan
The
2013
plan
The
2014
plan
The
2015
plan
The
2016
plan
Exercise price ¥ 1 ¥ 1 ¥ 1 ¥ 1 ¥ 1 ¥ 1 ¥ 1 ¥ 1 ¥ 1 ¥ 1 ¥ 1 ¥ 1 ¥ 1
Weighted average
fair value per
stock at the
exercise date – – – 3,350 3,357 3,360 – 3,350 – – – – –
Fair value of stock
options as of the
grant date – – 2,390 2,730 2,080 1,825 1,400 1,200 1,020 1,875 1,865 2,025 2,225
U.S. dollars
The
2004
plan
The
2005
plan
The
2006
plan
The
2007
plan
The
2008
plan
The
2009
plan
The
2010
plan
The
2011
plan
The
2012
plan
The
2013
plan
The
2014
plan
The
2015
plan
The
2016
plan
Exercise price $ 0 $ 0 $ 0 $ 0 $ 0 $ 0 $ 0 $ 0 $ 0 $ 0 $ 0 $ 0 $ 0
Weighted average
fair value per
stock at the
exercise date – – – 30 30 30 – 30 – – – – –
Fair value of stock
options as of the
grant date – – 21 24 19 16 12 11 9 17 17 18 20

Yodogawa Steel Works, Ltd. and Consolidated Subsidiaries
Notes to Consolidated Financial Statements (continued)
45
17. Shareholders’ Equity (continued)
The above tables present the stock options plans that existed during the year ended March 31,
2017. The number of stock options was converted to the number of shares to be issued upon
the exercise of the stock options.
The number of stock and the fair value in the above tables were adjusted due to the
consolidation of five shares into one share on October 1, 2015.
Valuation method for estimating fair value was the Black-Scholes model. The major
assumptions used are as follows:
Major assumptions Note The 2016 plan
Expected volatility (a) 26.716%
Expected holding period 10 years
Expected dividend (b) ¥50 per share
Risk-free rate (c) (0.285%)
(a) Expected volatility was computed by the closing stock price of the Company in the last
trading day of each month during the period from July 2006 to June 2016.
(b) The expected dividend was calculated at the actual amounts paid for the year ended March
31, 2016.
(c) The risk-free rate was determined based on Japanese government bonds whose
redemption period corresponds to the expected holding period described above.
Because it is difficult to reasonably estimate the number of stock options that will be forfeited,
the estimation reflects only the actual number of forfeited stock options.
Common stock and treasury stock
Movements in common stock and treasury stock during the years ended March 31, 2016 and
2017 are summarized as follows:
Number of shares
2016
April 1, 2015 Increase Decrease March 31, 2016
Common stock (*1) 179,186,153 – 143,348,923 35,837,230
Treasury stock (*2) 24,475,276 1,290,550 20,402,747 5,363,079
Number of shares
2017
April 1, 2015 Increase Decrease March 31, 2017
Common stock 35,837,230 – – 35,837,230
Treasury stock (*3) 5,363,079 670,018 4,252 6,028,845

Yodogawa Steel Works, Ltd. and Consolidated Subsidiaries
Notes to Consolidated Financial Statements (continued)
46
17. Shareholders’ Equity (continued)
(*1) The decrease in the number of common stock of 143,348,923 shares was due to the
consolidation of five shares into one share on October 1, 2015.
(*2) The increase in the number of shares of treasury consists of 1,272,878 shares due to
purchase of shares based on the resolution of the Board of Directors meeting, 14,138
shares due to the purchase of fractional shares of less than one voting unit and 3,534 shares
attributable to the Company acquired by its affiliate under the equity method.
The decrease in the number of shares of treasury stock consists of 20,364,401 shares due
to the consolidation of shares, 37,400 shares due to the exercise of stock option rights and
946 shares due to the sales of fractional shares less than one voting unit to shareholders at
their request.
(*3) The increase in the number of shares of treasury consists of 667,400 shares due to
purchase of shares based on the resolution of the Board of Directors meeting, 1,550 shares
due to the purchase of fractional shares of less than one voting unit and 1,068 shares
attributable to the Company acquired by its affiliate under the equity method.
The decrease in the number of shares of treasury stock consists of 4,200 shares due to the
exercise of stock option rights and 52 shares due to the sales of fractional shares less than
one voting unit to shareholders at their request.
18. Land Revaluation
As of March 31, 2000 and 2002, certain consolidated subsidiaries and an affiliate revalued
their land held for business use in accordance with the “Law on Land Revaluation.”
Differences on land revaluation have been accounted for as land revaluation reserve under net
assets and are stated at the Company’s share of the net amount of the relevant tax effect. The
method followed for land revaluation was determined in accordance with the “Enforcement
Act Concerning Land Revaluation.”
The fair value of the land revalued as of March 31, 2000 and 2002 was less than the
corresponding carrying value by the following amounts as of March 31, 2016 and 2017:
Millions of yen
Thousands of
U.S. dollars
2016 2017 2017
Land revalued as of March 31, 2000 ¥ (331) ¥ (329) $ (2,932)
Land revalued as of March 31, 2002 (656) (604) (5,384)
¥ (987) ¥ (933) $ (8,316)

Yodogawa Steel Works, Ltd. and Consolidated Subsidiaries
Notes to Consolidated Financial Statements (continued)
47
18. Land Revaluation (continued)
A certain portion of land revalued as of March 31, 2000 and 2002 is related to real estate for
investment, rental and idle properties as of March 31, 2016 in the amounts of ¥13 million and
¥289 million, respectively.
A certain portion of land revalued as of March 31, 2000 and 2002 is related to real estate for
investment, rental and idle properties as of March 31, 2017 in the amounts of ¥12 million
($107 thousand) and ¥286 million ($2,549 thousand), respectively.
19. Research and Development Costs
Research and development costs included in selling, general and administrative expenses
totaled ¥560 million and ¥526 million ($4,688 thousand) for the years ended March 31, 2016
and 2017, respectively.
20. Leases
(a) Finance leases
The Group leases mainly machinery, vehicles and others (machinery and equipment) as
leased assets under finance lease transactions which transfer ownership to the Group and
mainly, information processing systems (equipment) as leased assets under finance lease
transactions which do not transfer ownership to the Group.
The depreciation method for leased assets is provided in Note 1. Summary of Significant
Accounting Policies (l) Leases.
(b) Operating leases
Future minimum lease receipts subsequent to March 31, 2017 under non-cancelable
operating leases are as follows:
Years ending March 31, Millions of yen
Thousands of
U.S. dollars
2018 ¥ 17 $ 152
2019 and thereafter 86 766
¥ 103 $ 918

Yodogawa Steel Works, Ltd. and Consolidated Subsidiaries
Notes to Consolidated Financial Statements (continued)
48
21. Derivatives The outstanding currency-related derivatives positions designated as hedging instruments as
of March 31, 2016 and 2017 are as follows:
Millions of yen
2016
Contract value
(notional
principal
amount)
Contract value
over one year
Estimated
fair value
Method of
hedge accounting
Hedge transactions
and major hedged items
Allocation method for
forward foreign
exchange contracts
Forward foreign exchange contracts:
Selling USD, Accounts receivable ¥ 114 ¥ – (*)
Millions of yen
2017
Contract
value
(notional
principal
amount)
Contract value
over one year
Estimated
fair value
Method of
hedge accounting
Hedge transactions
and major hedged items
Allocation method for
forward foreign
exchange contracts
Forward foreign exchange contracts:
Selling USD, Accounts receivable ¥ 111 ¥ – (*)
Thousands of U.S. dollars
2017
Contract
value
(notional
principal
amount)
Contract value
over one year
Estimated
fair value
Method of
hedge accounting
Hedge transactions
and major hedged items
Allocation method for
forward foreign
exchange contracts
Forward foreign exchange contracts:
Selling USD, Accounts receivable $ 989 $ – (*)
(*) The fair value of forward foreign exchange contracts that qualify for allocation method is
included in the carrying value of hedged accounts receivable.

Yodogawa Steel Works, Ltd. and Consolidated Subsidiaries
Notes to Consolidated Financial Statements (continued)
49
22. Amounts per Share
Amounts per share as of March 31, 2016 and 2017 and for the years then ended are as follows:
Yen U.S. dollars
2016 2017 2017
Net assets ¥ 4,500.51 ¥ 4,805.41 $ 42.83
(Loss) profit attributable to
owners of parent:
Basic (90.14) 224.27 2.00
Diluted – 223.38 1.99
Cash dividends 30.00 70.00 0.62
Amounts per share of net assets are computed based on the number of shares of common stock
outstanding at the year end.
Basic (loss) profit attributable to owners of parent per share is computed based on the (loss)
profit available for distribution to shareholders of common stock of parent and the weighted-
average number of shares of common stock outstanding during the year. Diluted profit
attributable to owners of parent per share is computed based on the profit available for
distribution to the shareholders and the weighted-average number of shares of common stock
outstanding during each year after giving effect to the dilutive potential of shares of common
stock to be issued upon the exercise of stock acquisition rights.
Diluted earnings attributable to owners of parent per share for the year ended March 31, 2016
was not presented since the Company recorded loss.
The average number of shares of common stock used to compute basic (loss) profit attributable
to owners of parent per share for the years ended March 31, 2016 and 2017 were 30,746
thousand and 30,031 thousand, respectively. The number of shares of common stock with
dilutive potential for the years ended March 31, 2016 and 2017 were 109 thousand and 120
thousand, respectively.
Cash dividends per share represent the cash dividends proposed by the Board of Directors as
applicable to the respective years together with the interim cash dividends paid.

Yodogawa Steel Works, Ltd. and Consolidated Subsidiaries
Notes to Consolidated Financial Statements (continued)
50
23. Transactions with Related Parties
Transactions and balances with related parties as of and for the years ended March 31, 2016
and 2017 are summarized as follows:
Name of affiliated company
Transactions
Type of transaction
Millions of yen Thousands of U.S. dollars
2016 2017 2017
Sadoshima Corporation
Sales ¥ 31,989 ¥ 32,094 $ 286,068
Balances
Account name
Millions of yen Thousands of U.S. dollars
2016 2017 2017
Notes and accounts receivable ¥ 12,727 ¥ 13,455 $ 119,930
The Company owns 50.0% of the voting rights of Sadoshima Corporation, a steel product
wholesaler for the Company. Certain board members of Sadoshima Corporation serve
concurrently as board members of the Company. Selling prices of products are determined
based on price negotiations each fiscal year, after considering market prices, overall costs and
the Company’s proposals regarding desired prices.
24. Investment, Rental and Idle Properties
The Company and certain consolidated subsidiaries own office buildings, land, and parking
lots as rental properties and idle properties mainly in Osaka Prefecture, other domestic areas
and Taiwan. Certain portions of real estate, such as office buildings are used by the Company
and certain consolidated subsidiaries.
The carrying value in the consolidated balance sheet as of March 31, 2016 and 2017 and the
corresponding fair value of rental properties and idle properties and real estate including
certain portions used as rental property are as follows:
Millions of yen
Carrying value Fair value
2015 Net change 2016 2016
Rental properties and idle
properties ¥ 4,617 ¥ (145) ¥ 4,472 ¥ 9,259
Real estate including certain
portions used as rental
property 4,628 204 4,832 11,803

Yodogawa Steel Works, Ltd. and Consolidated Subsidiaries
Notes to Consolidated Financial Statements (continued)
51
24. Investment, Rental and Idle Properties (continued)
Millions of yen
Carrying value Fair value
2016 Net change 2017 2017
Rental properties and idle
properties ¥ 4,472 ¥ (118) ¥ 4,354 ¥ 9,081
Real estate including certain
portions used as rental
property 4,832 1,004 5,836 12,175
Thousands of U.S. dollars
Carrying value Fair value
2016 Net change 2017 2017
Rental properties and idle
properties $ 39,861 $(1,052) $ 38,809 $ 80,943
Real estate including certain
portions used as rental
property 43,070 8,949 52,019 108,521
The carrying value represents the acquisition cost less accumulated depreciation and
cumulative impairment loss.
The components of net change in carrying value for the year ended March 31, 2016 included
increases mainly due to purchase of buildings in the amount of ¥274 million and decreases
mainly due to depreciation of buildings in the amount of ¥131 million and translation
adjustments in the amount of ¥47 million.
The components of net change in carrying value for the year ended March 31, 2017 included
increases mainly due to purchase of buildings in the amount of ¥700 million ($6,239 thousand)
and land in the amount of ¥385 million ($3,432 thousand) and decreases mainly due to
depreciation of buildings in the amount of ¥143 million ($1,275 thousand) and loss on
impairment of land in the amount of ¥23 million ($205 thousand) and sale of land in the
amount of ¥7 million ($62 thousand) and translation adjustments in the amount of ¥27 million
($241 thousand).
Fair value of domestic rental properties are principally measured based on the real-estate
appraisal assessed by the external real-estate appraiser. However, unless the appraisal or
indicators that are regarded to reflect the fair value of the properties appropriately change
significantly since the date of acquisition or the date of the latest appraisal, the Company and
certain domestic consolidated subsidiaries measure the fair value of the properties based on
such appraisal or indicators obtained previously and adjusted as appropriately.

Yodogawa Steel Works, Ltd. and Consolidated Subsidiaries
Notes to Consolidated Financial Statements (continued)
52
24. Investment, Rental and Idle Properties (continued)
Fair value of rental properties in Taiwan is measured based on the property prices announced
by the government.
Revenues, costs and expenses relevant to investment, rental, idle properties and real estate
including certain portions used as result property for the years ended March 31, 2016 and 2017
are as follows:
Millions of yen
2016
Rental revenues Rental costs Difference
Other loss, net on
sales and others
¥ 1,019 ¥ 742 ¥ 277 ¥ 38
Millions of yen
2017
Rental revenues Rental costs Difference
Other loss, net on
sales and others
¥ 924 ¥ 564 ¥ 360 ¥ 22
Thousands of U.S. dollars
2017
Rental revenues Rental costs Difference
Other loss, net on
sales and others
$ 8,236 $ 5,027 $ 3,209 $ 196
The rental revenues and rental costs for certain properties of which only a part are used as
rental properties are not included in the above table because the Company and certain
consolidated subsidiaries use a portion of these properties for the purposes of rendering
services and conducting management activities. The rental revenues are recorded under net
sales or other net, as part of other income (expenses) and the rental costs are recorded under
cost of sales, selling, general and administrative expenses or other, net, as part of other income
(expenses), in the consolidated statement of operations.

Yodogawa Steel Works, Ltd. and Consolidated Subsidiaries
Notes to Consolidated Financial Statements (continued)
53
25. Segment Information
(a) Outline of segment information
The reportable segments of the Group are components for which discrete financial
information is available, and whose operating results are regularly reviewed by the Board
of Directors of the Company in order to make decisions about resource allocation and to
assess business performance.
The Group’s business units are divided by the similarity of the products or services sold
by each business unit. Each business unit develops its own strategies and operates its
businesses independently. Therefore, the Group consists four reportable segments based
on business units: “Steel Sheet Segment,” “Roll Segment,” “Grating Segment” and “Real
Estate Segment.”
The “Steel Sheet Segment” engages in the manufacture and sale of cold rolled steel,
polished hoop steel, hot dip galvanizing steel sheets, painted hot dip galvanizing steel
sheets, various steel sheets, other construction materials, and exterior products and others
and in designing and engineering of construction work. The “Roll Segment” engages in
the manufacture and sale of rolls for iron, steel and non-ferrous products and others. The
“Grating Segment” engages in the manufacture and sales of gratings. The “Real Estate
Segment” engages in the sale, purchase and lease of real estate such as buildings, car
parking lots.
(b) Calculation methods used for net sales, income or loss, assets and other items of each
reportable segment
The accounting policies of the segments are the same as those described in the summary
of significant accounting policies in Note 1. In addition, segment income is adjusted to
be consistent with operating income in the consolidated statement of operations.
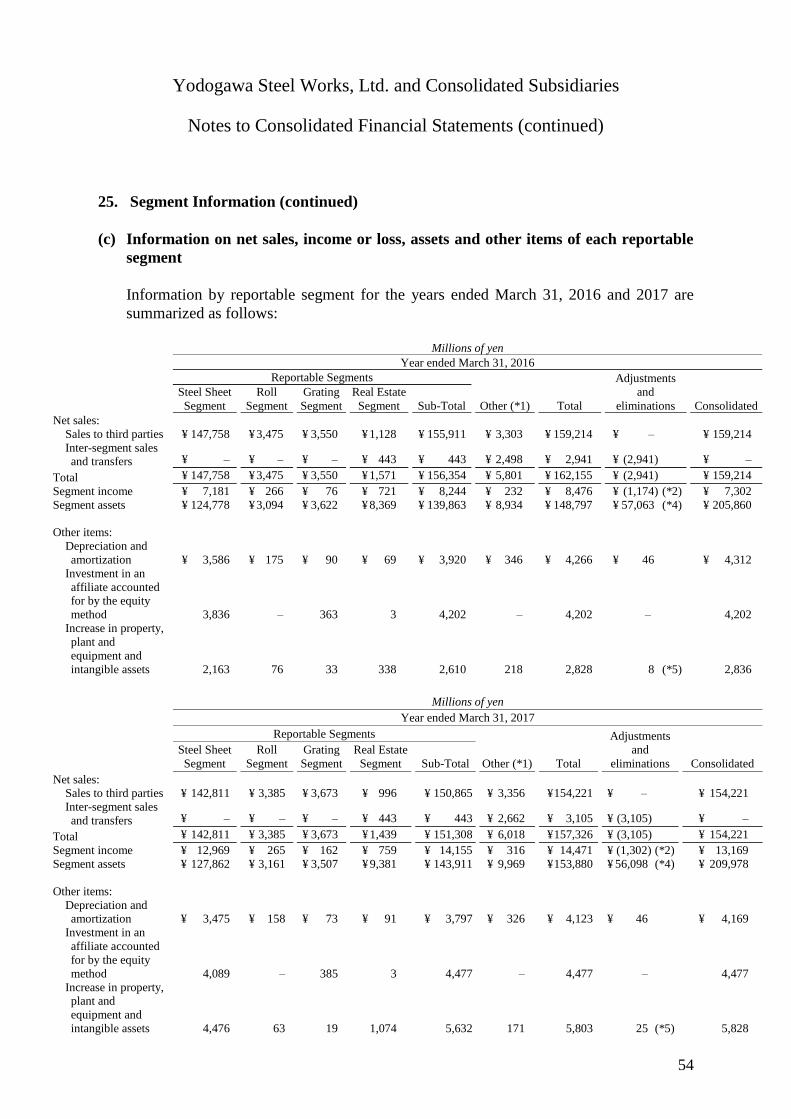
Yodogawa Steel Works, Ltd. and Consolidated Subsidiaries
Notes to Consolidated Financial Statements (continued)
54
25. Segment Information (continued)
(c) Information on net sales, income or loss, assets and other items of each reportable
segment
Information by reportable segment for the years ended March 31, 2016 and 2017 are
summarized as follows:
Millions of yen
Year ended March 31, 2016
Reportable Segments
Other (*1) Total
Adjustments
and
eliminations Consolidated
Steel Sheet
Segment
Roll
Segment
Grating
Segment
Real Estate
Segment Sub-Total
Net sales:
Sales to third parties ¥ 147,758 ¥ 3,475 ¥ 3,550 ¥ 1,128 ¥ 155,911 ¥ 3,303 ¥ 159,214 ¥ – ¥ 159,214
Inter-segment sales and transfers ¥ – ¥ – ¥ – ¥ 443 ¥ 443 ¥ 2,498 ¥ 2,941 ¥ (2,941) ¥ –
Total ¥ 147,758 ¥ 3,475 ¥ 3,550 ¥ 1,571 ¥ 156,354 ¥ 5,801 ¥ 162,155 ¥ (2,941) ¥ 159,214
Segment income ¥ 7,181 ¥ 266 ¥ 76 ¥ 721 ¥ 8,244 ¥ 232 ¥ 8,476 ¥ (1,174) (*2) ¥ 7,302
Segment assets ¥ 124,778 ¥ 3,094 ¥ 3,622 ¥ 8,369 ¥ 139,863 ¥ 8,934 ¥ 148,797 ¥ 57,063 (*4) ¥ 205,860
Other items:
Depreciation and
amortization ¥ 3,586 ¥ 175 ¥ 90 ¥ 69 ¥ 3,920 ¥ 346 ¥ 4,266 ¥ 46 ¥ 4,312
Investment in an
affiliate accounted for by the equity
method 3,836 – 363 3 4,202 – 4,202 – 4,202
Increase in property,
plant and
equipment and
intangible assets 2,163 76 33 338 2,610 218 2,828 8 (*5) 2,836
Millions of yen
Year ended March 31, 2017
Reportable Segments
Other (*1) Total
Adjustments
and
eliminations Consolidated
Steel Sheet
Segment
Roll
Segment
Grating
Segment
Real Estate
Segment Sub-Total
Net sales: Sales to third parties ¥ 142,811 ¥ 3,385 ¥ 3,673 ¥ 996 ¥ 150,865 ¥ 3,356 ¥ 154,221 ¥ – ¥ 154,221
Inter-segment sales
and transfers ¥ – ¥ – ¥ – ¥ 443 ¥ 443 ¥ 2,662 ¥ 3,105 ¥ (3,105) ¥ –
Total ¥ 142,811 ¥ 3,385 ¥ 3,673 ¥ 1,439 ¥ 151,308 ¥ 6,018 ¥ 157,326 ¥ (3,105) ¥ 154,221
Segment income ¥ 12,969 ¥ 265 ¥ 162 ¥ 759 ¥ 14,155 ¥ 316 ¥ 14,471 ¥ (1,302) (*2) ¥ 13,169
Segment assets ¥ 127,862 ¥ 3,161 ¥ 3,507 ¥ 9,381 ¥ 143,911 ¥ 9,969 ¥ 153,880 ¥ 56,098 (*4) ¥ 209,978
Other items:
Depreciation and amortization ¥ 3,475 ¥ 158 ¥ 73 ¥ 91 ¥ 3,797 ¥ 326 ¥ 4,123 ¥ 46 ¥ 4,169
Investment in an
affiliate accounted
for by the equity
method 4,089 – 385 3 4,477 – 4,477 – 4,477
Increase in property, plant and
equipment and
intangible assets 4,476 63 19 1,074 5,632 171 5,803 25 (*5) 5,828
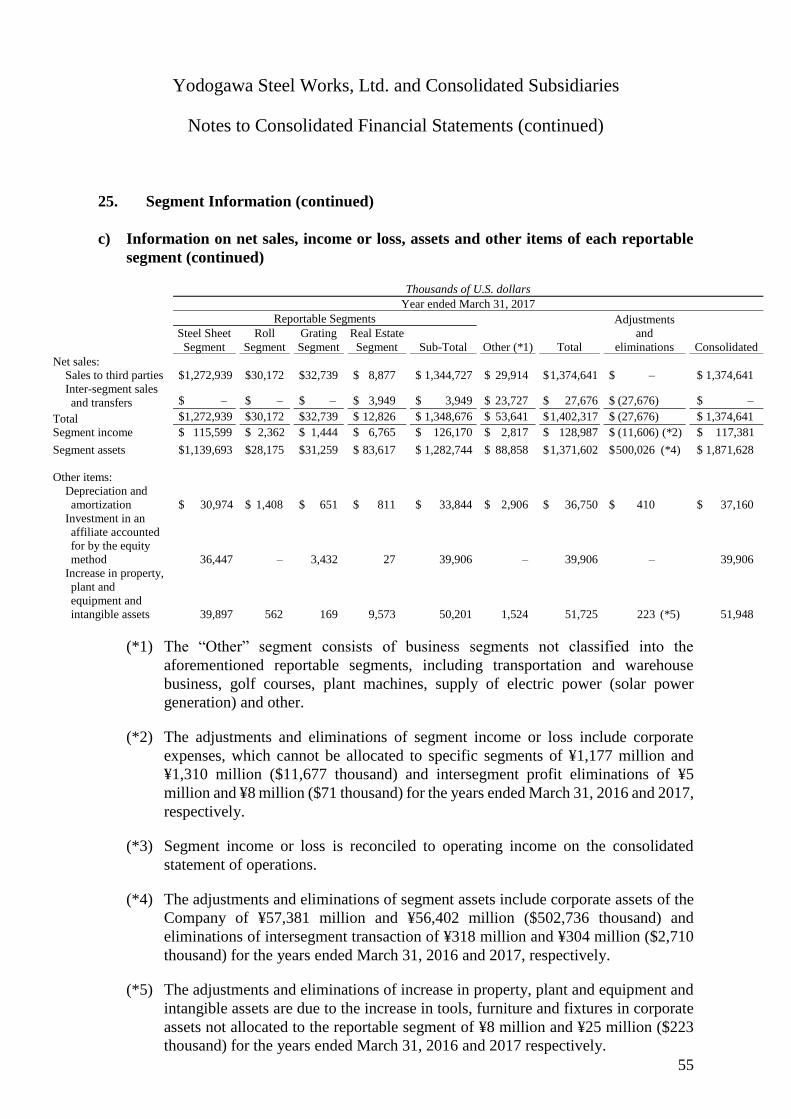
Yodogawa Steel Works, Ltd. and Consolidated Subsidiaries
Notes to Consolidated Financial Statements (continued)
55
25. Segment Information (continued)
c) Information on net sales, income or loss, assets and other items of each reportable
segment (continued)
Thousands of U.S. dollars
Year ended March 31, 2017
Reportable Segments
Other (*1) Total
Adjustments
and
eliminations Consolidated
Steel Sheet
Segment
Roll
Segment
Grating
Segment
Real Estate
Segment Sub-Total
Net sales: Sales to third parties $1,272,939 $30,172 $32,739 $ 8,877 $ 1,344,727 $ 29,914 $ 1,374,641 $ – $ 1,374,641
Inter-segment sales
and transfers $ – $ – $ – $ 3,949 $ 3,949 $ 23,727 $ 27,676 $ (27,676) $ –
Total $1,272,939 $30,172 $32,739 $ 12,826 $ 1,348,676 $ 53,641 $ 1,402,317 $ (27,676) $ 1,374,641
Segment income $ 115,599 $ 2,362 $ 1,444 $ 6,765 $ 126,170 $ 2,817 $ 128,987 $ (11,606) (*2) $ 117,381
Segment assets $1,139,693 $28,175 $31,259 $ 83,617 $ 1,282,744 $ 88,858 $ 1,371,602 $ 500,026 (*4) $ 1,871,628
Other items:
Depreciation and
amortization $ 30,974 $ 1,408 $ 651 $ 811 $ 33,844 $ 2,906 $ 36,750 $ 410 $ 37,160
Investment in an
affiliate accounted for by the equity
method 36,447 – 3,432 27 39,906 – 39,906 – 39,906
Increase in property,
plant and
equipment and
intangible assets 39,897 562 169 9,573 50,201 1,524 51,725 223 (*5) 51,948
(*1) The “Other” segment consists of business segments not classified into the
aforementioned reportable segments, including transportation and warehouse
business, golf courses, plant machines, supply of electric power (solar power
generation) and other.
(*2) The adjustments and eliminations of segment income or loss include corporate
expenses, which cannot be allocated to specific segments of ¥1,177 million and
¥1,310 million ($11,677 thousand) and intersegment profit eliminations of ¥5
million and ¥8 million ($71 thousand) for the years ended March 31, 2016 and 2017,
respectively.
(*3) Segment income or loss is reconciled to operating income on the consolidated
statement of operations.
(*4) The adjustments and eliminations of segment assets include corporate assets of the
Company of ¥57,381 million and ¥56,402 million ($502,736 thousand) and
eliminations of intersegment transaction of ¥318 million and ¥304 million ($2,710
thousand) for the years ended March 31, 2016 and 2017, respectively.
(*5) The adjustments and eliminations of increase in property, plant and equipment and
intangible assets are due to the increase in tools, furniture and fixtures in corporate
assets not allocated to the reportable segment of ¥8 million and ¥25 million ($223
thousand) for the years ended March 31, 2016 and 2017 respectively.

Yodogawa Steel Works, Ltd. and Consolidated Subsidiaries
Notes to Consolidated Financial Statements (continued)
56
25. Segment Information (continued)
Net sales categorized by country and region based on locations of customers within the Group
for the years ended March 31, 2016 and 2017 are summarized as follows:
Millions of yen
2016
Japan Taiwan USA Other Total
¥ 100,214 ¥ 23,202 ¥ 13,567 ¥ 22,231 ¥ 159,214
Millions of yen
2017
Japan Taiwan USA Other Total
¥ 99,976 ¥ 27,654 ¥ 6,713 ¥ 19,878 ¥ 154,221
Thousands of U.S. dollars
2017
Japan Taiwan USA Other Total
$ 891,131 $ 246,493 $ 59,836 $ 177,181 $ 1,374,641
Property, plant and equipment, net, categorized by geographical area as of March 31, 2016
and 2017 are summarized as follows:
Millions of yen
2016
Japan Taiwan China Other Total
¥ 32,138 ¥ 11,198 ¥ 4,428 ¥ 2,874 ¥ 50,638
Millions of yen
2017
Japan Taiwan China Other Total
¥ 34,319 ¥ 10,869 ¥ 3,138 ¥ 2,562 ¥ 50,888
Thousands of U.S. dollars
2017
Japan Taiwan China Other Total
$ 305,901 $ 96,880 $ 27,970 $ 22,837 $ 453,588

Yodogawa Steel Works, Ltd. and Consolidated Subsidiaries
Notes to Consolidated Financial Statements (continued)
57
25. Segment Information (continued)
Net sales to major customers for the years ended March 31, 2016 and 2017 are as follows:
Millions of yen
Thousands of
U.S. dollars Customer name 2016 2017 2017 Related Segments
Sadoshima
Corporation
¥ 31,989 ¥ 32,094 $ 286,068
“Steel Sheet Segment,”
“Grating Segment,”
“Real Estate Segment”
and “Other”
Loss on impairment of fixed assets by reportable segment for the years ended March 31, 2016
and 2017 is summarized as follows:
Millions of yen
Year ended March 31, 2016
Reportable Segments
Steel Sheet
Segment
Roll
Segment
Grating
Segment
Real Estate
Segment Other
Adjustments and
eliminations Total
Loss on impairment
of fixed assets ¥ 5,971 ¥ – ¥ – ¥ – ¥ 600 ¥ 32 ¥ 6,603
Millions of yen
Year ended March 31, 2017
Reportable Segments
Steel Sheet
Segment
Roll
Segment
Grating
Segment
Real Estate
Segment Other
Adjustments and
eliminations Total
Loss on impairment
of fixed assets ¥ 714 ¥ – ¥ – ¥ – ¥ 0 ¥ 23 ¥ 737
Thousands of U.S. dollars
Year ended March 31, 2017
Reportable Segments
Steel Sheet
Segment
Roll
Segment
Grating
Segment
Real Estate
Segment Other
Adjustments and
eliminations Total
Loss on impairment
of fixed assets $ 6,364 $ – $ – $ – $ 0 $ 205 $ 6,569

Yodogawa Steel Works, Ltd. and Consolidated Subsidiaries
Notes to Consolidated Financial Statements (continued)
58
25. Segment Information (continued)
The amortization and balance of goodwill by reportable segment as of and for the years ended
March 31, 2016 and 2017 is summarized as follows:
Millions of yen
Year ended March 31, 2016
Reportable Segments
Steel Sheet
Segment
Roll
Segment
Grating
Segment
Real Estate
Segment Other
Adjustments and
eliminations Total
Amortization ¥ 22 ¥ – ¥ – ¥ – ¥ – ¥ – ¥ 22
Balance at the year end ¥ 14 ¥ – ¥ – ¥ – ¥ – ¥ – ¥ 14
Millions of yen
Year ended March 31, 2017
Reportable Segments
Steel Sheet
Segment
Roll
Segment
Grating
Segment
Real Estate
Segment Other
Adjustments and
eliminations Total
Amortization ¥ 3 ¥ – ¥ – ¥ – ¥ – ¥ – ¥ 3
Balance at the year end ¥ 11 ¥ – ¥ – ¥ – ¥ – ¥ – ¥ 11
Thousands of U.S. dollars
Year ended March 31, 2017
Reportable Segments
Steel Sheet
Segment
Roll
Segment
Grating
Segment
Real Estate
Segment Other
Adjustments and
eliminations Total
Amortization $ 27 $ – $ – $ – $ – $ – $ 27
Balance at the year end $ 98 $ – $ – $ – $ – $ – $ 98
Goodwill was recognized as a result of capital increase of consolidated subsidiary in
November 2014 and March 2015.
Loss on impairment of goodwill of ¥162 million has been recorded in the consolidated
statement of operations for the year ended March 31, 2016.

Yodogawa Steel Works, Ltd. and Consolidated Subsidiaries
Notes to Consolidated Financial Statements (continued)
59
26. Subsequent Events
(a) Cash dividends
The following distribution of retained earnings of the Company, which has not been
reflected in the accompanying consolidated financial statements for the year ended March
31, 2017, was approved at a meeting of the Board of Directors held on May 10, 2017.
Millions of yen
Thousands of
U.S. dollars
Cash dividends of ¥40 ($0.36) per share ¥ 1,204 $ 10,732
(b) Purchase of treasury stock
At the meeting of the Board of Directors of the Company held on May 10, 2017, in
accordance with Article 459 (1) of the Act and Article 35 of the Company’s articles of
incorporation, the Company approved the purchase of up to 160,000 shares of treasury
stock for an aggregate acquisition cost not exceeding ¥500 million ($4,457 thousand)
during the period from May 11, 2017 through June 23, 2017, to support the execution of
a flexible capital management policy in response to changes in the business environment.
As a result, the Company purchased 160,000 shares of treasury stock for a total amount
of ¥487 million ($4,341 thousand) on the Tokyo Stock Exchange.