Embed Size (px)
Citation preview

Consolidated Financial Statements Together with Report of Independent Certified Public Accountants
AARP
December 31, 2014 and 2013
AARP
TABLE OF CONTENTS
Page(s)
Report of Independent Certified Public Accountants 1 - 2
Consolidated Financial Statements:
Consolidated Statements of Financial Position as of December 31, 2014 and 2013 3
Consolidated Statement of Activities for the year ended December 31, 2014 4
Consolidated Statement of Activities for the year ended December 31, 2013 5
Consolidated Statements of Cash Flows for the years ended December 31, 2014 and 2013 6
Notes to Consolidated Financial Statements 7 - 31

REPORT OF INDEPENDENT CERTIFIED PUBLIC ACCOUNTANTS
To the Board of Directors of
AARP, Inc.:
We have audited the accompanying consolidated financial statements of AARP, Inc. and affiliates
(collectively, “AARP”), which comprise the consolidated statements of financial position as of
December 31, 2014 and 2013, and the related consolidated statements of activities and cash flows for the
years then ended, and the related notes to the consolidated financial statements.
Management’s responsibility for the financial statements
Management is responsible for the preparation and fair presentation of these consolidated financial
statements in accordance with accounting principles generally accepted in the United States of America;
this includes the design, implementation, and maintenance of internal control relevant to the preparation
and fair presentation of consolidated financial statements that are free from material misstatement, whether
due to fraud or error.
Auditor’s responsibility
Our responsibility is to express an opinion on these consolidated financial statements based on our audits.
We conducted our audits in accordance with auditing standards generally accepted in the United States of
America. Those standards require that we plan and perform the audit to obtain reasonable assurance about
whether the consolidated financial statements are free from material misstatement.
An audit involves performing procedures to obtain audit evidence about the amounts and disclosures in the
consolidated financial statements. The procedures selected depend on the auditor’s judgment, including the
assessment of the risks of material misstatement of the consolidated financial statements, whether due to
fraud or error. In making those risk assessments, the auditor considers internal control relevant to AARP’s
preparation and fair presentation of the consolidated financial statements in order to design audit
procedures that are appropriate in the circumstances, but not for the purpose of expressing an opinion on
the effectiveness of AARP’s internal control. Accordingly, we express no such opinion. An audit also
includes evaluating the appropriateness of accounting policies used and the reasonableness of significant
accounting estimates made by management, as well as evaluating the overall presentation of the
consolidated financial statements.
Grant Thornton LLP 1250 Connecticut Ave NW, Suite 400 Washington, DC 20036-3531
T 202.296.7800 F 202.833.9165 GrantThornton.com linkd.in/GrantThorntonUS twitter.com/GrantThorntonUS
Grant Thornton LLP U.S. member firm of Grant Thornton International Ltd

- 2 -
We believe that the audit evidence we have obtained is sufficient and appropriate to provide a basis for our
audit opinion.
Opinion
In our opinion, the consolidated financial statements referred to above present fairly, in all material
respects, the consolidated financial position of AARP, Inc. and affiliates as of December 31, 2014 and
2013, and the changes in their net assets and their cash flows for the years then ended in accordance with
accounting principles generally accepted in the United States of America.
Washington, D.C.
March 26, 2015
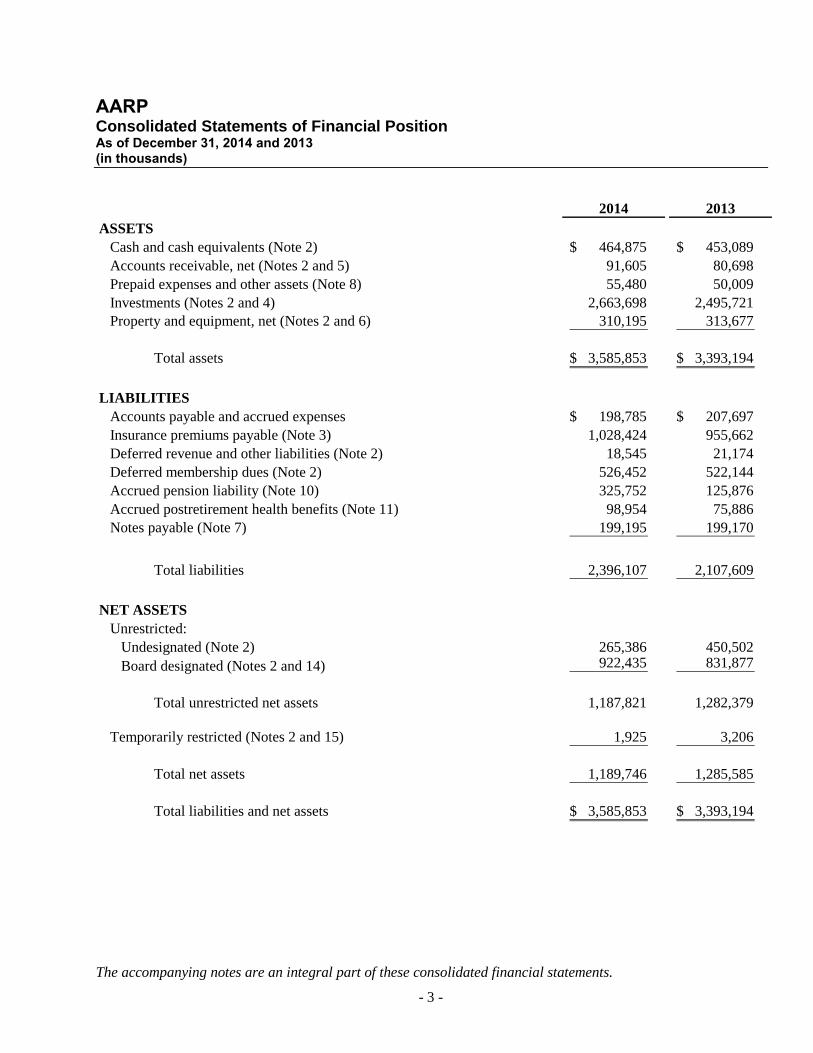
AARP Consolidated Statements of Financial Position As of December 31, 2014 and 2013 (in thousands)
The accompanying notes are an integral part of these consolidated financial statements.
- 3 -
2014 2013
ASSETS
Cash and cash equivalents (Note 2) 464,875$ 453,089$
Accounts receivable, net (Notes 2 and 5) 91,605 80,698
Prepaid expenses and other assets (Note 8) 55,480 50,009
Investments (Notes 2 and 4) 2,663,698 2,495,721
Property and equipment, net (Notes 2 and 6) 310,195 313,677
Total assets 3,585,853$ 3,393,194$
LIABILITIES
Accounts payable and accrued expenses 198,785$ 207,697$
Insurance premiums payable (Note 3) 1,028,424 955,662
Deferred revenue and other liabilities (Note 2) 18,545 21,174
Deferred membership dues (Note 2) 526,452 522,144
Accrued pension liability (Note 10) 325,752 125,876
Accrued postretirement health benefits (Note 11) 98,954 75,886
Notes payable (Note 7) 199,195 199,170
Total liabilities 2,396,107 2,107,609
NET ASSETS
Unrestricted:
Undesignated (Note 2) 265,386 450,502
Board designated (Notes 2 and 14) 922,435 831,877
Total unrestricted net assets 1,187,821 1,282,379
Temporarily restricted (Notes 2 and 15) 1,925 3,206
Total net assets 1,189,746 1,285,585
Total liabilities and net assets 3,585,853$ 3,393,194$
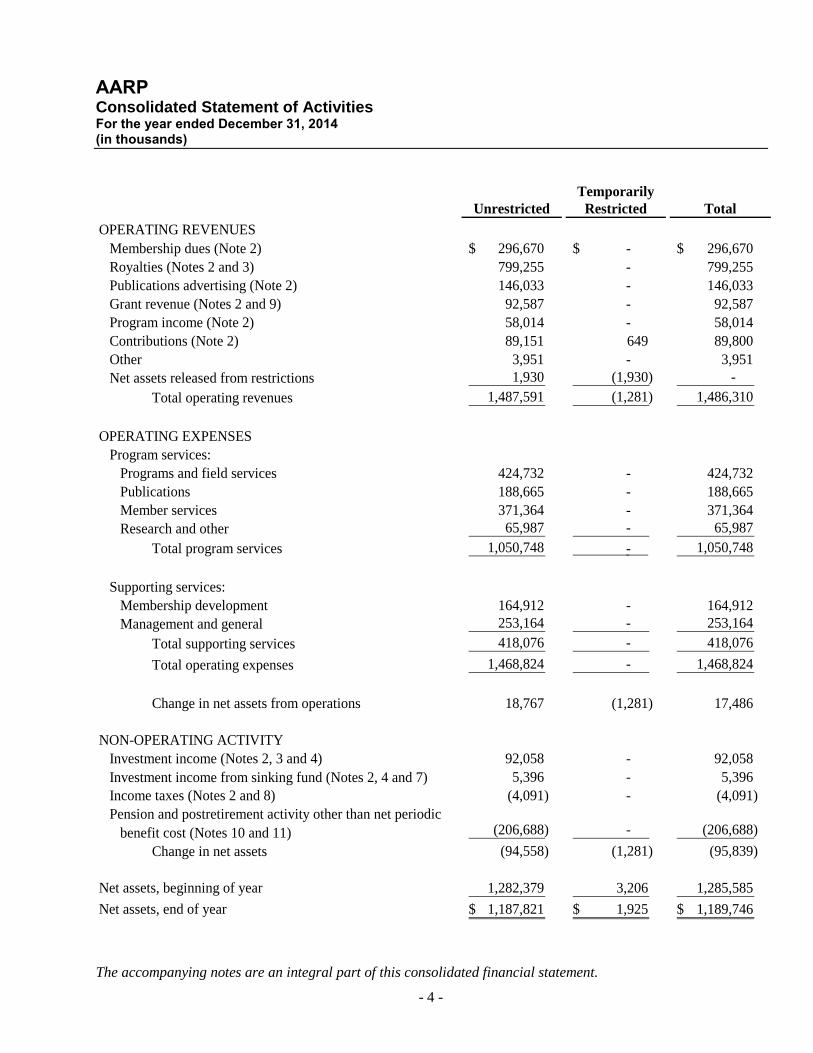
AARP Consolidated Statement of Activities For the year ended December 31, 2014 (in thousands)
The accompanying notes are an integral part of this consolidated financial statement.
- 4 -
Temporarily
Unrestricted Restricted Total
OPERATING REVENUES
Membership dues (Note 2) 296,670$ - $ 296,670$
Royalties (Notes 2 and 3) 799,255 - 799,255
Publications advertising (Note 2) 146,033 - 146,033
Grant revenue (Notes 2 and 9) 92,587 - 92,587
Program income (Note 2) 58,014 - 58,014
Contributions (Note 2) 89,151 649 89,800
Other 3,951 - 3,951
Net assets released from restrictions 1,930 (1,930) -
Total operating revenues 1,487,591 (1,281) 1,486,310
OPERATING EXPENSES
Program services:
Programs and field services 424,732 - 424,732
Publications 188,665 - 188,665
Member services 371,364 - 371,364
Research and other 65,987 - 65,987
Total program services 1,050,748 - 1,050,748
Supporting services:
Membership development 164,912 - 164,912
Management and general 253,164 - 253,164
Total supporting services 418,076 - 418,076
Total operating expenses 1,468,824 - 1,468,824
Change in net assets from operations 18,767 (1,281) 17,486
NON-OPERATING ACTIVITY
Investment income (Notes 2, 3 and 4) 92,058 - 92,058
Investment income from sinking fund (Notes 2, 4 and 7) 5,396 - 5,396
Income taxes (Notes 2 and 8) (4,091) - (4,091)
Pension and postretirement activity other than net periodic
benefit cost (Notes 10 and 11) (206,688) - (206,688)
Change in net assets (94,558) (1,281) (95,839)
Net assets, beginning of year 1,282,379 3,206 1,285,585
Net assets, end of year 1,187,821$ 1,925$ 1,189,746$
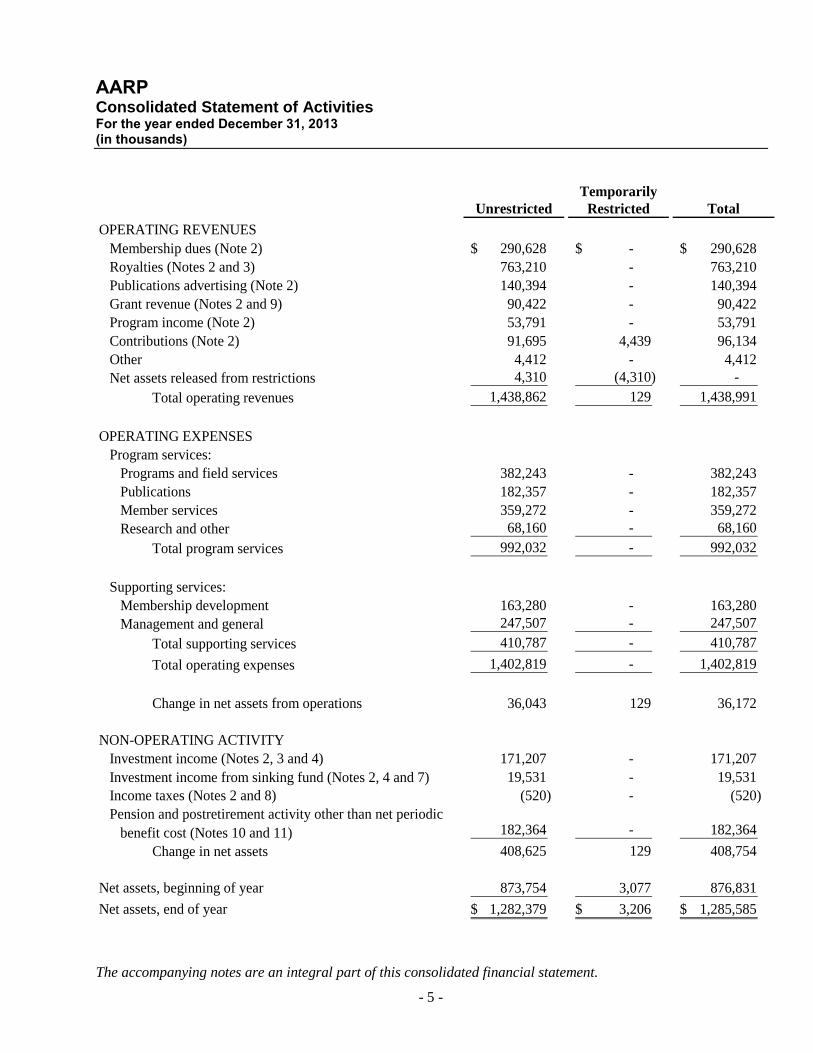
AARP Consolidated Statement of Activities For the year ended December 31, 2013 (in thousands)
The accompanying notes are an integral part of this consolidated financial statement.
- 5 -
Temporarily
Unrestricted Restricted Total
OPERATING REVENUES
Membership dues (Note 2) 290,628$ - $ 290,628$
Royalties (Notes 2 and 3) 763,210 - 763,210
Publications advertising (Note 2) 140,394 - 140,394
Grant revenue (Notes 2 and 9) 90,422 - 90,422
Program income (Note 2) 53,791 - 53,791
Contributions (Note 2) 91,695 4,439 96,134
Other 4,412 - 4,412
Net assets released from restrictions 4,310 (4,310) -
Total operating revenues 1,438,862 129 1,438,991
OPERATING EXPENSES
Program services:
Programs and field services 382,243 - 382,243
Publications 182,357 - 182,357
Member services 359,272 - 359,272
Research and other 68,160 - 68,160
Total program services 992,032 - 992,032
Supporting services:
Membership development 163,280 - 163,280
Management and general 247,507 - 247,507
Total supporting services 410,787 - 410,787
Total operating expenses 1,402,819 - 1,402,819
Change in net assets from operations 36,043 129 36,172
NON-OPERATING ACTIVITY
Investment income (Notes 2, 3 and 4) 171,207 - 171,207
Investment income from sinking fund (Notes 2, 4 and 7) 19,531 - 19,531
Income taxes (Notes 2 and 8) (520) - (520)
Pension and postretirement activity other than net periodic
benefit cost (Notes 10 and 11) 182,364 - 182,364
Change in net assets 408,625 129 408,754
Net assets, beginning of year 873,754 3,077 876,831
Net assets, end of year 1,282,379$ 3,206$ 1,285,585$
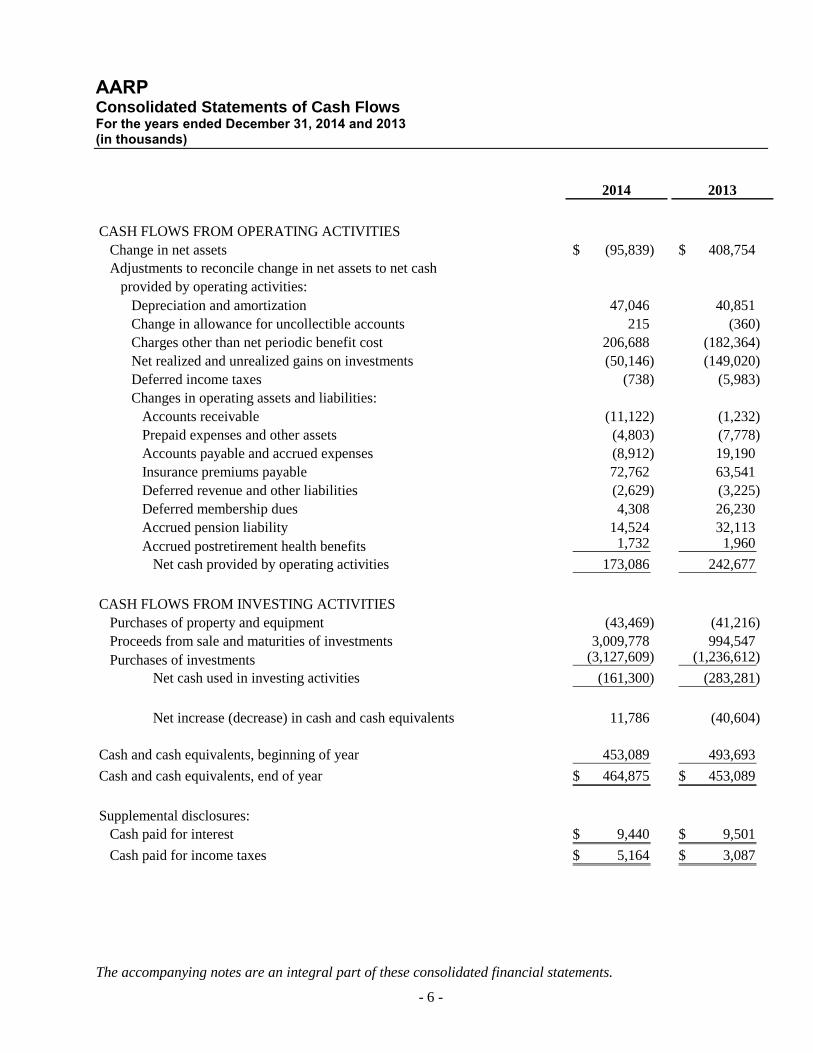
AARP Consolidated Statements of Cash Flows For the years ended December 31, 2014 and 2013 (in thousands)
The accompanying notes are an integral part of these consolidated financial statements.
- 6 -
2014 2013
CASH FLOWS FROM OPERATING ACTIVITIES
Change in net assets (95,839)$ 408,754$
Adjustments to reconcile change in net assets to net cash
provided by operating activities:
Depreciation and amortization 47,046 40,851
Change in allowance for uncollectible accounts 215 (360)
Charges other than net periodic benefit cost 206,688 (182,364)
Net realized and unrealized gains on investments (50,146) (149,020)
Deferred income taxes (738) (5,983)
Changes in operating assets and liabilities:
Accounts receivable (11,122) (1,232)
Prepaid expenses and other assets (4,803) (7,778)
Accounts payable and accrued expenses (8,912) 19,190
Insurance premiums payable 72,762 63,541
Deferred revenue and other liabilities (2,629) (3,225)
Deferred membership dues 4,308 26,230
Accrued pension liability 14,524 32,113
Accrued postretirement health benefits 1,732 1,960
Net cash provided by operating activities 173,086 242,677
CASH FLOWS FROM INVESTING ACTIVITIES
Purchases of property and equipment (43,469) (41,216)
Proceeds from sale and maturities of investments 3,009,778 994,547
Purchases of investments (3,127,609) (1,236,612)
Net cash used in investing activities (161,300) (283,281)
Net increase (decrease) in cash and cash equivalents 11,786 (40,604)
Cash and cash equivalents, beginning of year 453,089 493,693
Cash and cash equivalents, end of year 464,875$ 453,089$
Supplemental disclosures:
Cash paid for interest 9,440$ 9,501$
Cash paid for income taxes 5,164$ 3,087$
AARP Notes to Consolidated Financial Statements December 31, 2014 and 2013
- 7 -
1. DESCRIPTION OF ORGANIZATIONS AND ACTIVITIES
AARP, Inc.
AARP, Inc. was organized in 1958 as a District of Columbia not-for-profit corporation for the purpose of
promoting the interests of older persons. AARP, Inc. is qualified as a tax-exempt social welfare
organization under Section 501(c)(4) of the Internal Revenue Code (“IRC”). The mission of AARP, Inc. is
to meet the needs and promote the independence, dignity, and purpose of persons 50 and older. The
programs and activities of AARP, Inc. and its affiliates include education, advocacy, research, service
programs, other social welfare activities, and charitable programs serving the needs of older persons.
AARP, Inc.’s programs, activities and operations are managed and supported primarily from its National
Headquarters in Washington, D.C. AARP, Inc. and its affiliates also have offices in all fifty U.S. states,
Washington, D.C., Puerto Rico and the U.S. Virgin Islands, as well as a membership processing center
located in Lakewood, California, and a media sales office in New York City.
AARP Services, Inc.
AARP Services, Inc. (“AARP Services”) is a wholly owned taxable subsidiary of AARP, Inc., and was
incorporated in Delaware in 1998. AARP Services’ Board of Directors is composed of members appointed
by AARP, Inc.’s Board of Directors.
Pursuant to an agreement with AARP, Inc., AARP Services is responsible for providing quality control
services designed to ensure licensees of AARP’s intellectual property are using such property appropriately.
AARP Services also provides membership development, new product development, institutional
relationship services and other services designed to support AARP’s efforts to select, improve and expand
member benefits and services made available to AARP, Inc. members, and to improve the lives of the 50+
population. AARP Services receives fees from AARP, Inc. for performing these services. As part of the
aforementioned agreement, AARP, Inc. granted to AARP Services a no fee license to use the AARP
trademarks and service marks, to be used for specific, limited purposes under stringent terms and
conditions. AARP Services also receives third-party consulting fees for marketing development and other
services.
AARP Insurance Plan
The AARP Insurance Plan (the “Plan”), also referred to as the AARP Health Trust, is a grantor trust
established in 1958 by an Agreement and Declaration of Trust for the purpose of making group health
insurance and other health-related products and services available to AARP, Inc. members or for the
general benefit, good and welfare of AARP, Inc. Insurance premiums collected by the Plan are paid
directly by participants. At the direction of the third-party insurance carriers, certain agreed upon payments
are made for royalties payable to AARP, Inc. The Plan is administered by a Board of Trustees appointed by
the Board of Directors of AARP, Inc.
AARP Foundation and AARP Institute
AARP Foundation was organized in 1961 as a District of Columbia not-for-profit corporation. AARP
Foundation is dedicated to serving vulnerable people 50+ by creating solutions that help them secure the
essentials - food, housing, income and personal connection - and achieve their best life. AARP Foundation,
an AARP, Inc. affiliate, is a qualified nonprofit organization under Section 501(c) (3) of the IRC and is
therefore exempt from federal income taxes on its charitable operations. In addition, AARP Foundation is a
AARP Notes to Consolidated Financial Statements December 31, 2014 and 2013
- 8 -
public charity as defined in Section 509(a)(1) of the IRC. AARP Foundation receives funding principally
from the federal government, AARP, Inc., foundations, corporations and individuals. AARP Foundation’s
Board of Directors is composed of members appointed by AARP, Inc.’s Board of Directors.
AARP Institute (the “Institute”), an affiliate of AARP Foundation, was organized in 1963 as a District of
Columbia not-for-profit corporation. The Institute qualifies as a tax-exempt organization under Section
501(c)(3) of the IRC. AARP Foundation and the Institute are collectively referred to as the “Foundation”.
Legal Counsel for the Elderly
Legal Counsel for the Elderly (“LCE”) was incorporated in the District of Columbia in 1980 for the purpose
of providing free legal assistance and education to the elderly, primarily in the District of Columbia. LCE
publishes manuals, conducts seminars on issues affecting the elderly, and operates legal services and long-
term care ombudsman programs. LCE qualifies as a tax-exempt charitable organization under Section
501(c)(3) of the IRC. Funding for LCE is obtained primarily through contributions from AARP, Inc.,
government grants, foundations, corporations and individuals. LCE’s Board of Directors is comprised of
seven members appointed by AARP, Inc.’s Chief Executive Officer.
AARP Experience Corps
AARP Experience Corps (“EC”) was incorporated in the District of Columbia in 2008. EC is a not-for-
profit organization, qualified as tax-exempt under Section 501(c)(3) of the IRC, formed to engage
experienced adults in high-impact community service and leadership activities and to promote the
importance of the contributions these individuals make to their communities. These activities are funded
primarily through federal and nonfederal grants and contributions from AARP, Inc.
Other Affiliates
AARP Andrus Insurance Fund LLC, a single-member LLC with AARP, Inc. as its sole member, was
formed in 2007 to serve as a self-funding mechanism for the deductible portion of certain AARP, Inc. and
affiliates’ insurance coverage with third-party insurance carriers. In addition, various special purpose
taxable affiliated entities own and operate the AARP, Inc. headquarters building located in Washington,
D.C., the related parking garage facilities and a building in California. These properties are primarily
occupied by AARP, Inc. and its affiliates.
2. SUMMARY OF SIGNIFICANT ACCOUNTING POLICIES
Basis of Presentation
These consolidated financial statements are prepared on the accrual basis of accounting and include the
accounts of the entities listed in Note 1, collectively referred to as “AARP.”
All significant intercompany transactions have been eliminated in consolidation. These consolidated
financial statements do not include the operations and accounts of more than 1,200 local chapters of AARP
that are organized and operated as separate entities. AARP neither controls nor derives beneficial economic
interest from these organizations, as defined by U.S. generally accepted accounting principles.
AARP summarizes the costs of providing and managing its various programs and supporting activities on a
functional basis in the accompanying consolidated statements of activities. Accordingly, certain operating
costs are allocated among the benefiting program and supporting services, based on specific identification
or appropriate allocation methodologies.
AARP Notes to Consolidated Financial Statements December 31, 2014 and 2013
- 9 -
Net assets and changes in net assets are classified based on the existence or absence of donor-imposed
restrictions. Accordingly, net assets are classified and reported as follows:
Unrestricted - net assets that are not subject to donor-imposed stipulations including amounts
designated by the Board of Directors for specific purposes.
Temporarily restricted - net assets subject to donor-imposed stipulations that will be met by
actions of AARP and/or the passage of time.
Use of Estimates
The preparation of the consolidated financial statements in conformity with accounting principles generally
accepted in the United States of America requires management to make estimates and assumptions that
affect the reported amounts of assets and liabilities and changes therein, disclosure of contingent assets and
liabilities, and the reported amounts of revenues and expenses during the reporting period. Actual results
could differ from those estimates.
Cash and Cash Equivalents
Cash consists of cash on deposit with banks. Cash equivalents represent money market funds or short-term
investments with original maturities of three months or less from the date of purchase. As of December 31,
2014 and 2013, $327,000,000 and $311,000,000, respectively, were held by the AARP Insurance Plan for
the payment of member insurance premiums.
Concentrations of Credit Risk
Financial instruments that potentially subject AARP to concentrations of credit risk consist principally of
cash and cash equivalents and investments in U.S. treasury securities, fixed income funds, equity funds and
similar interests. AARP maintains its cash and cash equivalents in various bank accounts and money
market funds that, at times, may exceed federally insured limits. AARP’s cash and cash equivalent
accounts have been placed with high credit quality financial institutions. AARP has not experienced, nor
does it anticipate, any losses with respect to such accounts.
Accounts Receivable, net
AARP estimates uncollectible amounts based on the aging of outstanding accounts receivable and
management’s estimate of their net realizable values. Accounts are written-off when deemed uncollectible.
Investments
Investments are measured and reported at fair value. Changes in fair value are reported as investment
income/loss in the accompanying consolidated statement of activities.
The fair value of debt and equity securities with a readily determinable fair value is based on quotations
obtained from national security exchanges. The fair value of non-U.S. Treasury debt securities is
determined by a nationally recognized independent pricing service (pricing service).
Purchases and sales of securities are reflected on a trade-date basis. Gains and losses on sales of securities
are based on average cost and are recorded in the consolidated statement of activities in the period in which
the securities are sold. Dividends are accrued based on the ex-dividend date. Interest is recognized as
earned.
AARP Notes to Consolidated Financial Statements December 31, 2014 and 2013
- 10 -
Institutional mutual funds are carried at net asset values as provided by the investment managers as of the
reporting date. AARP management reviews and evaluates the values provided by the investment managers
and agrees with the valuation methods and assumptions used in determining their estimated fair value. Due
to the inherent uncertainties of these estimates, these values may differ from the values that would have
been reported had a ready market for such investments existed. In 2014 and 2013, these estimated fair
values represented approximately 55% and 51%, respectively, of total investments.
All investment securities are exposed to various risks such as interest rate, market, and credit risks. Due to
the level of risk associated with certain investment securities, it is at least reasonably possible that changes
in the values of investment securities will occur in the near term and such changes could materially affect
the amounts reported in the accompanying consolidated financial statements.
Property and Equipment, net
Property and equipment are stated at cost. Computer software is composed of external and certain
qualifying internal costs related to software development. Management periodically evaluates whether
events or circumstances have occurred indicating that the carrying amount of long-lived assets may not be
recovered. Depreciation and amortization are calculated using the straight-line method over the lesser of
the estimated useful lives of the assets or the lease term. The useful lives range from three to thirty years.
Maintenance and repair costs are expensed as incurred.
Membership Dues
Membership dues are deferred upon receipt and recognized as revenue ratably over the membership term of
one, two, three or five years.
Royalties
Royalties are received from AARP branded third-party providers of member benefit programs, in return for
the rights to use AARP’s intellectual property (including name, logo and mailing list) in offering programs.
These royalties are recognized as revenue as earned.
The service provider United Healthcare Corporation accounted for approximately 66% of total royalties
earned in 2014 and 2013.
Publications Advertising
AARP sells advertising space in its major publications, which are provided to members without additional
charge as part of their membership benefits. Advertising revenue is recognized as earned in the month of
each publication’s issue date.
Grant Revenues
The Foundation, LCE and EC report activities under grant agreements as exchange transactions.
Accordingly, grant-related revenue is recognized to the extent that allowable expenses are incurred under
program agreements. Amounts reported as grants receivable represent grant program expenses incurred in
advance of the receipt of funds. Funds received in advance of incurred grant program expenses are reported
as deferred revenue. Federal funds are only received by the Foundation, LCE and EC.
AARP Notes to Consolidated Financial Statements December 31, 2014 and 2013
- 11 -
Program Income
AARP receives service fees from providers of and participants in member programs, for consulting and
specific program services. These fees are recognized as earned.
Contributions and Fundraising Expense
AARP reports contributions as revenue when received or pledged by the donor. Contributions are reported
as temporarily restricted revenue if such gifts are restricted by the donor to a specific program and/or
include an explicit or implied time restriction.
Expirations of temporary restrictions on net assets (i.e. the donor-stipulated purpose has been fulfilled
and/or the stipulated time period has elapsed) are reported as net assets released from restrictions. Gifts
whose donor-stipulated purposes are met in the same year as received are reported as unrestricted revenue.
Contributions include cash received in support of both charitable and advocacy program activities.
Charitable contributions are only received by the Foundation, LCE and EC, while advocacy contributions
are received by AARP, Inc. Contributions also include in-kind contributed professional services with a fair
value totaling $23,834,000 and $25,206,000 for the years ended December 31, 2014 and 2013, respectively.
Fundraising expenses, which are reported as part of management and general expenses within the
accompanying consolidated statements of activities, totaled $27,936,000 and $27,546,000 for the years
ended December 31, 2014 and 2013, respectively.
Volunteer Services
AARP and its members benefit from the efforts of many volunteers. These in-kind contributions by
volunteers are not recorded as revenue in the consolidated financial statements because they do not meet the
requirements for recognition under U.S. generally accepted accounting principles.
Income Taxes
Income taxes are accounted for under the asset and liability method. Deferred tax assets and liabilities are
recognized for the future tax consequences attributable to the differences between the consolidated financial
statement carrying amounts of existing assets and liabilities and their respective tax bases and operating loss
and tax credit carry-forwards. Deferred tax assets and liabilities are measured using enacted rates expected
to apply to taxable income in the years in which those temporary differences are expected to be recovered
or settled. The effect on deferred tax assets and liabilities of a change in tax rates is recognized in other
income (expenses) in the period that includes the enactment date.
AARP does not believe that there are any unrecognized tax benefits/liabilities that should be recorded.
AARP follows guidance that clarifies the accounting for uncertainty in tax positions taken or expected to be
taken in a tax return, including issues relating to financial statement recognition and measurement. This
guidance provides that the tax effects from an uncertain tax position can only be recognized in the financial
statements if the position is “more-likely-than-not” to be sustained if the position were to be challenged by
a taxing authority. The assessment of the tax position is based solely on the technical merits of the position,
without regard to the likelihood that the tax position may be challenged.
AARP is exempt from income tax under IRC section 501(c)(4), though it is subject to tax on income
unrelated to its exempt purpose, unless that income is otherwise excluded by the Code. AARP has
AARP Notes to Consolidated Financial Statements December 31, 2014 and 2013
- 12 -
processes presently in place to ensure the maintenance of its tax-exempt status; to identify and report
unrelated income; to determine its filing and tax obligations in jurisdictions for which it was nexus; and to
identify and evaluate other matters that may be considered tax positions. The tax years ended
December 31, 2011, 2012, 2013 and 2014 are still open to audit for both federal and state purposes. AARP
has determined that there are no material uncertain tax positions that require recognition or disclosure in the
consolidated financial statements.
Measure of Operations
AARP reports as part of operations all activities except for any required provision for federal and state
income taxes, investment income, pension and post-retirement related changes other than net periodic
benefit cost, and other items which are unusual or nonrecurring in nature.
Advertising Expenses
AARP expenses advertising costs as incurred except to the extent of any direct response marketing costs
that qualify for capitalization. These costs include brand awareness, member acquisition and retention,
member program marketing, and advocacy advertising. For the years ended December 31, 2014 and 2013,
advertising expense totaled $274,171,000 and $219,454,000, respectively, and no costs were capitalized.
Fair Value Measurements
Fair value is defined as the exchange price that would be received to sell an asset or paid to transfer a
liability in the principal or most advantageous market for the asset or liability in an orderly transaction
between market participants on the measurement date. Fair value should be based on the assumptions
market participants would use when pricing an asset or liability and a fair value hierarchy that prioritizes
the information used to develop those assumptions. The fair value hierarchy gives the highest priority to
quoted prices in active markets (observable inputs) and the lowest priority to an entity’s assumptions
(unobservable inputs). AARP groups assets and liabilities at fair value in three levels, based on the markets
in which the assets and liabilities are traded and the reliability of the assumptions used to determine fair
value. These levels are:
Level 1 - Unadjusted quoted market prices for identical assets or liabilities in active markets.
Level 2 - Other observable inputs, either directly or indirectly, including:
Quoted prices for similar assets/liabilities in active markets;
Quoted prices for identical or similar assets in nonactive markets;
Inputs other than quoted prices that are observable for the asset/liability;
Inputs that are derived principally from or corroborated by other observable market data;
Investments using a net asset value (NAV) per share, or its equivalent, that may be
redeemed at NAV at the consolidated statement of financial position date or in the near
term, which AARP has determined to be within ninety days.
Level 3 - Unobservable inputs that cannot be corroborated by observable market data.
At December 31, 2014 and 2013, the carrying value of financial instruments such as cash equivalents,
accounts receivable, accounts payable and variable rate debt approximates their fair value, based on the
short-term maturities or floating interest rates of these instruments. The fair values of investments, notes
payable and fixed rate debt.
AARP Notes to Consolidated Financial Statements December 31, 2014 and 2013
- 13 -
Reclassifications
Certain information in the fiscal 2013 consolidated financial statements has been reclassified to conform to
the fiscal 2014 presentation. There were no changes in total assets, liabilities, revenues, expenses or
changes in net assets as reflected in the fiscal 2013 consolidated financial statements.
3. GRANTOR TRUST
AARP established a grantor trust for the purpose of making group health insurance and other health-related
products and services available to AARP, Inc. members or for the general benefit, good and welfare of
AARP. Agreements between AARP, Inc., AARP Services, United HealthCare Corporation (“United”),
Metropolitan Life Insurance Company (“MetLife”), Genworth Life Insurance Company (“Genworth”), and
Aetna Life Insurance Company (“Aetna”) make certain types of insurance available to AARP, Inc.
members.
The Plan, a grantor trust, holds group policies, and maintains depository accounts to initially collect
insurance premiums received from participating members. In accordance with the agreements referenced
above, collections are remitted to third-party insurance carriers within contractually specified periods of
time, net of the contractual royalty payments that are due to AARP, Inc., which are reported as royalties in
the accompanying consolidated statement of activities. AARP derived 54% and 53% of total royalties from
the Plan for the years ended December 31, 2014 and 2013, respectively. Billing of insurance premiums and
issuance of certificates of insurance to insured members is the responsibility of the third-party insurance
carrier. The collection of premiums and submission of amounts due to the insurance carrier are classified as
agency transactions and, as such, are not recorded as either revenue or expenses in the accompanying
consolidated statement of activities. For the years ended December 31, 2014 and 2013, the Plan processed
$9.0 and $8.4 billion, respectively, of premium payments from member participants.
The premiums are collected from insured members and are subsequently remitted to the third-party
insurance carriers, and are invested and recorded as an offsetting liability, insurance premiums payable in
the accompanying consolidated statements of financial position. For the years ended December 31, 2014
and 2013, the Plan earned net investment income of $26,522,000 and $42,677,000, respectively, which is
included in investment income in the accompanying consolidated statements of activities.
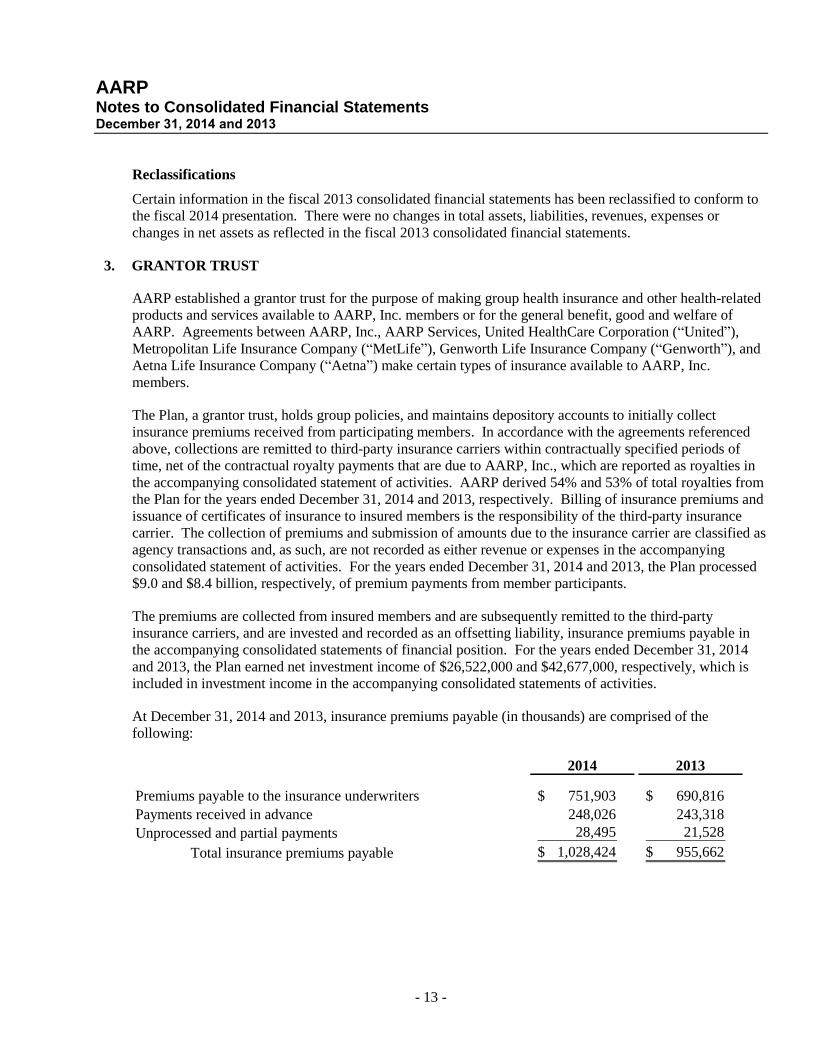
At December 31, 2014 and 2013, insurance premiums payable (in thousands) are comprised of the
following:
2014 2013
Premiums payable to the insurance underwriters 751,903$ 690,816$
Payments received in advance 248,026 243,318
Unprocessed and partial payments 28,495 21,528
Total insurance premiums payable 1,028,424$ 955,662$
AARP Notes to Consolidated Financial Statements December 31, 2014 and 2013
- 14 -
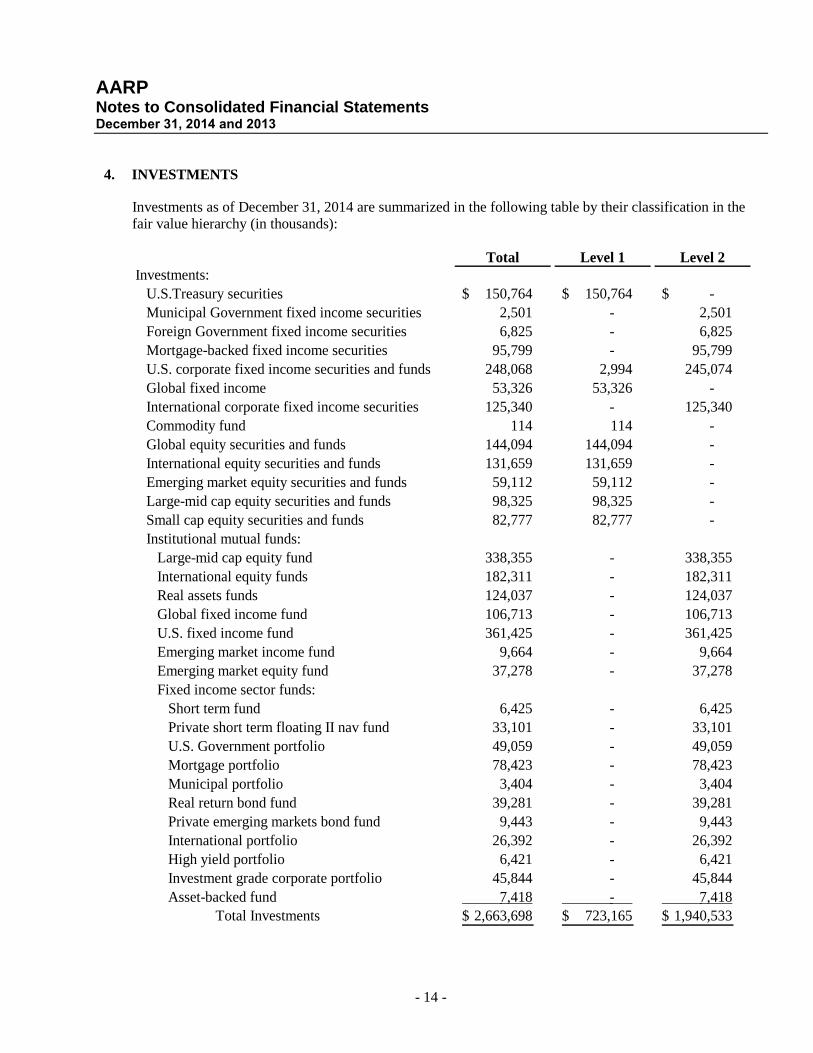
4. INVESTMENTS
Investments as of December 31, 2014 are summarized in the following table by their classification in the
fair value hierarchy (in thousands):
Total Level 1 Level 2
Investments:
U.S.Treasury securities 150,764$ 150,764$ - $
Municipal Government fixed income securities 2,501 - 2,501
Foreign Government fixed income securities 6,825 - 6,825
Mortgage-backed fixed income securities 95,799 - 95,799
U.S. corporate fixed income securities and funds 248,068 2,994 245,074
Global fixed income 53,326 53,326 -
International corporate fixed income securities 125,340 - 125,340
Commodity fund 114 114 -
Global equity securities and funds 144,094 144,094 -
International equity securities and funds 131,659 131,659 -
Emerging market equity securities and funds 59,112 59,112 -
Large-mid cap equity securities and funds 98,325 98,325 -
Small cap equity securities and funds 82,777 82,777 -
Institutional mutual funds:
Large-mid cap equity fund 338,355 - 338,355
International equity funds 182,311 - 182,311
Real assets funds 124,037 - 124,037
Global fixed income fund 106,713 - 106,713
U.S. fixed income fund 361,425 - 361,425
Emerging market income fund 9,664 - 9,664
Emerging market equity fund 37,278 - 37,278
Fixed income sector funds:
Short term fund 6,425 - 6,425
Private short term floating II nav fund 33,101 - 33,101
U.S. Government portfolio 49,059 - 49,059
Mortgage portfolio 78,423 - 78,423
Municipal portfolio 3,404 - 3,404
Real return bond fund 39,281 - 39,281
Private emerging markets bond fund 9,443 - 9,443
International portfolio 26,392 - 26,392
High yield portfolio 6,421 - 6,421
Investment grade corporate portfolio 45,844 - 45,844
Asset-backed fund 7,418 - 7,418
Total Investments 2,663,698$ 723,165$ 1,940,533$
AARP Notes to Consolidated Financial Statements December 31, 2014 and 2013
- 15 -
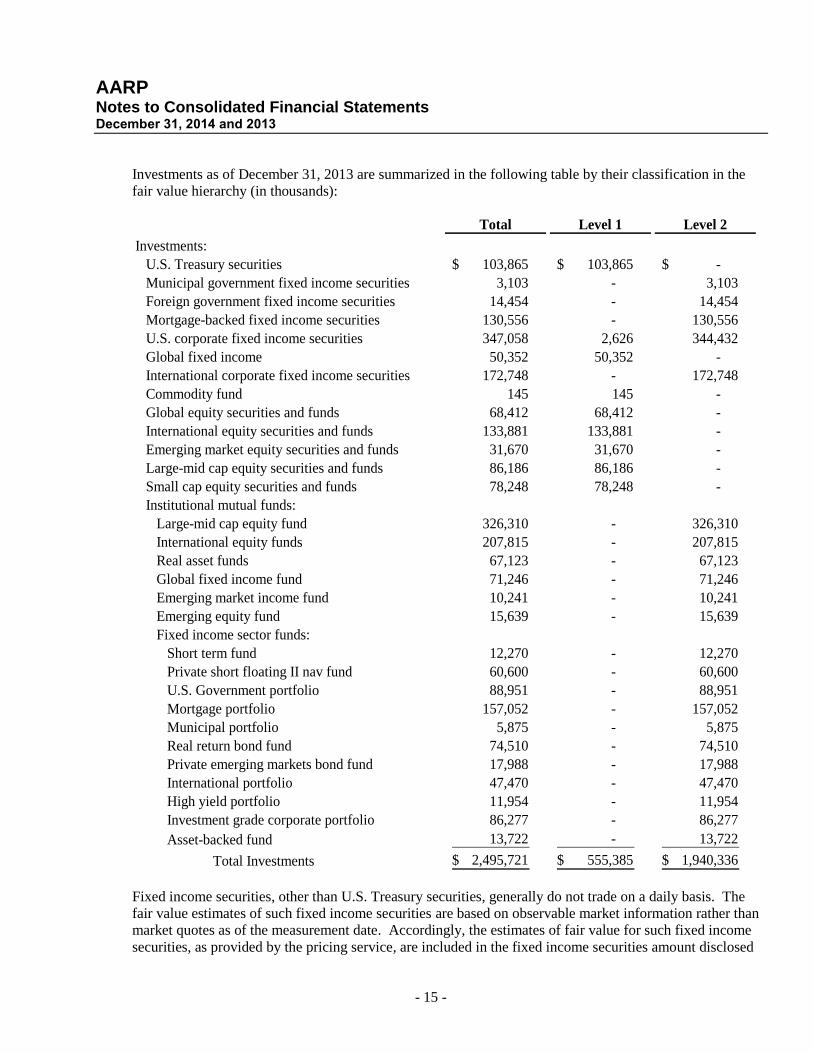
Investments as of December 31, 2013 are summarized in the following table by their classification in the
fair value hierarchy (in thousands):
Total Level 1 Level 2
Investments:
U.S. Treasury securities 103,865$ 103,865$ - $
Municipal government fixed income securities 3,103 - 3,103
Foreign government fixed income securities 14,454 - 14,454
Mortgage-backed fixed income securities 130,556 - 130,556
U.S. corporate fixed income securities 347,058 2,626 344,432
Global fixed income 50,352 50,352 -
International corporate fixed income securities 172,748 - 172,748
Commodity fund 145 145 -
Global equity securities and funds 68,412 68,412 -
International equity securities and funds 133,881 133,881 -
Emerging market equity securities and funds 31,670 31,670 -
Large-mid cap equity securities and funds 86,186 86,186 -
Small cap equity securities and funds 78,248 78,248 -
Institutional mutual funds:
Large-mid cap equity fund 326,310 - 326,310
International equity funds 207,815 - 207,815
Real asset funds 67,123 - 67,123
Global fixed income fund 71,246 - 71,246
Emerging market income fund 10,241 - 10,241
Emerging equity fund 15,639 - 15,639
Fixed income sector funds:
Short term fund 12,270 - 12,270
Private short floating II nav fund 60,600 - 60,600
U.S. Government portfolio 88,951 - 88,951
Mortgage portfolio 157,052 - 157,052
Municipal portfolio 5,875 - 5,875
Real return bond fund 74,510 - 74,510
Private emerging markets bond fund 17,988 - 17,988
International portfolio 47,470 - 47,470
High yield portfolio 11,954 - 11,954
Investment grade corporate portfolio 86,277 - 86,277
Asset-backed fund 13,722 - 13,722
Total Investments 2,495,721$ 555,385$ 1,940,336$
Fixed income securities, other than U.S. Treasury securities, generally do not trade on a daily basis. The
fair value estimates of such fixed income securities are based on observable market information rather than
market quotes as of the measurement date. Accordingly, the estimates of fair value for such fixed income
securities, as provided by the pricing service, are included in the fixed income securities amount disclosed
AARP Notes to Consolidated Financial Statements December 31, 2014 and 2013
- 16 -
in Level 2 of the hierarchy. The values of U.S. Treasury securities are disclosed in Level 1 of the hierarchy,
based on unadjusted market prices as of the measurement date.
AARP’s equity securities trade on a major exchange. Accordingly, such equity securities are disclosed in
Level 1 of the hierarchy.
AARP invests in several institutional mutual funds. These funds are not available to retail investors and are
not publicly traded. However, the underlying investments in these funds are publicly traded. The fair value
estimates of such institutional mutual funds are based on net asset value (NAV) as provided by the
respective investment manager. Because AARP has the ability to redeem its interest in these investments in
the near term, such investments are classified as Level 2 of the hierarchy.
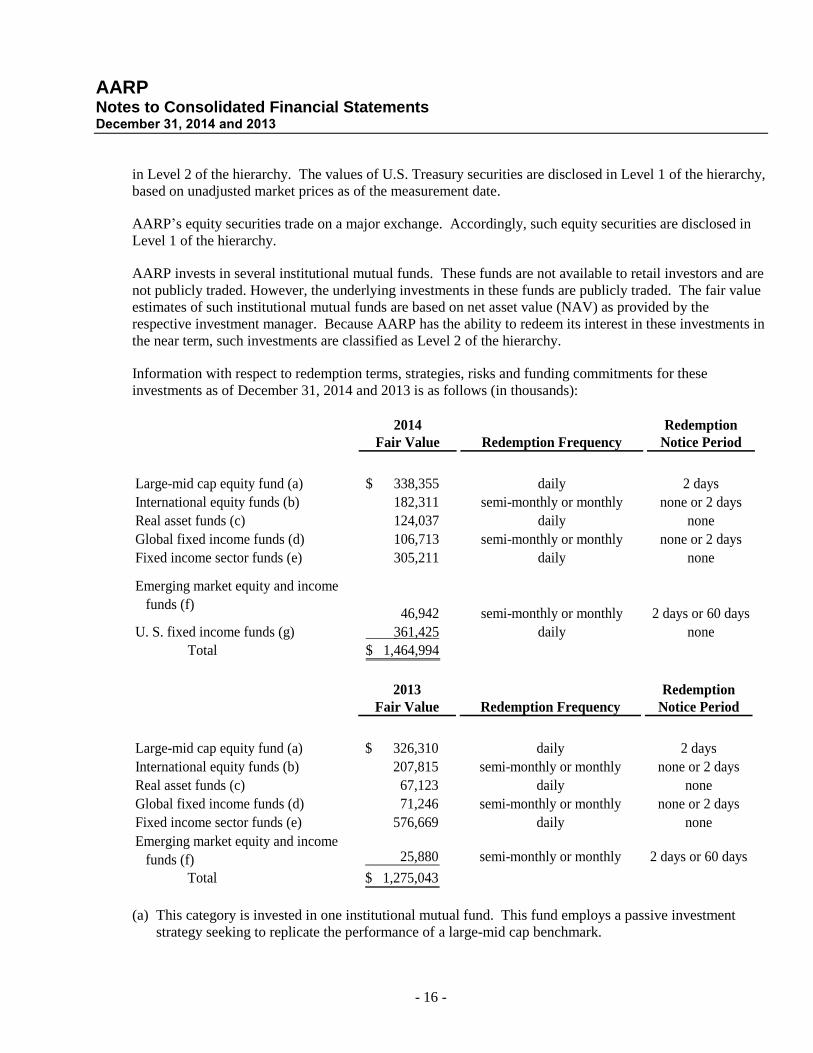
Information with respect to redemption terms, strategies, risks and funding commitments for these
investments as of December 31, 2014 and 2013 is as follows (in thousands):
2014 Redemption
Fair Value Redemption Frequency Notice Period
Large-mid cap equity fund (a) 338,355$ daily 2 days
International equity funds (b) 182,311 semi-monthly or monthly none or 2 days
Real asset funds (c) 124,037 daily none
Global fixed income funds (d) 106,713 semi-monthly or monthly none or 2 days
Fixed income sector funds (e) 305,211 daily none
Emerging market equity and income
funds (f) 46,942 semi-monthly or monthly 2 days or 60 days
U. S. fixed income funds (g) 361,425 daily none
Total 1,464,994$
2013 Redemption
Fair Value Redemption Frequency Notice Period
Large-mid cap equity fund (a) 326,310$ daily 2 days
International equity funds (b) 207,815 semi-monthly or monthly none or 2 days
Real asset funds (c) 67,123 daily none
Global fixed income funds (d) 71,246 semi-monthly or monthly none or 2 days
Fixed income sector funds (e) 576,669 daily none
Emerging market equity and income
funds (f) 25,880 semi-monthly or monthly 2 days or 60 days
Total 1,275,043$
(a) This category is invested in one institutional mutual fund. This fund employs a passive investment
strategy seeking to replicate the performance of a large-mid cap benchmark.
AARP Notes to Consolidated Financial Statements December 31, 2014 and 2013
- 17 -
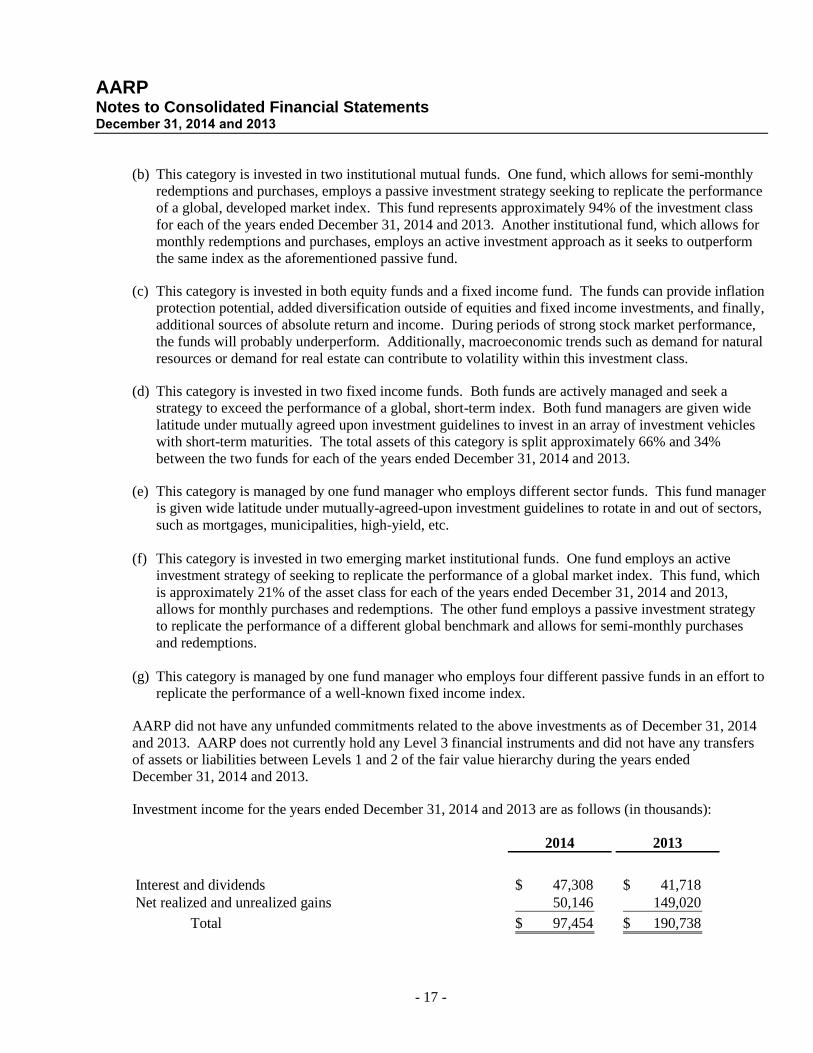
(b) This category is invested in two institutional mutual funds. One fund, which allows for semi-monthly
redemptions and purchases, employs a passive investment strategy seeking to replicate the performance
of a global, developed market index. This fund represents approximately 94% of the investment class
for each of the years ended December 31, 2014 and 2013. Another institutional fund, which allows for
monthly redemptions and purchases, employs an active investment approach as it seeks to outperform
the same index as the aforementioned passive fund.
(c) This category is invested in both equity funds and a fixed income fund. The funds can provide inflation
protection potential, added diversification outside of equities and fixed income investments, and finally,
additional sources of absolute return and income. During periods of strong stock market performance,
the funds will probably underperform. Additionally, macroeconomic trends such as demand for natural
resources or demand for real estate can contribute to volatility within this investment class.
(d) This category is invested in two fixed income funds. Both funds are actively managed and seek a
strategy to exceed the performance of a global, short-term index. Both fund managers are given wide
latitude under mutually agreed upon investment guidelines to invest in an array of investment vehicles
with short-term maturities. The total assets of this category is split approximately 66% and 34%
between the two funds for each of the years ended December 31, 2014 and 2013.
(e) This category is managed by one fund manager who employs different sector funds. This fund manager
is given wide latitude under mutually-agreed-upon investment guidelines to rotate in and out of sectors,
such as mortgages, municipalities, high-yield, etc.
(f) This category is invested in two emerging market institutional funds. One fund employs an active
investment strategy of seeking to replicate the performance of a global market index. This fund, which
is approximately 21% of the asset class for each of the years ended December 31, 2014 and 2013,
allows for monthly purchases and redemptions. The other fund employs a passive investment strategy
to replicate the performance of a different global benchmark and allows for semi-monthly purchases
and redemptions.
(g) This category is managed by one fund manager who employs four different passive funds in an effort to
replicate the performance of a well-known fixed income index.
AARP did not have any unfunded commitments related to the above investments as of December 31, 2014
and 2013. AARP does not currently hold any Level 3 financial instruments and did not have any transfers
of assets or liabilities between Levels 1 and 2 of the fair value hierarchy during the years ended
December 31, 2014 and 2013.
Investment income for the years ended December 31, 2014 and 2013 are as follows (in thousands):
2014 2013
Interest and dividends 47,308$ 41,718$
Net realized and unrealized gains 50,146 149,020
Total 97,454$ 190,738$

AARP Notes to Consolidated Financial Statements December 31, 2014 and 2013
- 18 -
Investment income, as reported on the consolidated statements of activities, are as follows (in thousands):
2014 2013
Investment income 92,058$ 171,207$
Investment gain - sinking fund 5,396 19,531
Total 97,454$ 190,738$
As of December 31, 2014 and 2013, $706,000,000 and $664,000,000 of consolidated investments,
respectively, are held by the AARP Insurance Plan for the payment of member insurance premiums.
5. ACCOUNTS RECEIVABLE, NET
Accounts receivable, net, as of December 31 are as follows (in thousands):
2014 2013
Royalties 59,464$ 47,199$
Program fees 1,692 2,593
Publication advertising 13,133 11,926
Interest and dividends 1,693 2,800
Grants 8,349 9,848
Other 7,465 6,739
Accounts receivable, gross 91,796 81,105
Less: Allowance for doubtful accounts (191) (407)
Accounts receivable, net 91,605$ 80,698$
6. PROPERTY AND EQUIPMENT, NET
Property and equipment, net, as of December 31 are as follows (in thousands):
2014 2013
Land 53,023$ 53,023$
Buildings and improvements 255,232 252,243
Furniture and equipment 96,694 89,310
Computer software 208,834 200,564
Leasehold improvements 9,382 9,026
623,165 604,166
Less: accumulated depreciation and amortization (312,970) (290,489)
Property and equipment, net 310,195$ 313,677$

AARP Notes to Consolidated Financial Statements December 31, 2014 and 2013
- 19 -
7. NOTES PAYABLE
The carrying amounts of notes payable and other long-term debt as of December 31 are as follows (in
thousands):
2014 2013
Fixed rate notes, maturing May 2031, net of discount
of $805 in 2014 and $830 in 2013 (a) 124,195$ 124,170$
Variable rate notes, maturing May 2031 (b) 50,000 50,000
District of Columbia Variable Rate Revenue Bonds,
maturing October 2034 (c) 25,000 25,000
Total notes payable 199,195$ 199,170$
The maturity dates of notes payable are as follows (in thousands):
2031 175,000$ 2034 25,000
200,000$
Total interest expense for the years ended December 31, 2014 and 2013 totaled $9,463,000 and $9,517,000,
respectively.
(a) Fixed Rate Notes
On May 1, 2001, AARP, Inc. issued unsecured fixed rate notes in the aggregate amount of $125,000,000
for permanent financing of the AARP, Inc. Headquarters Building which bear interest at 7.5%. Interest is
payable semi-annually. Based on the borrowing rates currently available to AARP for fixed rate bonds with
similar terms and average maturities, the fair value of the $125,000,000 fixed rate debentures is
approximately $179,979,000 and $165,671,000 as of December 31, 2014 and 2013, respectively.
(b) Variable Rate Notes
On May 1, 2001, AARP, Inc. issued unsecured variable rate notes in the amount of $75,000,000, for
permanent financing of the AARP, Inc. Headquarters Building. The variable rates were 0.08% and 0.12%
at December 31, 2014 and 2013, respectively. Interest is payable monthly. On December 1, 2004, AARP
made debt repayments of $25,000,000 on the unsecured variable notes.
(c) District of Columbia Variable Rate Revenue Bonds
On October 21, 2004, the Foundation issued 30 year District of Columbia Variable Rate Revenue Bonds
Series 2004 in the amount of $25,000,000 to finance the purchase of two office space located within the
AARP, Inc. Headquarters Building. The bonds bear interest at a variable rate determined by the
Remarketing Agent, based upon market conditions of reselling the bonds in a secondary market sale.
Accrued interest is payable monthly. The Foundation may elect at any time to convert to a fixed interest
rate. As of December 31, 2014 and 2013, the notes had an interest rate of 0.06% and 0.05%, respectively.

AARP Notes to Consolidated Financial Statements December 31, 2014 and 2013
- 20 -
The Foundation has obtained a letter of credit to secure repayment of the bonds financing of its office
space. The letter of credit constitutes an irrevocable obligation to pay the bond trustee up to an amount
equal to the sum of the principal amount of the bonds outstanding, plus an amount equal to interest for
35 days on the principal amount of each bond outstanding. The Foundation’s letter of credit expires
October 21, 2015.
Revolving Credit Facility
On July 17, 2009, AARP, Inc. entered into an unsecured revolving credit facility with a maximum principal
amount of $50,000,000 from a commercial bank. Borrowings under the credit facility can take the form of
a base rate loan, money market loan or a LIBOR rate loan. The base rate loan is charged interest at a
commercial floating rate which is the higher of (a) the 30-day LIBOR Rate plus 2.50%, and (b) the Prime
Rate, in the case of the Prime Rate, as in effect for such day, such rate to change as and when such Prime
Rate changes. The money market loan is charged a rate of interest as offered by the lender from time to
time for any single commercial borrowing for such periods as the lender, at its discretion, may make
available. The LIBOR rate loan is charged interest at a floating LIBOR rate plus 50 basis points. AARP
did not draw any funds from this credit facility in 2014 or 2013. The credit facility expires on July 15,
2016.
Board Designated Sinking Fund
In 2001, the AARP Board of Directors authorized the creation and funding of a Sinking Fund for the
purpose of repayment of outstanding notes payable (Note 14). The designated minimum funding is
$3,600,000 per year, to be transferred on or about January 1 of each year. The balance in the Sinking Fund
as of December 31, 2014 and 2013 totaled $132,645,000 and $123,649,000, respectively, and the Sinking
Fund assets were included in investments in the accompanying consolidated statements of financial
position. The Sinking Fund investments had net investment gains of $5,396,000 and $19,531,000 for the
years ended December 31, 2014 and 2013, respectively.
8. INCOME TAXES
The significant components of the provision for income taxes are as follows for the years ended
December 31, 2014 and 2013 (in thousands):
2014 2013
Current:
Federal income tax 4,781$ 4,635$
State income tax 641 1,868
Current income tax expense 5,422 6,503
Deferred:
Federal income tax (2,143) (4,129)
State income tax 812 (1,854)
Deferred income tax (benefit) expense (1,331) (5,983)
Total income tax expense 4,091$ 520$
AARP Notes to Consolidated Financial Statements December 31, 2014 and 2013
- 21 -
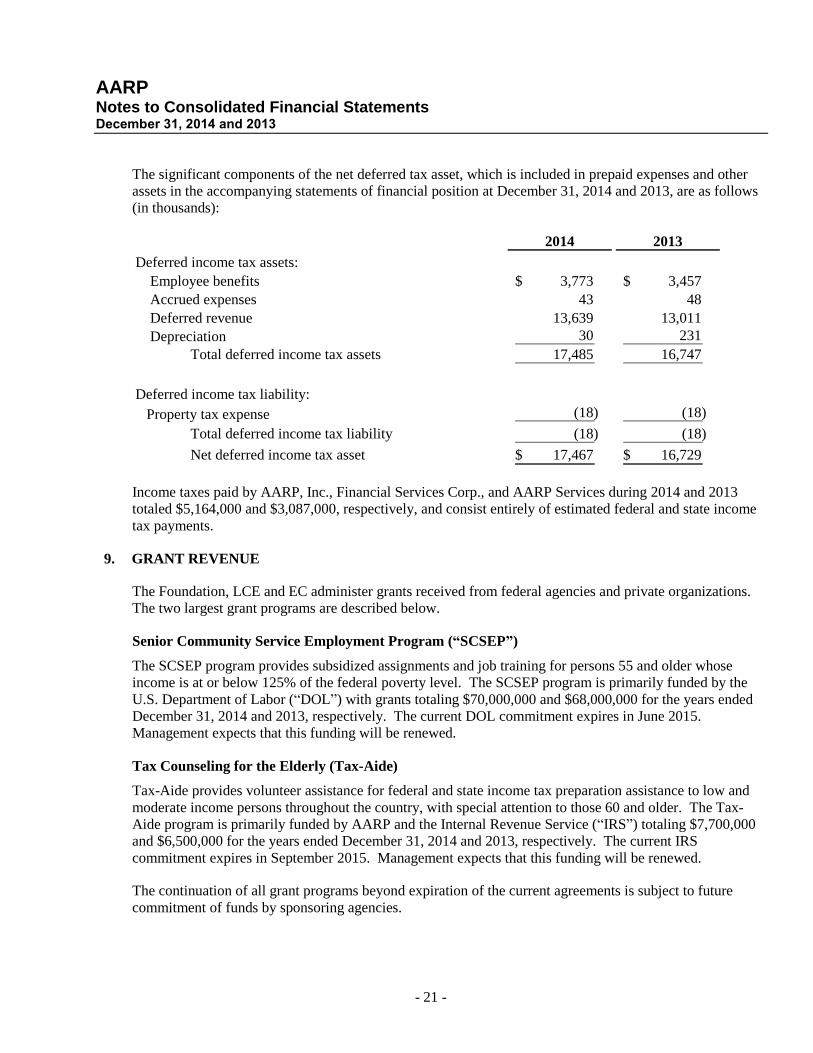
The significant components of the net deferred tax asset, which is included in prepaid expenses and other
assets in the accompanying statements of financial position at December 31, 2014 and 2013, are as follows
(in thousands):
2014 2013
Deferred income tax assets:
Employee benefits 3,773$ 3,457$
Accrued expenses 43 48
Deferred revenue 13,639 13,011
Depreciation 30 231
Total deferred income tax assets 17,485 16,747
Deferred income tax liability:
Property tax expense (18) (18)
Total deferred income tax liability (18) (18)
Net deferred income tax asset 17,467$ 16,729$
Income taxes paid by AARP, Inc., Financial Services Corp., and AARP Services during 2014 and 2013
totaled $5,164,000 and $3,087,000, respectively, and consist entirely of estimated federal and state income
tax payments.
9. GRANT REVENUE
The Foundation, LCE and EC administer grants received from federal agencies and private organizations.
The two largest grant programs are described below.
Senior Community Service Employment Program (“SCSEP”)
The SCSEP program provides subsidized assignments and job training for persons 55 and older whose
income is at or below 125% of the federal poverty level. The SCSEP program is primarily funded by the
U.S. Department of Labor (“DOL”) with grants totaling $70,000,000 and $68,000,000 for the years ended
December 31, 2014 and 2013, respectively. The current DOL commitment expires in June 2015.
Management expects that this funding will be renewed.
Tax Counseling for the Elderly (Tax-Aide)
Tax-Aide provides volunteer assistance for federal and state income tax preparation assistance to low and
moderate income persons throughout the country, with special attention to those 60 and older. The Tax-
Aide program is primarily funded by AARP and the Internal Revenue Service (“IRS”) totaling $7,700,000
and $6,500,000 for the years ended December 31, 2014 and 2013, respectively. The current IRS
commitment expires in September 2015. Management expects that this funding will be renewed.
The continuation of all grant programs beyond expiration of the current agreements is subject to future
commitment of funds by sponsoring agencies.
AARP Notes to Consolidated Financial Statements December 31, 2014 and 2013
- 22 -
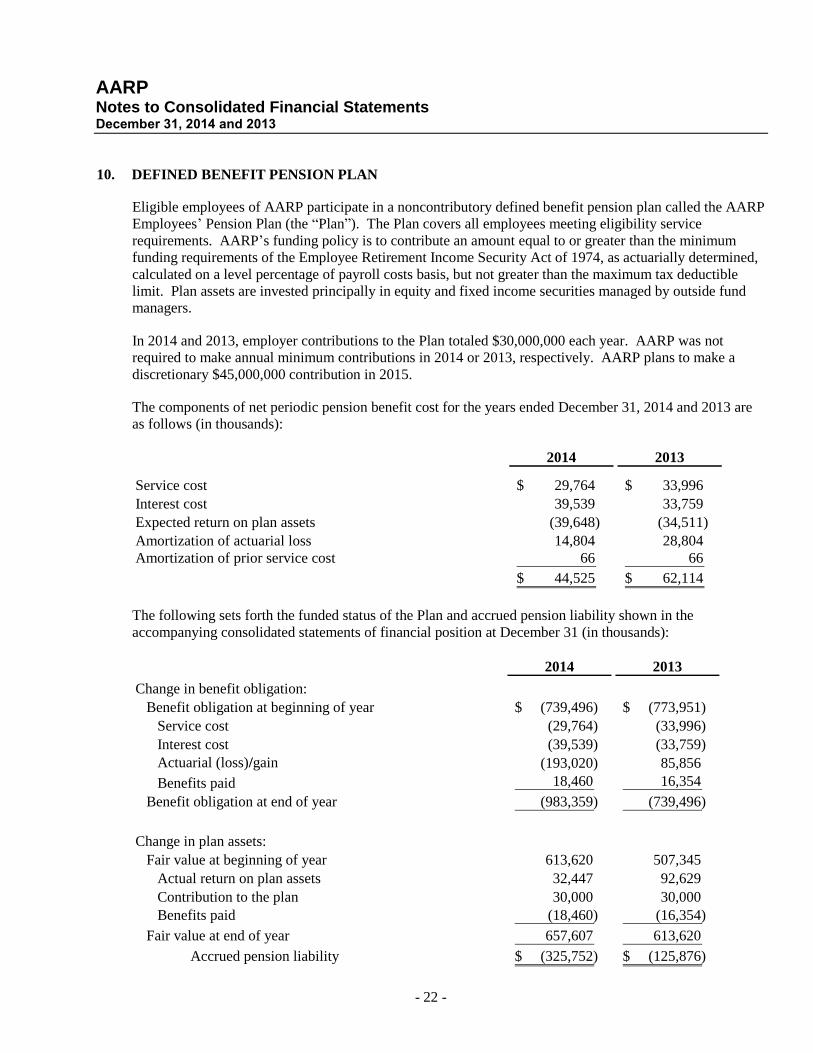
10. DEFINED BENEFIT PENSION PLAN
Eligible employees of AARP participate in a noncontributory defined benefit pension plan called the AARP
Employees’ Pension Plan (the “Plan”). The Plan covers all employees meeting eligibility service
requirements. AARP’s funding policy is to contribute an amount equal to or greater than the minimum
funding requirements of the Employee Retirement Income Security Act of 1974, as actuarially determined,
calculated on a level percentage of payroll costs basis, but not greater than the maximum tax deductible
limit. Plan assets are invested principally in equity and fixed income securities managed by outside fund
managers.
In 2014 and 2013, employer contributions to the Plan totaled $30,000,000 each year. AARP was not
required to make annual minimum contributions in 2014 or 2013, respectively. AARP plans to make a
discretionary $45,000,000 contribution in 2015.
The components of net periodic pension benefit cost for the years ended December 31, 2014 and 2013 are
as follows (in thousands):
2014 2013
Service cost 29,764$ 33,996$
Interest cost 39,539 33,759
Expected return on plan assets (39,648) (34,511)
Amortization of actuarial loss 14,804 28,804
Amortization of prior service cost 66 66
44,525$ 62,114$
The following sets forth the funded status of the Plan and accrued pension liability shown in the
accompanying consolidated statements of financial position at December 31 (in thousands):
2014 2013
Change in benefit obligation:
Benefit obligation at beginning of year (739,496)$ (773,951)$
Service cost (29,764) (33,996)
Interest cost (39,539) (33,759)
Actuarial (loss)/gain (193,020) 85,856
Benefits paid 18,460 16,354
Benefit obligation at end of year (983,359) (739,496)
Change in plan assets:
Fair value at beginning of year 613,620 507,345
Actual return on plan assets 32,447 92,629
Contribution to the plan 30,000 30,000
Benefits paid (18,460) (16,354)
Fair value at end of year 657,607 613,620
Accrued pension liability (325,752)$ (125,876)$
AARP Notes to Consolidated Financial Statements December 31, 2014 and 2013
- 23 -
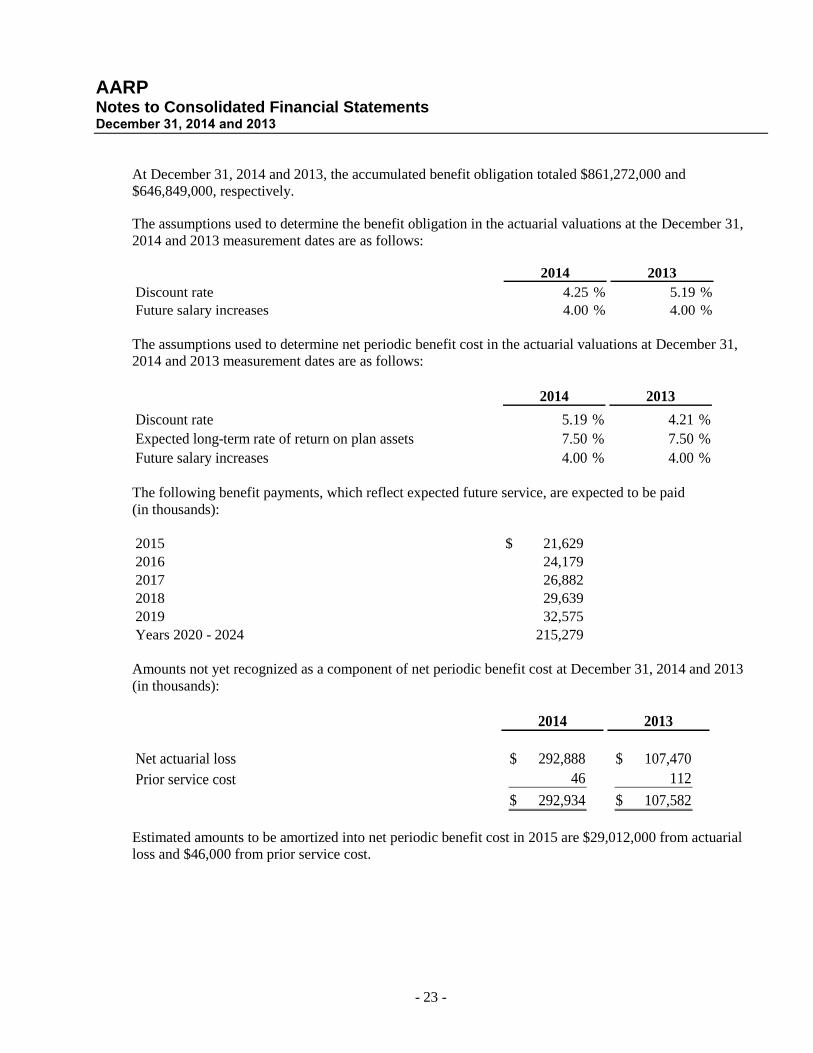
At December 31, 2014 and 2013, the accumulated benefit obligation totaled $861,272,000 and
$646,849,000, respectively.
The assumptions used to determine the benefit obligation in the actuarial valuations at the December 31,
2014 and 2013 measurement dates are as follows:
2014 2013
Discount rate 4.25 % 5.19 %
Future salary increases 4.00 % 4.00 %
The assumptions used to determine net periodic benefit cost in the actuarial valuations at December 31,
2014 and 2013 measurement dates are as follows:
2014 2013
Discount rate 5.19 % 4.21 %
Expected long-term rate of return on plan assets 7.50 % 7.50 %
Future salary increases 4.00 % 4.00 %
The following benefit payments, which reflect expected future service, are expected to be paid
(in thousands):
2015 21,629$
2016 24,179
2017 26,882
2018 29,639
2019 32,575
Years 2020 - 2024 215,279
Amounts not yet recognized as a component of net periodic benefit cost at December 31, 2014 and 2013
(in thousands):
2014 2013
Net actuarial loss 292,888$ 107,470$
Prior service cost 46 112
292,934$ 107,582$
Estimated amounts to be amortized into net periodic benefit cost in 2015 are $29,012,000 from actuarial
loss and $46,000 from prior service cost.

AARP Notes to Consolidated Financial Statements December 31, 2014 and 2013
- 24 -
In order to determine an appropriate return on plan assets, AARP considers its current asset allocation along
with historical and expected returns that can be achieved with the various asset types in the Plan.
Management believes that the current asset allocation justifies an expected long-term rate of return on plan
assets of 7.5%.
The weighted average asset allocation for plan assets is as follows at December 31, 2014 and 2013:
2014 2013
Asset categories:
Equity securities 60 % 64 %
Debt securities 35 % 31 %
Alternatives 4 % 4 %
Cash equivalents 1 % 1 %
100 % 100 %
The targeted allocation of the investment assets in the Plan is for equities to comprise 60% of the
investment portfolio, debt securities to comprise 35%, and alternatives to comprise the remaining 5%.
These targets are not intended to serve as a rigid constraint on the investment allocation. The following
chart sets forth the minimum and maximum positions for the various asset classes in the Plan:
Minimum Target Maximum
Asset class:
Equity securities 50 % 60 % 70 %
Debt securities 30 % 35 % 40 %
Alternatives 0 % 5 % 10 %
Cash equivalents 0 % 0 % 0 %

AARP Notes to Consolidated Financial Statements December 31, 2014 and 2013
- 25 -
As of December 31, 2014 and 2013, the fair value of AARP’s pension plan assets by asset category within
the fair value hierarchy is as follows (in thousands):
2014
Total Level 1 Level 2
Cash and cash equivalents 5,516$ 5,516$ - $
Common stocks 246,886 246,886 -
Preferred stocks 198 198 -
U.S. Treasury securities 1,202 1,202 -
Corporate fixed income securities 2,079 - 2,079
Various fixed income funds 107,586 107,586 -
Institutional mutual funds:
Real asset funds 31,344 - 31,344
Large cap fund 104,283 - 104,283
Mid cap fund 5,916 - 5,916
Emerging market equity funds 23,666 - 23,666
International equity fund 11,065 - 11,065
Global fixed income fund 40,323 - 40,323
Fixed income sector funds: -
Asset-backed securities portfolio 1,881 - 1,881
Emerging markets portfolio 2,406 - 2,406
High yield portfolio 1,635 - 1,635
International portfolio 6,709 - 6,709
Investment grade corporation portfolio 11,716 - 11,716
Mortgage portfolio 20,060 - 20,060
Municipal sector portfolio 866 - 866
Various short-term portfolios 9,623 - 9,623
Real return portfolio 10,057 - 10,057
U.S. Government sector portfolio 12,590 - 12,590
657,607$ 361,388$ 296,219$

AARP Notes to Consolidated Financial Statements December 31, 2014 and 2013
- 26 -
2013
Total Level 1 Level 2
Cash and cash equivalents 6,780$ 6,780$ - $
Common stocks 245,988 245,988 -
Preferred stocks 608 608 -
Corporate fixed income securities 1,290 - 1,290
Various fixed income funds 94,862 94,862 -
Institutional mutual funds:
Real asset funds 27,159 - 27,159
Large cap fund 96,614 - 96,614
Mid cap fund 6,738 - 6,738
Emerging market equity funds 21,703 - 21,703
International equity fund 13,557 - 13,557
Global fixed income fund 35,985 - 35,985
Fixed income sector funds:
Asset-backed securities portfolio 1,506 - 1,506
Emerging markets portfolio 1,981 - 1,981
High yield portfolio 1,328 - 1,328
International portfolio 5,255 - 5,255
Investment grade corporate portfolio 9,495 - 9,495
Mortgage portfolio 17,261 - 17,261
Municipal sector portfolio 632 - 632
Various short-term portfolios 6,917 - 6,917
Real return portfolio 8,185 - 8,185
U.S. Government sector portfolio 9,776 - 9,776
613,620$ 348,238$ 265,382$
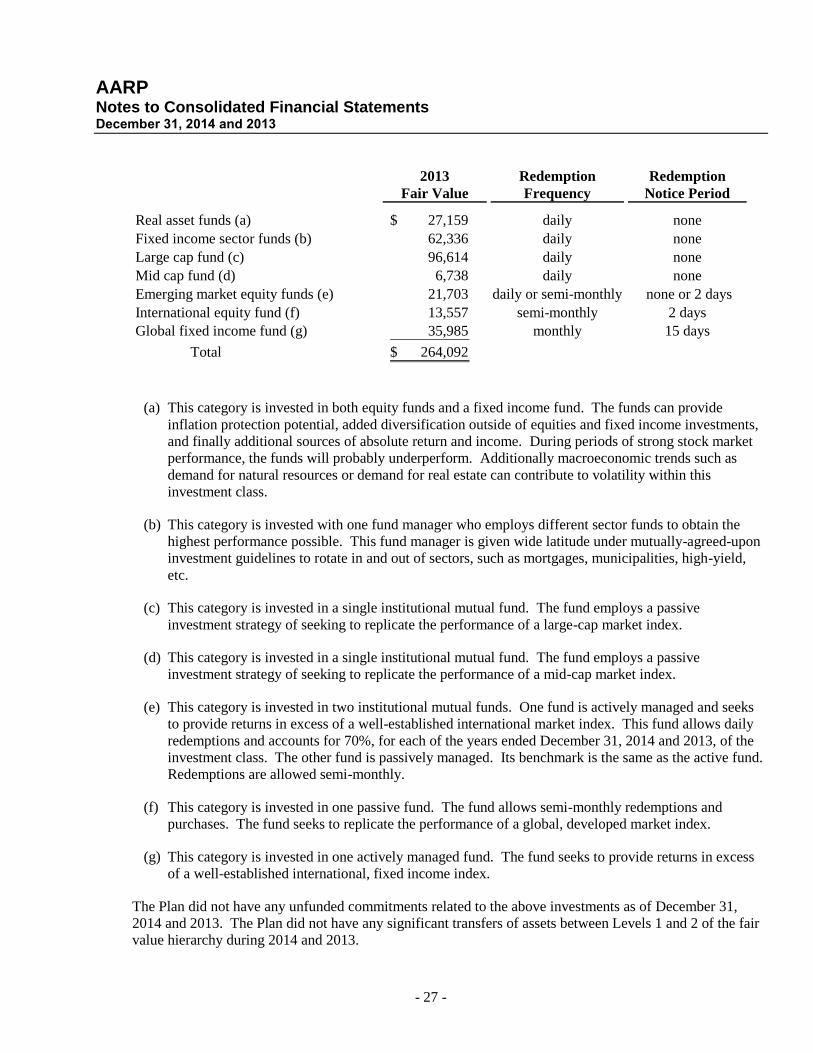
The fair values of the institutional mutual funds have been estimated using the net asset value per share of
the investment. Information with respect to redemptions, strategies, risks and funding commitments for
these investments as of December 31, 2014 and 2013 is as follows (in thousands):
2014 Redemption Redemption
Fair Value Frequency Notice Period
Real asset funds (a) 31,344$ daily none
Fixed income sector funds (b) 77,543 daily none
Large cap fund (c) 104,283 daily none
Mid cap fund (d) 5,916 daily none
Emerging market equity funds (e) 23,666 daily or semi-monthly none or 2 days
International equity fund (f) 11,065 semi-monthly 2 days
Global fixed income fund (g) 40,323 monthly 15 days
Total 294,140$
AARP Notes to Consolidated Financial Statements December 31, 2014 and 2013
- 27 -
2013 Redemption Redemption
Fair Value Frequency Notice Period
Real asset funds (a) 27,159$ daily none
Fixed income sector funds (b) 62,336 daily none
Large cap fund (c) 96,614 daily none
Mid cap fund (d) 6,738 daily none
Emerging market equity funds (e) 21,703 daily or semi-monthly none or 2 days
International equity fund (f) 13,557 semi-monthly 2 days
Global fixed income fund (g) 35,985 monthly 15 days
Total 264,092$
(a) This category is invested in both equity funds and a fixed income fund. The funds can provide
inflation protection potential, added diversification outside of equities and fixed income investments,
and finally additional sources of absolute return and income. During periods of strong stock market
performance, the funds will probably underperform. Additionally macroeconomic trends such as
demand for natural resources or demand for real estate can contribute to volatility within this
investment class.
(b) This category is invested with one fund manager who employs different sector funds to obtain the
highest performance possible. This fund manager is given wide latitude under mutually-agreed-upon
investment guidelines to rotate in and out of sectors, such as mortgages, municipalities, high-yield,
etc.
(c) This category is invested in a single institutional mutual fund. The fund employs a passive
investment strategy of seeking to replicate the performance of a large-cap market index.
(d) This category is invested in a single institutional mutual fund. The fund employs a passive
investment strategy of seeking to replicate the performance of a mid-cap market index.
(e) This category is invested in two institutional mutual funds. One fund is actively managed and seeks
to provide returns in excess of a well-established international market index. This fund allows daily
redemptions and accounts for 70%, for each of the years ended December 31, 2014 and 2013, of the
investment class. The other fund is passively managed. Its benchmark is the same as the active fund.
Redemptions are allowed semi-monthly.
(f) This category is invested in one passive fund. The fund allows semi-monthly redemptions and
purchases. The fund seeks to replicate the performance of a global, developed market index.
(g) This category is invested in one actively managed fund. The fund seeks to provide returns in excess
of a well-established international, fixed income index.
The Plan did not have any unfunded commitments related to the above investments as of December 31,
2014 and 2013. The Plan did not have any significant transfers of assets between Levels 1 and 2 of the fair
value hierarchy during 2014 and 2013.
AARP Notes to Consolidated Financial Statements December 31, 2014 and 2013
- 28 -
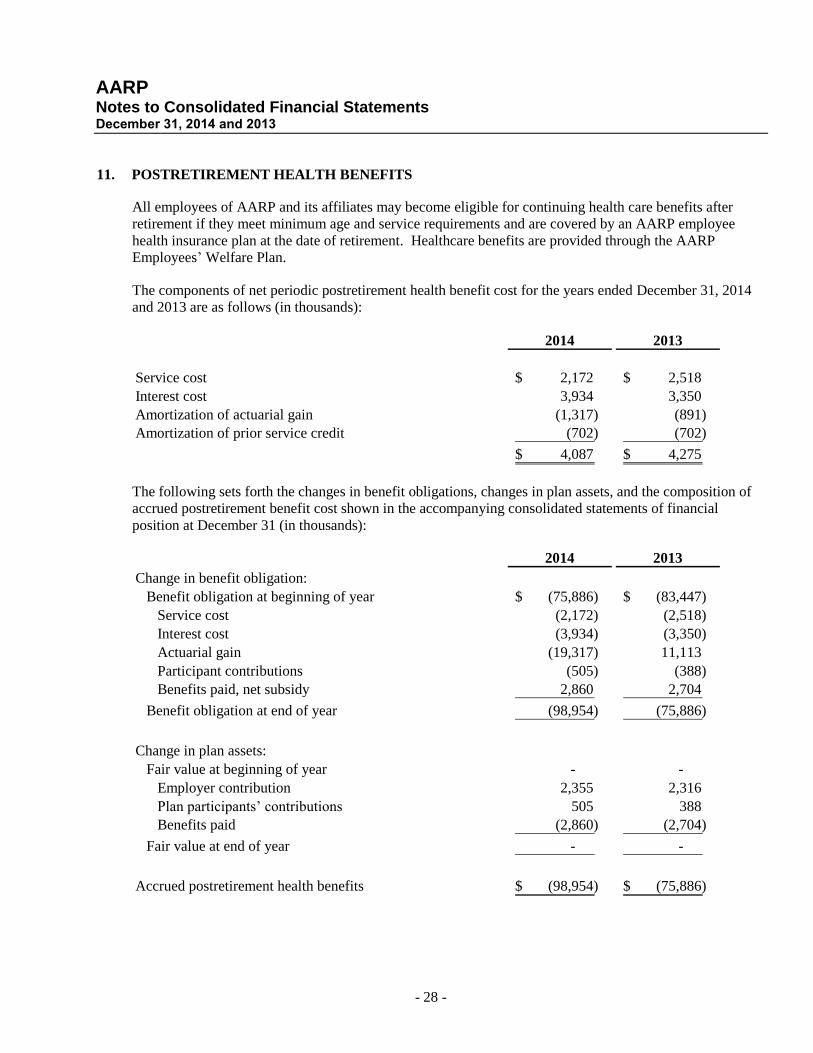
11. POSTRETIREMENT HEALTH BENEFITS
All employees of AARP and its affiliates may become eligible for continuing health care benefits after
retirement if they meet minimum age and service requirements and are covered by an AARP employee
health insurance plan at the date of retirement. Healthcare benefits are provided through the AARP
Employees’ Welfare Plan.
The components of net periodic postretirement health benefit cost for the years ended December 31, 2014
and 2013 are as follows (in thousands):
2014 2013
Service cost 2,172$ 2,518$
Interest cost 3,934 3,350
Amortization of actuarial gain (1,317) (891)
Amortization of prior service credit (702) (702)
4,087$ 4,275$
The following sets forth the changes in benefit obligations, changes in plan assets, and the composition of
accrued postretirement benefit cost shown in the accompanying consolidated statements of financial
position at December 31 (in thousands):
2014 2013
Change in benefit obligation:
Benefit obligation at beginning of year (75,886)$ (83,447)$
Service cost (2,172) (2,518)
Interest cost (3,934) (3,350)
Actuarial gain (19,317) 11,113
Participant contributions (505) (388)
Benefits paid, net subsidy 2,860 2,704
Benefit obligation at end of year (98,954) (75,886)
Change in plan assets:
Fair value at beginning of year - -
Employer contribution 2,355 2,316
Plan participants’ contributions 505 388
Benefits paid (2,860) (2,704)
Fair value at end of year - -
Accrued postretirement health benefits (98,954)$ (75,886)$
AARP Notes to Consolidated Financial Statements December 31, 2014 and 2013
- 29 -
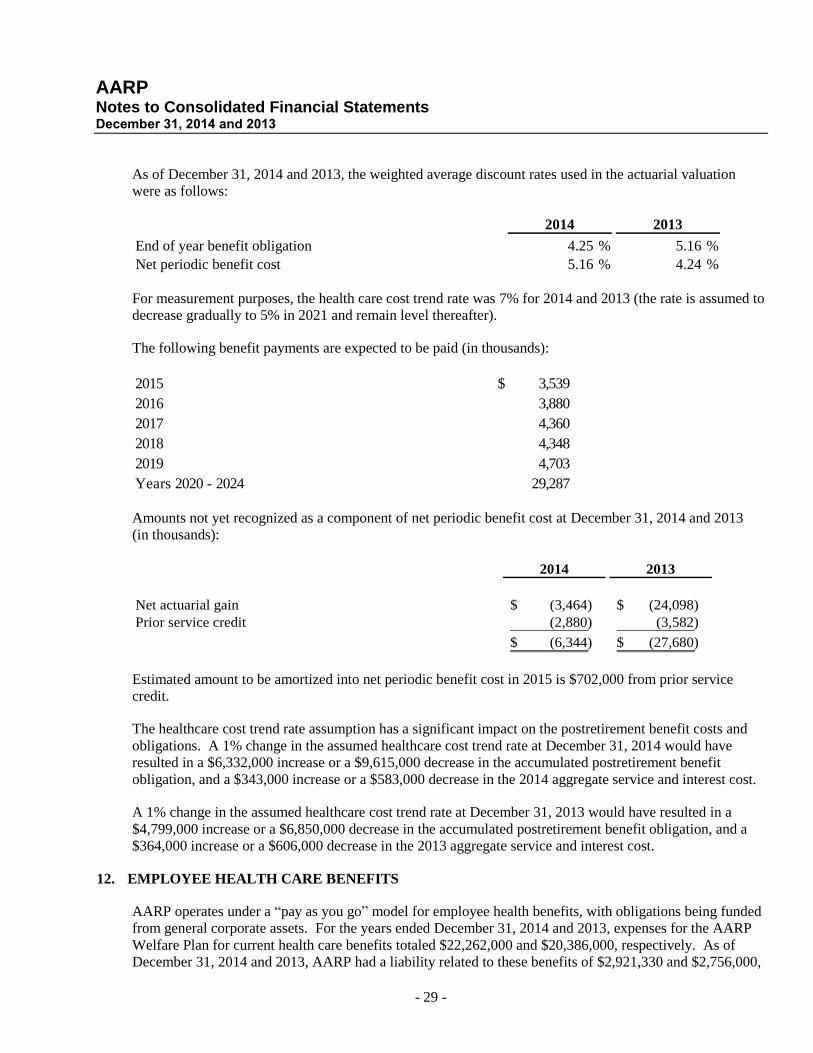
As of December 31, 2014 and 2013, the weighted average discount rates used in the actuarial valuation
were as follows:
2014 2013
End of year benefit obligation 4.25 % 5.16 %
Net periodic benefit cost 5.16 % 4.24 %
For measurement purposes, the health care cost trend rate was 7% for 2014 and 2013 (the rate is assumed to
decrease gradually to 5% in 2021 and remain level thereafter).
The following benefit payments are expected to be paid (in thousands):
2015 3,539$
2016 3,880
2017 4,360
2018 4,348
2019 4,703
Years 2020 - 2024 29,287
Amounts not yet recognized as a component of net periodic benefit cost at December 31, 2014 and 2013
(in thousands):
2014 2013
Net actuarial gain (3,464)$ (24,098)$
Prior service credit (2,880) (3,582)
(6,344)$ (27,680)$
Estimated amount to be amortized into net periodic benefit cost in 2015 is $702,000 from prior service
credit.
The healthcare cost trend rate assumption has a significant impact on the postretirement benefit costs and
obligations. A 1% change in the assumed healthcare cost trend rate at December 31, 2014 would have
resulted in a $6,332,000 increase or a $9,615,000 decrease in the accumulated postretirement benefit
obligation, and a $343,000 increase or a $583,000 decrease in the 2014 aggregate service and interest cost.
A 1% change in the assumed healthcare cost trend rate at December 31, 2013 would have resulted in a
$4,799,000 increase or a $6,850,000 decrease in the accumulated postretirement benefit obligation, and a
$364,000 increase or a $606,000 decrease in the 2013 aggregate service and interest cost.
12. EMPLOYEE HEALTH CARE BENEFITS
AARP operates under a “pay as you go” model for employee health benefits, with obligations being funded
from general corporate assets. For the years ended December 31, 2014 and 2013, expenses for the AARP
Welfare Plan for current health care benefits totaled $22,262,000 and $20,386,000, respectively. As of
December 31, 2014 and 2013, AARP had a liability related to these benefits of $2,921,330 and $2,756,000,
AARP Notes to Consolidated Financial Statements December 31, 2014 and 2013
- 30 -
respectively, which was included in accounts payable and accrued expenses on the accompanying
consolidated statements of financial position.
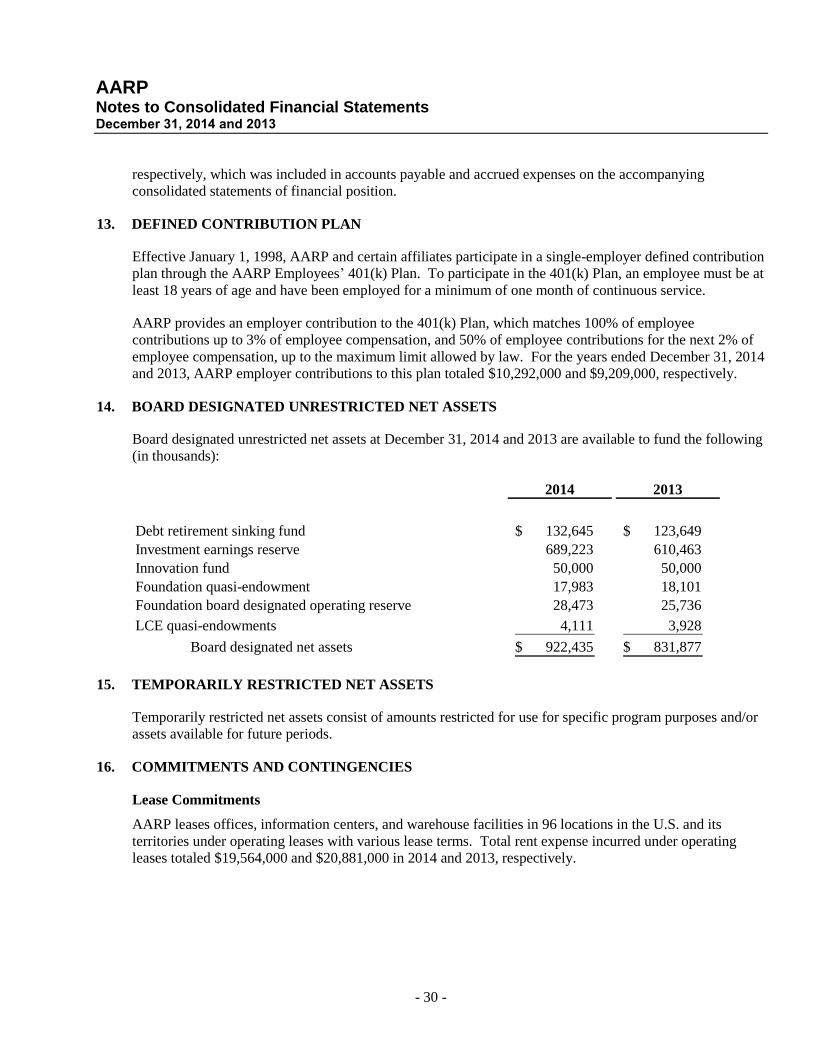
13. DEFINED CONTRIBUTION PLAN
Effective January 1, 1998, AARP and certain affiliates participate in a single-employer defined contribution
plan through the AARP Employees’ 401(k) Plan. To participate in the 401(k) Plan, an employee must be at
least 18 years of age and have been employed for a minimum of one month of continuous service.
AARP provides an employer contribution to the 401(k) Plan, which matches 100% of employee
contributions up to 3% of employee compensation, and 50% of employee contributions for the next 2% of
employee compensation, up to the maximum limit allowed by law. For the years ended December 31, 2014
and 2013, AARP employer contributions to this plan totaled $10,292,000 and $9,209,000, respectively.
14. BOARD DESIGNATED UNRESTRICTED NET ASSETS
Board designated unrestricted net assets at December 31, 2014 and 2013 are available to fund the following
(in thousands):
2014 2013
Debt retirement sinking fund 132,645$ 123,649$
Investment earnings reserve 689,223 610,463
Innovation fund 50,000 50,000
Foundation quasi-endowment 17,983 18,101
Foundation board designated operating reserve 28,473 25,736
LCE quasi-endowments 4,111 3,928
Board designated net assets 922,435$ 831,877$
15. TEMPORARILY RESTRICTED NET ASSETS
Temporarily restricted net assets consist of amounts restricted for use for specific program purposes and/or
assets available for future periods.
16. COMMITMENTS AND CONTINGENCIES
Lease Commitments
AARP leases offices, information centers, and warehouse facilities in 96 locations in the U.S. and its
territories under operating leases with various lease terms. Total rent expense incurred under operating
leases totaled $19,564,000 and $20,881,000 in 2014 and 2013, respectively.

AARP Notes to Consolidated Financial Statements December 31, 2014 and 2013
- 31 -
Future minimum lease payments, exclusive of additional operating costs, at December 31, 2014 are (in
thousands):
2015 15,484$
2016 12,506
2017 11,355
2018 10,006
2019 8,461
2020 - 2025 21,108
Total 78,920$
Contingencies
The Foundation, LCE and EC receive a majority of their revenue from government grants, which are
subject to audit by various federal and state agencies. The ultimate determination of amounts received
under these grants generally is based upon allowable costs reported to and audited by the governments or
their designees. The liabilities, if any, arising from such compliance audits cannot be determined at this
time. In the opinion of management, adjustments resulting from such audits, if any, will not have a
significant effect on the financial position, changes in net assets or cash flow of the Foundation, LCE or EC.
In the normal course of business, AARP is subject to various claims and lawsuits. Certain lawsuits may be
covered, in full or in part, by external insurance coverage. The amount of loss, if any, from these lawsuits
could not be estimated as of December 31, 2014 and management believes the exposure, if any, will not be
material.
17. SUBSEQUENT EVENTS
AARP evaluated its December 31, 2014 consolidated financial statements for subsequent events through
March 26, 2015, the date the consolidated financial statements were issued. AARP is not aware of any
material subsequent events which would require recognition or disclosure in the accompanying
consolidated financial statements.