Embed Size (px)
Citation preview

Consolidated Financial Statements Together with Report of Independent Auditors
THE AMERICAN MUSEUM OF NATURAL HISTORY
For the years ended June 30, 2020 and 2019
THE AMERICAN MUSEUM OF NATURAL HISTORY
TABLE OF CONTENTS
Page
Report of Independent Auditors 1 - 2
Consolidated Financial Statements
Consolidated Statements of Financial Position at June 30, 2020 and 2019 3
Consolidated Statements of Activities for the years ended June 30, 2020 and 2019 4
Consolidated Statements of Cash Flows for the years ended June 30, 2020 and 2019 5
Notes to Consolidated Financial Statements 6 - 36

GT.COM Grant Thornton LLP is the U.S. member firm of Grant Thornton International Ltd (GTIL). GTIL and each of its member firms are separate legal entities and are not a worldwide partnership.
To the Board of Trustees of The American Museum of Natural History:
We have audited the accompanying consolidated financial statements of The American Museum of Natural History (the “Museum”), which includes The American Museum of Natural History Planetarium Authority, which comprise the consolidated statements of financial position as of June 30, 2020 and 2019, and the related consolidated statements of activities and cash flows for the years then ended, and the related notes to the consolidated financial statements.
Management’s responsibility for the financial statements Management is responsible for the preparation and fair presentation of these consolidated financial statements in accordance with accounting principles generally accepted in the United States of America; this includes the design, implementation, and maintenance of internal control relevant to the preparation and fair presentation of consolidated financial statements that are free from material misstatement, whether due to fraud or error.
Auditor’s responsibility Our responsibility is to express an opinion on these consolidated financial statements based on our audits. We conducted our audits in accordance with auditing standards generally accepted in the United States of America. Those standards require that we plan and perform the audit to obtain reasonable assurance about whether the consolidated financial statements are free from material misstatement.
An audit involves performing procedures to obtain audit evidence about the amounts and disclosures in the consolidated financial statements. The procedures selected depend on the auditor’s judgment, including the assessment of the risks of material misstatement of the consolidated financial statements, whether due to fraud or error. In making those risk assessments, the auditor considers internal control relevant to the Museum’s preparation and fair presentation of the consolidated financial statements in order to design audit procedures that are appropriate in the circumstances, but not for the purpose of expressing an opinion on the effectiveness of the Museum’s internal control. Accordingly, we express no such opinion. An audit also includes evaluating the appropriateness of accounting policies used and the reasonableness of significant accounting estimates made by management, as well as evaluating the overall presentation of the consolidated financial statements.
We believe that the audit evidence we have obtained is sufficient and appropriate to provide a basis for our audit opinion.
REPORT OF INDEPENDENT AUDITORS
GRANT THORNTON LLP 757 Third Ave., 9th Floor New York, NY 10017-2013 D +1 212 599 0100 F +1 212 370 4520
- 2 -
Opinion In our opinion, the consolidated financial statements referred to above present fairly, in all material respects, the consolidated financial position of The American Museum of Natural History, which includes The American Museum of Natural History Planetarium Authority, as of June 30, 2020 and 2019, and the consolidated changes in their net assets and their cash flows for the years then ended in accordance with accounting principles generally accepted in the United States of America.
New York, New York November 17, 2020

THE AMERICAN MUSEUM OF NATURAL HISTORY Consolidated Statements of Financial Position At June 30, 2020 and 2019
The accompanying notes are an integral part of these consolidated financial statements.
- 3 -
ASSETS 2020 2019
Cash and cash equivalents 204,575,880$ 144,842,737$ Short-term investments designated for current operations 6,000,000 23,986,002 Accounts receivable, less allowance for doubtful accounts of
$709,662 and $679,954 in 2020 and 2019, respectively 2,951,674 5,801,237 Inventories, less allowance of $40,000 in 2020 and 2019 1,064,721 1,226,474 Prepaid expenses and other assets 15,545,082 16,716,358 Government grants receivable, net 13,984,155 7,510,792 Contributions receivable, net 88,234,731 102,932,295 Long-term investments 701,285,749 722,010,717 Plant and equipment, net 497,466,004 438,265,226
Total assets 1,531,107,996$ 1,463,291,838$
LIABILITIES AND NET ASSETS
LIABILITIESAccounts payable and accrued liabilities 45,714,938$ 52,396,062$ Accrued interest payable 2,890,171 2,596,062 Deferred revenue 11,938,715 9,392,073 Notes payable to banks 40,000,000 - Bonds and loans payable 321,549,326 268,050,314 Interest rate exchange and cap agreements 38,252,607 24,788,018 Accrued postretirement and other benefits 70,878,832 59,576,880
Total liabilities 531,224,589 416,799,409
NET ASSETSNet assets without donor restrictions 186,558,119 252,416,874 Net assets with donor restrictions 813,325,288 794,075,555
Total net assets 999,883,407 1,046,492,429
Total liabilities and net assets 1,531,107,996$ 1,463,291,838$

THE AMERICAN MUSEUM OF NATURAL HISTORY Consolidated Statements of Activities For the years ended June 30, 2020 and 2019
The accompanying notes are an integral part of these consolidated financial statements.
- 4 -
Without Donor Program or Amounts Held Without Donor Program or Amounts HeldRestrictions Time Restricted in Perpetuity Total Total Restrictions Time Restricted in Perpetuity Total Total
OPERATING REVENUE AND SUPPORTInvestment return designated for operations 19,146,337$ 12,512,624$ -$ 12,512,624$ 31,658,961$ 19,052,626$ 11,895,220$ -$ 11,895,220$ 30,947,846$ Contributions and grants 33,400,362 22,216,849 - 22,216,849 55,617,211 29,902,036 13,672,546 - 13,672,546 43,574,582 Operating support from the City of New York 19,721,639 - - - 19,721,639 19,706,436 - - - 19,706,436 Visitors’ contributions and admissions 35,328,419 - - - 35,328,419 52,871,256 - - - 52,871,256 Membership fees 4,942,697 - - - 4,942,697 6,772,447 - - - 6,772,447 Auxiliary activities 19,550,093 - - - 19,550,093 29,661,791 - - - 29,661,791 Miscellaneous fees and other revenue 8,139,104 - - - 8,139,104 9,227,559 - - - 9,227,559 Net assets released from restrictions 23,676,291 (23,676,291) - (23,676,291) - 29,319,257 (29,319,257) - (29,319,257) -
Total operating revenue and support 163,904,942 11,053,182 - 11,053,182 174,958,124 196,513,408 (3,751,491) - (3,751,491) 192,761,917
OPERATING EXPENSESScientific research 36,396,714 - - - 36,396,714 36,611,363 - - - 36,611,363 Education 23,515,015 - - - 23,515,015 26,935,781 - - - 26,935,781 Exhibitions 6,492,136 - - - 6,492,136 5,882,607 - - - 5,882,607 Membership 2,380,430 - - - 2,380,430 2,585,909 - - - 2,585,909 Visitor services 8,215,284 - - - 8,215,284 9,322,713 - - - 9,322,713 Auxiliary activities 15,032,954 - - - 15,032,954 17,918,357 - - - 17,918,357 General and administrative 19,396,785 - - - 19,396,785 18,289,312 - - - 18,289,312 Fundraising 6,874,392 - - - 6,874,392 6,929,877 - - - 6,929,877 Communications and digital media 6,543,031 - - - 6,543,031 8,410,960 - - - 8,410,960 Information technology 8,610,903 - - - 8,610,903 8,369,168 - - - 8,369,168 Guardianship, maintenance and operating costs 36,259,279 - - - 36,259,279 36,251,516 - - - 36,251,516
Total operating expenses 169,716,923 - - - 169,716,923 177,507,563 - - - 177,507,563
Designated contributions and transfers to plant and long-term investments 12,988,872 - - - 12,988,872 18,861,928 - - - 18,861,928 Operating revenue and support over expenses,
designated contributions, and transfers (18,800,853) 11,053,182 - 11,053,182 (7,747,671) 143,917 (3,751,491) - (3,751,491) (3,607,574) Release from quasi-endowment to support operations (18,800,853) - - - (18,800,853) - - - - -
Operating revenue and support in excess of operatingexpenses, designated contributions and transfers - 11,053,182 - 11,053,182 11,053,182 143,917 (3,751,491) - (3,751,491) (3,607,574)
NONOPERATING REVENUE, SUPPORT AND EXPENSESRevenue and support for plant:
Contributions, grants and miscellaneous revenue 7,085,430 2,574,981 - 2,574,981 9,660,411 2,239,963 15,579,829 - 15,579,829 17,819,792 Capital support from the City of New York 3,274,373 - - - 3,274,373 - - - - - Net assets released from restrictions 204,859 (204,859) - (204,859) - 306,083 (306,083) - (306,083) - Transfer from long-term investments and operations to plant 21,914,632 - - - 21,914,632 22,983,039 - - - 22,983,039
Plant expenses:Interest and related expenses 11,148,641 - - - 11,148,641 9,814,300 - - - 9,814,300 Change in value of interest rate exchange and cap agreements 13,464,589 - - - 13,464,589 7,646,856 - - - 7,646,856 Depreciation and amortization 30,891,904 - - - 30,891,904 30,414,196 - - - 30,414,196 Plant expenses not capitalized 16,277 - - - 16,277 15,506 - - - 15,506
Long-term investments:Contributions and bequests (256,629) (130,837) 7,389,766 7,258,929 7,002,300 751,483 (21,701) 4,108,831 4,087,130 4,838,613 Investment return, in excess of amounts designated for operations and plant (12,300,497) 6,551,544 (405,313) 6,146,231 (6,154,266) (11,642,500) 7,122,130 (158,720) 6,963,410 (4,679,090) Net assets released from restrictions and other 7,578,731 (16,328,731) 8,750,000 (7,578,731) - 10,855,617 (10,855,617) - (10,855,617) - Transfers from plant and operations (to) from long-term investments, net (27,726,611) - - - (27,726,611) (4,121,110) - - - (4,121,110)
Pension related activities and other transfers (10,111,632) - - - (10,111,632) (8,942,193) - - - (8,942,193) Changes in net assets (65,858,755) 3,515,280 15,734,453 19,249,733 (46,609,022) (35,316,559) 7,767,067 3,950,111 11,717,178 (23,599,381)
Net assets, beginning of year 252,416,874 549,993,208 244,082,347 794,075,555 1,046,492,429 287,733,433 542,226,141 240,132,236 782,358,377 1,070,091,810
Net assets, end of year 186,558,119$ 553,508,488$ 259,816,800$ 813,325,288$ 999,883,407$ 252,416,874$ 549,993,208$ 244,082,347$ 794,075,555$ 1,046,492,429$
2020 2019With Donor Restrictions With Donor Restrictions
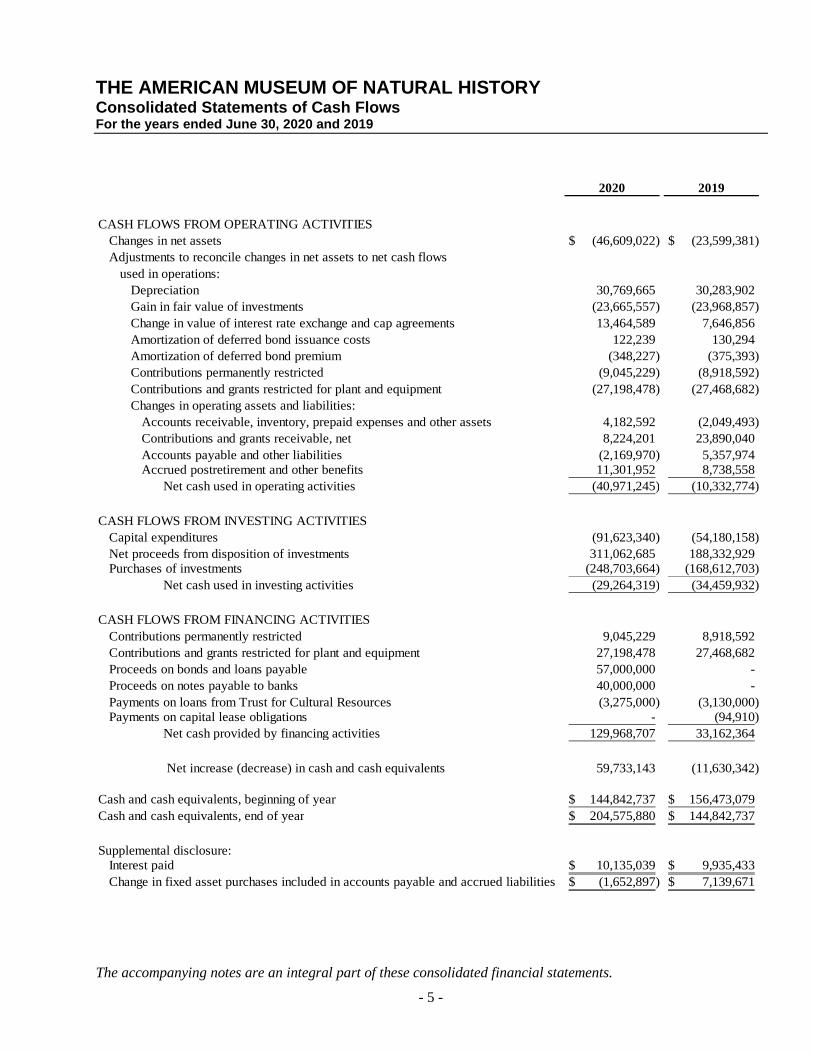
THE AMERICAN MUSEUM OF NATURAL HISTORY Consolidated Statements of Cash Flows For the years ended June 30, 2020 and 2019
The accompanying notes are an integral part of these consolidated financial statements.
- 5 -
2020 2019
CASH FLOWS FROM OPERATING ACTIVITIESChanges in net assets (46,609,022)$ (23,599,381)$ Adjustments to reconcile changes in net assets to net cash flows
used in operations:Depreciation 30,769,665 30,283,902 Gain in fair value of investments (23,665,557) (23,968,857) Change in value of interest rate exchange and cap agreements 13,464,589 7,646,856 Amortization of deferred bond issuance costs 122,239 130,294 Amortization of deferred bond premium (348,227) (375,393) Contributions permanently restricted (9,045,229) (8,918,592) Contributions and grants restricted for plant and equipment (27,198,478) (27,468,682) Changes in operating assets and liabilities:
Accounts receivable, inventory, prepaid expenses and other assets 4,182,592 (2,049,493) Contributions and grants receivable, net 8,224,201 23,890,040 Accounts payable and other liabilities (2,169,970) 5,357,974 Accrued postretirement and other benefits 11,301,952 8,738,558
Net cash used in operating activities (40,971,245) (10,332,774)
CASH FLOWS FROM INVESTING ACTIVITIESCapital expenditures (91,623,340) (54,180,158) Net proceeds from disposition of investments 311,062,685 188,332,929 Purchases of investments (248,703,664) (168,612,703)
Net cash used in investing activities (29,264,319) (34,459,932)
CASH FLOWS FROM FINANCING ACTIVITIESContributions permanently restricted 9,045,229 8,918,592 Contributions and grants restricted for plant and equipment 27,198,478 27,468,682 Proceeds on bonds and loans payable 57,000,000 - Proceeds on notes payable to banks 40,000,000 - Payments on loans from Trust for Cultural Resources (3,275,000) (3,130,000) Payments on capital lease obligations - (94,910)
Net cash provided by financing activities 129,968,707 33,162,364
Net increase (decrease) in cash and cash equivalents 59,733,143 (11,630,342)
Cash and cash equivalents, beginning of year 144,842,737$ 156,473,079$ Cash and cash equivalents, end of year 204,575,880$ 144,842,737$
Supplemental disclosure:Interest paid 10,135,039$ 9,935,433$ Change in fixed asset purchases included in accounts payable and accrued liabilities (1,652,897)$ 7,139,671$

THE AMERICAN MUSEUM OF NATURAL HISTORY Notes to Consolidated Financial Statements June 30, 2020 and 2019
- 6 -
1. ORGANIZATION
The American Museum of Natural History (the “Museum”) is a highly complex scientific, educational and cultural institution that was founded as a natural history museum and library in 1869 by a special act of the Legislature of the State of New York. Today it is a diverse scientific, educational and cultural organization with one of the world’s largest natural history collections, museums, and library, as well as the Rose Center for Earth and Space (and Hayden Planetarium), and the Richard Gilder Graduate School. The Museum is accredited as a museum by the American Alliance of Museums and its scientific research, educational programs and exhibitions operate under the auspices of the Board of Regents of the State of New York.
Within the Museum is the Richard Gilder Graduate School (the “Graduate School”) that was first chartered in 2006, and is accredited, by the Board of Regents of the State of New York. The Graduate School is authorized to confer the degrees of Doctor of Philosophy (“Ph.D.”) and Master of Philosophy (“M. Phil”) in Comparative Biology and the Master of Arts in Teaching (“MAT”). The activities of the Graduate School are included in the accompanying consolidated financial statements.
The Museum also operates the Rose Center for Earth and Space and the Hayden Planetarium housed within it pursuant to a lease from the American Museum of Natural History Planetarium Authority (the “Planetarium Authority”). The Planetarium Authority is a public benefit corporation chartered in 1933 by a special act of the Legislature of the State of New York, and its Board consists of three to five independent members appointed by the Museum’s Board of Trustees. The financial statements of the Planetarium Authority are included in the accompanying consolidated financial statements.
The Museum is a nonprofit corporation and exempt from corporate federal income tax under Section 501(c)(3) of the Internal Revenue Code (the “IRC”) and is qualified to receive tax-deductible gifts and bequests under the U.S. tax code. The Planetarium Authority is also exempt from corporate federal income tax under Section 501(c)(3) of the IRC. On March 13, 2020, the Museum closed to the public in accordance with directives issued by New York State due to the COVID-19 global pandemic. The Museum remained closed until September 2, 2020 when it reopened for AMNH Members, and on September 9, 2020 it reopened to the general public, both under limited capacities and offerings, with significant safety and cleaning protocols. During the closure, the Museum’s primary focus was to ensure the safety of essential personnel onsite, a seamless transition to remote work where possible, continued digital delivery of mission-related programs, and navigating the financial and operational uncertainty of planning for the future.
2. SUMMARY OF SIGNIFICANT ACCOUNTING POLICIES
Basis of Presentation The accompanying consolidated financial statements have been prepared using the accrual basis of accounting in accordance with accounting principles generally accepted in the United States of America (“U.S. GAAP”). All inter-institutional amounts/transactions have been eliminated in consolidation.

THE AMERICAN MUSEUM OF NATURAL HISTORY Notes to Consolidated Financial Statements - Continued June 30, 2020 and 2019
- 7 -
Net Asset Accounting - Museum resources are classified and reported in the accompanying consolidated financial statements as separate classes of net assets in accordance with donor-imposed restrictions as follows:
Net Assets Without Donor Restriction:
Represent net assets which are not restricted by donors. Net assets without donor restrictions are funds that are fully available, at the discretion of the Board of Trustees and management, for the Museum to utilize in any of its programs or supporting services. Net assets without donor restrictions may be designated for specific purposes by the Museum’s Board of Trustees or may be limited by legal requirements or contractual agreements with outside parties.
Net Assets With Donor Restriction:
Represent net assets which are subject to donor-imposed restrictions whose use is restricted by time and/or purpose. A portion of the Museum’s net assets with donor restrictions are subject to donor-imposed restrictions that require the Museum to use or expend the gifts as specified, based on purpose or passage of time. When donor restrictions expire, that is, when a purpose restriction is fulfilled or a time restriction ends, such net assets are reclassified to net assets without donor restrictions and reported on the consolidated statement of activities as net assets released from restrictions.
Another portion of net assets with donor restrictions stipulates that the corpus of the gifts be maintained in perpetuity, but allow for the expenditure of net investment income and gains earned on the corpus for either specified or unspecified purposes.
Measure of Operations The Museum’s measure of operations includes all operating revenues and expenses included in net assets without donor restrictions that are an integral part of its programs and supporting activities, including net assets released from donor restrictions to support operating activities. The measure of operations also includes distributions from the endowment in support of operating expenses as appropriated by the Museum’s Board of Trustees (see Note 6). The measure of operations excludes net income and gains or losses on the endowment that exceed or are less than the annual distribution appropriated by the Board of Trustees and changes in fair value of planned giving and other agreements, plant revenue, non-capitalizable plant expenses, depreciation and amortization of plant and equipment, interest and related expenses, other pension related activities apart from service cost, contributions with donor restrictions for long-term investment and capital, gifts without restrictions designated by the Museum for nonoperating purposes and other transfers and nonrecurring items.
Revenue Recognition and Receivables In accordance with Financial Accounting Standards Board (“FASB”) Accounting Standards Codification (“ASC”) Topic 606, Revenue from Contracts with Customers (“ASC 606”), the Museum recognizes revenue when control of the promised goods or services is transferred to the Museum’s students or outside parties in an amount that reflects the consideration the Museum expects to be entitled to in exchange for those goods or services. The standard outlines a five-step model whereby revenue is recognized as performance obligations within a contract are satisfied.

THE AMERICAN MUSEUM OF NATURAL HISTORY Notes to Consolidated Financial Statements - Continued June 30, 2020 and 2019
- 8 -
ASC 606 also requires new and expanded disclosures regarding revenue recognition to ensure an understanding as to the nature, amount, timing and uncertainty of revenue and cash flows arising from contracts with customers. The Museum has identified program revenues and sales of auxiliary revenue as revenue categories subject to the principles of ASC 606. The Museum recognizes contracts with customers, as goods or services are transferred or provided in accordance with ASC 606.
The Museum has multiple revenue sources that are accounted for as exchange transactions, including visitors’ contributions and admissions, membership fees, auxiliary activities, and miscellaneous fees and other revenue.
Visitors’ Contributions and Admissions The Museum recognizes revenue from visitors’ contributions and admissions upon sale or date of service, as applicable.
Membership Fees The Museum offers memberships of various categories that typically last for a term of one year. The Museum divides fees from these memberships between contributions and exchange transactions and recognizes revenue for the contribution upon sale and for the exchange portion of the transaction ratably over the term of the membership.
Auxiliary Activities Revenue from auxiliary activities includes sales and other revenue from retail sales and parking garage fees of $9,807,495 and $15,038,931 at June 30, 2020 and June 30, 2019, respectively, declining in 2020 due to COVID-19 related closures. The Museum recognizes revenue from these sources upon sale. Revenue from auxiliary activities also includes special events and exhibition touring fees of $9,742,598 and $14,622,860 at June 30, 2020 and June 30, 2019, respectively, with the 2020 decline attributable to COVID-19 related closures. The Museum recognizes this revenue as performance obligations are satisfied.

THE AMERICAN MUSEUM OF NATURAL HISTORY Notes to Consolidated Financial Statements - Continued June 30, 2020 and 2019
- 9 -
Miscellaneous Fees and Other Revenue Revenue from miscellaneous fees and other revenue includes educational programs, short-term investment income, and miscellaneous income of $6,439,441 and $7,429,682 at June 30, 2020 and June 30, 2019, respectively. The Museum recognizes revenue for educational programs and miscellaneous income upon sale. Although the Museum recognizes revenue for short-term investment income as earned, it is not subject to ASC 606.
Contributions, Grants and Contracts The Museum recognizes revenue from grants and contracts in accordance with ASU 2018-08, Not-For-Profit Entities (Topic 958): Clarifying the Scope and the Accounting Guidance for Contributions Received and Contributions Made. In accordance with ASU 2018-08, the Museum evaluates whether a transfer of assets is (1) an exchange transaction in which a resource provider is receiving commensurate value in return for the resources transferred or (2) a contribution. If the transfer of assets is determined to be an exchange transaction, the Museum applies guidance under ASC 606. If the transfer of assets is determined to be a contribution, the Museum evaluates whether the contribution is conditional based upon whether the agreement includes both (1) one or more barriers that must be overcome before the Museum is entitled to the assets transferred and promised and (2) a right of return of assets transferred or a right of release of a promisor’s obligation to transfer assets.
Grants for capital projects received from the City of New York (the “City”) and the State of New York (the “State”) have been deemed to be conditional contributions and are recorded as support for plant within net assets without donor restrictions, as the work is performed.
Federal, State and City grants and contracts for research, education and other purposes have been deemed to be conditional contributions and are included in contributions and grants without donor restrictions in the consolidated statement of activities. Revenue from grants and contracts is recognized when earned, that is, generally as the related costs are incurred under the terms of the grant or contract agreements. Amounts expended in advance of reimbursements are reported as government grants receivable.
Contributions and grants, including donations of cash, property, in-kind contributions and unconditional promises to give (pledges), are reported in the period received. Contributions are recorded at fair value, and in the case of pledges, are recorded at the present value of their estimated future cash flows. Discounts to present value are calculated using current interest rates paid on U.S. Treasury obligations with maturities that correspond to expected pledge payment dates adjusted for credit risk. Allowances are recorded for estimated uncollectible contributions based on management’s judgment, past collection experience and other relevant factors.
The Museum has a significant number of volunteers who contribute meaningful amounts of time in furtherance of the Museum’s mission. Such contributions do not meet generally accepted accounting criteria for recognition as contributed services and, accordingly, are not reflected in the consolidated statements of activities.
Cash and Cash Equivalents Cash consists of cash on premises generated through the course of daily activities and cash on deposit with banks and other financial institutions. Cash equivalents represent money market funds or short-term investments with original maturities of 90 days or less from the date of purchase. Cash and cash equivalents managed by the Museum’s investment managers as part of its long-term investment strategy are included in long-term investments.

THE AMERICAN MUSEUM OF NATURAL HISTORY Notes to Consolidated Financial Statements - Continued June 30, 2020 and 2019
- 10 -
Short-Term Investments, Designated for Current Operations Short-term investments are reported at fair value based on quoted market values as of the reporting date and primarily consist of operating cash placed in certificates of deposit, short-term equity funds, treasury bills and notes, and other federal agency notes and generally have maturities greater than 90 days.
Concentrations of Credit Risk In order to avoid concentrations of credit risk in cash and cash equivalents, the Museum has diversified its short-term cash holdings among several high credit quality banks and financial institutions. Additionally, it has diversified its endowment investment holdings among different investment managers with different strategies and holdings in accordance with direction from the Investment Committee of its Board of Trustees, in consultation with external advisors.
Investments Investments in publicly traded debt and equity securities are recorded at fair value, generally determined on the basis of quoted market values as of the reporting date. Investments in alternative investments that are not readily marketable, are reported at fair value as determined by the respective investment manager at the fund’s measurement date and adjusted by the Museum for activity from that date through June 30th of each year. Interests in planned giving agreements and perpetual trusts are reported at fair value based on the underlying assets.
Purchases and sales of investments are reflected on a trade-date basis. Changes in fair value of investments are determined based on average cost and are recorded in the consolidated statement of activities in the period in which they occur. Such changes are reported as increases or decreases in net assets without donor restrictions unless subject to donor restriction or applicable law. Dividends and interest are recognized as earned. The Museum’s investments are pooled to facilitate their management. Investment return is allocated to net assets with and without donor restrictions based on donor restrictions, if any, calculated on a unit basis that reflects the ratio of the related funds invested in the pooled portfolio to the total fair value.

THE AMERICAN MUSEUM OF NATURAL HISTORY Notes to Consolidated Financial Statements - Continued June 30, 2020 and 2019
- 11 -
Fair Value Measurements FASB Topic 820, under the FASB ASC, defined fair value, established a framework for measuring fair value, and expanded disclosures about fair value measurements. The standard provides a consistent definition of fair value, which focuses on an exit price between market participants in an orderly transaction. The standard also prioritizes, within the measurement of fair value, the use of market-based information over entity-specific information and establishes a three-level hierarchy for fair value measurements based on the transparency of information used in the valuation of an asset or liability as of the measurement date.
Assets and liabilities, subject to the standard, measured and reported at fair value are classified and disclosed in one of the following categories:
Level I - Quoted prices are available in publicly traded markets for identical assets or liabilities as of the measurement date. The type of investments in Level I include listed equities held in the name of the Museum, and exclude listed equities and other securities held indirectly through commingled funds.
Level II - Pricing inputs, including broker quotes, are generally those other than exchange quoted prices in publicly traded markets, which are either directly or indirectly observable as of the measurement date, and fair value is determined through the use of valuation methodologies.
Level III - Pricing inputs are unobservable for the asset or liability and include situations where there is little, if any, market activity for the asset or liability. The inputs into the determination of fair value require significant management judgment or estimation. Investments that are included in this category generally include hedge funds, private investment funds and partnership interests, which are required to provide the Museum with periodic audited financial statements.
The Museum follows the accounting standards of the FASB ASC Subtopic 820-10-35-59, Fair Value Measurement and Disclosures - Fair Value Measurements of Investments in Certain Entities That Calculate Net Asset Value per Share (or its Equivalent). This allows for the estimation of the fair value of investments in investment companies, for which the investment does not have a readily determinable fair value, using net asset value (“NAV”) per share or its equivalent, as provided by the investment managers. The Museum reviews and evaluates the values provided by its investment managers and agrees with the valuation methods and assumptions used in determining the NAVs of these investments as of the measurement date. These estimated fair values may differ significantly from the values that would have been used had a ready market for these securities existed.
Investments valued using a NAV as an estimate of fair value are exempt from categorization within the fair value hierarchy and related disclosures. Therefore, the Museum separately discloses the information required for assets measured using NAV, and discloses a reconciling item between the total amount of investments categorized within the fair value hierarchy and total investments measured at fair value as reported on the consolidated financial statements.
Inventory Inventory consists of retail shop merchandise valued at cost, principally using the first-in, first-out cost method. The Museum provides an allowance for inventory obsolescence and shrinkage based on amounts ultimately expected to be realized upon sale.

THE AMERICAN MUSEUM OF NATURAL HISTORY Notes to Consolidated Financial Statements - Continued June 30, 2020 and 2019
- 12 -
Plant and Equipment The Museum’s and the Planetarium Authority’s facilities consist of permanent exhibition halls and theaters, including those in the Rose Center for Earth and Space, and research and educational facilities located on an 18-acre campus on the Upper West Side of Manhattan. The buildings and land occupied by the Museum are owned by the City of New York and are occupied by the Museum pursuant to an original 1877 lease with the City. The lease grants to the Museum, free of rent, the exclusive use of the land and buildings erected and to be erected thereon for so long as the leased properties are used for purposes consistent with the Museum’s charter. The Museum includes the book value of these buildings and grounds in its consolidated financial statements consistent with U.S. GAAP, which permits the recording of assets contributed to institutions pursuant to a long-term lease.
The Planetarium Authority holds title to the Rose Center for Earth and Space and the land beneath. The land was donated by the City and the State to the Planetarium Authority, subject to a reversion of title in certain events, in which case, title to the land and building would revert to the City but under lease to the Museum, under the same provisions as the City’s lease of land and buildings to the Museum. The Museum owns the Southwest Research Station and its research facilities located on approximately 100 acres in the Chiricahua Mountains near Portal, Arizona, that it purchased in 1955. The Museum also owns Great Gull Island in Long Island Sound, New York that was donated to the Museum by the United States in 1949. It consists of approximately 17 acres used by the Museum for research purposes. The gross value of plant represents the cost of Museum expenditures for construction and leasehold improvements. The gross value of equipment represents the cost of Museum expenditures and the value of donated equipment. Plant and equipment purchased for a value greater than $5,000 and with depreciable lives greater than one year are reported at cost, net of accumulated depreciation and amortization which is calculated on a straight-line basis over the estimated useful lives of such assets which range from 5 to 40 years.
Bond Issuance Costs Costs incurred for the issuance of debt are deferred and amortized over the life of the outstanding debt to which they pertain. Debt issuance costs are presented in the consolidated statement of financial position as a direct deduction from the carrying amount of debt, consistent with debt discounts or premiums.
Exhibitions The Museum capitalizes exhibition costs as they are incurred. Upon the opening of an exhibition, the capitalized costs are amortized on a straight-line basis over its estimated useful life of five years. The net unamortized exhibition costs are included in prepaid expenses and other assets on the consolidated statement of financial position.

THE AMERICAN MUSEUM OF NATURAL HISTORY Notes to Consolidated Financial Statements - Continued June 30, 2020 and 2019
- 13 -
Collections The Museum has extensive collections of specimens and artifacts that constitute a record of life on Earth. These valuable, and sometimes irreplaceable, collections have been acquired through field expeditions, contributions and purchases since the Museum’s inception and represent one of the largest natural history collections in the world. New collection areas include the Museum’s frozen tissue collection of DNA and tissue samples as well as large scientific databases of genomic and astrophysical data. The collections provide a resource for scientists around the world, and grow significantly each year. In accordance with accounting policies generally followed by museums, the value of the Museum’s collections is not reflected in the consolidated statements of financial position. The Museum’s collections policy requires that the proceeds from the sale of collection items be used for acquisitions to the collections. If the assets used to purchase collection items are sourced from restricted funds, proceeds from the sale of those items are recorded as increases in net assets with donor restrictions in that fund until an acquisition is made.
Use of Estimates The preparation of consolidated financial statements in conformity with U.S. GAAP requires management to make estimates and assumptions that affect the reported amounts of assets and liabilities and disclosure of contingent assets and liabilities at the date of the consolidated financial statements and the reported amounts of revenues and expenses during the reporting period. The more significant estimates relate to actuarial assumptions used to calculate potential postretirement benefits, the determination of allowances for doubtful accounts, the useful lives of plant and equipment, conditional asset retirement obligations and the fair value of certain alternative investments and interest rate exchange and cap agreements. Actual results could differ from those estimates.
Deferred Revenue Deferred revenue consists of amounts received from donors who have not yet directed the use of their gifts, advance payments for traveling exhibitions, advance ticket sales, and other miscellaneous deferred items, all recognized as revenue upon performance of the underlying obligation or once the donor has directed the use of their gift.
Income Taxes U.S. GAAP requires that a tax position be recognized or derecognized based on a “more likely than not” threshold. This applies to positions taken or expected to be taken in a tax return. The Museum does not believe its consolidated financial statements include any uncertain tax positions that would have a material adverse effect on its financial condition.

THE AMERICAN MUSEUM OF NATURAL HISTORY Notes to Consolidated Financial Statements - Continued June 30, 2020 and 2019
- 14 -
New Accounting Pronouncements In March 2017, the FASB issued ASU No. 2017-07, Compensation - Retirement Benefits (Topic 715): Improving the Presentation of Net Periodic Pension Cost and Net Periodic Postretirement Benefit Cost (“ASU 2017-07”). The standard requires entities to report the service cost component of net periodic benefit cost in the same line item or items as other compensation costs arising from services rendered by the pertinent employees during the period. The other components of net benefit cost are required to be presented in the statement of activities separately from the service cost component and outside a subtotal of income from operations, if one is presented. The Museum adopted ASU 2017-07 for the year ended June 30, 2020.
Subsequent Events The Museum evaluated its June 30, 2020 consolidated financial statements for subsequent events through November 17, 2020, the date the consolidated financial statements were issued. The Museum is not aware of any material subsequent events which would require recognition or disclosure in the accompanying consolidated financial statements.
3. CONTRIBUTIONS RECEIVABLE
Unconditional promises to donate to the Museum (pledges) are recorded as contributions receivable at the present value of expected future cash flows. Discount factors are established in the fiscal year in which the respective contribution originates and are not subsequently adjusted. The rates used to discount contributions receivable to present value at June 30, 2020 and 2019 ranged from .7% to 5.3%.
Contributions receivable consist of the following at June 30, 2020 and 2019:
2020 2019Gross Contributions Due:
Within one year 32,250,413$ 22,130,722$ 1 to 5 years 50,256,228 75,826,712 Over 5 years 15,717,161 12,414,066
Gross Contributions Receivable 98,223,802 110,371,500
Less:Discount to Present Value (9,089,071) (6,539,205) Allowance for Doubtful Accounts (900,000) (900,000)
Contributions Receivable, net 88,234,731$ 102,932,295$
The Museum has been notified of certain intentions to give. If received, these gifts will be used to support operations, fund capital expenditures or for long-term investment. These amounts have not been recorded in the accompanying consolidated financial statements due to their conditional nature.

THE AMERICAN MUSEUM OF NATURAL HISTORY Notes to Consolidated Financial Statements - Continued June 30, 2020 and 2019
- 15 -
4. GOVERNMENT GRANTS RECEIVABLE
Government grants receivable consist of the following at June 30, 2020 and 2019:
2020 2019
Due from the City (primarily for capital projects) 79,716$ 79,716$ Due from the City for Urban Advantage 4,896,472 5,956,737
Due from the State (primarily for capital projects) 6,405,669 - Due from Federal agencies 2,881,298 1,753,339
Gross Government Grants Receivable 14,263,155 7,789,792
Less: Allowance for Doubtful Accounts (279,000) (279,000)
Government Grants Receivable, net 13,984,155$ 7,510,792$
The Museum is also the recipient of government grants that have been awarded primarily for research, education and capital projects that will be recorded as revenue in the future as the terms of the respective agreements are satisfied. The remaining balances of these grants, which have not been reflected in the accompanying consolidated financial statements at June 30, 2020, total $14,439,089.
5. LONG-TERM INVESTMENTS
Investment objectives and policies are approved by the Museum’s Board of Trustees based on recommendations by its Investment Committee and are carried forward and implemented by external investment managers which are selected and monitored by the Investment Committee and staff of the Museum in consultation with its external advisors.

THE AMERICAN MUSEUM OF NATURAL HISTORY Notes to Consolidated Financial Statements - Continued June 30, 2020 and 2019
- 16 -
The following table presents investment returns, net, less distributions from endowment to operations and plant, pursuant to annual appropriation by the Board of Trustees, for the years ended June 30, 2020 and 2019:
2020 2019
Interest and dividends 4,182,935$ 4,638,908$ Gain in fair value of investments 23,665,557 23,968,857 Total gains on investments, before investment
expenses 27,848,492 28,607,765
Investment expenses (1,474,143) (1,484,120) Total gains on investments, after investment
expenses 26,374,349 27,123,645
Less: Distribution from endowment to operations pursuant to annual appropriation by the Board of Trustees (31,658,961) (30,947,846) Distribution from endowment to plant pursuant to annual appropriation by the Board of Trustees (869,654) (854,889)
Investment (losses), net of amounts designated for operations and plant (6,154,266)$ (4,679,090)$
Long-term investments consist of the following at June 30, 2020 and 2019:
2020 2019
Cash equivalents1 61,712,494$ 44,235,110$ Accrued interest and dividends receivable 75,264 114,976 U.S. common and preferred stocks 108,097,643 115,058,047 Foreign common and preferred stocks 118,497,969 135,321,290 Fixed income 22,339,449 21,169,235 Alternative investments 376,922,186 392,318,928
Pooled endowment 687,645,005 708,217,586
Planned giving agreements and perpetual trusts 13,640,744 13,793,131
Long-term investments 701,285,749$ 722,010,717$
Fair Value
1Includes pending settlements of investment trades, net of $28,763,610 and $4,044,158 and accrued investment management fees of $129,180 and $151,387 at June 30, 2020 and 2019, respectively.

THE AMERICAN MUSEUM OF NATURAL HISTORY Notes to Consolidated Financial Statements - Continued June 30, 2020 and 2019
- 17 -
Alternative investments represent hedge funds, private equity, real assets and other investments which follow a variety of investment strategies. Terms and conditions of these investments, including liquidity provisions, differ for each fund. The Museum believes that the reported amount of its alternative investments is a reasonable estimate of the fair value of such investments at June 30, 2020 and 2019. The Museum uses the NAV per share or its equivalent to determine the fair value of all the underlying investments which (a) do not have a readily determinable fair value and (b) prepare their financial statements consistent with the measurement principles of an investment company or have the attributes of an investment company. The following tables list investments by major category:
Fair ValueAlternative Determined Remaining Unfunded Redemption Redemption
Investment Strategy Using NAV in Funds Life Commitments Terms Restrictions
U.S. common and preferred stocks 14,087,741$ NA None Monthly with notice required by the 22nd of the month prior NoneForeign common and preferred stocks 118,497,969 NA None Ranges between daily with 5 days’ notice to a rolling 3 year
redemption with 90 days’ noticeRanges between none and a lockup through 12/31/2020
Marketable Alternative Assets: Funds of Funds 8,612,495 NA None In liquidation None Equity-oriented funds 182,789,113 NA None Ranges between quarterly redemption with 30 days’ notice to
50% bi-annual redemption with a 90 days’ notice and subject to a 36 month payout at firm’s discretion
None
Credit-oriented funds 26,193,829 NA None Ranges between 25% quarterly redemption with 65 days’ notice
to a rolling 2 year redemption with 45 days’ noticeNone
Multi-strategy funds 43,244,332 NA None Ranges between quarterly redemption with 65 days’ notice to
annual redemption with 45 days’ noticeNone
Real assets-oriented funds 6,854,065 NA None Monthly with 15 days’ notice NoneTotal Marketable Alternative Assets 267,693,834 -
Nonmarketable Alternative Assets: Funds of Funds 922,770 1 to 9 years 6,968,844$ As underlying investments are sold None Equity-oriented funds 83,357,101 1 to 12 years 44,830,758 As underlying investments are sold None Credit-oriented funds 21,862,296 1 to 6 years 8,192,755 As underlying investments are sold None Real assets-oriented funds 3,086,185 1 to 6 years 1,068,968 As underlying investments are sold None
Total Nonmarketable Alternative Assets
109,228,352 61,061,325
Total Alternative Investments 509,507,896$ 61,061,325$
2020
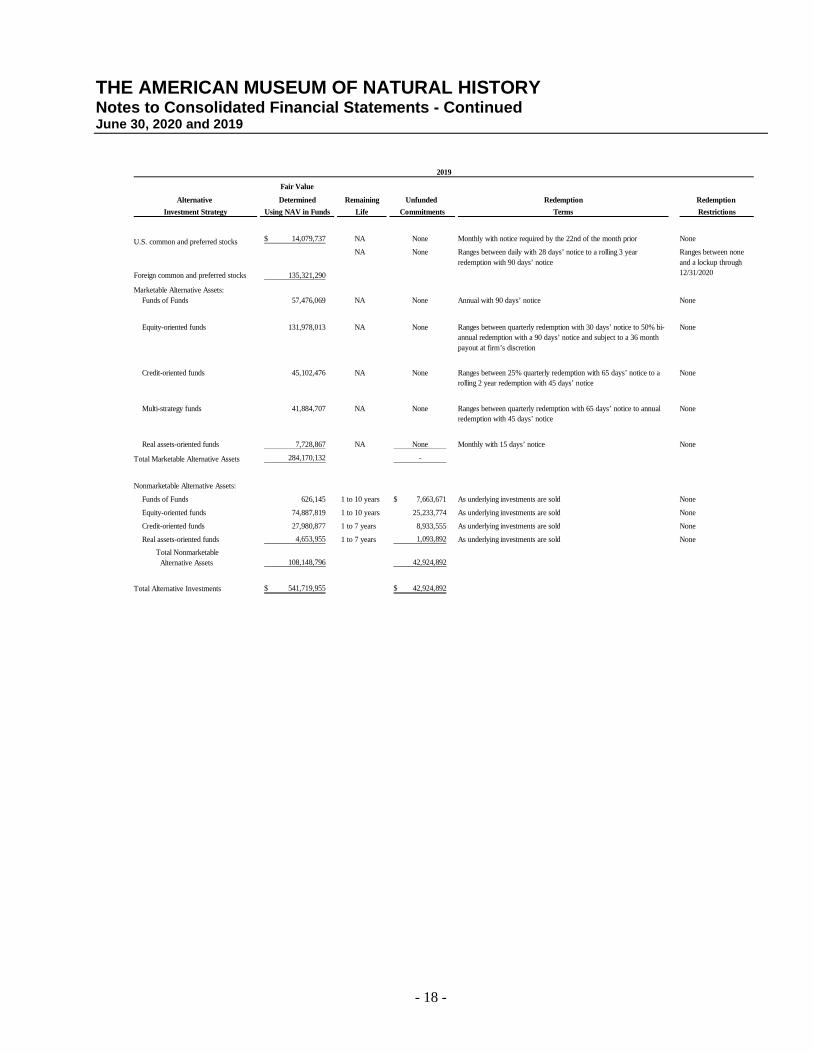
THE AMERICAN MUSEUM OF NATURAL HISTORY Notes to Consolidated Financial Statements - Continued June 30, 2020 and 2019
- 18 -
Fair ValueAlternative Determined Remaining Unfunded Redemption Redemption
Investment Strategy Using NAV in Funds Life Commitments Terms Restrictions
U.S. common and preferred stocks 14,079,737$ NA None Monthly with notice required by the 22nd of the month prior None
Foreign common and preferred stocks 135,321,290
NA None Ranges between daily with 28 days’ notice to a rolling 3 year redemption with 90 days’ notice
Ranges between none and a lockup through 12/31/2020
Marketable Alternative Assets: Funds of Funds 57,476,069 NA None Annual with 90 days’ notice None Equity-oriented funds 131,978,013 NA None Ranges between quarterly redemption with 30 days’ notice to 50% bi-
annual redemption with a 90 days’ notice and subject to a 36 month payout at firm’s discretion
None
Credit-oriented funds 45,102,476 NA None Ranges between 25% quarterly redemption with 65 days’ notice to a
rolling 2 year redemption with 45 days’ noticeNone
Multi-strategy funds 41,884,707 NA None Ranges between quarterly redemption with 65 days’ notice to annual
redemption with 45 days’ noticeNone
Real assets-oriented funds 7,728,867 NA None Monthly with 15 days’ notice None
Total Marketable Alternative Assets 284,170,132 -
Nonmarketable Alternative Assets: Funds of Funds 626,145 1 to 10 years 7,663,671$ As underlying investments are sold None Equity-oriented funds 74,887,819 1 to 10 years 25,233,774 As underlying investments are sold None Credit-oriented funds 27,980,877 1 to 7 years 8,933,555 As underlying investments are sold None Real assets-oriented funds 4,653,955 1 to 7 years 1,093,892 As underlying investments are sold None
Total Nonmarketable Alternative Assets 108,148,796 42,924,892
Total Alternative Investments 541,719,955$ 42,924,892$
2019

THE AMERICAN MUSEUM OF NATURAL HISTORY Notes to Consolidated Financial Statements - Continued June 30, 2020 and 2019
- 19 -
The Museum’s investment portfolio is exposed to various risks, such as interest rate, market risk and credit risk. Because of the level of risk associated with such investments, changes in their values will occur and such changes could materially affect the amounts reported in the accompanying consolidated financial statements.
The following tables summarize investments within the fair value hierarchy as of June 30, 2020 and 2019:
Level I Level II Level III NAV Total
Cash equivalents 33,078,064$ -$ -$ -$ 33,078,064$
U.S. common and preferred stocks 94,009,903 - - 14,087,741 108,097,644
Foreign common and preferred stocks - - - 118,497,969 118,497,969
Fixed income 22,339,449 - - - 22,339,449
Marketable alternative investments - - - 267,693,834 267,693,834
Nonmarketable alternative investments - - - 109,228,352 109,228,352
Planned giving agreements - 10,228,651 - - 10,228,651 Perpetual trusts - - 3,412,093 - 3,412,093
149,427,416$ 10,228,651$ 3,412,093$ 509,507,896$ 672,576,056
Pending receivables and payables, net 28,634,429
Accrued interest and dividends 75,264
Total long-term investments 701,285,749$
2020
Level I Level II Level III NAV Total
Cash equivalents 40,342,339$ -$ -$ -$ 40,342,339$
U.S. common and preferred stocks 100,978,310 - - 14,079,737 115,058,047
Foreign common and preferred stocks - - - 135,321,290 135,321,290
Fixed income 21,169,235 - - - 21,169,235
Marketable alternative investments - - - 284,170,132 284,170,132
Nonmarketable alternative investments - - - 108,148,796 108,148,796
Planned giving agreements - 10,339,076 - - 10,339,076
Perpetual trusts - - 3,454,055 - 3,454,055
162,489,884$ 10,339,076$ 3,454,055$ 541,719,955$ 718,002,970
Pending receivables and payables, net 3,892,771
Accrued interest and dividends 114,976
Total long-term investments 722,010,717$
2019

THE AMERICAN MUSEUM OF NATURAL HISTORY Notes to Consolidated Financial Statements - Continued June 30, 2020 and 2019
- 20 -
The following table summarizes the changes in fair values associated with Level III investments for the years ended June 30, 2020 and 2019:
2020 2019
Level III investments, beginning of year 3,454,055$ 3,466,310$
Realized and unrealized (losses) (41,962) (12,255)
Level III investments, end of year 3,412,093$ 3,454,055$
Under the Museum’s charitable gift annuities program where the Museum is the trustee, liabilities are recorded for the present value of the estimated future payments expected to be made to the donors and/or other stipulated life beneficiaries. Upon termination of a life interest, the share of the corpus attributable to the life interest holder, if any, becomes available to the Museum. Changes in the life expectancy of the donor or beneficiary, amortization of the discount, and other changes in the estimates of future payments are recognized annually by the Museum, based on actuarially determined valuations. The discount rates used to value planned giving agreements at June 30, 2020 and 2019 ranged from 1.2% to 8.0% and are set at the time the original gift is made. Contribution revenue is recognized at the date planned giving agreements are established.
6. ENDOWMENT
The Museum’s endowment consists of donor-restricted endowment funds (funds contributed by donors with the restriction that the funds be invested, spent in part, or otherwise preserved as endowment). The endowment also includes Board-designated gifts (gifts that could be spent currently but have been set aside by the Board to be invested and spent in a manner similar to donor-restricted endowment funds but without restrictions). As required by U.S. GAAP, net assets of the endowment funds are classified as and reported based on the existence or absence of donor-imposed restrictions or relevant law.
The financial objectives of the Museum’s endowment include providing support for the Museum’s annual operations and providing funding for certain nonoperating activities, such as capital needs, as institutional needs or opportunities arise. Accordingly, the Museum’s current spending policy is to annually spend 5% of the value of the endowment averaged over the twelve preceding quarters for operations with such additional amounts as may be appropriated by the Board of Trustees for capital and other purposes.
In order to accomplish this financial objective, the primary investment strategy for the endowment over the long-term is to generate an average total return equal to the Museum’s spending policy, plus an amount sufficient to fund investment-related expenses and inflation. While this is the Museum’s long-term objective, it is recognized that due to market circumstances the Museum may not be able to achieve this objective in a particular year or years, and may surpass this objective in other years.
In order to meet this investment objective, while also maintaining prudent levels of risk and liquidity, the Museum maintains a highly diversified investment portfolio.
The portfolio is invested by external investment managers selected by the Investment Committee in consultation with external advisors. Investments are made through separate accounts or commingled vehicles, including funds, trusts, and limited partnerships and similar interests.

THE AMERICAN MUSEUM OF NATURAL HISTORY Notes to Consolidated Financial Statements - Continued June 30, 2020 and 2019
- 21 -
In September 2010, the New York Prudent Management of Institutional Funds Act (“NYPMIFA”) became effective. The application of NYPMIFA requires all unspent donor-restricted endowment earnings to be classified as net assets with donor restrictions until appropriated by the Board of the Museum. In accordance with NYPMIFA, the Museum applies a standard of prudence and considers the spending policy and the following factors in making a determination to appropriate for expenditure or to accumulate donor-restricted endowment funds:
(1) The duration and preservation of the endowment funds;
(2) The purposes and institutional objectives of the Museum and the endowment funds;
(3) General economic conditions;
(4) The possible effect of inflation and deflation;
(5) The expected total return from income and appreciation of investments;
(6) Other resources of the Museum; (7) Where appropriate, alternatives to appropriation from the endowment funds and the possible effects
of those alternatives on the Museum;
(8) The investment policy of the Museum; and
(9) The cash needs and other needs of the Museum. Unless otherwise stipulated by the donor, the Museum classifies donor-restricted endowment funds as net assets with donor restrictions held in perpetuity, using the original value of the gift when it was donated to the permanent endowment. Accumulated earnings to the permanent endowment are classified as net assets with donor restrictions that are program or time restricted in accordance with NYPMIFA. Such accumulated earnings are directed in accordance with the applicable donor gift instrument with regard to purpose. Board-designated endowment is classified as net assets without donor restrictions.
From time to time, the fair value of assets associated with individual donor-restricted endowment funds may fall below the level the donor requires the Museum to retain as a fund of perpetual duration. These deficiencies generally result from unfavorable market fluctuations that occur shortly after the investment of new donor restricted contributions. In such an event, the Museum will not continue to appropriate from the donor-restricted funds, but rather appropriate from Board-designated endowment funds. There were no cumulative deficiencies at June 30, 2020 and 2019. Total endowment net assets include the pooled endowment and accrued endowment expenses and exclude endowment related pledges, planned giving agreements and perpetual trusts.

THE AMERICAN MUSEUM OF NATURAL HISTORY Notes to Consolidated Financial Statements - Continued June 30, 2020 and 2019
- 22 -
The following table summarizes endowment net asset composition by type of fund as of June 30, 2020:
Net AssetsWithout Donor Program or Amounts Held
Restrictions Time Restricted in Perpetuity Total Total
Donor-restricted endowment funds -$ 260,863,180$ 240,772,187$ 501,635,367$ 501,635,367$ Board-designated endowment funds 186,014,433 - - - 186,014,433 Total endowment net assets 186,014,433$ 260,863,180$ 240,772,187$ 501,635,367$ 687,649,800$
Net Assets With Donor Restrictions
The following table summarizes endowment net asset composition by type of fund as of June 30, 2019:
Net AssetsWithout Donor Program or Amounts Held
Restrictions Time Restricted in Perpetuity Total Total
Donor-restricted endowment funds -$ 270,589,588$ 222,845,733$ 493,435,321$ 493,435,321$ Board-designated endowment funds 215,076,258 - - - 215,076,258 Total endowment net assets 215,076,258$ 270,589,588$ 222,845,733$ 493,435,321$ 708,511,579$
Net Assets With Donor Restrictions

THE AMERICAN MUSEUM OF NATURAL HISTORY Notes to Consolidated Financial Statements - Continued June 30, 2020 and 2019
- 23 -
The following tables summarize changes in endowment net assets for the fiscal years 2020 and 2019:
Net AssetsWithout Donor Program or Amounts Held
Restrictions Time Restricted in Perpetuity Total Total
Endowment net assets, beginning of year 215,076,258$ 270,589,588$ 222,845,733$ 493,435,321$ 708,511,579$ Contributions and bequests 140,985 50,470 9,567,708 9,618,178 9,759,163 Appropriation of endowment assets for expenditure (20,255,298) (12,273,317) - (12,273,317) (32,528,615) Interest and dividends 1,276,237 2,906,698 - 2,906,698 4,182,935 Investment gains (losses), realized and unrealized 6,291,373 15,918,472 (391,254) 15,527,218 21,818,591 Net distributions to support non- operating purposes (5,293,000) - - - (5,293,000) Net distributions to support operations (18,800,853) - - - (18,800,853) Other, primarily net assets released from restrictions and other transfers 7,578,731 (16,328,731) 8,750,000 (7,578,731) -
Endowment net assets, end of year 186,014,433$ 260,863,180$ 240,772,187$ 501,635,367$ 687,649,800$
2020
Net Assets With Donor Restrictions
Net AssetsWithout Donor Program or Amounts Held
Restrictions Time Restricted in Perpetuity Total Total
Endowment net assets, beginning of year 220,915,048$ 274,285,685$ 216,738,066$ 491,023,751$ 711,938,799$ Contributions and bequests 725,705 50,470 6,446,673 6,497,143 7,222,848 Appropriation of endowment assets for expenditure (20,575,687) (11,227,048) - (11,227,048) (31,802,735) Interest and dividends 1,499,411 3,139,497 - 3,139,497 4,638,908 Investment gains (losses), realized and unrealized 6,823,602 15,170,544 (379,311) 14,791,233 21,614,835 Net distributions to support non- operating purposes (5,141,381) - - - (5,141,381) Other, primarily net assets released from restrictions 10,829,560 (10,829,560) 40,305 (10,789,255) 40,305
Endowment net assets, end of year 215,076,258$ 270,589,588$ 222,845,733$ 493,435,321$ 708,511,579$
2019Net Assets With Donor Restrictions

THE AMERICAN MUSEUM OF NATURAL HISTORY Notes to Consolidated Financial Statements - Continued June 30, 2020 and 2019
- 24 -
7. PLANT AND EQUIPMENT, NET
Plant and equipment, net, consists of the following at June 30, 2020 and 2019:
Range ofEstimated
Useful Lives 2020 2019
Buildings and leasehold improvements 5 - 40 years 788,557,324$ 786,995,331$ Equipment, furniture and fixtures 5 years 91,737,483 89,023,667 Construction-in-progress 200,176,671 114,482,037
Gross plant and equipment 1,080,471,478 990,501,035
Less: Accumulated depreciation and amortization (583,005,474) (552,235,809)
Plant and equipment, net 497,466,004$ 438,265,226$
In accordance with U.S. GAAP, the Museum accounts for conditional asset retirement obligations to reflect the cost associated with the eventual remediation of asbestos on certain Museum collections and portions of the buildings in which they reside. At June 30, 2020 and 2019, the Museum’s liability for conditional asset retirement obligations totaled approximately $2,200,000 and is included in the accompanying consolidated statements of financial position in accounts payable and accrued liabilities. Because the Museum’s buildings and land are owned by the City, remediation costs associated with the removal of asbestos and other hazardous materials within the construct of the buildings are allocated between the City and the Museum at the time of project origination. Until a project exists, the range of time over which remediation may be required is unknown and the costs to the Museum cannot reasonably be estimated. Accordingly, any building remediation where a remediation project has not been entered into between the City and the Museum cannot be measured and has not been recorded in the accompanying consolidated financial statements.
8. NOTES PAYABLE TO BANKS
At June 30, 2020 and 2019, the Museum had three unsecured credit facilities with three commercial banks. One facility, a $100 million revolving line of credit that matures in January 2023, had $40 million outstanding as of June 30, 2020 and no amounts outstanding as of June 30, 2019. Amounts borrowed under this facility bear interest based on LIBOR or the Federal Funds Rate and are reset every 30 days.
A second facility, a $20 million revolving line of credit that matures in May 2021, had no amounts outstanding as of June 30, 2020 and 2019, respectively. Amounts borrowed under this facility bear interest based on LIBOR and are reset every 30 days.
Additionally, a third facility, a $20 million revolving line of credit that matures in September 2020, had no amounts outstanding as of June 30, 2020 and 2019, respectively. Amounts borrowed under this agreement bear interest based on LIBOR and are reset every 30 days.

THE AMERICAN MUSEUM OF NATURAL HISTORY Notes to Consolidated Financial Statements - Continued June 30, 2020 and 2019
- 25 -
9. BONDS AND LOANS PAYABLE
Since 1991, the Museum has entered into unsecured loan agreements with the Trust for Cultural Resources of the City of New York (the “Trust”), a public benefit organization created by the State of New York. Pursuant to these agreements the Trust has issued tax-exempt bonds, the proceeds of which have been used for the financing of a portion of the construction, expansion, improvement and rehabilitation of facilities operated by the Museum or to refinance existing indebtedness incurred for similar purposes. Pursuant to these loan agreements, the Museum is required to pay, when due, principal and interest on the bonds. In 2015, the Museum issued unsecured taxable bonds direct to the market as its own issuer, the proceeds of which were used to refinance existing indebtedness which was originally issued through the Trust. These bonds require the Museum to pay, when due, principal and interest.
Total interest and related expense for the years ended June 30, 2020 and 2019 was $11,148,641 and $9,814,300, respectively. Included in this amount are payments related to interest rate exchange agreements of $2,047,756 and $1,485,056 for the years ended June 30, 2020 and 2019, respectively, as well as other bond related expenses of $1,067,720 and $436,557, for the years ended June 30, 2020 and 2019, respectively.
Series 2008 Refinancing Bonds In 2008, the Trust issued Series 2008 Variable Interest Rate Bonds totaling $174,630,000, which have been refunded such that only the $21,335,000 Series 2008B3 Bonds are outstanding. The Series 2008B3 Bonds are subject to a weekly interest rate reset. In the event the Museum receives notice of any optional tender on its variable rate demand bonds, or if the bonds become subject to mandatory tender, the purchase price will be paid from the remarketing of the bonds. To provide liquidity in the event a tender does not remarket promptly, the Museum has entered into a backup credit facility with a major U.S. bank totaling $15.3 million, which has historically been renewed since inception. The credit facility currently expires on June 30, 2021. There has been no drawdown to date against the credit facility supporting the Series 2008B3 Bonds.
Series 2009 Refinancing Bonds In 2009, the Trust issued $17,940,000 Series 2009A Fixed Interest Rate Bonds, due serially through April 1, 2021 at an average interest rate of 4.79%, for the purpose of refinancing the Series 1993A Bonds, which are no longer outstanding.
Series 2014 Refinancing Bonds In 2014, the Trust issued Series 2014 Bonds totaling $149,490,000 divided as follows: $49,775,000 Series 2014A Bonds, $50,225,000 Series 2014B1 Bonds, and $49,490,000 Series 2014B2 Bonds for the purpose of refinancing the Series 2004A, Series 2008B1, and Series 2008B2 Bonds, which are no longer outstanding. The proceeds from the Series 2014 Bonds were used to redeem the Series 2004A, 2008B1 and 2008B2 Bonds.

THE AMERICAN MUSEUM OF NATURAL HISTORY Notes to Consolidated Financial Statements - Continued June 30, 2020 and 2019
- 26 -
The Series 2014A Bonds are fixed rate bonds due serially through 2034 at 5.00%, marketed at a premium to generate a true fixed interest rate of 4.17%. The Series 2014B1 and Series 2014B2 are variable rate bonds due serially through 2044. The Series 2014B1 and 2014B2 Bonds are Floating Rate Notes, issued for 270-day terms but callable after 180 days, at which time they are subject to an interest rate reset. In the event the Museum receives notice of any optional tender on the Series 2014B1 and 2014B2 Bonds, or if the bonds become subject to mandatory tender, the purchase price will be paid from the remarketing of the bonds. The Museum has agreed to provide liquidity in the event a tender does not remarket promptly.
Series 2015 Refinancing Bonds On May 13, 2015, the Museum issued a total of $95,605,000 of taxable bonds (the “Series 2015 Bonds”) for the purpose of refinancing the Series 2008A1 and Series 2008A2 Bonds.
The Series 2015 Bonds are fixed rate bonds due serially through 2045 at an average interest rate of 4.09%. The Series 2015 Bonds are subject to optional redemption by the Museum subject to a make-whole redemption provision.
Loan Payable On December 31, 2019, the Museum entered into an unsecured loan agreement with a commercial bank in the amount of $57,000,000. The proceeds of the loan are to be used as bridge financing in advance receipt of donor pledge payments for a major construction project.
The taxable loan matures on July 1, 2027, with principal payments due annually beginning July 1, 2023. The interest rate on the loan is fixed at 2.49%. In summary, the bonds and related activity underlying the Museum’s long-term debt consist of the following:
Long-Term Debt: June 30, 2020 June 30, 2019
Series 2008B3 due by April 1, 2029 12,885,000$ 13,185,000$ Series 2009A due by April 1, 2021 3,120,000 6,095,000 Series 2014A due by July 1, 2034 49,775,000 49,775,000 Series 2014B1 due by April 1, 2044 50,225,000 50,225,000 Series 2014B2 due by April 1, 2044 49,490,000 49,490,000 Series 2015 due by July 15, 2045 95,605,000 95,605,000 Loan payable due by July 1, 2027 57,000,000 - 318,100,000 264,375,000 Series 2009A unamortized bond premium 18,858 63,658 Series 2014A unamortized bond premium 4,687,171 4,990,598 Unamortized deferred bond issuance costs (1,256,703) (1,378,942)
Total long-term debt 321,549,326$ 268,050,314$

THE AMERICAN MUSEUM OF NATURAL HISTORY Notes to Consolidated Financial Statements - Continued June 30, 2020 and 2019
- 27 -
The interest rates for each issue are as follows:
2020 2019Interest rates on long-term debt
Series 2008B3 0.13% 1.87%Series 2009A 5.00% 5.00%Series 2014A 5.00% 5.00%Series 2014B1 0.12% 1.90%Series 2014B2 0.43% 1.90%Series 2015 3.77% 3.77%Loan payable 2.49% -
June 30,
After giving effect to the interest rate exchange agreements, the estimated future debt service payments of principal and interest are as follows:
TotalPrincipal Interest EstimatedAmount Payments Debt Service
Year Ending June 30,2021 3,420,000$ 11,280,104$ 14,700,104$ 2022 6,425,000 10,999,894 17,424,894 2023 6,600,000 10,820,514 17,420,514 2024 20,450,000 10,278,462 30,728,462 2025 13,255,000 9,900,376 23,155,376 Thereafter 267,950,000 109,754,657 377,704,657
Total 318,100,000$ 163,034,007$ 481,134,007$

THE AMERICAN MUSEUM OF NATURAL HISTORY Notes to Consolidated Financial Statements - Continued June 30, 2020 and 2019
- 28 -
Interest Rate Exchange and Cap Agreements: In 2005, the Museum entered into a 39-year interest rate exchange agreement with Morgan Stanley (“MS”) for the purpose of limiting the Museum’s interest rate exposure on the Series 2008B3 and 2014B2 Bonds. The notional amount of the exchange was set at $68,975,000 and amortizes according to a schedule that is similar to the mandatory redemption schedule of the Series 2008B3 and 2014B2 Bonds. Under the terms of the exchange, MS pays to the Museum a variable rate consistent with the rate on the Series 2008B3 and 2014B2 Bonds, and the Museum pays to MS the fixed rate of 3.395% per annum. In 2007, the Museum entered into a 39-year interest rate exchange agreement with Bank of New York (“BONY”) for the purpose of limiting the Museum’s interest rate exposure on a portion of the Series 2014B1 Bonds. The notional amount of the exchange was set at $25,225,000 and amortizes according to a schedule that is similar to the mandatory redemption schedule of a portion of the Series 2014B1 Bonds. Under the terms of the exchange, BONY pays to the Museum a variable rate consistent with the rate on a portion of the Series 2014B1 Bonds, and the Museum pays to BONY the fixed rate of 3.62% per annum.
In 2014, the Museum entered into a 10-year interest rate cap agreement with SMBC Capital Markets, Inc. (“SMBC”). The purpose of the agreement is to limit the Museum’s interest rate exposure on $25,000,000 of variable rate bonds. Under the terms of the agreement SMBC will pay the Museum floating rates (as measured by 70% of 3-month US dollar LIBOR) to the extent the variable rate on the bonds exceed 5.00%.
The Museum’s interest rate exchange and cap agreements are considered Level II financial instruments with an estimated fair value as follows:
2020 2019Interest Rate Exchange and Cap Agreement Valuations:
Fair value interest rate exchange agreement on Series 2008B3 and 2014B2 (24,002,406)$ (15,616,466)$
Fair value interest rate exchange agreement for $25,225,000 of Series 2014B1 (14,251,062) (9,172,183) Fair value interest rate cap agreement for $25,000,000 of Series 2014B1 861 631
Total interest rate exchange and cap agreements (38,252,607)$ (24,788,018)$ The change in value of the interest rate exchange and cap agreements was ($13,464,589) and ($7,646,856) for the years ended June 30, 2020 and 2019, respectively, and is included in the accompanying consolidated statements of activities.
10. POSTRETIREMENT HEALTH INSURANCE BENEFITS
Eligible retirees may participate in medical and dental plans offered by the Museum annually, and current expenditures are funded from operations. These plans are not funded and the benefits are not vested; however, potential future costs are actuarially estimated and reported as a liability during the service lives of eligible employees pursuant to ASC 715-60.

THE AMERICAN MUSEUM OF NATURAL HISTORY Notes to Consolidated Financial Statements - Continued June 30, 2020 and 2019
- 29 -
The medical and dental plans are contributory with participants’ contributions typically adjusted annually. The actuarial valuations of the potential postretirement medical and dental benefits for fiscal 2020 and 2019 are as follows:
2020 2019
Benefit obligation, beginning of year: 50,242,668$ 42,015,606$ Service cost 1,572,026 1,201,317 Interest cost 1,854,129 1,921,359 Plan participants’ contributions 549,517 582,948 Actuarial losses 8,708,567 6,604,363 Benefits paid (1,865,394) (2,082,925) Funded status/accrued benefit reported in consolidated statements of financial position/benefit obligation, end of year 61,061,513$ 50,242,668$
2020 2019Change in Plan assets for fiscal 2020 and 2019 included:Fair value of Plan assets, beginning of year -$ -$ Museum contributions 1,315,877 1,499,977 Plan participants’ contributions 549,517 582,948 Benefits paid (1,865,394) (2,082,925)
Fair value of Plan assets, end of year -$ -$
Amounts recognized in net assets without donor restriction consist of: Net actuarial loss 27,138,456$ 19,439,336$ Prior unamortized service credit (180,929) (2,648,130)
Total amount recognized 26,957,527$ 16,791,206$
Amounts in net assets without donor restrictions expected to be recognized in net periodic benefit cost in the following year: Amortization of unrecognized net loss 1,348,106$ 964,612$ Amortization of prior service credit (180,929) (2,467,202)
Total amount to be recognized 1,167,177$ (1,502,590)$

THE AMERICAN MUSEUM OF NATURAL HISTORY Notes to Consolidated Financial Statements - Continued June 30, 2020 and 2019
- 30 -
Weighted average assumptions as of June 30th (measurement date):
2020 2019
Discount rate 3.00% 3.75%Expected return on Plan assets N/A N/AInitial trend for the coming fiscal year 7.25% pre-65, 6.75% post-65 7.50% pre-65, 7.00% post-65Ultimate trend rate 4.50% 4.50%Fiscal year in which ultimate trend
is attained 2032 pre-65, 2030 post-65 2032 pre-65, 2030 post-65 The actuarially determined components of the net periodic postretirement medical and dental benefit costs consist of the following:
2020 2019
Service cost 1,572,026$ 1,201,317$ Interest cost 1,854,129 1,921,359 Amortization of actuarial loss 1,009,447 730,261 Amortization of prior service cost (2,467,201) (2,467,201)
Net periodic benefit cost 1,968,401$ 1,385,736$
Assumed healthcare cost trend rates have a significant effect on the amounts reported for the healthcare plan. A one percentage point change in assumed healthcare cost trend rates would have the following effects:
Impact of a 1% increase in Medical Trend:On obligations at year end 11,399,464$ On service and interest costs 735,034$
Impact of a 1% decrease in Medical Trend:On obligations at year end (8,912,068)$ On service and interest costs (563,998)$
Projected cash outflows for the years ending June 30 are as follows: 2021 2,132,843$ 2022 2,139,324 2023 2,256,008 2024 2,326,906 2025 2,390,484 2026 through 2030 13,001,060

THE AMERICAN MUSEUM OF NATURAL HISTORY Notes to Consolidated Financial Statements - Continued June 30, 2020 and 2019
- 31 -
11. RETIREMENT PLANS
The Museum participates in the Cultural Institution Retirement System (“CIRS”), a trust managed by an independent Board of Trustees that provides a defined benefit pension, a 401k plan and life insurance (the “Plan”) to union and non-union employees of over 40 cultural institutions, day care centers and other non-profit organizations. The Plan (Plan number 11-2001170 001) is funded by contributions from the employers and the City of New York. The Plan is collectively bargained and resulting agreements are subject to approval by the CIRS Board of Trustees and the City. A collectively bargained agreement was signed in September 2016 that covered the 5 year period from July 1, 2015 through June 30, 2020. The agreement increased the employer contribution to the pension from 9.1% of salaried payroll for the year preceding the agreement to 11.0% in the first year of the agreement and 11.1% in the following four years. The agreement established a new tier of benefits for employees hired on or after October 1, 2016 that provided a lower pension benefit and a mandatory employee contribution of 2% that increases up to 3% for higher salaries. CIRS has commenced the process for bargaining the terms of the new agreement. The pension is certified by the pension plan’s actuary under the Pension Reform Act of 2006 to be in the green zone for the plan year beginning July 1, 2019, and therefore there are no surcharges for the pension plan and no financial improvement plan or rehabilitation plan is required. Total costs for the Plan paid by the Museum for eligible employees, exclusive of payments made directly by the City, amounted to $8,941,295 and $8,608,317 for the years ended June 30, 2020 and 2019, respectively. The Museum’s contribution exceeds 5% of the total contributions to the Plan. The Museum established and maintains supplemental executive retirement plans for key employees. These plans are unfunded and payments are forfeitable and contingent upon such employees meeting specified service requirements and represent actuarially determined general obligations of the Museum of $9,817,319 and $9,334,212 at June 30, 2020 and 2019, respectively. These amounts include accumulated sums of benefits that have been accrued and reported in the appropriate year on the Museum’s Form 990.
12. NET ASSETS
The Museum’s net assets with donor restrictions are comprised of gift arrangements where the Museum is obligated to retain the original value of the gift in perpetuity and of perpetual trusts, planned giving agreements and endowment pledges receivable. In addition, donors have restricted the income on these net assets to the purposes shown below as of June 30, 2020 and 2019:
2020 2019
Scientific research 86,290,978$ 78,593,105$ Education and public programs 103,086,748 96,200,750 Exhibitions 30,216,817 30,046,791 Without donor restrictions (for general purposes of the Museum) 38,722,257 37,741,701 Other 1,500,000 1,500,000
Total net assets held in perpetuity 259,816,800$ 244,082,347$

THE AMERICAN MUSEUM OF NATURAL HISTORY Notes to Consolidated Financial Statements - Continued June 30, 2020 and 2019
- 32 -
The Museum’s net assets with donor restrictions that are subject to donor-imposed restrictions that require the Museum to use or expend the gifts as specified, based on purpose or passage of time shown below:
2020 2019Restricted for: Scientific research 100,364,397$ 109,442,856$ Education and public programs 31,206,534 29,249,642 Exhibitions 12,892,779 10,709,248 Capital projects 236,116,921 233,759,974 Debt service 40,404,230 40,772,400 Other operating purposes (primarily passage of time) 20,351,444 12,691,595 Awaiting appropriation by Board of Trustees - otherwise without donor restrictions 112,172,183 113,367,493
Total net assets program or time restricted 553,508,488$ 549,993,208$
Net assets were released from donor restrictions due to the passage of time, performance of activities satisfying the restricted purposes specified by the donors, and/or by appropriation by the Board of Trustees as follows:
2020 2019Operating: Passage of time (cash receipt of prior period pledges) 1,528,830$ 3,271,820$ Expenditures satisfying donor-imposed purpose restrictions 22,147,461 26,047,437
23,676,291 29,319,257 Nonoperating: Passage of time (cash receipt of prior period pledges) 50,470 76,526 Expenditures satisfying donor-imposed capital purpose
restrictions 204,859 306,083 Expenditures satisfying endowment purpose restrictions 280,083 720,911 Appropriation by the Board of Trustees and other (otherwise unrestricted) 7,248,178 10,058,180
7,783,590 11,161,700
Total net assets released 31,459,881$ 40,480,957$

THE AMERICAN MUSEUM OF NATURAL HISTORY Notes to Consolidated Financial Statements - Continued June 30, 2020 and 2019
- 33 -
13. REVENUE RECOGNITION FROM EXCHANGE TRANSACTIONS
The Museum recognized revenue of $5,454,089 and $5,901,367 from amounts that were included in deferred revenue at the beginning of the fiscal year at June 30, 2020 and June 30, 2019, respectively.
At June 30, 2020, deferred revenue totaled $11,938,715. Of that amount, the performance obligations related to this deferred revenue are expected to be met in:
14. SUPPORT FROM THE CITY OF NEW YORK
Operating Support The City annually appropriates funds to support the cost of certain operating salaries, primarily guardianship, maintenance and expenses (the “Department of Cultural Affairs (DCLA) Obligation Plan”) up to a maximum amount determined by the City in its annual budget process. These amounts are recognized as operating revenue in the month the expenses are incurred by the Museum. The City pays the Museum’s energy costs as well as pension costs for employees funded on the DCLA Obligation Plan. The City provides a statement of these expenditures to the Museum, which records them as operating revenue with an offsetting amount to operating expense.
Capital Support The City has contributed $187,885,906 in total capital expenses from 1995 to 2020. The following represents City support for the years ended June 30, 2020 and 2019, respectively:
2020 2019Operating Support:
DCLA - Obligation Plan 11,849,699$ 11,382,465$ Energy 6,493,277 7,082,005 Pension 1,378,663 1,241,966
19,721,639 19,706,436
Capital Support 3,274,373 -
Total City Support 22,996,012$ 19,706,436$
Visitors’ Miscellaneous Contributions and Membership Auxiliary Fees and Other
Admissions Fees Activities Revenue TotalYear Ending June 30,2021 928,249$ 190,729$ 5,053,677$ 5,002,507$ 11,175,162$ 2022 - - 115,000 28,986 143,986 2023 - - 125,000 28,986 153,986 2024 - - 125,000 28,986 153,986 2025 - - - 28,986 28,986 Thereafter - - - 282,609 282,609
Total 928,249$ 190,729$ 5,418,677$ 5,401,060$ 11,938,715$

THE AMERICAN MUSEUM OF NATURAL HISTORY Notes to Consolidated Financial Statements - Continued June 30, 2020 and 2019
- 34 -
15. LIQUIDITY AND AVAILABILITY OF RESOURCES
The Museum’s financial assets available within one year of the consolidated statement of financial position date for general expenditures are as follows:
2020 2019Financial assets due within one year:
Cash and cash equivalents 204,575,880$ 144,842,737$ Short-term investments designated for current operations 6,000,000 23,986,002 Accounts receivable, net 2,951,674 5,801,237 Government grants receivable, net 13,984,155 7,510,792 Contributions receivable due within one year 32,250,413 22,130,722 Long-term investments (excluding perpetual trusts and planned
giving arrangements) 687,645,005 708,217,586 947,407,127 912,489,076
Offset by:Amounts unavailable for general expenditures within one year due to:
(non-endowment) (excluding planned giving arrangements) 246,876,739 211,324,738 Temporarily restricted by donors already expended (146,536,636) (86,356,276) Endowment funds already appropriated (39,997,698) (37,821,615) Unappropriated accumulated endowment gains 260,863,180 270,589,588 Restricted by donor in perpetuity (excluding perpetual trusts, pledges
and perpetual CGAs) 240,772,187 222,845,733 Board-designated endowment funds 186,014,433 215,076,258
747,992,205 795,658,426 Liquidity resources:
Available bank lines of credit 100,000,000 100,000,000 Total financial assets and liquidity resources available to management for general expenditure within one year 299,414,922$ 216,830,650$
The Museum structures its financial assets to be available as its general expenditures, liabilities, and other obligations come due. Although the Museum does not intend to spend from its Board-designated endowment funds, other than amounts appropriated as part of its annual appropriation process, these funds do not carry donor restrictions and up to $161,304,987 could be made available if necessary.

THE AMERICAN MUSEUM OF NATURAL HISTORY Notes to Consolidated Financial Statements - Continued June 30, 2020 and 2019
- 35 -
16. COMMITMENTS AND CONTINGENCIES
The Museum has entered into an operating lease for a facility used for storage purposes through fiscal 2024. Total future minimum rental commitments due under the terms of this lease agreement are as follows:
Year ending June 30,2021 $ 364,242 2022 375,169 2023 386,424 2024 162,988
Total 1,288,823$ The Museum is a party to litigation matters which have arisen in the normal course of its operations. The matters are insured or expected to be insured in substantial part. To the extent not insured, in the opinion of management the resolution of such matters is not anticipated to have a material effect on its consolidated financial statements. The Museum receives significant Federal, State and City grants and contracts which are subject to audit by the respective governmental agencies. Management is of the opinion that disallowances, if any, would not have a significant effect on the financial position or changes in net assets of the Museum.

THE AMERICAN MUSEUM OF NATURAL HISTORY Notes to Consolidated Financial Statements June 30, 2020 and 2019
- 36 -
17. FUNCTIONAL EXPENSES
The following presents the natural expense classifications by program and support area for fiscal year 2020 and in total for fiscal year 2019 and reflects the allocation of depreciation, amortization and interest generally on the basis of the department for which the assets were purchased or constructed; the allocation of information technology, guardianship, maintenance and operating costs on the basis of square footage; and the allocation of plant administration expenses to general and administrative expenses. The following classification of expenses excludes the change in value of interest rate exchange and cap agreements and other pension related activities.
Scientific Visitor Auxiliary Subtotal General and SupportingResearch Exhibitions Education Membership Services Activities Programs Administrative Fundraising Services Total 2020 Total 2019
Payroll and fringe benefits 44,056,631$ 17,393,451$ 17,388,150$ 1,775,081$ 7,342,400$ 7,188,469$ 95,144,182$ 19,955,722$ 5,665,591$ 25,621,313$ 120,765,495$ 121,219,550$ Supplies 1,109,957 818,965 984,193 13,080 181,999 139,944 3,248,138 385,790 19,487 405,277 3,653,415 4,775,491 Energy services 2,768,733 2,846,003 136,359 12,337 120,775 407,778 6,291,985 158,436 42,856 201,292 6,493,277 7,082,005 Outside services and insurance 2,412,508 2,632,587 2,714,628 190,479 277,689 2,120,066 10,347,957 2,814,015 532,874 3,346,889 13,694,846 14,625,659 Professional fees 226,149 8,170 2,383,059 49,208 827 2,351,422 5,018,835 2,176,982 405,915 2,582,897 7,601,732 8,651,182 Depreciation and amortization 13,172,308 13,539,922 648,730 58,694 574,589 1,940,012 29,934,255 753,763 203,886 957,649 30,891,904 30,414,196 Interest 4,753,781 4,886,450 234,121 21,182 207,364 700,135 10,803,033 272,027 73,581 345,608 11,148,641 9,814,300 Other 4,962,321 2,466,693 851,243 425,529 1,126,482 5,644,143 15,476,411 1,544,104 503,920 2,048,024 17,524,435 21,169,182
. Total 2020 73,462,388$ 44,592,241$ 25,340,483$ 2,545,590$ 9,832,125$ 20,491,969$ 176,264,796$ 28,060,839$ 7,448,110$ 35,508,949$ 211,773,745$
Total 2019 72,797,666$ 43,078,799$ 28,717,939$ 2,747,152$ 10,901,196$ 23,247,859$ 181,490,611$ 28,770,970$ 7,489,984$ 36,260,954$ 216,765,282$ 217,751,565$